Article

Cross-Scaling Approach for Water-Flow-Regulating Ecosystem Services: A Trial in Bochum, Germany

1
College of Architecture and Urban Planning, Tongji University, Shanghai 200092, China
2
Urban Planning & Design Institute of Shenzhen, Shenzhen 518000, China
3
Joint International Research Laboratory of Eco-Urban Design, Ministry of Education, Research Centre for Land Ecological Planning, Design and Environmental Effects, Shanghai 200092, China
*
Author to whom correspondence should be addressed.
Land 2022, 11(5), 740; https://doi.org/10.3390/land11050740
Submission received: 27 March 2022 / Revised: 10 May 2022 / Accepted: 12 May 2022 / Published: 16 May 2022

Abstract

:
Water-flow-regulating ecosystem services (ESs) determine the regulation of hydrological flows on the ground’s surface. A lack of water-flow-regulating ESs would cause environmental problems such as heavy rainfall runoff and urban water logging, leading to floods affecting well-being, especially in dense urban areas. Research on water-flow-regulating ES supply–demand relationships in urban areas is urgently needed to better support the management of urban surface runoff. However, matching the supply–demand relationships of water-flow-regulating ESs remains challenging. In this contribution, a cross-scale approach linking the supply–demand assessment of water-flow-regulating ESs on a macroscale and the evaluation of the constructed urban environment on a microscale was developed. The approach was applied in the city of Bochum, Germany, as a trial of bridging the “science–practice gap”. Our findings show that the supply–demand budget of water-flow-regulating ESs in Bochum exhibits an urban–rural difference and is also partially influenced by land cover transformations such as vegetation degradation. In addition, further assessment of the constructed urban environment confirmed the result from the assessment of water-flow-regulating ESs based on the understanding of the urban hydrological cycle in Bochum. To account for the mismatch in the supply–demand budget, we classified the typical superior and inferior forms of urban water-flow-regulating ESs through field research on the same extreme areas to summarize the operable optimization, enhancement, and protection suggestions for urban construction decision makers. Finally, the cross-scale approach was approved as a possible way to bridge the “science–practice” gap for water-flow-regulating ES research in urban areas.

1. Introduction

Ecosystem services (ESs) are the benefits that people derive from ecosystems [1]. ESs are classified into provisioning, regulating, and cultural services. The concept of ESs has gained attention in the scientific community and has found its way into research about urban environments [2]. Although the urban ecosystem is an open frontier in ES research, with the development of related research, practical applications of urban ESs in policymaking are gradually increasing [3]. The main challenge of such practical applications is how to decide on the optimal allocation and management of different land-use options [4]. Nevertheless, the “science–practice gap”, caused by essential differences between the professional and scientific cultures, was determined to be a key barrier within practical ES research [5].
Regulating ESs are the most underemphasized in emerging ES decision-making frameworks, because they have less obvious links with human benefits [6] and exhibit high complexity due to many relevant variables [7]. The Common International Classification of Ecosystem Services (CICES) classifies water-flow-regulating ESs in a group for the regulation of baseline flows and extreme events [8]. This ES is particularly important for ensuring a sufficient supply of water to support the immediate environment whilst avoiding extreme fluctuations in water flows. Water-flow-regulating ESs are related to the water-flow-regulation function that involves the influence of natural systems on the regulation of hydrological flows at the Earth’s surface [9]. Climate factors, mineral soils, and living organisms interact to regulate fluxes of water in watersheds or catchments. These processes involved in flow regulation form a key part of the terrestrial water cycle.
Urban water-logging, as the most common form of extreme water flow fluctuation in an urban environment, results from unsustainable urban planning measures such as inadequate urban water-logging emergency response systems, decreasing green areas, and the filling of water bodies [10]. To support planners, an efficient approach to bridge the “science-practice gap” through understanding the impacts of urban constructions on urban water-flow-regulating ESs is needed. The mapping of ESs has been proven to be the main requirement for the implementation of ES concepts into decision making [11]. However, the mapping of ESs should consider not only their provision, but human needs for this service as well [9]. In this context, water-regulating ESs supply refers to the capacity to regulate water flow and maintain a normal level of watershed (such as the fraction of the water flow stored in the soil) [12], and the demands of water-regulating ESs are related to the benefits people obtain from this service (Figure 1).
On the macroscale, water-flow-regulating ESs are provided by the water-related regulating ecosystem processes, which are defined as the “ecosystem structure’s influence on dampening environmental disturbances” [9]. In addition, some land cover types, such as forests and green urban areas, can improve water-regulating services by preventing damage to infrastructure and influencing water retention capacities [4,13,14]. Land-cover-based ES assessments [15] are commonly used for measuring the capacity of ESs on a regional scale [16]. The land use land cover (LULC) pattern can represent the spatial distribution of urban space at larger scales; however, urbanization produces several small land cover changes (e.g., from natural vegetation to urban areas) along the urban–rural gradient while changing the urban morphology, thus differentially affecting ESs both within and outside urban areas [17,18,19]. Thus, monitoring and characterizing urbanization and its changing patterns on a microscale are necessary to understand its resultant impacts on ESs [20]. However, plenty of microscale ES studies have focused narrowly on a reduced set of variables with a high control for limited spatial monitoring [21,22,23], and lack the ability to identify effects and trends in ES changes on a landscape scale [24]. Cross-scale studies have also emerged due to the awareness that studying only one particular scale is insufficient, with a focus on the drivers of change across different scales [25]. For practical research on water-flow-regulating ESs to bridge the “science-practice gap”, it is possible to optimize urban water-flow-regulating ESs at the macroscale by analyzing urban forms at the microscale.
In this article, we provide a spatial analysis of water-flow-regulating ESs in urban areas, identifying areas that have a high potential for mitigating urban water-logging risk through transformation of the built environment and the LULC pattern, based on spatial analysis using geographic information systems (GISs). Corresponding water-flow-regulating ES indicators were selected as influencing factors of the water cycle processes as well as ESs. A cross-scale approach was developed to link water-flow-regulating ES measurements on the macroscale and urban form on the microscale. Our work contributes to empirical urban water-flow-regulating-ES research to explore ways to bridge the “science-practice gap” by combining the spatial distribution of water-flow-regulating ES with the urban form to suggest the enhancement of urban areas.

2. Materials and Methods

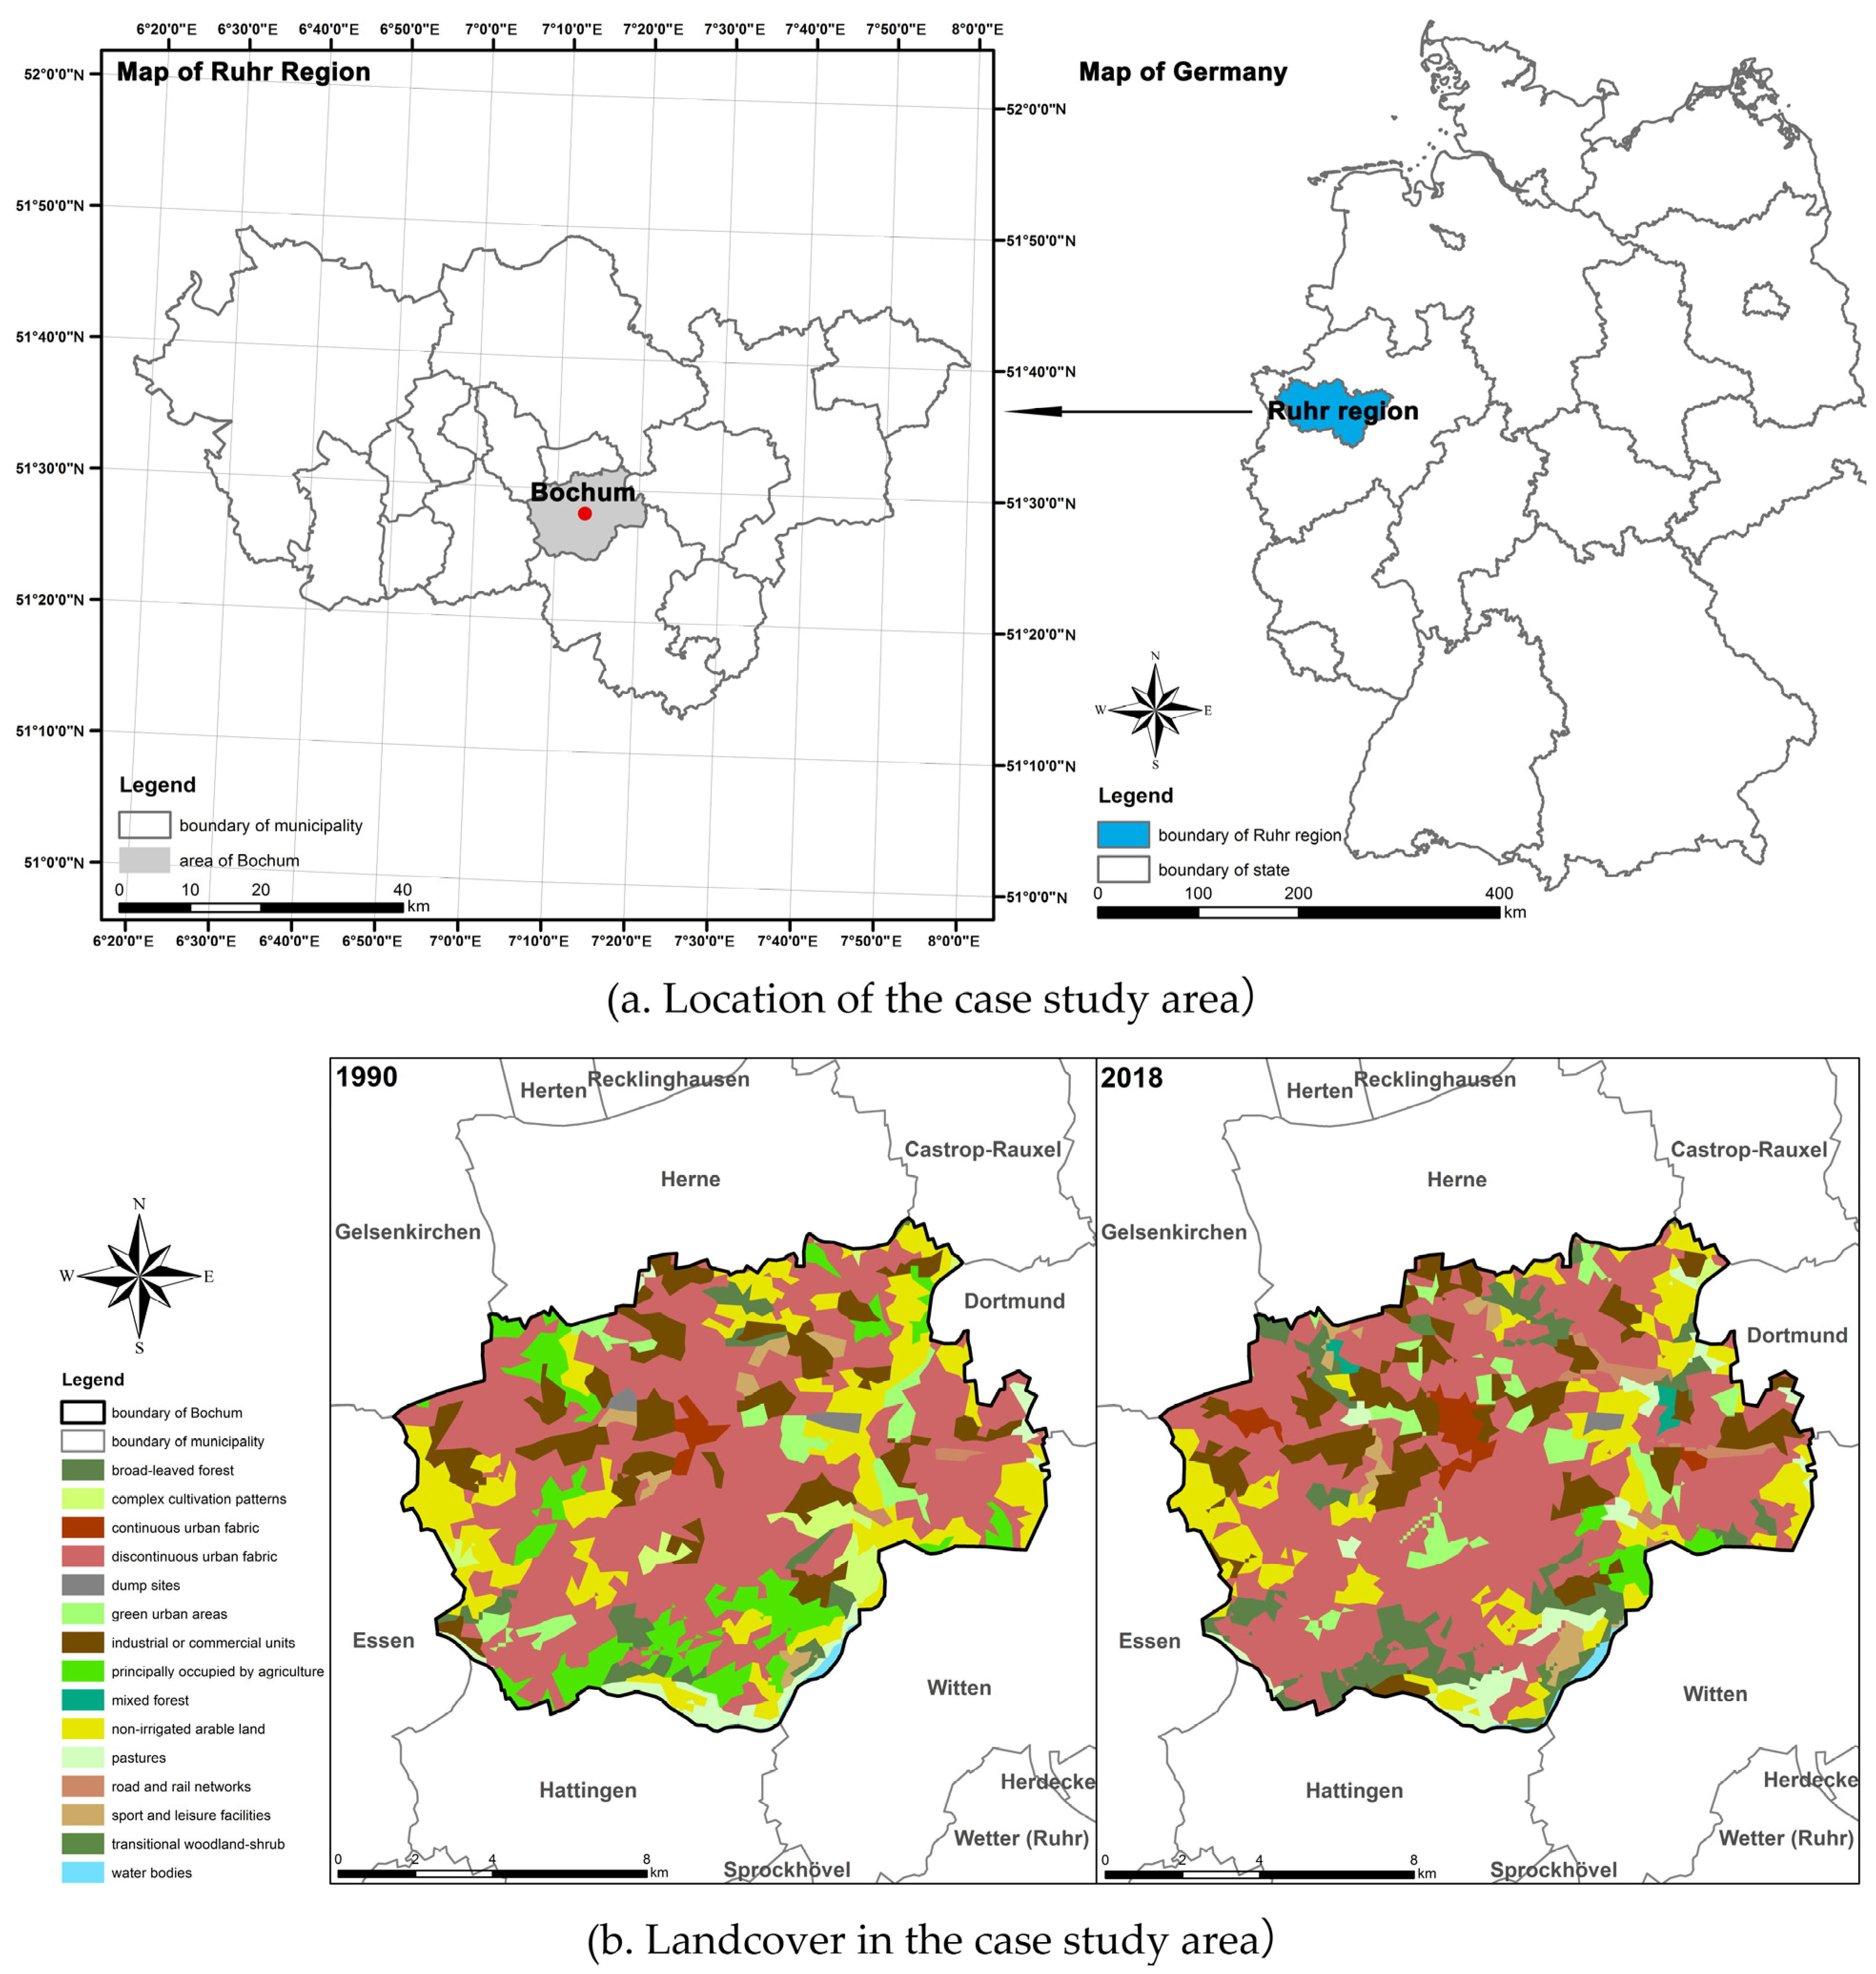
2.1. Case Study Area

The city of Bochum, located in northwest Germany, was selected as a case study. Covering an area of 144.66 km2 (Figure 2a), the city occupies the Ruhr Heights hill chain between the Ruhr and Emscher rivers. A temperate oceanic climate characterized by generally warm and mild weather is present. The mean annual temperature is 9.6 °C and the annual precipitation is 842 mm. The lowest precipitation is in February, with an average of 52 mm. The most precipitation falls in June, with an average of 84 mm [26]. The urban area of Bochum is divided into the Ruhr River catchment in the south and the Emscher catchment in the north. The Ruhr has an average discharge of 79 m3/s and the Emscher has a mean annual outflow near the mouth into the lower Rhine of 16 m3/s.
We used the Bochum municipality administrative area which, according to the CORINE 2018 land cover data (Figure 2b), is dominated by discontinuous, but evenly distributed, urban fabric (50.24%). Agricultural land makes up about 15% of the total area, 13% of which belonging to the arable land cover class as a result of the relatively flat terrain and fertile soil. The agricultural land is located mainly in the area near the west boundary and eastern part of the study area. Forest land cover occupies around 13% of the municipality, most of which (8.14%) is broadleaf forest located in the urban fringe. Mixed forest is predominantly planted and covers 5.11% of the area. Green urban areas are concentrated in the urban center, accounting for 4.31% of the area. Grassland and pastures occupy limited areas (3.49%), mainly in the eastern part.
We selected 1991 and 2018 as research periods, because the LULC changed significantly during this period. There was continuous urban fabric spread in the center of Bochum, as well as in new cores in the eastern and western areas. Vegetated areas principally occupied by agriculture decreased or changed into urban areas in the west and south, whereas the distribution of green urban areas transformed from being located in suburbs to being concentrated in the city center. These LULC transformations underpin changes in the water-flow-regulating ESs.

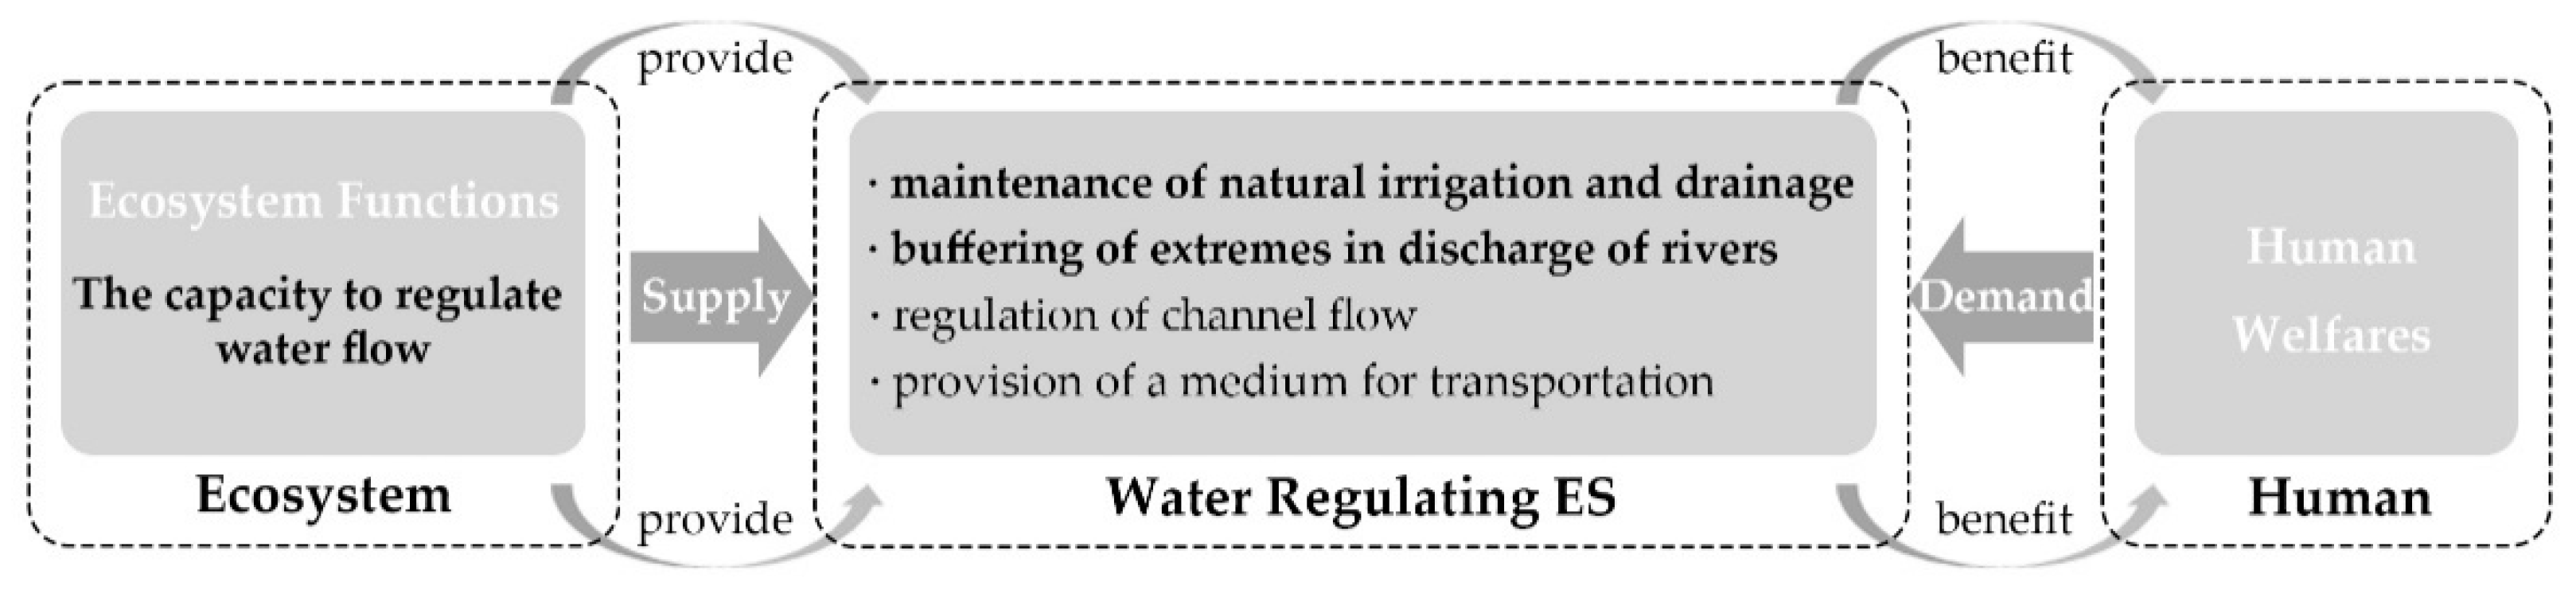
2.2. Water-Flow-Regulating ES Indicators

Appropriate indicators are needed to quantify supply–demand relationships and to measure ES [27]. A set of indicators (Table 1) that quantitatively represented the processes by which ecosystems regulate water balance was selected to assess the capacity of ecosystems to prevent and mitigate surface runoff and floods.

2.2.1. Hydroclimate and Population Indicators on the Macroscale

Soil and surface water retention capacities are key indicators for measuring the reduction in flood danger and preventing damage to infrastructure; therefore, they were used as supply indicators of the water-flow-regulating ESs [4]. Calculation of the water-flow-regulating capacity was based on the TETIS model [28]. This model is not a groundwater model; thus, the regional water yield was determined primarily by the rainfall patterns, which mainly depend on the regional climate and topography [29]. For this study, the water regulation capacity was defined as the ratio of the water stored in the soil (Hu, mm/year) to the ecosystem water flow (R, units of mm/year, where R is calculated as the rainfall minus potential evapotranspiration). The potential evapotranspiration should be modified by correction factors for different vegetation types to obtain a more realistic value. The utilized correction factors (Table 2) were derived from the InVEST (Integrated Valuation of Ecosystem Services and Tradeoffs) classification and changed to fit the LULC CORINE classification [30].
To assess the demand for water-flow-regulating ESs, we used the annual drought index (dMI), an indicator implemented from the Deutscher Wetterdienst (DWD). The dMI can be used for measuring gradual change from arid to humid in a certain area, because the regional drought severity often contradicts the need to regulate surface runoff. The demand for water-flow-regulating ESs is also related to the benefits that people obtain from this service. Such benefits include the protection of property, such as infrastructure and farmlands, and safety to human life in this study. The damage and effects caused by the lack of water-flow-regulating services are more severe in densely populated areas because more people suffer from these effects. Hence, population density is regarded as an indicator to reflect the demand for water-flow-regulating services.

2.2.2. Construction-Related Indicators on the Microscale

In an urban catchment, imperviousness is generally adopted as an effective indicator for assessing positional runoff risk. The definition of an impervious surface is a natural or anthropogenic material that prevents the infiltration of surface water into underlying soils [31]. When the imperviousness ratio increases, both the velocity and volume of surface runoff increase. This is due to the enhancement of hydraulic efficiency and the substantial decrease in capacity for rainwater infiltration, in addition to a concomitant increase in runoff generation in urban catchments [32]. The effects of imperviousness on surface runoff at the scale of small, urbanized drainage areas have recently been determined [33]. Highly sealed urban areas with a high proportion of impervious pavement prevent surface water from infiltrating into the ground. In these areas, the risk of a large amount of surface runoff is higher than in other natural permeable areas. In other words, the demand for water flow regulation in impervious areas is higher than in other places. Therefore, the imperviousness ratio was used to represent the demand for water-flow-regulating ESs in the downscaling analysis.
In addition to the imperviousness factors, topography features, such as the slope and area of the catchment, are also regarded as indicators that influence the water-flow-regulating ESs [34]. In areas with steeper slopes, runoff from the same type of surface drains faster. In addition, with the same drainage conditions, the smaller the catchment, the shorter the drainage time. Hence, in the downscaling research, the slope and area of the catchment were regarded as indicators to show the potential drainage capacity with the supply of water-flow-regulating ESs.

2.3. Database

Spatial and nonspatial data were collected for the study area and transformed into appropriate formats to build a database for spatial analyses and for use in the assessment of the water-flow-regulating ESs’ capacity assessment. Datasets (Table 2), including hydrological data, land use data, and a digital elevation model (DEM) were used, with formats compatible with Arc GIS standards. Additional data for water-flow-regulating ES demands’ assessments, such as imperviousness data and population data, were also included.
To assess the changes in water-flow-regulating ESs in Bochum, we compared the services in 1991 and 2018. Therefore, the database contained data both for 1990/1991 and 2018, except for those values utilized for downscaling research, which only contained 2018.

2.3.1. Hydrological Data

Hydrological data, including precipitation data, evapotranspiration data, soil moisture data, and drought index, provided by DWD, were spatially differentiated in 1 km × 1 km grids. The gridding method was based on height regression and inverse distance weight (IDW) of the DWD station data. The annual precipitation data were the sum of monthly precipitation grids over Germany, derived from DWD stations and legally qualitatively equivalent partner stations in Germany. The evapotranspiration grid was interpolated from the potential evapotranspiration over grass, which was derived at a fixed selection of stations. The potential evaporation was calculated with the AMBAV model, which was developed to calculate soil water balance and simulated the water balance in the crop-soil system using the Penman–Monteith formula on an hourly basis [35]. The soil moisture grid was interpolated from the soil moisture at a 60 cm depth under grass derived from the same stations. The drought index grids are only visualized from the year 2000 onwards on the DWD website; therefore, the drought index value for the year 1991 was calculated from the precipitation and temperature data in 1991. Due to the roughness of the data resolution, these data could be implemented for the assessment of the water-flow-regulating ESs on the whole municipality scale but are not suitable for detailed analysis. Through calculations of the water-regulation capacity (WC), these hydrological data can explain the water-flow-regulating ES supply.

2.3.2. Land Use Data

CORINE land cover information for 1990 and 2018 was used as the main source to modify the evapotranspiration of different land cover types using evapotranspiration coefficients (Table 1). CORINE provides cost-effective data which are also comparable across Europe. CORINE GIS data contain a minimum mapping unit (MMU) of 25 hectares (ha) for areal phenomena and a minimum width of 100 m for linear phenomena. The CORINE data were temporally and spatially adequate for this analysis, containing land cover data for both 1990 and 2018, with a scale sufficient for the assessment of water-flow-regulating services, comparable with the other data in 1 km × 1 km grids.

2.3.3. Population Data

Population data were derived from the Statistisches Jahrbuch Bochum for 1991 and 2018. However, these population data were counted in administrative districts which did not match the grids from the hydrological data. Hence, the population data of each district were calculated as population density values by dividing by the area of the corresponding district, then further calculated as population density data in line with the hydrological grids using Arc GIS tools.

2.3.4. Imperviousness Data

The imperviousness ratio was used as the indicator that represented the demand for water-flow-regulating ESs at the microscale. Therefore, the freely accessible high-resolution imperviousness data on Copernicus was implemented in this research. These data are available in 20 m pixel sizes and capture the percentage of soil sealing. The level of sealed soil (imperviousness degree: 1% to 100%) is produced using a semiautomated classification, based on the calibrated NDVI [36]. The imperviousness data for the year 2015, as this was the most recent dataset, were used to measure the demand for water-flow-regulating ESs on the microscale and compare them with the results of measurements on the macroscale.

2.3.5. Digital Elevation Model

The slope and catchment maps were derived from a digital elevation model (DEM) using the ArcGIS Spatial Analyst. This 1 m resolution DEM was downloaded from TIM-online 2.0, an internet application for North Rhine–Westphalia, displaying the digital map and geographic data. The buildings’ locations and heights were extracted from a GIS database. The building’s height, combined with the original high-resolution DEM, produced a new digital surface-elevation model containing the building information. This model was utilized for improving the accuracy of the water catchments’ simulation by using GIS hydrologic analysis tools (Figure 3) in the hydrological and slope analysis.

2.4. Cross-Scale Approach for Assessing Water-Flow-Regulating ES

A cross-scale approach (Figure 4 and Figure 5) was applied to explore improvements of water-flow-regulating ESs with the changing urban forms. On the macroscale, indicators of both supply and demand sides of water-flow-regulating ESs were determined and mapped. Then, the supply–demand relationships were shown by overlapping the supply and demand maps identifying the spatial distribution of differences in 2018. The second assessment of water-flow-regulating ESs in 1991 was performed to contrast and clarify the changing trends in ES. The most oversupplied and most overdemanded areas were selected for downscaled analysis at the microscale. Construction-related indicators were selected to assess the urban form that influenced water flow regulation at smaller scales. Field research was combined to explore future urban development in response to reduced urban water-logging problems and improved urban water-flow-regulating ESs.

2.5. Mapping of Water-Flow-Regulating ESs

Mapping ESs is one of the main challenges facing the implementation of the ES concept in decision making [11]. Water flow regulation has been assessed together with other ecosystem functions and services [11,28,37]. Most empirical research on water ESs has been carried out on aquatic ecosystems, forests ecosystems, and agricultural ecosystems, rather than on urban ecosystems [38]. Maragno et al. proposed a new ES approach to manage urban water flows by modeling the supply and demand of urban flood-reduction services in 2018. In this study, the supply, demand, and budget of water-flow-regulating ESs were mapped on both the macro- and microscales, utilizing hydroclimate indicators and construction-related indicators, respectively, to highlight similarities and differences.

2.5.1. Supply-Demand Budget Mapping on the Macroscale

On the macroscale, the supply of water-flow-regulating ESs is reflected by the water-retention capacity, and the demand of this ES represents the benefits which could be reflected by the population density and the degree of ecosystem dryness. In addition, spatial patterns and balances between supply and demand can be mapped by merging the maps of water-flow-regulating ESs’ supply and demand [15].
As a result of a spatial overlay between the supply and demand map layers, a map of the water-flow-regulating ESs’ budgets in 1991 and 2018 was created with a 1 km × 1 km grid resolution. For the calculation, the demand of water-flow-regulating ES was transformed into negative values and the supply was accounted as positive values. The changes in the budget between 1991 and 2018 were also mapped by overlapping these two budgets. Hence, changes of the water-flow-regulating ESs from 1991 to 2018 could be visually represented on the map.

2.5.2. Mapping and Field Research Approaches on the Microscale

Downscaling analysis of urban areas was included to ascertain the influence of the urban form in the budget of water-flow-regulating ESs. Sites for the downscaling analysis were selected from the oversupplied and overdemanded areas in the budget map of water-flow-regulating ESs in 2018. The imperviousness ratio, the slope, and the areas of catchments were mapped in the research sites to comprehensively assess construction indicators related to water flow regulating with a 20 m × 20 m resolution.
The imperviousness data, such as the demand for water-flow-regulating ESs, were divided into five degrees (value 1 to 5), which are, respectively, <20%, 20–40%, 40–60%, 60–80%, and >80%. Slope values applied to a relative scale ranging from 1 to 5 were >35°, 15°–35°, 5°–15°, 2°–5°, and <2°. Areas of catchments were also divided into five degrees based on the quantiles of catchments’ areas in 1991, which from 1 to 5 are >5215 m2, 3995–5215 m2, 3163–3995 m2, 2019–3163 m2, and <2019 m2, respectively. The water-flow-regulating ES supply capacity was mapped by overlapping slope and catchment layers and assigning values from 1 to 5. After downscaled research sites were determined from the extremum areas on the budget map of 2018, the construction environment assessment maps of these sites were created, and they are also shown as further results. Based on the assessment at the microscale, a statistical table from field research for the downscaled analysis sites presents the actual situation of urban spaces with different water-flow-regulating capacities. The map of water-flow-regulating ES budgets in downscaling sites was created in the same way as the budget for the whole municipality. Moreover, an on-the-spot investigation was performed on selected areas to determine the actual construction situation for the spots with different downscaling assessment results.
In the first and second steps (Figure 4), the supply capacities and demand for water-flow-regulating ESs in 2018 were measured and mapped on the scale of the municipality in statistic grids. After overlapping the supply and demand map layers, the budget of this service was created to illustrate its spatial differences. The capacities of the identified spatial units were assessed on a relative scale ranging from 1 to 5, based on the classification method of Burkhard’s assessment matrix for ESs [15]. This scale offers an alternative relative evaluation scheme, avoiding the presentation of monetary or normative value–transfer results [39].

3. Results

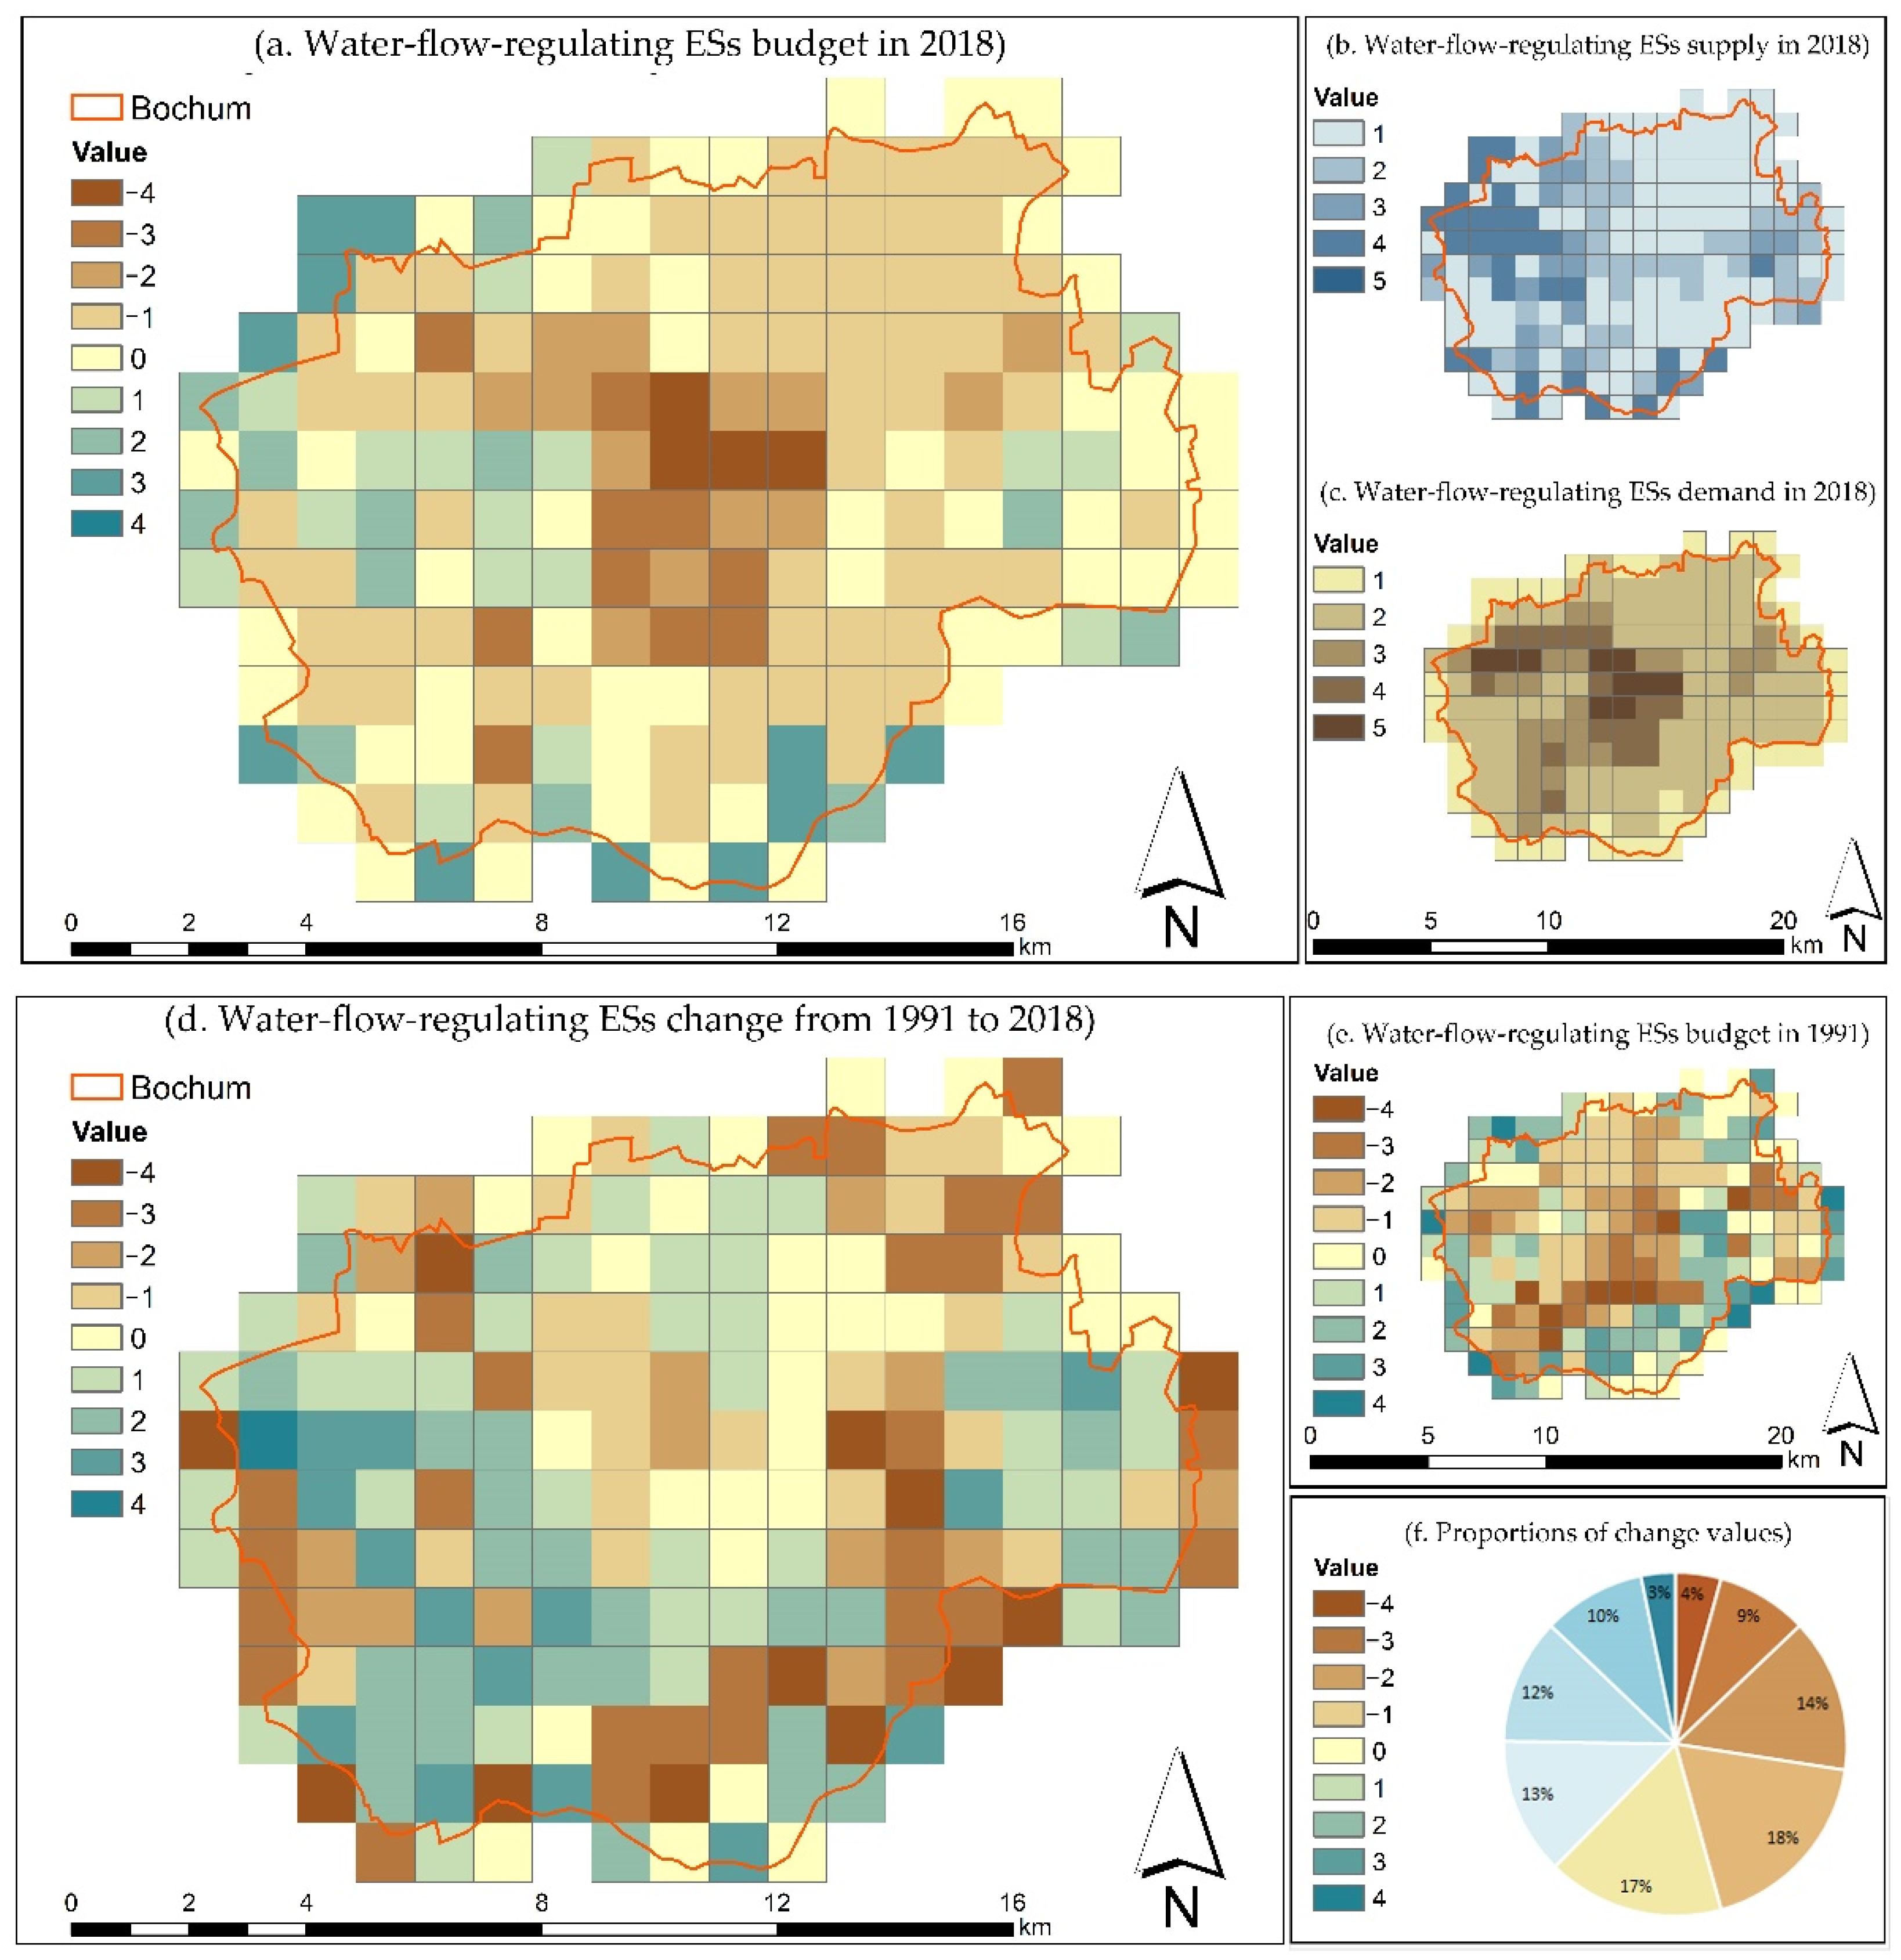
3.1. Water-Flow-Regulating ES Budget on the Macroscale

For assessment of the water-flow-regulating capacity, the ranking was based on the water-flow-regulating capacity values in 1991 and divided by quantiles in different spatial grids. Areas with a 1-value included those grids whose water-flow-regulating capacity was under 0.112 m−3 and indicated that this was the lowest relevant capacity to supply water-flow-regulating ESs. A 5-value showed that the capacity of water regulating was over 0.645 m−3, indicating the highest relevant capacity for the supply of this service in the case study area. Values of 2, 3, and 4 represented capacities of 0.112–0.17 m−3, 0.117–0.119 m−3, and 0.119–0.645 m−3, respectively, and were intermediate supply capacities.
A similar relative scale ranging from 1 to 5 was applied to assess the demand for water flow regulation. The value was calculated by multiplying these two indicators; 1 indicated that there was no relevant demand for water flow regulation, and 5 indicated the highest demand for water flow regulation within the case study area. Values of 2, 3, and 4 also represented the respective intermediate demands. From the 1-value to 5-value, these were determined by quantiles of the values of demand in 1991, which were <232 mm/°C∙m−2, 232–705 mm/°C∙m−2, 705–865 mm/°C∙m−2, 865–1098 mm/°C∙m−2, and >1098 mm/°C∙m−2, respectively.
The budget map of water-flow-regulating ESs shows that high-demand areas were concentrated in dense urban areas in 2018. The distribution of the overdemand pixels with a −4 value was highly consistent with the continuous urban fabric (Figure 6a). In contrast, the locations of oversupply pixels had no direct relationship with specific land covers, but were mostly allocated in the west of Bochum due to the lower levels of annual precipitation. In the supply map of water-flow-regulating ESs, there is a significant difference between the supply capacities of the west and the east. The demand for water flow regulation differs with the urban–rural topography and the demand increases with the urbanization intensity.

3.2. Change of Water-Flow-Regulating ES Budget on the Macroscale

The budget for water-flow-regulating ESs in 1991 contrasts with the budget for 2018. By comparing these two budget maps, the change in the budget is reflected (Figure 6d). The budget of water-flow-regulating ESs decreased by over 60% in Bochum during this period (Figure 6f). The main declining areas are located in a belt from the south to the northeast, which was covered by natural vegetation and agricultural land in 1991. Even though most of the vegetated areas remained in this belt in 2018 compared with the condition in 1991, some vegetation with high evaporation rates, such as forests and pastures, had been transformed into other land cover types with lower evaporation rates, such as arable land. This kind of vegetation degradation causes a decrease in the water-flow-regulating capacity. Meanwhile, urban development encroached on original vegetation existing in those declined areas in the southern and northern parts. Compared with the land cover changes from 1990 to 2018, the budget decreased as well in the city center which became denser with the increase in impervious surfaces.

3.3. Mapping of Water-Flow-Regulating ESs on the Microscale

Two sites with values of −4 and 3 in the budget map in 2018 were selected for the downscaling analysis (Figure 7a). Site A was located near the city center with relatively high-density residential areas and wide motorways for transportation. Site B occupied the area with extensive natural vegetation and arable land in the south urban fringe of the Bochum municipality. Both sites had an area of 1 km2. The downscaling budget maps of sites A and B were created by several processes (see Figure 5 and Section 2.2), reflecting different supply and demand relationships in a high-resolution grid (1 m × 1 m), offering a reference for fieldwork to identify special urban form features in oversupplied and overdemanded areas.
Comparing the budgets, site A had 50% more overdemanded surfaces in the whole quadrant. Some of these surfaces were concentrated on the sides of main roads, whereas others described several dispersedly distributed clusters. Around 60% of the surfaces in site B were oversupply areas, although most of them were on the scale with a value of 1, which meant that the capacity of supply only slightly exceeded the demand. The average value of the budget on the microscale in site A was −0.66, whereas the average value of the budget in site B was 0.46, which is in line with the overall budget value of site A (−4) and site B (3) on the macroscale.

3.4. Urban form Assessment by Field Research

To prove that the mapping of water-flow-regulating ESs based on the urban form indicators on the microscale accurately reflected the urban environment, two field studies have been practiced on the 22 May and 2 July, 2019, for site A and site B separately with GPS (Figure 7b). We identified urban form characteristics that could improve or hinder the water-flow-regulating ESs. Photographs of the existing conditions were collated for 17 points and 9 points in site A and site B, respectively (Table 3).
Most of the high-demand clusters in both sites corresponded to high-density residential areas and some flat-sealed areas such as factories, parking lots, and football fields. Overdemanded lines in budget maps are usually roads without side greenery. Oversupply areas, such as greenways with wide green belts, were present in the two sites, but urban forms varied within the sites across different locations. Urban green areas such as cemeteries and gardens were the dominant high-supply areas in site A, which was close to the city center. Forests and grasslands were more common in site B as the oversupply areas. Therefore, the results of the fieldwork suggest that the proportions of concrete and flat buildings and facilities are related to the capacity of water-flow-regulating ESs based on the utilized downscaling indicators.

4. Discussion

Our research presents an assessment and mapping of water-flow-regulating ESs on the macroscale to identify differences of water-flow-regulating ESs from the city center to the urban fringe in Bochum, Germany. The results represent the integration of data from different sources with a GIS-based assessment, providing an appropriate database and a set of indicators for measuring the form–service–benefit relationships. Mapping on the macroscale and microscale enables comparisons of results calculated for supply and demand.

4.1. The Use of a Cross-Scale Approach for Water-Flow-Regulating ESs

The cross-scale assessment based on the quantified indicators provides a simple approach to measure water-flow-regulating ESs on a municipality scale compared with the use of hydrological models, which is common for measuring water-related ecological functions. Although hydrological models can accurately quantify hydrological performance, they usually require detailed continuous hydrological observations and complex datasets [37,40,41]. In some cases, event simulations are also necessary for describing the processes of interception, dynamic infiltration, surface runoff, and erosion from watersheds predominantly characterized by overland flow [39]. In this study, merely annual precipitation data, annual evapotranspiration data, and annual soil moisture data in each statistical grid were used to calculate the water flow regulation capacity, which enhanced the measurement efficiency. The demand for water-flow-regulating ESs was quantified by climate and population data to reflect the extent of the impact on human welfare. This method avoids the influence of individual subjective opinions.
However, there are some shortcomings. For instance, the assessment implemented two different groups of indicators for comparison, on the macro- and microscales. Although the results of the two groups of indicators showed consistency (see Section 3.3), the relationships between them are still under discussion. Moreover, the multiscale assessment included the overall assessment and downscaling assessment, as well as the fieldwork, which are time-consuming routines. Another problem in the measurement of water-flow-regulating ESs is the annual water yield and the potential drainage capacity determined by the drainage time. In the downscaling analysis, only the imperviousness ratio, the average slope, and the area of the catchment were selected as urban-form-related indicators. However, there are other factors influencing the damage caused by a large degree of surface runoff. Additionally, the results of our field research imply the effects of a sealed area on water-flow-regulating ESs, although there is no clear association between the other two indicators. Hence, the indicators of the microscale approach for urban management should screen more relevant indicators of the urban form with more significant actual spatial differences in further research.
Rapid surface runoff could increase the erosion of urban infrastructure and threaten the security of pedestrian traffic. Another limitation involved for the calculation of population density in the municipality were those grids on the boundary that only had a counted population within the boundary. This might cause an underestimation of the demand for water-flow-regulating ESs in those grids; therefore, those grids were not considered in the selection of the downscaling sites. Moreover, the implementation of the 1–5 class value assignments in this study may be deceptive in some cases. These assignments only represent degrees and not actual magnitudes for the indicators, or combinations of indicators.

4.2. Building the Cross-Scale Approach to Bridge the Gap

Prior research of water-related ESs has mainly focused on the relationship between land cover types and the capacity of ES supply and demand on the regional scale [10,37,42,43,44]. However, in densely urbanized areas, LULC is dominated by urban fabric and artificial areas in highly complex material assemblages taking place at relatively short distances [45]. Therefore, simplified and homogenized LULC cannot be regarded as the main reference to describe different capacities of ES in an urban context. The influences of urban form, green infrastructure, and urban LULC on water-flow-regulating ESs are highly complex; however, research on urban ES are mostly “explanations” rather than “applications” [7].
Studying urban water-flow-regulating ESs can enhance decision making for better urban planning. This research attempted to bridge the “science-practice gap” for water-flow-regulating ESs research through a cross-scale approach to link ES on the macroscale and urban form on the microscale. Analyzing urban form at the microscale is a promising research avenue. There is a similarity between average values from the microscale and the macroscale assessments of selected oversupply and overdemand sites.

4.3. Effectiveness of theMicroscale Approach in Urban Planning towards Water-Flow-Regulating ESs

Urban form assessment and field research were integrated into the microscale approach to recognize water-related urban constructed elements and propose practical recommendations for urban planning and design. Identifying what urban form should be appropriated for enhancing water-flow-regulating ESs is a challenge for urban development. In our research, common categories in oversupply areas on a microscale were regarded as urban forms that could benefit water-flow-regulating ESs (Table 3). The classification of urban forms based on the characteristic assessment by field research allows suggestions for oversupply and overdemand areas in downscaling sites (Table 4). Those suggestions for decision makers aim to mitigate the decline in water-flow-regulating ESs in Bochum in the future.

5. Conclusions

In this study, we were concerned about the disconnect of supply–demand research on water-flow-regulating ESs and urban planning and construction towards mitigating the risk of extreme urban water flows. A cross-scale approach for matching the supply–demand relationships of water-flow-regulating ESs with urban form and field research was applied in Bochum, Germany.
On the macroscale, the supply–demand budget of water-flow-regulating ESs in most areas of Bochum declined from 1991 to 2018, with a considerable urban–rural difference. The ES budget decreased more significantly in the vegetated area than in the densely built areas, as a result of vegetation degradation and change from natural areas to agricultural land. This change in water-flow-regulating ESs in the study area could help decision makers recognize which areas are in urgent need of recovering water-regulating ESs due to declines in this service over the past few years. To ascertain the mismatch of the supply–demand budget, we classified the typical superior and inferior urban forms of water-flow-regulating ESs through field research on the two selected sites. On the microscale, further assessments of urban form in two typical extremum sites showed similar results: the different urban forms could influence the water-flow-regulating ESs. Moreover, further fieldwork in the selected sites identified urban-form characteristics to summarize operable optimization, enhancement, and protection suggestions for decision makers.
This empirical study attempted to bridge the “science-practice gap” for water-flow-regulating ESs in urban areas. A macroscale approach based on water-regulating ES budget mapping for urban assessments and a micro approach based on urban forms for further enhancement and maintenance have been proposed to strengthen urban management. With better data and more accurate analysis, matching supply–demand relationships of water-flow-regulating ESs by studying urban-form-related characteristics on a smaller scale is promising. Appropriate implementation of the measurements of water-flow-regulating ESs into urban planning and design would greatly benefit from the cross-scale approach used in our research. This is a promising technique to connect research and practice in urban development.

Author Contributions

Conceptualization, Z.X. and Y.W.; methodology, Z.X.; software, Z.X.; validation, Z.X. and Y.W; formal analysis, Z.X.; investigation, Z.X.; resources, Z.X.; data curation, Z.X.; writing—original draft preparation, Z.X.; writing—review and editing, Z.X.; visualization, Z.X.; supervision, Y.W.; project administration, Y.W.; funding acquisition, Y.W. All authors have read and agreed to the published version of the manuscript.

Funding

This work was funded by the National Key Technology R&D Program of China “rural land-scape environment and its digital identification technology development” (No. 2019YFD1100405).

Data Availability Statement

Publicly available datasets were analyzed in this study. The climate-related data can be found on Deutscher Wetterdienst Climate Data Center: https://cdc.dwd.de/portal/ (accessed on 26 March 2022). The land use data and imperviousness data can be found on Copernicus: https://www.copernicus.eu/en (accessed on 26 March 2022). The population data can be found on the website of Bochum: https://www.bochum.de/ (accessed on 26 March 2022). The digital evaluation data can be found on TIM-online: https://www.tim-online.nrw.de/ (accessed on 26 March 2022).

Acknowledgments

The authors are grateful to the anonymous reviewers for their detailed comments and valuable suggestions.

Conflicts of Interest

The authors declare no conflict of interest.

References

  1. Millennium Ecosystem Assessment. Ecosystems and Human Well-Being; Island Press: Washington, DC, USA, 2005; Volume 5. [Google Scholar]
  2. La Rosa, D.; Spyra, M.; Inostroza, L. Indicators of Cultural Ecosystem Services for urban planning: A review. Ecol. Indic. 2016, 61, 74–89. [Google Scholar] [CrossRef]
  3. Gómez-Baggethun, E.; Barton, D.N. Classifying and valuing ecosystem services for urban planning. Ecol. Econ. 2013, 86, 235–245. [Google Scholar] [CrossRef]
  4. de Groot, R.S.; Alkemade, R.; Braat, L.; Hein, L.; Willemen, L. Challenges in integrating the concept of ecosystem services and values in landscape planning, management and decision making. Ecol. Complex. 2010, 7, 260–272. [Google Scholar] [CrossRef]
  5. Chen, C.; Wang, Y.; Jia, J.; Mao, L.; Meurk, C.D. Ecosystem services mapping in practice: A Pasteur ’ s quadrant perspective. Ecosyst. Serv. 2019, 40, 101042. [Google Scholar] [CrossRef]
  6. Sutherland, I.J.; Villamagna, A.M.; Ouellet, C.; Bennett, E.M.; Chin, A.T.M.; Yeung, A.C.Y.; Lamothe, K.A.; Tomschae, S.A.; Cormie, R. Undervalued and under pressure: A plea for greater attention toward regulating ecosystem services. Ecol. Indic. 2018, 94, 23–32. [Google Scholar] [CrossRef]
  7. Cortinovis, C.; Geneletti, D. A framework to explore the effects of urban planning decisions on regulating ecosystem services in cities. Ecosyst. Serv. 2019, 38, 100946. [Google Scholar] [CrossRef]
  8. Haines-Young, R.; Potschin-Young, M. Revision of the common international classification for ecosystem services (CICES V5. 1): A policy brief. One Ecosyst. 2018, 3, e27108. [Google Scholar] [CrossRef]
  9. de Groot, R.S.; Wilson, M.A.; Boumans, R.M.J. A typology for the classification, description and vauation of ecosystem functions, goods and services. Ecol. Econ. 2002, 41, 393–408. [Google Scholar] [CrossRef] [Green Version]
  10. Li, C. Ecohydrology and good urban design for urban storm water-logging in Beijing, China. Ecohydrol. Hydrobiol. 2012, 12, 287–300. [Google Scholar] [CrossRef] [Green Version]
  11. Daily, G.C.; Matson, P.A. Ecosystem services: From theory to implementation. Proc. Natl. Acad. Sci. USA 2008, 105, 9455–9456. [Google Scholar] [CrossRef] [Green Version]
  12. Maitre, D.C.L.; Kotzee, I.M.; O’Farrell, P.J. Impacts of land-cover change on the water flow regulation ecosystem service: Invasive alien plants, fire and their policy implications. Land Use Policy 2014, 36, 171–181. [Google Scholar] [CrossRef]
  13. Zimmermann, E.; Bracalenti, L.; Piacentini, R.; Inostroza, L. Urban Flood Risk Reduction by Increasing Green Areas for Adaptation to Climate Change. In Procedia Engineering; Elsevier Ltd.: Amsterdam, The Netherlands, 2016; pp. 2241–2246. [Google Scholar]
  14. Pappalardo, V.; La Rosa, D.; Campisano, A.; La Greca, P. The potential of green infrastructure application in urban runoff control for land use planning: A preliminary evaluation from a southern Italy case study. Ecosyst. Serv. 2017, 26, 345–354. [Google Scholar] [CrossRef]
  15. Burkhard, B.; Kroll, F.; Nedkov, S.; Müller, F. Mapping ecosystem service supply, demand and budgets. Ecol. Indic. 2012, 21, 17–29. [Google Scholar] [CrossRef]
  16. Zepp, H.; Mizgajski, A.; Mess, C.; Zwierzchowska, I. A preliminary assessment of urban ecosystem services in central European urban areas. A methodological outline with examples from Bochum (Germany) and Poznań (Poland). Ber. Geogr. Landeskd. 2016, 90. Available online: https://www.researchgate.net/publication/315492264_Zepp_H_Mizgajski_A_Mess_C_Zwierzchowska_I_2016_-_A_Preliminary_Assessment_of_Urban_Ecosystem_Services_in_Central_European_Urban_areas_A_Methodological_Outline_with_Examples_from_Bochum_Germany_and_Poz (accessed on 26 March 2022).
  17. Vargo, J.; Habeeb, D.; Stone, B. The importance of land cover change across urban–rural typologies for climate modeling. J. Environ. Manag. 2013, 114, 243–252. [Google Scholar] [CrossRef]
  18. Zhou, X.; Chen, H. Impact of urbanization-related land use land cover changes and urban morphology changes on the urban heat island phenomenon. Sci. Total Environ. 2018, 635, 1467–1476. [Google Scholar] [CrossRef]
  19. Viana, C.M.; Oliveira, S.; Oliveira, S.C.; Rocha, J. Land Use/Land Cover Change Detection and Urban Sprawl Analysis. In Spatial Modeling in GIS and R for Earth and Environmental Sciences; Pourghasemi, H.R., Gokceoglu, C., Eds.; Elsevier: Amsterdam, The Netherlands, 2019; Volume 29, pp. 621–651. [Google Scholar]
  20. Hassan, M.M. Monitoring land use/land cover change, urban growth dynamics and landscape pattern analysis in five fastest urbanized cities in Bangladesh. Remote Sens. Appl. Soc. Environ. 2017, 7, 69–83. [Google Scholar] [CrossRef]
  21. Bochum Climate_ Average Temperature, Weather by Month, Bochum Weather Average—Climate-Data. 2019. Available online: climate-data.org (accessed on 26 March 2022).
  22. Van Oudenhoven, A.P.E.; Petz, K.; Alkemade, R.; Hein, L.; De Groot, R.S. Framework for systematic indicator selection to assess effects of land management on ecosystem services. Ecol. Indic. 2012, 21, 110–122. [Google Scholar] [CrossRef]
  23. Takács, Á.; Kiss, M.; Hof, A.; Tanács, E.; Gulyás, Á.; Kántor, N. Microclimate modification by urban shade trees–an integrated approach to aid ecosystem service based decision-making. Procedia Environ. Sci. 2016, 32, 97–109. [Google Scholar] [CrossRef] [Green Version]
  24. Takács, Á.; Kiss, M.; Gulyás, Á. Some aspects of indicator development for mapping microclimate regulation ecosystem service of urban tree stands. Acta Climatol. Chorol. 2014, 47, 99–108. [Google Scholar]
  25. Scholes, R.; Reyers, B.; Biggs, R.; Spierenburg, M.; Duriappah, A. Multi-scale and cross-scale assessments of social–ecological systems and their ecosystem services. Curr. Opin. Environ. Sustain. 2013, 5, 16–25. [Google Scholar] [CrossRef]
  26. Tiwary, A.; Kumar, P. Impact evaluation of green–grey infrastructure interaction on built-space integrity: An emerging perspective to urban ecosystem service. Sci. Total Environ. 2014, 487, 350–360. [Google Scholar] [CrossRef] [PubMed] [Green Version]
  27. Norton, L.; Greene, S.; Scholefield, P.; Dunbar, M. The importance of scale in the development of ecosystem service indicators? Ecol. Indic. 2016, 61, 130–140. [Google Scholar] [CrossRef] [Green Version]
  28. Onaindia, M.; de Manuel, B.F.; Madariaga, I.; Rodríguez-Loinaz, G. Co-benefits and trade-offs between biodiversity, carbon storage and water flow regulation. For. Ecol. Manag. 2013, 289, 1–9. [Google Scholar] [CrossRef]
  29. Vélez, J.J.; Puricelli, M.; López Unzu, F.; Francés, F. Parameter extrapolation to ungauged basins with a hydrological distributed model in a regional framework. Hydrol. Earth Syst. Sci. 2009, 13, 229–246. [Google Scholar]
  30. Finn, S.; Keiffer, S.; Koroncai, B.; Koroncai, B. Assessment of InVEST 2.1 Beta: Ecosystem service valuation software. Assessment 2011, 1, 1–25. [Google Scholar]
  31. Slonecker, E.T.; Jennings, D.B.; Garofalo, D. Remote sensing of impervious surfaces: A review. Remote Sens. Rev. 2001, 20, 227–255. [Google Scholar] [CrossRef]
  32. Mejía, A.I.; Moglen, G.E. Spatial Patterns of Urban Development from Optimization of Flood Peaks and Imperviousness-Based Measures. J. Hydrol. Eng. 2009, 14, 416–424. [Google Scholar] [CrossRef]
  33. Yao, L.; Wei, W.; Chen, L. How does imperviousness impact the urban rainfall-runoff process under various storm cases? Ecol. Indic. 2016, 60, 893–905. [Google Scholar] [CrossRef]
  34. Bin Ghomash, S.K.; Caviedes-Voullieme, D.; Hinz, C. Effects of erosion-induced changes to topography on runoff dynamics. J. Hydrol. 2019, 573, 811–828. [Google Scholar] [CrossRef]
  35. Friesland, H.; Löpmeier, F.-J. The performance of the model AMBAV for evapotranspiration and soil moisture on Müncheberg data. In Modelling Water and Nutrient Dynamics in Soil–Crop Systems; Springer: Berlin/Heidelberg, Germany, 2007; pp. 19–26. [Google Scholar] [CrossRef]
  36. Langanke, T.; Moran, A.; Dulleck, B.; Schleicher, C. Copernicus land monitoring service–high resolution layer water and wetness: Product specifications document. Copernic. Team EEA 2016. Available online: https://land.copernicus.eu/user-corner/technical-library/hrl-water-wetness-technical-document-prod-2015 (accessed on 26 March 2022).
  37. Schmalz, B.; Kruse, M.; Kiesel, J.; Müller, F.; Fohrer, N. Water-related ecosystem services in Western Siberian lowland basins—Analysing and mapping spatial and seasonal effects on regulating services based on ecohydrological modelling results. Ecol. Indic. 2016, 71, 55–65. [Google Scholar] [CrossRef]
  38. Aznar-Sánchez, J.A.; Velasco-Muñoz, J.F.; Belmonte-Ureña, L.J.; Manzano-Agugliaro, F. The worldwide research trends on water ecosystem services. Ecol. Indic. 2019, 99, 310–323. [Google Scholar] [CrossRef]
  39. Nedkov, S.; Burkhard, B. Flood regulating ecosystem services—Mapping supply and demand, in the Etropole municipality, Bulgaria. Ecol. Indic. 2012, 21, 67–79. [Google Scholar] [CrossRef]
  40. Stürck, J.; Poortinga, A.; Verburg, P.H. Mapping ecosystem services: The supply and demand of flood regulation services in Europe. Ecol. Indic. 2014, 38, 198–211. [Google Scholar] [CrossRef]
  41. Ghazi, H.; Messouli, M.; Khebiza, M.Y.; Egoh, B.N. Mapping regulating services in Marrakesh Safi region—Morocco. J. Arid Environ. 2018, 159, 54–65. [Google Scholar] [CrossRef]
  42. Guo, Z.; Xiao, X.; Li, D. An Assessment of Ecosystem Services: Water Flow Regulation and Hydroelectric Power Production. Ecol. Appl. 2000, 10, 925–936. [Google Scholar] [CrossRef]
  43. Tarigan, S.; Wiegand, K.; Slamet, B.; Sunarti. Minimum forest cover required for sustainable water flow regulation of a watershed: A case study in Jambi Province, Indonesia. Hydrol. Earth Syst. Sci. 2018, 22, 581–594. [Google Scholar] [CrossRef] [Green Version]
  44. Xiao, Y.; Xiao, Q.; Ouyang, Z.; Maomao, Q. Assessing changes in water flow regulation in Chongqing region, China. Environ. Monit. Assess. 2015, 187, 362. [Google Scholar] [CrossRef]
  45. Wentz, E.A.; York, A.M.; Alberti, M.; Conrow, L.; Fischer, H.; Inostroza, L.; Jantz, C.; Pickett, S.T.; Seto, K.C.; Taubenböck, H. Six fundamental aspects for conceptualizing multidimensional urban form: A spatial mapping perspective. Landsc. Urban Plan. 2018, 179, 55–62. [Google Scholar] [CrossRef]
Figure 1. Conceptual framework linking ecosystem functions and human welfares as supply and demand sides of water regulating ES.
Land 11 00740 g001
Figure 2. Overview of the study area.
Land 11 00740 g002
Figure 3. Processing of high-resolution digital elevation model with building information.
Land 11 00740 g003
Figure 4. The method used in the assessment and mapping of water-flow-regulating ESs. 1: Mapping of the supply and demand of water-flow-regulating ESs. 2: Mapping of the budget of water regulating ES. 3: Downscaling research and field research on selected research sites.
Land 11 00740 g004
Figure 5. Flow graph of the approach for assessing water-flow-regulating ESs. (a) mapping of water-flow-regulating capacity on the macroscale; (b) mapping of drought index on the macroscale; (c) mapping of population density on the macroscale; (d) selection of oversupply and overdemand sites in 2018; (e) change of the supply–demand budget from 1991 to 2018 on the macroscale; (f) mapping of imperviousness ratio on the microscale; (g) mapping of slope on the microscale; (h) mapping of the area of water catchments on the microscale; (i) supply–demand budget mapping on the microscale.
Land 11 00740 g005
Figure 6. Water-flow-regulating ESs assessment results in 1991 and 2018.
Land 11 00740 g006
Figure 7. Water-flow-regulating ESs assessment results on downscaling sites.
Land 11 00740 g007
Table 1. Indicators and respective descriptions applied for assessing demand and supply of water-flow-regulating ESs.
Dimensions Water-Flow-Regulating ESs Indicators
IndicatorsFormulaDescription
Hydroclimate and population indicators on macroscaleSupplyWater regulation capacity (WC) W C = H u R
R = P E T c
H u = P h u × V s
W C = P h u × V s P E T c
I W C = W C V s = P h u P E T c
WC is the water flow regulation capacity; Hu is the water storage in the soil (mm/year); R is the annual water flow (mm/year); P is the annual rainfall (mm/year); E T c is the corrected annual potential evapotranspiration (mm/year). P h u is the percent plant useable water %; V s is the soil volume; I W C is the index of WC.
In this study, V s was regarded as a fixed value for each measuring unit. Therefore, I W C was used as a variable to express the water-flow-regulating capacity (WC).
DemandAnnual drought index (dMI) dMI = P T + 10 The values T (in Celsius degree) from temperature grids and P (in mm) from precipitation grids. For quality, considerations refer to the quality of the input data (temperature grids, precipitation grids) (Deutscher Wetterdienst, 2018).
Population density(D) D = P S D is the population density; P is the amount of population in one unit; S is the area of the unit.
Constructed–related indicators on microscaleSupplyAverage slope (AS)——The average slope of a pixel in the downscaling analysis.
Area of the catchment (AC)——The area of the catchment in the downscaling analysis sites.
DemandImperviousness ratio (I)——The ratio of impermeable surfaces to all areas in a downscaling analysis pixel.
Table 2. Utilized data, their source, and their spatial resolution for the study area.
DataSourceDetail
Hydrological dataPrecipitationDeutscher Wetterdienst Climate Data Center1 km × 1 km 1991/2018 unit: mm
EvapotranspirationDeutscher Wetterdienst Climate Data Center1 km × 1 km 1991/2018 unit: mm
InVEST- Integrated Valuation of ESs and Tradeoffsevapotranspiration coefficient table
Soil moistureDeutscher Wetterdienst Climate Data Center1 km × 1 km 1991/2018
unit: percent plant useable water %
Drought indexDeutscher Wetterdienst Climate Data Center1 km × 1 km1991/2018
unit: mm/°C
Land use dataCORINE land cover 1990100 m × 100 m
CORINE land cover 2018100 m × 100 m
Population dataStatistisches Jahrbuch Bochum2018/1991
Imperviousness dataCopernicus20 m × 20 m
DEMTIM-online 2.01 m × 1 m
Table 3. Statistical table of different overdemand and oversupply areas in both downscaling sites.
CategoryOverdemand Areas
Dense Residential AreaParking LotPlantFootball FieldUrban Vehicles Road
Site A23216
Site B30002
Photo Land 11 00740 i001 Land 11 00740 i002 Land 11 00740 i003 Land 11 00740 i004 Land 11 00740 i005
Categoryoversupply areas
urban green areaforestsgrasslands with columns of treegreenway
Site A2001
Site B0121
Photo Land 11 00740 i006 Land 11 00740 i007 Land 11 00740 i008 Land 11 00740 i009
Table 4. Suggestions for future development towards water-flow-regulating ESs in the study area.
MacroscaleOverdemand AreasOversupply Areas
Microscale
Overdemand areasOptimizing:
Transform existing streets without greenery to shaded streets separated by planting belts.
Reduce surface parking, build vertical parking lots, and underground parking lot.
Increase vegetation and permeable paving in dense residential areas.
Enhancing:
Improve the vegetation quality of existing urban green areas.
Avoid over flat square and lawn construction.
Oversupply areasProtecting:
New development should combine or improve drainage topography (golf course, residential area, and so on).
For developing the existing natural landscape, the construction of impervious areas should be limited.
Publisher’s Note: MDPI stays neutral with regard to jurisdictional claims in published maps and institutional affiliations.

