
Farmland Suitability Evaluation Oriented by Non-Agriculturalization Sensitivity: A Case Study of Hubei Province, China


Abstract
:1. Introduction
2. Literature Review

| Framework | Methods | Study Area | References |
|---|---|---|---|
| Climatic-Topographic-Soil properties | Pair-wise rating method; GIS technology | Zambia rainfed paddy rice production region | [16] |
| Climate-Slope percentage-Soil types-Water wells distributions | Multi-criteria decision-making method | Ma’an Governorate, Jordan | [18] |
| Soil nutrients-Location-Physico-Chemical properties-Soil management | Hierarchical analysis process; GIS technology | Yongding District, Zhangjiajie City | [20] |
| Climate-Location-Physico-Chemical properties-Soil nutrients | Expert scoring; Hierarchical analysis process; GIS technology | Maize growing area | [21] |
| Soil properties-Terrain-Climatic-Accessibility | FAHP (fuzzy hierarchical process); GIS technology | Central Amol District, Iran; rice | [23] |
| Climate-Slope-Soil | Expert scoring method; Hierarchical analysis process; GIS technology | Agamsa sub-basin, Ethiopia; sorghum crop | [27] |
| Slope-Soil-Drainage class-Land use/cover-Water availability | Multi-criteria evaluation decision-making (MCE) techniques; GIS technology | Ethiopian Rift Valley Basin | [38] |
| Climatic-Soil-Terrain | Expert scoring method; hierarchical analysis process; parametric method; GIS technology | Northeastern Iran; oak, pine | [39] |
| Soil-Vegetation-Location-Production | Expert scoring; hierarchical analysis process; GIS technology | Huanghe Island | [40] |
| Terrain and Landforms-Soil environment | Integrated evaluation method; hierarchical analysis process; GIS technology | Yong’an City; agricultural land | [41] |
| Terrain-Soil-Water | GIS technology; Remote Sensing Technology | Zhangzhou City | [42] |
| Soil-Terrain-Temperature-Water | Hierarchical analysis process; expert scoring method; GIS technology | Xiasiwan Town, Ganquan County, Shaanxi Province | [43] |
| Climate-Terrain-Soil physical properties-Moisture conditions-Chemical fertility | Laboratory analysis; productivity indices | Southwest Cameroon coastal plain; oil palm land | [44] |
3. Methodology
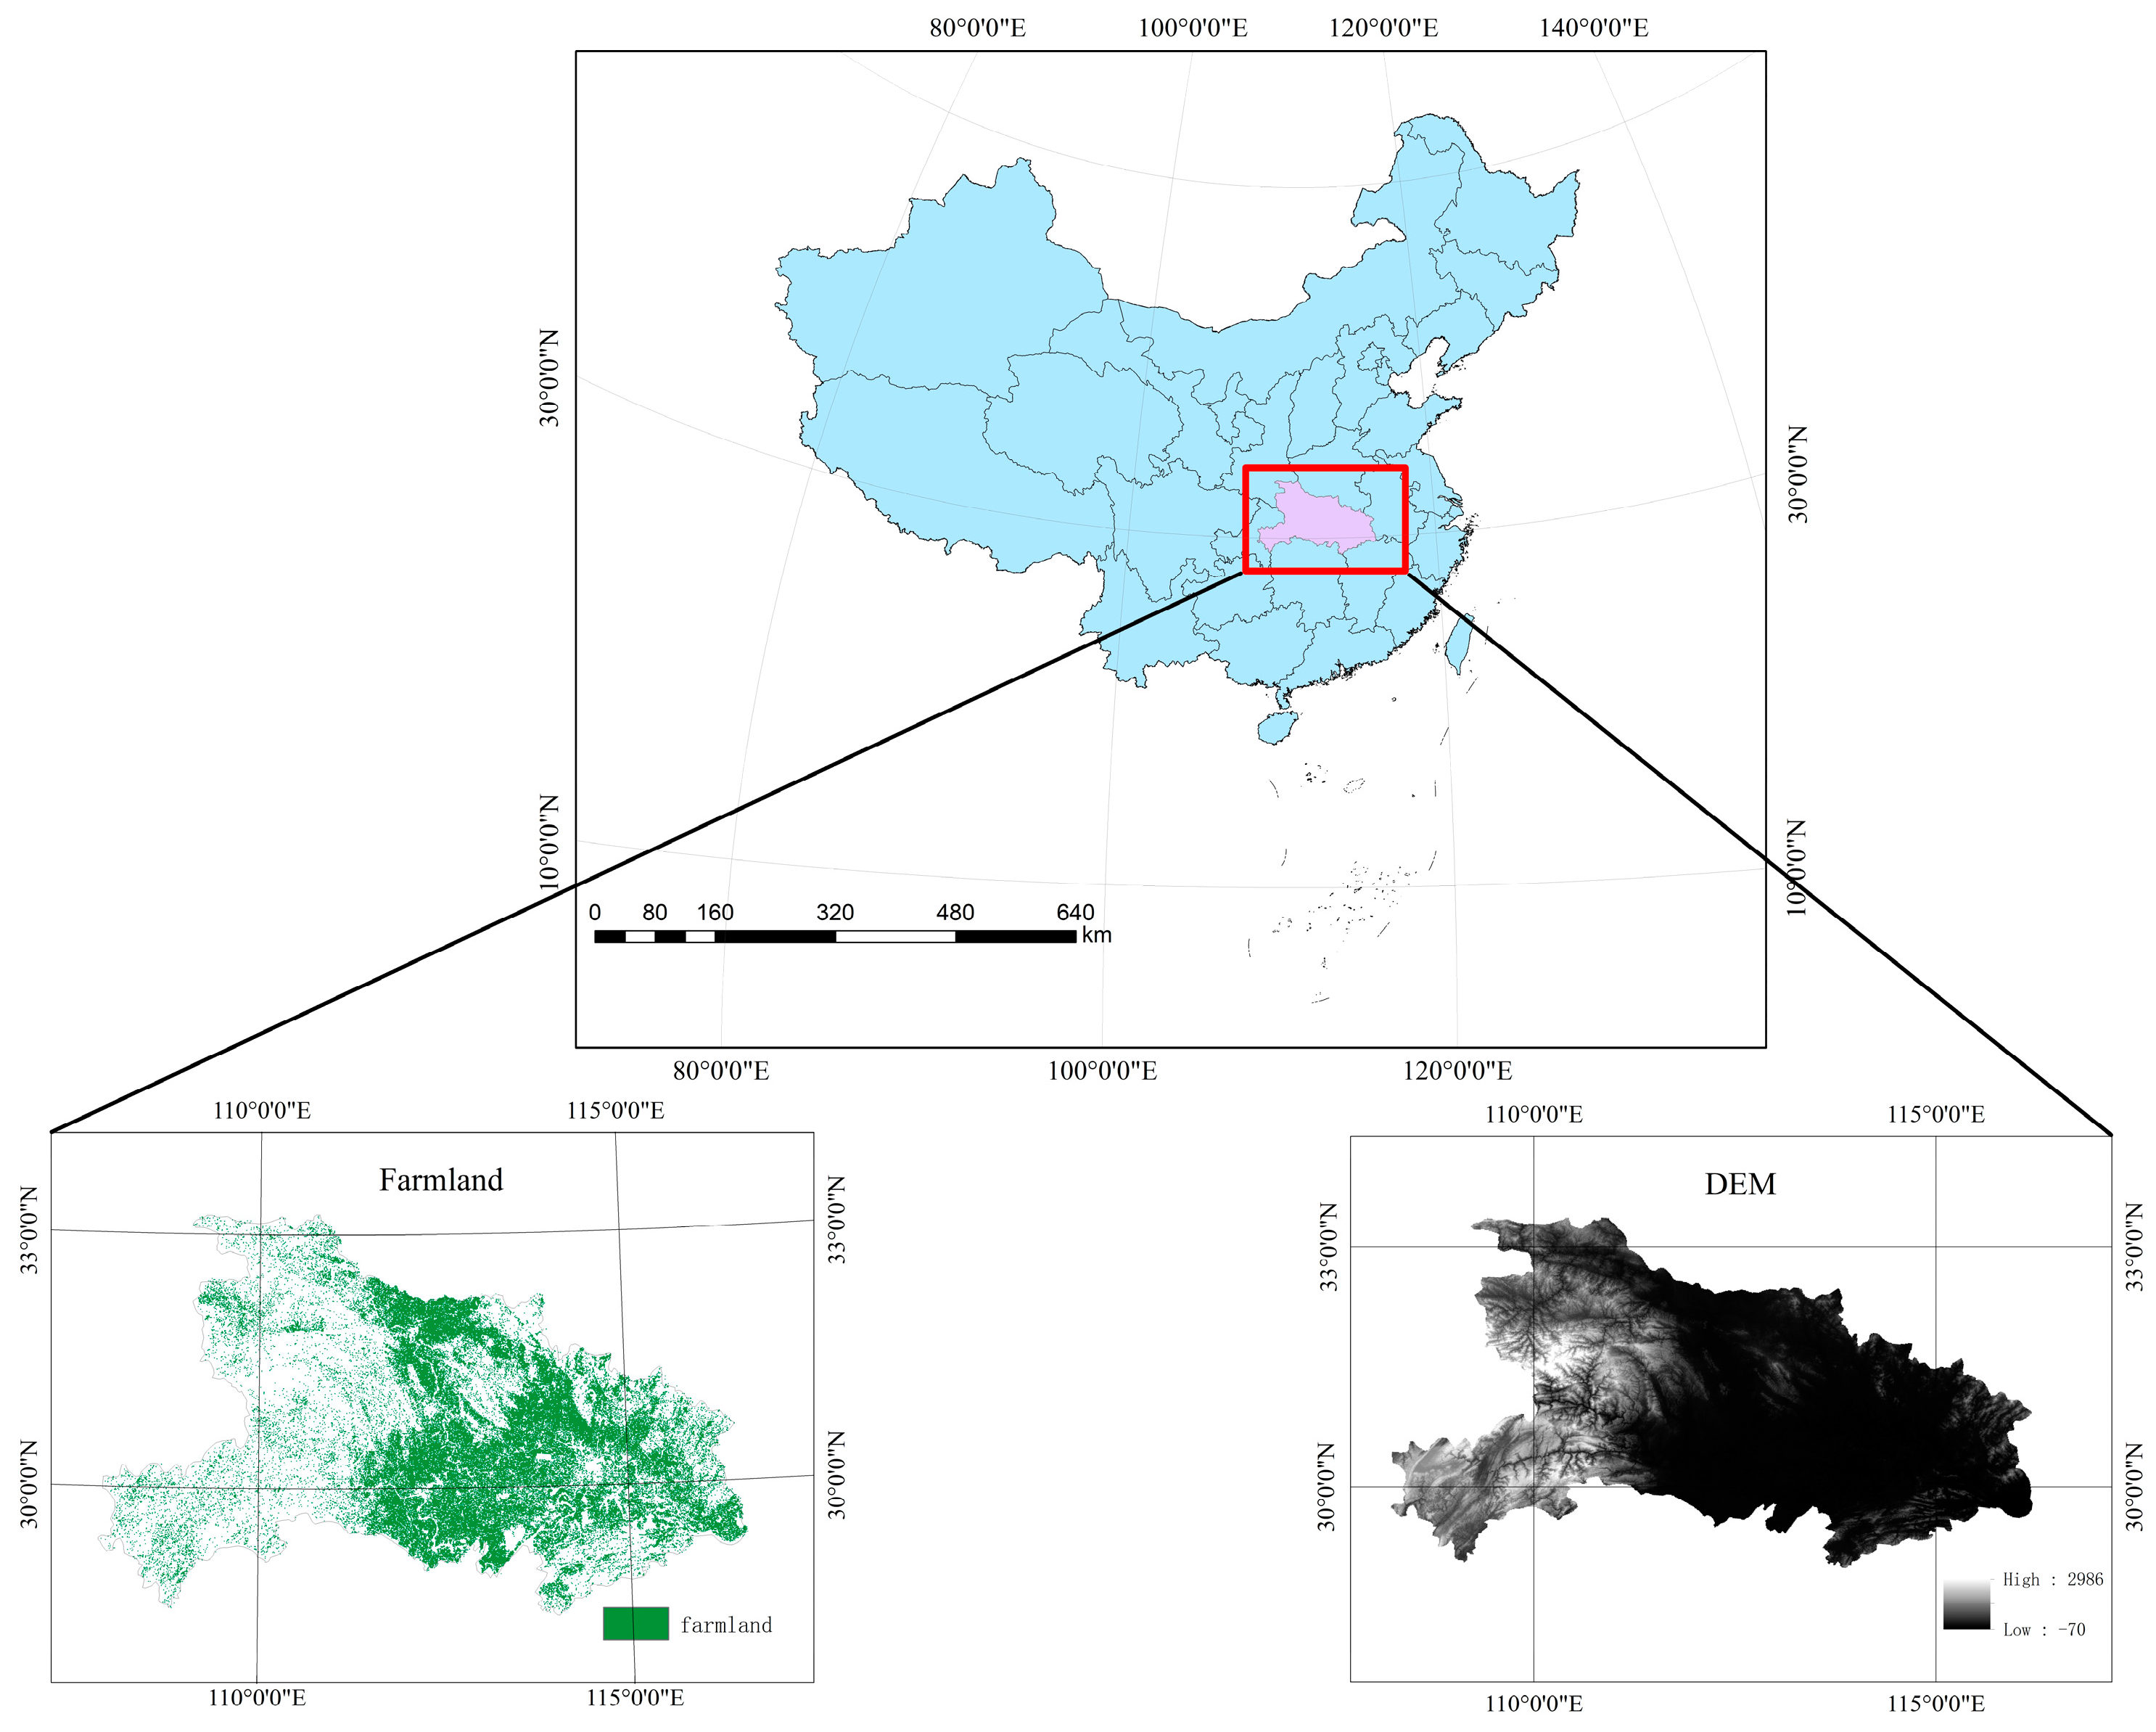
3.1. Study Area
3.2. Methods
3.2.1. Evaluation Framework of FSE
- (1)
- Soil
- (2)
- Terrain
- (3)
- Climate
- (4)
- Non-agriculturalization sensitivity
3.2.2. Indicators for Suitability
- (1)
- Calculation of soil condition indicators
- (2)
- Calculation of terrain condition indicators
- (3)
- Calculation of climatic condition indicators
- (4)
- Calculation of non-agriculturalization sensitivity indicator
- (5)
- Criterion scores for indicators
3.2.3. Weights of FSE Indicators
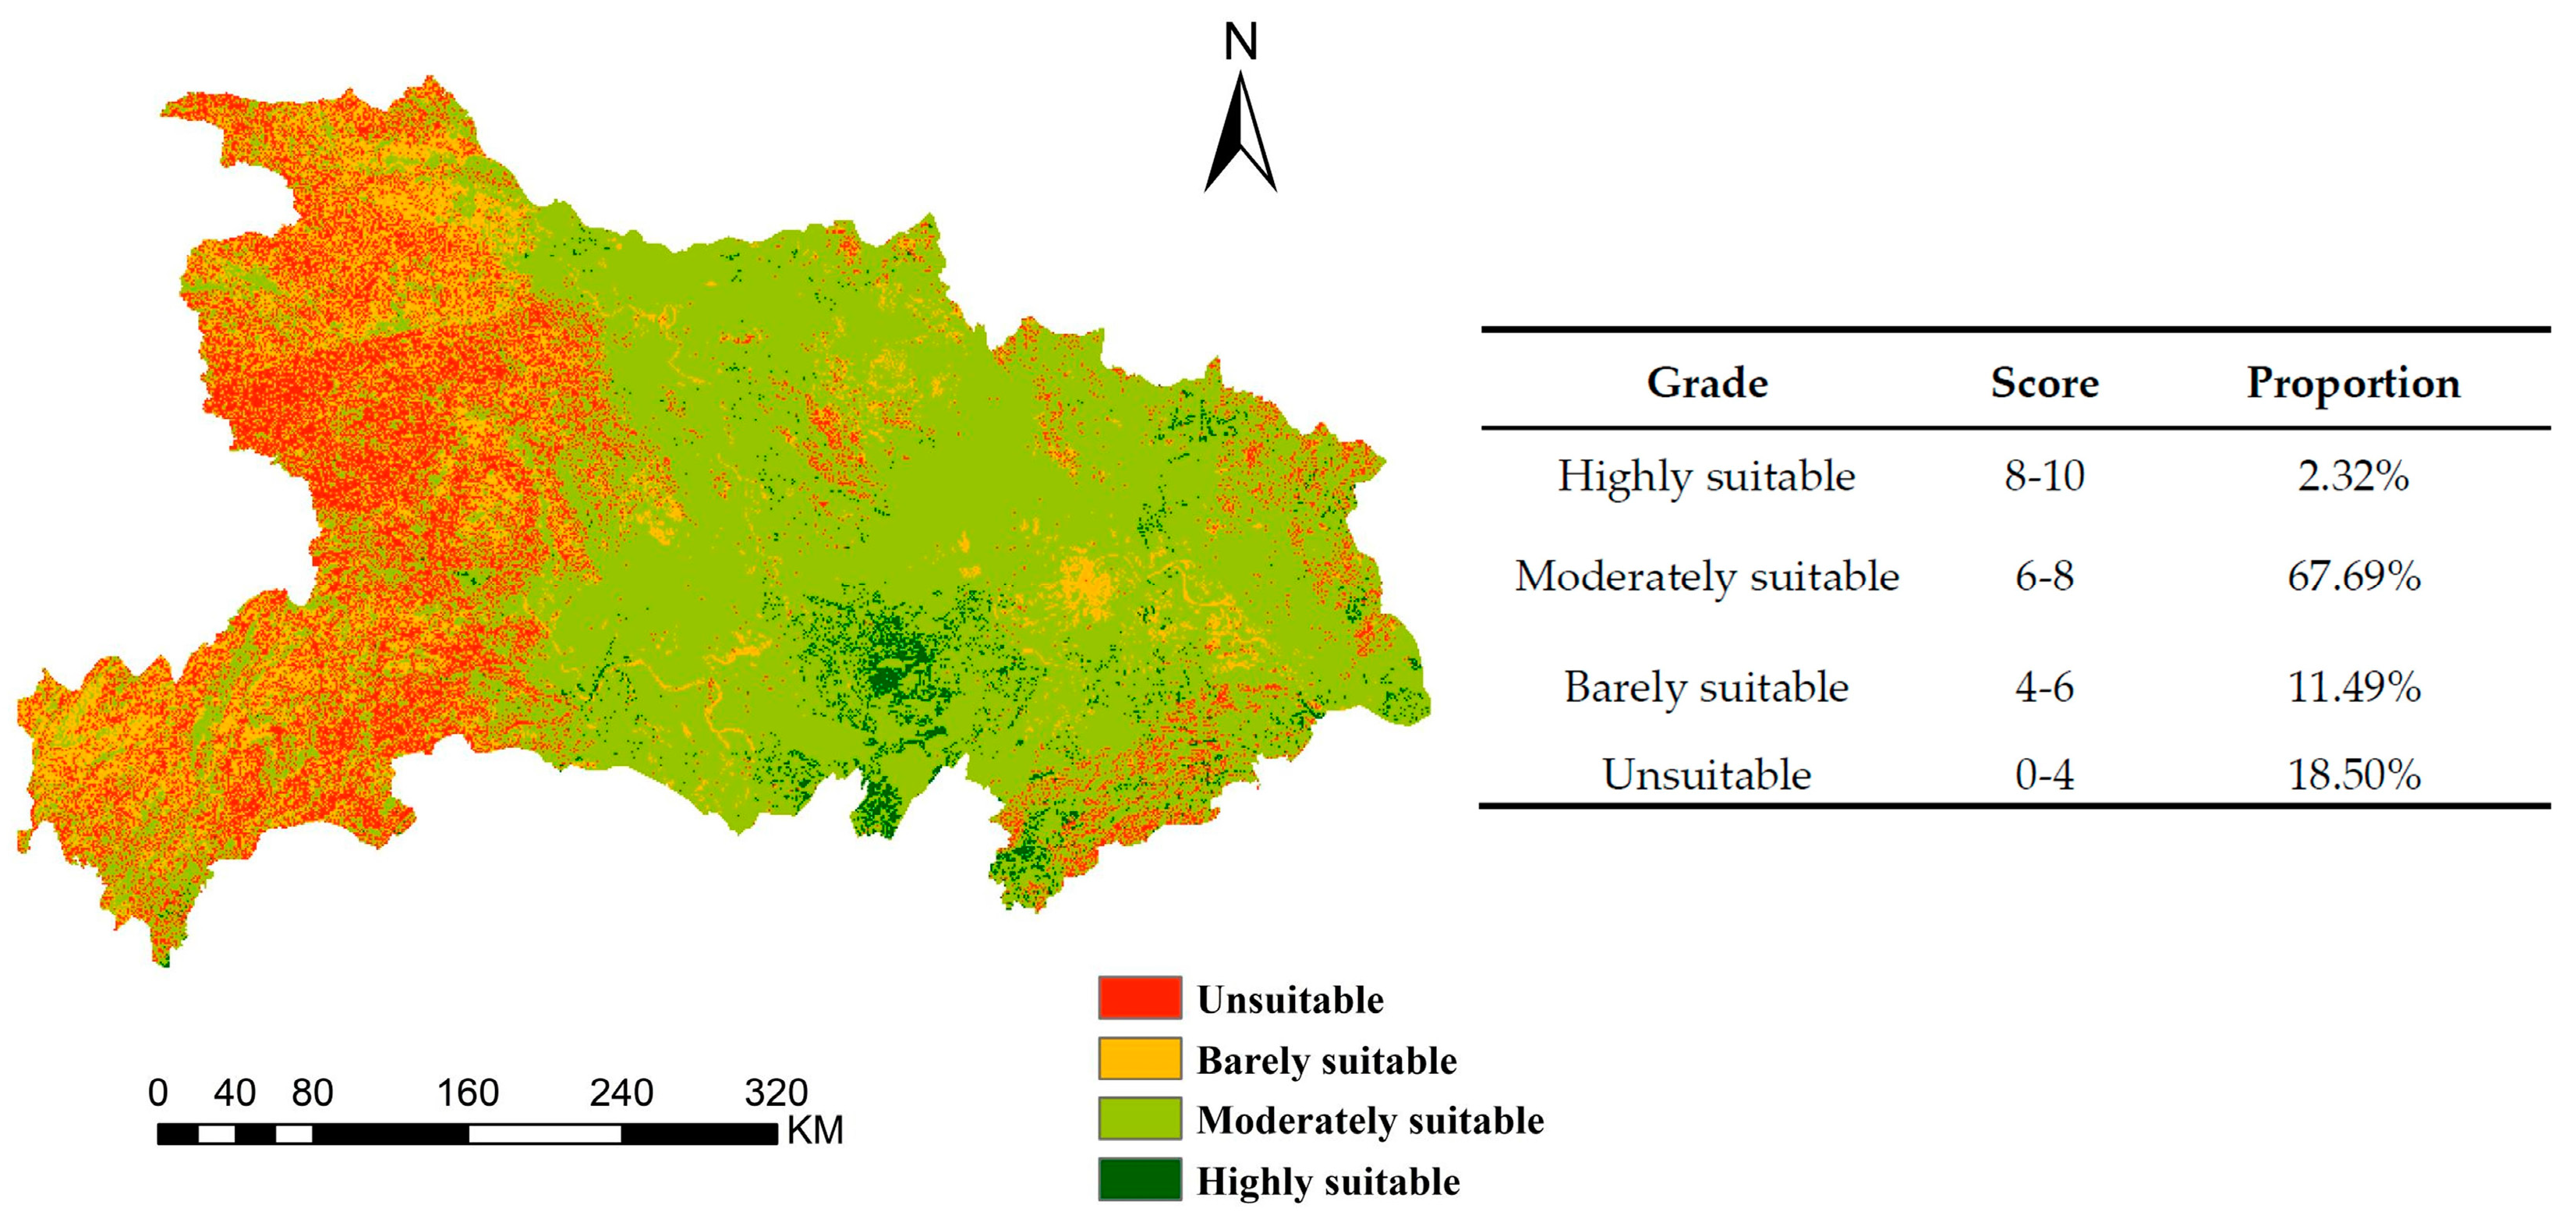
3.2.4. Classification of FSE
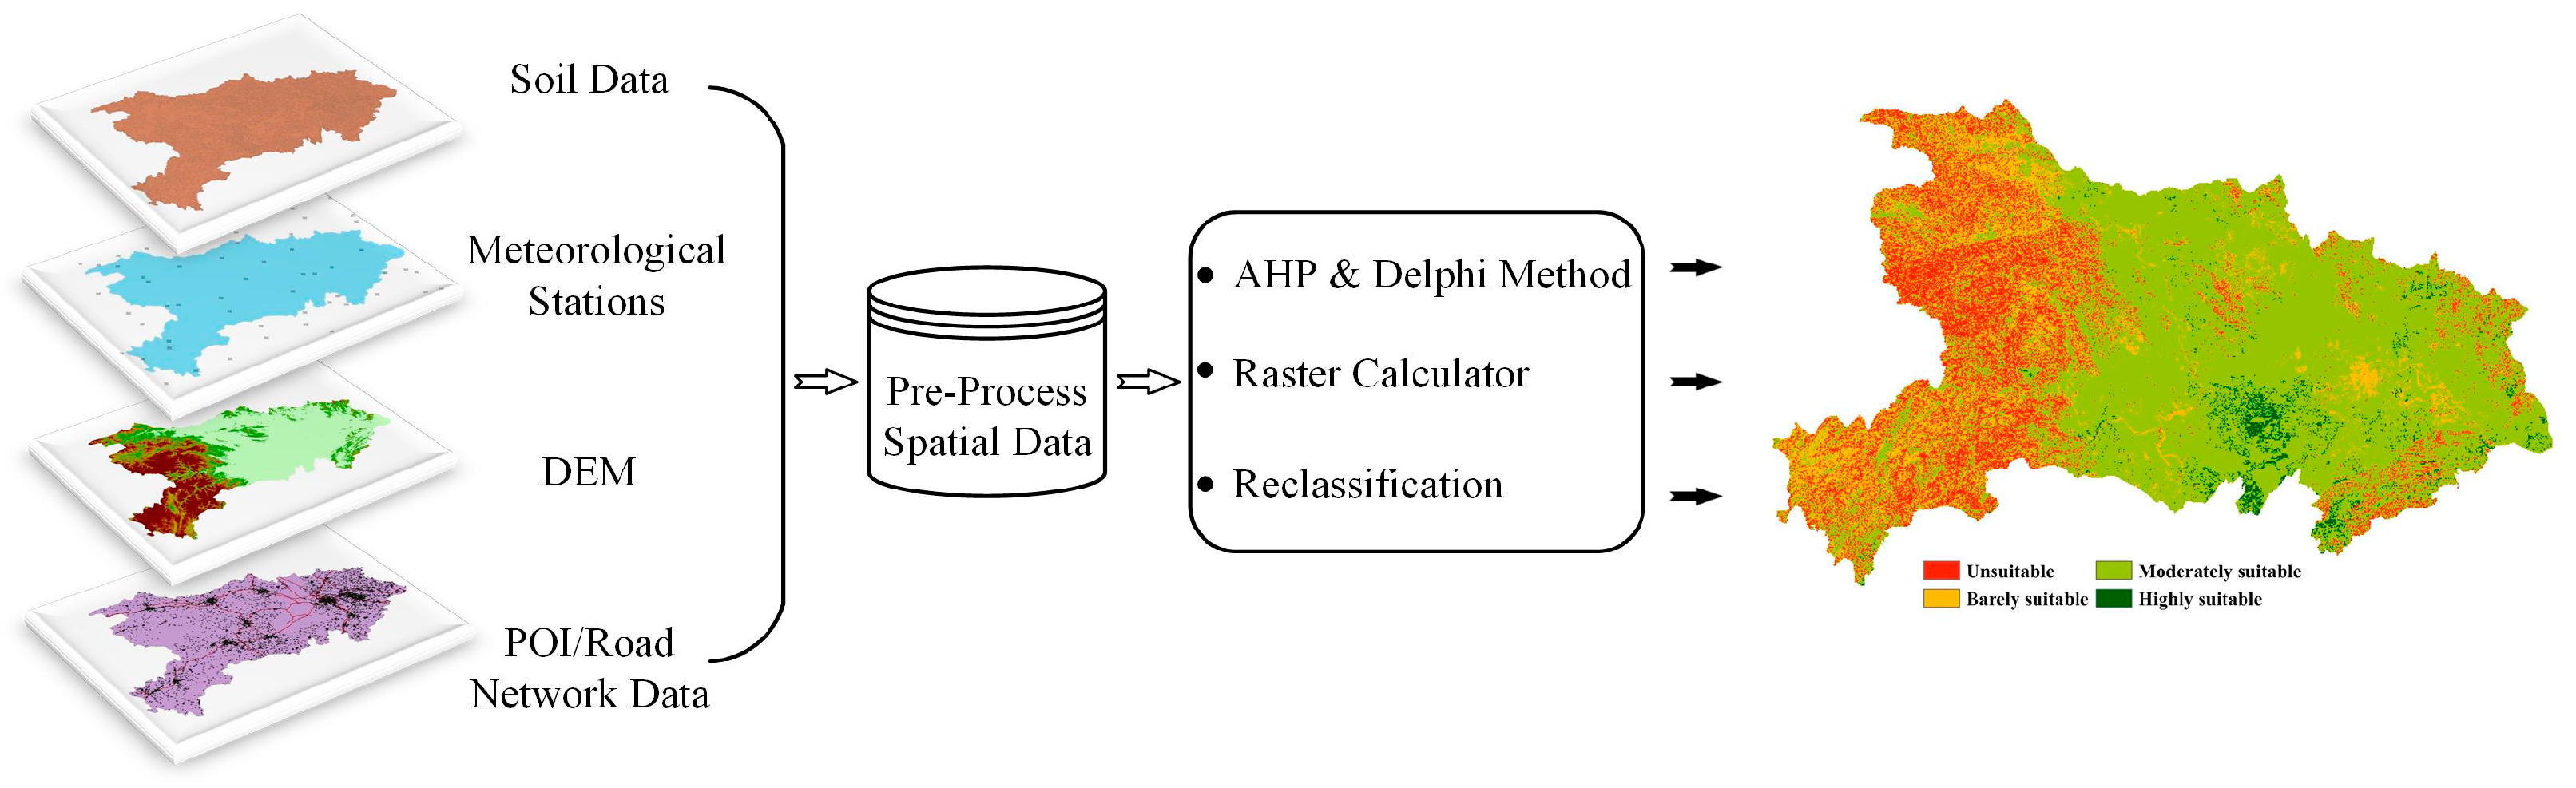
3.3. Data
4. Results
4.1. Single Factor Evaluation
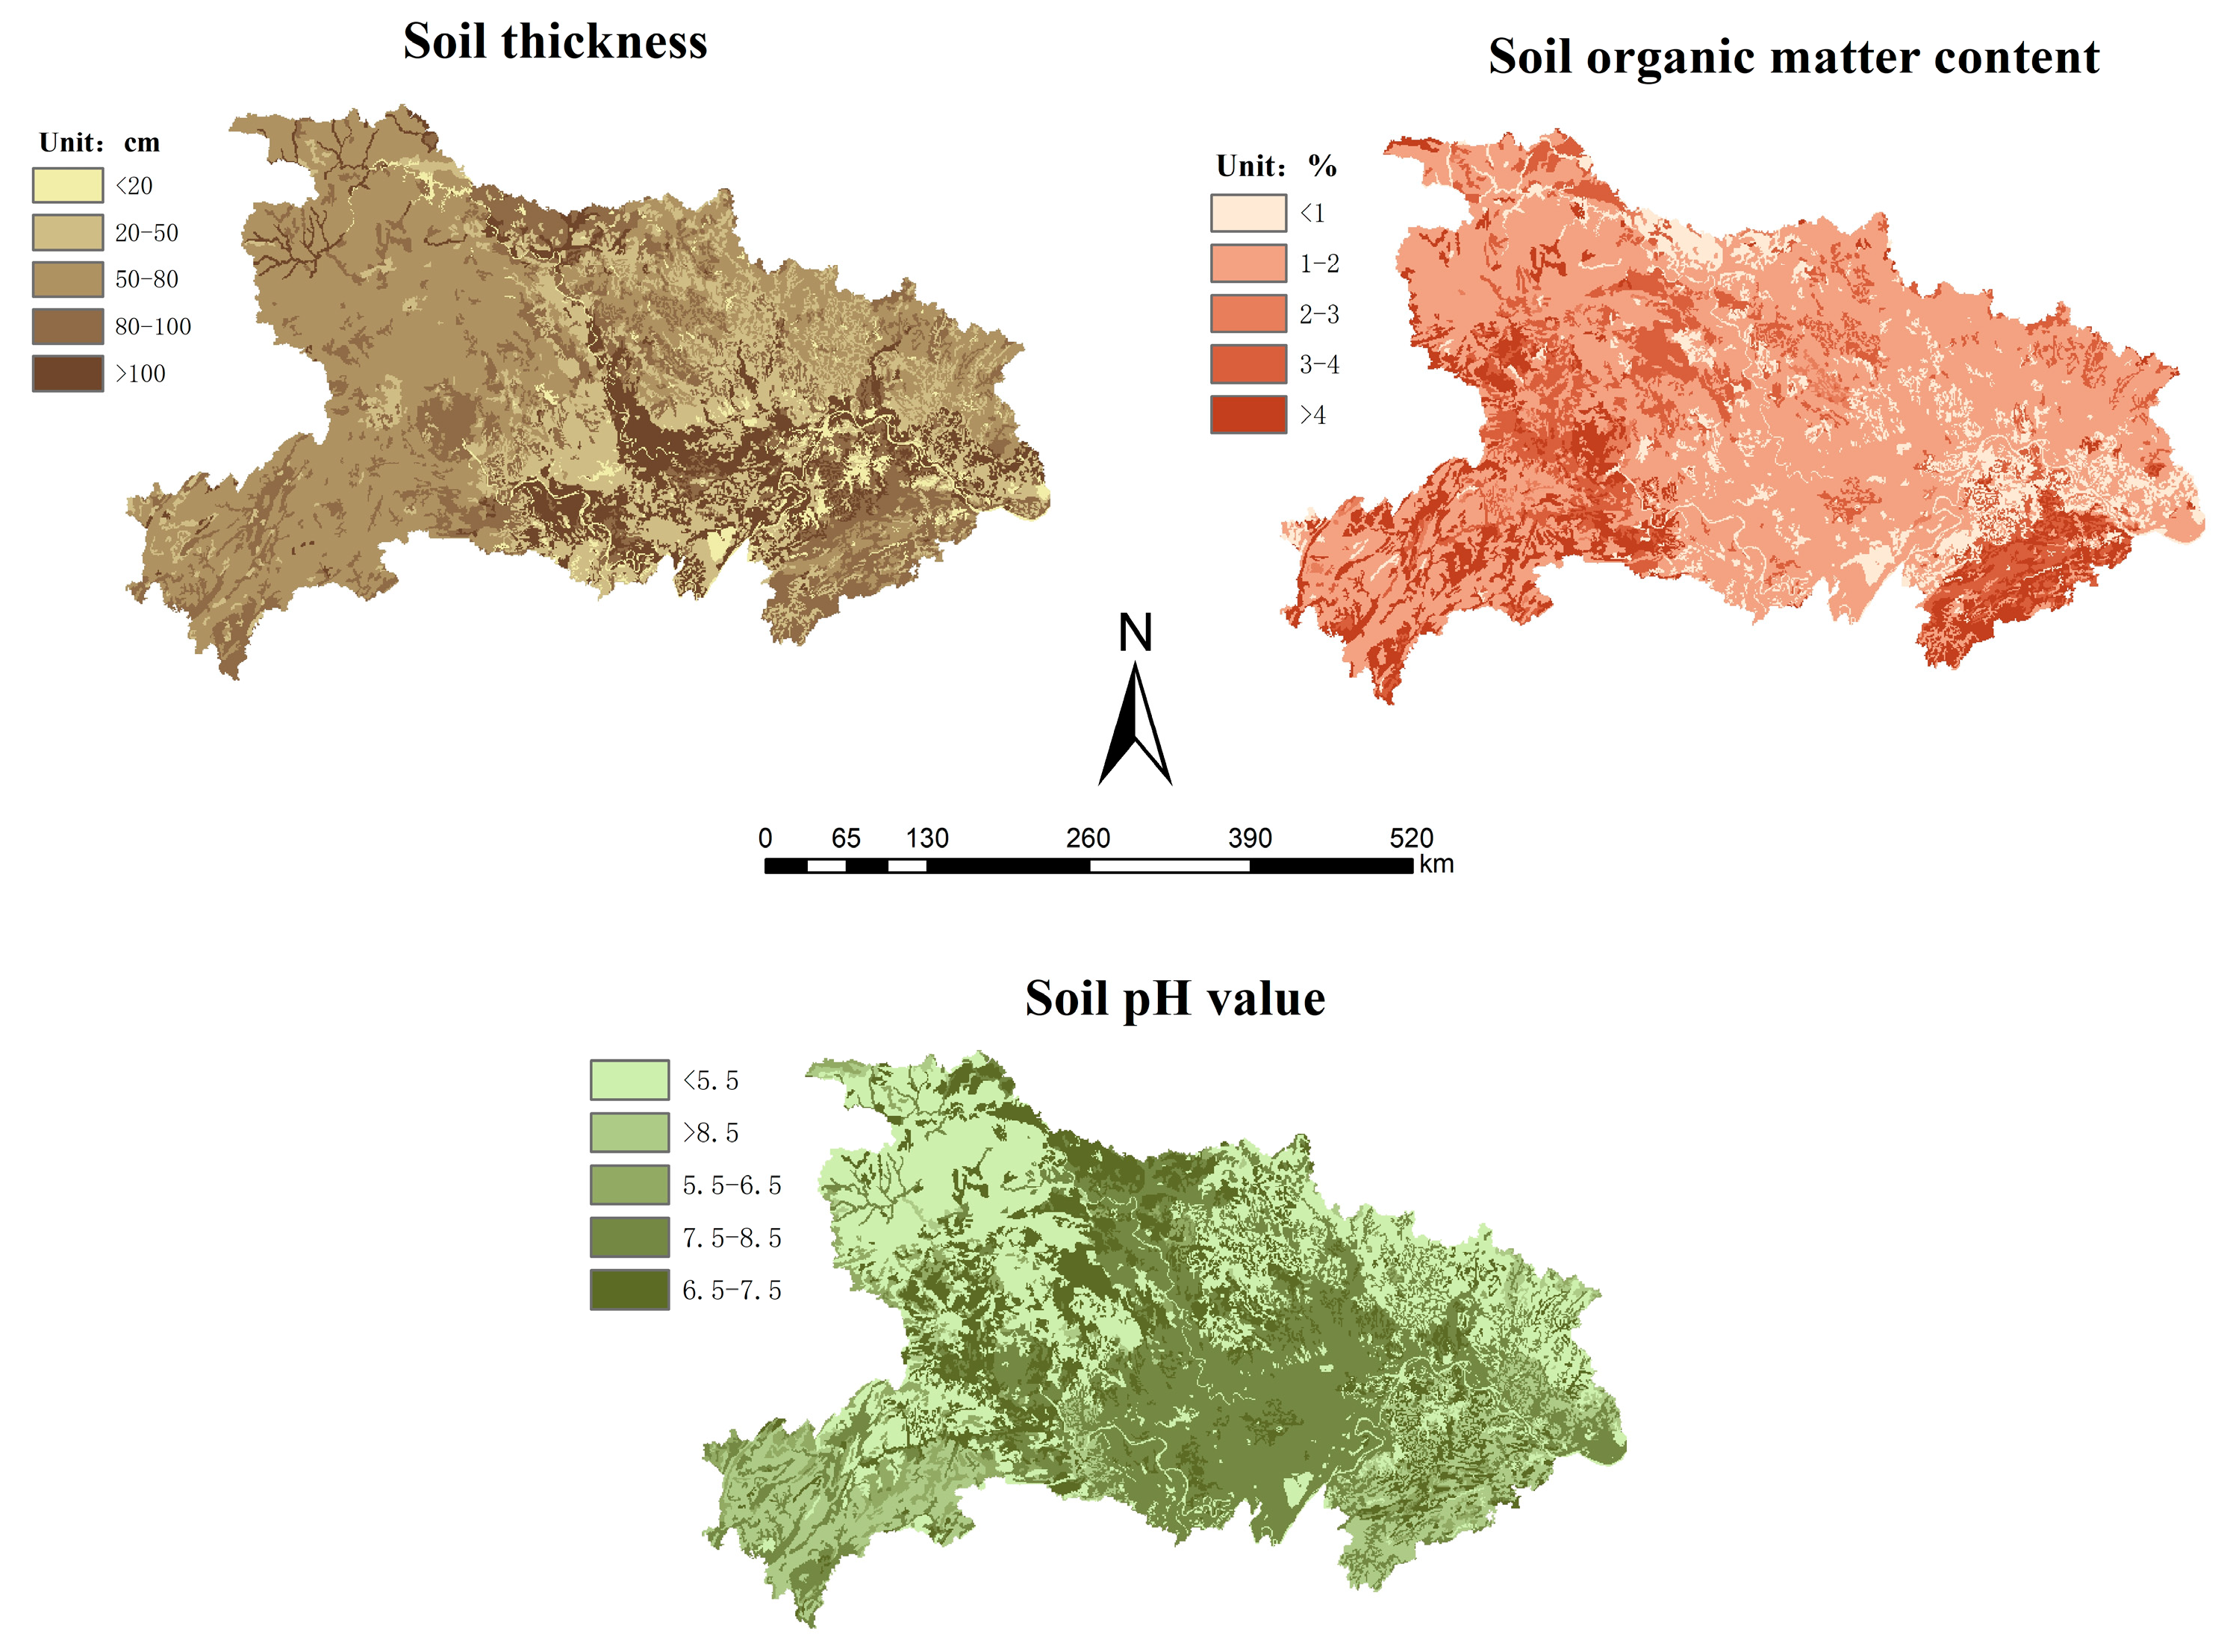
4.1.1. Soil Conditions
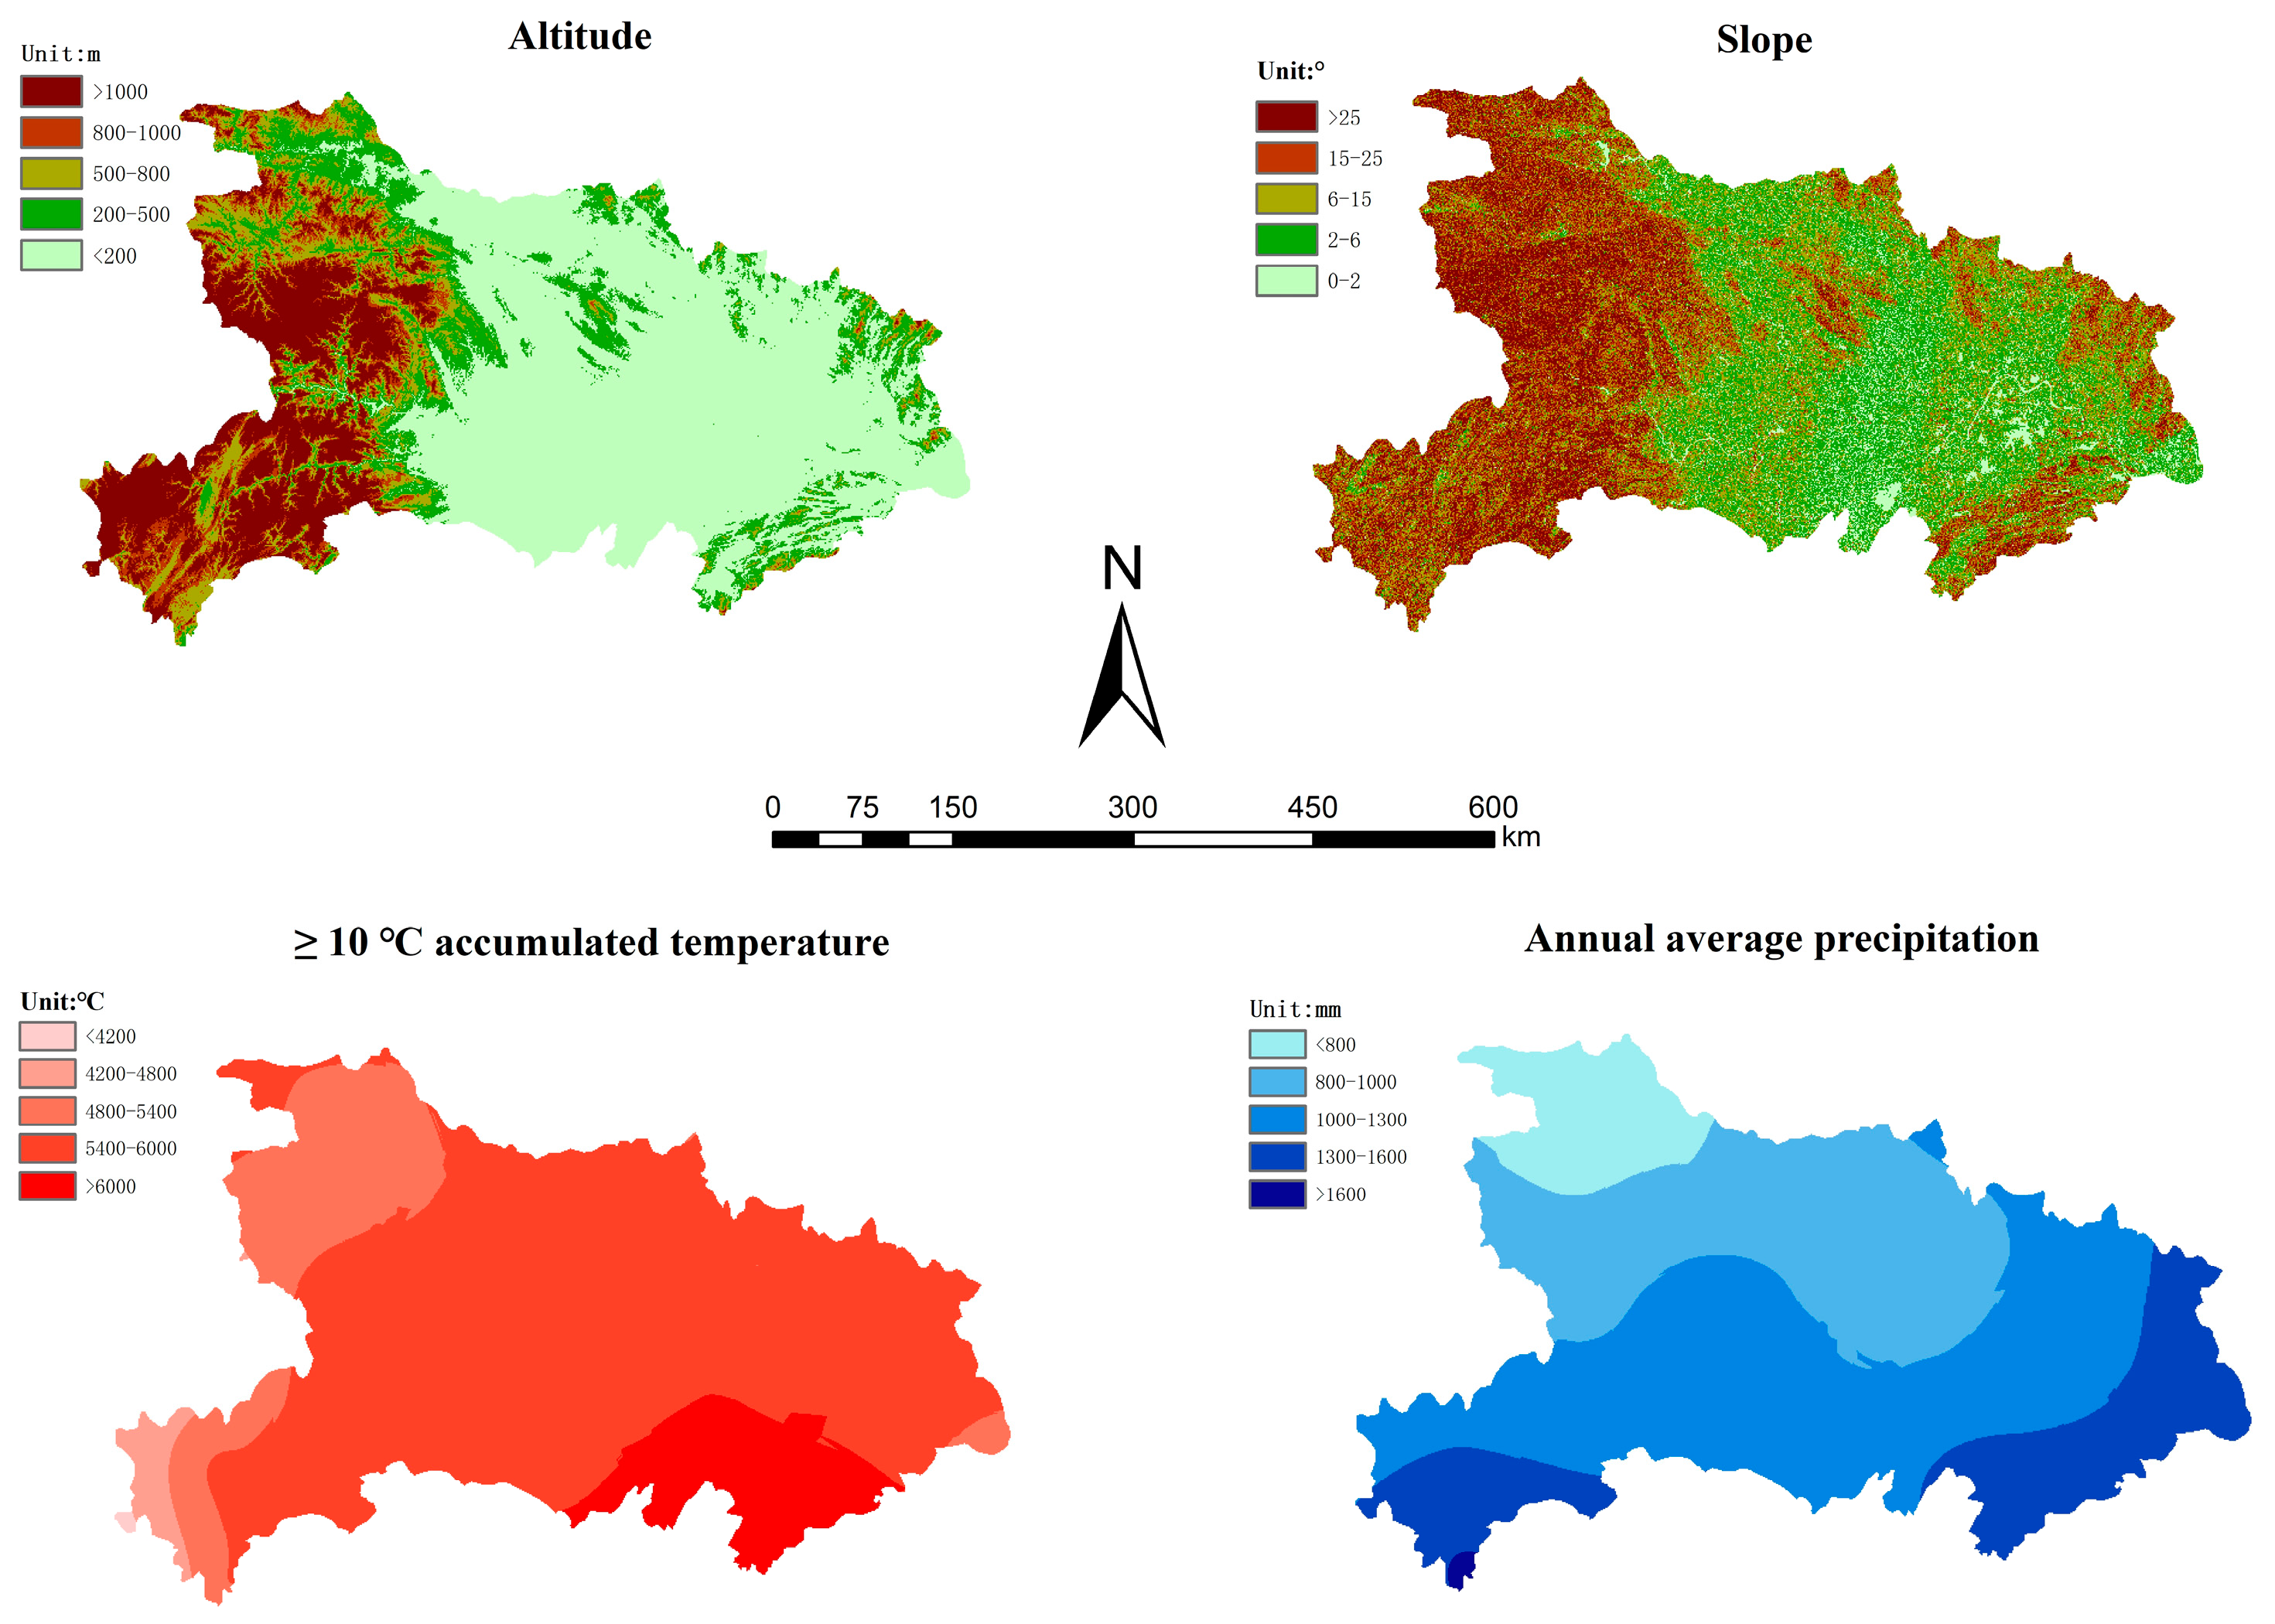
4.1.2. Terrain Conditions
4.1.3. Climatic Conditions
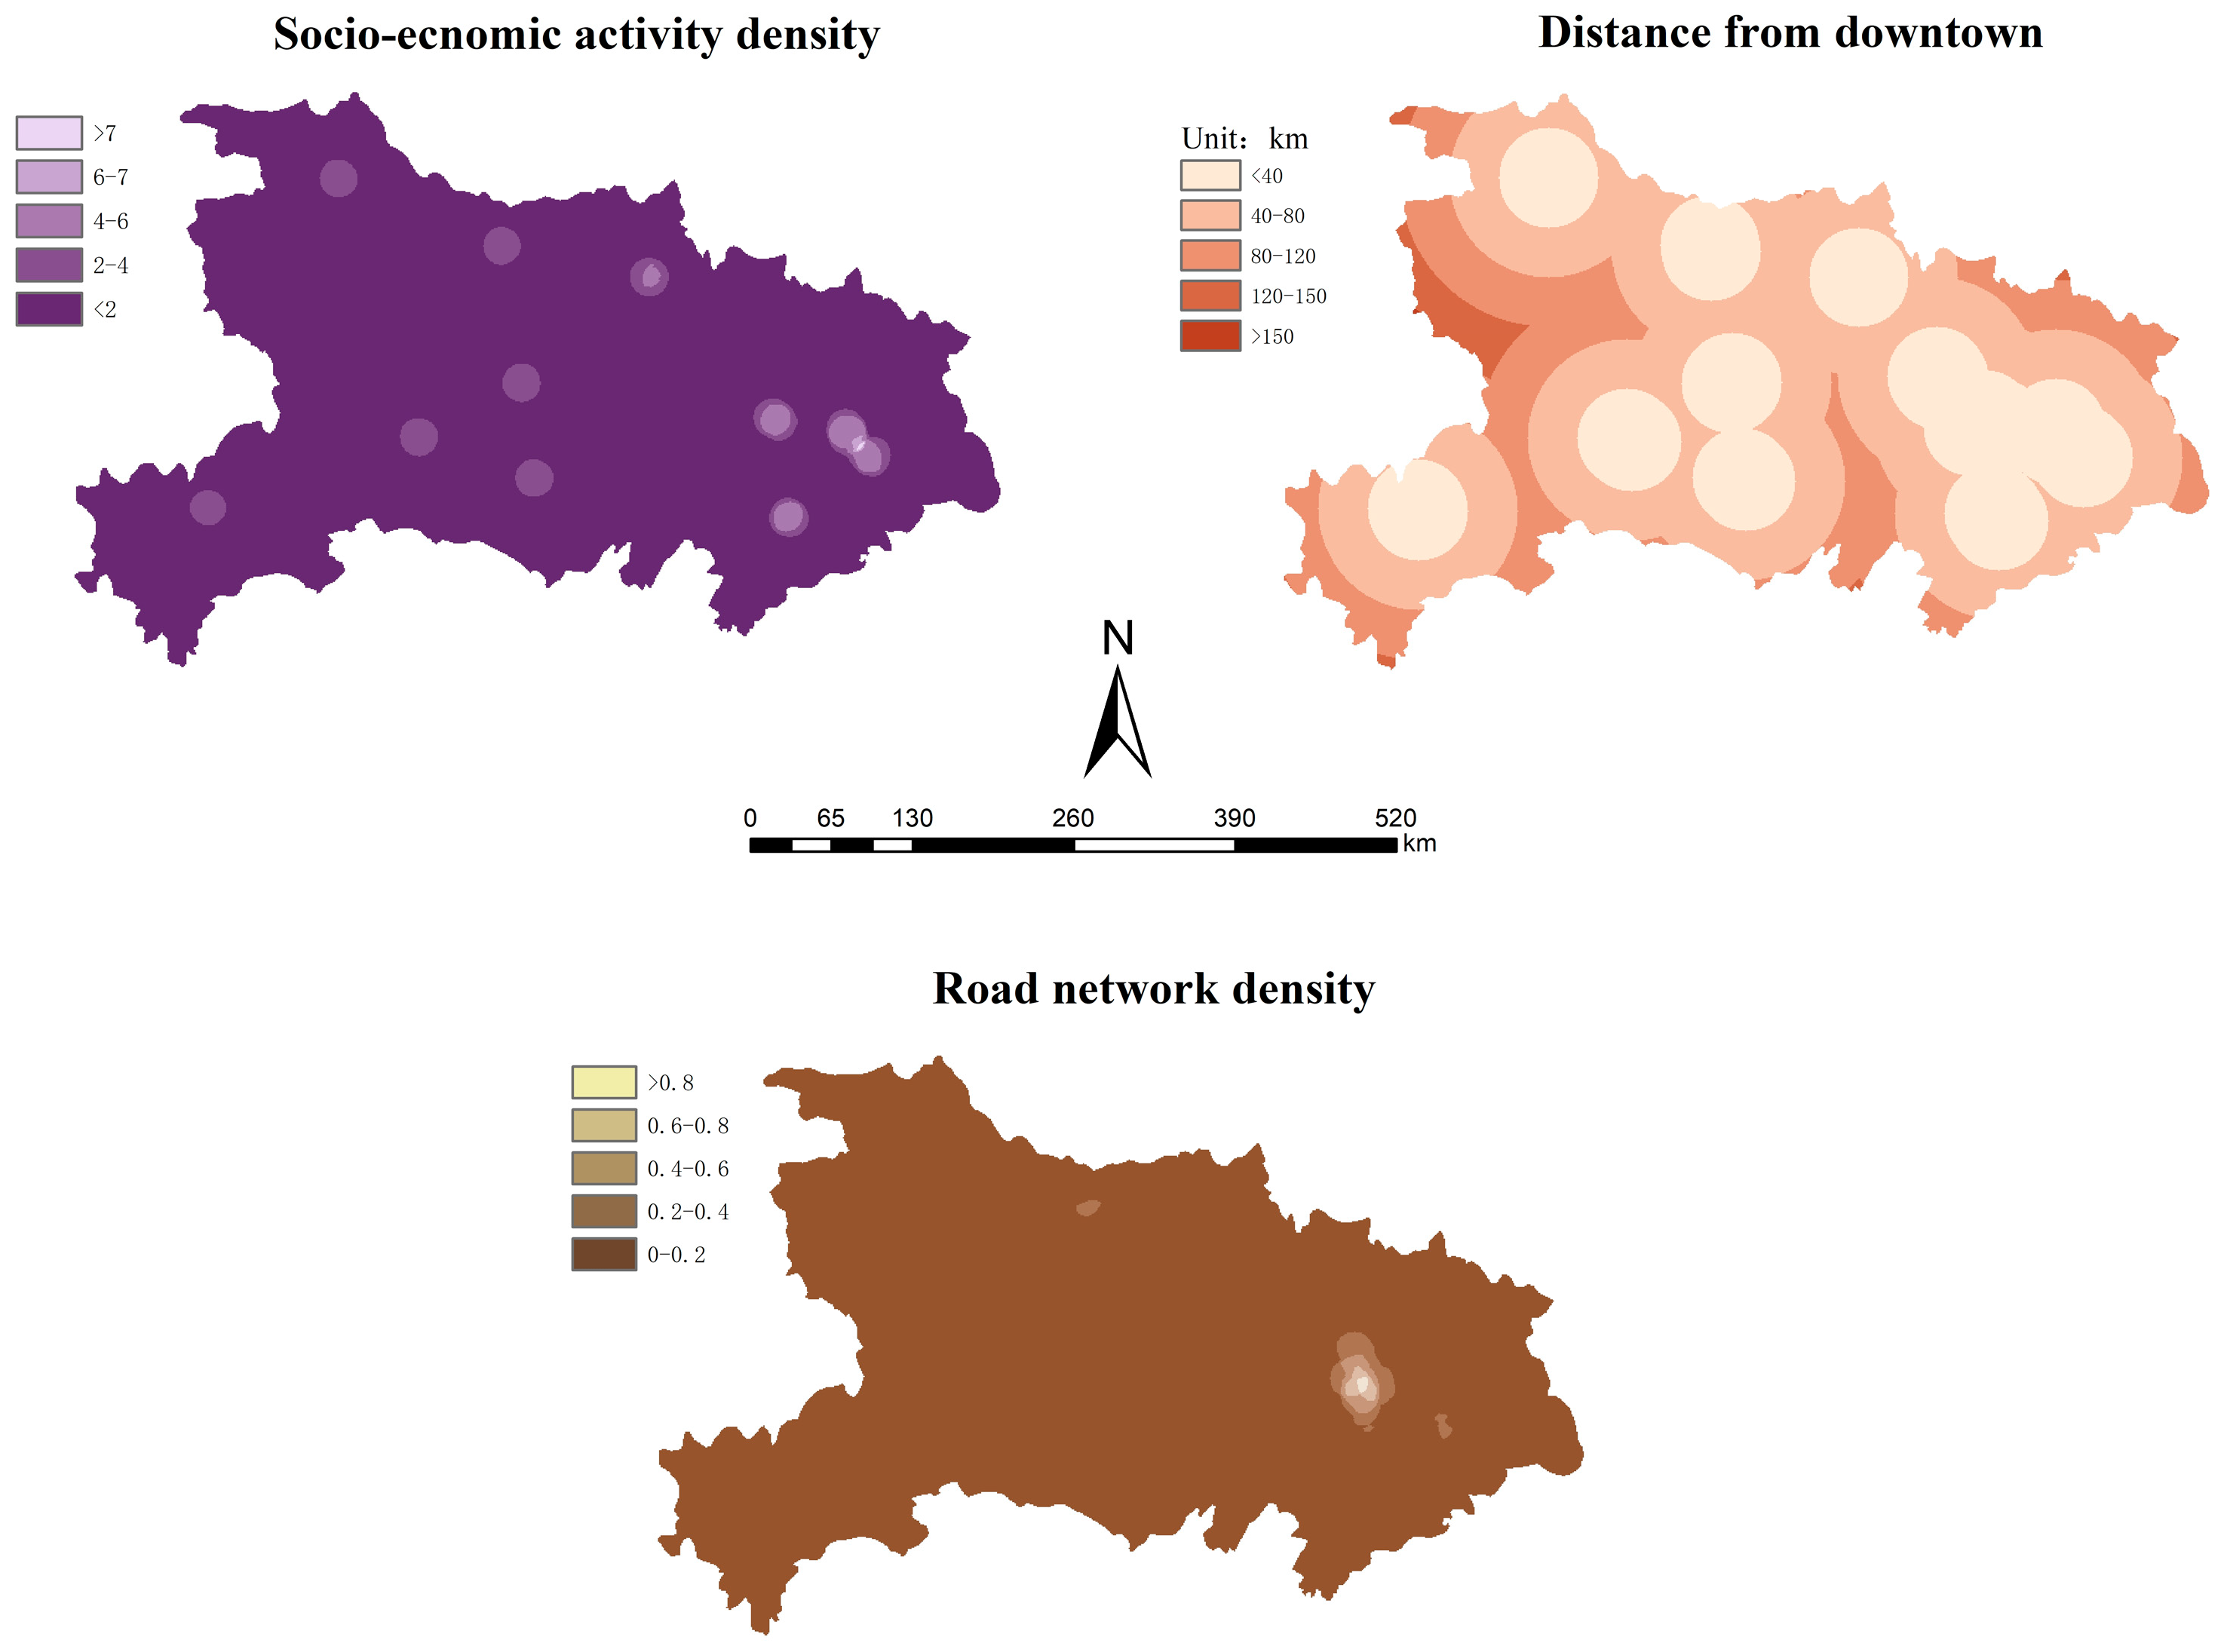
4.1.4. Non-Agriculturalization Sensitivity
4.2. Suitability Evaluation
5. Discussion
6. Conclusions
Author Contributions
Funding
Data Availability Statement
Conflicts of Interest
References
- Gao, H. On dynamic balance of total arable land. Rural Econ. 2001, 11, 16–17. (In Chinese) [Google Scholar]
- Qian, H.; Xue, Y.; Tian, Y. Review on evaluation of rational use of land resources. China Land Sci. 2001, 15, 14–19. (In Chinese) [Google Scholar] [CrossRef]
- Zhang, Y.; Tan, W. Review of land evaluation research in China and abroad. Chin. Public Adm. 2009, 9, 115–118. (In Chinese) [Google Scholar]
- Eskandari, M.; Homaee, M.; Mahmoodi, S.; Pazira, E.; Van Genuchten, M.T. Optimizing landfill site selection by using land classification maps. Environ. Sci. Pollut. Res. 2015, 22, 7754–7765. [Google Scholar] [CrossRef] [PubMed]
- Hamzeh, M.; Ali Abbaspour, R.; Davalou, R. Raster-based outranking method: A new approach for municipal solid waste landfill (MSW) siting. Environ. Sci. Pollut. Res. 2015, 22, 12511–12524. [Google Scholar] [CrossRef]
- Yu, Z.; Zhang, W.; Liang, J.; Zhuang, L. Progress in evaluating suitability of spatial development and construction land. Prog. Geogr. 2015, 34, 1107–1122. (In Chinese) [Google Scholar] [CrossRef]
- Huang, R.; Nie, Y.; Duo, L.; Zhang, X.; Wu, Z.; Xiong, J. Construction land suitability assessment in rapid urbanizing cities for promoting the implementation of united nations sustainable development goals: A case study of Nanchang, China. Environ. Sci. Pollut. Res. 2021, 28, 25650–25663. [Google Scholar] [CrossRef]
- Ustaoglu, E.; Aydınoglu, A.C. Suitability evaluation of urban construction land in Pendik District of Istanbul, Turkey. Land Use Policy 2020, 99, 104783. [Google Scholar] [CrossRef]
- Habibie, M.I.; Noguchi, R.; Shusuke, M.; Ahamed, T. Land suitability analysis for maize production in indonesia using satellite remote sensing and GIS-based multicriteria decision support system. Geojournal 2021, 86, 777–807. [Google Scholar] [CrossRef]
- Ustaoglu, E.; Sisman, S.; Aydınoglu, A.C. Determining agricultural suitable land in peri-urban geography using GIS and multi criteria decision analysis (MCDA) techniques. Ecol. Model. 2021, 455, 109610. [Google Scholar] [CrossRef]
- Suffling, R. An index of ecological sensitivity to disturbance based on ecosystem age and related to landscape diversity. J. Environ. Manag. 1980, 10, 253–262. [Google Scholar]
- Ouyang, Z.; Wang, X.; Miao, H. China ’s eco-environmental sensitivity and its spatial heterogeneity. Acta Ecol. Sin. 2000, 20, 10–13. (In Chinese) [Google Scholar]
- He, Y.; Yao, Y.; Chen, Y.; Ongaro, L. Regional land suitability assessment for tree crops using remote sensing and GIS. In Proceedings of the 2011 International Conference on Computer Distributed Control and Intelligent Environmental Monitoring, Changsha, China, 19–20 February 2011; pp. 354–363. [Google Scholar]
- Elsheikh, R.; Mohamed Shariff, A.R.B.; Amiri, F.; Ahmad, N.B.; Balasundram, S.K.; Soom, M.A.M. Agriculture land suitability evaluator (ALSE): A decision and planning support tool for tropical and subtropical crops. Comput. Electron. Agric. 2013, 93, 98–110. [Google Scholar] [CrossRef] [Green Version]
- Prakash, T.N. Land Suitability Analysis for Agricultural Crops: A Fuzzy Multicriteria Decision Making Approach; ITC: Enschede, The Nehterland, 2003. [Google Scholar]
- Makungwe, M.; Chabala, L.M.; Van Dijk, M.; Chishala, B.H.; Lark, R.M. Assessing land suitability for rainfed paddy rice production in Zambia. Geoderma Reg. 2021, 27, e00438. [Google Scholar] [CrossRef]
- Yao, M.; Shao, D.; Lv, C.; An, R.; Gu, W.; Zhou, C. Evaluation of arable land suitability based on the suitability function—A case study of the Qinghai-Tibet Plateau. Sci. Total Environ. 2021, 787, 147414. [Google Scholar] [CrossRef]
- AL-Taani, A.; Al-husban, Y.; Farhan, I. Land suitability evaluation for agricultural use using GIS and remote sensing techniques: The case study of Ma’an Governorate, Jordan. Egypt. J. Remote Sens. Space Sci. 2021, 24, 109–117. [Google Scholar] [CrossRef]
- Qian, F.; Lal, R.; Wang, Q. Land evaluation and site assessment for the basic farmland protection in Lingyuan County, Northeast China. J. Clean. Prod. 2021, 314, 128097. [Google Scholar] [CrossRef]
- Qin, X. Study on cultivated land suitability evaluation based on GIS technology and analytic hierarchy process. China Agric. Inform. 2018, 30, 53–62. (In Chinese) [Google Scholar] [CrossRef]
- Wang, S.; Liao, G.; Deng, Y.; Tu, J.; Xu, X.; He, G.; Li, L.; Dai, L. Evaluation of land ecological suitability in corn planting area supported by GIS. Chin. J. Agric. Resour. Reg. Plan. 2020, 41, 174–182. (In Chinese) [Google Scholar] [CrossRef]
- Nath, A.J.; Kumar, R.; Devi, N.B.; Rocky, P.; Giri, K.; Sahoo, U.K.; Bajpai, R.K.; Sahu, N.; Pandey, R. Agroforestry land suitability analysis in the eastern Indian Himalayan Region. Environ. Chall. 2021, 4, 100199. [Google Scholar] [CrossRef]
- Maddahi, Z.; Jalalian, A.; Kheirkhah Zarkesh, M.M.; Honarjo, N. Land suitability analysis for rice cultivation using a GIS-based fuzzy multi-criteria decision making approach: Central part of Amol District, Iran. Soil Water Res. 2017, 12, 29–38. [Google Scholar] [CrossRef] [Green Version]
- Nguyen, H.; Nguyen, T.; Hoang, N.; Bui, D.; Vu, H.; Van, T. The application of LSE software: A new approach for land suitability evaluation in agriculture. Comput. Electron. Agric. 2020, 173, 105440. [Google Scholar] [CrossRef]
- Maleki, F.; Kazemi, H.; Siahmarguee, A.; Kamkar, B. Development of a land use suitability model for saffron (Crocus sativus L.) cultivation by multi-criteria evaluation and spatial analysis. Ecol. Eng. 2017, 106, 140–153. [Google Scholar] [CrossRef]
- Sari, F.; Koyuncu, F. Multi criteria decision analysis to determine the suitability of agricultural crops for land consolidation areas. Int. J. Eng. Geosci. 2021, 6, 64–73. [Google Scholar] [CrossRef]
- Tadesse, M.; Negese, A. Land suitability evaluation for sorghum crop by using GIS and AHP techniques in Agamsa Sub-Watershed, Ethiopia. Cogent Food Agric. 2020, 6, 1743624. [Google Scholar] [CrossRef]
- Pilevar, A.R.; Matinfar, H.R.; Sohrabi, A.; Sarmadian, F. Integrated fuzzy, AHP and GIS techniques for land suitability assessment in semi-arid regions for wheat and maize farming. Ecol. Indic. 2020, 110, 105887. [Google Scholar] [CrossRef]
- Orhan, O. Land suitability determination for citrus cultivation using a GIS-based multi-criteria analysis in Mersin, Turkey. Comput. Electron. Agric. 2021, 190, 106433. [Google Scholar] [CrossRef]
- Morales, F.; de Vries, W. Establishment of land use suitability mapping criteria using Analytic Hierarchy Process (AHP) with practitioners and beneficiaries. Land 2021, 10, 235. [Google Scholar] [CrossRef]
- Ligmann-Zielinska, A.; Jankowski, P. Spatially-explicit integrated uncertainty and sensitivity analysis of criteria weights in multicriteria land suitability evaluation. Environ. Model. Softw. 2014, 57, 235–247. [Google Scholar] [CrossRef]
- Ostovari, Y.; Honarbakhsh, A.; Sangoony, H.; Zolfaghari, F.; Maleki, K.; Ingram, B. GIS and multi-criteria decision-making analysis assessment of land suitability for rapeseed farming in calcareous soils of semi-arid regions. Ecol. Indic. 2019, 103, 479–487. [Google Scholar] [CrossRef]
- Li, M.; Mu, F.; Lin, X.; Long, Q.; Cui, M. Spatial fuzzy comprehensive assessment of highway flood risk based on GIS. China Saf. Sci. J. 2018, 28, 149–155. (In Chinese) [Google Scholar] [CrossRef]
- Eskandari, S.; Miesel, J.R. Comparison of the fuzzy AHP method, the spatial correlation method, and the dong model to predict the fire high-risk areas in Hyrcanian Forests of Iran. Geomat. Nat. Hazards Risk 2017, 8, 933–949. [Google Scholar] [CrossRef] [Green Version]
- Shi, L.; Feng, Y.; Gao, L. The method of territorial spatial development suitability evaluation in the Yangtze River Delta: A case study of Changxing County. ACTA Ecol. Sin. 2020, 40, 6495–6504. (In Chinese) [Google Scholar] [CrossRef]
- Tercan, E.; Dereli, M.A. Development of a land suitability model for citrus cultivation using GIS and multi-criteria assessment techniques in Antalya Province of Turkey. Ecol. Indic. 2020, 117, 106549. [Google Scholar] [CrossRef]
- Lu, S.; Zhou, M.; Guan, X.; Tao, L. An integrated GIS-based interval-probabilistic programming model for land-use planning management under uncertainty—a case study at Suzhou, China. Environ. Sci. Pollut. Res. 2015, 22, 4281–4296. [Google Scholar] [CrossRef] [PubMed]
- Adugna Gurara, M. Evaluation of land suitability for irrigation development and sustainable land management using arcgis on Katar Watershed in Rift Valley Basin, Ethiopia. J. Water Resour. Ocean Sci. 2020, 9, 56. [Google Scholar] [CrossRef]
- Gholizadeh, A.; Bagherzadeh, A.; Keshavarzi, A. Model application in evaluating land suitability for oak and pine forest plantations in Northeast of Iran. Geol. Ecol. Landsc. 2019, 4, 236–250. [Google Scholar] [CrossRef] [Green Version]
- Chen, X.; Zhong, T.; Yu, H.; Chen, S.; Wang, A. Evaluation on the suitability for cultivated land reserve resources development in saline-alkali area of Yellow River Delta—A case of the Huanghe Island. J. Shandong Agric. Univ. Nat. Sci. Ed. 2020, 51, 1052–1057. (In Chinese) [Google Scholar] [CrossRef]
- Jiang, X. Suitability assessment of agricultural land in Yong’an City based on GIS. J. Anhui Agric. Sci. 2019, 47, 58–60. (In Chinese) [Google Scholar] [CrossRef]
- Li, Z.; Zhou, X.; Man, W.; Sun, F.; Huang, Y. Cultivated land suitability of Zhangzhou City based on GIS. Jiangsu Agric. Sci. 2018, 46, 281–285. (In Chinese) [Google Scholar] [CrossRef]
- Kong, H. Suitability evaluation of cultivated l and in land regulation based on GIS and comprehensive factor evaluation method. Rural Sci. Technol. 2020, 14, 117–118. (In Chinese) [Google Scholar]
- Kome, G.K.; Tabi, F.O.; Enang, R.K.; Silatsa, F.B.T. Land suitability evaluation for oil palm (Elaeis Guineensis Jacq.) in coastal plains of Southwest Cameroon. Open J. Soil Sci. 2020, 10, 257–273. [Google Scholar] [CrossRef]
- Qin, S.; Yang, J.; Liao, Z. Identification and evaluation of urban centre systems based on multi-source big data: Using Nanjing as an example. South Archit. 2020, 11–19. (In Chinese) [Google Scholar] [CrossRef]
- Wu, Q.; Qian, L.; Wu, Z. Research on spatial structure identification and spatial morphology of megalopolis based on multi-source data. Geomat. World 2020, 27, 32–38. (In Chinese) [Google Scholar]
- Chen, N.; Zhang, H.; Si, Z. Suitable evaluation of cultivated land renovation based on gis—A case study of Pingdingshan City. J. Henan Agric. Sci. 2015, 44, 78–82. (In Chinese) [Google Scholar] [CrossRef]
- Cui, X.; Liu, C.; Shan, L.; Lin, J.; Zhang, J.; Jiang, Y.; Zhang, G. Spatial-Temporal responses of ecosystem services to land use transformation driven by rapid urbanization: A case study of Hubei Province, China. Int. J. Environ. Res. Public. Health 2021, 19, 178. [Google Scholar] [CrossRef] [PubMed]


| Objective Level | Criteria Layer | Indicator Layer |
|---|---|---|
| Suitability evaluation of farmland | Soil conditions | Soil thickness Soil organic matter Soil pH value |
| Terrain conditions. | Elevation | |
| Slope | ||
| Climatic conditions | Annual average precipitation | |
| ≥10 °C accumulated temperature | ||
| Non-agriculturalization sensitivity | Socio-economic activity density Distance from the city center Road network density |
| Score | Soil Thickness (cm) | Soil Organic Matter Content (%) | Soil pH Value | Altitude (m) | Slope (°) | ≥10 °C Accumulated Temperature (°C) | Annual Average Precipitation (mm) | Socio-Economic Activity Density | Distance from Downtown (km) | Road Network Density (km/km2) |
|---|---|---|---|---|---|---|---|---|---|---|
| 10 | >100 | >4 | 6.5–7.5 | >6000 | >1600 | <2 | >150 | 0–0.2 | ||
| 9 | <200 | 0–2° | ||||||||
| 8 | 80–100 | 3–4 | 7.5–8.5 | 200–500 | 5400–6000 | 1300–1600 | 2–4 | 120–150 | 0.2–0.4 | |
| 7 | 2–6° | |||||||||
| 6 | 50–80 | 2–3 | 5.5–6.5 | 500–800 | 4800–5400 | 1000–1300 | 4–6 | 80–120 | 0.4–0.6 | |
| 5 | 6–15° | |||||||||
| 4 | 20–50 | 1–2 | >8.5 | 800–1000 | 4200–4800 | 800–1000 | 6–7 | 40–80 | 0.6–0.8 | |
| 3 | 15–25° | |||||||||
| 2 | <20 | 0.6–1 | <5.5 | >1000 | <4200 | <800 | >7 | 0–40 | >0.8 | |
| 1 | <0.6 | >25° |
| Criterion Layer | Soil Condition (0.2534) | Terrain Condition (0.2798) | Climatic Conditions (0.1039) | Non-Agrochemical Sensitivity (0.3629) | Comprehensive Weight |
|---|---|---|---|---|---|
| Soil thickness | 0.3919 | 0.0993 | |||
| Soil pH value | 0.2332 | 0.0591 | |||
| Soil organic matter content | 0.3749 | 0.095 | |||
| Altitude | 0.4031 | 0.1128 | |||
| Slope | 0.5969 | 0.167 | |||
| Annual precipitation | 0.4783 | 0.0497 | |||
| ≥10 °C accumulated temperature | 0.5217 | 0.0542 | |||
| Socio-economic activity density | 0.3894 | 0.1413 | |||
| Distance from downtown | 0.3306 | 0.12 | |||
| Road network density | 0.28 | 0.1016 |
Publisher’s Note: MDPI stays neutral with regard to jurisdictional claims in published maps and institutional affiliations. |
© 2022 by the authors. Licensee MDPI, Basel, Switzerland. This article is an open access article distributed under the terms and conditions of the Creative Commons Attribution (CC BY) license (https://creativecommons.org/licenses/by/4.0/).
Share and Cite
Cui, X.; Zhou, T.; Xiong, X.; Xiong, J.; Zhang, J.; Jiang, Y. Farmland Suitability Evaluation Oriented by Non-Agriculturalization Sensitivity: A Case Study of Hubei Province, China. Land 2022, 11, 488. https://doi.org/10.3390/land11040488
Cui X, Zhou T, Xiong X, Xiong J, Zhang J, Jiang Y. Farmland Suitability Evaluation Oriented by Non-Agriculturalization Sensitivity: A Case Study of Hubei Province, China. Land. 2022; 11(4):488. https://doi.org/10.3390/land11040488
Chicago/Turabian StyleCui, Xufeng, Tingting Zhou, Xinxing Xiong, Jiaqi Xiong, Jing Zhang, and Yuehua Jiang. 2022. "Farmland Suitability Evaluation Oriented by Non-Agriculturalization Sensitivity: A Case Study of Hubei Province, China" Land 11, no. 4: 488. https://doi.org/10.3390/land11040488