Article

Improving Outdoor Thermal Comfort in a Steppe Climate: Effect of Water and Trees in an Urban Park

1
Department of Landscape Architecture and Urban Planning, Texas A&M University, College Station, TX 77843, USA
2
Dipartimento di Scienze e Tecnologie Biologiche ed Ambientali, University of Salento, S.P. 6 Lecce-Monteroni, 73100 Lecce, Italy
*
Author to whom correspondence should be addressed.
Land 2022, 11(3), 431; https://doi.org/10.3390/land11030431
Submission received: 21 February 2022 / Revised: 8 March 2022 / Accepted: 15 March 2022 / Published: 16 March 2022
(This article belongs to the Special Issue Feature Papers for Land Planning and Architecture Section)

Abstract

:
Excess heat in urban environments is an increasing threat to human health and well-being. Furthermore, the increasingly important phenomenon of the Urban Heat Island (UHI) is exacerbating problems of livability in urban centers. Hence, there should be an increasing effort to assess the impact of heat mitigation strategies (HMSs) on outdoor thermal comfort in cities. This research has investigated how urban areas in steppe climate zones can be more thermally comfortable due to the effects of water bodies and trees, and how this might help to mitigate heat waves. Numerical simulations using the ENVI-met microclimate model have been performed for an urban park in Tabriz, Iran. In-situ measurements of air temperature (Ta) and mean radiant temperature (MRT) have been carried out in the study site and the collected data was used to validate the model (RMSE value 0.98 °C for Ta and 5.85 °C for MRT). Results show that water body evaporation without trees may decrease the air temperature, but on the other hand also increases the humidity, which reduces the positive impact on thermal comfort. However, the combination of water body with trees represents a better performance in the regulation of urban microclimate and thermal comfort.

1. Introduction

Population growth and global climate change are two critical challenges that mankind is facing today. Around 55% of the global population is living in cities and urban areas. According to projections by the Population Reference Bureau (PRB) [1], 66% of the world population will live in cities (over 85% in developed countries) by 2050. Projected warming from climate change is a significant challenge for the urban environment which is superimposed on the local phenomenon known as the urban heat island (UHI). The effect of UHI and urbanization is causing uncomfortable hot summer environments, especially for the elderly and the sick [2]. Therefore, more consideration should be paid to contributions of landscape characteristics and local climate to the cooling effect [3]. Climatologists and designers have provided recommendations and urban design strategies for urban heat island mitigation [4]. Urban tree planting and the appropriate use of high-albedo surfaces have been suggested as strategies to control urban climate changes and to create better human thermal comfort. Numerous studies focusing on ways for improving urban microclimate and human thermal comfort by planting trees, adding water bodies, using cool surfaces and changing the urban form [5] have been conducted. A series of research studies has been conducted on the outdoor thermal comfort in tropical climates such as Dhaka, Bangladesh [6], Hong Kong [7,8,9], Selangor, Malaysia [10], Colombo, Sri Lanka [11], Hangzhou, China [12] and Singapore [13,14]. However, Bartesaghi Koc et al. showed that little is known about the thermal benefits of green infrastructures in tropical and desert climates, developing countries, and southern-hemisphere regions which are experiencing significant urbanization and population growth, and are severely affected by heatwaves [15]. This study will investigate the effectiveness of three heat mitigation strategies in the desert climate of Tabriz in the developing county of Iran, which is in the steppe climate zone: trees; pavement; and water.

1.1. The Effect of Trees

Several studies have been conducted on the effect of trees as a cooling strategy on urban microclimate and regulating human thermal comfort. For example, Yan et al. [16] reported that adding trees reduced air temperatures, and areas with greater than 55% vegetation coverage created a relatively stable thermal comfort condition for the users in a subtropical climate. Bowler et al. [17], in their research on urban greenery, concluded that trees and parks act to cool the environment on average by 1 °C compared to a non-green area. Aboelata and Sodoudi [18] evaluated the effect of trees on UHI mitigation and their findings reported that a 50% tree cover scenario reduced air temperature (0.5 K) and enhanced thermal performance (PET). In addition, Aboelata [19] analyzed the effect of vegetation in different street orientations with aspect ratios to mitigate UHI. Their findings reported that trees are not effective at air temperature reduction in streets with an aspect ratio (H/W) 1:1 in all orientations.
There is a high correlation between solar radiation with thermal sensation [20] and it is the most important factor influencing thermal comfort indices (e.g., physiologically equivalent temperature, PET) in the urban environment [21]. Shading from live trees is a very useful strategy for lowering solar radiation received at the surface [22]. Adding trees can reduce the mean radiant temperature (MRT) significantly, which improves human thermal comfort. In one study trees were found to decrease PET value from 34.9 °C (hot thermal sensation) to 26.2 °C (slightly warm) on hot summer days [23]. Aminipouri et al. [24] evaluated the advantages of adding trees to a street in six different climate zones during summertime and their results showed that the potential to offset MRT increased under the best scenario. Hami et al. [25] reported that the cooling potential of trees depends on their specifications including leaf area index, tree height, trunk height, crown height and crown width. But not all species of vegetation are equally effective in ameliorating temperatures in urban areas [26]. On the other hand, results of a study on the radiative performance of ten planted tree species in the UK illustrated that tree species selection in the reduction of urban heat depends on the leaf size, solar altitude, and a combination of tree crown morphologies. In addition, infrared transflection towards buildings and pedestrians is considerable [27]. Based on [28], different land use/land cover types play different roles in different seasons and times. In addition, the shape and size of trees can modify the effect in different climate regions [29]. The evaluation of different commonly found arboreal species and their characteristics should be taken into account by professionals of the urban built environment. This would improve outdoor thermal comfort, reducing the effect of heat islands and ensuring a better quality of life for people in the urban environment [29,30,31]. A few results of the research also have shown the effect of urban greening and trees on urban microclimate and thermal comfort in winter [25,32,33,34]. According to literature studies, the effect of urban vegetation on thermal comfort in summer appears more important than in winter.

1.2. The Effect of Urban Pavement

In a series of research studies that have been conducted on the performance of urban pavements, the impact of reflective surface on urban microclimate and human thermal comfort in urban areas have been investigated. For example, the wide use of materials with high solar reflectance can contribute to the mitigation of the heat island effect and the improvement of urban environmental quality [35]. In other words, pavement materials with high albedo have a positive effect on urban microclimate [36]. In this regard, Akbari et al. [37] showed that cool surfaces as a result of high reflectivity of solar radiation are a useful strategy for mitigating the heat island effect. In similar research, Taleghani et al. [38] reported that with increasing urban albedo, MRT and PET increase. In contrast, the water surface decreased PET value. Most of the studies investigated the relative effectiveness of different pavement materials in urban areas. However, the thermal comfort of a person is dependent on the overall energy budget, and a small reduction in air temperature might not offset the increased amount of reflected radiation from highly reflective pavements.

1.3. The Effect of Water

In parks design, water bodies are often used to provide operational, aesthetic and microclimate benefits. Urban water bodies are one of the most important components in urban greenery which may positively impact on urban microclimate, particularly in dry climates. Water is commonly designed in different forms such as ponds, rivers, lakes, and fountains. Relatively few studies have investigated the effects of the water body on microclimate and human thermal comfort in urban areas. Xu et al. [39] evaluated the effect of urban water bodies during hot days (air temperatures above 35 °C). Their results showed that increasing waterbody area decreases heat index, providing a significant improvement in human comfort in littoral areas on hot summer days. In another study, the water body had an adverse effect on thermal comfort when the water was warmer than the air temperature at night. In those cases, the water body eventually limits the cooling and thermal comfort in the surrounding city [40]. Steeneveld et al. [41] concluded that water bodies increase rather than decrease the 95 percentile of the daily maximum UHI based on weather observations. Some studies have investigated the effect of moving water, including spray fountains and waterfalls, on human thermal comfort in urban areas [42,43,44,45].

1.4. Outdoor Thermal Comfort

Many indices have been developed to estimate outdoor thermal comfort. Predicted Mean Vote (PMV) [46] is mainly considered for indoor environments while Standard Effective Temperature (SET) [47], Physiologically Equivalent Temperature (PET) [48] and Universal Thermal Climate Index (UTCI) have been typically applied outdoor. The mean radiant temperature (MRT) is the most effective factor for outdoor thermal comfort in all indexes, particularly during hot, sunny days.
In this study, physiologically equivalent temperature (PET) was used because: (i) it is a universal index and combines weather and thermo-physiological parameters (clothing and metabolic activity); (ii) it reports the result in degrees Celsius (°C) which makes results more understandable; (iii) it has an acceptable function in both hot and colder climates; and (iv) it has a thermophysiological background and so it gives the real effect of the sensation of climate on humans. Climatic characteristics, including air temperature (Ta), relative humidity (RH), wind speed (WS), mean radiant temperature (MRT) are all used to predict PET. The thermal comfort stresses are defined over 10 scales ranging from extreme heat stress to extreme cold stress. The thermal comfort zone is believed to be between 18 °C and 23 °C for PET (Table 1) [49].
The goal of this study was to investigate the effectiveness of heat mitigation strategies in a steppe climate zone. The objectives were to: (i) conduct a case study in an urban park (El Golu Park, Tabriz) in a steppe climate; (ii) investigate the effect of trees, pavement types, and water on the microclimate and human thermal comfort on the hottest day of the year through the use of ENVI-met modelling and field validation.

2. Material and Methods
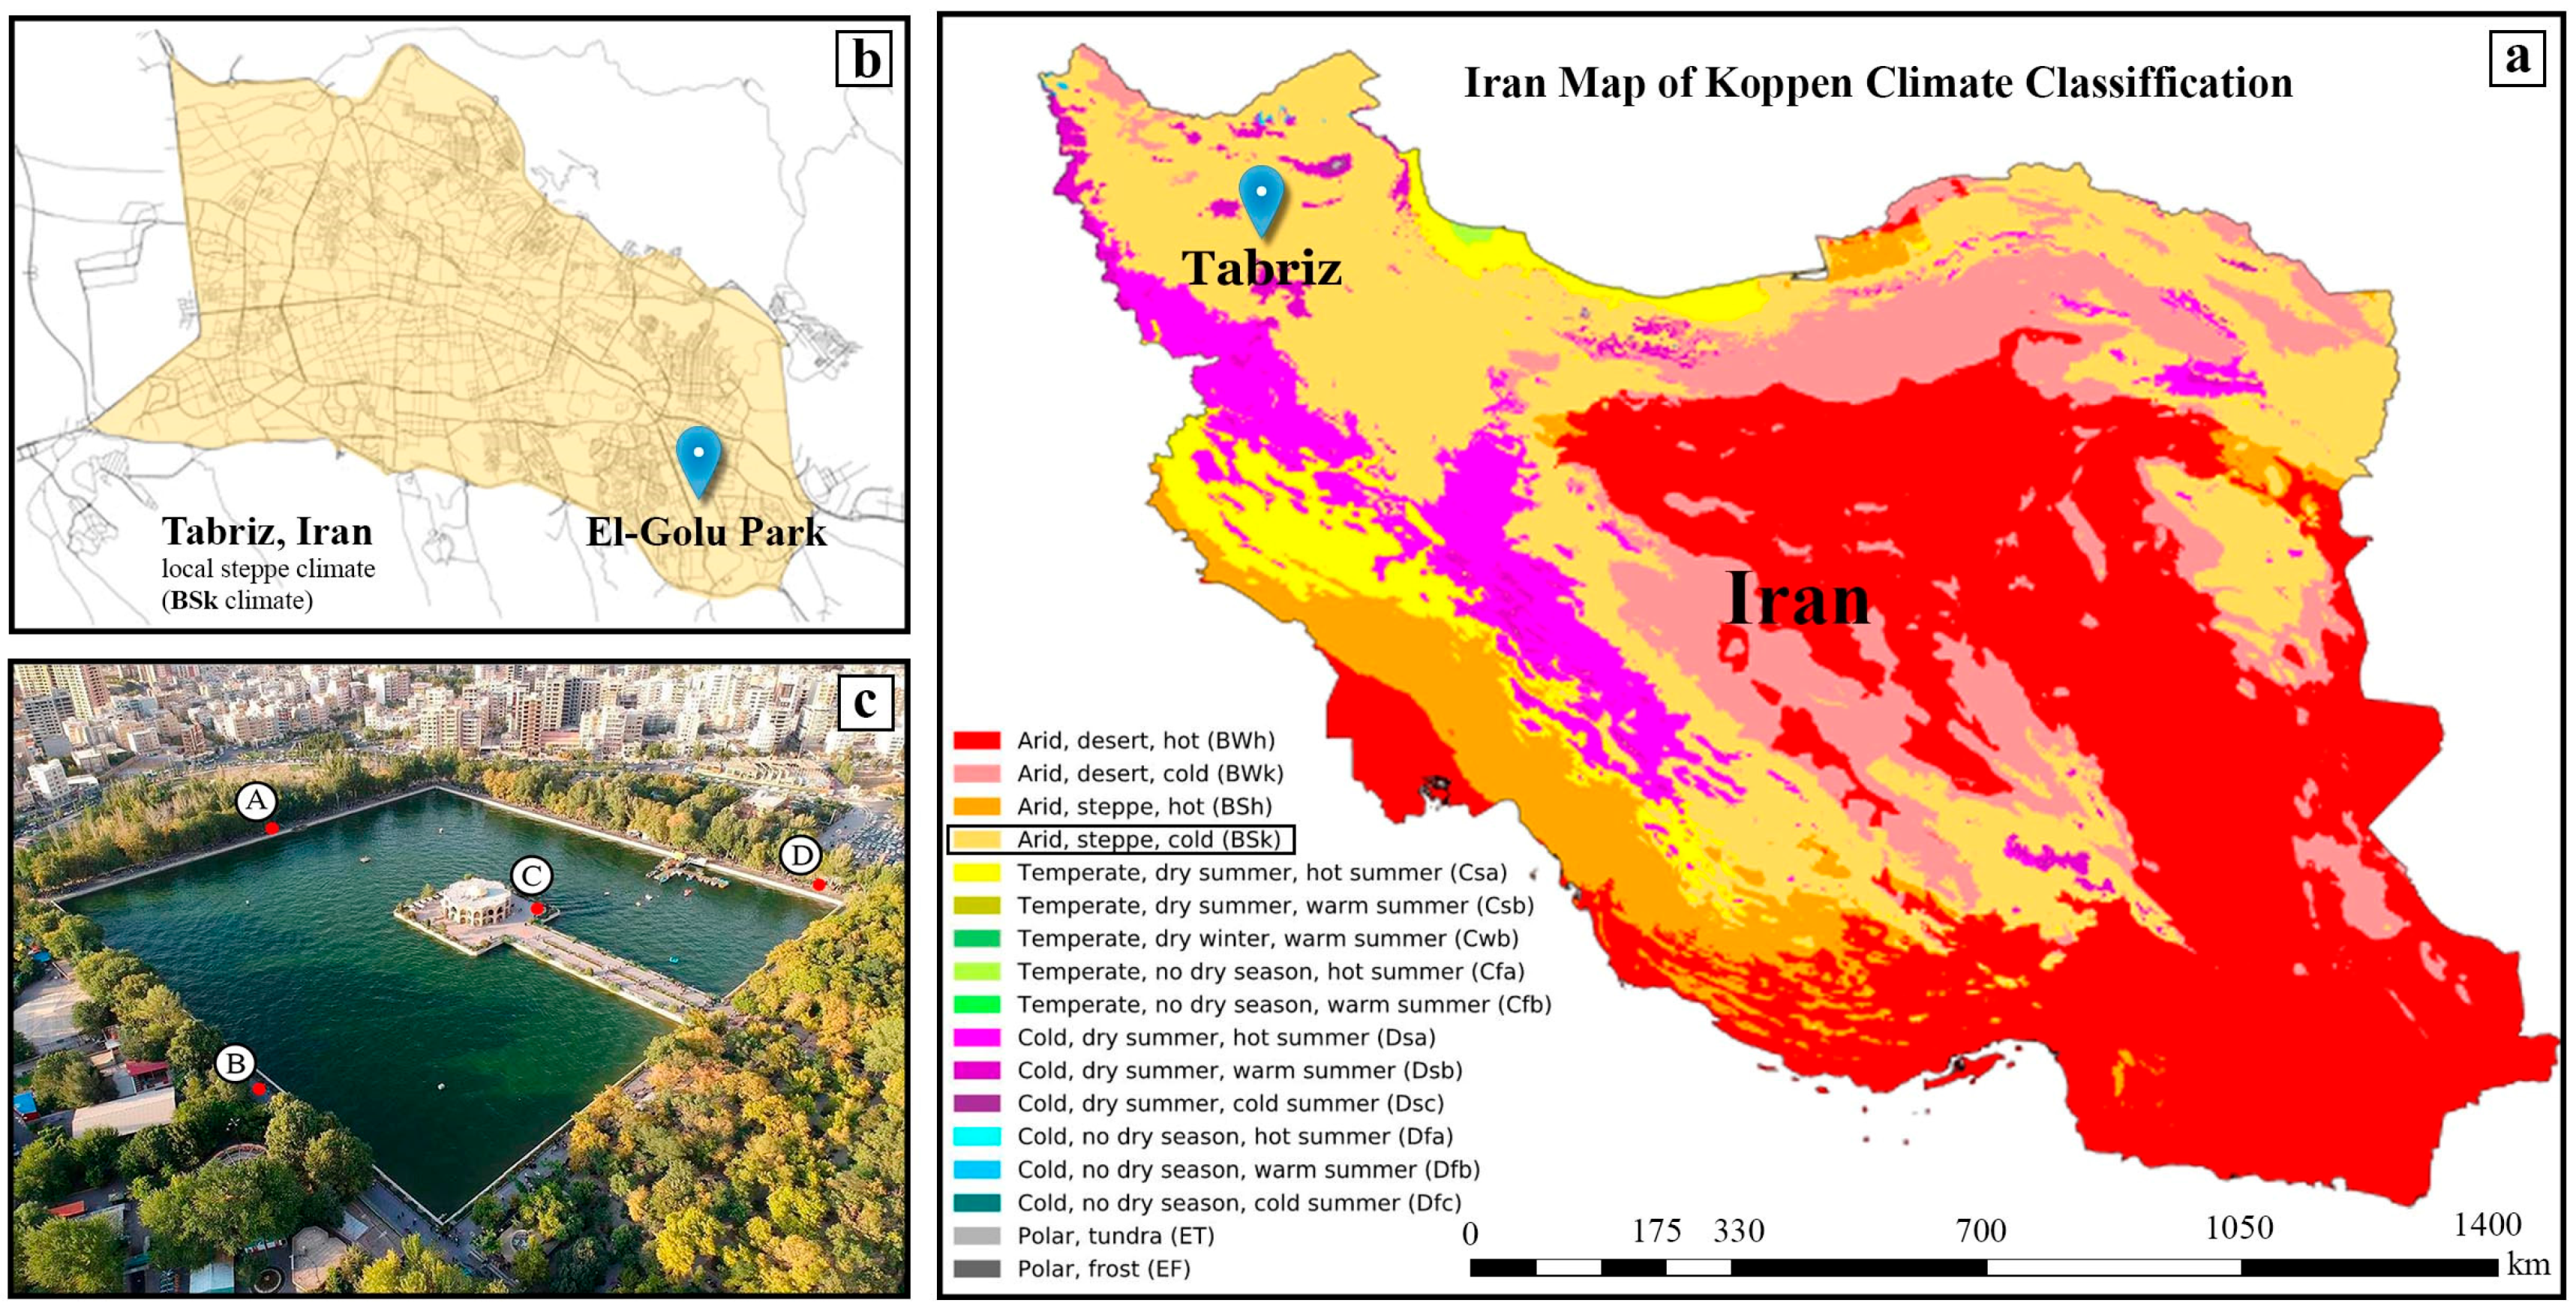
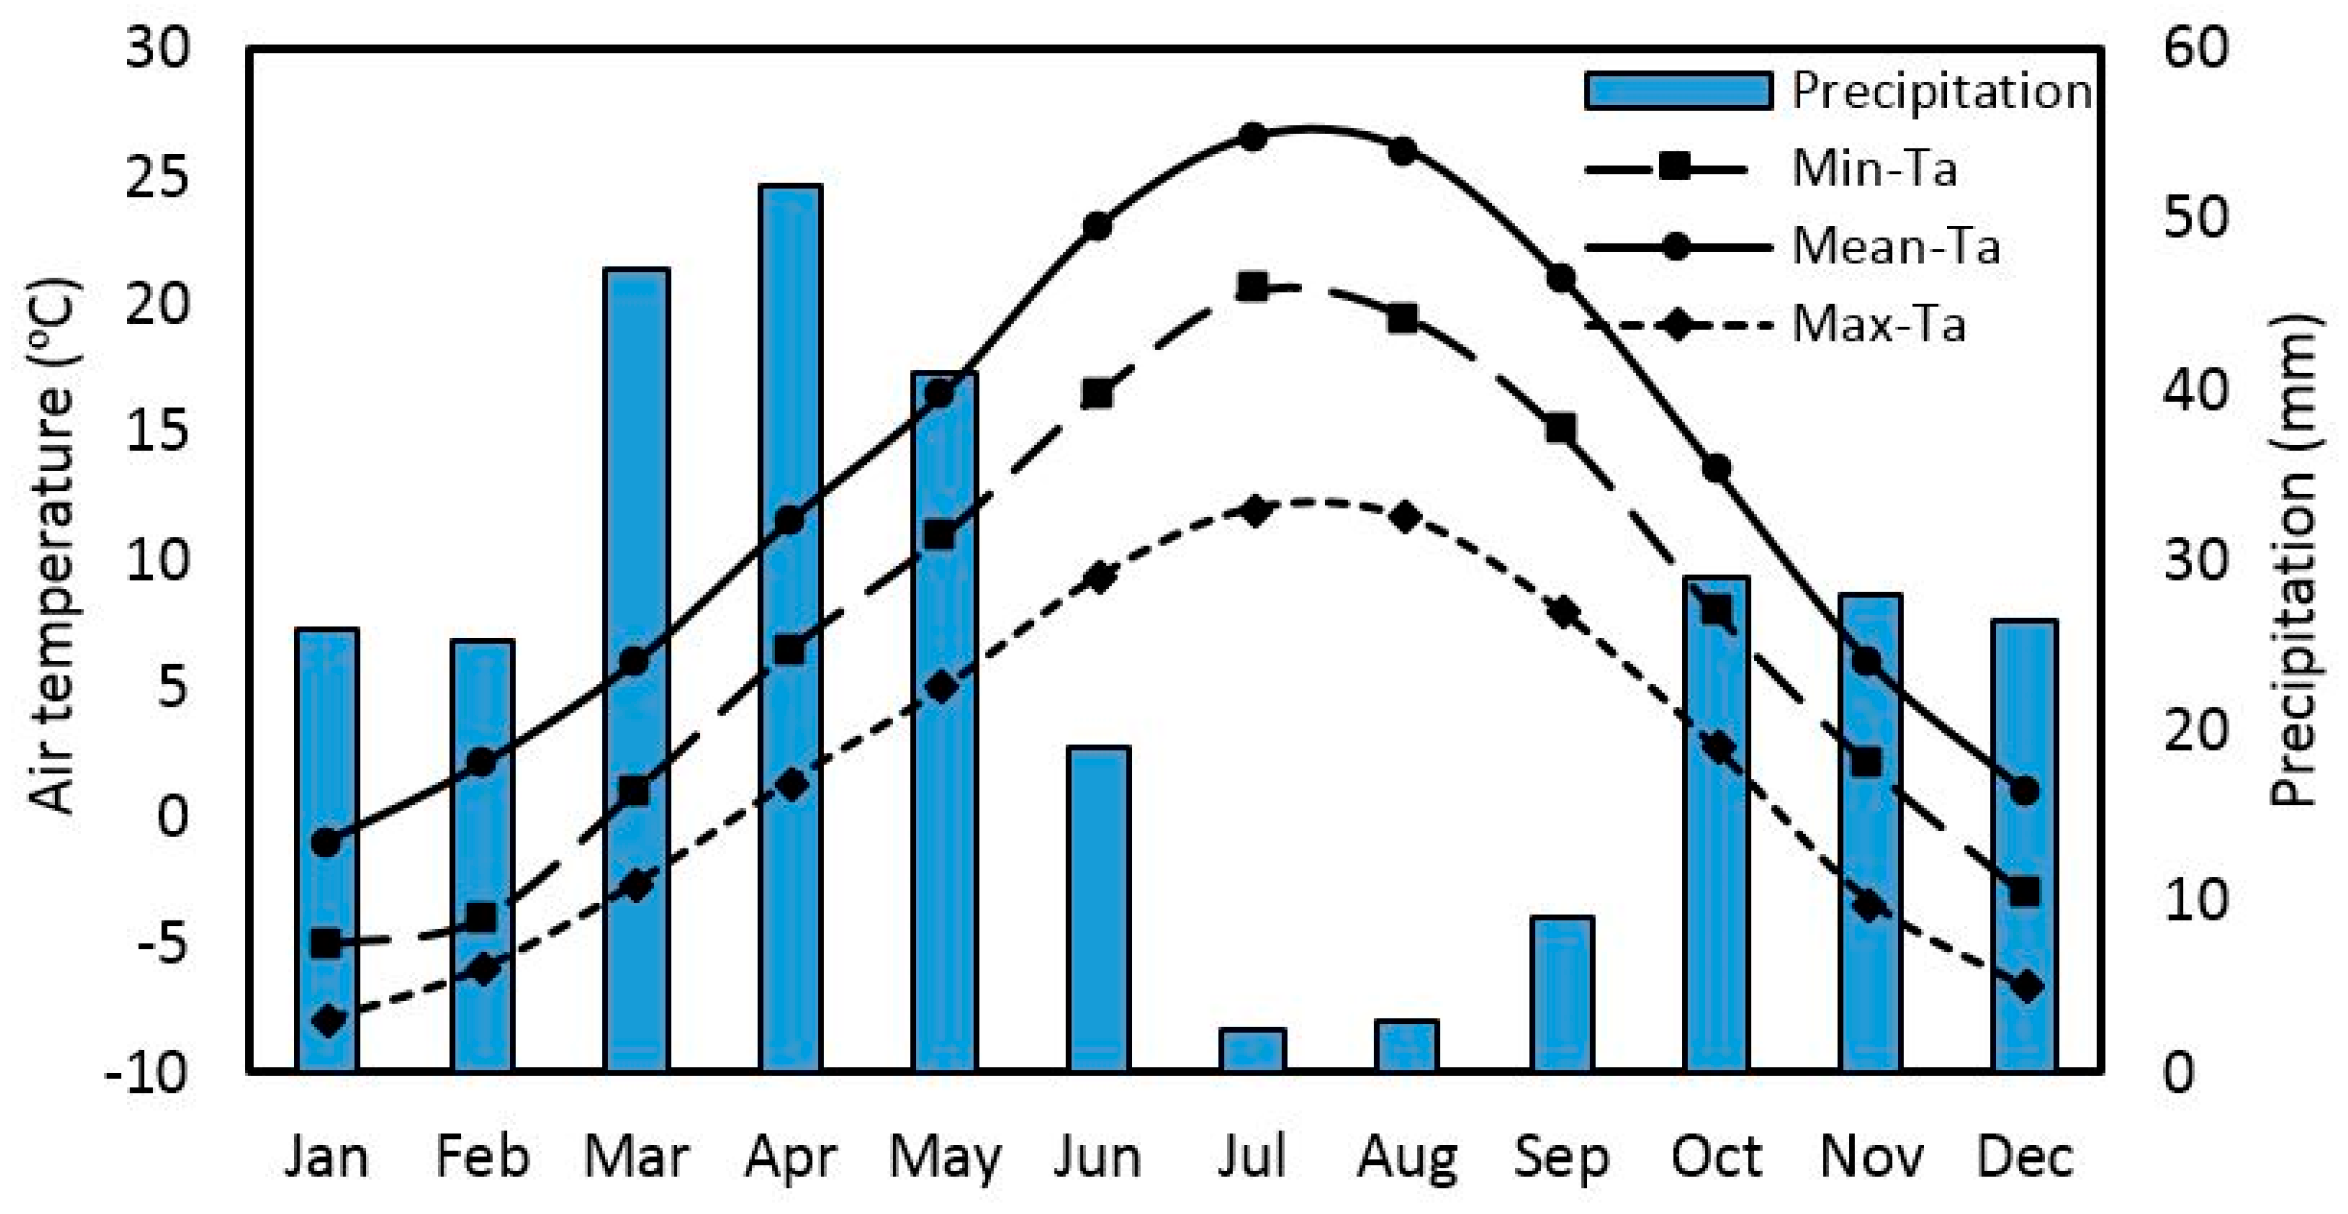
2.1. Study Area

This study was conducted in Tabriz (38°8′ N; 48°15′ E; 1350 m elevation) a metropolis in the mountain area in the northwest of Iran. Tabriz is influenced by the local steppe climate [50]. In Tabriz, there is little rainfall throughout the year. El-Golu Park, as a large historic park containing an artificial lake in the southeast of Tabriz, was chosen as a case study (Figure 1) because it has a large artificial lake, which is unique to this area.
The highest percentage of district surfaces are covered in, respectively: trees (36%); water body (27%); granite pavement (sidewalk, 21%); asphalt surface (13%); and buildings (3%).
Figure 2 illustrates the monthly minimum, mean. maximum air temperatures.

2.2. Input Parameters for ENVI-Met

Overheating in summer causes a lot of problems in areas where populations are vulnerable to heat. Therefore, the hottest day (28th July) of year 2019 in terms of daily average temperature was selected as the study day. Table 2 illustrates the conditions used in the configuration file of the ENVI-met model and meteorological data reported in the Iranian Meteorological Organization website [52].
This research used the example of a 35-year-old man, 175 in height and 75 kg in weight. Clothing insulation (clo) was considered to be 0.4 clo (summer clothing) with a wind speed of 0.5 m/s.
Green area (grass and vegetation) covers about 47% of the district surface. The total number of trees in the site is 417, with three different types of trees (Figure 3). Almost all the trees at the site are deciduous (Poplar, Beech), and the number of coniferous trees (pine) at the site is quite limited (Table 3).
Albero as subcategories of the ENVI-met was used for modeling trees which needed to include three types of parameters:
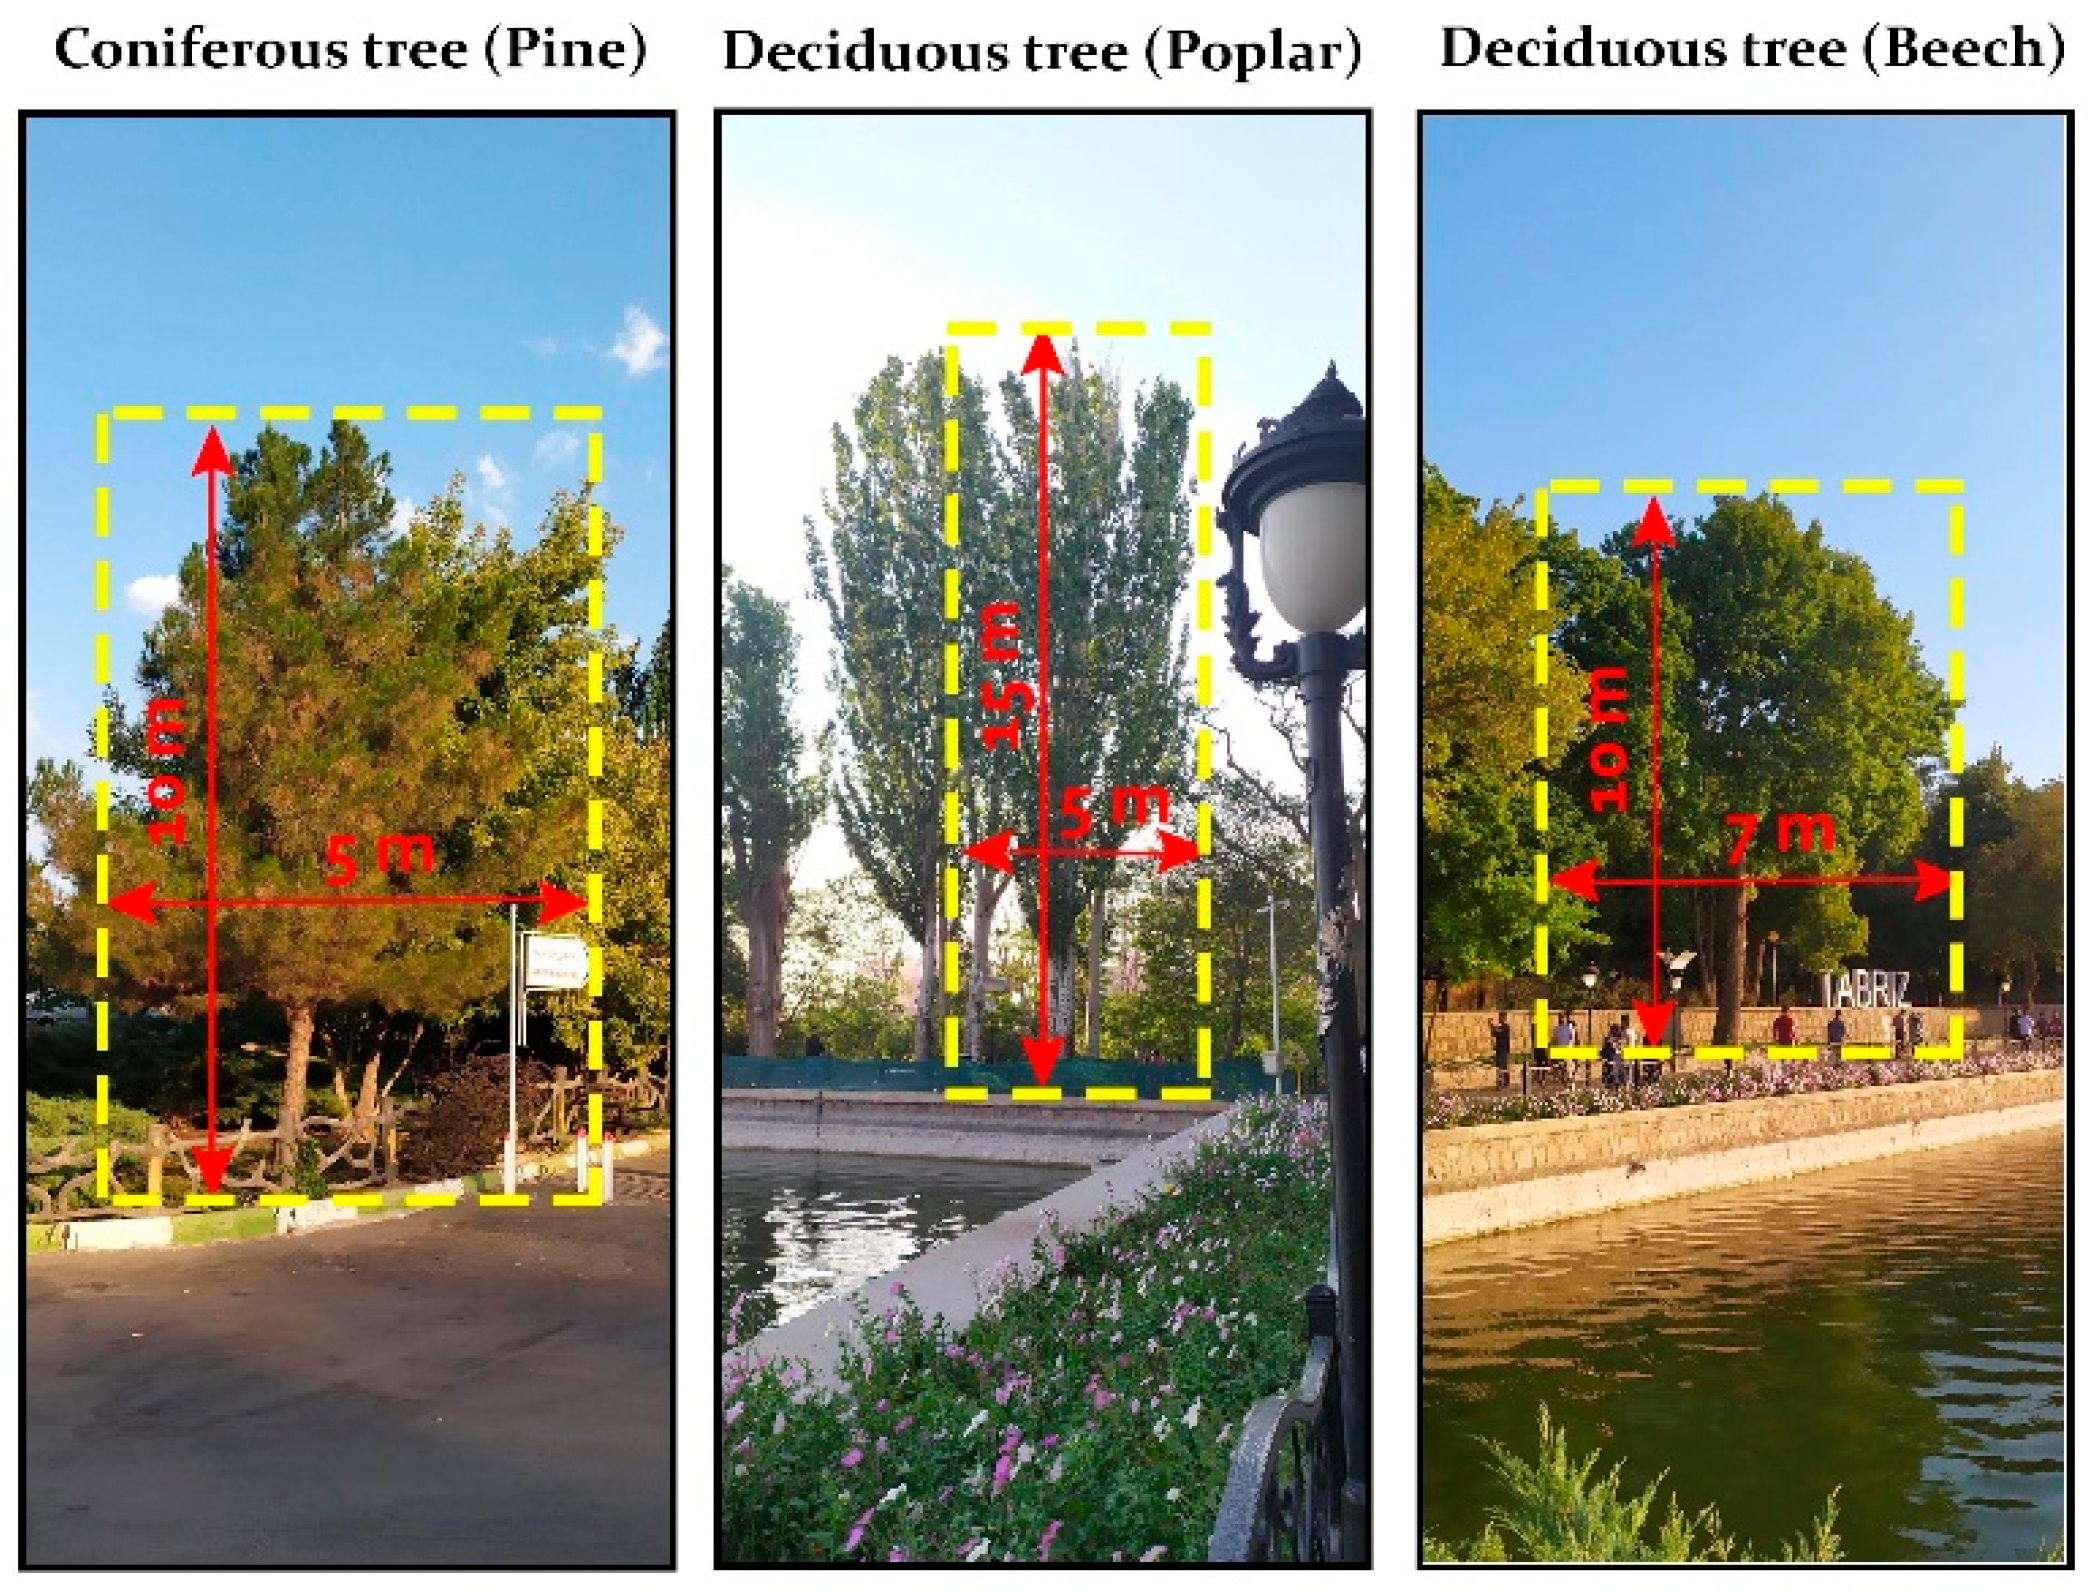
  • The tree crown geometry (height and diameter of tree);
  • Leaf Specifications (Species, foliage albedo and tree calendar);
  • The root geometry (form, diameter, depth and area density of root).
In this study, the physical specification of each studied tree for modeling in the ENVI-met was input using the measured data (Table 3). Leaf properties have been defined according to species (coniferous-deciduous) and tree calendar (season profile). Root geometries of trees were default values.

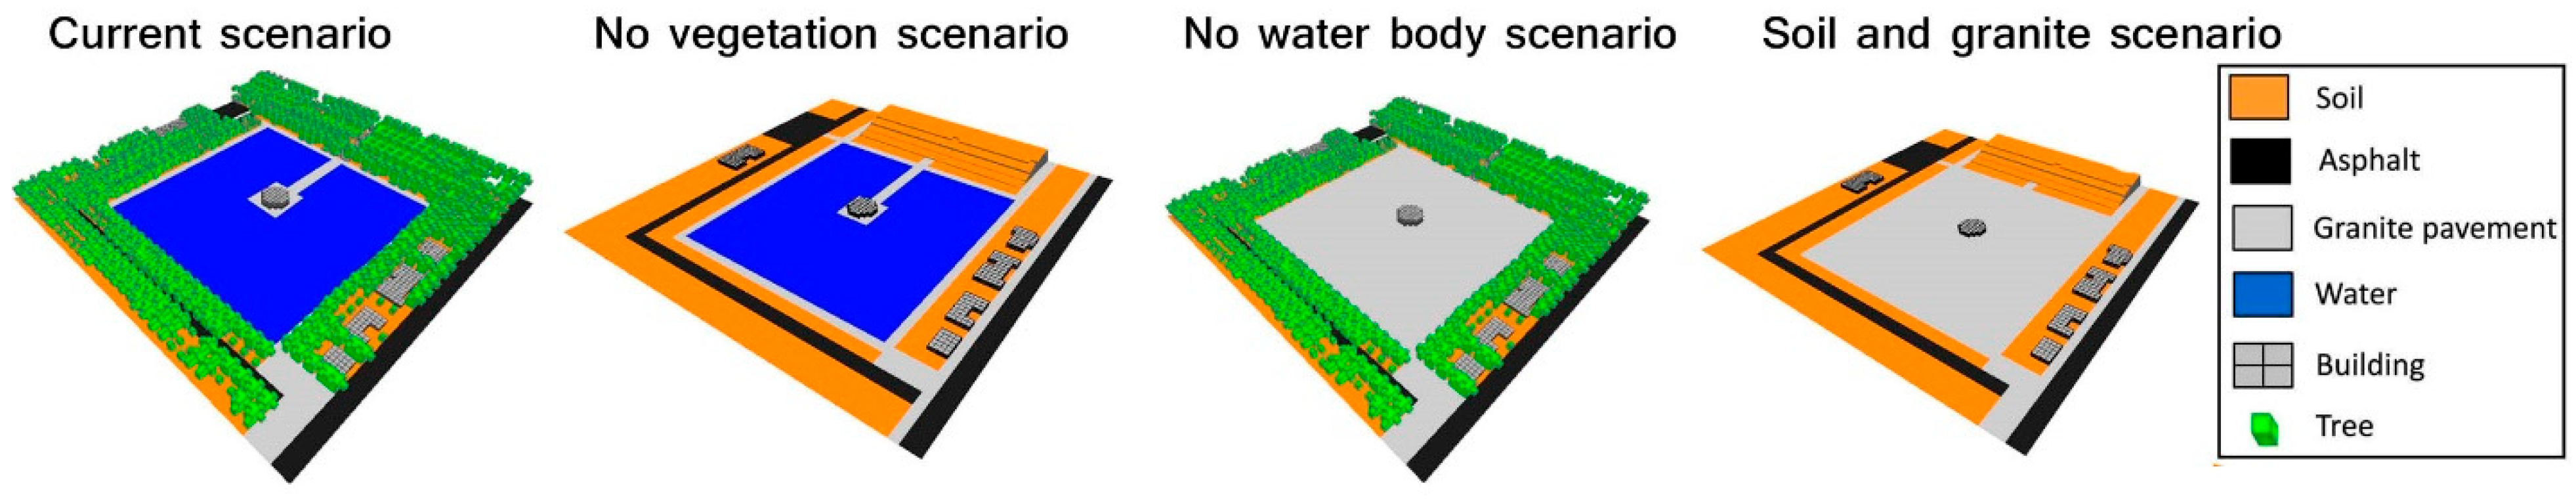
Numerical Simulation

The proportions of different land-use types in the four scenarios are summarized in Table 4. The percentages show that asphalt and buildings are unchanged in all cases.
Four different scenarios were analyzed as simulation scenarios:
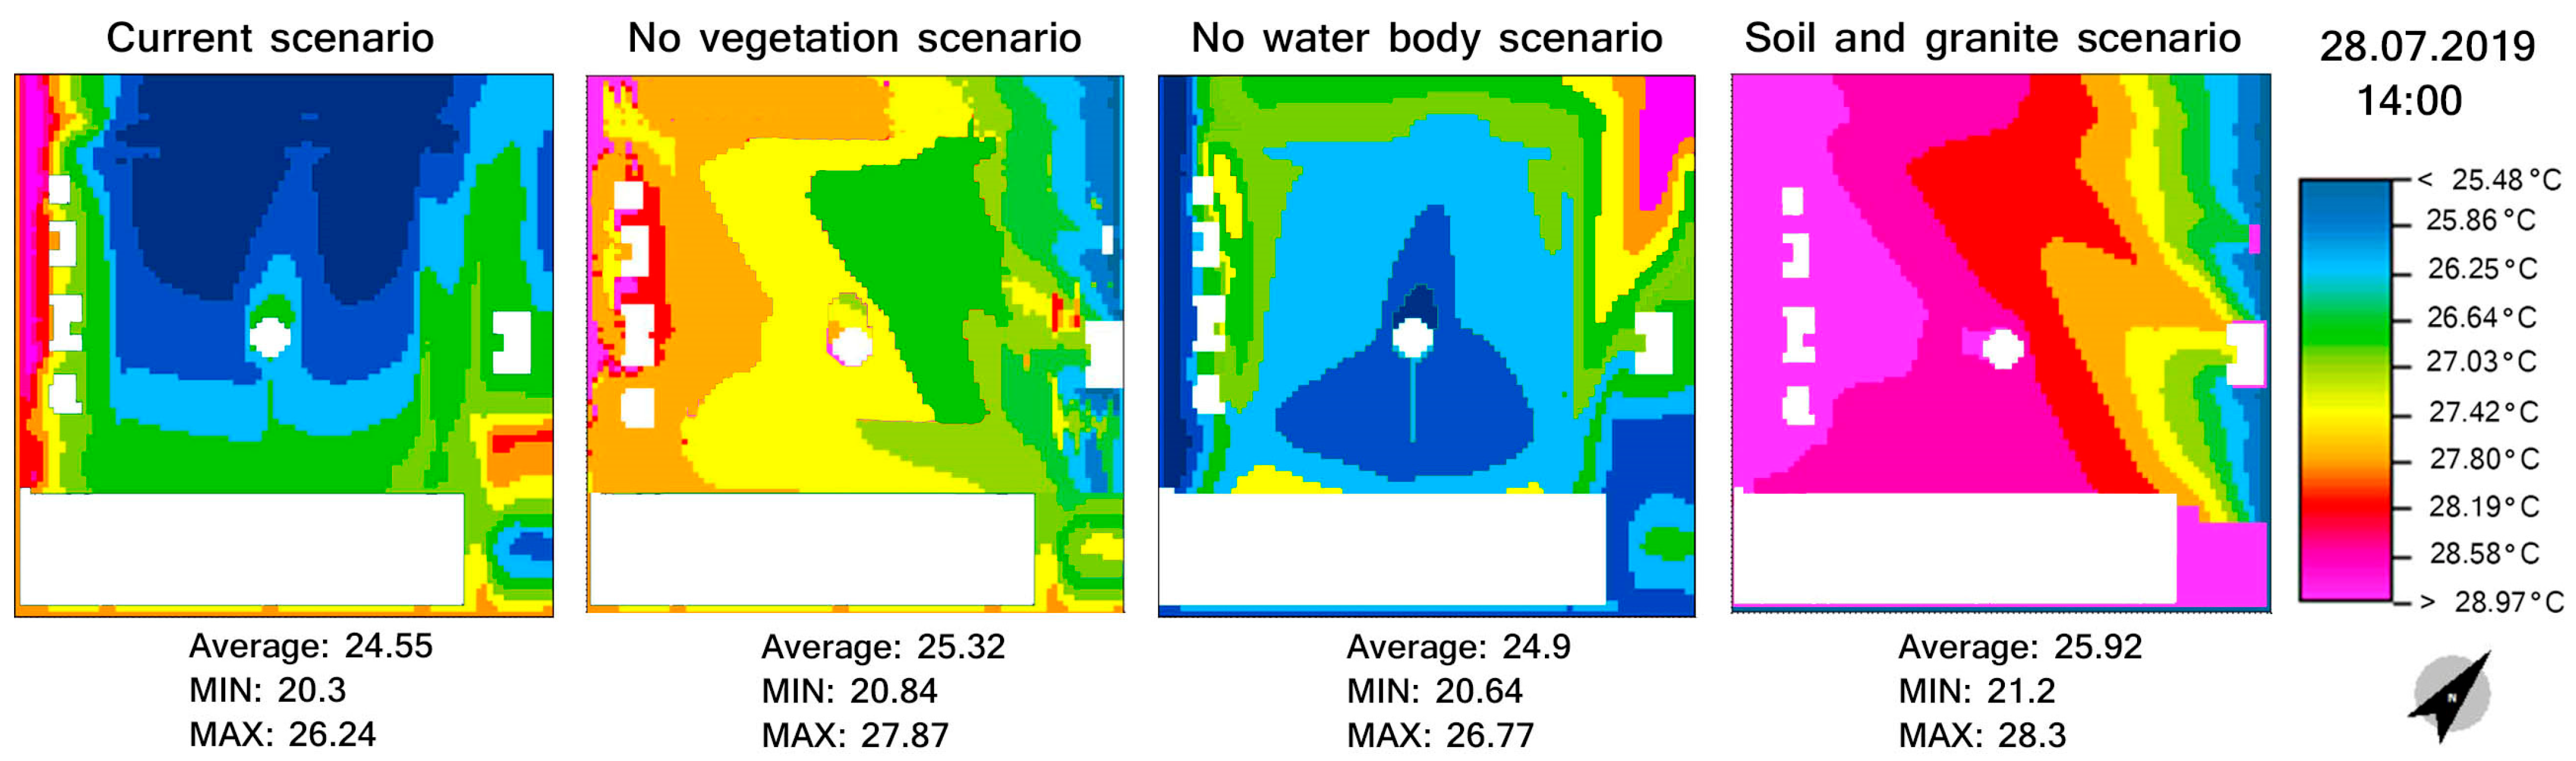
  • case 1: current scenario (vegetation + water body);
  • case 2: no vegetation scenario (water body without vegetation, replaced by bare soil);
  • case 3: no water body scenario (vegetation without water body, replaced by granite pavement);
  • case 4: soil and granite scenario (without vegetation and water body).
The simulation domain was subdivided into a three-dimensional grid of 96 × 96 × 32 cells with dimensions 4 × 4 × 4, and five nesting grids to each side. Four virtual receptors in ENVI-met simulation (A to d) as reference points for recording and receiving climatic information during the simulation period (9:00 to 17:00) is defined. Output data of ENVI-met v4 were used in the RayMan model 2.1 [53] to calculate PET [48]. The comparison of simulation results can have presented the impact of water and trees on urban microclimate and human thermal comfort on the site. Contributions of the water body, trees, and reflective surfaces (asphalt and granite pavement) have illustrated in four scenarios in Figure 4.

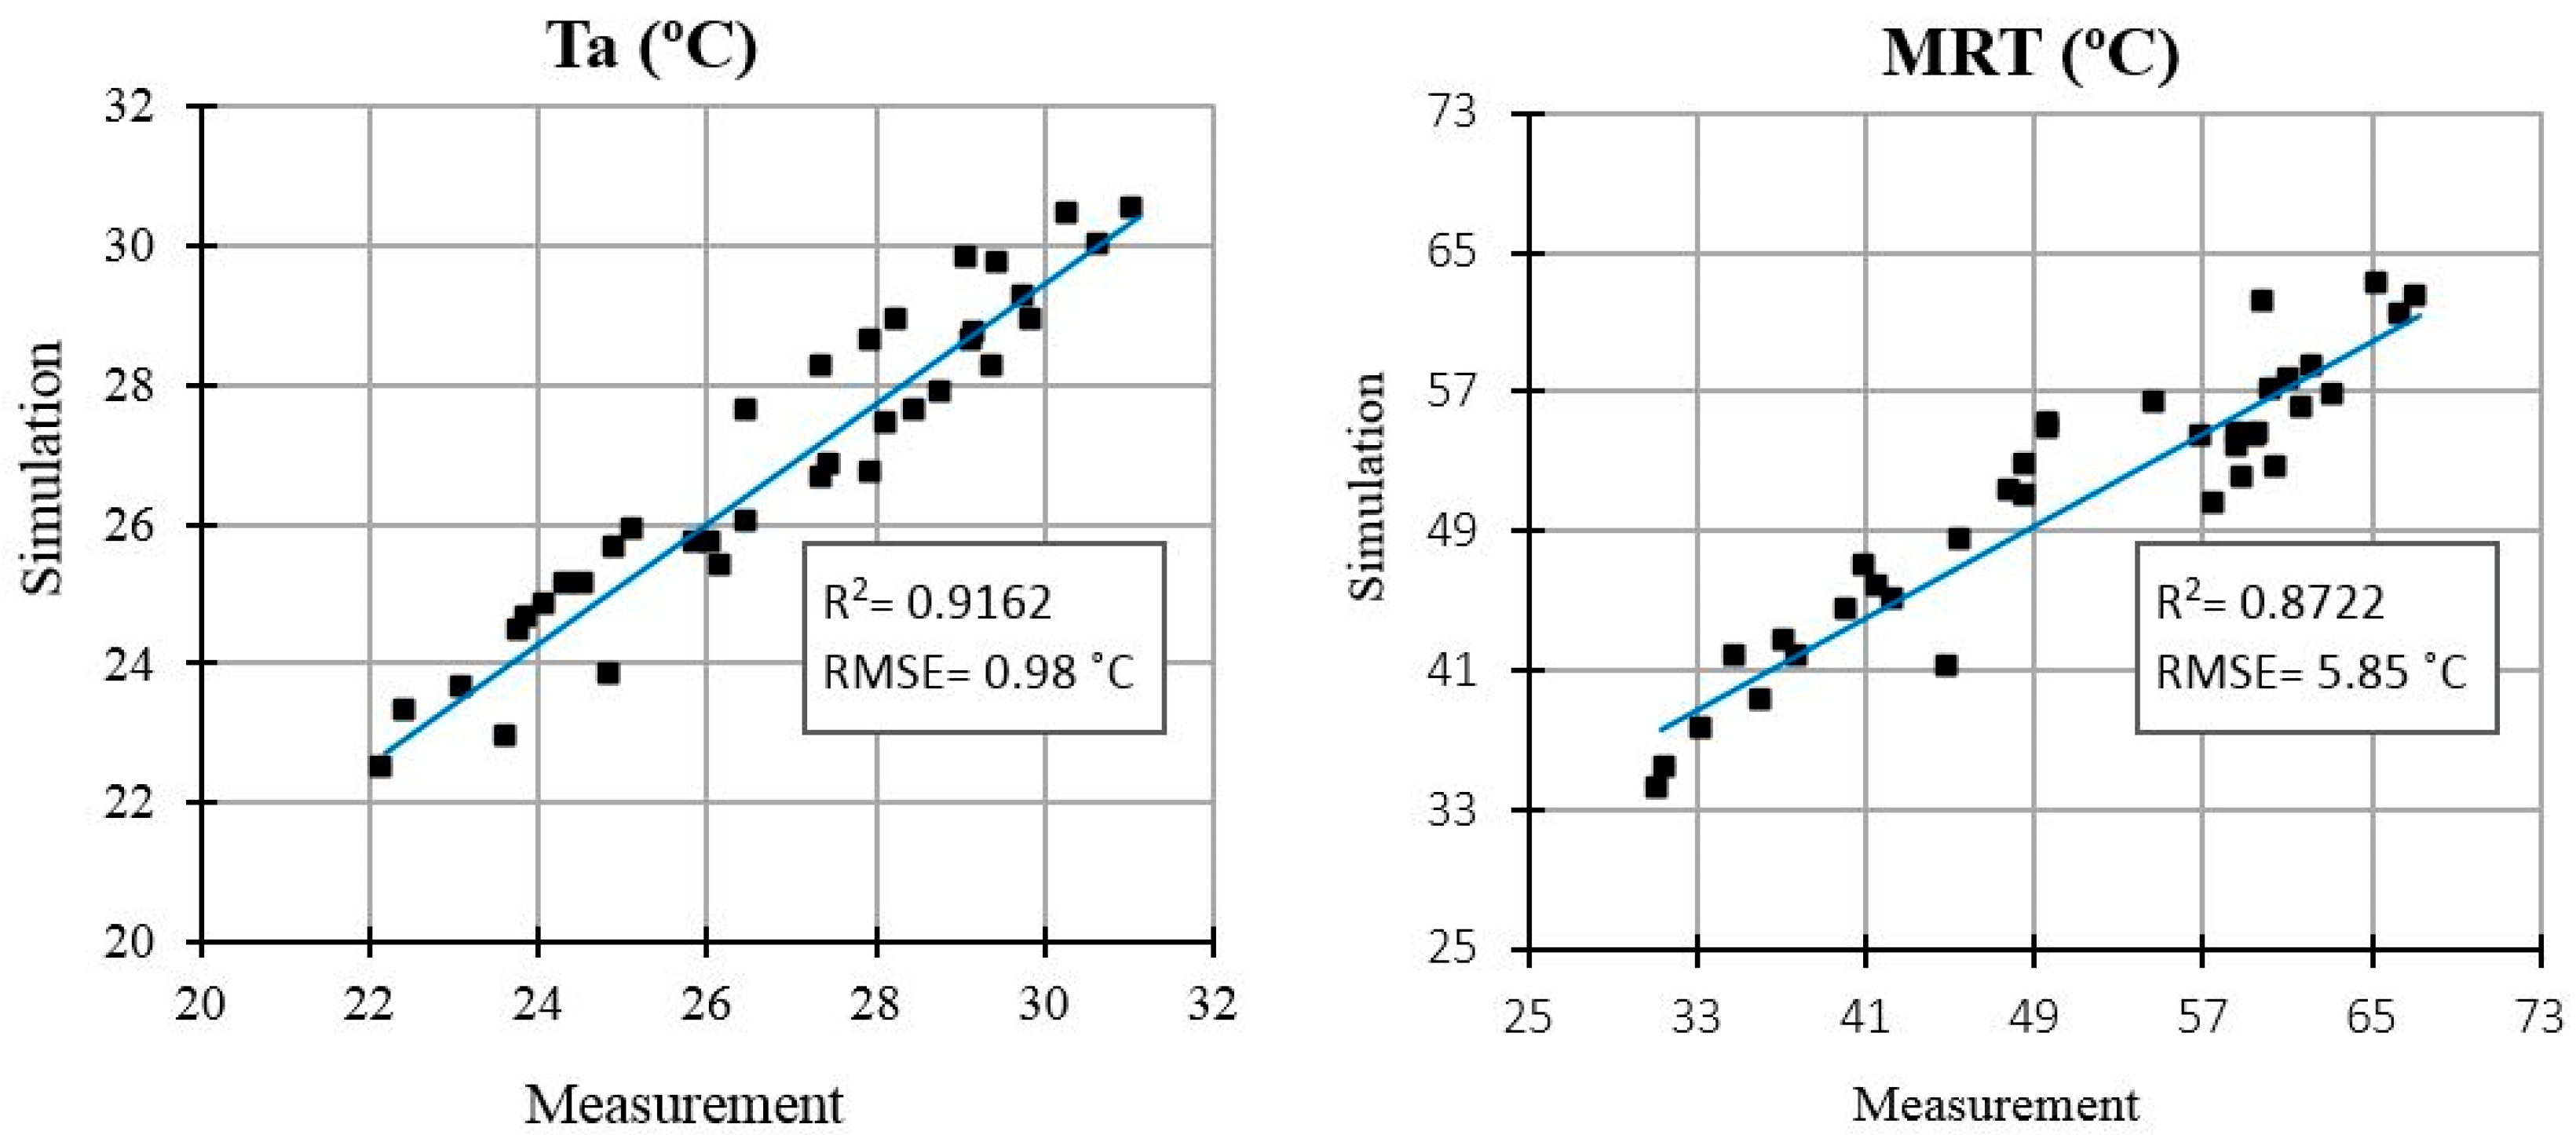
2.3. ENVI-Met Validation

This section intends to validate the ENVI-met model using the measured and predicted air temperature (Ta) and Mean Radiant Temperature (MRT), which is defined as the uniform temperature of an imaginary enclosure in which the radiant heat transfer from the human body is equal to the radiant heat transfer in the actual non uniform enclosure [54]. The instruments were placed 1.5 m above the ground of the study site. The specifications and technical data of the instruments are reported in (Table 5). By using a statistical method, the measured and simulated Ta and MRT of this area were analyzed. The data were measured at different times on 28 July 2019 from 09:00–17:00 in local time.

3. Results

3.1. Validation Results

Based on the simulated and measured results, the maximum air temperature occurred at about 13:00–16:00. The Ta difference between the results of simulated and measured is about 1.3 °C at the highest point, while the average difference is 0.5 °C. On the other hand, the maximum MRT occurred at 12:00 to 15:00 in both the simulated and measured results. The model represented very similar results between the measured and simulated data of Ta (R2 ≃ 0.91, RMSE ≃ 0.98 °C) and MRT (R2 ≃ 0.87, RMSE ≃ 5.85 °C). So, the performance of ENVI-met software is acceptable (Figure 5).

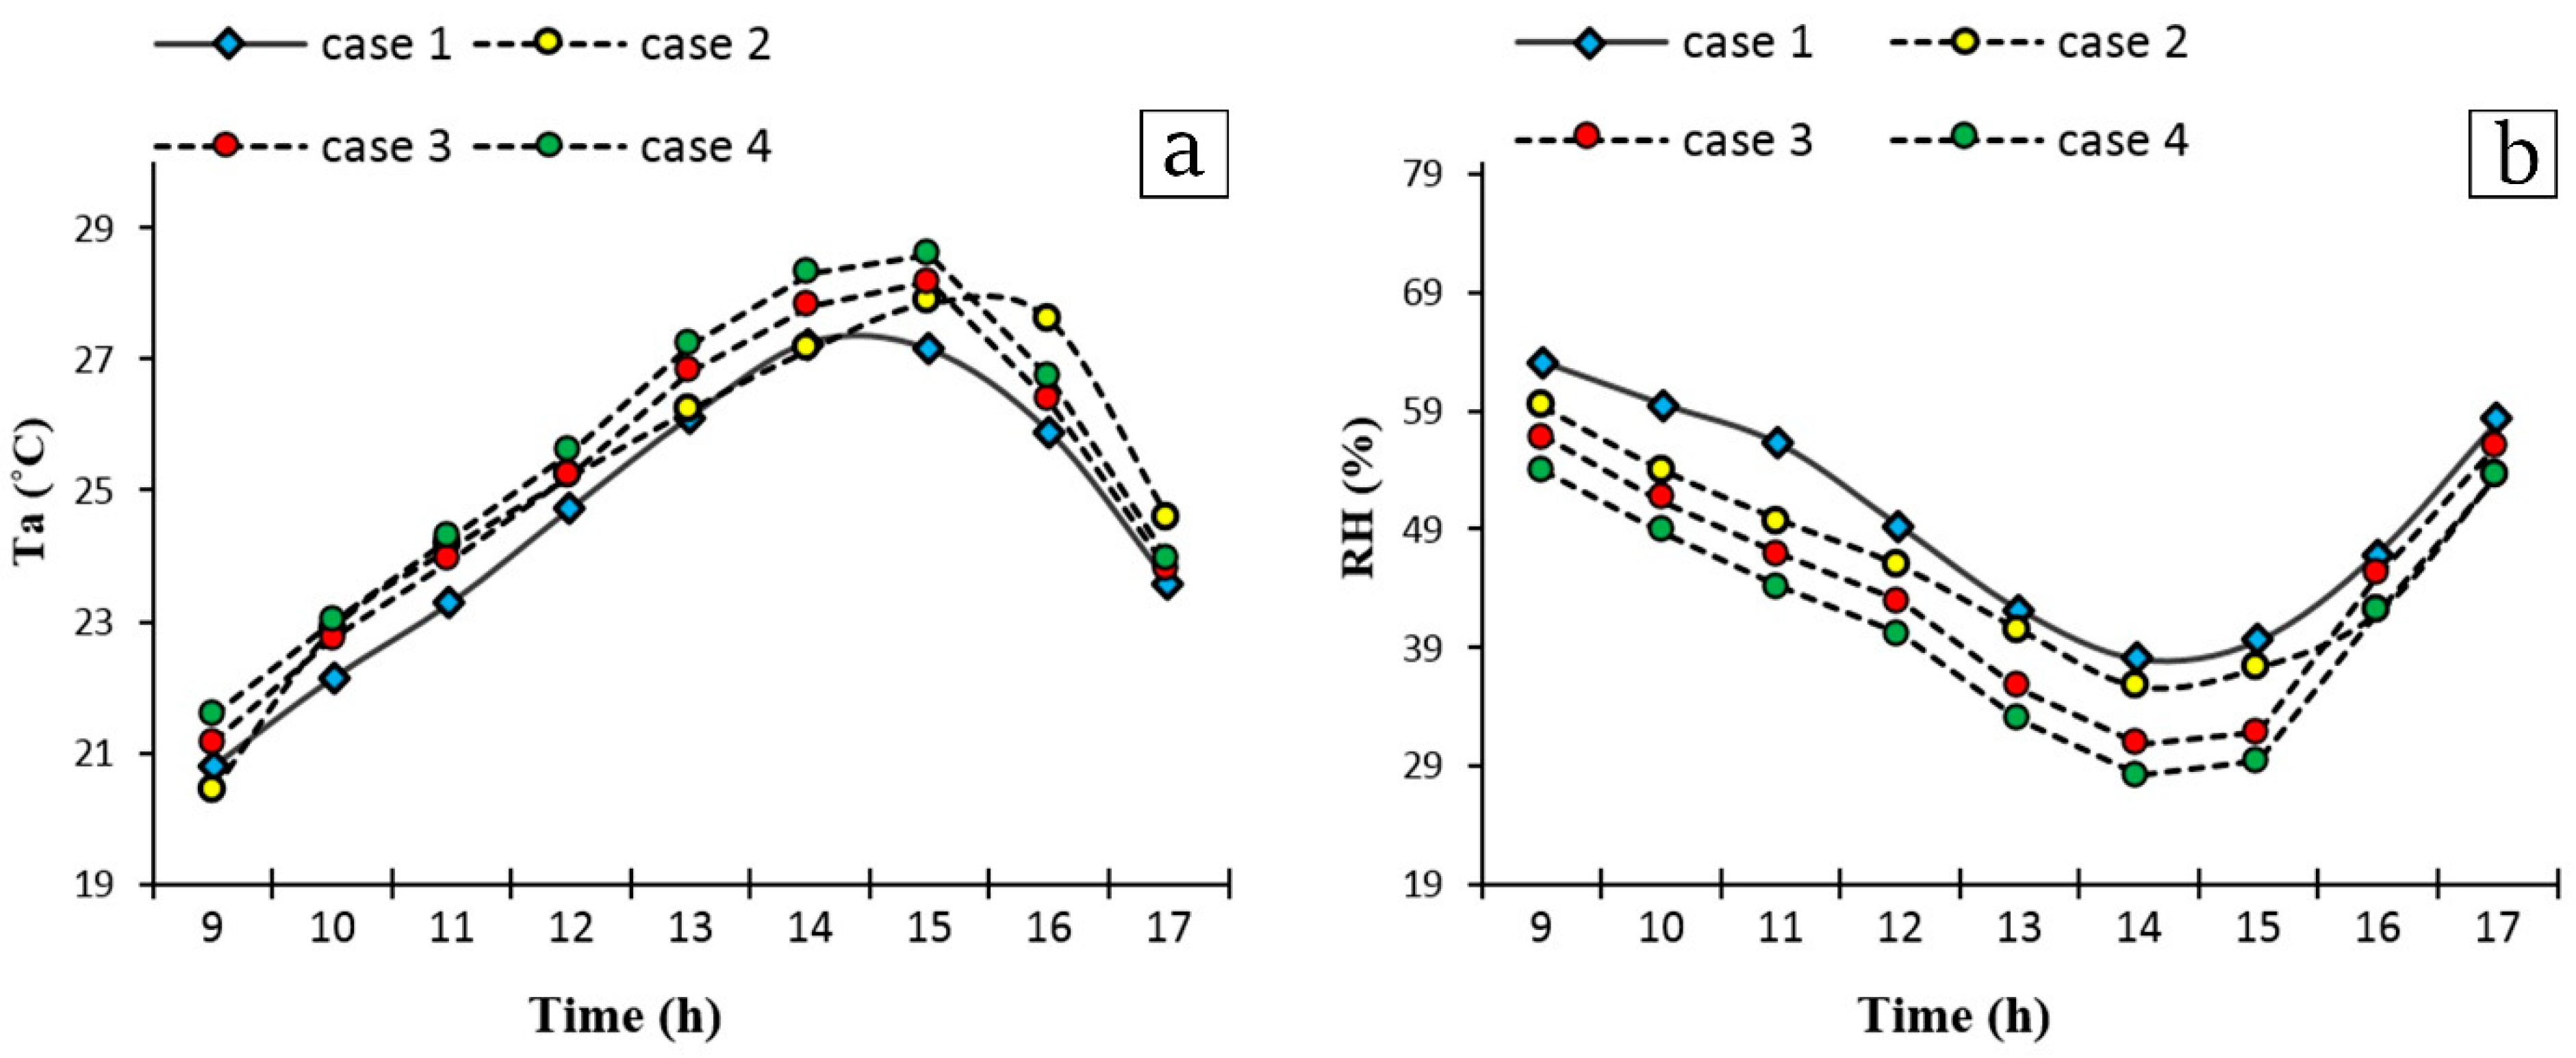
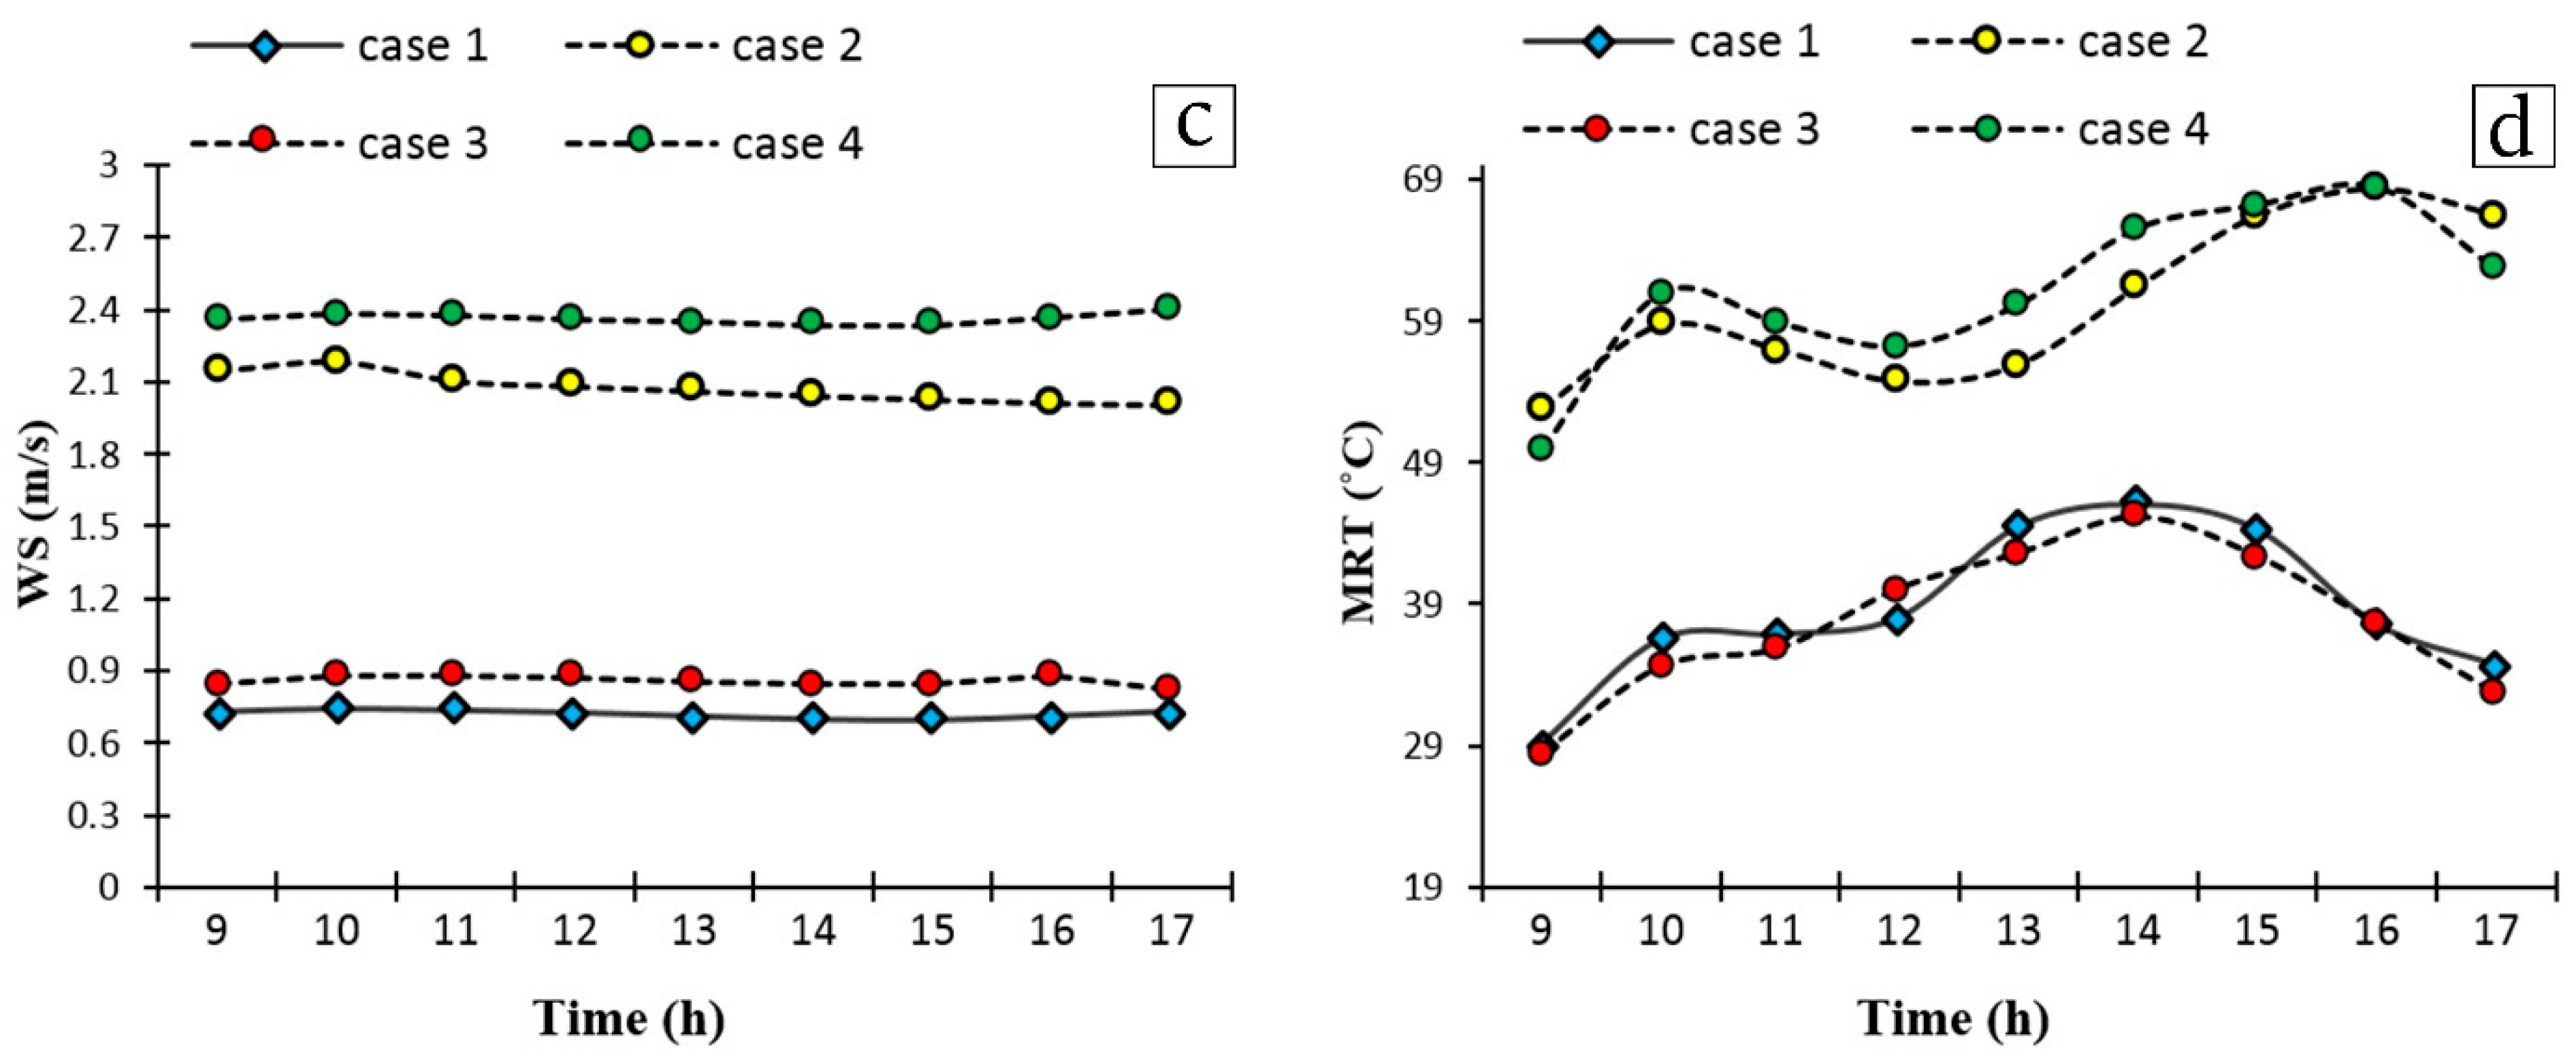
3.2. Investigation of Microclimate Results

LEONARDO is one of the other subcategories of the ENVI-met which shows the results of simulated variables in color-coded ranges. Distribution of air temperature at the hottest time (14:00) based on climate on the hottest day of the year (28 July 2019) for all the scenarios are shown in Figure 6.
The 9-h average of climate variables related to the receiving points located on the site has been calculated for Ta, RH, WS, MRT (Figure 7). According to the results, the average Ta and MRT vary depending on the presence of trees and water body in all scenarios. As shown in Figure 7, the average Ta and MRT of the current scenario (c1) during the summer day are respectively 25.9 and 37.7 °C. Therefore, the average Ta in scenarios (c2–c4) compared to the scenario c1 have increased 0.4 °C, 0.2 °C and 0.4 °C respectively. Also, shading by trees has a positive impact on the sunlight reduction. These differences have created a wide zone of “mean radiant temperatures” in different parts of the site. The average MRT compared to c1 has increased c2: 18.2 °C, c3: 1.6 °C, and c4: 22 °C, respectively.
With regard to simulation results, scenario c2 (no vegetation scenario) provides the same results as the scenario c4, while scenario c1 and c3, have a cooling assistance benefit compared to scenarios c2 and c4. It should be noted although case 3 (no water body scenario) like case1 has improved PET, while the relative importance of the water body on air temperature reduction is quite impressive in case 1 (vegetation + water body) (Figure 8a). In detail, the daily average Ta in cases 1 and 3 are 24.6 °C and 25.1 °C respectively. Overall, it can be seen that water alone has dropped air temperature by 0.55 °C.
Figure 7b illustrates the relative humidity trend in the four scenarios. As expected, the water body in the urban park also induces a dramatic increase in relative humidity. Compared to the base model, the three other scenarios (c2–c4) provide the reduction of RH by respectively 3.93%, 6.18% and 8.87%.

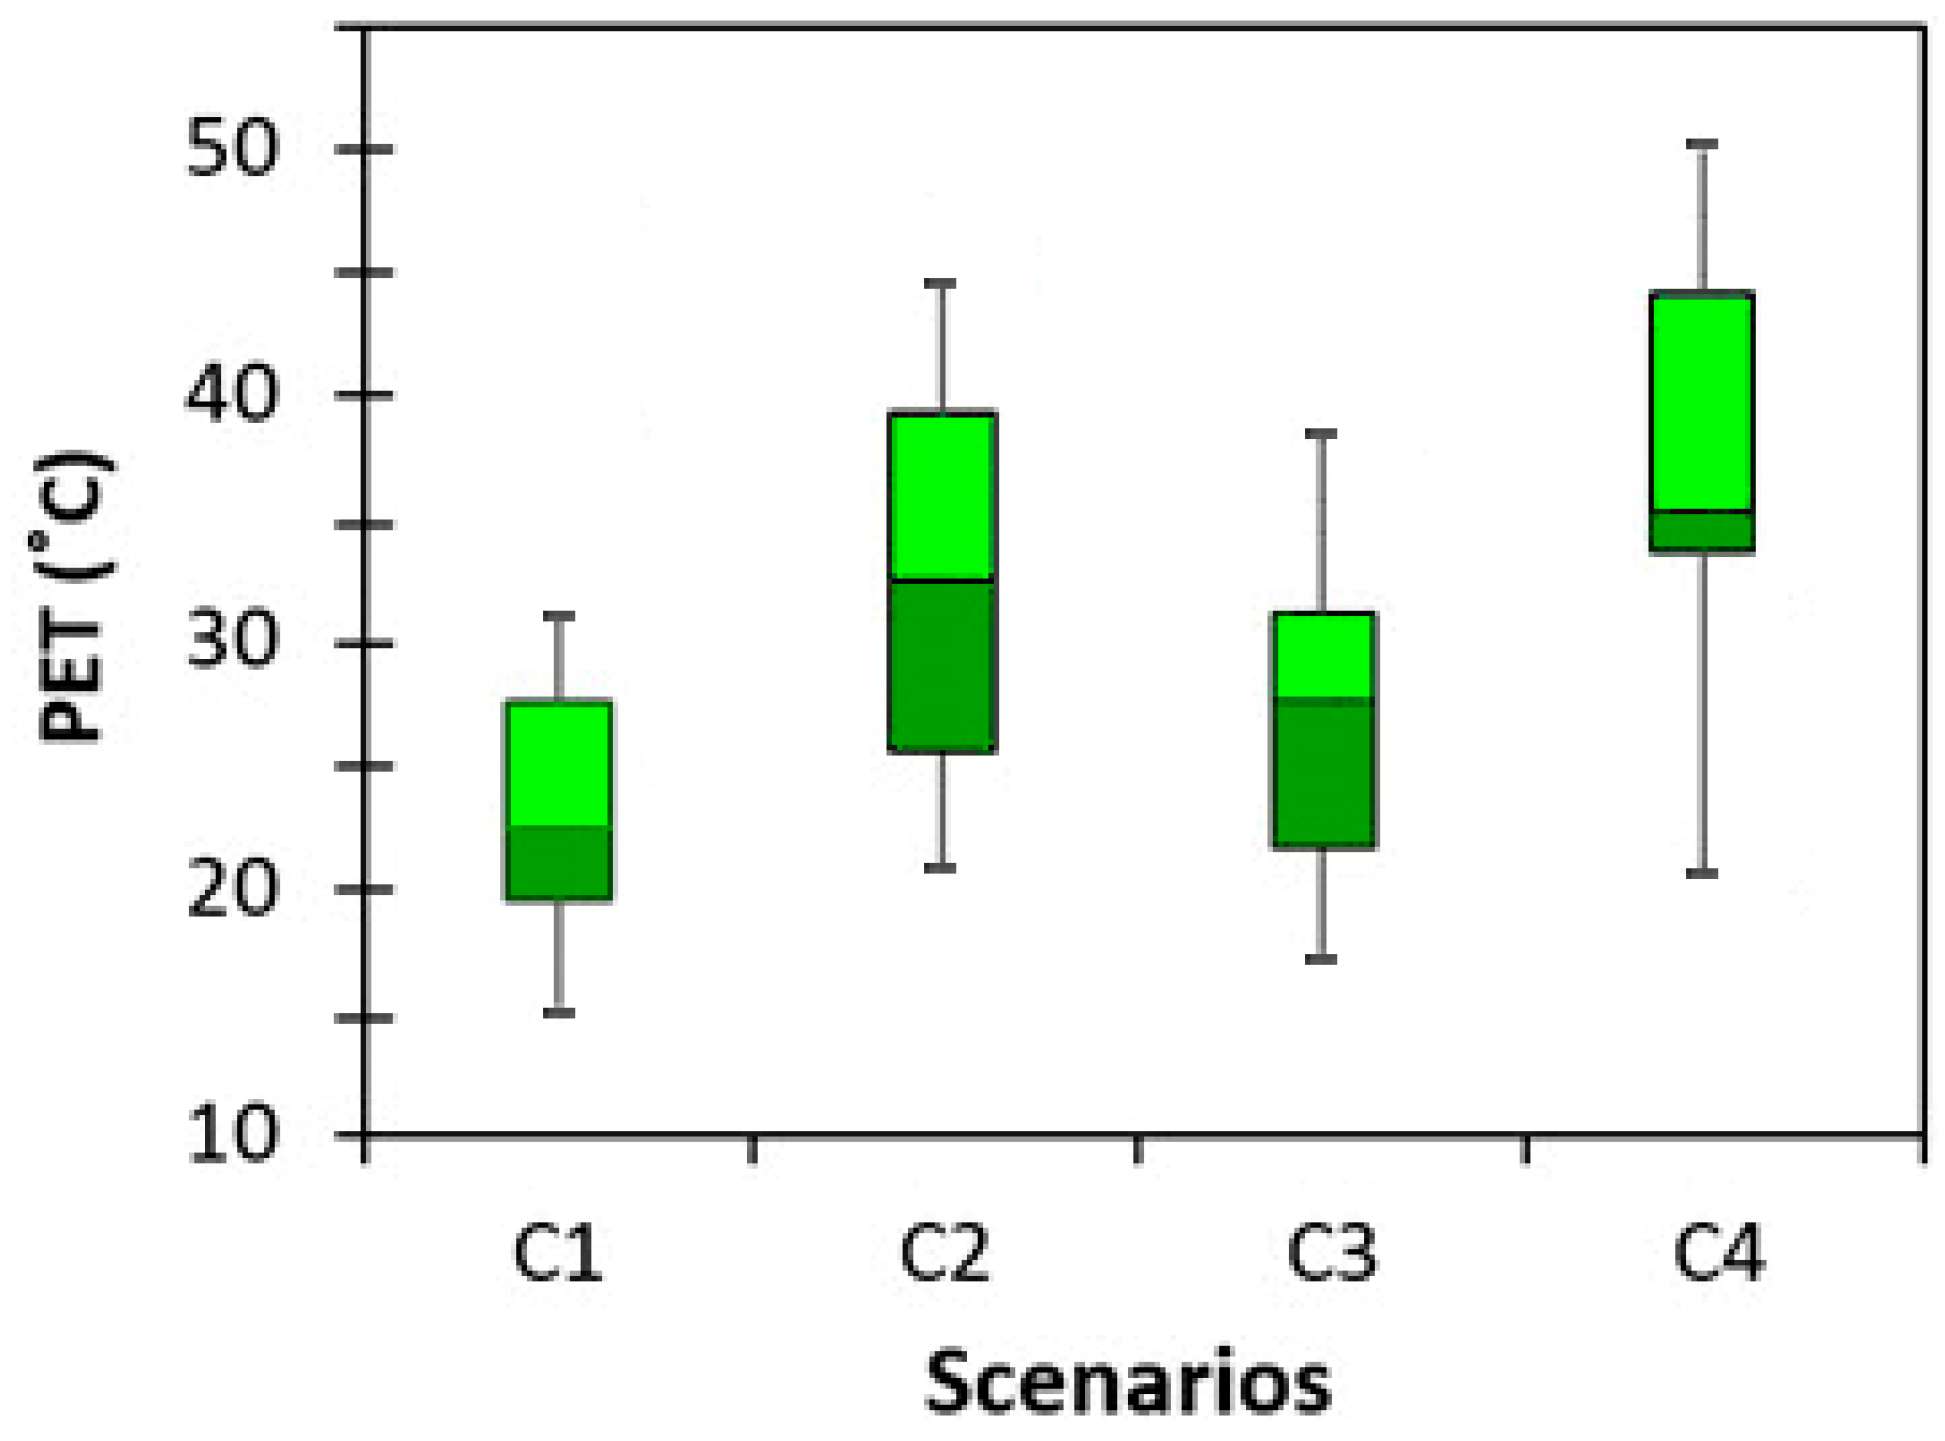
3.3. Investigation of Thermal Comfort Results

Based on the physiological equivalent temperature (PET) range, the comfort zone is obtained between 18 and 23 °C (Table 1). Simulation results show that the average PET of the base model (c1) during simulation day is 23 °C (comfortable sensation). The average PET in the scenarios (c2–c4) is 35.2 °C (hot sensation), 26.7 °C (Slightly warm sensation) and 37.5 °C (hot sensation), respectively. According to PET index case 1 (vegetation + water body) is in a comfortable zone at 10:00–11:00 and at 17:00. However, the site suffers a warm sensation from 14:00–15:00 on the hottest day of the year. The results of case 2 (no vegetation scenario) showed that the presence of trees can reduce PET value (15 °C−18 °C) at the hottest time of the day around 14:00–15:00. On the other hand, case 3 (no water body scenario) has about similar results with case 1, except 13:00 (warm sensation), and from 14:00–15:00 is in hot sensation. Therefore, PET results reported that vegetation and water body in urban areas can reduce 3–7 °C at the hottest time of the day (14:00–15:00) (Table 6, Figure 8).
Figure 8 represents the boxplots of PET values at the site (1.5 m agl) for all scenarios on the hottest day of the year from 09:00–17:00.

4. Discussion

Urban microclimate and human thermal comfort can be ameliorated through mitigation strategies. This study investigated the influence of water bodies, trees, and surface materials on the microclimate and thermal comfort in an urban park in a steppe climate. The ENVI-met model (v4) was utilized to simulate scenarios. This model uses computational fluid dynamics (CFD) to simulates surface-water-plant-air-interactions in urban areas and has been widely used in studies to the assessment of HMSs on urban microclimate [55,56,57,58] and human thermal comfort [59,60,61,62].
Thermal comfort model performance in terms of simulation Ta and MRT in the ENVI-met model was validated. In most previous studies validation of the ENVI-met model was mainly focused on air temperature and MRT [59,63,64,65]. The performance of ENVI-met software was satisfactory compared with early versions [66]. The reasonable performance of ENVI-met provides opportunities to researchers to test different design scenarios.
Previous studies have demonstrated that urban heat island mitigation strategies, especially the use of urban greenery, are useful for the regulation of urban microclimate, whose magnitude depend on the specific climates. On the other hand, such a strategy has a significant impact on human-biometeorology which is beneficial for improving thermo-physiological indices (e.g., physiologically equivalent temperature, PET). Nevertheless, water bodies in urban areas could also impact human thermal sensation. This issue has seldom been considered in the studies. Furthermore, few studies have investigated the beneficial effect of water bodies in desert climates and developing countries. This study has tried to fill these gaps by providing an application of numerical evaluations of microclimate and outdoor thermal comfort in an urban park in Tabriz, Iran, characterized by a steppe climate.
Based on the results of the surfaces tested, the water body was more effective in reducing heat island compared with the granite pavement. The reduction was achieved because the evaporation of water decreased the surface temperature. However, it also increased the humidity, which reduced the positive impact on thermal comfort. These results confirm the modeling results by [40], where they utilized the same model to study open water surface influence on thermal sensation. However, the combination of water body with trees which reduced MRT represents better performance in the regulation of urban microclimate and thermal comfort. Our result reported that water surface in conjunction with tree cover can reduce air temperature at the pedestrian level by 0.5 °C on the hottest day of the year, which was lower than the results of previous studies [67]. However, 0.5 °C is less than the RMSE value 0.98 °C for Ta so it does not necessarily represent a true reduction in temperature. Plus, a reduction that small has only a minor effect on human thermal comfort. More importantly, the MRT reduction of 22 °C is much larger than the 5.8 °C RMSE for MRT and has a substantial effect on human thermal comfort.
According to simulation results, scenario c1, characterized by 36% trees, 27% water body, and 21% granite pavement, is an optimal scheme for summertime. The results of this case can be summarized:
  • The model presented a high correlation between measured and simulated results, with the RMSE value 0.98 °C for Ta and 5.8 °C for MRT;
  • The average air temperature and mean radiant temperature were decreased by 0.5 °C and 22 °C respectively by water body compound with trees on the hottest day of the year;
  • According to PET results, the cooling benefits from water body with tree cover in urban areas have a positive effect on human thermal comfort levels from “hot” to “comfortable” sensation in the hottest day of summertime;
  • Based on PET index, numerically expressed by 37.5 °C (c4: without all trees and water body) to 23 °C (c1: current situation including all trees and water body) which is around to the comfort zone in the hottest day.
These results will help urban designers and policymakers to think more creative and bring the concept of sustainability to using cool surfaces, especially water surface, in conjunction with planting trees which has important potential to help offset projected warming from climate change.

5. Conclusions

Numerous studies have demonstrated the benefits of the tree cover and cool surfaces in urban environments, through reducing solar radiation, creating a microclimate in urban spaces, mitigating the impact of urban heat islands, and overall improving the urban landscape. In this research, the effect of water body with trees on microclimate and human thermal comfort in an urban park in Tabriz have been investigated. Numerical simulations were performed by the micro-meteorological model ENVI-met, validated for Ta and MRT data, on four different scenarios. Results showed that, although water body increases the humidity it also decreases air temperature, which has positive effect on thermal comfort particularly in combination with trees. In summary, the average daily air temperature and MRT were decreased by 0.5 °C and 22 °C, respectively. Therefore, PET reached 23 °C, which is around the comfort zone on the hottest day.
Results of this study illustrate that using systematical principles from water body and tree-planting in urban areas can be an effective strategy for cooling urban temperature and improving human thermal comfort conditions, and can provide design recommendations and guidelines for urban designers and policymakers.

Author Contributions

Conceptualization, S.T.; methodology, S.T. and R.D.B.; software, S.T.; formal analysis, S.T. and E.G.; investigation, S.T., E.G., D.L. and R.D.B.; data curation, S.T., E.G., D.L. and R.D.B.; Writing—original draft, S.T.; Writing—review and editing, E.G., D.L. and R.D.B.; project administration, R.D.B. All authors have read and agreed to the published version of the manuscript.

Funding

This research received no external funding.

Institutional Review Board Statement

Not applicable.

Informed Consent Statement

Not applicable.

Data Availability Statement

Not applicable.

Conflicts of Interest

The authors declare no conflict of interest.

Abbreviations

PETPhysiological equivalent thermometer
PMVPredicted Mean Vote
SETStandard Effective Temperature
UTCIUniversal Thermal Climate Index
HVACHeating, ventilation, and air conditioning
HTCHuman Thermal Comfort
hPaHectopascal (100 × 1 Pascal)
kgkilogram
RMSERoot Mean Square Error
CCCorrelation Coefficient
TaAir Temperature
RHRelative Humidity
MRTMean Radiant Temperature
°CCelsius degree
m/sMeter/second
UHIUrban Heat Island
HMSsHeat Mitigation Strategies
CFDComputational Fluid Dynamic
LADLeaf Area Density

References

  1. Population Reference B. Available online: https://www.prb.org/ (accessed on 30 September 2019).
  2. Kotharkar, R.; Bagade, A.; Ramesh, A. Assessing urban drivers of canopy layer urban heat island: A numerical modeling approach. Landsc. Urban Plan. 2019, 190, 103586. [Google Scholar] [CrossRef]
  3. Yu, Z.; Yang, G.; Zuo, S.; Jørgensen, G.; Koga, M.; Vejre, H. Critical review on the cooling effect of urban blue-green space: A threshold-size perspective. Urban For. Urban Green. 2020, 49, 126630. [Google Scholar] [CrossRef]
  4. Mills, G. Urban climatology and urban design. In Proceedings of the 15th International Congress of Biometeorology and International Conference on Urban Climatology, Yokohama, Japan, 29 June 1999. [Google Scholar]
  5. Lai, D.; Liu, W.; Gan, T.; Liu, K.; Chen, Q. A review of mitigating strategies to improve the thermal environment and thermal comfort in urban outdoor spaces. Sci. Total Environ. 2019, 661, 337–353. [Google Scholar] [CrossRef] [PubMed]
  6. Ahmed, K.S. Comfort in urban spaces: Defining the boundaries of outdoor thermal comfort for the tropical urban environments. Energy Build. 2003, 35, 103–110. [Google Scholar] [CrossRef]
  7. Cheng, V.; Ng, E.; Chan, C.; Givoni, B. Outdoor thermal comfort study in a sub-tropical climate: A longitudinal study based in Hong Kong. Int. J. Biometeorol. 2011, 56, 43–56. [Google Scholar] [CrossRef]
  8. Lau, K.K.-L.; Chung, S.C.; Ren, C. Outdoor thermal comfort in different urban settings of sub-tropical high-density cities: An approach of adopting local climate zone (LCZ) classification. Build. Environ. 2019, 154, 227–238. [Google Scholar] [CrossRef]
  9. Kong, L.; Lau, K.K.-L.; Yuan, C.; Chen, Y.; Xu, Y.; Ren, C.; Ng, E.Y.Y. Regulation of outdoor thermal comfort by trees in Hong Kong. Sustain. Cities Soc. 2017, 31, 12–25. [Google Scholar] [CrossRef]
  10. Makaremi, N.; Salleh, E.; Jaafar, M.Z.; GhaffarianHoseini, A. Thermal comfort conditions of shaded outdoor spaces in hot and humid climate of Malaysia. Build. Environ. 2012, 48, 7–14. [Google Scholar] [CrossRef]
  11. Johansson, E.; Emmanuel, R. The influence of urban design on outdoor thermal comfort in the hot, humid city of Colombo, Sri Lanka. Int. J. Biometeorol. 2006, 51, 119–133. [Google Scholar] [CrossRef]
  12. Hou, H.; Estoque, R.C. Detecting cooling effect of landscape from composition and configuration: An urban heat island study on hangzhou. Urban For. Urban Green. 2020, 53, 126719. [Google Scholar] [CrossRef]
  13. Yang, W.; Wong, N.H.; Jusuf, S.K. Thermal comfort in outdoor urban spaces in Singapore. Build. Environ. 2012, 59, 426–435. [Google Scholar] [CrossRef]
  14. Roth, M.; Lim, V.H. Evaluation of canopy-layer air and mean radiant temperature simulations by a microclimate model over a tropical residential neighbourhood. Build. Environ. 2017, 112, 177–189. [Google Scholar] [CrossRef]
  15. Koc, C.B.; Osmond, P.; Peters, A. Evaluating the cooling effects of green infrastructure: A systematic review of methods, indicators and data sources. Sol. Energy 2018, 166, 486–508. [Google Scholar] [CrossRef]
  16. Yan, C.; Guo, Q.; Li, H.; Li, L.; Qiu, G.Y. Quantifying the cooling effect of urban vegetation by mobile traverse method: A local-scale urban heat island study in a subtropical megacity. Build. Environ. 2020, 169, 106541. [Google Scholar] [CrossRef]
  17. Bowler, D.E.; Buyung-Ali, L.; Knight, T.M.; Pullin, A.S. Urban greening to cool towns and cities: A systematic review of the empirical evidence. Landsc. Urban Plan. 2010, 97, 147–155. [Google Scholar] [CrossRef]
  18. Aboelata, A.; Sodoudi, S. Evaluating the effect of trees on UHI mitigation and reduction of energy usage in different built up areas in Cairo. Build. Environ. 2019, 168, 106490. [Google Scholar] [CrossRef]
  19. Aboelata, A. Vegetation in different street orientations of aspect ratio (H/W 1:1) to mitigate UHI and reduce buildings’ energy in arid climate. Build. Environ. 2020, 172, 106712. [Google Scholar] [CrossRef]
  20. Teshnehdel, S.; Soflaei, F.; Shokouhian, M. Assessment of solar shading performance of courtyard houses in desert climate of Kashan, Iran. Arch. Eng. Des. Manag. 2020, 16, 473–492. [Google Scholar] [CrossRef]
  21. Teshnehdel, S.; Mirnezami, S.; Saber, A.; Pourzangbar, A.; Olabi, A.G. Data-driven and numerical approaches to predict thermal comfort in traditional courtyards. Sustain. Energy Technol. Assess. 2020, 37, 100569. [Google Scholar] [CrossRef]
  22. Colter, K.; Middel, A.C.; Martin, C.A. Effects of natural and artificial shade on human thermal comfort in residential neighborhood parks of Phoenix, Arizona, USA. Urban For. Urban Green. 2019, 44, 126429. [Google Scholar] [CrossRef]
  23. Teshnehdel, S.; Akbari, H.; Di Giuseppe, E.; Brown, R.D. Effect of tree cover and tree species on microclimate and pedestrian comfort in a residential district in Iran. Build. Environ. 2020, 178, 106899. [Google Scholar] [CrossRef]
  24. Aminipouri, M.; Rayner, D.; Lindberg, F.; Thorsson, S.; Knudby, A.J.; Zickfeld, K.; Middel, A.; Krayenhoff, E.S. Urban tree planting to maintain outdoor thermal comfort under climate change: The case of Vancouver’s local climate zones. Build. Environ. 2019, 158, 226–236. [Google Scholar] [CrossRef]
  25. Hami, A.; Abdi, B.; Zarehaghi, D.; Bin Maulan, S. Assessing the thermal comfort effects of green spaces: A systematic review of methods, parameters, and plants’ attributes. Sustain. Cities Soc. 2019, 49, 101634. [Google Scholar] [CrossRef]
  26. Richards, D.R.; Fung, T.K.; Belcher, R.N.; Edwards, P.J. Differential air temperature cooling performance of urban vegetation types in the tropics. Urban For. Urban Green. 2020, 50, 126651. [Google Scholar] [CrossRef]
  27. Deng, J.; Pickles, B.J.; Smith, S.T.; Shao, L. Infrared radiative performance of urban trees: Spatial distribution and interspecific comparison among ten species in the UK by in-situ spectroscopy. Build. Environ. 2020, 172, 106682. [Google Scholar] [CrossRef]
  28. Onishi, A.; Cao, X.; Ito, T.; Shi, F.; Imura, H. Evaluating the potential for urban heat-island mitigation by greening parking lots. Urban For. Urban Green. 2010, 9, 323–332. [Google Scholar] [CrossRef]
  29. Shashua-Bar, L.; Potchter, O.; Bitan, A.; Boltansky, D.; Yaakov, Y. Microclimate modelling of street tree species effects within the varied urban morphology in the Mediterranean city of Tel Aviv, Israel. Int. J. Clim. 2009, 30, 44–57. [Google Scholar] [CrossRef]
  30. Streiling, S.; Matzarakis, A. Influence of Single and Small Clusters of Trees on the Bioclimate of a City: A Case Study. Arboric. Urban For. 2003, 29, 309–316. [Google Scholar] [CrossRef]
  31. Abreu-Harbich, L.V.; Labaki, L.; Matzarakis, A. Thermal bioclimate in idealized urban street canyons in Campinas, Brazil. Arch. Meteorol. Geophys. Bioclimatol. Ser. B 2013, 115, 333–340. [Google Scholar] [CrossRef]
  32. Zhang, L.; Zhan, Q.; Lan, Y. Effects of the tree distribution and species on outdoor environment conditions in a hot summer and cold winter zone: A case study in Wuhan residential quarters. Build. Environ. 2018, 130, 27–39. [Google Scholar] [CrossRef]
  33. Yang, B.; Olofsson, T.; Nair, G.; Kabanshi, A. Outdoor thermal comfort under subarctic climate of north Sweden—A pilot study in Umeå. Sustain. Cities Soc. 2017, 28, 387–397. [Google Scholar] [CrossRef]
  34. Gatto, E.; Buccolieri, R.; Aarrevaara, E.; Ippolito, F.; Emmanuel, R.; Perronace, L.; Santiago, J.L. Impact of urban vegetation on outdoor thermal comfort: Comparison between a mediterranean city (Lecce, Italy) and a northern European city (Lahti, Finland). Forests 2020, 11, 228. [Google Scholar] [CrossRef] [Green Version]
  35. Santamouris, M.; Synnefa, A.; Karlessi, T. Using advanced cool materials in the urban built environment to mitigate heat islands and improve thermal comfort conditions. Sol. Energy 2011, 85, 3085–3102. [Google Scholar] [CrossRef]
  36. Akbari, H.; Pomerantz, M.; Taha, H. Cool surfaces and shade trees to reduce energy use and improve air quality in urban areas. Sol. Energy 2001, 70, 295–310. [Google Scholar] [CrossRef]
  37. Akbari, H.; Menon, S.; Rosenfeld, A. Global cooling: Increasing world-wide urban albedos to offset CO2. Clim. Chang. 2008, 94, 275–286. [Google Scholar] [CrossRef]
  38. Taleghani, M.; Berardi, U. The effect of pavement characteristics on pedestrians’ thermal comfort in Toronto. Urban Clim. 2018, 24, 449–459. [Google Scholar] [CrossRef]
  39. Xu, J.; Wei, Q.; Huang, X.; Zhu, X.; Li, G. Evaluation of human thermal comfort near urban waterbody during summer. Build. Environ. 2010, 45, 1072–1080. [Google Scholar] [CrossRef]
  40. Theeuwes, N.E.; Solcerová, A.; Steeneveld, G.J. Modeling the influence of open water surfaces on the summertime temperature and thermal comfort in the city. J. Geophys. Res. Atmos. 2013, 118, 8881–8896. [Google Scholar] [CrossRef] [Green Version]
  41. Steeneveld, G.; Koopmans, S.; Heusinkveld, B.; Theeuwes, N. Refreshing the role of open water surfaces on mitigating the maximum urban heat island effect. Landsc. Urban Plan. 2014, 121, 92–96. [Google Scholar] [CrossRef]
  42. Ulpiani, G.; Di Giuseppe, E.; Di Perna, C.; D’Orazio, M.; Zinzi, M. Thermal comfort improvement in urban spaces with water spray systems: Field measurements and survey. Build. Environ. 2019, 156, 46–61. [Google Scholar] [CrossRef]
  43. Nishimura, N.; Nomura, T.; Iyota, H.; Kimoto, S. Novel water facilities for creation of comfortable urban micrometeorology. Sol. Energy 1998, 64, 197–207. [Google Scholar] [CrossRef]
  44. Ghiabaklou, Z. Thermal comfort prediction for a new passive cooling system. Build. Environ. 2003, 38, 883–891. [Google Scholar] [CrossRef]
  45. Belarbi, R.; Ghiaus, C.; Allard, F. Modeling of water spray evaporation: Application to passive cooling of buildings. Sol. Energy 2006, 80, 1540–1552. [Google Scholar] [CrossRef]
  46. Fanger, P.O. Thermal Comfort, Analysis and Application in Environmental Engineering; Danish Technical Press: Copenhagen, Denmark, 1972; p. 244. [Google Scholar]
  47. Gagge, A.P. Rational temperature indices of thermal comfort. In Studies in Environmental Science; Elsevier: Amsterdam, The Netherlands, 1981; Volume 10, pp. 79–98. [Google Scholar]
  48. Höppe, P. The physiological equivalent temperature—A universal index for the biometeorological assessment of the thermal environment. Int. J. Biometeorol. 1999, 43, 71–75. [Google Scholar] [CrossRef] [PubMed]
  49. Matzarakis, A.; Mayer, H.; Iziomon, M.G. Applications of a universal thermal index: Physiological equivalent temperature. Int. J. Biometeorol. 1999, 43, 76–84. [Google Scholar] [CrossRef]
  50. Peel, M.C.; Finlayson, B.L.; McMahon, T.A. Updated world map of the Köppen-Geiger climate classification. Hydrol. Earth Syst. Sci. 2007, 11, 1633–1644. [Google Scholar] [CrossRef] [Green Version]
  51. National Geographical Organization. Available online: https://www.ncc.gov.ir/ (accessed on 15 December 2021).
  52. Meteorological Organization. Available online: http://www.irimo.ir/eng/index.php (accessed on 4 June 2019).
  53. Matzarakis, A.; Rutz, F.; Mayer, H. Modelling radiation fluxes in simple and complex environments—Application of the RayMan model. Int. J. Biometeorol. 2007, 51, 323–334. [Google Scholar] [CrossRef]
  54. ISO. Ergonomics of the Thermal Environment-Instruments for Measuring Physical Quantities; Int Stand Organ: Geneva, Switzerland, 1998; p. 39. [Google Scholar]
  55. Tan, Z.; Lau, K.K.-L.; Ng, E.Y.Y. Urban tree design approaches for mitigating daytime urban heat island effects in a high-density urban environment. Energy Build. 2016, 114, 265–274. [Google Scholar] [CrossRef]
  56. Wang, Y.; Akbari, H. The effects of street tree planting on Urban Heat Island mitigation in Montreal. Sustain. Cities Soc. 2016, 27, 122–128. [Google Scholar] [CrossRef]
  57. Krayenhoff, E.S.; Jiang, T.; Christen, A.; Martilli, A.; Oke, T.R.; Bailey, B.; Nazarian, N.; Voogt, J.A.; Giometto, M.; Stastny, A.; et al. A multi-layer urban canopy meteorological model with trees (BEP-Tree): Street tree impacts on pedestrian-level climate. Urban Clim. 2020, 32, 100590. [Google Scholar] [CrossRef]
  58. Yang, Y.; Gatto, E.; Gao, Z.; Buccolieri, R.; Morakinyo, T.E.; Lan, H. The “plant evaluation model” for the assessment of the impact of vegetation on outdoor microclimate in the urban environment. Build. Environ. 2019, 159, 106151. [Google Scholar] [CrossRef]
  59. Lee, H.; Mayer, H.; Chen, L. Contribution of trees and grasslands to the mitigation of human heat stress in a residential district of Freiburg, Southwest Germany. Landsc. Urban Plan. 2016, 148, 37–50. [Google Scholar] [CrossRef]
  60. Lobaccaro, G.; Acero, J.A. Comparative analysis of green actions to improve outdoor thermal comfort inside typical urban street canyons. Urban Clim. 2015, 14, 251–267. [Google Scholar] [CrossRef]
  61. Zölch, T.; Rahman, M.A.; Pfleiderer, E.; Wagner, G.; Pauleit, S. Designing public squares with green infrastructure to optimize human thermal comfort. Build. Environ. 2018, 149, 640–654. [Google Scholar] [CrossRef]
  62. Farhadi, H.; Faizi, M.; Sanaieian, H. Mitigating the urban heat island in a residential area in Tehran: Investigating the role of vegetation, materials, and orientation of buildings. Sustain. Cities Soc. 2019, 46, 101448. [Google Scholar] [CrossRef]
  63. Jänicke, B.; Meier, F.; Hoelscher, M.-T.; Scherer, D. Evaluating the effects of façade greening on human bioclimate in a complex urban environment. Adv. Meteorol. 2015, 2015, 1–15. [Google Scholar] [CrossRef]
  64. Forouzandeh, A. Numerical modeling validation for the microclimate thermal condition of semi-closed courtyard spaces between buildings. Sustain. Cities Soc. 2018, 36, 327–345. [Google Scholar] [CrossRef]
  65. Salata, F.; Golasi, I.; de Lieto Vollaro, R.; de Lieto Vollaro, A. Urban microclimate and outdoor thermal comfort. A proper procedure to fit ENVI-met simulation outputs to experimental data. Sustain. Cities Soc. 2016, 26, 318–343. [Google Scholar] [CrossRef]
  66. Tsoka, S.; Tsikaloudaki, K.; Theodosiou, T. Analyzing the ENVI-met microclimate model’s performance and assessing cool materials and urban vegetation applications—A review. Sustain. Cities Soc. 2018, 43, 55–76. [Google Scholar] [CrossRef]
  67. Zhang, J.; Gou, Z. Tree crowns and their associated summertime microclimatic adjustment and thermal comfort improvement in urban parks in a subtropical city of China. Urban For. Urban Green. 2020, 59, 126912. [Google Scholar] [CrossRef]
Figure 1. Iran map of Koppen climate classification (a) [50], location of the studied site in Tabriz map (b) [51], measurement points on the site of El-Golu park (c).
Land 11 00431 g001
Figure 2. Monthly minimum/mean/maximum air temperature and precipitation in Tabriz, Iran [52].
Land 11 00431 g002
Figure 3. A view of three different trees planted in El-Golu park (trees exemplary dimensions in red).
Land 11 00431 g003
Figure 4. Representation of different simulation scenarios on ENVI-met.
Land 11 00431 g004
Figure 5. Relationship between ENVI-met simulated and measured data of Ta MRT (09:00–17:00 local time, 28 July year 2019).
Land 11 00431 g005
Figure 6. Simulated air temperature values at a height of 1.5 m agl averaged for all scenarios at an urban park in Tabriz on the 28 July 2019 at 14:00 in local time.
Land 11 00431 g006
Figure 7. Average air temperature values at the site (1.5 m agl) in all scenarios: (a) during on the hottest day of the year; (b) relative humidity; (c) wind speed; and (d) mean radiant temperature.
Land 11 00431 g007aLand 11 00431 g007b
Figure 8. Average of PET values at the site (1.5 m agl) in all scenarios, during on the hottest day of the year.
Land 11 00431 g008
Table 1. Categorization PET level for different thermal perception.
Thermal PerceptionPET
Very cold (Extreme cold stress)<4
Cold (Strong cold stress)4–8
Cool (Moderate cold stress)8–13
Slightly cold (Slight cold stress)13–18
Comfortable (Neutral)18–23
Slightly warm (Slight heat stress)23–29
Warm (Moderate heat stress)29–35
Hot (Strong heat stress)35–41
Very hot (Extreme heat stress)>41
Table 2. The conditions used in the configuration file.
Simulations inputTabriz
(38°8′ N 48°15′ E)
Simulation day28 July 2019
Meteorological data
Ta at 1.5 m (°C)32.2
RH at 1.5 m (%)28.3
Wind Speed (m/s)6.7
Wind Direction (degree from N)188
Cloud coverage0.0
Soil data
Initial temperature (°C) upper layer (0–20 cm)33.1
Initial temperature (°C) middle layer (20–50 cm)33.1
Initial temperature (°C) deep layer (below 50 cm)32.4
Relative humidity (%) upper layer (0–20 cm)24.0
Relative humidity (%) middle layer (20–50 cm)22.4
Relative humidity (%)deep layer (below 50 cm)20.8
Asphalt Albedo0.15
Granite Pavement Gray Albedo0.20
Water Albedo0.05
Building inputs
Wall (Brick) Albedo0.30
Roof Albedo0.20
Trees informationTable 3
Table 3. Profile alternatives offered to trees.
Crown geometrySimulation Trees Scenarios
Land 11 00431 i001 Land 11 00431 i002 Land 11 00431 i003
Trees speciesConiferous tree (Pine)Deciduous tree (Poplar)Deciduous tree (Beech)
Height101510
Diameter557
Albedo0.180.30.2
LAD (July)1.01.01.0
Number of trees28214175
Table 4. Specifications, number and species of trees in each of the cases studied.
Simulation of Land UseCurrent Scenario (Case 1)No Vegetation Scenario (Case 2)No Water Body Scenario (Case 3)Soil and Granite Scenario (Case 4)
Water surface27%27%-0%
Asphalt surface13%13%13%13%
Building3%3%3%3%
Granite pavement21%21%48%48%
Soil-36%-36%
Overall area of tree cover36%-36%-
Table 5. Measuring instrument, specifications and technical data of instruments.
Sensor TypeVariableMeasuring RangeAccuracyOutput ResolutionMeasuring Rate
Testo 480Ta−10 to +50 °C±0.5 °C0.1 °C1 min
Testo 480RH0 to 100%RH±2.5%RH (5 to 95%RH)0.1%RH1 min
Testo 480, Globe probe 0602 0743 (D = 150 mm)Black globe temperature0 to +120 °C22 °C, ±1 digitOutput Resolution1 min
Table 6. Average PET changes in summer.
09:0010:0011:0012:0013:0014:0015:0016:0017:00
Case 114.318.621.724.528.131.631.725.518.2
Case 224.32830.531.633.443.54740.934.9
Case 315.720.323.327.331.335.239.228.120.1
Case 426.531.433.535.139.546.849.440.437.9
Publisher’s Note: MDPI stays neutral with regard to jurisdictional claims in published maps and institutional affiliations.

