
Comparison of Impervious Surface Dynamics through Vegetation/High-Albedo/Low-Albedo/Soil Model and Socio-Economic Factors


Abstract
:1. Introduction
2. Materials and Methods
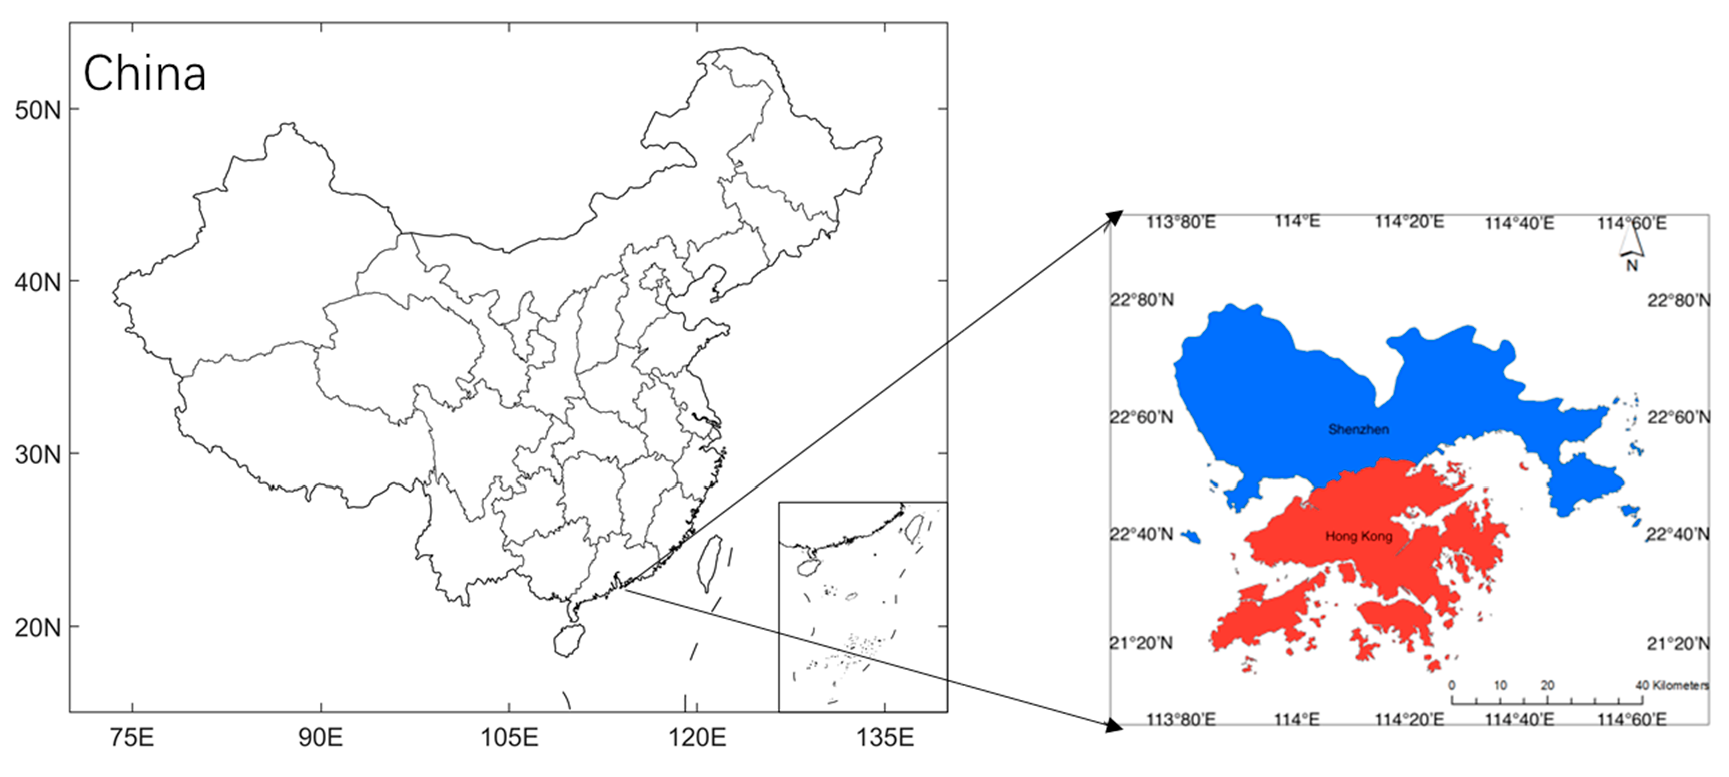
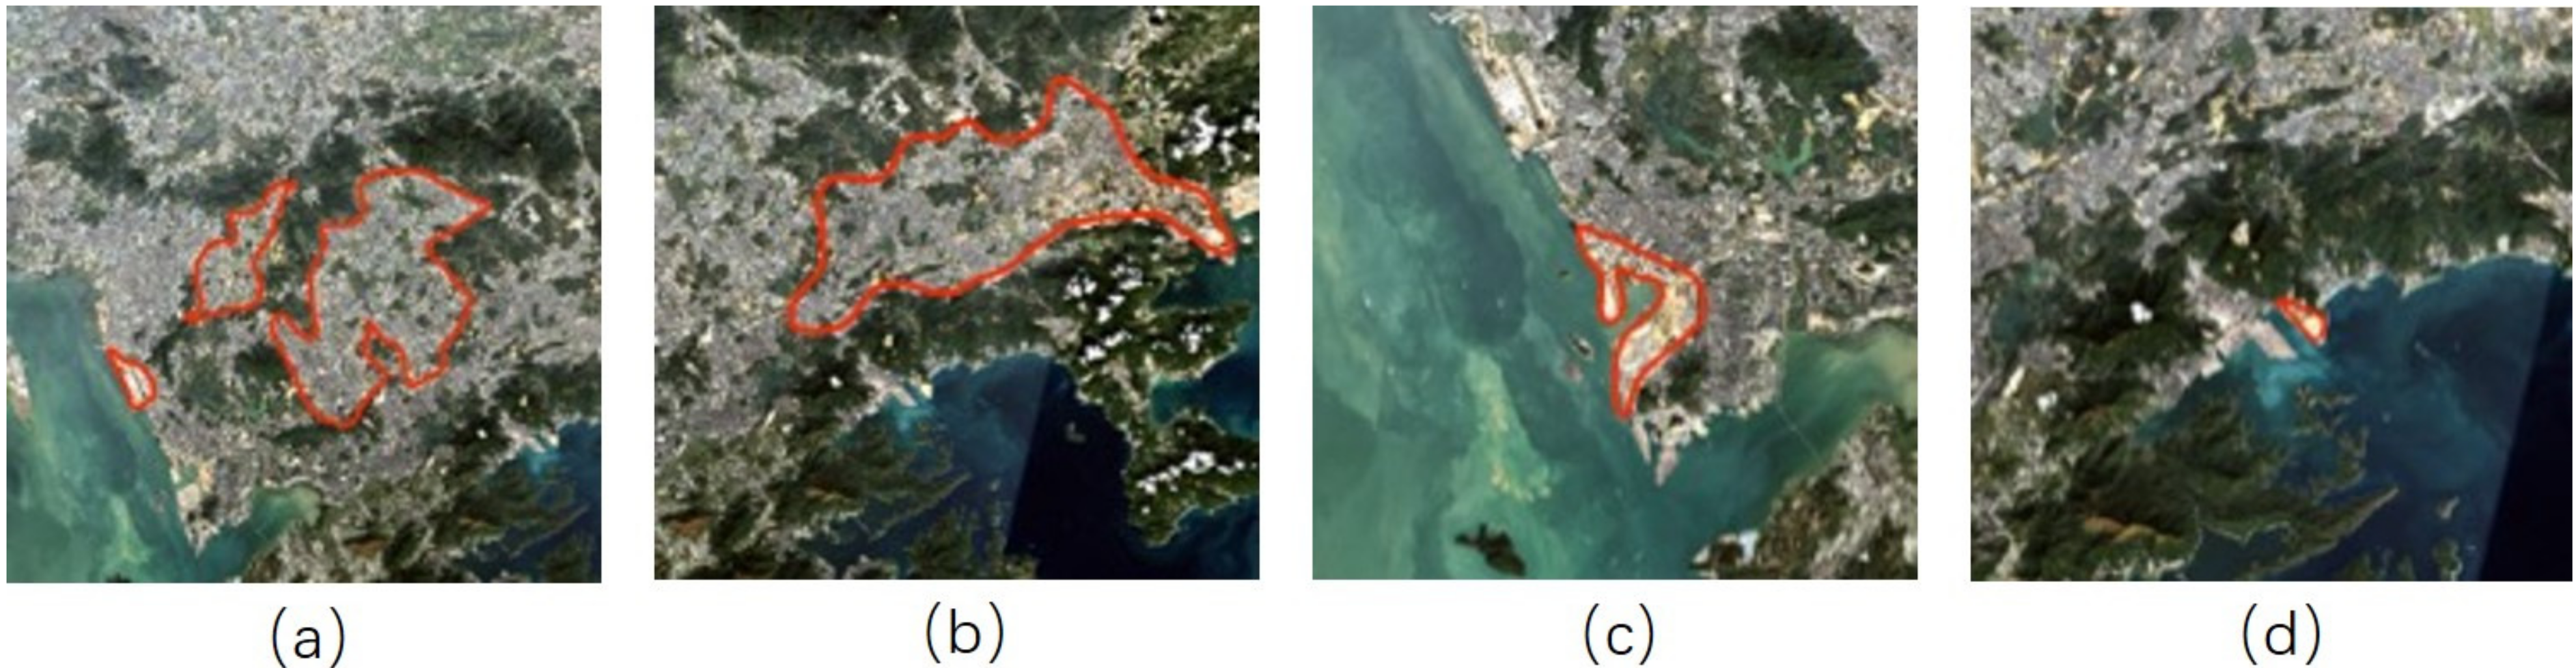
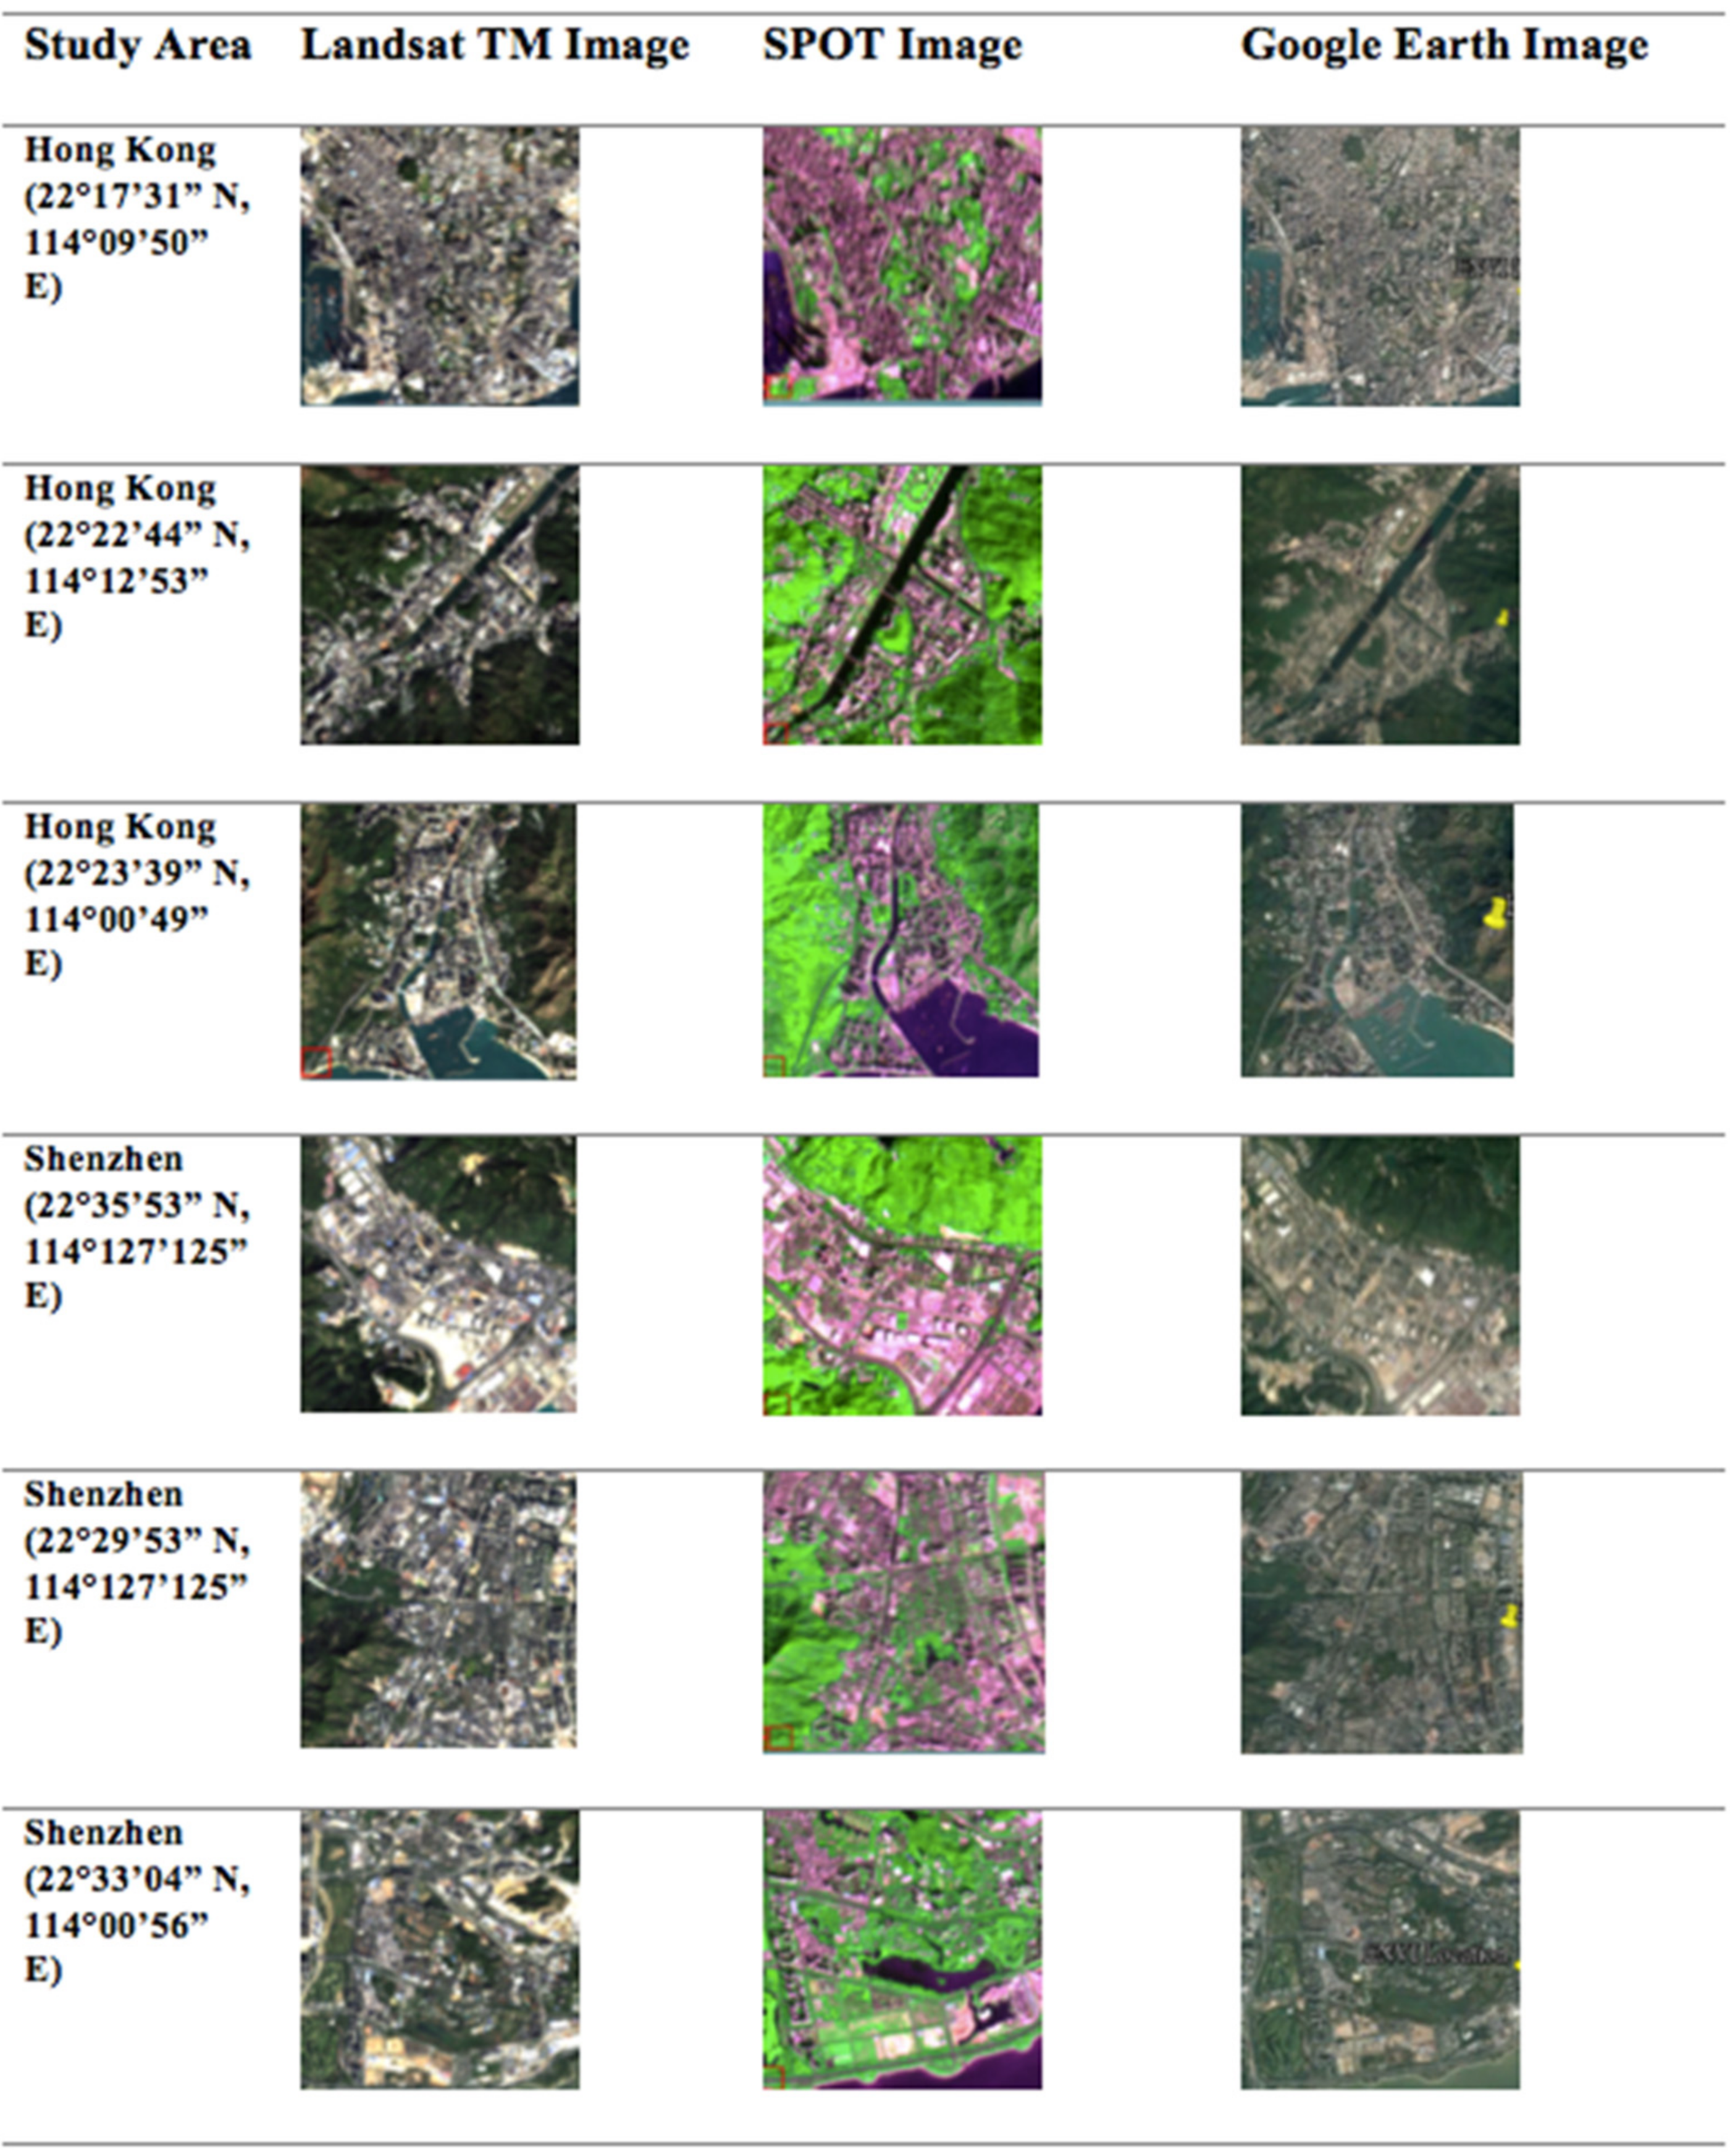
2.1. Study Area
2.1.1. Hong Kong
2.1.2. Shenzhen
2.2. Data Sets
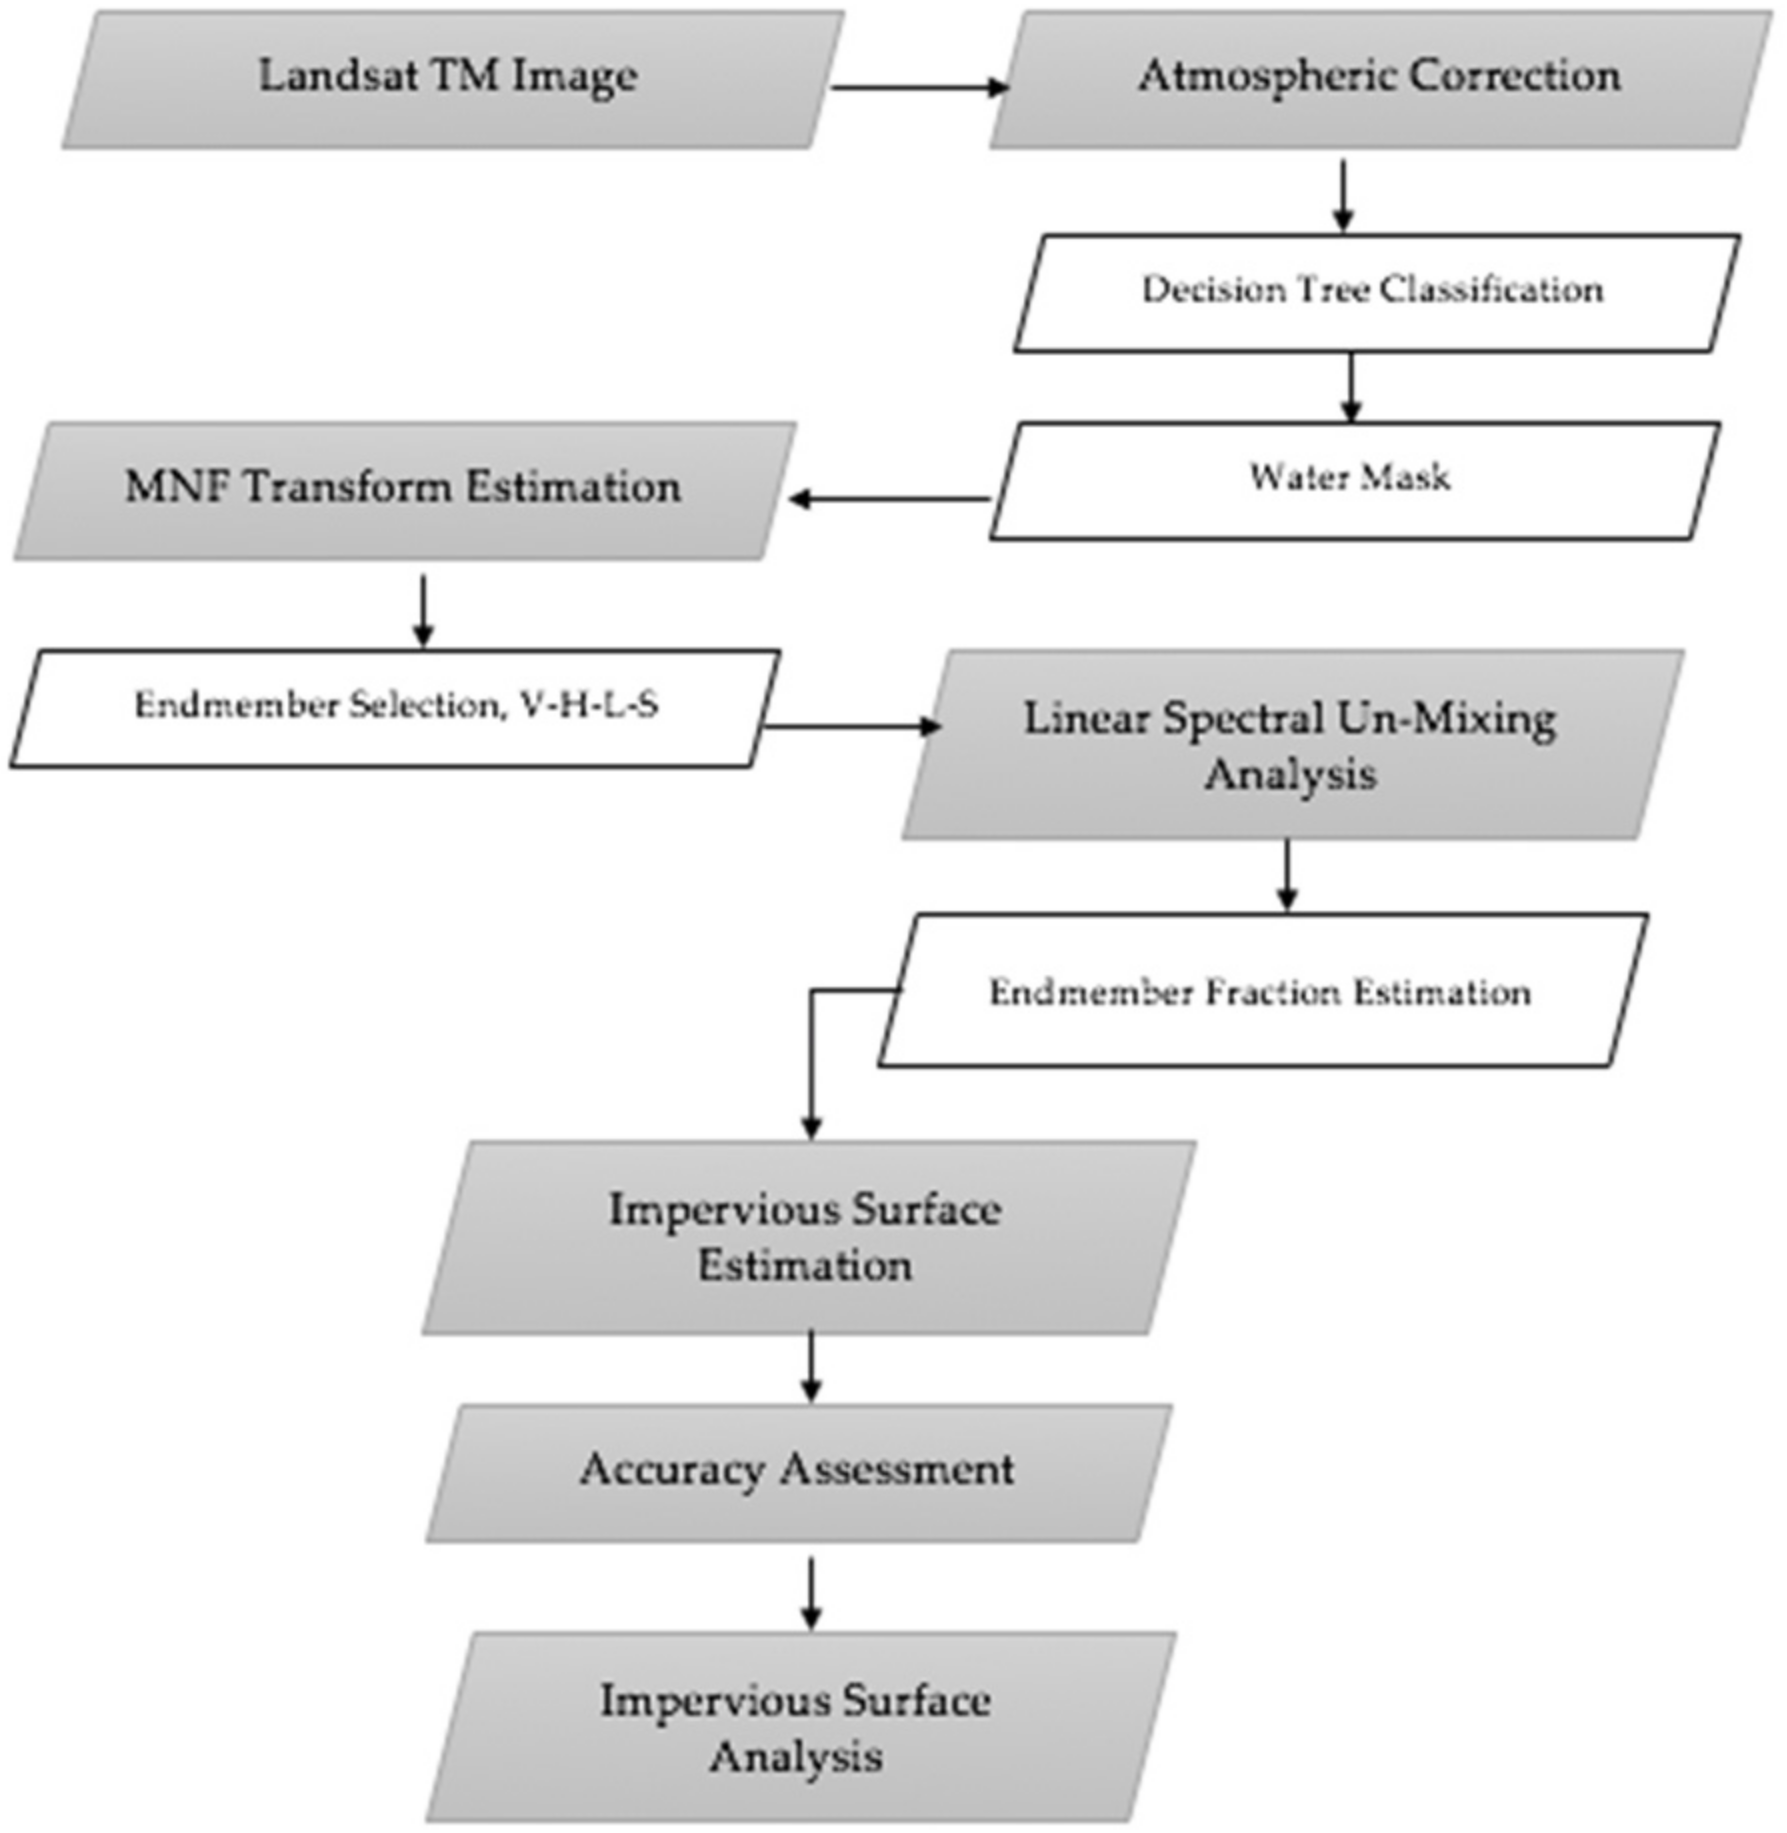
2.3. Methodology
2.3.1. Linear Spectral Mixture Analysis
2.3.2. Accuracy Assessment
3. Results
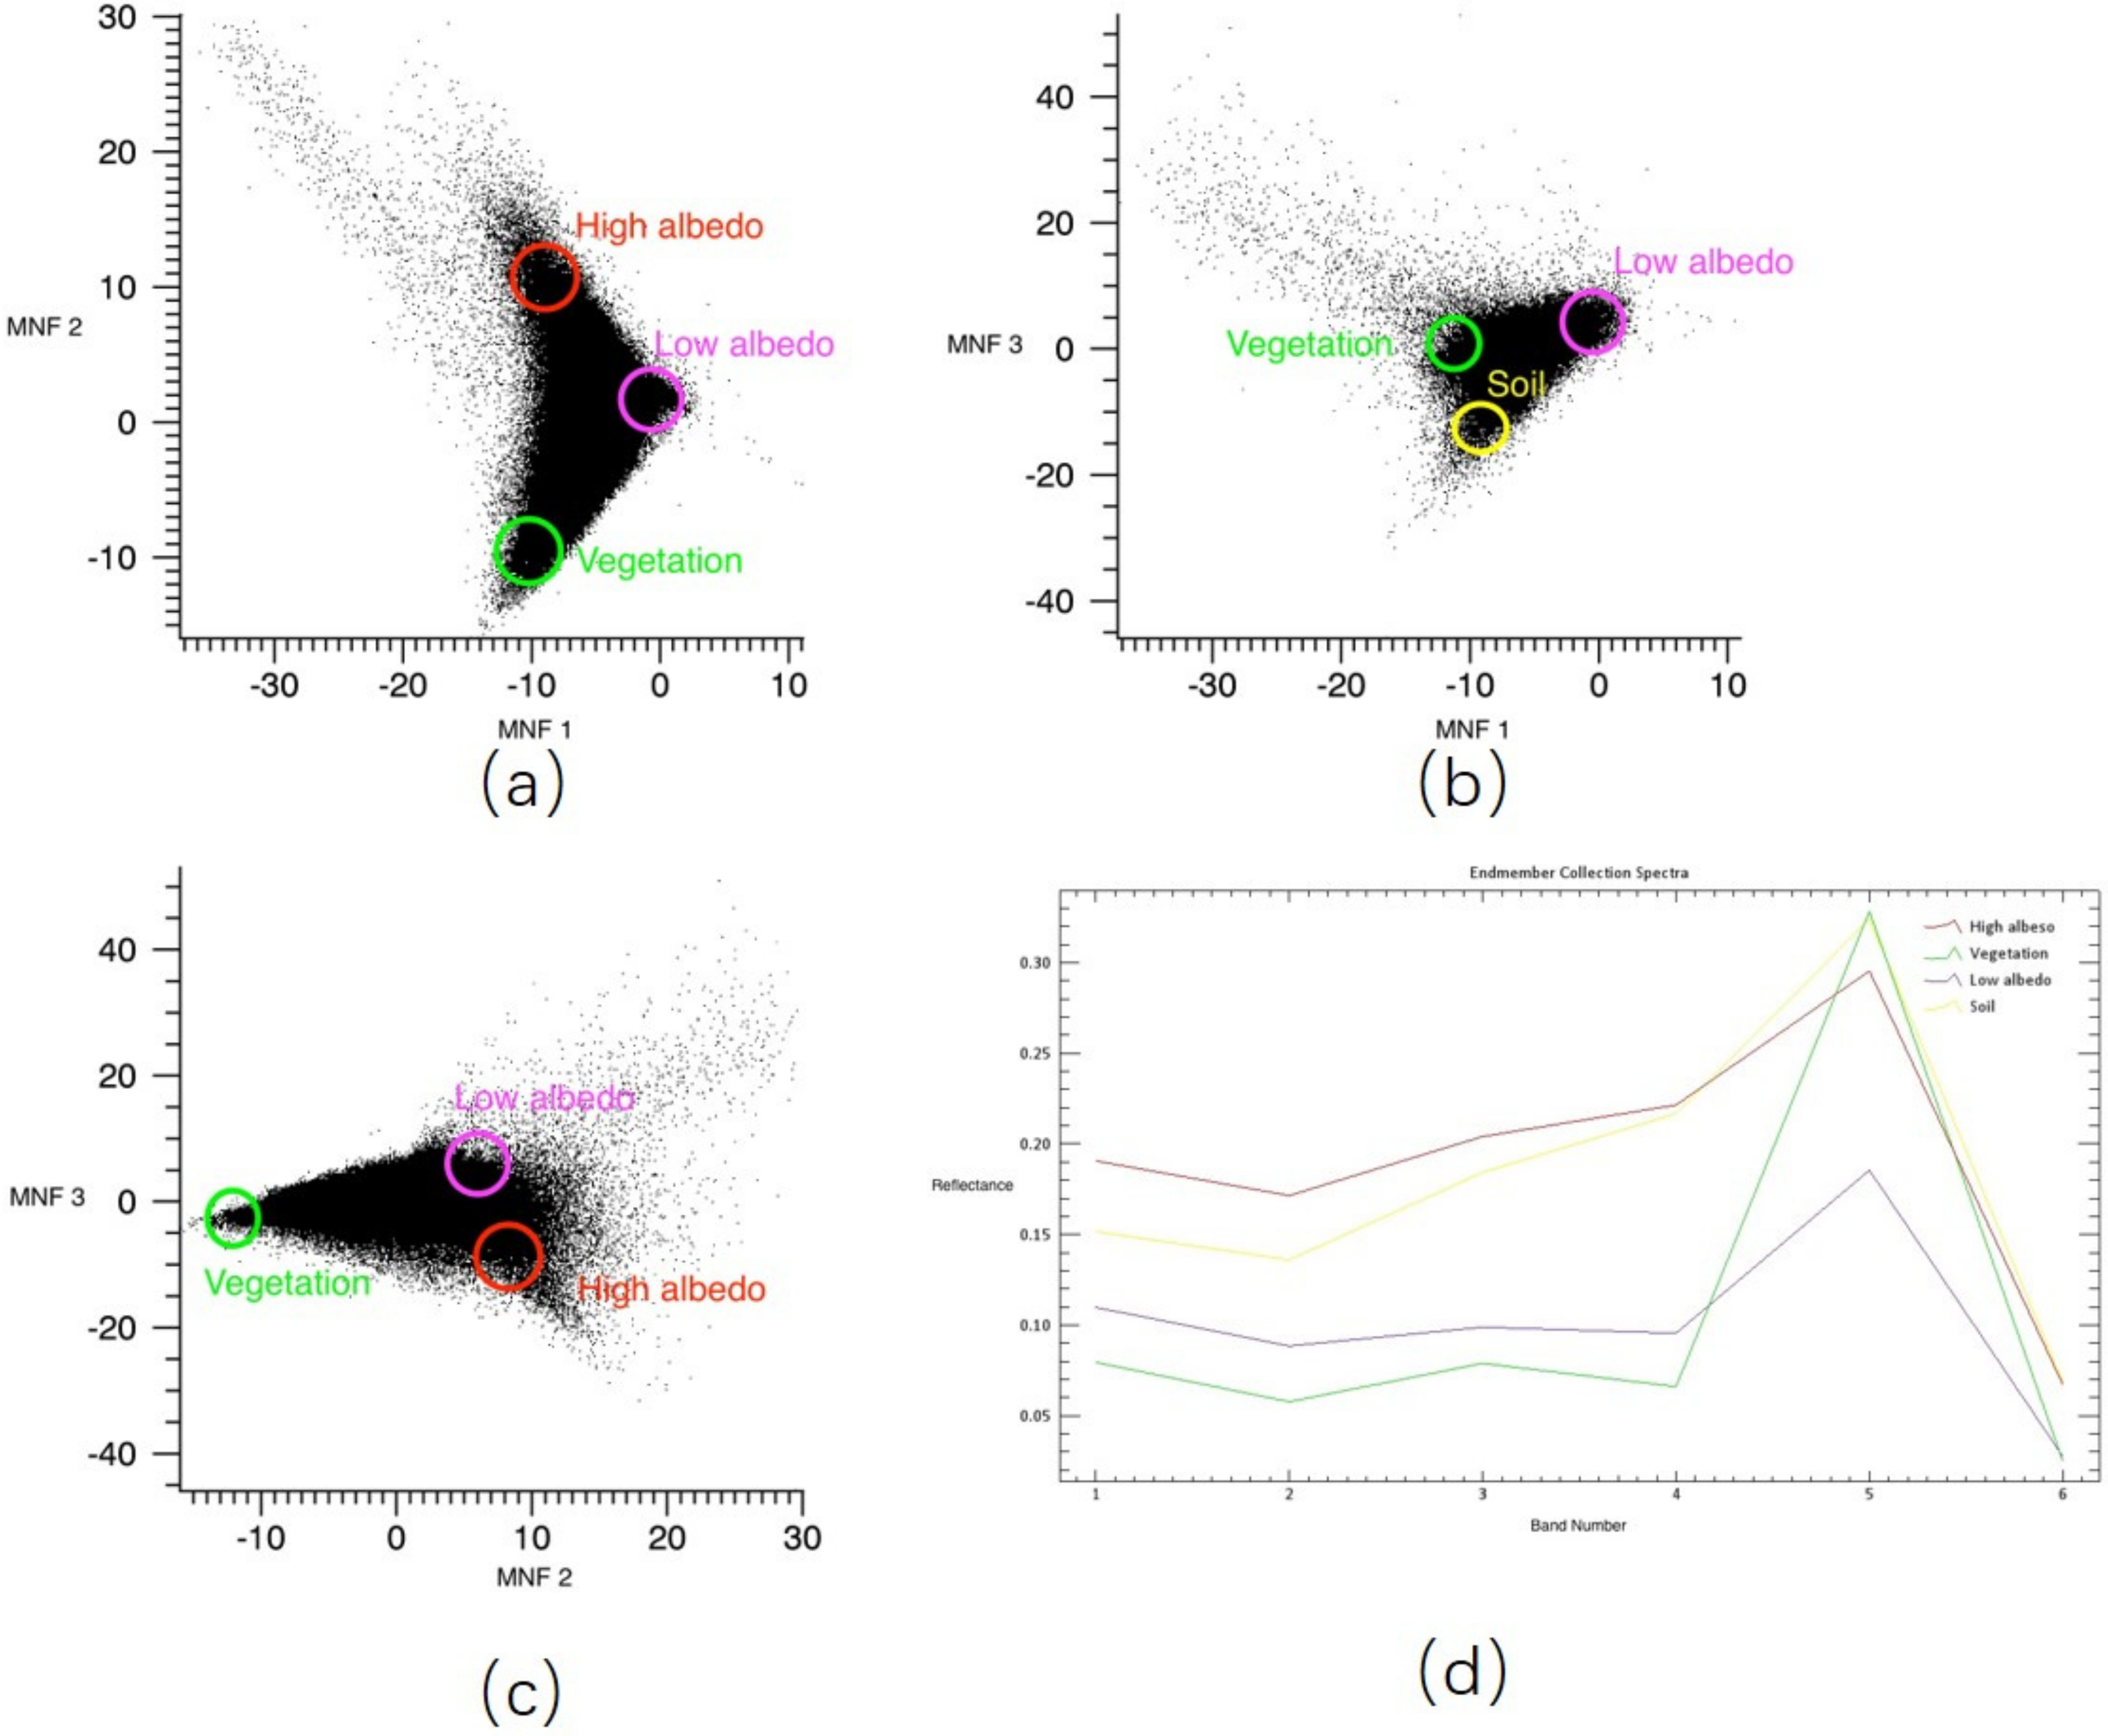
3.1. Minimum Noise Fraction
3.2. Endmenber Selection
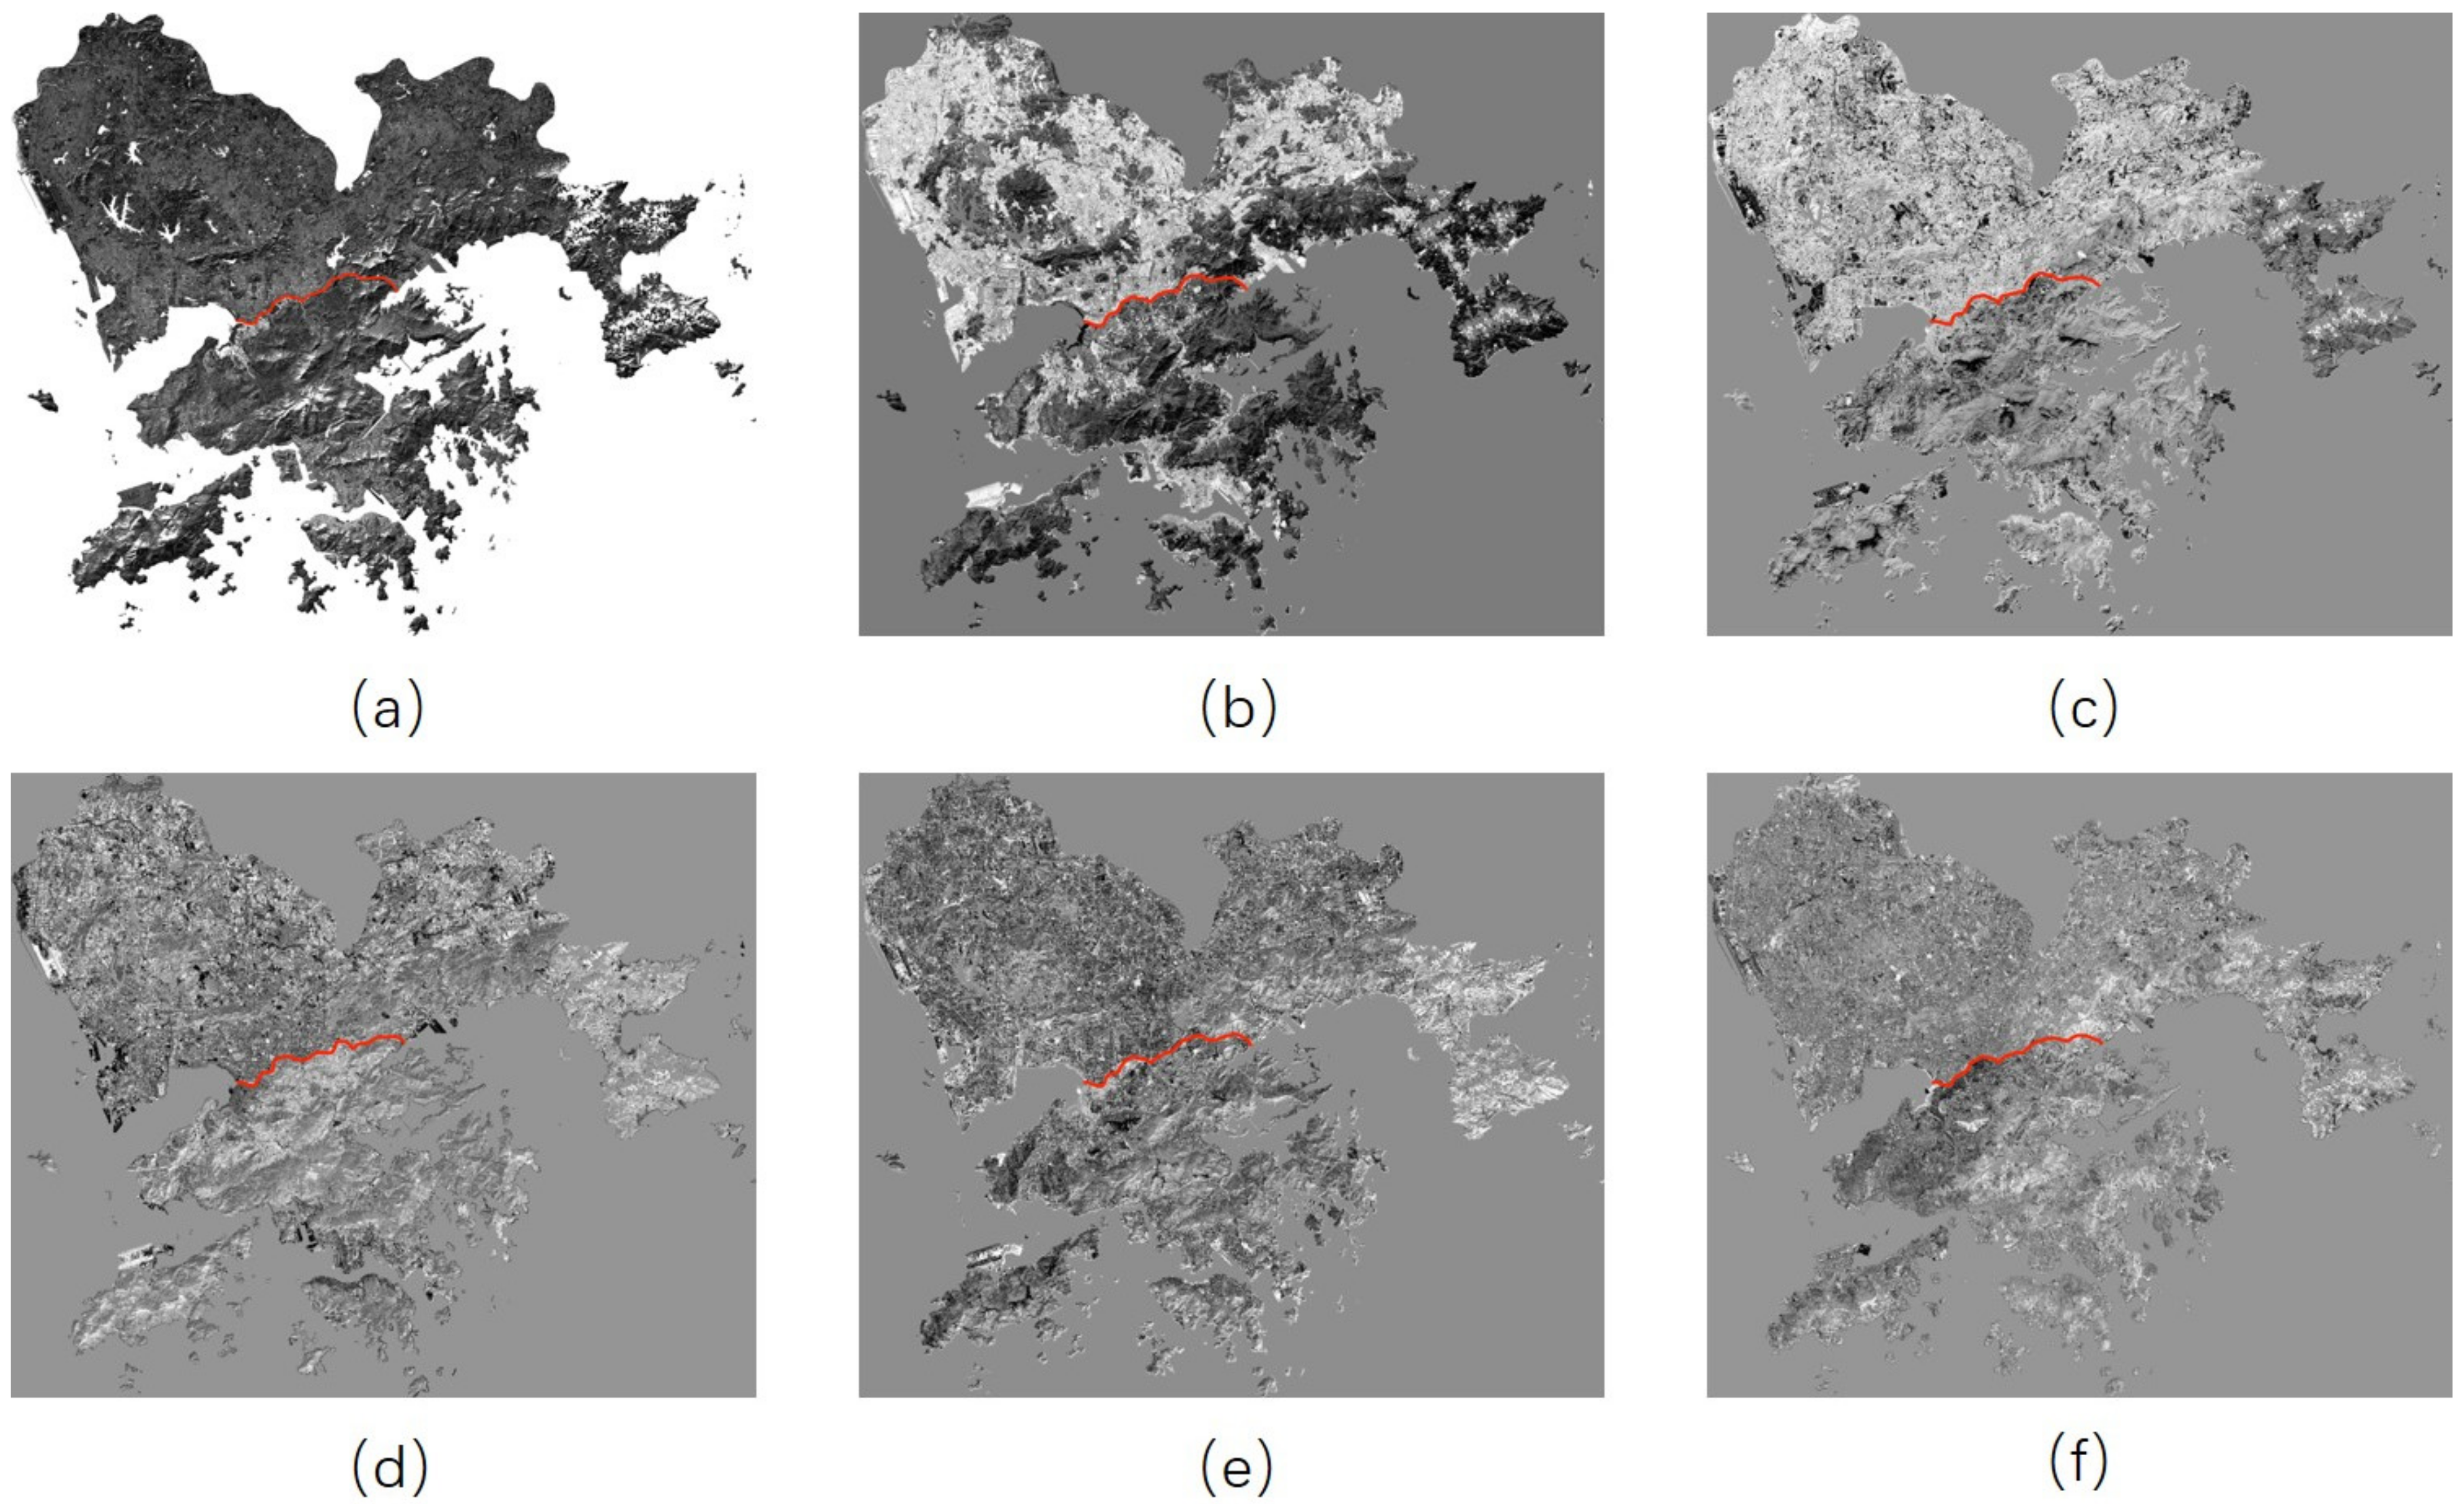
3.3. Linear Spectral Un-Mixing
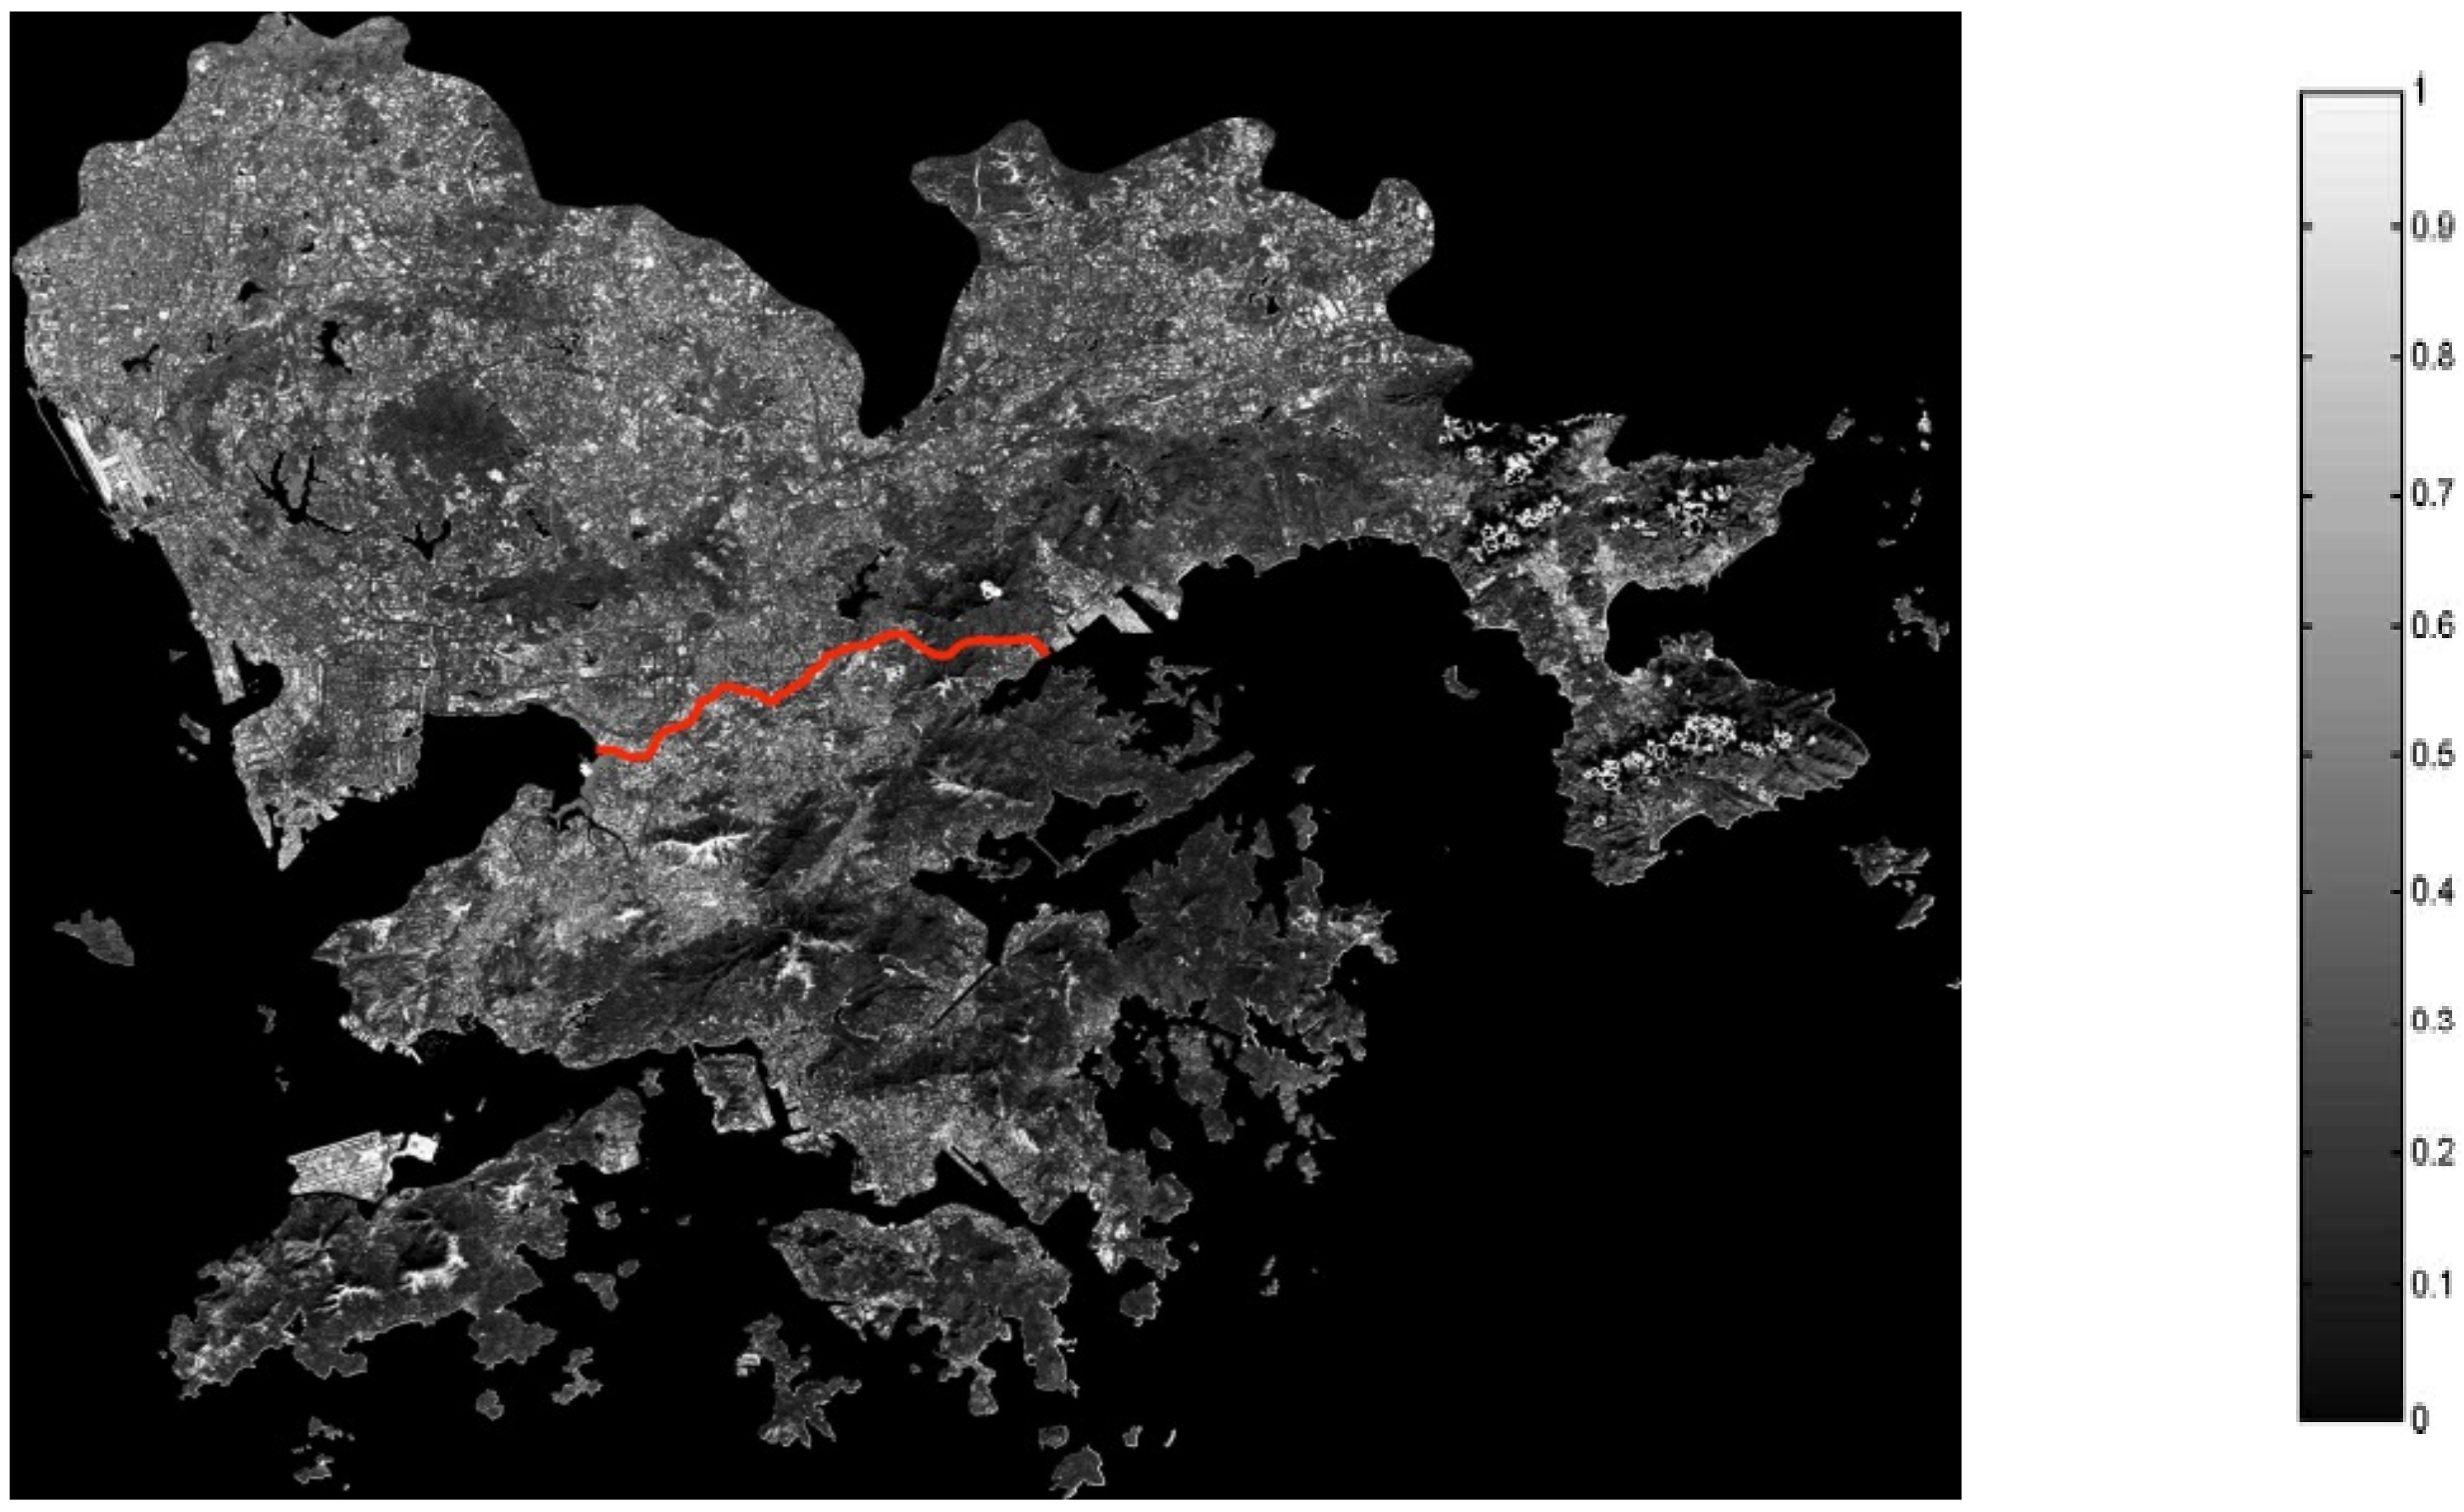
3.4. Impervious Surface Estimation
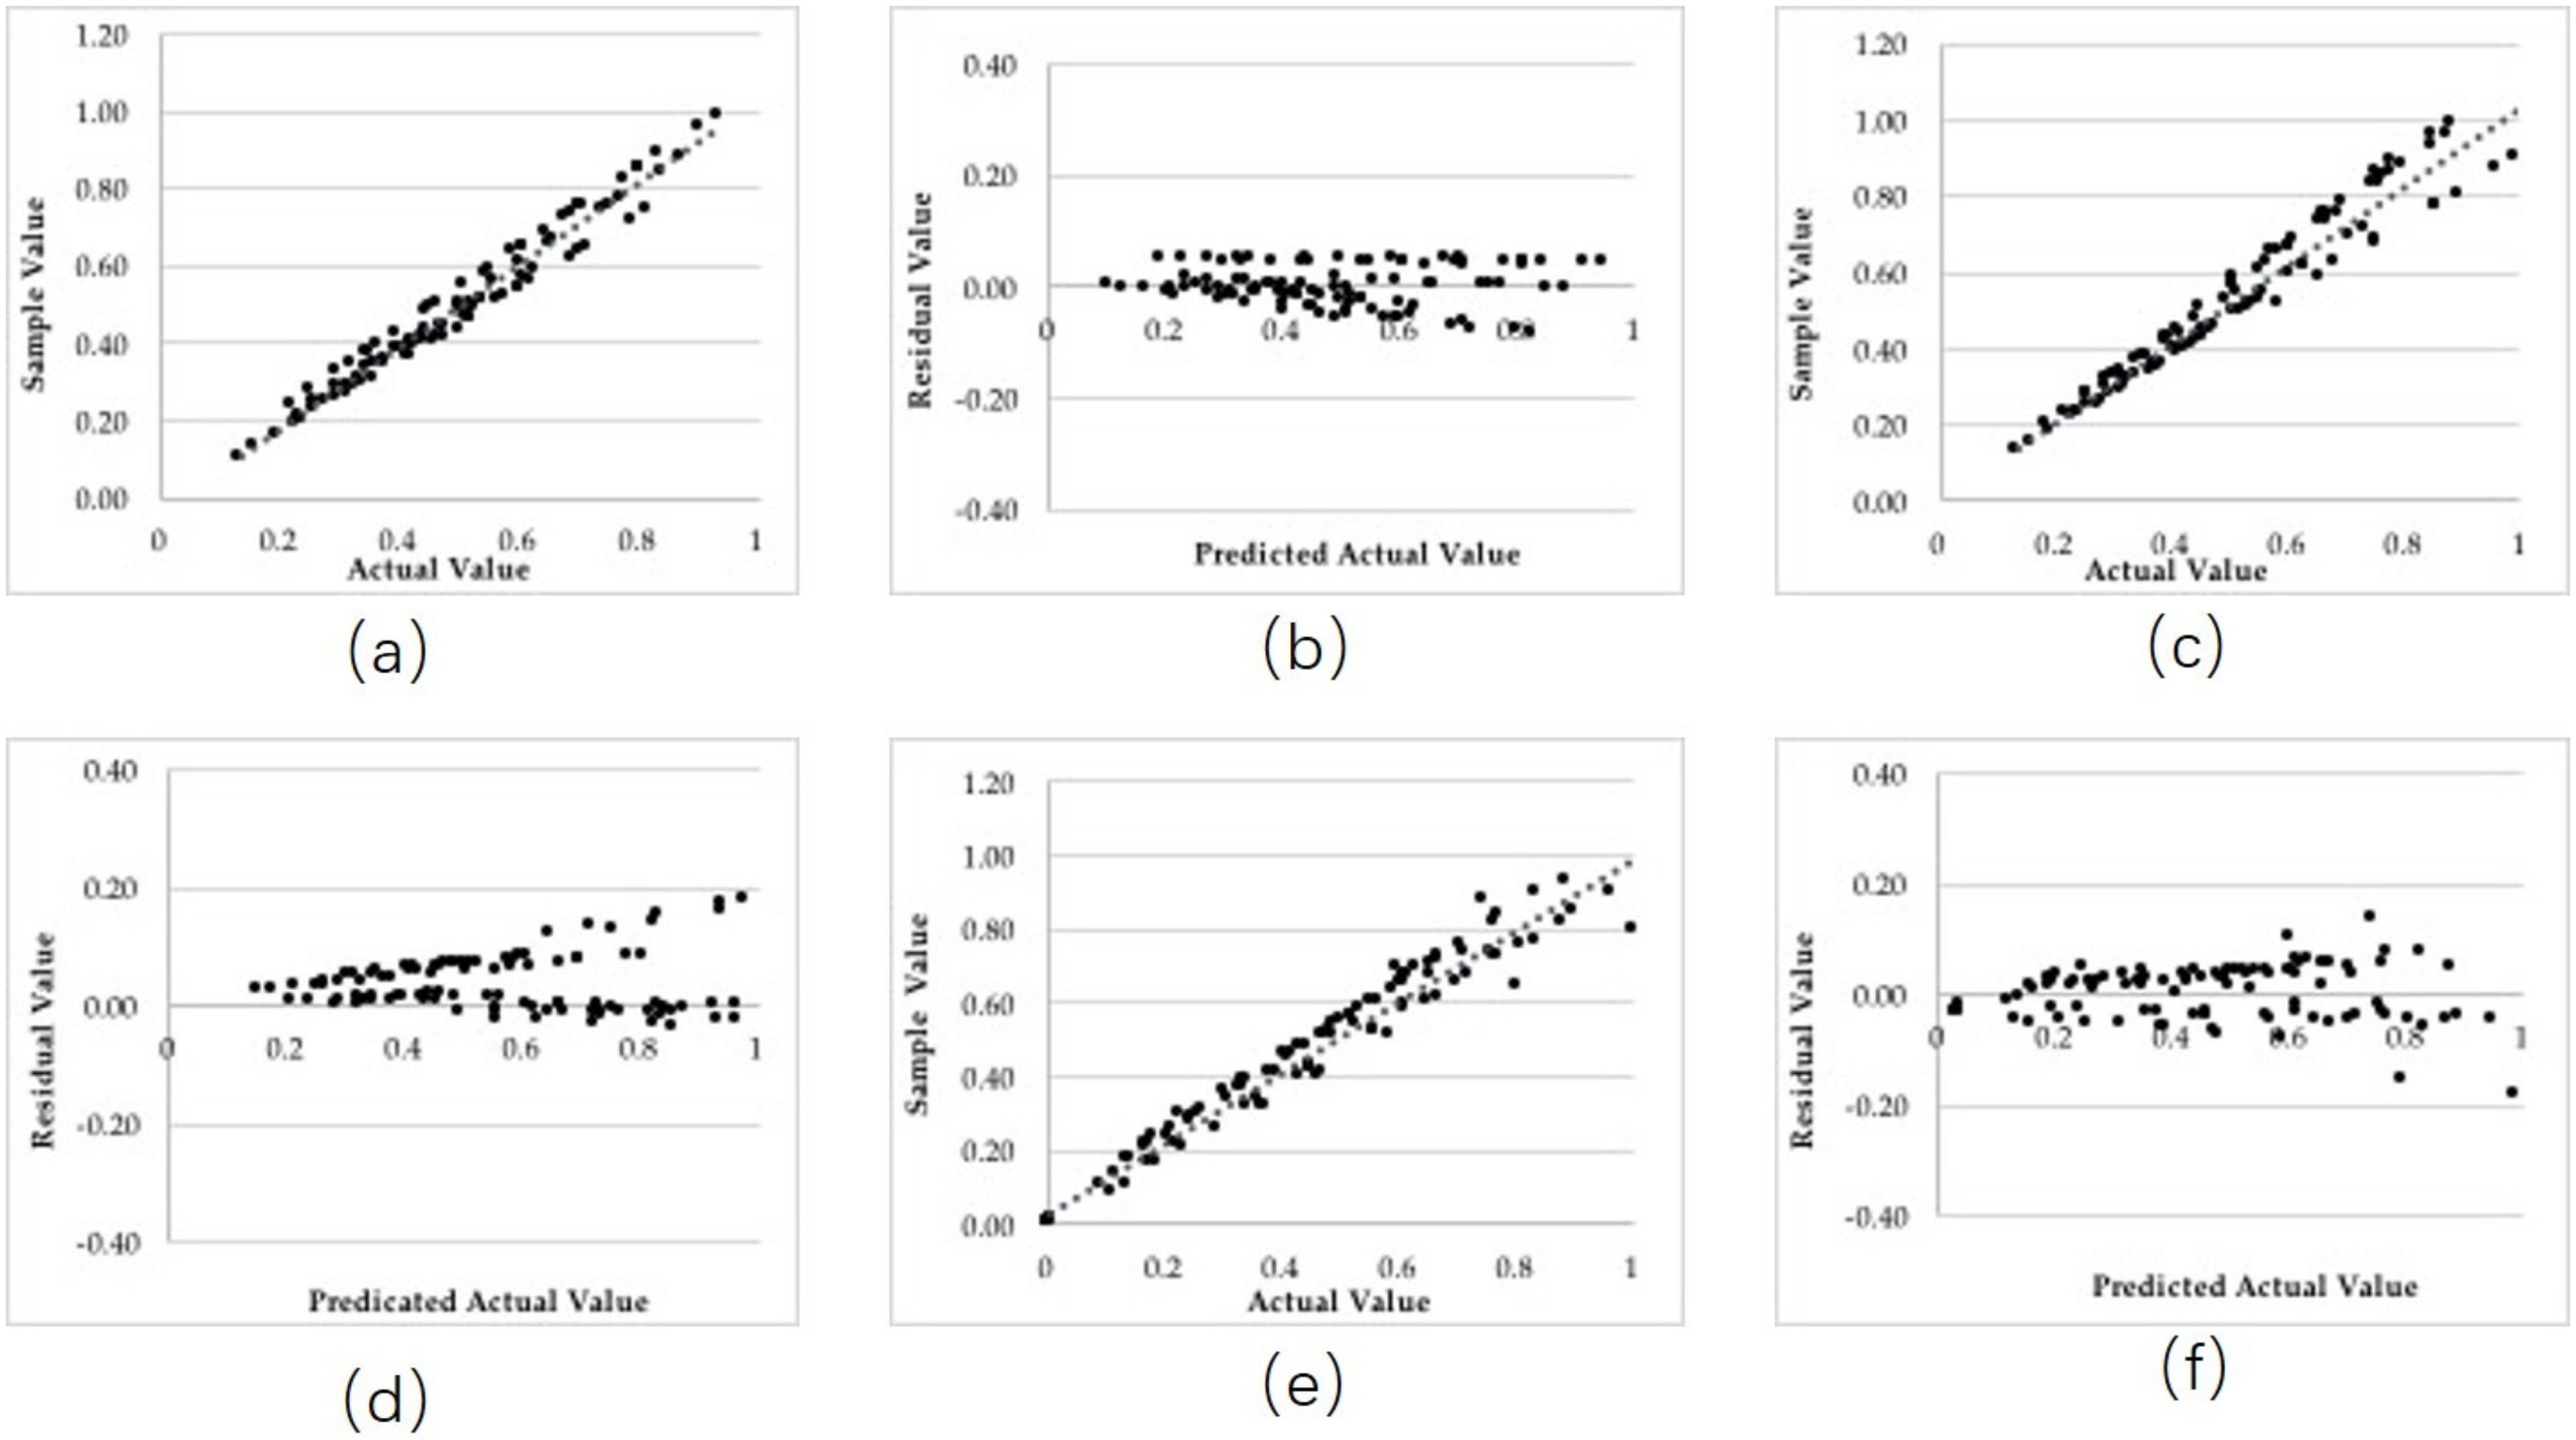
3.5. Accuracy Assessment
4. Discussion
4.1. Change Related to Land Use and Land Cover
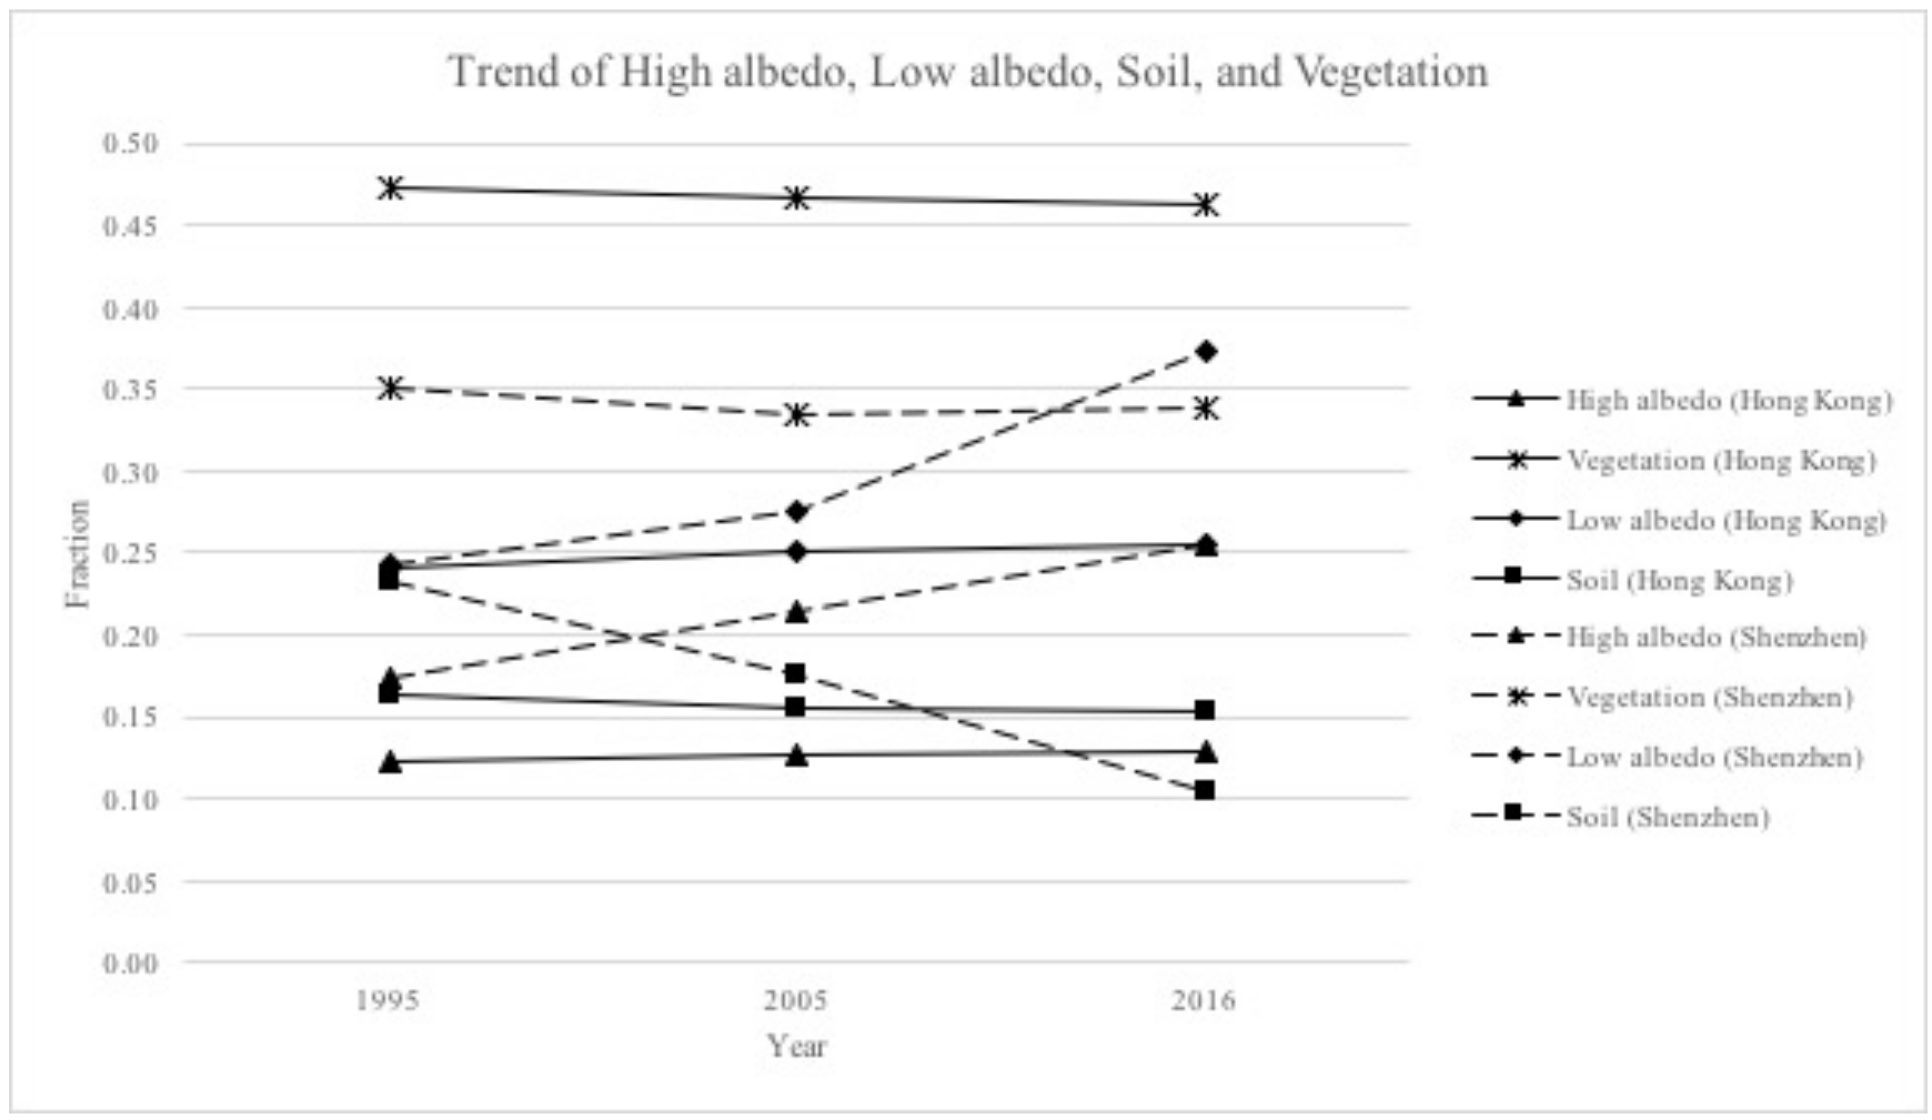
4.1.1. Change in the Fractions of Endmembers and Impervious Surfaces
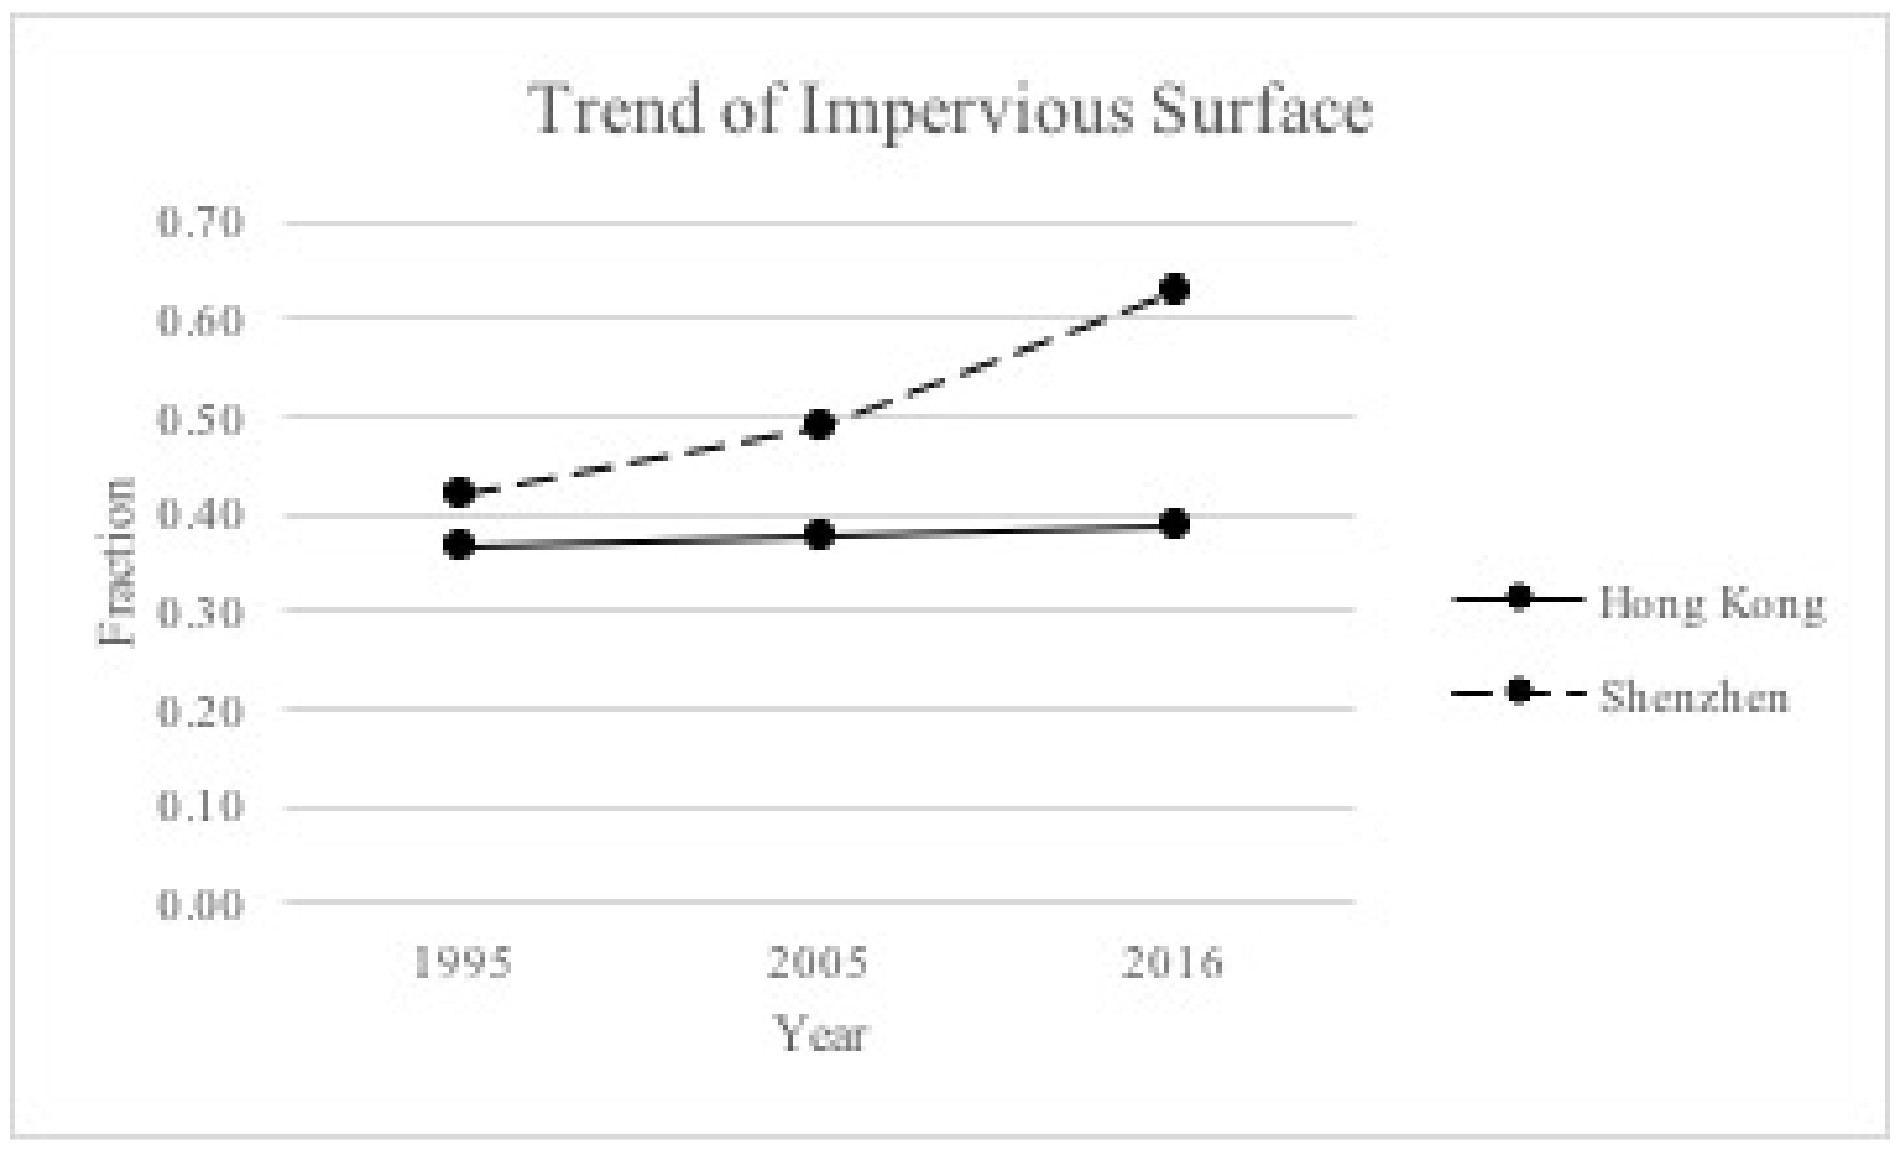
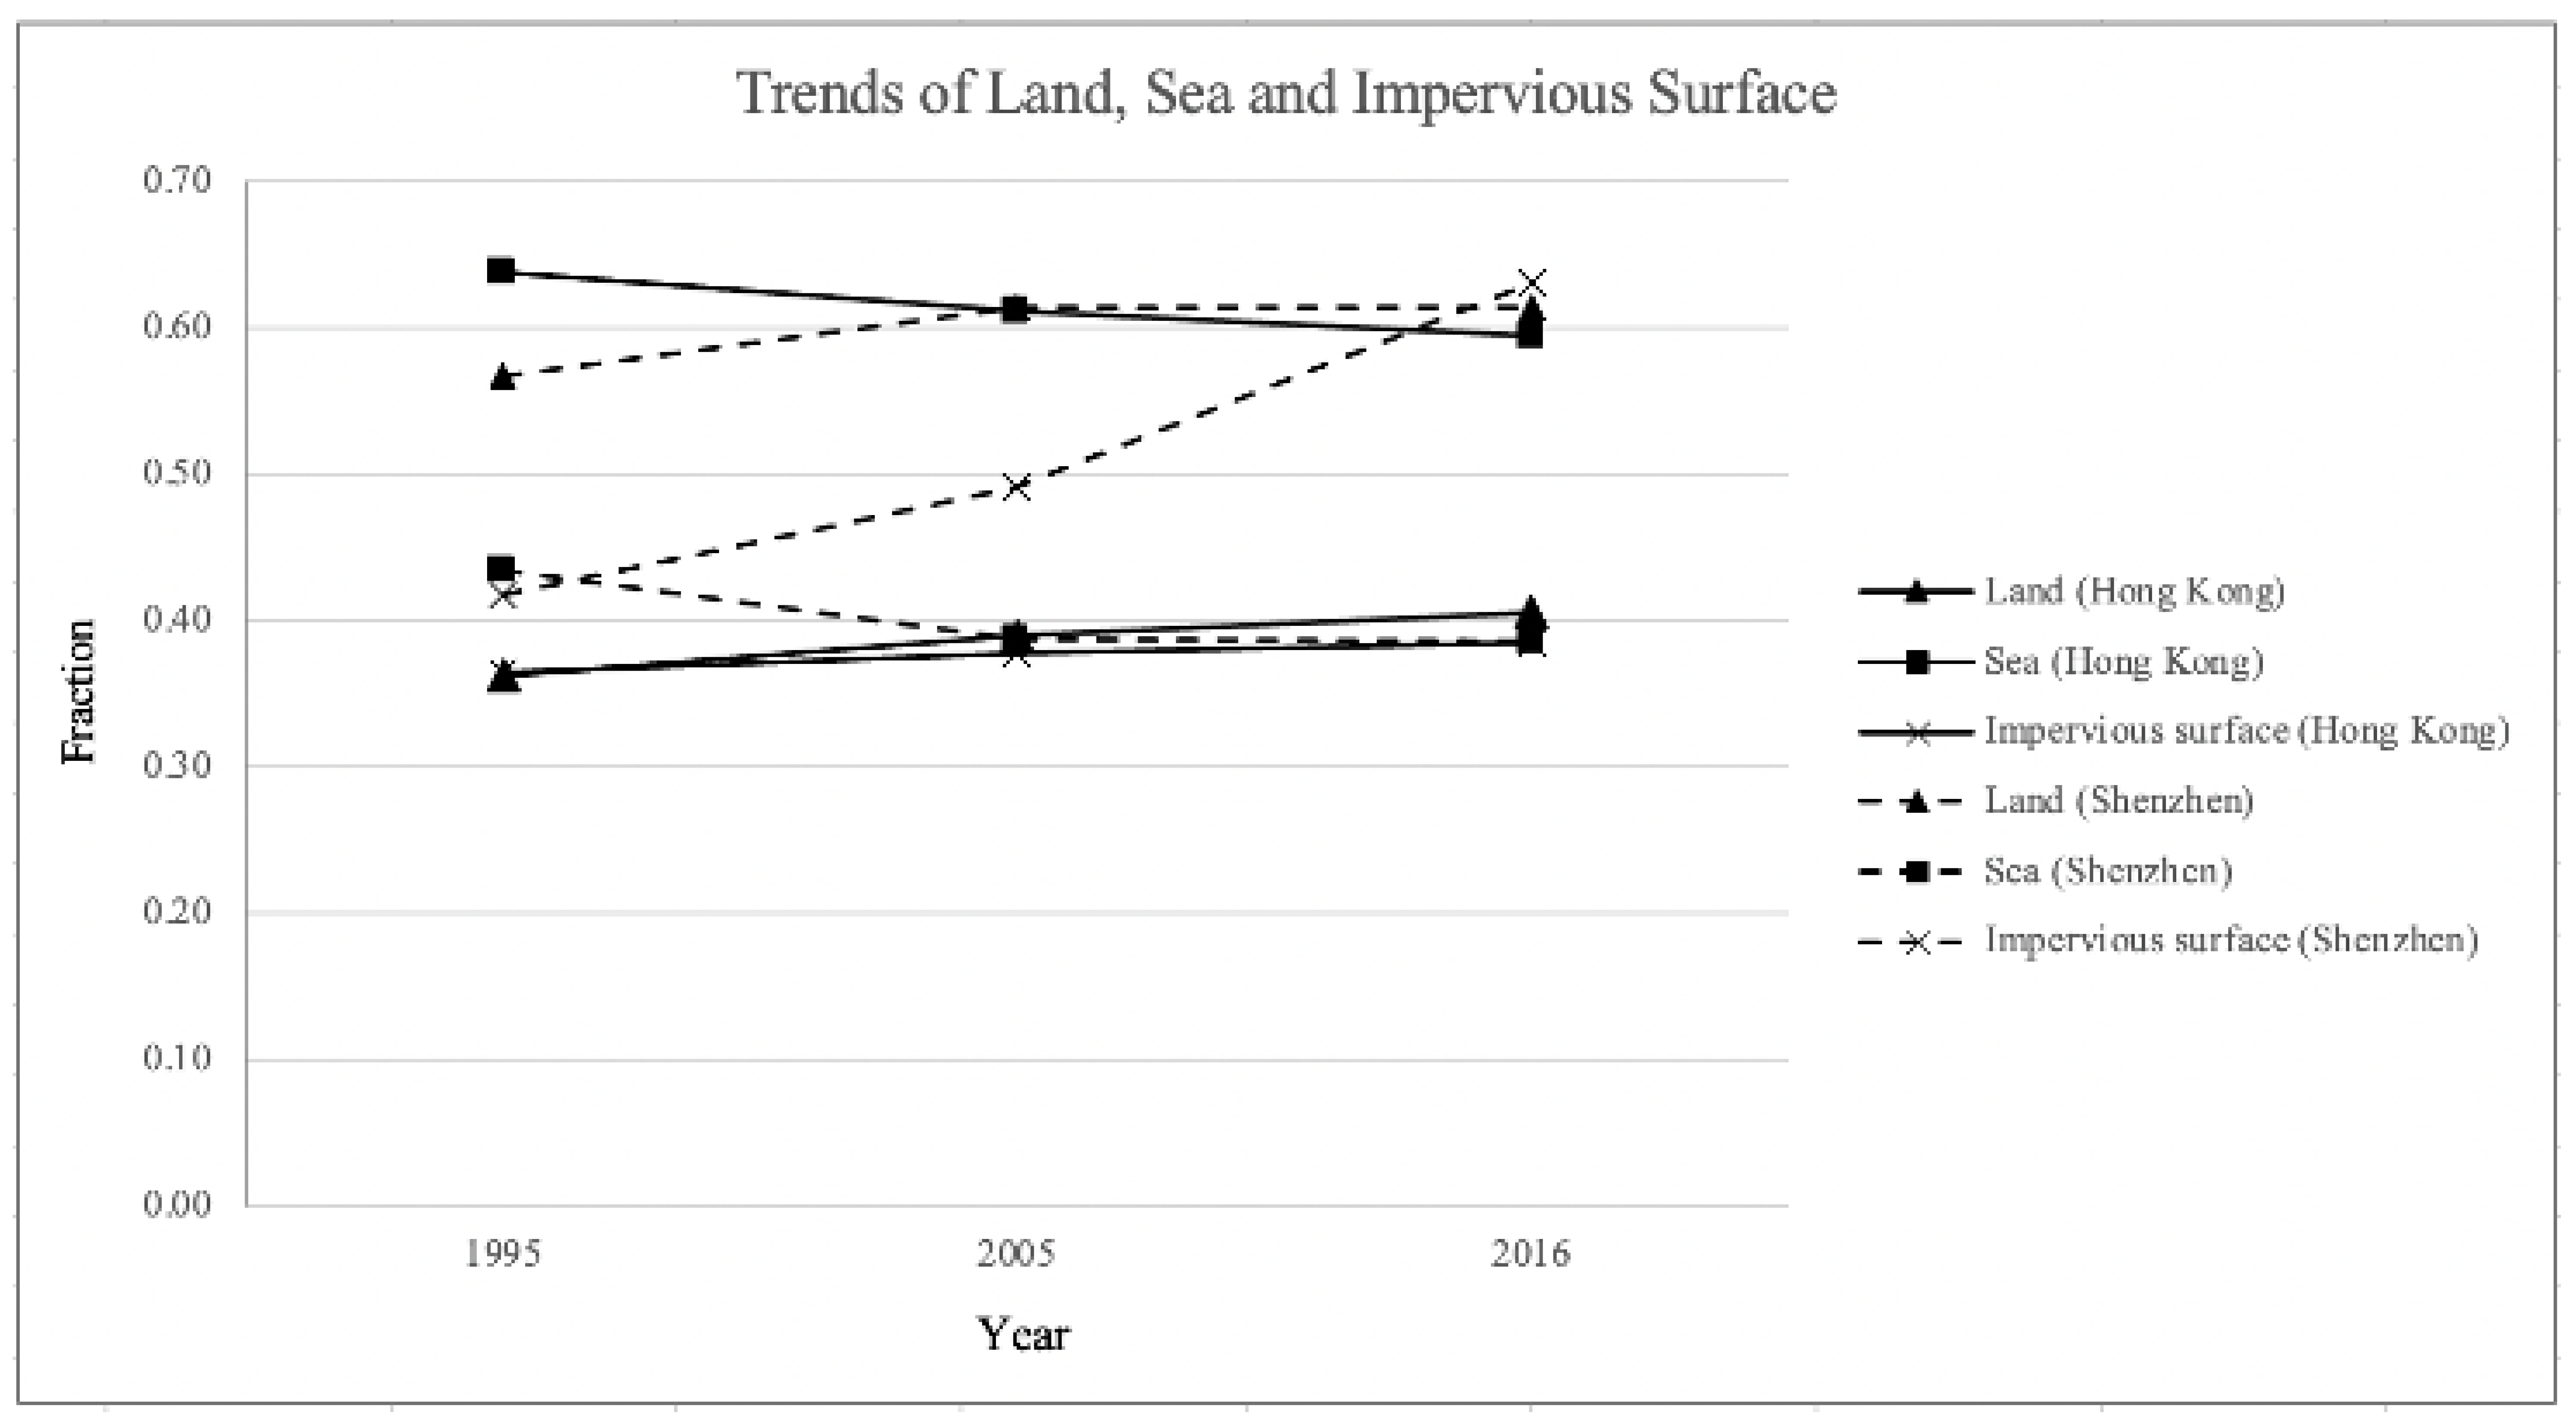
4.1.2. Change in the Trend of Land, Sea, and Impervious Surface
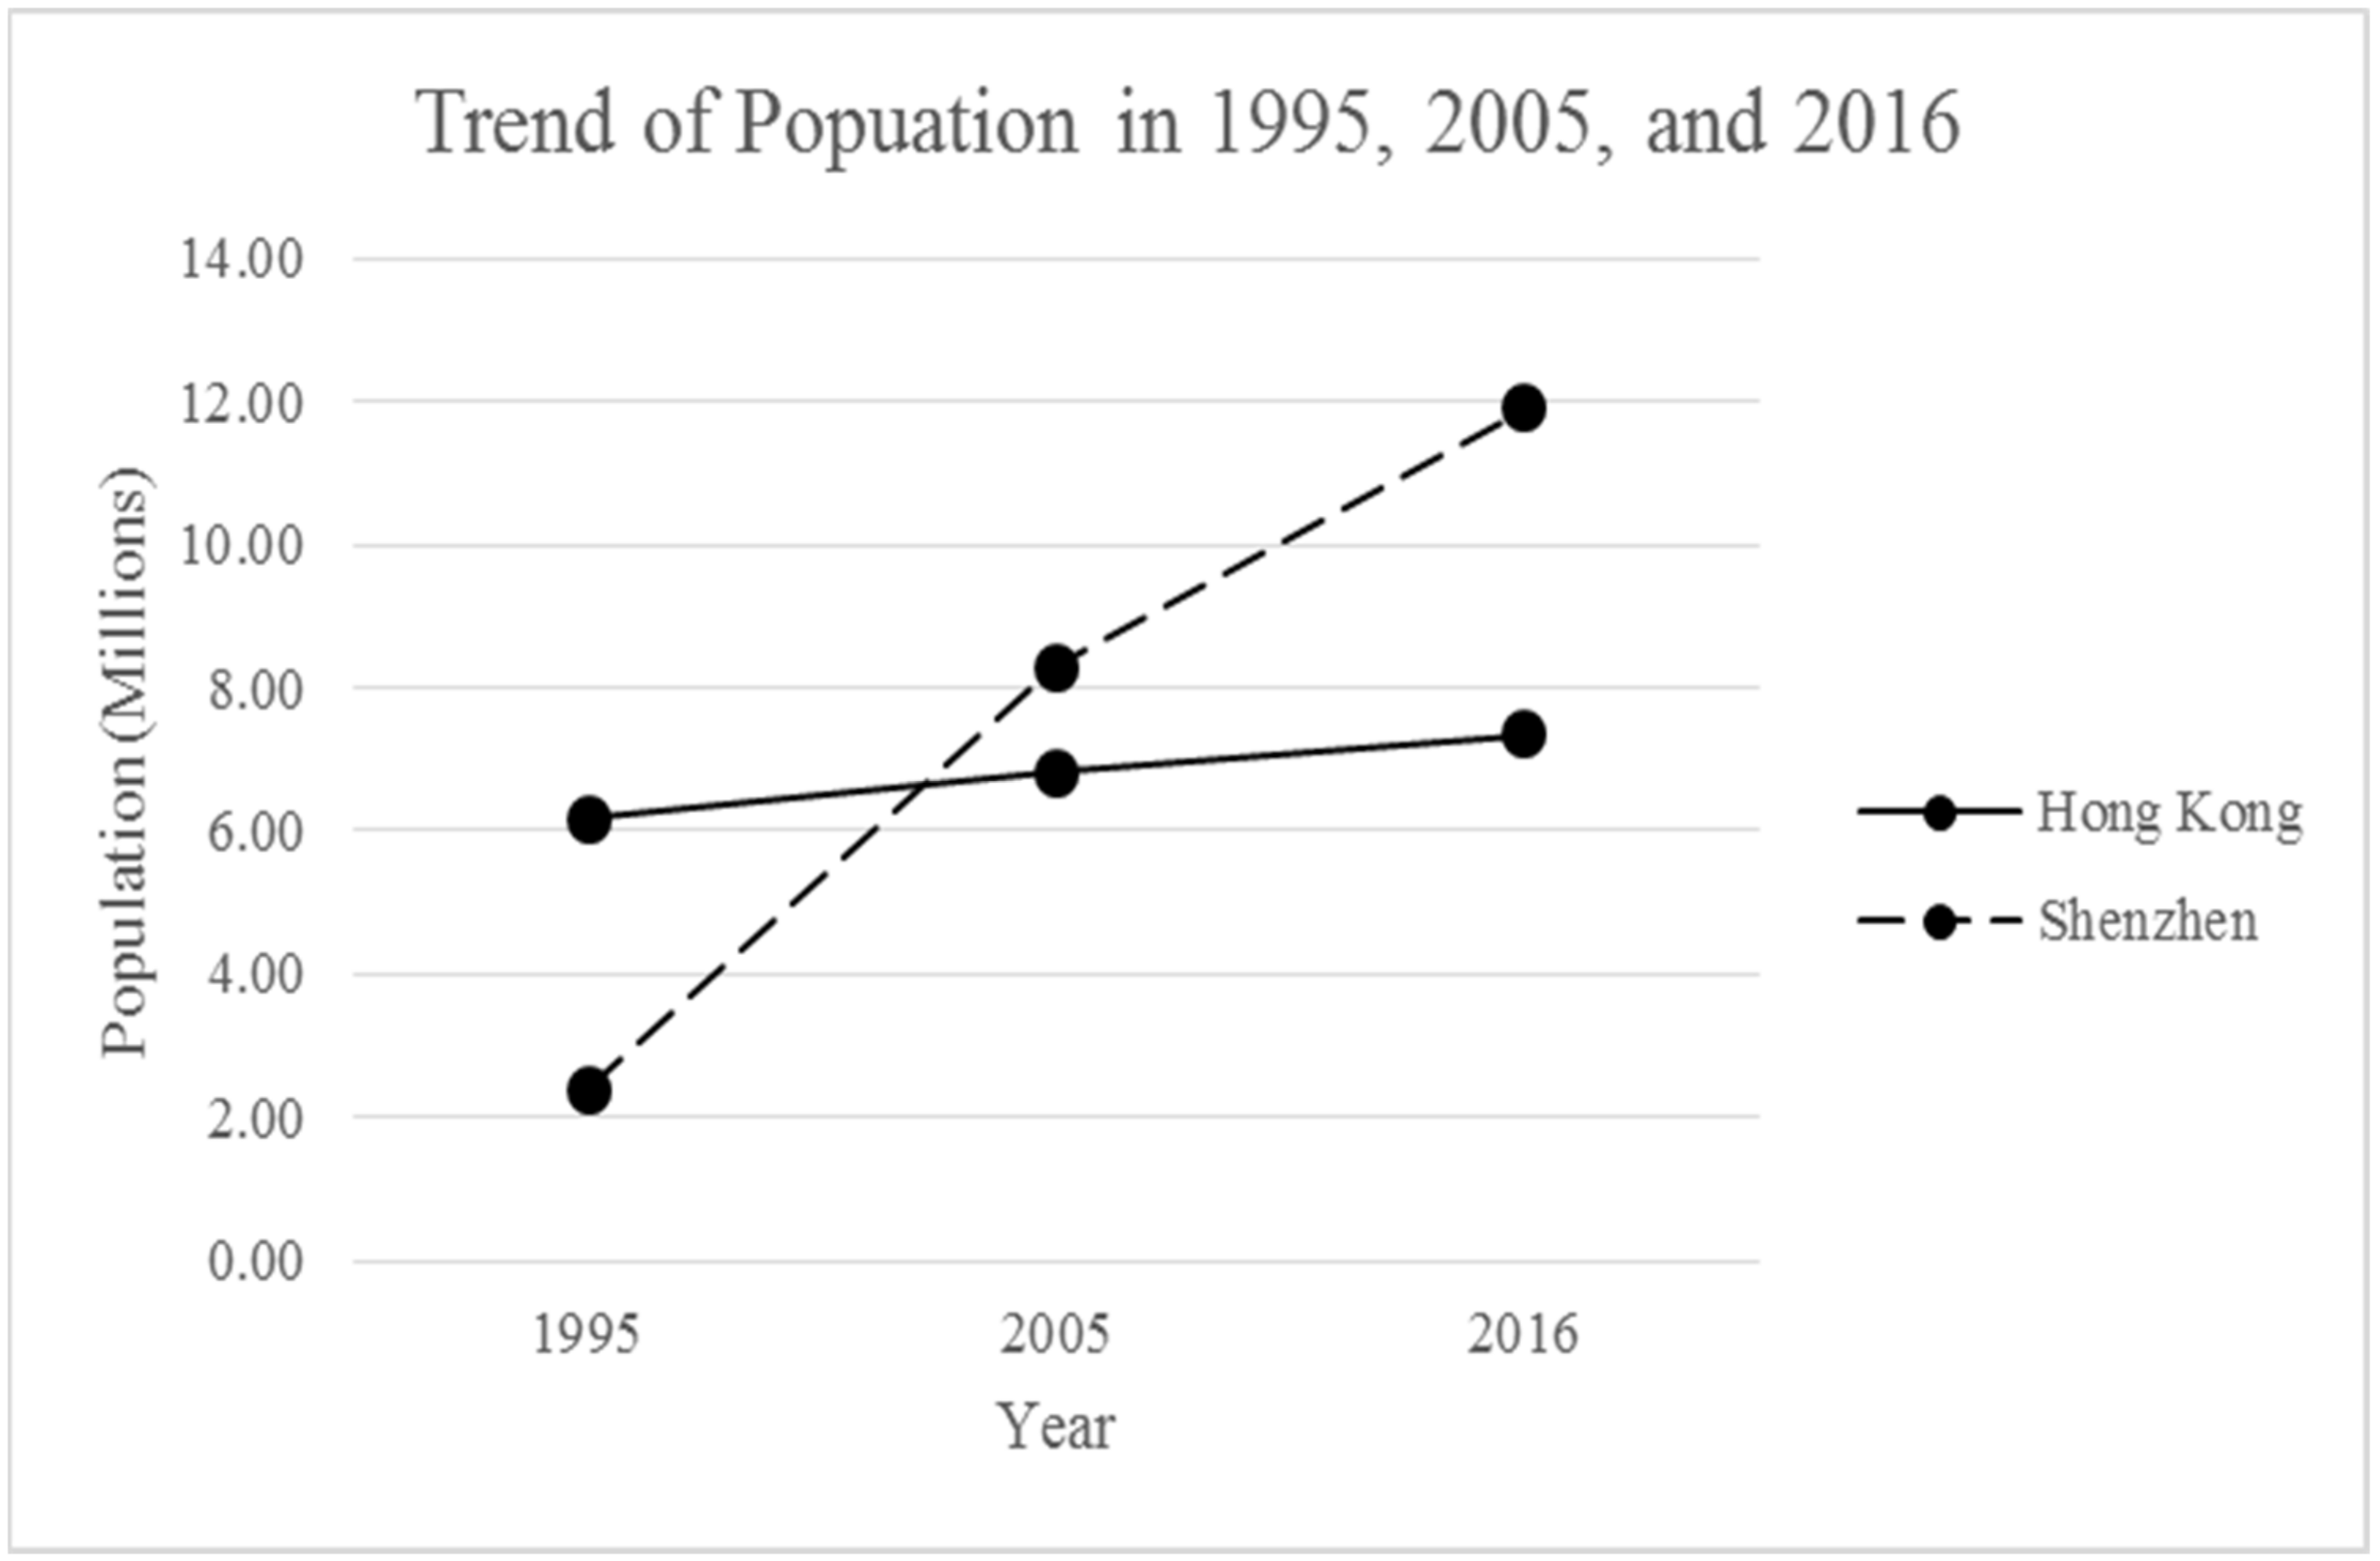
4.2. The Relationship between Impervious Surfaces, Gross Domestic Product, and Population
4.3. Limitations and Future Research
5. Conclusions
Author Contributions
Funding
Institutional Review Board Statement
Informed Consent Statement
Data Availability Statement
Acknowledgments
Conflicts of Interest
References
- Shahtahmassebi, A.; Pan, Y.; Lin, L.; Shortridge, A.; Wang, K.; Wu, J.X.; Wu, D.; Zhang, J. Implications of land use policy on impervious surface cover change in Cixi County, Zhejiang Province, China. Cities 2014, 39, 21–36. [Google Scholar] [CrossRef]
- Li, L.; Lu, D.; Kuang, W. Examining Urban Impervious Surface Distribution and Its Dynamic Change in Hangzhou Metropolis. Remote Sens. 2016, 8, 265. [Google Scholar] [CrossRef] [Green Version]
- Bauer, M.E.; Heinert, N.J.; Doyle, J.K.; Yuan, F. Impervious surface mapping and change monitoring using Landsat remote sensing. In Proceedings of the ASPRS annual conference proceedings, Denver, CO, USA, 23–28 May 2004. [Google Scholar]
- Espey, W.H.J.; Morgan, C.W.; Masch, F.D. A Study of some Effects of Urbanization on Storm Runoff from a Small Watershed; Report 23; Texas Water Development Board: Austin, TX, USA, 1966. [Google Scholar]
- Wu, C. Normalized spectral mixture analysis for monitoring urban composition using ETM+ imagery. Remote Sens. Environ. 2004, 93, 480–492. [Google Scholar] [CrossRef]
- Wu, C.; Murray, A.T. Estimating impervious surface distribution by spectral mixture analysis. Remote Sens. Environ. 2003, 84, 493–505. [Google Scholar] [CrossRef]
- Ridd, M.K. Exploring a V-I-S (vegetation-impervious surface-soil) model for urban ecosystem analysis through remote sensing: Comparative anatomy for cities†. Int. J. Remote Sens. 1995, 16, 2165–2185. [Google Scholar] [CrossRef]
- Ji, M.; Jensen, J.R. Effectiveness of subpixel analysis in detecting and quantifying urban imperviousness from Landsat Thematic Mapper imagery. Geocarto Int. 1999, 14, 33–41. [Google Scholar] [CrossRef]
- Wang, W.; Yao, X.; Zhai, J.; Ji, M. A Tetrahedron-Based Endmember Selection Approach for Urban Impervious Surface Mapping. PLoS ONE 2014, 9, e93479. [Google Scholar] [CrossRef]
- Hendrix, E.M.; Garcia, I.; Plaza, J.; Plaza, A. Minimum volume simplicial enclosure for spectral unmixing of remotely sensed hyperspectral data. In Proceedings of the 2010 IEEE International Geoscience and Remote Sensing Symposium, Honolulu, HI, USA, 25–30 July 2010; pp. 193–196. [Google Scholar] [CrossRef]
- Liao, W.; Deng, Y.; Li, M.; Sun, M.; Yang, J.; Xu, J. Extraction and Analysis of Finer Impervious Surface Classes in Urban Area. Remote Sens. 2021, 13, 459. [Google Scholar] [CrossRef]
- Shih, H.-C.; Stow, D.A.; Tsai, Y.-M.; Roberts, D.A. Estimating the starting time and identifying the type of urbanization based on dense time series of landsat-derived Vegetation-Impervious-Soil (V-I-S) maps—A case study of North Taiwan from 1990 to 2015. Int. J. Appl. Earth Obs. Geoinf. 2020, 85, 101987. [Google Scholar] [CrossRef]
- Zhang, Y.; Zhang, H.; Lin, H. Improving the impervious surface estimation with combined use of optical and SAR remote sensing images. Remote Sens. Environ. 2014, 141, 155–167. [Google Scholar] [CrossRef]
- Wong, K.P.; Zhang, Y.; Tsou, J.Y.; Li, Y. Assessing Impervious Surface Changes in Sustainable Coastal Land Use: A Case Study in Hong Kong. Sustainability 2017, 9, 1029. [Google Scholar] [CrossRef] [Green Version]
- Fu, B.; Peng, Y.; Zhao, J.; Wu, C.; Liu, Q.; Xiao, K.; Qian, G. Driving forces of impervious surface in a world metropolitan area, Shanghai: Threshold and scale effect. Environ. Monit. Assess. 2019, 191, 771. [Google Scholar] [CrossRef] [PubMed]
- Omurakunova, G.; Bao, A.; Xu, W.; Duulatov, E.; Jiang, L.; Cai, P.; Abdullaev, F.; Nzabarinda, V.; Durdiev, K.; Baiseitova, M. Expansion of Impervious Surfaces and Their Driving Forces in Highly Urbanized Cities in Kyrgyzstan. Int. J. Environ. Res. Public Heal. 2020, 17, 362. [Google Scholar] [CrossRef] [Green Version]
- Census and Statistics Department. Hong Kong Population Projections 2015–2064. 2015. Available online: https://www.statistics.gov.hk/pub/B1120015062015XXXXB0100.pdf (accessed on 6 April 2016).
- Goodstadt, L.F. The Global Crisis: Why Laisser-Faire Hong Kong Prefers Regulation (29 January 2010); HKIMR Working Paper No. 01/2010; SSRN: Rochester, NY, USA, 2010. [Google Scholar]
- China Institute of City Competitiveness. Yearbook of China City Competitive 2012. Available online: http://www.china-citynet.com/yjh/en/zgcsjzlnj_show.asp?id=13 (accessed on 6 April 2016).
- The Statistics Portal. China: Population of Shenzhen from 1995 to 2030. 2016. Available online: https://www.statista.com/statistics/466986/china-population-of-shenzhen/ (accessed on 6 April 2016).
- Lu, D.; Weng, Q. Use of impervious surface in urban land-use classification. Remote Sens. Environ. 2006, 102, 146–160. [Google Scholar] [CrossRef]
- Santamouris, M.; Synnefa, A.; Karlessi, T. Using advanced cool materials in the urban built environment to mitigate heat islands and improve thermal comfort conditions. Sol. Energy 2011, 85, 3085–3102. [Google Scholar] [CrossRef]
- Adam, J.B.; Smith, M.O.; Johnson, P.E. Spectral mixture modeling: A new analysis of rock and soil types at the Viking Landser a site. J. Geogr. Res. 1986, 91, 8098–8112. [Google Scholar] [CrossRef]
- Rashed, T.; Weeks, J.R.; Roberts, D.; Rogan, J.; Powell, R. Measuring the Physical Composition of Urban Morphology Using Multiple Endmember Spectral Mixture Models. Photogramm. Eng. Remote Sens. 2003, 69, 1011–1020. [Google Scholar] [CrossRef] [Green Version]
- Weng, Q.; Hu, X.; Lu, D. Extracting impervious surfaces from medium spatial resolution multispectral and hyperspectral imagery: A comparison. Int. J. Remote Sens. 2008, 29, 3209–3232. [Google Scholar] [CrossRef]
- Weng, Q.; Hu, X.; Liu, H. Estimating impervious surface using linear spectral mixture analysis with multi-temporal ASTER image. Int. J. Remote Sens. 2009, 30, 4807–4830. [Google Scholar] [CrossRef]
- Small, C. Estimation of urban vegetation abundance by spectral mixture analysis. Int. J. Remote Sens. 2001, 22, 1305–1334. [Google Scholar] [CrossRef]
- Welch, R. Spatial resolution requirements for urban studies. Int. J. Remote Sens. 1982, 3, 139–146. [Google Scholar] [CrossRef]
- Madhavan, B.B.; Kubo, S.; Kurisaki, N.; Sivakumar, T.V.L.N. Appraising the anatomy and spatial growth of the Bangkok Metropolitan area using a vegetation-impervious-soil model through remote sensing. Int. J. Remote Sens. 2001, 22, 789–806. [Google Scholar] [CrossRef]
- Setiawan, H.; Mathieu, R.; Thompson-Fawcett, M. Assessing the applicability of the V-I-S model to map urban land use in the developing world. Comput. Environ. Urban 2006, 30, 503–522. [Google Scholar] [CrossRef]
- Congalton, R.G. A review of assessing the accuracy of classifications of remotely sensed data. Remote Sens. Environ. 1991, 37, 35–46. [Google Scholar] [CrossRef]
- Congalton, R.G.; Green, K. Assessing the Accuracy of Remotely Sensed Data: Principles and Practices; CRC Press: Boca Raton, FL, USA, 1999. [Google Scholar]
- Foody, G.M. Status of land cover classification accuracy assessment. Remote Sens. Environ. 2002, 80, 185–201. [Google Scholar] [CrossRef]
- Lu, D.; Morán, E.; Batistella, M. Linear mixture model applied to Amazonian vegetation classification. Remote Sens. Environ. 2003, 87, 456–469. [Google Scholar] [CrossRef] [Green Version]
- Lu, D.; Batistella, M.; Morán, E.; Mausel, P. Application of spectral mixture analysis to Amazonian land-use and land-cover classification. Int. J. Remote Sens. 2004, 25, 5345–5358. [Google Scholar] [CrossRef]
- Li, P.; Qian, H.; Wu, J. Environment: Accelerate research on land creation. Nature 2014, 510, 29–31. [Google Scholar] [CrossRef] [PubMed]
- HKSAR Census and Statistic Department. Hong Kong Annual Digest of Statistics 1995; HKSAR Census and Statistic Department: Hong Kong, China, 1996. [Google Scholar]
- HKSAR Census and Statistic Department. Hong Kong Annual Digest of Statistics 2005; HKSAR Census and Statistic Department: Hong Kong, China, 2006. [Google Scholar]
- HKSAR Census and Statistic Department. Hong Kong Annual Digest of Statistics 2015; HKSAR Census and Statistic Department: Hong Kong, China, 2016. [Google Scholar]
- Department of Population and Employment Statistics of the National Bureau of Statistics of China. China Population Statistics Yearbook 1995; China Statistics Press: Beijing, China, 1995. [Google Scholar]
- Department of Population and Employment Statistics of the National Bureau of Statistics of China. China Population Statistics Yearbook 2005; China Statistics Press: Beijing, China, 2005. [Google Scholar]
- Department of Population and Employment Statistics of the National Bureau of Statistics of China. China Population Statistics Yearbook 2016; China Statistics Press: Beijing, China, 2016. [Google Scholar]
- Wong, Y.C.R. Hong Kong in Transition Economic Transformation in the Eighties. In Proceedings of the Conference on the Changing World Community: Development Consequences and Adjustments in Asia and the Pacific, Ninth General Meeting, Association of Development Research and Training Institutes of Asia and the Pacific, Macau, China, 8–11 October 1991. [Google Scholar]
- Lin, C.W.; Wong, K. Economic Growth and International Trade: The Case of Hong Kong. 1997. Available online: https://faculty.washington.edu/karyiu/papers/Gro&Tra-HKP.pdf (accessed on 6 April 2016).
- Ng, M.K.; Tang, W.-S. The Role of Planning in the Development of Shenzhen, China: Rhetoric and Realities. Eurasian Geogr. Econ. 2004, 45, 190–211. [Google Scholar] [CrossRef]
- Xie, H.L.; He, Y.F.; Xie, X. Exploring the factors influencing ecological land change for China’s Beijing–Tianjin–Hebei Region using big data. J. Clean. Prod. 2017, 142, 677–687. [Google Scholar] [CrossRef]
- An, X.; Ng, E.; Ren, C. Urban Heat island in Hong Kong. Department of Architecture. The Chinese University of Hong Kong. 2006. Available online: http://geography.ccsc.edu.hk/al/urbanheatislandHK.pdf (accessed on 6 April 2016).
- Peng, Y.; Qian, J.; Ren, F.; Zhang, W.; Du, Q. Sustainability of land use promoted by Construction-to-Ecological Land Con-version: A Case Study of Shenzhen City, China. Sustainability 2016, 8, 671. [Google Scholar] [CrossRef] [Green Version]


| Year | 1995 | 2005 | 2016 |
|---|---|---|---|
| Date | 02 November 1995 | 23 November2005 | 07 December 2016 |
| Sensor Type | Landsat5 TM | Landsat5 TM | Landsat8 OLI |
| MNF 1 | MNF 2 | MNF 3 | MNF 4 | MNF 5 | MNF 6 | |
|---|---|---|---|---|---|---|
| Eigenvalue | 44.36 | 17.32 | 6.53 | 3.70 | 3.02 | 1.53 |
| Contribution rate | 58.02% | 22.65% | 8.54% | 4.84% | 3.95% | 2.00% |
| Study Area | Type/Year | 1995 | 2005 | 2016 |
|---|---|---|---|---|
| Hong Kong | High-albedo | 12.34% | 12.63% | 12.94% |
| Vegetation | 47.24% | 46.69% | 46.27% | |
| Low-albedo | 24.12% | 25.18% | 25.56% | |
| Soil | 16.30% | 15.50% | 15.24% | |
| Shenzhen | High-albedo | 17.40% | 21.47% | 25.60% |
| Vegetation | 34.99% | 33.42% | 33.94% | |
| Low-albedo | 24.33% | 27.57% | 37.36% | |
| Soil | 23.28% | 17.53% | 10.37% |
| 1995 | 2005 | 2016 | |
|---|---|---|---|
| Value of R2 | 0.97 | 0.95 | 0.96 |
| n = 100 | RMSE = 3.67%, MAE = 2.98% | RMSE = 6.36%, MAE = 4.49% | RMSE = 4.92%, MAE = 4.12% |
| Study Area | Type/Year | 1995 | 2005 | 2016 |
|---|---|---|---|---|
| Hong Kong | Land | 36.21% 997.59 km2 | 38.94% 1072.80 km2 | 40.57% 1117.70 km2 |
| Sea | 63.79% 1757.41 km2 | 61.06% 1682.20 km2 | 59.43% 1637.30 km2 | |
| Impervious surface | 36.46% 362.72 km2 | 37.80% 405.51 km2 | 38.49% 430.20 km2 | |
| Shenzhen | Land | 56.61% 1777.55 km2 | 61.28% 1924.19 km2 | 61.35% 1926.39 km2 |
| Sea | 43.39% 1362.44 km2 | 38.72% 1215.80 km2 | 38.65% 1213.61 km2 | |
| Impervious surface | 41.72% 741.59 km2 | 49.04% 943.62 km2 | 62.96% 1212.85 km2 |
| Type/Year | 1995 | 2005 | 2016 | |
|---|---|---|---|---|
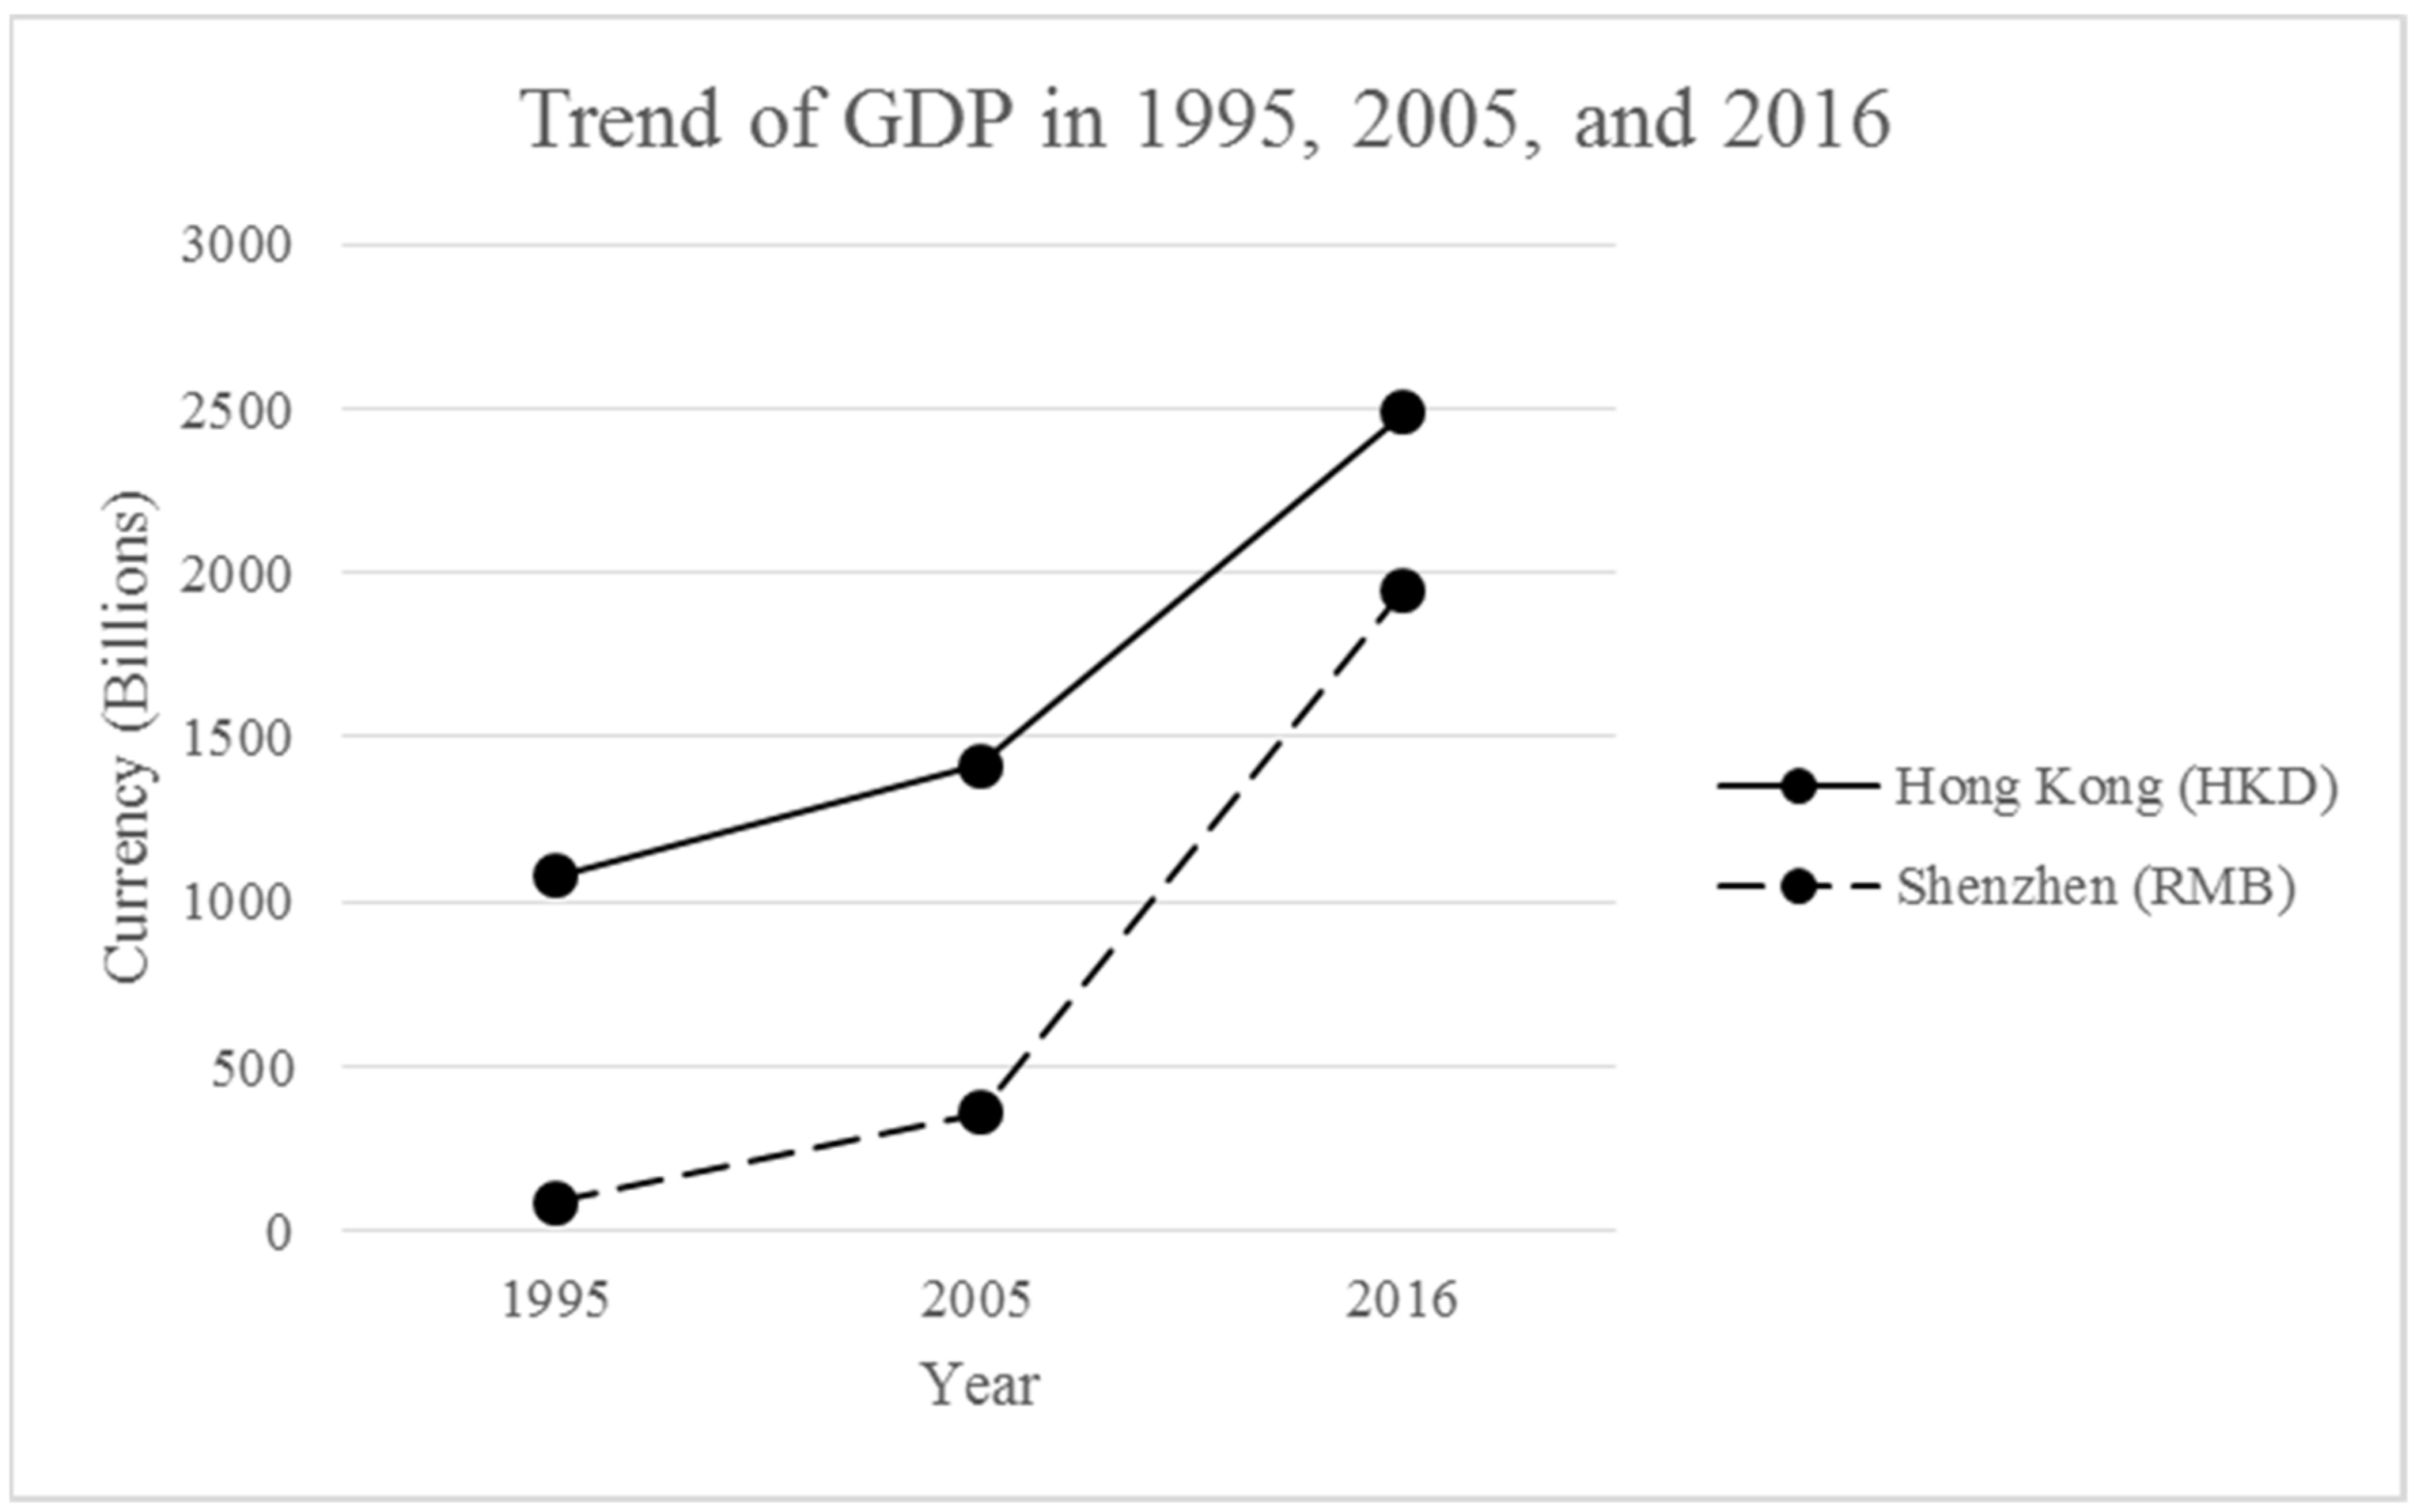
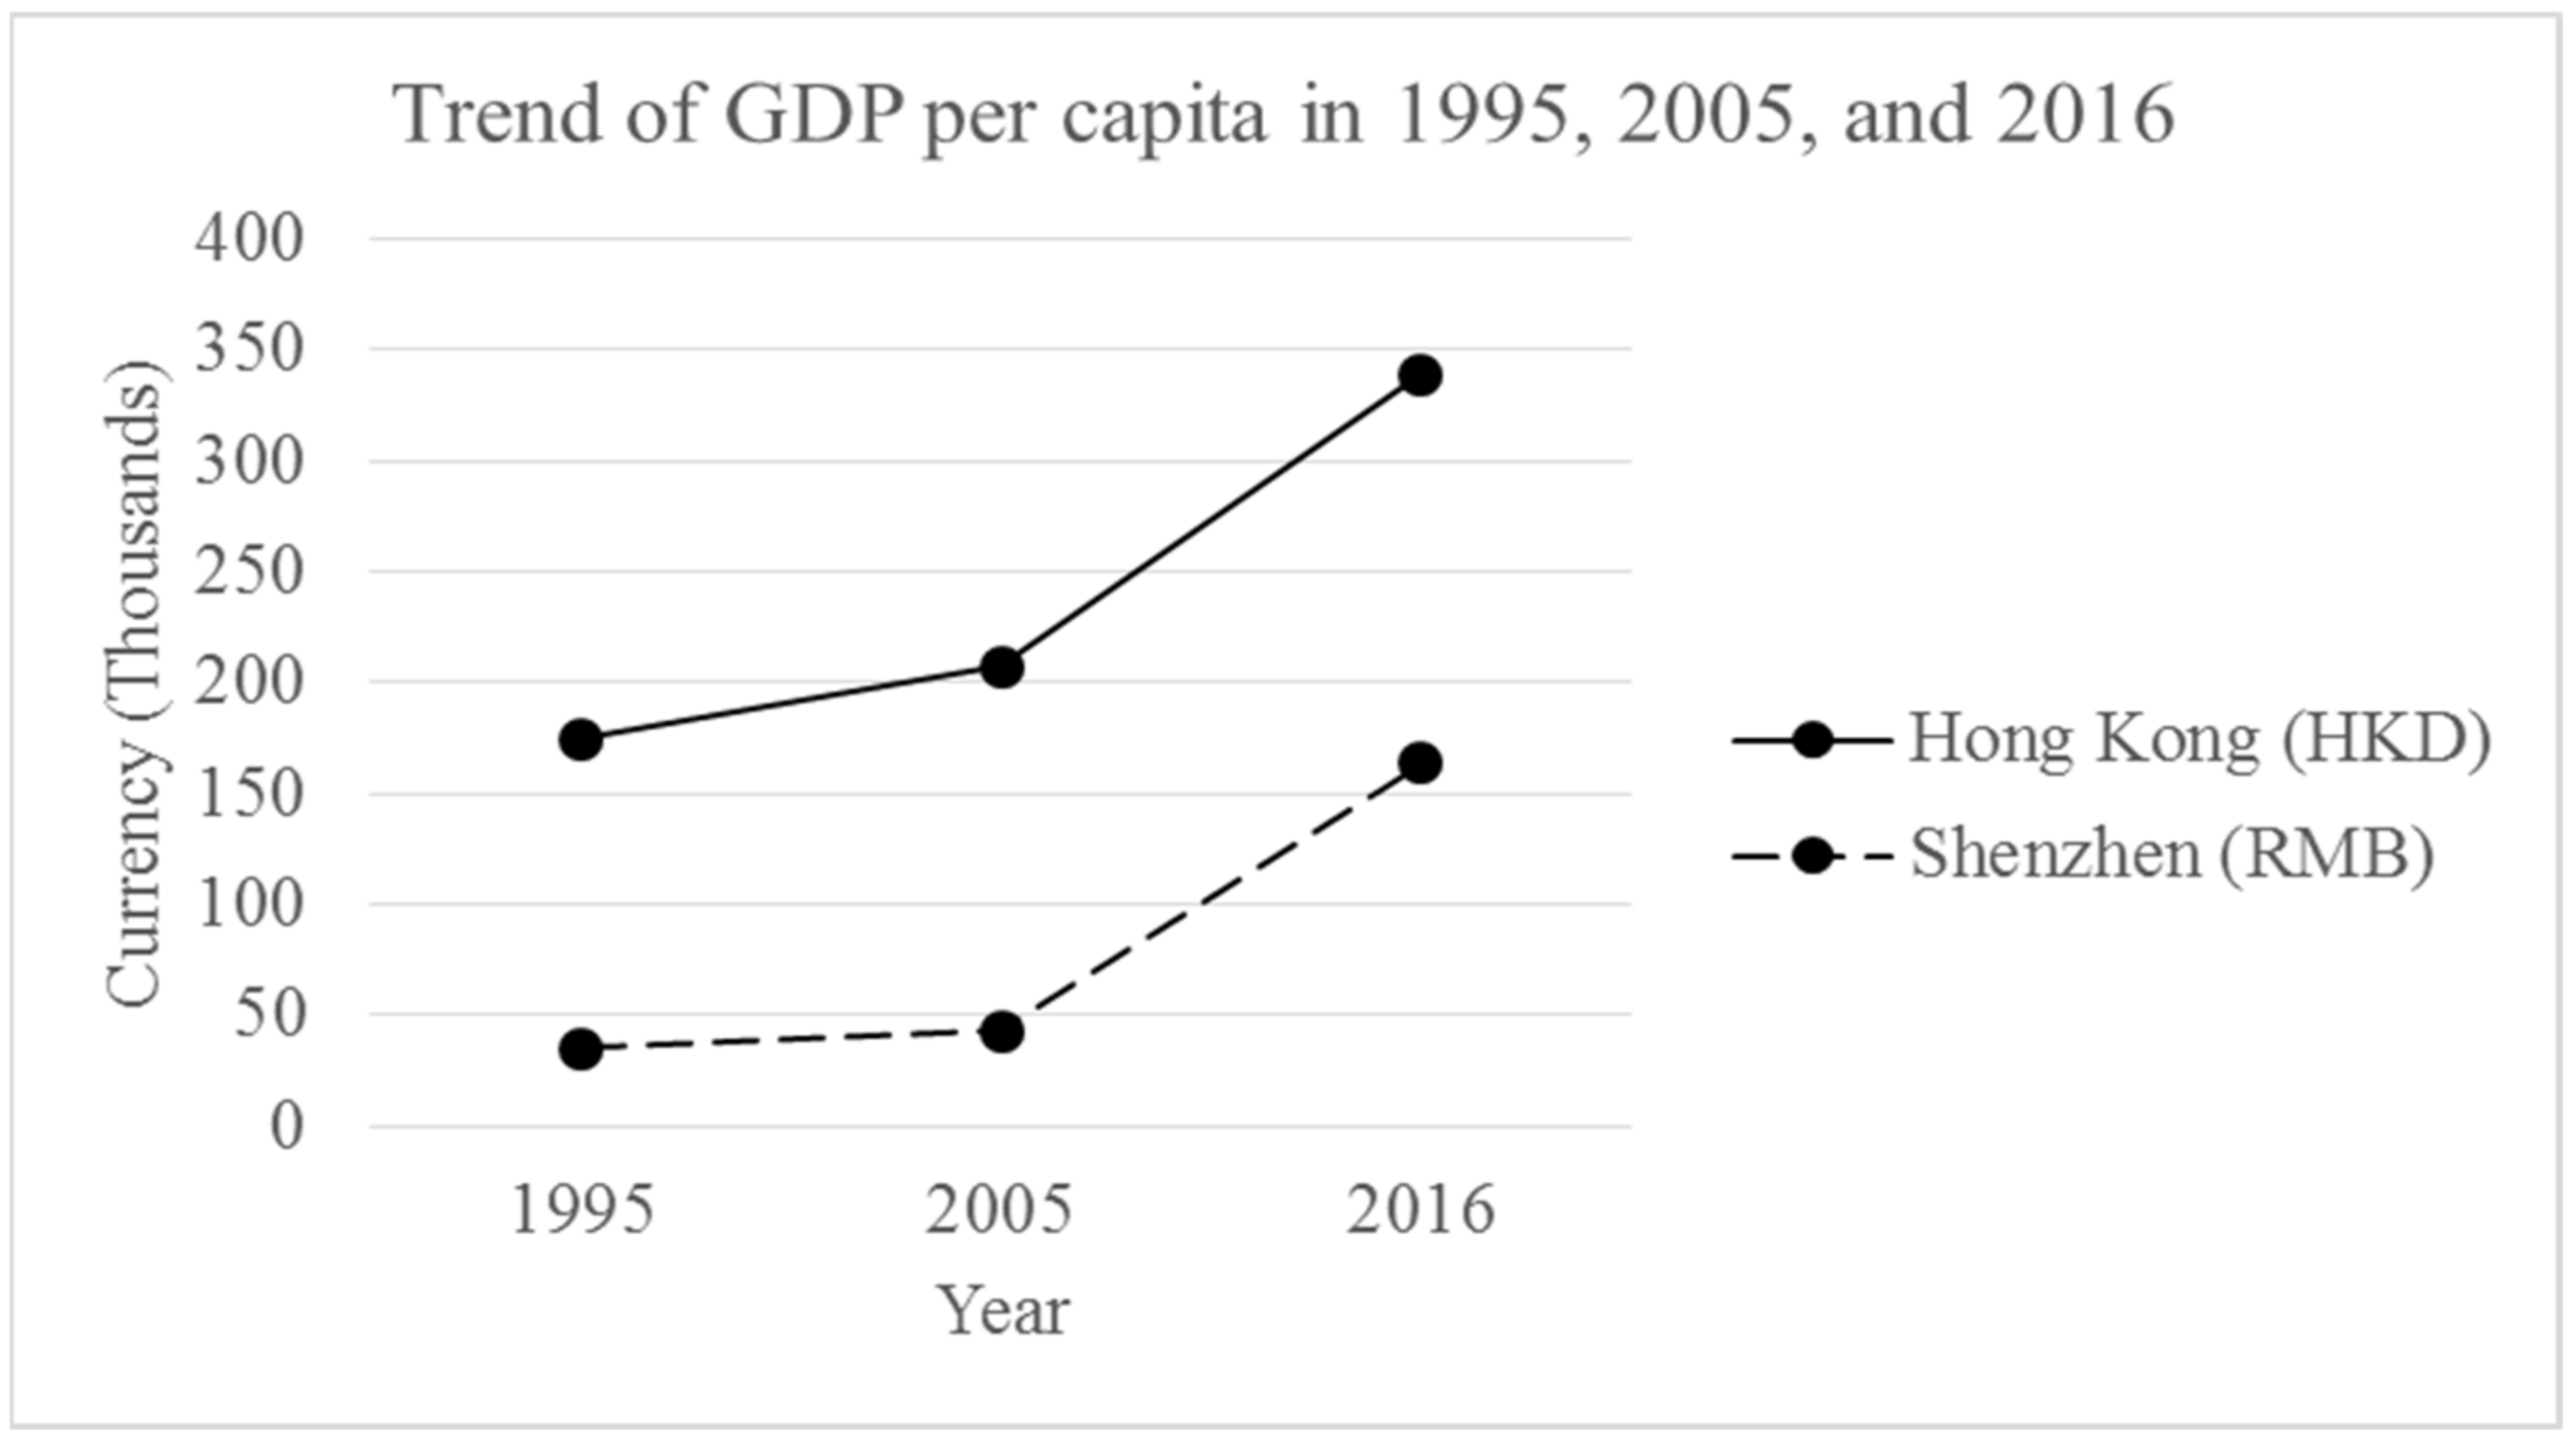
| Hong Kong | Population (Million) | 6.15 | 6.78 | 7.31 |
| GDP Billion HKD) | 761 | 1291 | 2397 | |
| GDP per capita (Thousand HKD) | 123.73 | 190.41 | 327.91 | |
| Shenzhen | Population (Million) | 2.39 | 5.98 | 10.75 |
| GDP (Billion RMB) | 79 | 342 | 1750 | |
| GDP per capita (Thousand RMB) | 33.05 | 57.19 | 162.79 |
Publisher’s Note: MDPI stays neutral with regard to jurisdictional claims in published maps and institutional affiliations. |
© 2022 by the authors. Licensee MDPI, Basel, Switzerland. This article is an open access article distributed under the terms and conditions of the Creative Commons Attribution (CC BY) license (https://creativecommons.org/licenses/by/4.0/).
Share and Cite
Wong, K.; Zhang, Y.; Cheng, Q.; Chao, M.C.; Tsou, J.Y. Comparison of Impervious Surface Dynamics through Vegetation/High-Albedo/Low-Albedo/Soil Model and Socio-Economic Factors. Land 2022, 11, 430. https://doi.org/10.3390/land11030430
Wong K, Zhang Y, Cheng Q, Chao MC, Tsou JY. Comparison of Impervious Surface Dynamics through Vegetation/High-Albedo/Low-Albedo/Soil Model and Socio-Economic Factors. Land. 2022; 11(3):430. https://doi.org/10.3390/land11030430
Chicago/Turabian StyleWong, Kapo, Yuanzhi Zhang, Qiuming Cheng, Ming Chun Chao, and Jin Yeu Tsou. 2022. "Comparison of Impervious Surface Dynamics through Vegetation/High-Albedo/Low-Albedo/Soil Model and Socio-Economic Factors" Land 11, no. 3: 430. https://doi.org/10.3390/land11030430