Article

The Effects of Tidal Flat Reclamation on the Stability of the Coastal Area in the Jiangsu Province, China, from the Perspective of Landscape Structure

1
Institute of Geographic Sciences and Natural Resources Research, Chinese Academy of Sciences, Beijing 100101, China
2
University of Chinese Academy of Sciences, Beijing 100049, China
3
College of Resources and Environment, Chengdu University of Information Technology, Chengdu 610225, China
4
School of Tourism and Urban Management, Jiangxi University of Finance and Economics, Nanchang 330013, China
*
Author to whom correspondence should be addressed.
Land 2022, 11(3), 421; https://doi.org/10.3390/land11030421
Submission received: 30 January 2022 / Revised: 8 March 2022 / Accepted: 11 March 2022 / Published: 14 March 2022
(This article belongs to the Special Issue Celebrating 25 Years of World Wetlands Day)

Abstract

:
As one of the most important wetland systems, coastal wetlands play an important role in conserving water, regulating the climate and protecting biodiversity. However, due to large-scale and long-term tidal flat reclamations, the landscape structure and function of the coastal wetlands have been greatly affected. Therefore, it is necessary to understand the spatio-temporal characteristics of the impact of tidal flat reclamation on regional ecology and to quantitatively assess the relationships between them. In this study based on long-term, multiperiod remote sensing data, the main spatio-temporal variation characteristics of stability, and the relationship between stability and tidal flat reclamation were analyzed with regard to the influence scope of tidal flat reclamation. The results showed that a substantial decrease in natural wetlands in 1980, mainly caused by tidal flat reclamation, was discovered in the Jiangsu coastal area, and the influence scope of tidal flat reclamation on regional landscape ecology was roughly 30 km. In the affected area, the overall stability had a tendency to improve, but the stability change characteristics between reclamation area and non-reclamation area varied greatly. Especially in the reclamation area, the stability of construction wetlands and non-wetlands deteriorated. Spatially, the stability outside the reclamation area had the characteristics of first deteriorating and then improving as the distance from the reclamation area increased. Under the influence of tidal flat reclamation, the influence of different use types of TFR on stability was not completely consistent, and the influence of the same uses type of tidal flat reclamation on different landscapes was also different.

1. Introduction

Coastal wetland, as an important landscape cover type and unique wetland ecosystem in coastal areas, plays an extremely important role in maintaining water, regulating climate and protecting biodiversity [1,2]. However, a great loss of coastal wetlands has been caused by excessive anthropogenic activities at different spatial scales [3,4], which will inevitably lead to the structural degradation of wetland systems and ultimately seriously affect the service supply capacity of regional ecosystems [5,6]. Therefore, to reduce the negative impact of human activities on the ecological environment, a better understanding of the ecological effect of human activities is urgent.
Tidal flat reclamation (TFR), as one of the most important human activities in the coastal area, has a long history in China [7] with a long coastline and abundant coastal wetlands [8,9]. According to statistics, a large number of coastal wetlands have been converted into agricultural land, industrial land, urban land, etc., to meet the needs of various industries [10]. From 1984 to 2018 alone, the coastal wetlands in China shrank from 10,263 km2 to 7400 km2, a decrease of approximately 27.9% [11]. In recent decades, TFR has provided a large number of reserve land resources for the development of various undertakings in coastal areas, which has greatly promoted economic development [12]; however, it has also caused a series of ecological and environmental problems [13,14]. A growing body of research suggests that rapid and large-scale TFR can lead to a sharp decline in coastal wetland resources [15], loss of diversity [16], decrease in coastal ecosystem functions and services [17], etc. Finally, these negative impacts, in turn, can have an impact on the regional environment and are detrimental to the sustainable development of coastal areas [13]. Therefore, facing irreversible ecological degradation caused by TFR, the evaluation of the ecosystem state has become particularly necessary for explicating the impact on ecosystems, which is significant to regional ecological conservation.
In recent years, the ecological impact of TFR has received an increasing amount of attention, and many scholars have conducted relevant research and achieved a series of results [18,19]. As the understanding of the ecological impact of TFR has increased, managers have taken a more scientific approach to formulating land planning and resource conservation policies [20]. However, most of the research has focused on very specific areas of aquatic or terrestrial ecosystems such as biodiversity loss [21], carbon flux [22], heavy metal contamination [23] and the bacterial community [24] and the comprehensive impact of TFR on the ecosystem is still relatively lacking [25].
Stability is an important feature in the structure and function of ecosystems that determines the rise and fall of ecosystems. As an important comprehensive indicator of the ecosystem state, stability has been the focus of ecological researchers to evaluate the ecological conditions of terrestrial ecosystems [26,27]. As ecological stability is a multidimensional concept that covers the different aspects of the dynamics of the system and its response to perturbations, the concept of stability has not yet been defined exactly [27,28]. Due to the differences in the professional backgrounds and research angles of researchers, different scholars often assign different connotations to ecosystem stability according to actual research needs [26,27]. Although there are many different concepts of ecological stability, they all contain the following implications: the ability of a system to remain in the status quo after a disturbance and the ability of a system to return to its original state after being disturbed.
To evaluate the ecological stability of wetlands, many scholars have performed excellent work and constructed many meaningful evaluation indicators. The evaluation of stability has mainly been based on the research objective of selecting a single indicator to characterize stability [29] or based on the structural relationship between multiple indicators by constructing a composite stability evaluation index to comprehensively evaluate stability [30,31]. Commonly used indicators can be roughly divided into three categories: structural indicators, functional indicators and external environmental factor indicators. Structural indicators include the components of animals, plants, microorganisms, soil [32,33], structural characteristic indices [31], etc., in the ecosystem. Functional indicators include the productivity level of the ecosystem [32], carbon absorption capacity [31], surface water availability [34], etc. External environmental factor indicators mainly include the external effects exerted by nature or humans on wetlands [35,36]. However, many functional indicators are difficult to measure, or raw data are difficult to obtain, making it impossible to conduct large-scale, long-term studies. Moreover, external environmental factor indicators are easily subject to subjective cognition and environmental influences and are not easy to quantify. There are also some indicators that are limited to theoretical research and cannot be applied to practice [27].
In view of the fact that most coastal areas tend to display long-term and large-scale TFR, it is necessary to construct an appropriate evaluation indicator when comprehensively evaluating the impact of TFR. The realization of landscape functions requires the support of the landscape structure [37], and the landscape structure can be expressed through the rich information contained in the landscape types and its spatial distribution forms and combinatorial relationships such as the diversity of landscape types, the area of landscape types and the landscape pattern. The change in this kind of information characterizes some of the most critical implications of the complex interactions between natural environment changes and human activities [5,38]. Remote sensing technology is widely used in landscape ecology due to its wide spatial range, long time series and easy access and can obtain rich landscape ecological information [39]. Therefore, a stability evaluation index can be constructed from the perspective of landscape structure based on remote sensing data.
In addition, previous research on the ecological impact of TFR was mostly limited to the impact of a single or several projects [40,41], and the change in the ecological environment before and after the project(s) was usually compared in the whole study area [42]. However, many studies have shown that the impact of human activities on regional ecology has obvious spatio-temporal characteristics [43], indicating that the characteristics of the impact of TFR inside and outside the reclamation area are not necessarily the same. Even within the non-reclamation area, the influence in different locations may be different. At the same time, the ecological impact of TFR has obvious spatial-temporal accumulation characteristics, and the impact at different times and different locations is constantly superimposed. Therefore, combined with long-term and multiperiod data, research on the spatio-temporal characteristics of the ecological impact of TFR is still lacking.
In this paper, we aim to make a modest step toward understanding the ecological impact of TFR from the perspective of landscape ecological stability by choosing the Jiangsu coastal area as a case study. Combined with multiperiod remote sensing data from 1980 to 2018, this study evaluated the impact of TFR on landscape pattern and determined the impact range of TFR. On this basis, the spatio-temporal variation characteristics of stability were analyzed, and the relationship between TFR and stability was quantitatively analyzed, both of which are expected to provide a meaningful reference for the future conservation and management of coastal wetland resources.

2. Materials and Methods
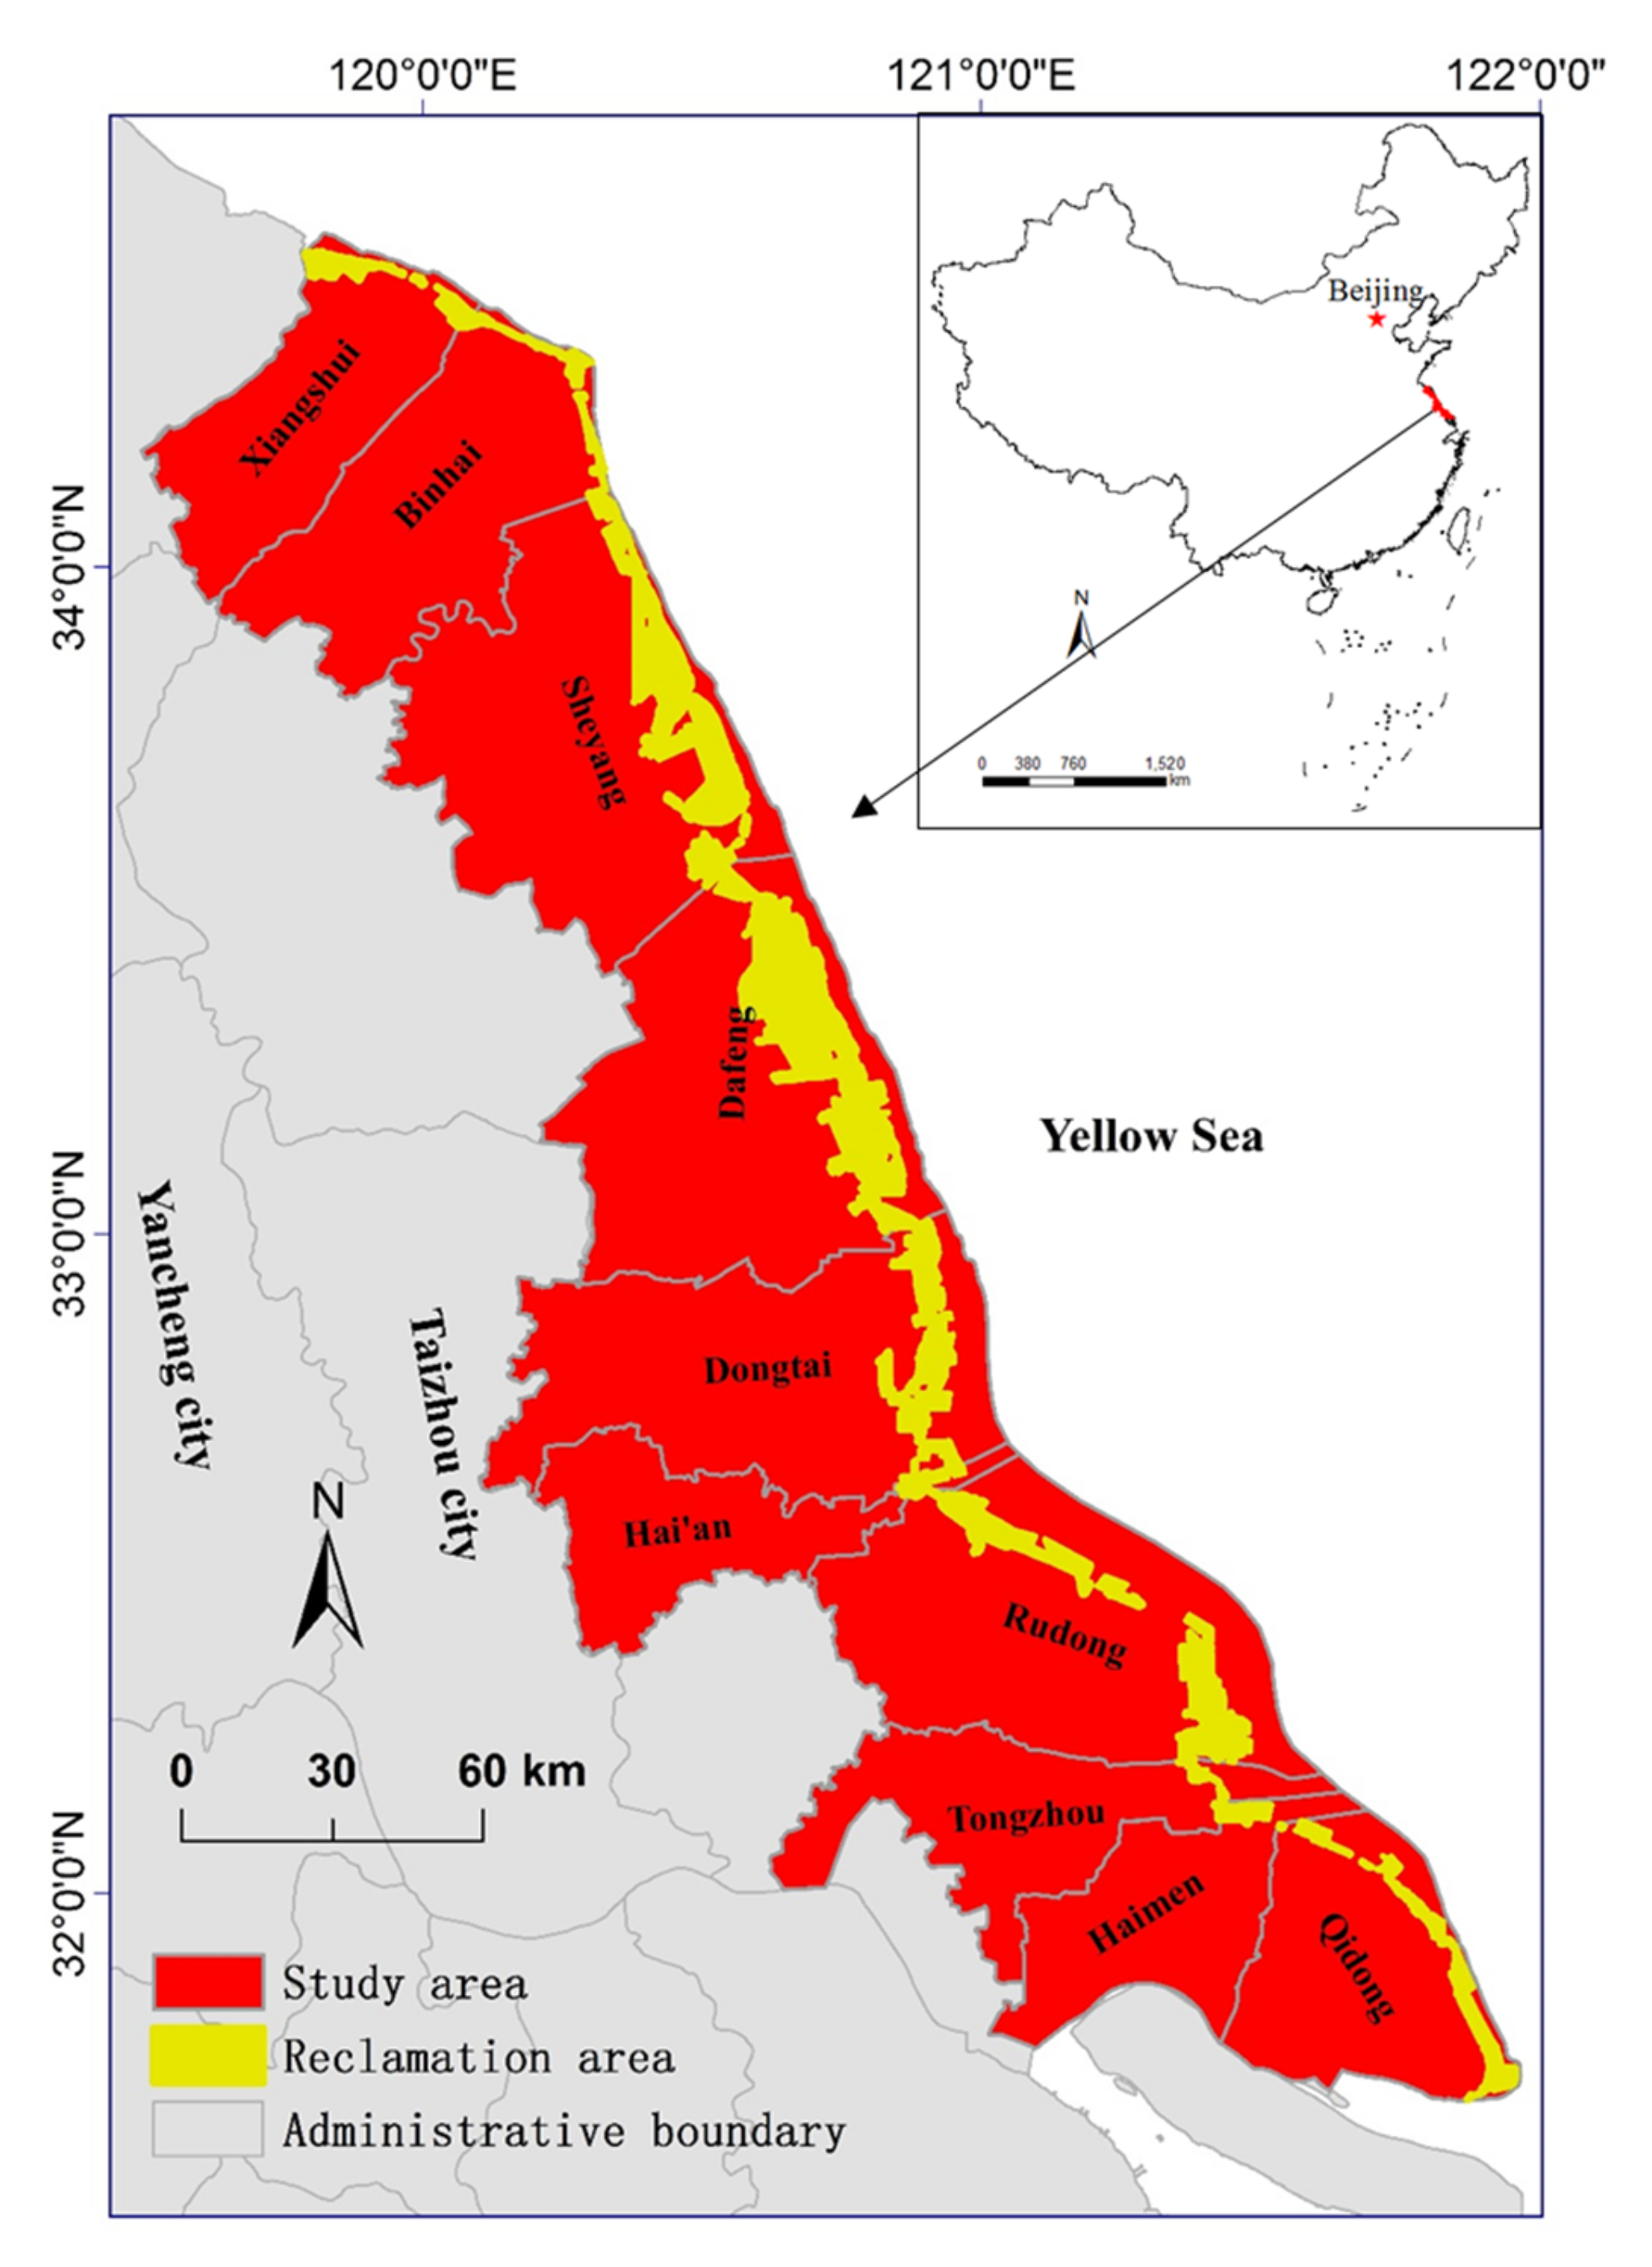
2.1. Study Area

The Jiangsu coastal area, as one of the regions with the richest wetland resources, is located in eastern China and adjacent to the Yellow Sea (Figure 1). The coverage is between 119°28′–121°59′ E and 31°39′–34°31′ N. In this region, there are a total of 10 cities and counties, as follows: Xiangshui, Binhai, Sheyang, Dafeng, Dongtai, Haian, Rudong, Tongzhou, Haimen, and Qidong. Due to the differences in the natural geographical environment, the northern part of the coastal wetlands is mainly dominated by rocky sand and substrate, and the central and southern parts are dominated by muddy coast, which is conducive to the formation of tidal flats. According to previous surveys, the coastline is approximately 954 km, accounting for approximately 5% of the total length of China’s coastline [44,45]. Abundant natural wetlands provide important habitats for endangered animal species and maintain regional biodiversity and at the same time provide sufficient reserve land resources to meet different land needs such as agricultural land and construction land. However, with the development of the economy, the short-term impact of human activities on the regional landscape ecology and its cumulative effect have gradually emerged. Therefore, the Jiangsu coastal area, due to its unique natural conditions and intense TFR, is a typical area for studying the ecological impact of TFR on the coastal area.

2.2. Data Sources and Preprocessing

The data we collected and used in this study involved both primary and secondary data. The primary data included Landsat MSS/TM/ETM+/OLI data for almost 40 years, as follows: 1980, 1983, 1986, 1992, 1995, 2000, 2005, 2008, 2011, 2014 and 2018 [45]. To fully cover the entire study area, three scenes of images were used for each target year. All the remote sensing data involved in this study were mainly cloud-free and acquired from August to October, with path/row numbers of 120/036, 119/037 and 118/038 (the path/row numbers for 1980 are 129/036), and with a spatial accuracy of 30m (the accuracy of remote sensing data in 1980 is 80 m). Considering that the size of the landscape patches in the study area was between 1.83 and 3.06 km, the 30m or 80m spatial accuracy was sufficient [5].
To meet the requirements of this study, 17 landscape types (Table 1), including natural wetlands, artificial wetlands, and non-wetlands (for the sake of discussion, non-wetlands were considered a special type of wetlands in this study), were extracted based on an object-oriented remote sensing interpretation method supplemented by visual interpretation. The interpretation results showed that the overall accuracy was more than 90%, which met our research requirements. In addition, vector data, including the provincial, municipal and county administrative boundaries of the administrative divisions of Jiangsu province, were used as secondary data.

2.3. The Identify of Use Types of Reclamation

Based on the remote sensing interpretation results and combined with the main use types of reclamation in the Jiangsu coastal area in the past 38 years (regarding 2018, the same as below), five main use types of reclamation were identified by overlay analysis.
To identify the transformation of TFR from the change in landscape types in each time period, sequential spatial overlay analysis was run on the landscape vector data layers for 1980, 1983, 1986, 1992, 1995, 2000, 2005, 2008, 2011, 2014 and 2018 using the overlay module of ArcGIS version 10.2. The results showed great continuous transformation of landscape change over the past 38 years. As the transformation processes information during a specific time period (e.g., 1980–1983, 1983–1986 and 1986–1992) can be identified by comparing the start-point landscape types with the end-point landscape types (e.g., a transformation from a tidal flat into a port area indicates a typical reclamation) [46], five major use types of reclamation were identified (Table 2). These types included aquaculture land (AQL), arable land (ARL), port construction land (POL), salt industry land (SAL) and hydraulic engineering land (HYL). In addition, as the area from tidal flats to woodland and bare land was minimal, neither transition was taken into account.

2.4. Buffer Analysis

Buffer analysis, as an important spatial analysis tool, is often used to identify changes in ecosystems, which are affected by human activities or other disturbance [47]. To analyze the spatial characteristics of landscape pattern and stability under the influence of TFR, one-sided buffer zones were constructed along the boundary of the reclamation area based on the Geographic Information System (GIS). A total of 12 bands with a width of 4.5 km were distributed on the landward side of the reclamation area (the southwest side). The width of levees was not accounted for in this study. To facilitate the further discussion, each buffer zone was numbered 1-12 from nearest to farthest according to its distance to the reclamation area.

2.5. Evaluation of the Ecological Stability in the Jiangsu Coastal Area

Based on the background structure (the optimal area proportion of the landscape types) of the Jiangsu coastal area, the stability index, as an indicator of local ecological stability, was used to evaluate the impact of TFR on ecological stability in the Jiangsu coastal area. The ecological stability index equation is as follows:
I = i = 0 m ( A i A s B i ) 2 m 2
where I is the stability index of the target area; A i is the area of landscape type i in the study area; A s is the total area of the study area; B i is the proportion of type i’s area to the area of the study area in the background structure; m is the number of landscape types in the study area. Stability index I can be understood as the standard deviation of the landscape structure over a certain time period and the background structure, so the smaller the I, the better the stability in a region.
The calculation of the background structure was mainly based on the theory of competition/coexistence. First, the ecological service game/competition model was constructed by using the reference point-based non-dominated sorting (NSGA-III) algorithm. The optimal solution as the optimal balance of ecosystem services was obtained using this model [45]. Finally, the corresponding landscape type area and area ratio (background structure; Table 3) were obtained based on the cascading relationship of “process-function-service”. (For a specific calculation method, see reference [45]).

2.6. Statistical Analyses

To analyze the stability trend with distance from the reclamation area, the ordinary least squares (OLS) method was used in this study. In addition, the Pearson correlation coefficients between the stability index and the cumulative area of reclamation in the affected area, the reclamation area and non-reclamation area were calculated to quantitatively analyze the effects of TFR on stability. All statistical analyses were conducted in SPSS 23. Statistical significance was at the 0.05 level.

2.7. Landscape Indices

To determine the spatial extent of the impact of TFR on the regional ecology, based on previous research [5,43,48,49], and taking into account the ecological significance of landscape patter indices, the fragmentation index (fragmentation), cohesion index (COHESION) and Shannon’s Diversity Index (SHDI) were selected in this study. The landscape pattern indices of each buffer zone were calculated according to the formulas as follows:
Fragmentation characterizes the degree of fragmentation of the landscape, reflects the complexity of the spatial structure of the landscape, and to a certain extent reflects the degree to which human activities affect the landscape. The formula is as follows:
C i = N i A i
where C i is the fragmentation of landscape type i ; N i is the number of patches of landscape type i ; A i is the total area of landscape type i . To understand the degree of fragmentation of all types as a whole, we divided the total number of patches in a target area by the total area of this area.
COHESION reflects the aggregation and dispersion of patches in the landscape,
−1< COHESION < 1. When the value is −1, the patches are completely dispersed; when the value is 0, the patches are randomly distributed; when the value is 1, the patches are clustered.
COHESION = 1 j = 1 m p ij j = 1 m p ij a ij [ 1 1 A ] 1 100
where a ij is the area(m2) of the j th patch in the landscape type i ; p ij presents the circumference (m) of the j th patch in the landscape type i ; A is the total area of the landscape type i (hm2).
SHDI is used to describe the diversity and complexity of landscape patches, SHDI ≥ 0. When SHDI = 0, the landscape contains only 1 landscape. When SHDI is large, the proportional distribution of area among landscape types becomes more equitable, and the complexity of the ecosystem composition usually tends to increase.
SHDI = i = 1 m p i ln p i
where P i is the area ratio of patch type i to a target area; m is the number of all patch types.
In addition, the overall transfer probability ( P ) of the target area was also calculated in this study. The probability of landscape transfer indicates the likelihood of a landscape transformation within an area. It is calculated as follows:
P = i = 1 n l i S
where P is the overall transfer probability of the target area; l i is the area of landscape type i that is converted to other landscape types in a certain period; S is the area of the target area; n is the number of landscape types in the start year of the target period;

3. Results

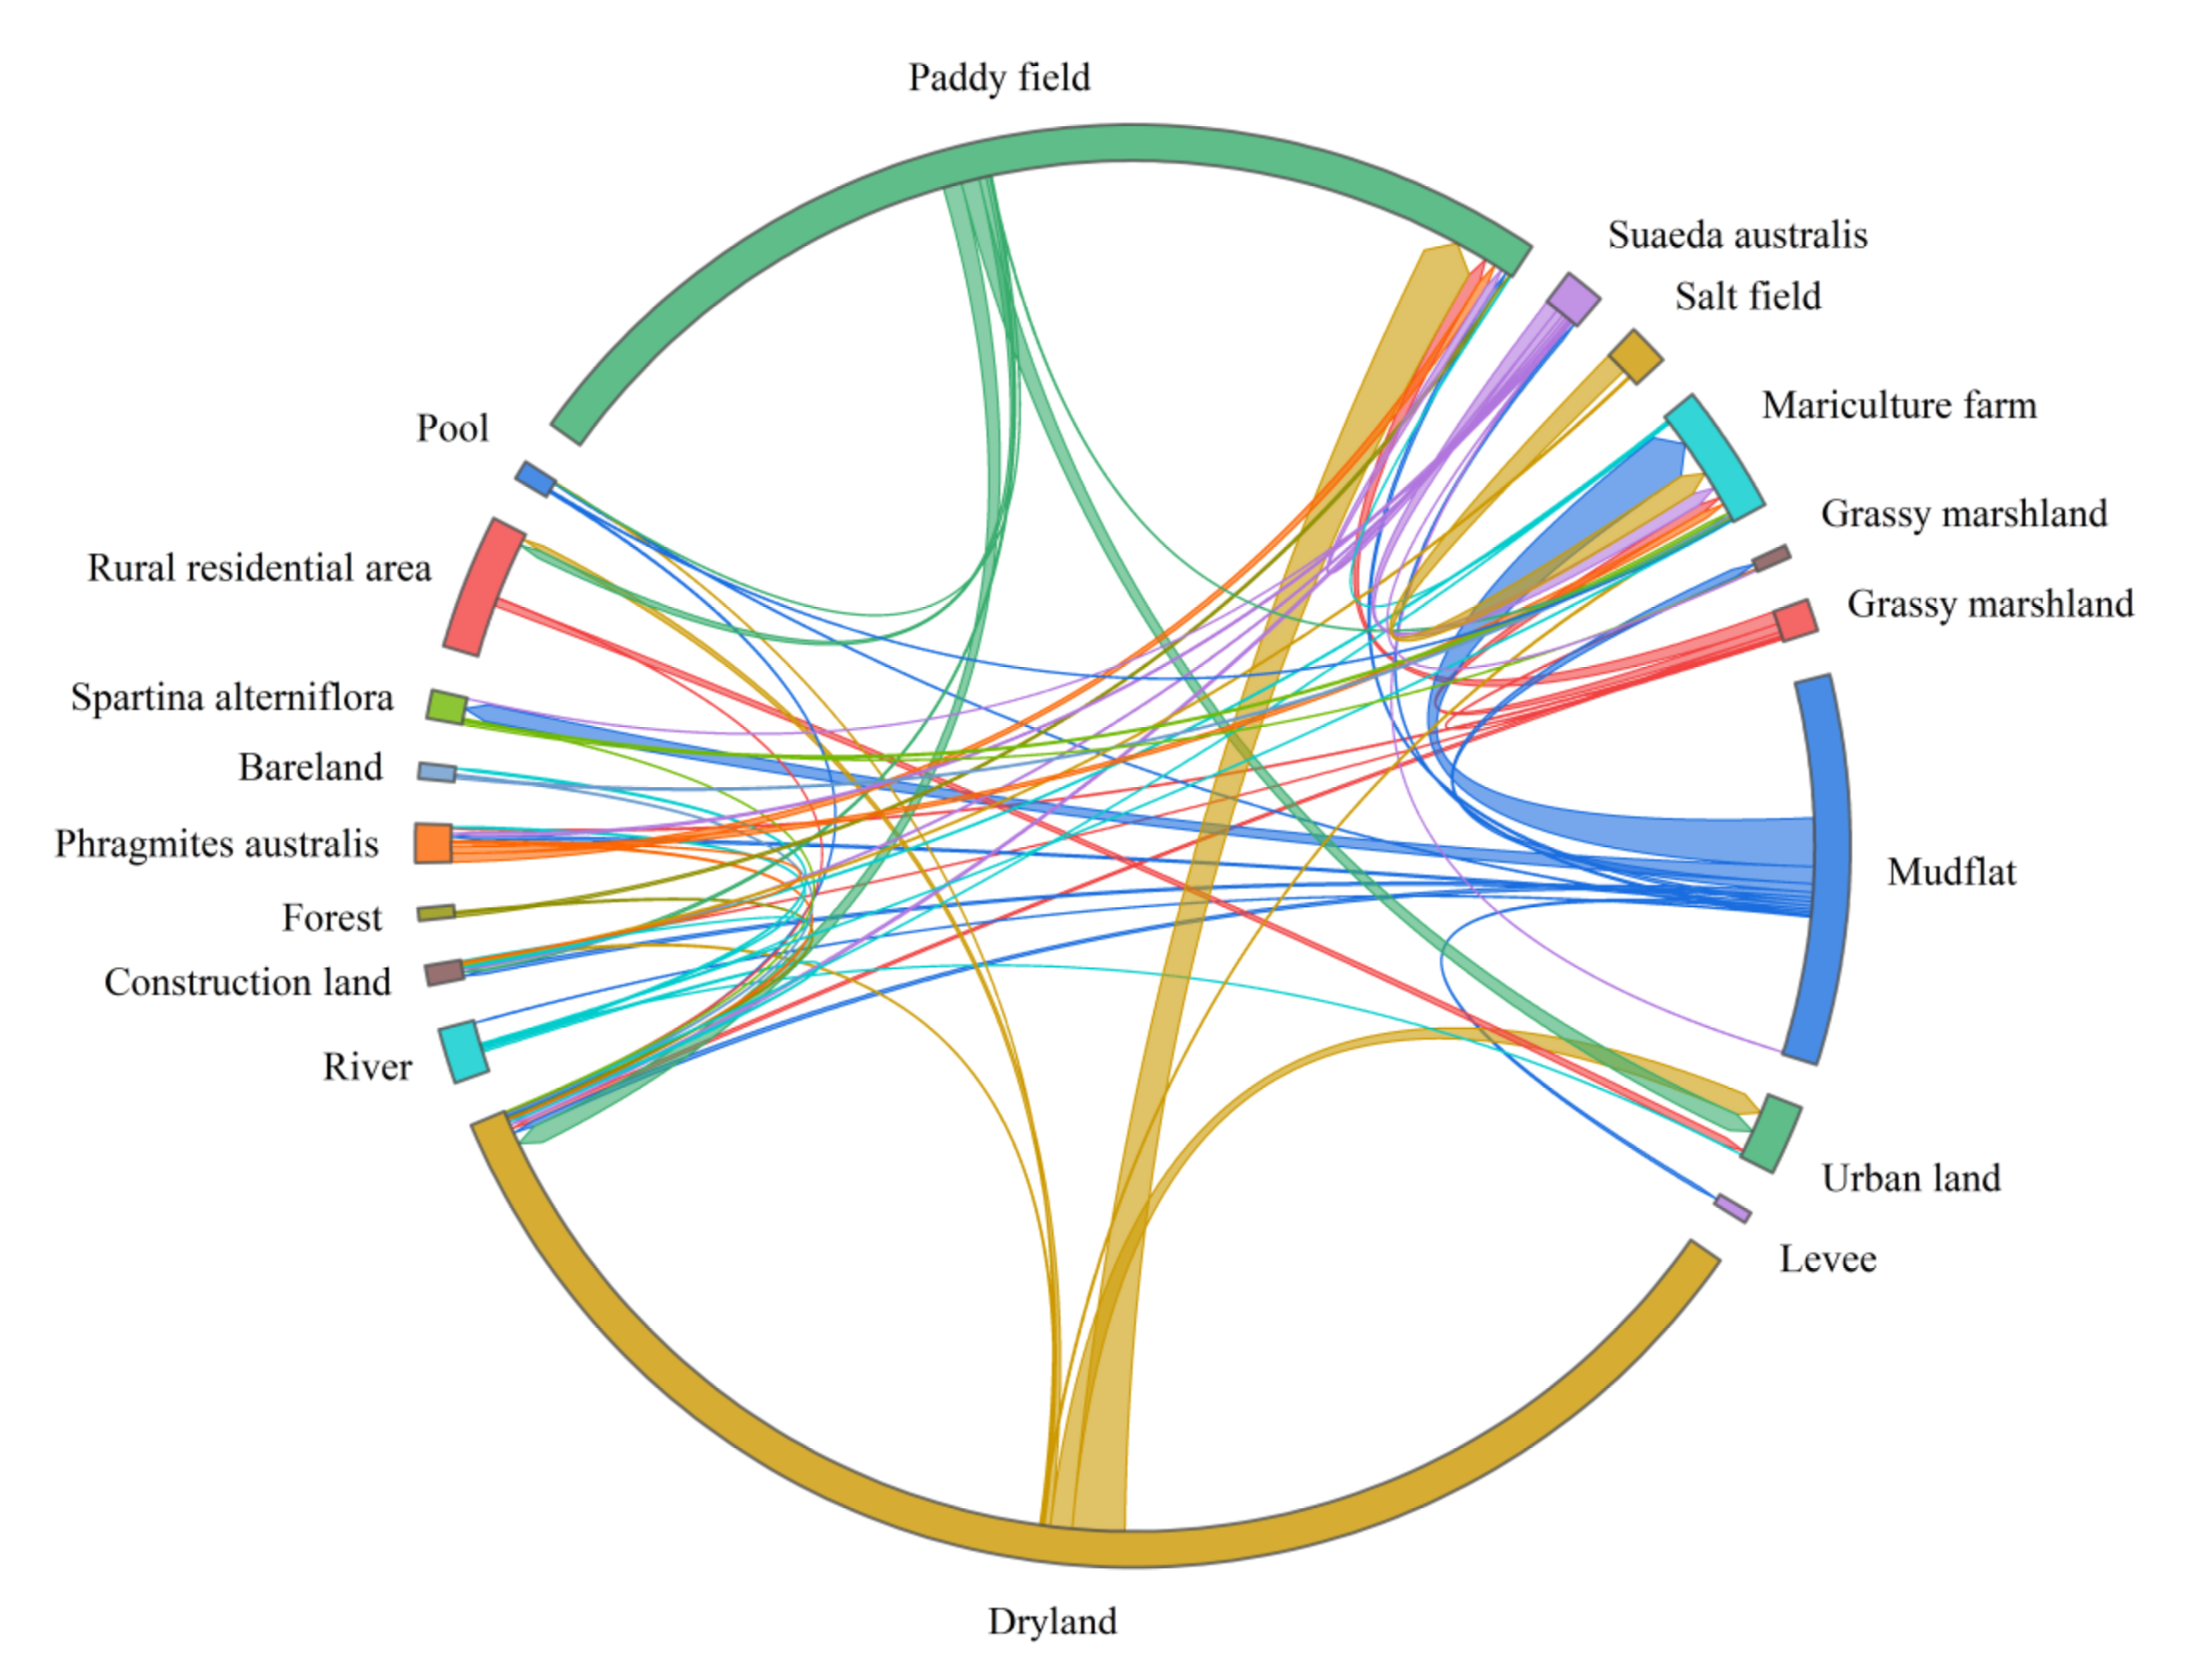
3.1. Major Landscape Transformation Features

3.1.1. Analysis of the Landscape Change Process

In the past 38 years, the main landscape change throughout the study area was characterized by a significant decrease in natural wetlands and a significant increase in artificial wetlands and non-wetlands (Figure 2). Specifically, natural wetlands decreased by 2477.64 km2 (41.63%), and artificial wetlands and non-wetlands increased by 1987.32 km2 (21.77%) and 378.89 km2 (2.96%), respectively.
Among natural wetlands, the mudflat and coastal marshes decreased by 1600.42 km2 and 756.59 km2, respectively and accounted for 60.11% and 28.26% of the total natural wetlands outflow area, respectively. Mariculture farms and paddy fields were the main contributors to the increase in artificial wetlands, increasing by 1736.73 km2 and 657.34 km2, respectively, and accounting for 72.51% and 27.44% of the total inflow area of artificial wetlands, respectively. The increase in non-wetlands was mainly due to the increase in residential land (including rural residential land and urban land) and construction land, and the area of residential land and construction land increased by 945.69 km2 and 296.54 km2, respectively, accounting for 73.67% and 23.10% of the total non-wetlands inflow area, respectively.

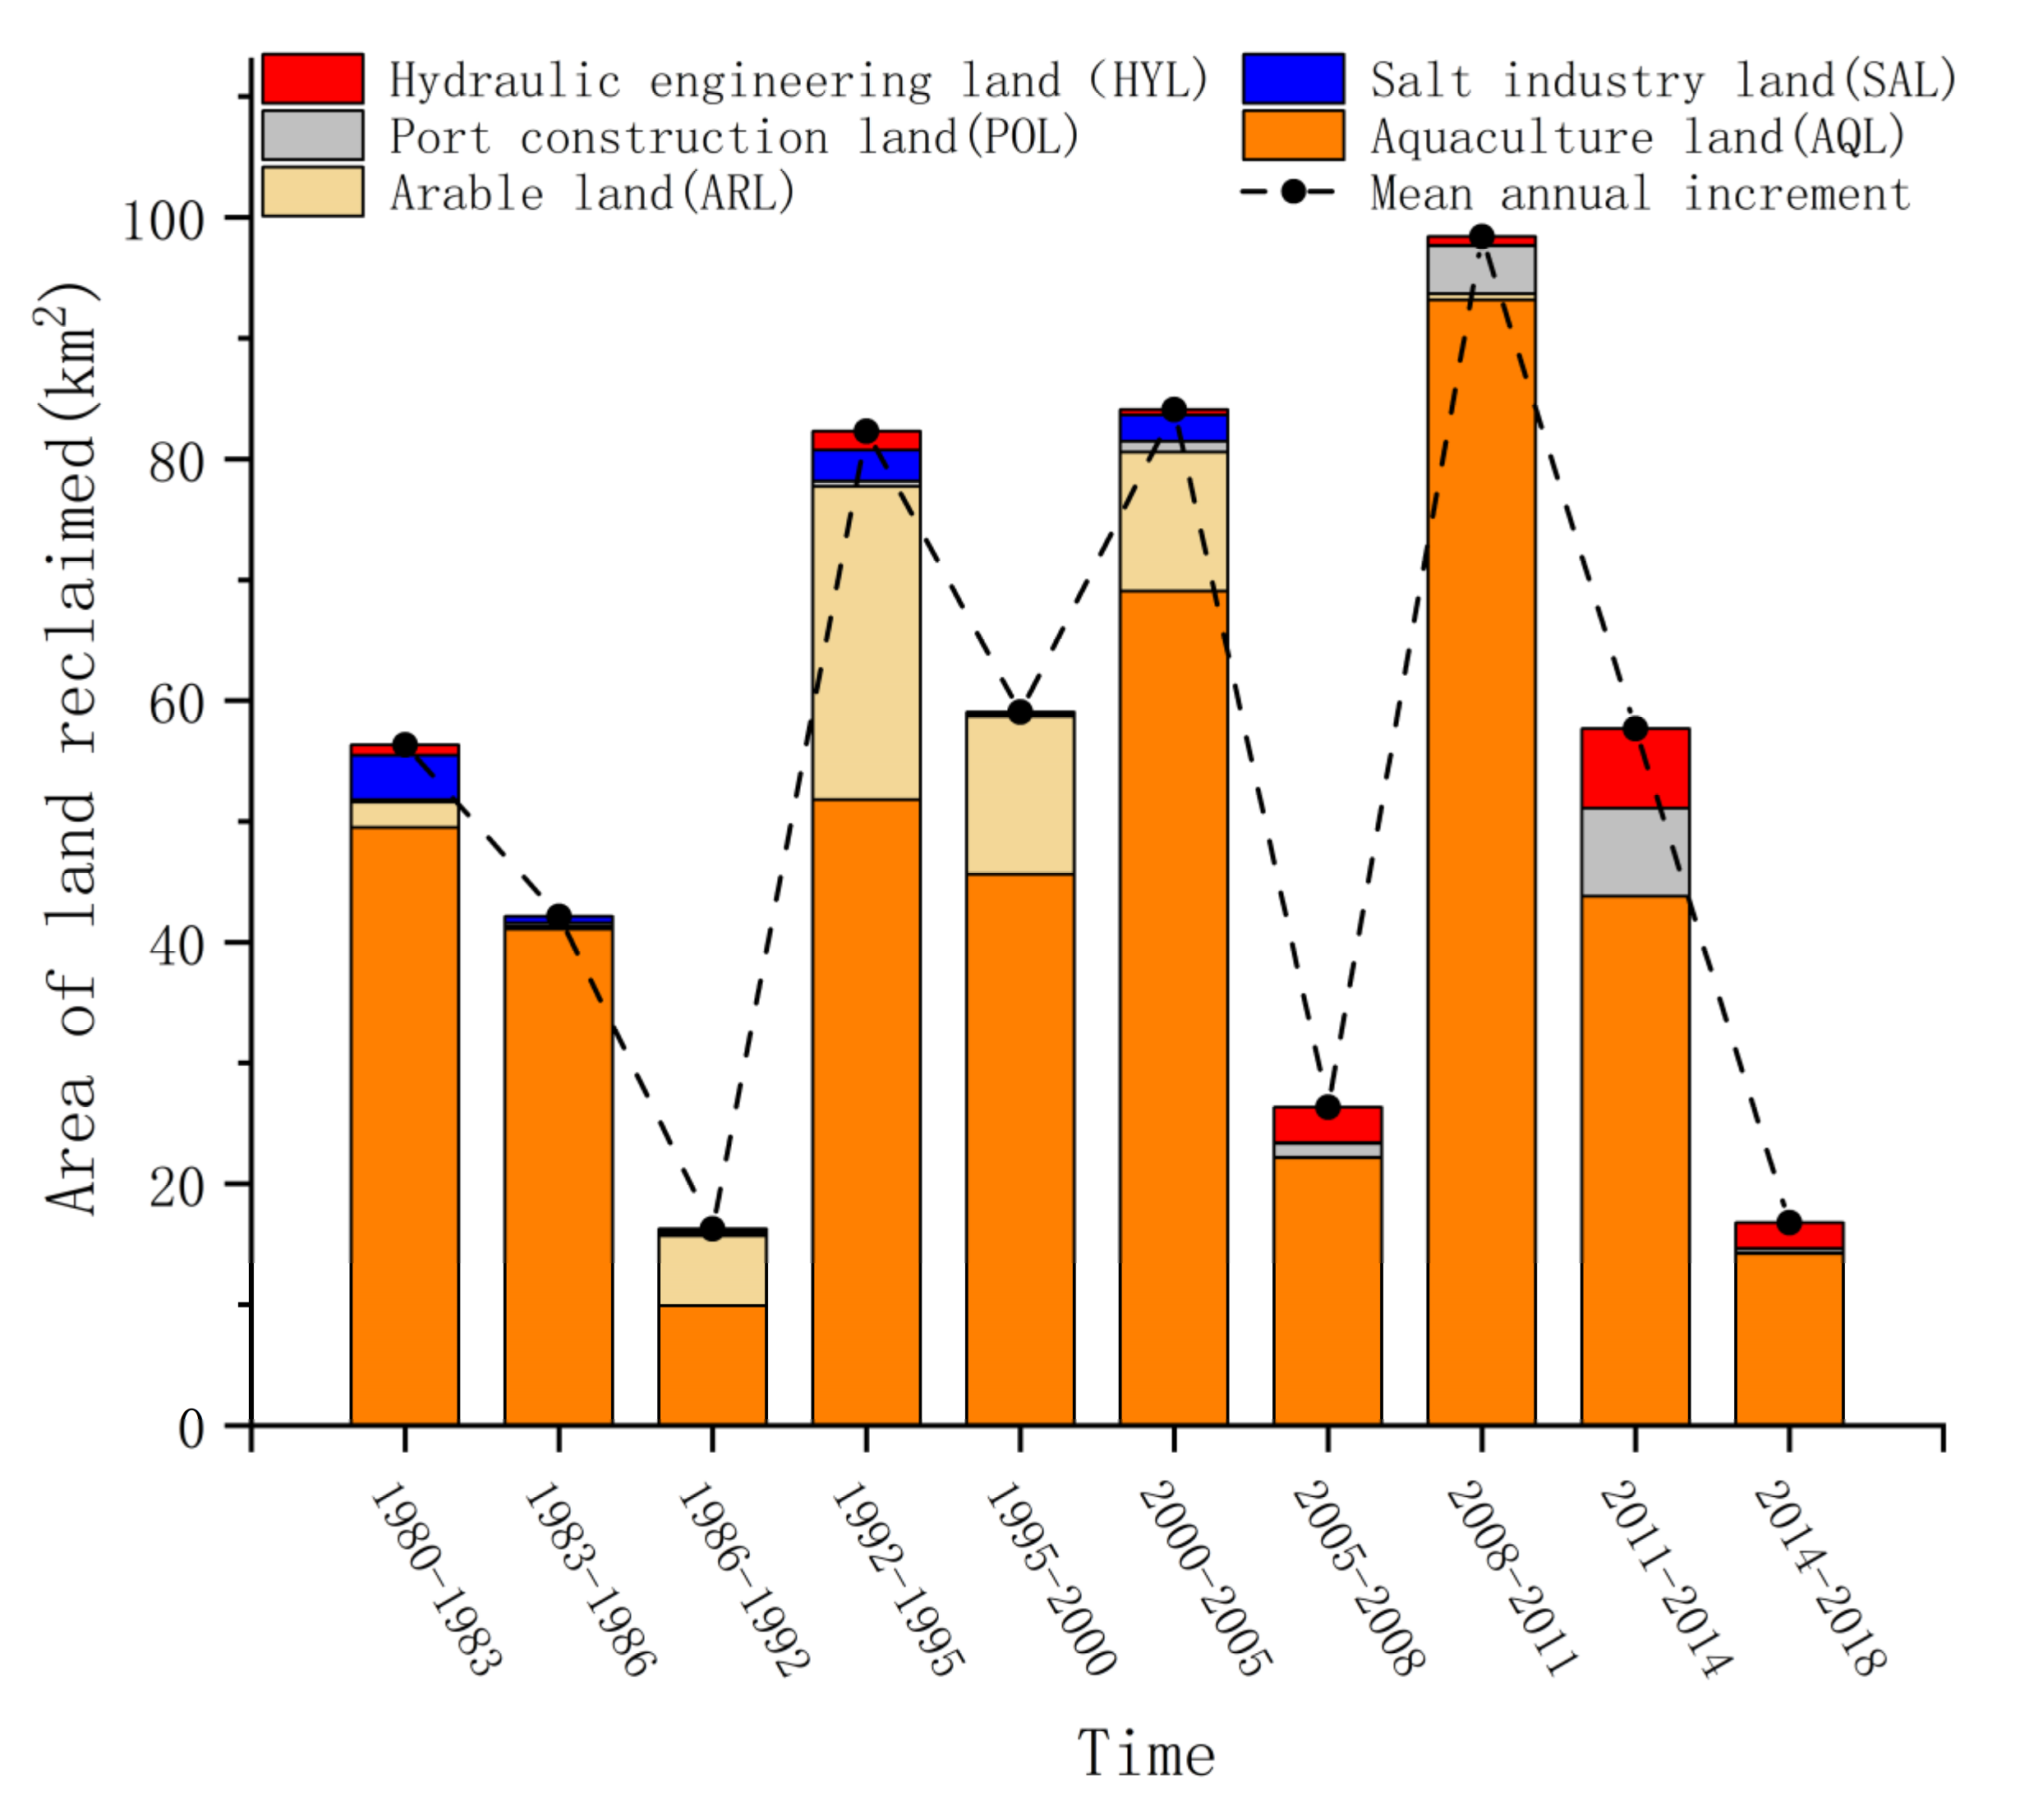
3.1.2. Analysis of TFR process

Due to the natural conditions and policy-oriented reclamation planning, landscape transformation in the Jiangsu coastal area was spatially distinct. The reduced natural wetlands were mainly concentrated in the reclamation area in the tidal flats. Overall, from 1980 to 2018, a total of 1969.86 km2 of coastal wetlands was reclaimed across the tidal flat area in Jiangsu province, and a consistently increasing annual rate of 51.84 km2 was observed. From the perspective of time course (Figure 3), the intensity of reclamation showed a generally fluctuating upward trend during the period 1980–2011, reaching a maximum value in 2008–2011, and then showing a rapid downward trend.
The majority of reclamation occurred in the middle of the coastal wetlands. Specifically, over 85.1% of the reclamation occurred in Dongtai, Rudong, Sheyang and Dafeng. Especially, approximately 35% of the reclamation occurred in Dafeng, where the average annual reclamation area between 1990 and 2005 (36.3 km2) was two times higher than that over the past 38 years. For administrative reasons, there has been only 12.6 km2 wetlands reclaimed in Tongzhou in the past 38 years, with a rate of less than 1 km2 per year.
In terms of use types, nature wetlands were mainly occupied by aquaculture land (APL) and arable land (ARL), followed by hydraulic engineering land (HYL), port construction land (POL) and, salt industry land (SAL), accounting for the total amount of reclamation 81.94%, 12.40%, 2.60%, 2.42%, and 1.64%, respectively. Aquaculture land was an absolute advantage at all time. When aquaculture land was not considered, the main use types were salt industry land (SAL) and arable land (ARL) in 1980–2005. After 2005, the main use types were port construction land (POL) and hydraulic engineering land (HYL), indicating that the use types of TFR shifted from agriculture to industry.
In non-reclamation areas, landscape transformation mainly occurred near tidal flats and at the junction of paddy field and dry land. Except for the large-scale transition between paddy field and dryland, a large amount of construction land and urban and rural settlements have been transferred from paddy field and dryland. The transformation from rural residential land and construction land to urban land also accounted for a certain amount.

3.2. Change in Cological Stability in the Coastal Area

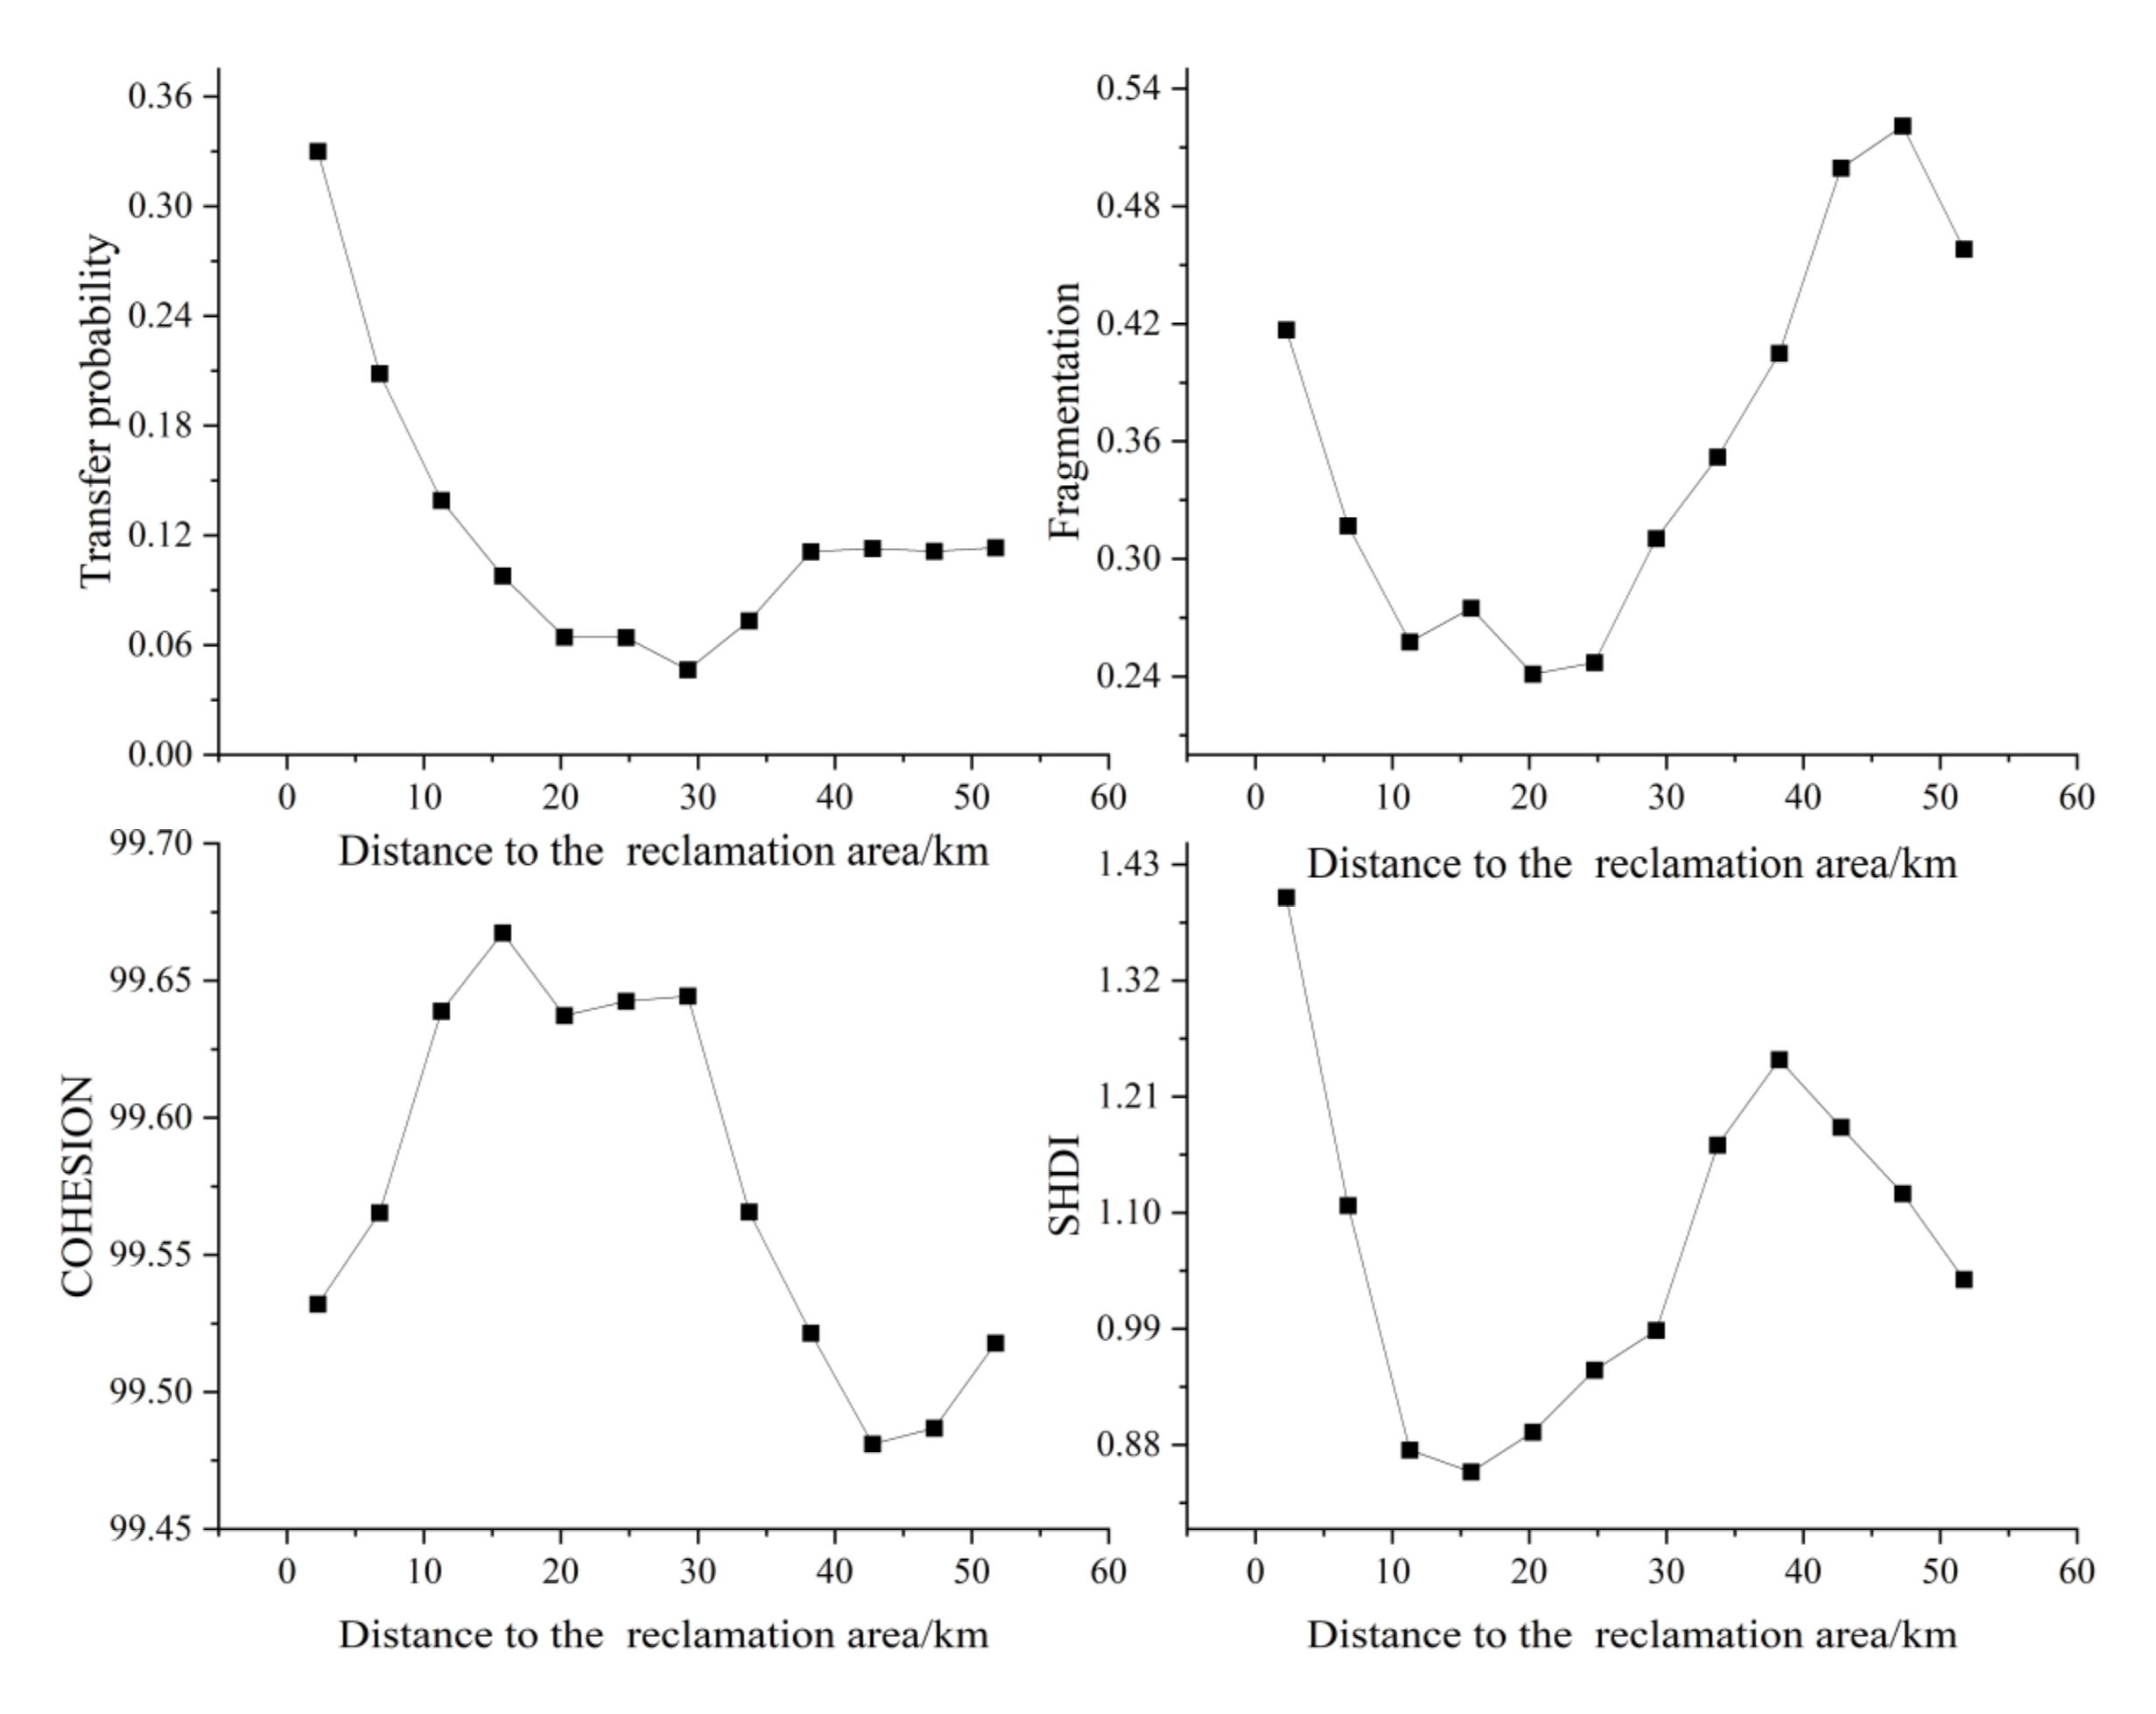
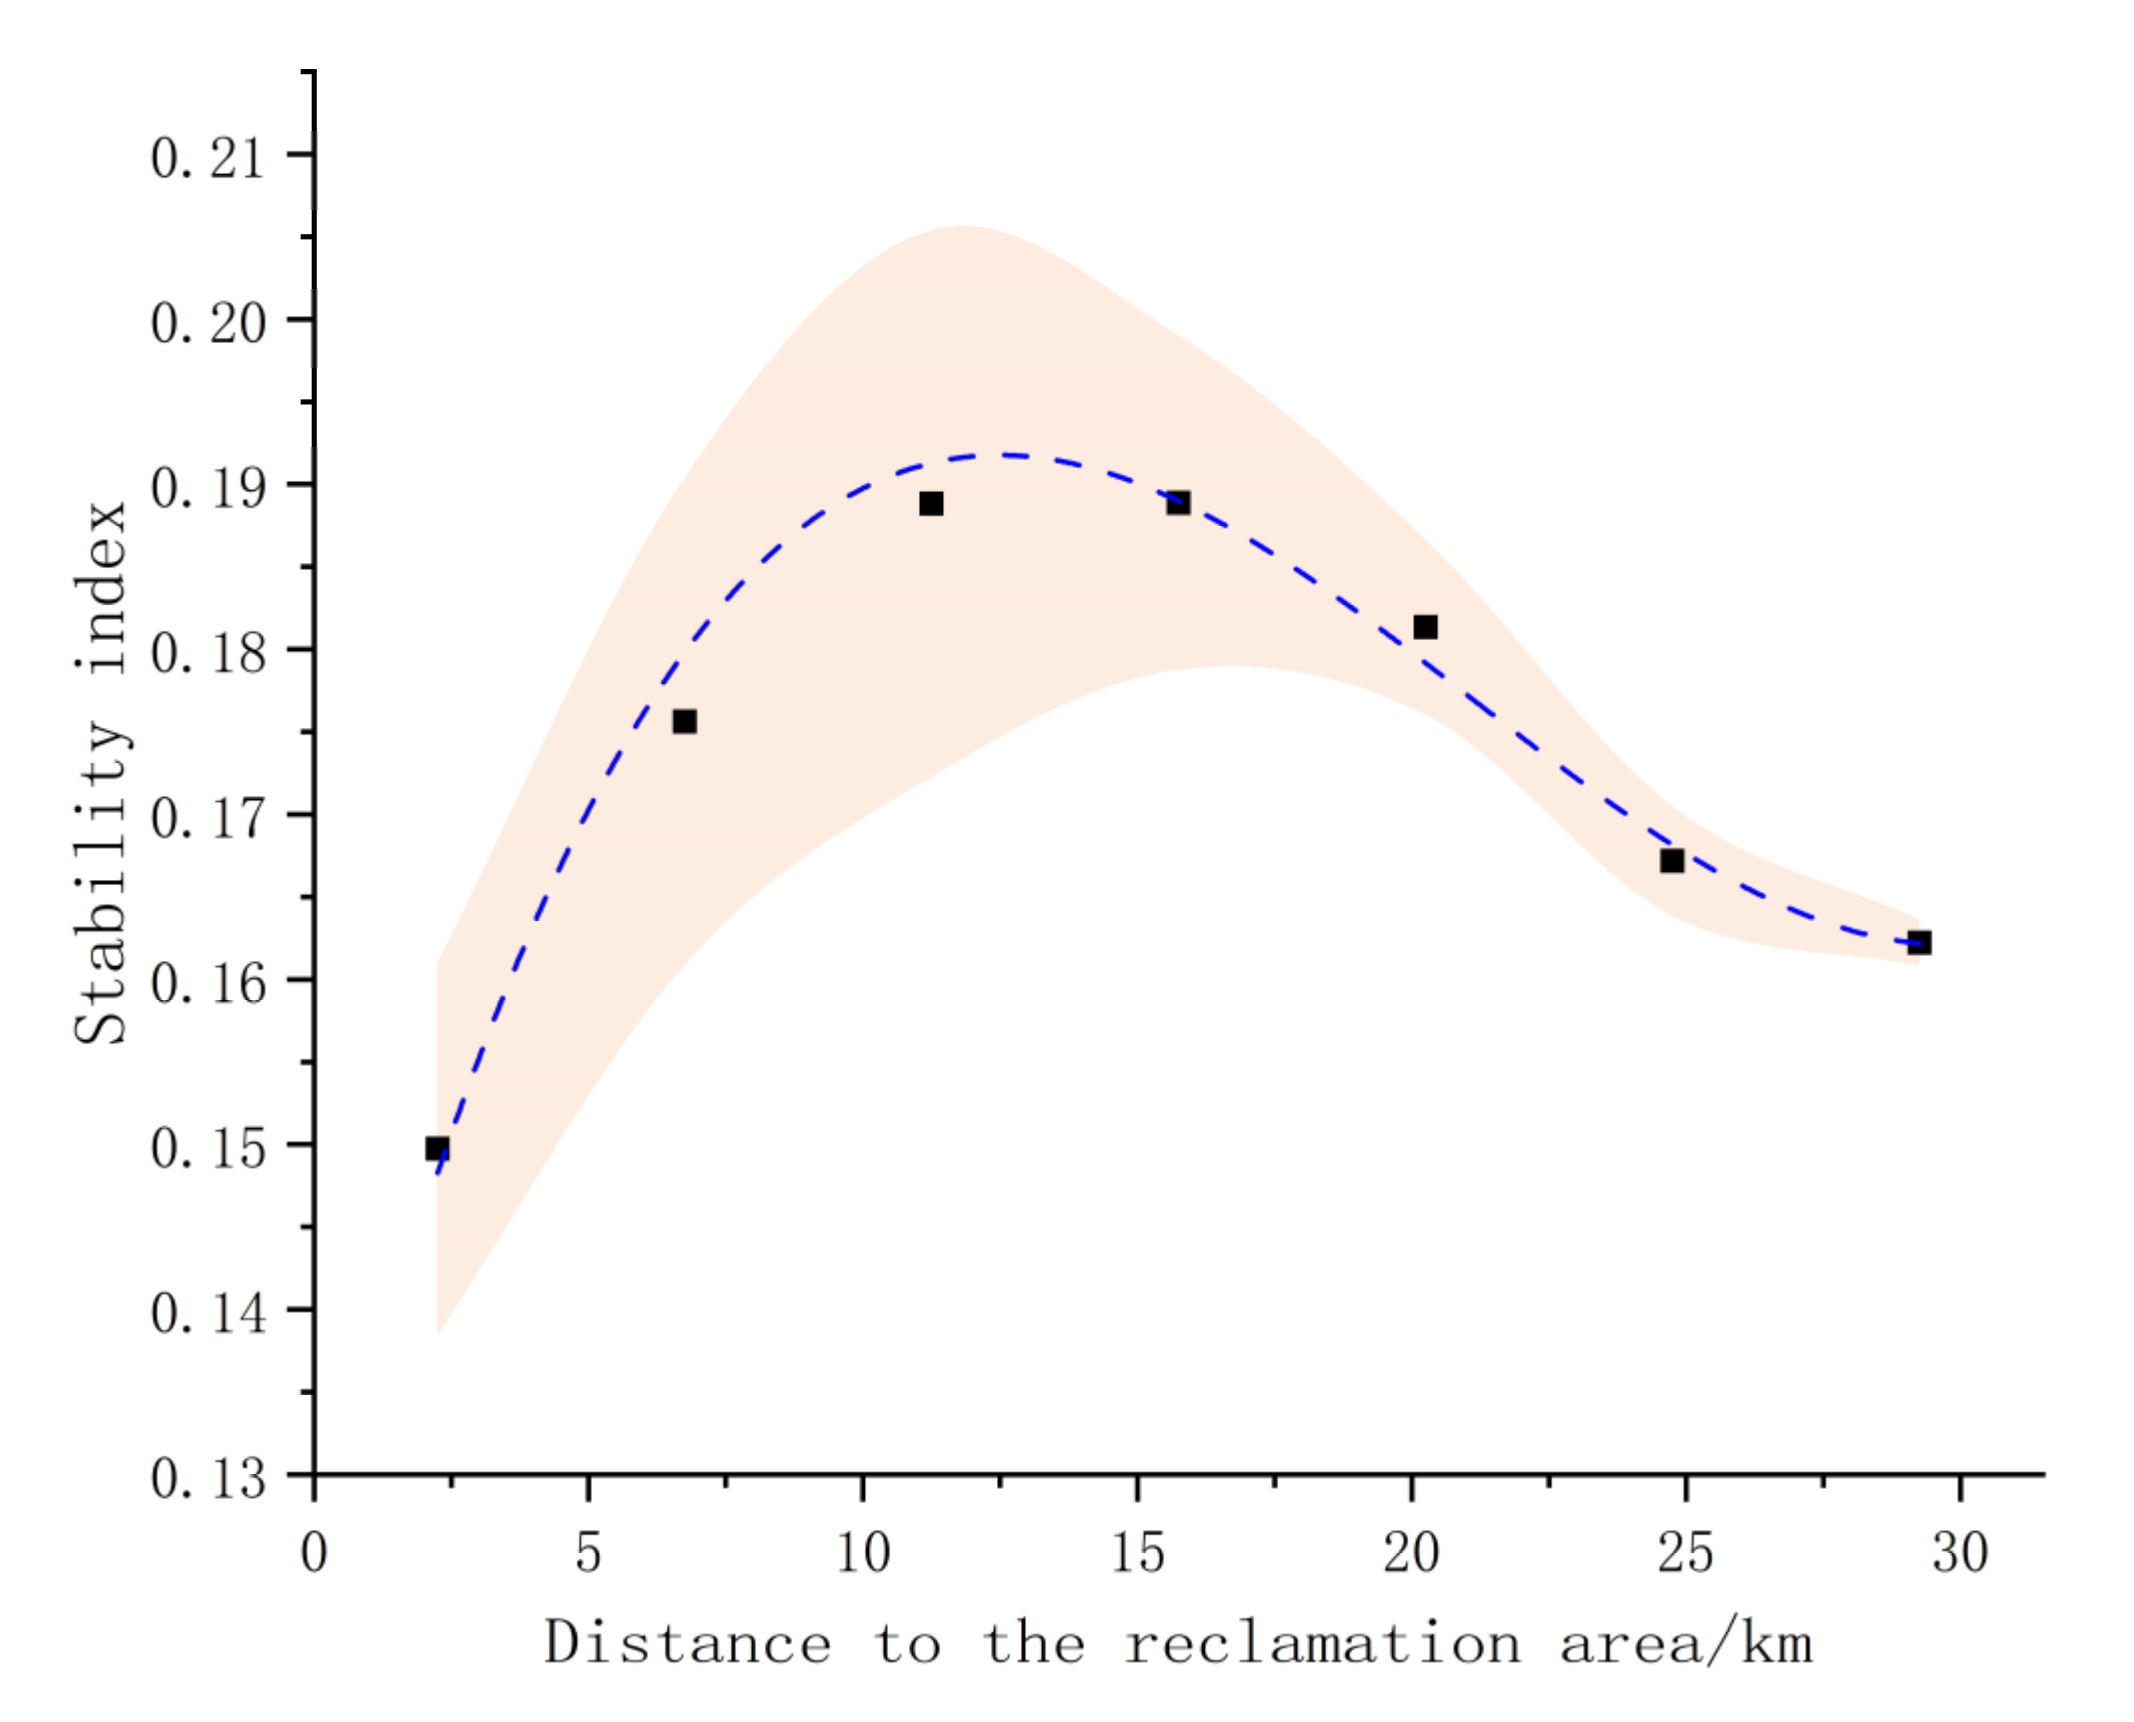
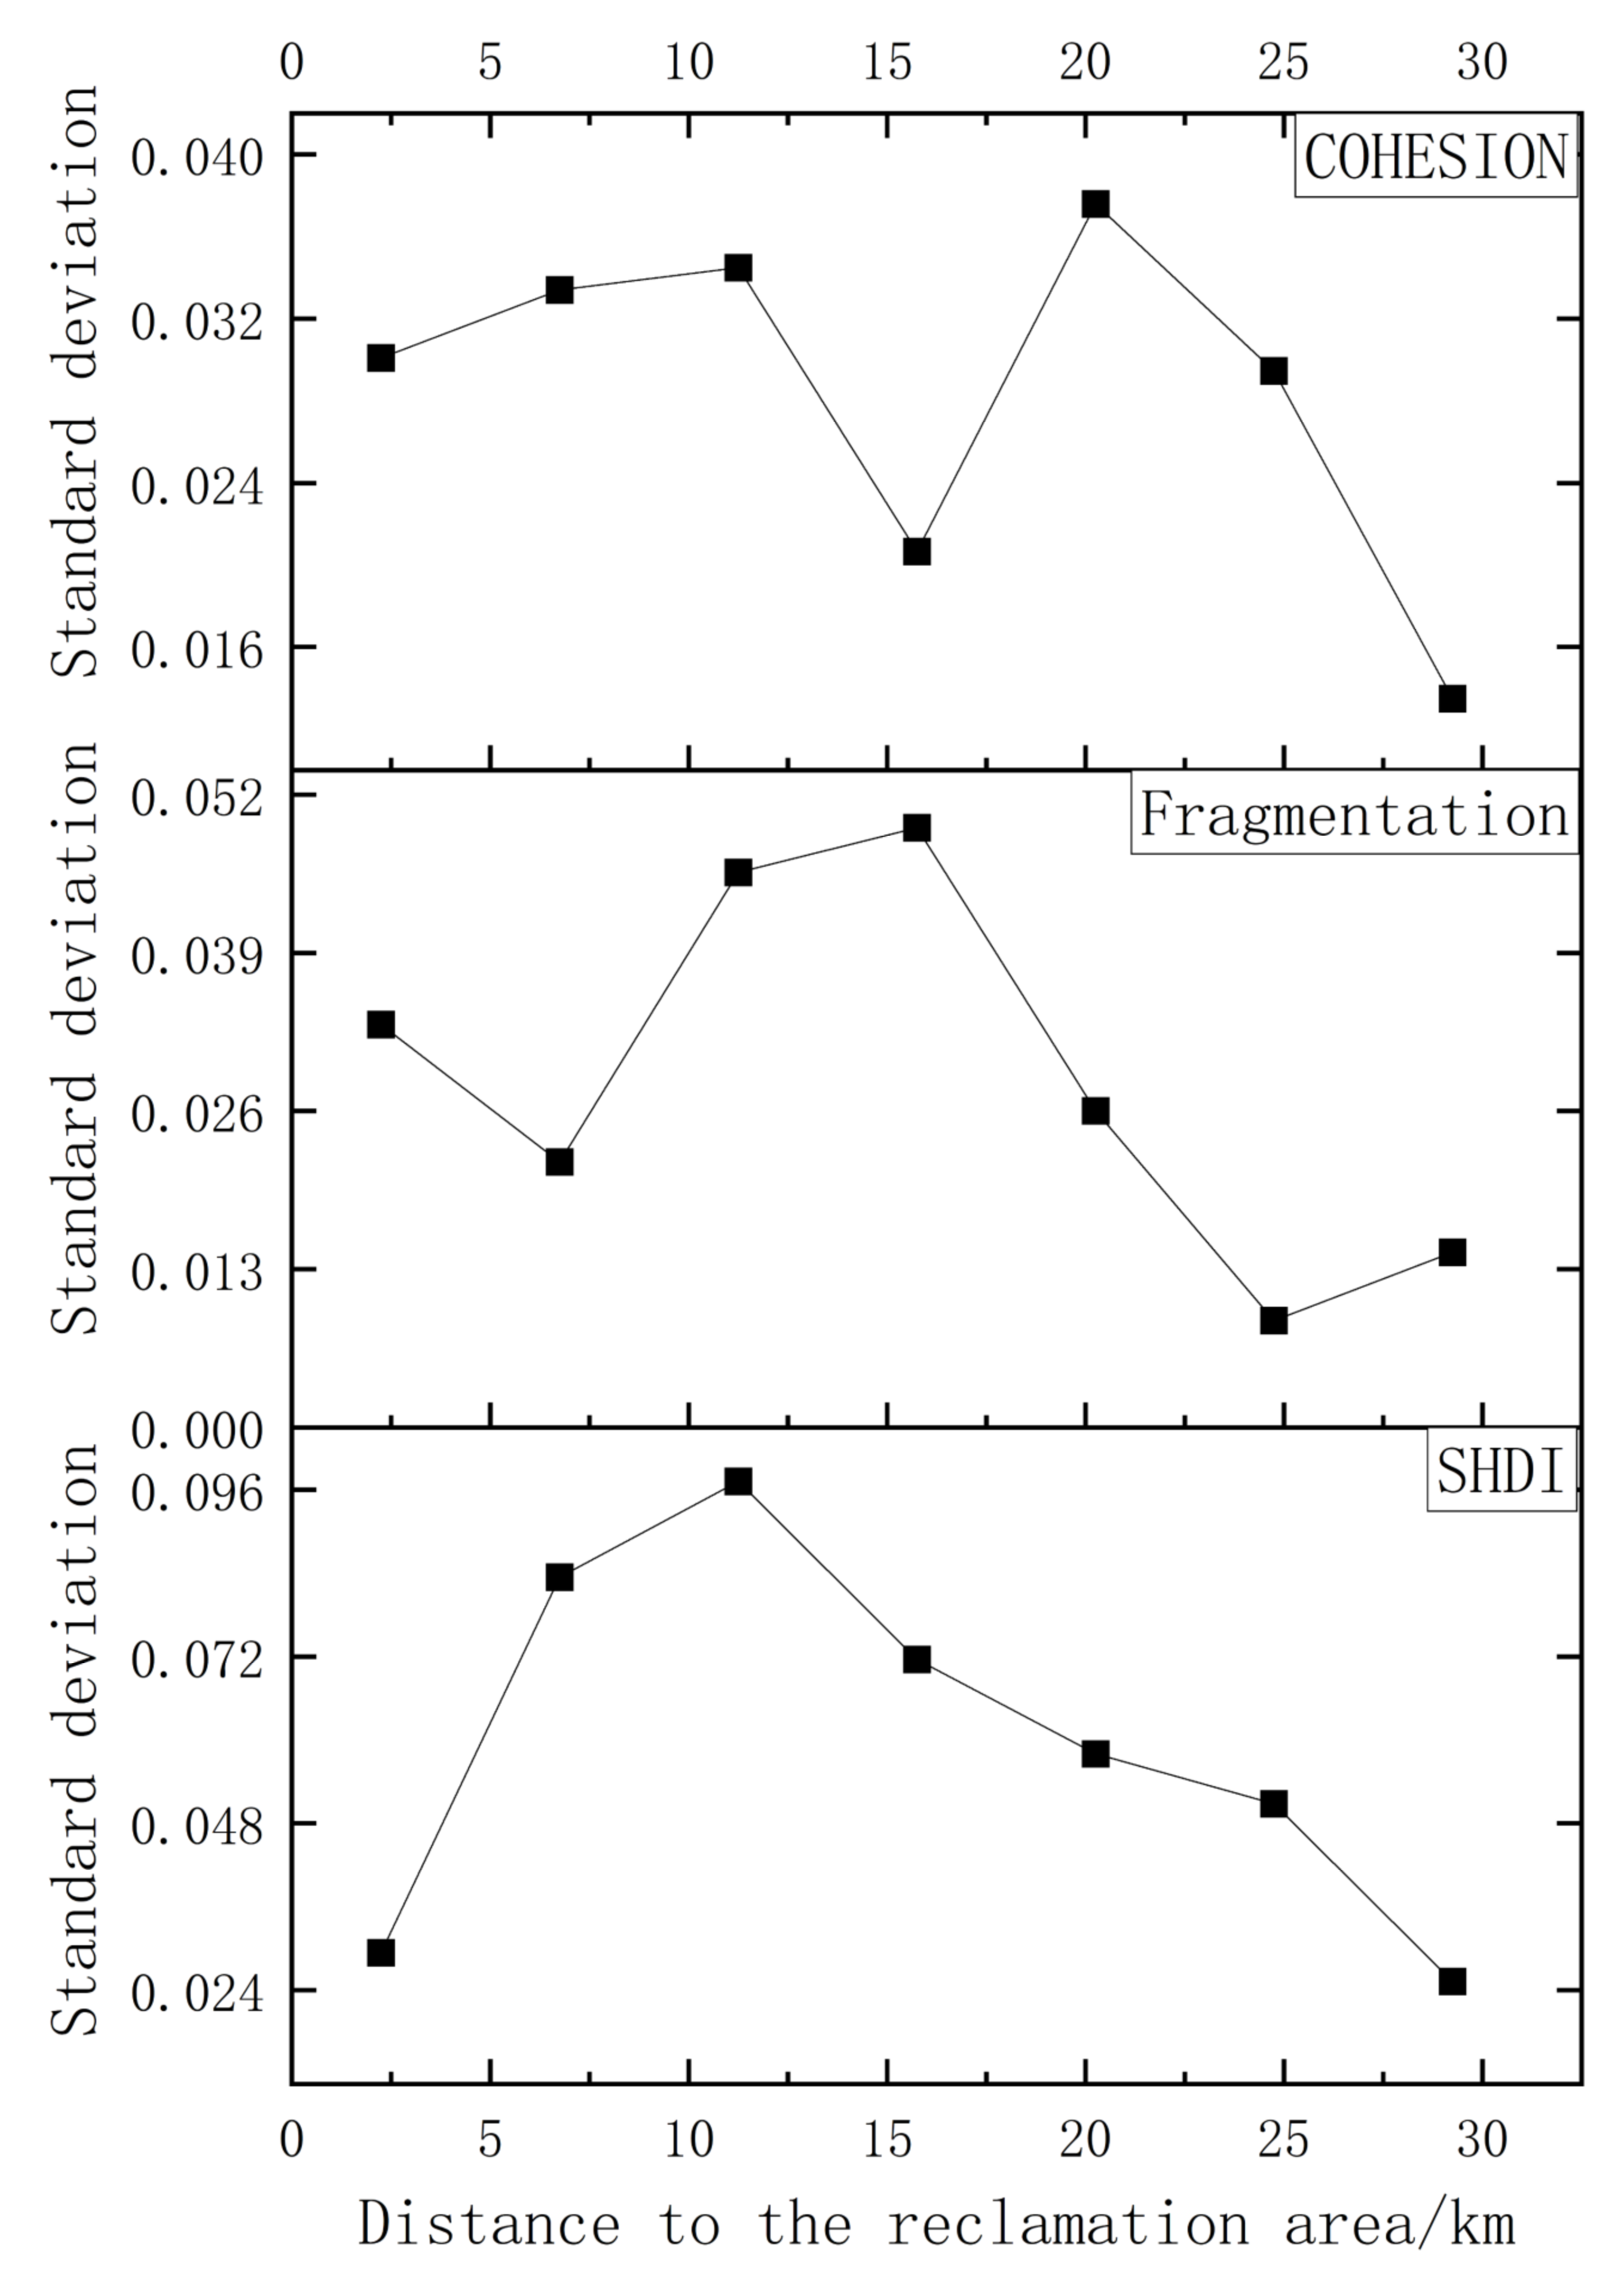
3.2.1. The Impact Scope of TFR in the Jiangsu Coastal Area

At the landscape level, the general impact of human activities is the transformation of the landscape in the target area, the results of which are changing the landscape structure, affecting the system functions [48,49], and ultimately affecting the stability of the landscape ecology [50]. Therefore, the stability change in regional ecology is fundamentally a change in the landscape structure. In this regard, to identify the spatial extent of TFR in the Jiangsu coastal area, the overall transfer probability and three landscape pattern indices (fragmentation, COHESION and SHDI) within each buffer zone were calculated, as shown in Figure 4.
In Figure 4, it can be seen that the overall transfer probability generally showed a downward trend. Specifically, the overall transfer probability gradually decreased with the distance from the reclamation area in the range of 0–29.25 km (buffer zones 1–7) and then increased to the max at 38.25 km. After 38.25 km, the overall transfer probability tended to stabilize. As the landscape transformed, the landscape pattern also changed at the same time. Specifically, within 24.75 km from the reclamation area, fragmentation showed a general downward trend and reached a minimum value at 24.75 km from the reclamation area, after which the overall trend of fragmentation was upward. COHESION was roughly negatively correlated with the fragmentation. Within 15.75 km from the reclamation area, COHESION rose significantly with the increase in distance and reached a maximum value at 15.75 km. Then, COHESION was basically stable within 20.25–29.25 km. After 29.25 km, COHESION decreased rapidly and reached a minimum at 42.75 km. Due to the reduction in landscape types, SHDI descended rapidly within 15.75 km from the reclamation area. After 15.75 km, SHDI gradually rose and then began to accelerate at 29.25 km, reaching a maximum at 38.25 km. After 38.25 km, SHDI gradually declined.
In summary, in the range of 24.95–29.25 km from the reclamation area, a significant turning point could be identified for the transfer probability and all three landscape pattern indices. Therefore, we believe that the maximum impact extent of TFR is approximately 29.25 km.

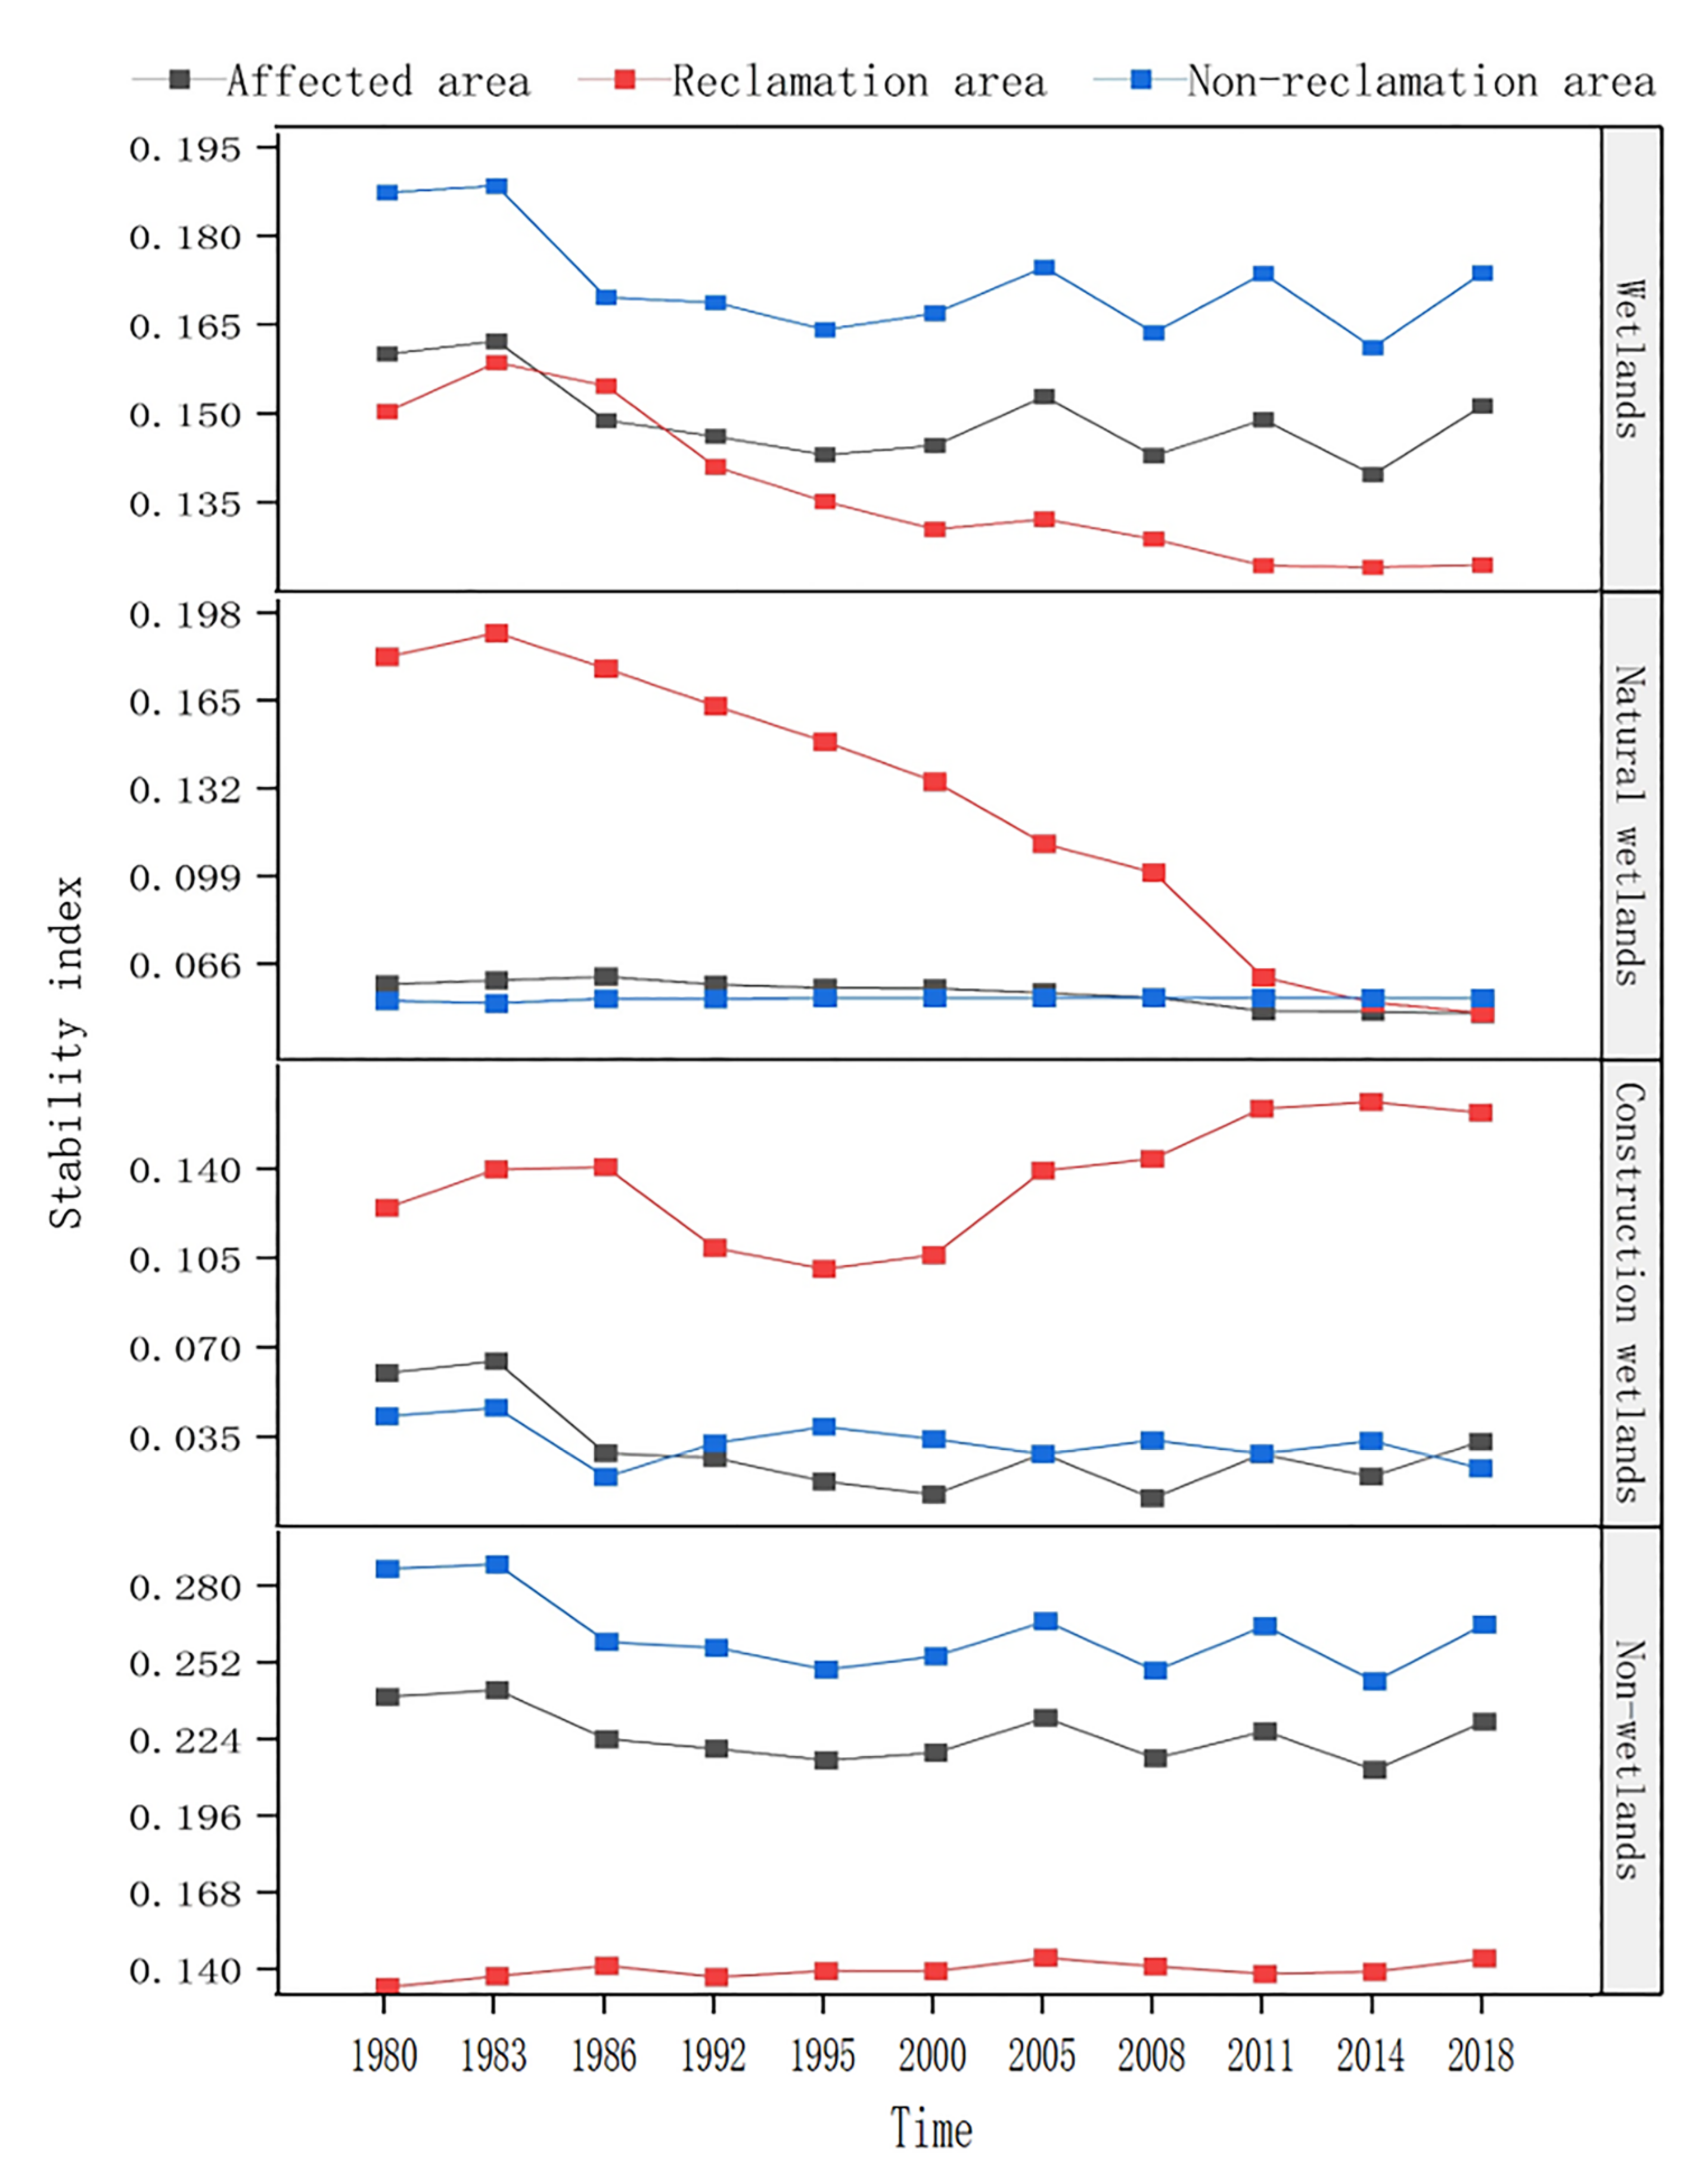
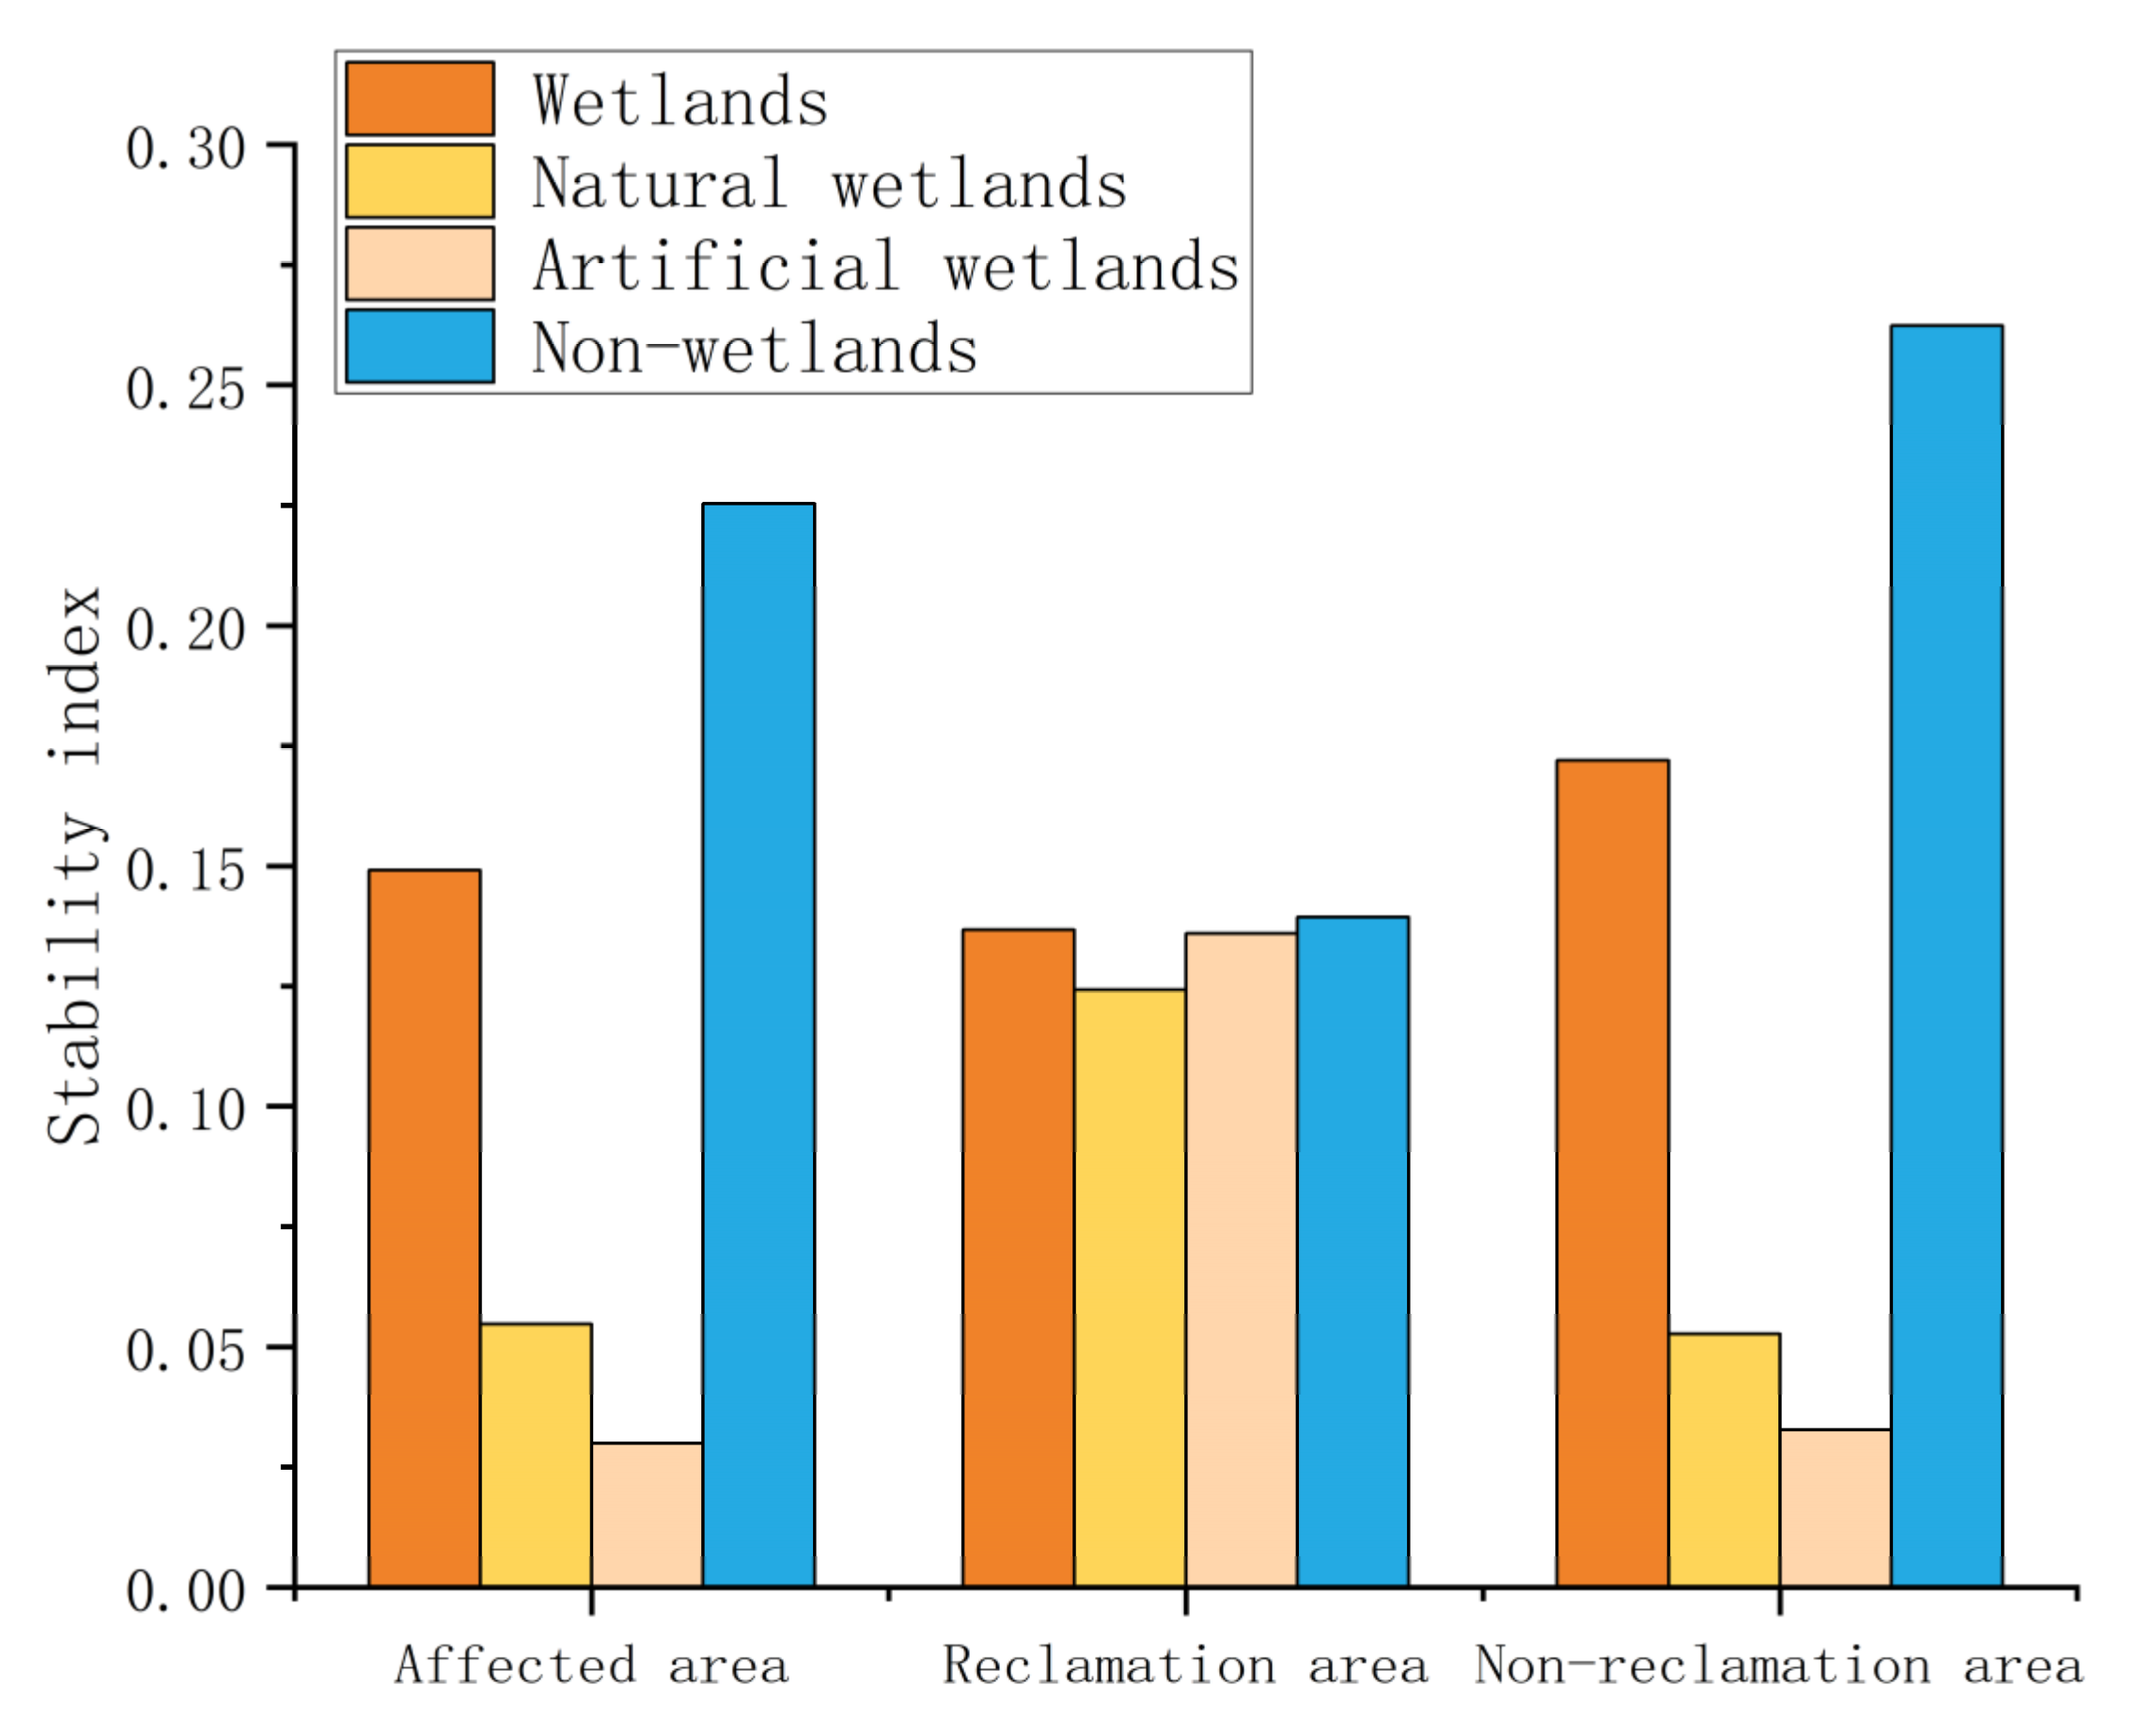
3.2.2. Temporal and Spatial Change in Stability

Based on the stability index calculation method, the stability index of the reclamation area, non-reclamation area (including the area all the buffer zones covered within the influence scope of TFR), and the affected area (including the reclamation area and non-reclamation area) were obtained for 11 target years (Figure 5).
In the affected area, the stability index was basically on a downward trend before 2000 and fluctuated after 2000 (including 2000), while the stability index of natural wetlands maintained a slight downward trend with small fluctuations. The change characteristics of the stability index of constructed wetlands and non-wetlands were basically consistent with those of the wetlands, but the stability index of construction wetlands had a slight upward trend after 2000. The above shows that the stability of construction wetlands and non-wetlands had a significant impact on the stability of wetlands in the entire affected area.
In the non-reclamation area, the change characteristics of wetlands stability were generally consistent with those of the affected area. The stability index of natural wetlands remained basically unchanged, and the stability index of construction wetlands showed small fluctuations after a significant decline in 1983–1986. The stability index change process of the non-wetlands was basically the same as that of the wetlands. The above shows that the stability of non-wetlands played a leading role in the stability of the non-reclamation area.
In the reclamation area, the stability index of wetlands maintained a downward trend after a short period of increase in 1980–1983, and generally remained unchanged after 2011. The variation characteristics of the stability index of natural wetlands were basically the same as those of wetlands, but the former declined faster. The stability index of construction wetlands gradually fluctuated and rose, while the stability index of the non-wetlands maintained a slight upward trend with small fluctuations. Overall, the stability of the reclamation area was mainly dominated by the stability of natural wetlands.
On average, the average stability index for the past 38 years was 0.17, 0.14 and 0.17 in the affected area, reclamation area and non-reclamation area, respectively (Figure 6), indicating that the stability level of the reclamation area was better than that of the non-reclamation area. From the perspective of different wetland types (Figure 6), in the reclamation area, the stability index of different wetland types was not much different, but the stability index of various types of wetlands in the non-reclamation area had a significant gap, which was basically consistent with that of the affected area. The stability index of natural wetlands and constructed wetlands in the reclamation area was greater than that in the non-reclamation area, and the stability index of non-wetlands in the reclamation area was smaller than that in non-reclamation area.
To further explore the spatial distribution characteristics of stability, the stability index of each buffer zone in the non-reclamation area was calculated. The general results of stability change in different buffer zones (Figure 7) showed that TFR can significantly affect the spatial distribution of stability. Figure 7 shows that the effect of LFTF on the stability index of the non-reclamation area was not linear but showed a cubic function relationship (R2 = 0.98, p < 0.01). Specifically, 11.25 km was the threshold distance from the reclamation area for stability index change, within which the closer to the reclamation area, the smaller the stability index (or the better the stability level), and outside which, the closer to the reclamation area, the greater the stability index (or the worse the stability level). In addition, the standard deviation of the stability index in each buffer zone over the past 38 years also exhibited obvious spatial characteristics. Similarly, approximately 11.25 km was the threshold for the change of standard deviation of the stability index. Within 11.25 km from the reclamation area, the overall stability index fluctuation was larger, and with the increase in distance, the stability index fluctuation increased. After 12.5 km from the reclamation area, the overall stability fluctuation was smaller, and as the distance increased, the fluctuation of the stability index gradually decreased until it was almost close to zero. The above shows that within the affected range the impact of TFR on stability was mainly concentrated within a 15.75 km range from the reclamation area (buffer zones 1–4).

3.3. Quantitative Relationship between TFR and Ecological Stability

Overall, the cumulative area of reclamation was negatively correlated with the stability index of natural wetlands in the affected area and natural wetlands, artificial wetlands, and wetlands in the reclamation area, and it was positively correlated with the stability index of natural wetland in the non-reclamation area (Table 4).
For specific use types of reclamation, in the affected area, all five use types were negatively correlated with the stability index of natural wetlands. Type ARL and SAL were negatively correlated with the stability index of artificial wetlands and coastal wetlands. In the reclamation area, all five types were negatively correlated with the stability index of natural wetlands and coastal wetlands. Type POL and HYL were positively correlated with the stability index of artificial wetlands, and type SAL was positively correlated with the stability index of non-wetlands. In the non-reclamation area, type AQL, ARL, and SAL were positively correlated with the stability index of natural wetlands, while type ARL and SAL were negatively associated with the stability index of non-wetlands and coastal wetlands.

4. Discussion

4.1. The Impact Scope of TFR

Tourism development, such as port construction, urban expansion and road networks, can have an impact on the surrounding environment. For TFR, the various use types of reclamation represent the comprehensive impact of human activities. According to the first law of geography, “everything is related to everything else, but near things are more related than distant things [51]”, so this effect of TFR diminishes with distance and accumulates over a certain time period and space.
The ecosystem structure is the basis of the system function, and a certain structure supports a certain function [37]. Changes in landscape structure are the basis for functional change. The landscape pattern indices condense a variety of rich information about the landscape pattern. According to previous research, human activities can significantly affect the fragmentation, COHESION, and SHDI; the AREA_MN (mean patch area); the FRAC_MN (mean fractal dimension index); the AI (aggregation index) [5,49,52]; etc. Combined with the ecological implications of landscape indices, we chose three indices (fragmentation, COHESION, and SHDI) to depict the landscape structure. According to the buffer analysis, the selected landscape pattern indices had obvious spatial distribution characteristics. Based on this, it was concluded that 29.25 km away from the reclamation area was the abrupt distance of the landscape pattern change and 29.25 km was used as the maximum influence range of TFR in the Jiangsu coastal area.
There are only a few studies on the impact extent of TFR on landscape ecology in China. Based on buffer analysis, Di et al. [53] found that the intensity of human activity had a significant gradient within 30 km from the coastline, indicating that the effects of TFR were within 30 km. Considering that the average distance between the western boundary of the reclamation area and the coastline was 9.32 km in this study, if the coastline was taken as the starting point, the influence range of TFR in this study was roughly 39 km, which was obviously greater than 30 km. Possible reasons for this are as follows: TFR has obvious spatio-temporal accumulation characteristics, so the impact of the TFR on the landscape ecology is the result of the combination of long-term and multi-regional reclamation. In Di’s study, the time span was 10 years, while our study spanned almost 40 years, so the impact scope of TFR was greater in our study.

4.2. The Rationality of the Index Construction

At present, there are no fixed indicators for stability evaluation due to the complexity of ecological stability itself and the inconsistency of the concepts of ecological stability [26,31]. Most studies have selected stability indicators based on specific research objectives. This study built a local stability index by combining the composition ratio of landscape types of optimal ecological backgrounds and realistic landscapes.
The selection of the index needs to be based on the characteristics of the study area [31,54]. In the Jiangsu coastal area, due to the long-term and large-scale TFR, while the landscape ecology in the reclamation area changed, it could also significantly affect the surrounding landscape pattern through natural or socioeconomic factors and ultimately affect the service supply and ecological stability of the ecosystem. At the landscape level, this is manifested by the transformation of landscape types before and after reclamation as well as the difference between the transformation of landscape types or the landscape pattern of the reclamation area and non-reclamation area. The result of the change or difference led to the changes in the areas of different landscape types over a certain time period. As a result, the impact of human activities can be reflected by proportional relationships between the areas of the various landscape types.
To evaluate the proportional relationships between different periods or different regions, a reasonable reference is necessary. According to Li et al. [45], the optimal ecological background structure depicted an ecological competition result in the case of artificial participation with minimal human intervention. By this they meant that the various functions of the ecosystem were not only coordinated and unified but also achieved approximately the best-reachable, natural stable condition before humans carried out large-scale production and life transformation in the area. Therefore, this situation can be regarded as the background quantitative structure of the Jiangsu coastal area.
According to the definition of stability we constructed, the stability index essentially reflects the closeness of various service supplies of the study area between reality scenarios and the best equilibrium state in a certain period. Therefore, the closer the landscape type proportion of the ecosystem in the study area is to the background structure, the better the ecology stability in this region. When the stability changes, e.g., becomes smaller, it can not only indicate that the landscape type proportion of the system is closer to the background structure but also that the various services of the ecosystem have been maximized after ecological competition by all parties.
In addition, Figure 4 shows that in the region close to the reclamation area (buffer zones 1–2), the fragmentation was larger and the COHESION was lower, meaning that the region had a higher degree of fragmentation and scattered patches. However, the SHDI was relatively large; the reason for this was that due to the proximity to the tidal flats, there were many landscape types, and patch distribution was also more balanced, which enabled the system to resist external disturbances [55,56]. In the zones that were slightly farther away (buffer zones 3–4), the fragmentation and SHDI were low, and the COHESION was relatively high. Combined with the results of remote sensing surveys, there were very few landscape types here with a large area of arable land and construction land, which was not conducive to its resistance to external disturbances. In the more distant zones (buffer zones 5–-7), the fragmentation and COHESION remained at a low and high level, respectively, but the SHDI increased significantly as the landscape types in this region increased, and the distribution was relatively balanced. Therefore, the resistance to the external disturbances in the most distant zones (buffer zones 5–7) was enhanced relative to the slightly farther away zones (buffer zones 3–4).
Combined with the spatial variation characteristics of the standard deviation of the landscape pattern indices, it can also be seen that with the increase in the distance from the reclamation area, the standard deviation (especially for the SHDI and fragmentation) basically showed the characteristics of first increasing and then decreasing (Figure 8), indicating that the ability of the system to maintain its own state under human disturbance had this spatial change feature. The above shows that within the influence scope stability showed the characteristics of first deteriorating and then improving with the increase in distance from the reclamation area. This was basically consistent with the stability change characteristics indicated by the stability index in this study (t7). Furthermore, through correlation analysis, it was found that the stability index had a significant positive correlation with the SHDI (p < 0.05), a marginally positive correlation with the fragmentation (p = 0.059), and a nonsignificant negative correlation with COHESION. The standard deviation of the landscape pattern indices had a positive correlation with stability index, but only SHDI passed the significance test (p < 0.05). Therefore, we believe that the stability index constructed in this study is reasonable.

4.3. Landscape Transformation and Stability

In the past 38 years, the landscape structure in the Jiangsu coastal area has undergone significant changes due to the influence of human activities. Intense human activities, especially TFR, can not only directly change the landscape pattern of the reclamation area [57] but also have spillovers within a certain range. The spillovers can affect the surrounding landscape ecology through a variety of factors such as the development and construction of ports and tourist resort area, which can drive the surrounding economy and gradually change and reshape the surrounding landscape pattern.
In this study, we constructed a local stability index to characterize the stability of the coastal area in Jiangsu province and to study the impact of TFR on regional ecology. As can be seen from Figure 5 and Figure 6, the stability of the reclamation and non-reclamation areas was very different. In the reclamation area, the stability index of the wetlands and natural wetlands showed a downward trend, but the stability of natural wetlands has remained almost unchanged in recent years. The stability index of constructed wetlands and non-wetlands has shown an upward trend. In the non-reclamation area, the stability index change characteristics were generally consistent with those of the entire affected area.
In the reclamation area (mainly distributed in the tidal flat area), a large number of natural wetlands were converted to artificial wetlands, such as mariculture farm and salt fields in the early stage (1983–2000) [43]. The result of this was that the proportion of natural wetlands and artificial wetlands gradually decreased and increased, respectively, and both tended to be close to the background structure. At the same time, although the urban land and construction land increased, the area proportion of non-wetlandss remained relatively stable, so the stability level of the reclamation area was determined by the stability level of natural wetlands and construction wetlands, which was manifested as a tendency to improve. In the later period (2000–2018), in addition to the conversion of natural wetlands into aquaculture land, they were mainly converted to non-wetlands such as dry land and construction land [43]. After 2008, although the natural wetlands were in a relatively stable state, the stability of non-wetlands gradually deteriorated, and the construction wetlands were in a very unstable state. After 2015, the government and Jiangsu province strengthened the protection of coastal wetlands, and the proportion of construction wetlands decreased, so the overall stability of wetlands showed no significant fluctuations or deviations.
In the non-reclamation area, paddy fields, dryland, construction land, urban land, and rural residential land were mainly distributed, of which the area proportion of non-wetlands was significantly greater than that in the background structure at any time. Therefore, in the non-reclamation area, the stability change was mainly affected by the area change in non-wetlands. In the early stage (1983–2000), the landscape transformation was mainly from arable land to construction land and residential land, and the area proportion of non-wetlands increased, but it was closer to the background structure, so the stability tended to be slightly better. In the later period (2005–2018), in addition to the early main landscape transformation, the mutual conversion between paddy fields and dryland increased at the junction of paddy fields and dryland near the reclamation area, resulting in obvious fluctuations in the proportion of non-wetlands, which were eventually manifested as obvious fluctuations in stability.
In addition, spatially, both the stability index and the volatility of the stability index in the non-reclamation area increased first and then decreased with the distance from the reclamation area. The main reasons for this were as follows: In the area closer to the reclamation area (buffer zones 1 and 2), there were mainly natural wetlands and artificial wetlands such as paddy fields and mariculture farms, and the landscape types were diverse. Compared with other more distant areas, the landscape structure composition of this area was closer to the tidal flat area with a higher stability level, so the stability index of this area was relatively smaller. In the past 38 years, the main transformation was the continuous transformation of large areas of natural wetlands to artificial wetlands or non-wetlands. As a result, the proportion of artificial wetlands and non-wetlands changed dramatically, which was manifested by significant fluctuations in the wetland stability index. In the slightly further areas (buffer zones 3 and 4), paddy field, dryland, urban land, and rural residential land were the main landscapes, but the non-wetland types were dominant, so the landscape structure deviated from the background structure more. Because the non-wetlands such as residential land and construction land were more susceptible to economic factors, the area of these landscape types (non-wetlands) has had a significant increase with the huge losses in paddy fields and dryland in the past 38 years, resulting in a dramatic change in the proportion of non-wetlandss and a significant increase in the volatility of the wetland stability index. In the more distant areas (buffer zones 5–7), although paddy fields and dryland were also the main landscapes, there were fewer construction land areas than in slightly further areas, so the contribution of non-wetlands to the stability of this region was weakened, and the wetland stability index was relatively small. In the past 38 years, the area of various landscape types has not changed significantly, and the stability index has not fluctuated much.

4.4. Implications for Protection and Management of Wetland Resources

Regarding the contradiction that the demand for land resources is large and resource protection is imminent, it is of great significance to deal with a series of ecological and environmental problems caused by the destruction of coastal wetlands such as reduced diversity, poorer water quality, and reduced carbon storage to achieve the sustainable development of tidal flat resources [11,58].
Although the average annual reclamation intensity accounted for a small proportion of the coastal area, the impact of TFR was continuous and cumulative, and a long period of large-scale TFR led to landscape degradation within the reclamation area as well as non-reclamation area in the Jiangsu coastal area [5]. The results of this study further showed that TFR had a significant impact on the stability of the non-reclamation area, the size of which was much larger than that of the reclamation area. Although the stability of the entire affected area had a slight tendency to improve, the stability of artificial and natural wetlands in the reclamation area was deteriorating, and the stability of non-wetlands in non-reclamation areas has also deteriorated in the past 10 years, which requires attention. In addition, different use types of TFR had different effects on wetland stability, and the same use type of TFR had different effects on different landscape types. All of the above indicate that future reclamation plans need to carefully consider the scale and use types of reclamation.
In addition, the concept of the compact city, whose basic principle is to form a better ecological environment for human living by increasing the density of development in a relatively compact area [59] can be borrowed and applied to TFR to solve the problem of unreasonable reclamation planning, by increasing the TFR in fewer areas and strengthening the efficiency of land use in tidal flat areas.

4.5. Limitations

This study has several major limitations that need to be addressed through future research.
First, we constructed 12 one-sided buffer zones with a width of 4.5 km outside the reclamation area to analyze the influence scope of TFR and the spatial variation of stability in this study. However, the spatial scale is an important factor that significantly influences the identification of the landscape structure and functional features. As the width of the buffer zone gradually increases or decreases, the results obtained may vary. Therefore, determining the optimal analytical scale is a problem that needs to be solved.
In addition, as the impact of TFR on regional landscape ecology is not immediate, the time when different use types of TFR have an impact on the ecological environment may also be different. When the interval time between adjacent target years is too short, it may not accurately reflect the impact of TFR in this period. In this study, although the time span was relatively long (between 3 and 6 years), it may have still omitted or overcalculated the impact of TFR in the target period to varying degrees.
Finally, when calculating the stability index in this study, we uniformly used the optimal background structure of the entire study area, but theoretically, each specific area should have its own optimal background structure. Therefore, it may be more appropriate to calculate the best background structure of the corresponding region when calculating the stability index of a certain area. For example, different buffer zones can have their own optimal background structure. However, when the optimal structure is obtained for the departmental areas, the entire study area will not necessarily achieve the best structure. Therefore, balancing local optimality with global optimality is a new problem that needs to be solved.

5. Conclusions

The rapid and large-scale TFR strongly changed the landscape pattern of the coastal area of Jiangsu province and also affected the structure and function of the landscape. The results showed that in the past 38 years, the main transformation features were the decrease in natural wetlands and the increase in artificial wetlands and non-wetlands. Among them, the reduction of natural wetlands was mainly caused by reclamation, which has reached 1969.86 km2 in the past 38 years. Except for the huge conversion to aquaculture land in each period, the use types of the reclaimed natural wetlands have gradually changed from agricultural land to industrial land since 2008.
According to the spatial analysis of landscape transfer probability and landscape pattern indices, the impact range of TFR on regional landscape ecology was roughly 30 km. Within the influence scope, overall, the stability of the affected area had a tendency to improve, but the volatility has increased in the past 10 years. In the reclamation area, the overall stability of the reclamation area had a tendency to improve, but the stability of construction wetlands and non-wetlands deteriorated. In the non-reclamation area, the stability change characteristics were generally consistent with the entire affected area. In addition, spatially, both stability and its volatility had the characteristics of first deteriorating and then improving as the distance from the reclamation area increased. Through correlation analysis, the relationship between the cumulative area of TFR and the stability index was quantitatively analyzed. It was found that under the influence of TFR, the influence of different use types of TFR on stability was not completely consistent, and the influence of the same use type of TFR on different landscape types was also different.
In summary, based on multitime remote sensing data and combined with the spatial analysis of the landscape structure indices, the spatial scope of the ecological impact of TFR was determined. On this basis, the spatio-temporal characteristics of stability were analyzed through buffer analysis by constructing a local stability index, and the impact of TFR on regional stability was quantitatively analyzed through correlation analysis. However, this study also has some drawbacks, as described in the previous discussion. All the shortcomings should be explored in future studies to better understand the impact of TFR on regional ecology and to better support the future conservation and management of wetland resources in the coastal area of Jiangsu province, China.

Author Contributions

Conceptualization, G.L.; methodology, G.L., L.C. and Y.C.; software, Y.C.; formal analysis, G.L.; investigation, L.C., Y.C. and L.L.; data curation, L.L., P.M. and L.H.; writing—original draft preparation, Y.C.; writing—review and editing, G.L. and Y.C.; visualization, Y.C. and L.L.; funding acquisition, G.L. and L.C. All authors have read and agreed to the published version of the manuscript.

Funding

This research was funded by the National Key Technology Research and Development Program of the Ministry of Science and Technology of China under grant number 2018YFC0407502, China Postdoctoral Science Foundation under grant number 2019M660780, Science and Technology Project of Sichuan Province under grant number 2020YFS0441, and a Chengdu University of Information Technology funded project under grant number KYT201738.

Data Availability Statement

All satellite data used in the study are available for free download through https://earthexplorer.usgs.gov/ (accessed on 10 May 2018).

Acknowledgments

The authors would like to thank the editors and the anonymous reviewers for their crucial comments, which improved the quality of this paper.

Conflicts of Interest

The authors declare no conflict of interest.

References

  1. Costanza, R.; Anderson, S.J.; Sutton, P.; Mulder, K.; Mulder, O.; Kubiszewski, I.; Wang, X.; Liu, X.; Pérez-Maqueo, O.; Martinez, M.L. The global value of coastal wetlands for storm protection. Glob. Environ. Change 2021, 70, 102328. [Google Scholar] [CrossRef]
  2. Narayan, S.; Beck, M.W.; Wilson, P.; Thomas, C.J.; Guerrero, A.; Shepard, C.C.; Reguero, B.G.; Franco, G.; Ingram, J.C.; Trespalacios, D. The Value of Coastal Wetlands for Flood Damage Reduction in the Northeastern USA. Sci. Rep. 2017, 7, 9463. [Google Scholar] [CrossRef] [PubMed]
  3. Newton, A.; Icely, J.; Cristina, S.; Perillo, G.M.E.; Turner, R.E.; Ashan, D.; Cragg, S.; Luo, Y.M.; Tu, C.; Li, Y.; et al. Anthropogenic, Direct Pressures on Coastal Wetlands. Front. Ecol. Evol. 2020, 8, 144. [Google Scholar] [CrossRef]
  4. Murray, N.J.; Phinn, S.R.; DeWitt, M.; Ferrari, R.; Johnston, R.; Lyons, M.B.; Clinton, N.; Thau, D.; Fuller, R.A. The global distribution and trajectory of tidal flats. Nature 2019, 565, 222–225. [Google Scholar] [CrossRef] [PubMed]
  5. Cui, L.L.; Li, G.S.; Chen, Y.H.; Li, L.J. Response of Landscape Evolution to Human Disturbances in the Coastal Wetlands in Northern Jiangsu Province, China. Remote Sens. 2021, 13, 2030. [Google Scholar] [CrossRef]
  6. Gaglio, M.; Aschonitis, V.G.; Gissi, E.; Castaldelli, G.; Fano, E.A. Land use change effects on ecosystem services of river deltas and coastal wetlands: Case study in Volano-Mesola-Goro in Po river delta (Italy). Wetl. Ecol. Manag. 2017, 25, 67–86. [Google Scholar] [CrossRef]
  7. Wang, L.; Coles, N.; Wu, C.F.; Wu, J.P. Effect of Long-Term Reclamation on Soil Properties on a Coastal Plain, Southeast China. J. Coast. Res. 2014, 30, 661–669. [Google Scholar] [CrossRef]
  8. Wang, X.G.; Yan, F.Q.; Su, F.Z. Changes in coastline and coastal reclamation in the three most developed areas of China, 1980–2018. Ocean Coast Manage. 2021, 204, 105542. [Google Scholar] [CrossRef]
  9. Wang, X.X.; Xiao, X.M.; Zou, Z.H.; Chen, B.Q.; Ma, J.; Dong, J.W.; Doughty, R.B.; Zhong, Q.Y.; Qin, Y.W.; Dai, S.Q.; et al. Tracking annual changes of coastal tidal flats in China during 1986–2016 through analyses of Landsat images with Google Earth Engine. Remote Sens. Environ. 2020, 238, 110987. [Google Scholar] [CrossRef] [PubMed]
  10. Chen, L.; Ren, C.Y.; Zhang, B.; Li, L.; Wang, Z.M.; Song, K.S. Spatiotemporal Dynamics of Coastal Wetlands and Reclamation in the Yangtze Estuary During Past 50 Years (1960s–2015). Chin. Geogr. Sci. 2018, 28, 386–399. [Google Scholar] [CrossRef] [Green Version]
  11. Wang, X.X.; Xiao, X.M.; Xu, X.; Zou, Z.H.; Chen, B.Q.; Qin, Y.W.; Zhang, X.; Dong, J.W.; Liu, D.Y.; Pan, L.H.; et al. Rebound in China’s coastal wetlands following conservation and restoration. Nat. Sustain. 2021, 4, 1076–1083. [Google Scholar] [CrossRef]
  12. Tian, B.; Wu, W.T.; Yang, Z.Q.; Zhou, Y.X. Drivers, trends, and potential impacts of long-term coastal reclamation in China from 1985 to 2010. Estuar. Coast. Shelf Sci. 2016, 170, 83–90. [Google Scholar] [CrossRef]
  13. Ma, Z.; Melville, D.S.; Liu, J.; Chen, Y.; Yang, H.; Ren, W.; Zhang, Z.; Piersma, T.; Li, B. Rethinking China’s new great wall. Science 2014, 346, 912–914. [Google Scholar] [CrossRef] [PubMed] [Green Version]
  14. Meng, W.Q.; He, M.X.; Hu, B.B.; Mo, X.Q.; Li, H.Y.; Liu, B.Q.; Wang, Z.L. Status of wetlands in China: A review of extent, degradation, issues and recommendations for improvement. Ocean Coast. Manage. 2017, 146, 50–59. [Google Scholar] [CrossRef]
  15. Chen, Y.; Dong, J.; Xiao, X.; Zhang, M.; Tian, B.; Zhou, Y.; Li, B.; Ma, Z. Land claim and loss of tidal flats in the Yangtze Estuary. Sci. Rep. 2016, 6, 24018. [Google Scholar] [CrossRef] [PubMed]
  16. Yang, H.; Ma, M.; Thompson, J.R.; Flower, R.J. Protect coastal wetlands in China to save endangered migratory birds. Proc. Natl. Acad. Sci. USA. 2017, 114, E5491–E5492. [Google Scholar] [CrossRef] [PubMed] [Green Version]
  17. Sun, X.; Li, Y.F.; Zhu, X.D.; Cao, K.; Feng, L. Integrative assessment and management implications on ecosystem services loss of coastal wetlands due to reclamation. J. Clean Prod. 2017, 163, S101–S112. [Google Scholar] [CrossRef]
  18. Liu, Q.; Mou, X. Interactions between Surface Water and Groundwater: Key Processes in Ecological Restoration of Degraded Coastal Wetlands Caused by Reclamation. Wetlands 2016, 36, S95–S102. [Google Scholar] [CrossRef]
  19. Zhang, H.; Wu, P.B.; Fan, M.M.; Zheng, S.Y.; Wu, J.T.; Yang, X.H.; Zhang, M.; Yin, A.J.; Gao, C. Dynamics and driving factors of the organic carbon fractions in agricultural land reclaimed from coastal wetlands in eastern China. Ecol. Indic. 2018, 89, 639–647. [Google Scholar] [CrossRef]
  20. Wang, W.; Liu, H.; Li, Y.Q.; Su, J.L. Development and management of land reclamation in China. Ocean Coast. Manage. 2014, 102, 415–425. [Google Scholar] [CrossRef]
  21. Choi, C.Y.; Jackson, M.V.; Gallo-Cajiao, E.; Murray, N.J.; Clemens, R.S.; Gan, X.J.; Fuller, R.A. Biodiversity and China’s new Great Wall. Divers. Distrib. 2018, 24, 137–143. [Google Scholar] [CrossRef] [Green Version]
  22. Lin, W.J.; Wu, J.; Lin, H.J. Contribution of unvegetated tidal flats to coastal carbon flux. Glob. Change Biol. 2020, 26, 3443–3454. [Google Scholar] [CrossRef] [PubMed]
  23. Yan, X.L.; Liu, M.; Zhong, J.Q.; Guo, J.T.; Wu, W. How Human Activities Affect Heavy Metal Contamination of Soil and Sediment in a Long-Term Reclaimed Area of the Liaohe River Delta, North China. Sustainability 2018, 10, 338. [Google Scholar] [CrossRef] [Green Version]
  24. Hua, J.; Feng, Y.; Jiang, Q.; Bao, X.; Yin, Y. Shift of bacterial community structure along different coastal reclamation histories in Jiangsu, Eastern China. Sci. Rep. 2017, 7, 10096. [Google Scholar] [CrossRef] [Green Version]
  25. Jin, Y.W.; Yang, W.; Sun, T.; Yang, Z.F.; Li, M. Effects of seashore reclamation activities on the health of wetland ecosystems: A case study in the Yellow River Delta, China. Ocean Coast. Manage. 2016, 123, 44–52. [Google Scholar] [CrossRef] [Green Version]
  26. Donohue, I.; Hillebrand, H.; Montoya, J.M.; Petchey, O.L.; Pimm, S.L.; Fowler, M.S.; Healy, K.; Jackson, A.L.; Lurgi, M.; McClean, D.; et al. Navigating the complexity of ecological stability. Ecol. Lett. 2016, 19, 1172–1185. [Google Scholar] [CrossRef]
  27. Kéfi, S.; Domínguez-García, V.; Donohue, I.; Fontaine, C.; Thébault, E.; Dakos, V. Advancing our understanding of ecological stability. Ecol. Lett. 2019, 22, 1349–1356. [Google Scholar] [CrossRef] [PubMed]
  28. Grimm, V.; Wissel, C. Babel, or the ecological stability discussions: An inventory and analysis of terminology and a guide for avoiding confusion. Oecologia 1997, 109, 323–334. [Google Scholar] [CrossRef] [PubMed]
  29. Li, W.; Tan, R.; Wang, J.; Fan, D.; Yang, Y. Effects of anthropogenic disturbance on richness-dependent stability in Napahai plateau wetland. Sci. Bull. 2013, 55, 4120–4125. [Google Scholar] [CrossRef] [Green Version]
  30. Li, H.F.; Li, L.F.; Su, F.L.; Wang, T.L.; Gao, P. Ecological stability evaluation of tidal flat in coastal estuary: A case study of Liaohe estuary wetland, China. Ecol. Indic. 2021, 130, 108032. [Google Scholar] [CrossRef]
  31. Li, X.H.; Lei, S.G.; Liu, Y.; Chen, H.; Zhao, Y.B.; Gong, C.A.; Bian, Z.F.; Lu, X.G. Evaluation of Ecological Stability in Semi-Arid Open-Pit Coal Mining Area Based on Structure and Function Coupling during 2002–2017. Remote Sens. 2021, 13, 5040. [Google Scholar] [CrossRef]
  32. Parparov, A.; Gal, G. Quantifying Ecological Stability: From Community to the Lake Ecosystem. Ecosystems 2017, 20, 1015–1028. [Google Scholar] [CrossRef]
  33. Zhang, Z.S.; Xue, Z.S.; Lyu, X.G.; Tong, S.Z.; Jiang, M. Scaling of soil carbon, nitrogen, phosphorus and C:N:P ratio patterns in peatlands of China. Chin. Geogr. Sci. 2017, 27, 507–515. [Google Scholar] [CrossRef]
  34. Mukherjee, K. Wetland habitat stability assessment in hydro-geomorphological (HGM) and surface water availability (SWA) conditions in a lower Gangetic floodplain region of Eastern India. Ecol. Indic. 2020, 119, 106842. [Google Scholar] [CrossRef]
  35. Ren, P.; Hong, B.T.; Cheng, W.X.; Zhou, J.M. Stability evaluation of forest ecosystem and study of spatial differential features in the upper Yangtze River. Geogr. Res. 2013, 32, 1017–1024. [Google Scholar]
  36. Zhou, Z.B.; Xu, X.W.; Lei, J.Q.; Li, S.G. Study on the ecological stability of tarim desert highway shelterbelt. Sci. Bull. 2006, 51, 126–312. [Google Scholar] [CrossRef]
  37. Wu, J.G. Landscape Ecology—Concepts and Theories. Chinese J. Ecol. 2000, 19, 42–52. [Google Scholar]
  38. Ma, T.T.; Li, X.W.; Bai, J.H.; Cui, B.S. Impacts of Coastal Reclamation on Natural Wetlands in Large River Deltas in China. Chin. Geogr. Sci. 2019, 29, 640–651. [Google Scholar] [CrossRef] [Green Version]
  39. Yu, H.; Liu, X.M.; Kong, B.; Li, R.P.; Wang, G.X. Landscape ecology development supported by geospatial technologies: A review. Ecol. Inform. 2019, 51, 185–192. [Google Scholar] [CrossRef]
  40. Xu, X.; Yang, T. Mathematical model study on overall impact of Sanmenwan Bay reclamation project. J. Mar. Sci. 2006, 4, 49–59. [Google Scholar]
  41. Zhang, C.; Zheng, J.; Dong, X.; Cao, K.; Zhang, J. Morphodynamic response of Xiaomiaohong tidal channel to a coastal reclamation project in Jiangsu Coast, China. J. Coast. Res. 2013, 65, 630–635. [Google Scholar] [CrossRef]
  42. Yu, J.; Bao, X.W.; Ding, Y.; Zhang, W.; Zhou, L.L. The impact of large-scale reclamation on hydro-dynamic environment—A case study of Xinghua Bay. J. Ocean Univ. China 2016, 15, 583–592. [Google Scholar] [CrossRef]
  43. Zhou, Y.K.; Ning, L.X.; Bai, X.L. Spatial and temporal changes of human disturbances and their effects on landscape patterns in the Jiangsu coastal zone, China. Ecol. Indic. 2018, 93, 111–122. [Google Scholar] [CrossRef]
  44. Bao, J.L.; Gao, S. Traditional coastal management practices and land use changes during the 16–20th centuries, Jiangsu Province, China. Ocean Coast. Manage. 2016, 124, 10–21. [Google Scholar] [CrossRef]
  45. Li, L.J.; Li, G.S.; Cui, L.L.; He, L.; Chen, Y.H. Method for modelling ecological competition based on Pareto optimality: A case study of coastal wetlands in Jiangsu Province, China. Ecol. Indic. 2021, 129, 107946. [Google Scholar] [CrossRef]
  46. Ma, T.T.; Li, X.W.; Bai, J.H.; Cui, B.S. Tracking three decades of land use and land cover transformation trajectories in China’s large river deltas. Land Degrad. Dev. 2019, 30, 799–810. [Google Scholar] [CrossRef]
  47. Liu, S.L.; Zhao, Q.H.; Wen, M.X.; Deng, L.; Dong, S.K.; Wang, C. Assessing the impact of hydroelectric project construction on the ecological integrity of the Nuozhadu Nature Reserve, southwest China. Stoch. Environ. Res. Risk Assess. 2013, 27, 1709–1718. [Google Scholar] [CrossRef]
  48. Li, H.L.; Peng, J.; Liu, Y.X.; Hu, Y.N. Urbanization impact on landscape patterns in Beijing City, China: A spatial heterogeneity perspective. Ecol. Indic. 2017, 82, 50–60. [Google Scholar] [CrossRef]
  49. Zhu, C.M.; Zhang, X.L.; Zhou, M.M.; He, S.; Gan, M.Y.; Yang, L.X.; Wang, K. Impacts of urbanization and landscape pattern on habitat quality using OLS and GWR models in Hangzhou, China. Ecol. Indic. 2020, 117, 106654. [Google Scholar] [CrossRef]
  50. Kirwan, M.L.; Megonigal, J.P. Tidal wetland stability in the face of human impacts and sea-level rise. Nature 2013, 504, 53–60. [Google Scholar] [CrossRef]
  51. Tobler, W.R. A Computer Movie Simulating Urban Growth in the Detroit Region. Econ. Geogr. 1970, 46, 234–240. [Google Scholar] [CrossRef]
  52. Fan, Q.D.; Ding, S.Y. Landscape pattern changes at a county scale: A case study in Fengqiu, Henan Province, China from 1990 to 2013. Catena 2016, 137, 152–160. [Google Scholar] [CrossRef]
  53. Di, X.H.; Hou, X.Y.; Wang, Y.D.; Wu, L. Spatial-temporal Characteristics of Land Use Intensity of Coastal Zone in China During 2000–2010. Chin. Geogr. Sci. 2015, 25, 51–61. [Google Scholar] [CrossRef]
  54. Cavallero, L.; Lopez, D.R.; Raffaele, E.; Aizen, M.A. Structural-functional approach to identify post-disturbance recovery indicators in forests from northwestern Patagonia: A tool to prevent state transitions. Ecol. Indic. 2015, 52, 85–95. [Google Scholar] [CrossRef]
  55. Wang, Y.; Cadotte, M.W.; Chen, Y.; Fraser, L.H.; Zhang, Y.; Huang, F.; Luo, S.; Shi, N.; Loreau, M. Global evidence of positive biodiversity effects on spatial ecosystem stability in natural grasslands. Nat. Commun. 2019, 10, 3207. [Google Scholar] [CrossRef]
  56. Pennekamp, F.; Pontarp, M.; Tabi, A.; Altermatt, F.; Alther, R.; Choffat, Y.; Fronhofer, E.A.; Ganesanandamoorthy, P.; Garnier, A.; Griffiths, J.I.; et al. Biodiversity increases and decreases ecosystem stability. Nature 2018, 563, 109–112. [Google Scholar] [CrossRef] [Green Version]
  57. Hu, T.; Fan, J.; Hou, H.; Li, Y.; Li, Y.; Huang, K. Long-term monitoring and evaluation of land development in a reclamation area under rapid urbanization: A case-study in Qiantang New District, China. Land Degrad. Dev. 2021, 32, 3259–3271. [Google Scholar] [CrossRef]
  58. Lin, Q.Y.; Yu, S. Losses of natural coastal wetlands by land conversion and ecological degradation in the urbanizing Chinese coast. Sci. Rep. 2018, 8, 16046. [Google Scholar] [CrossRef]
  59. Jim, C.Y. Sustainable urban greening strategies for compact cities in developing and developed economies. Urban Ecosyst. 2012, 16, 741–761. [Google Scholar] [CrossRef] [Green Version]
Figure 1. Location of the study area and geographic distribution of reclamation area since 1980.
Land 11 00421 g001
Figure 2. The area of the landscape transformation in the Jiangsu coastal area during the period 1980–2018.
Land 11 00421 g002
Figure 3. The reclamation process from 1980 to 2018.
Land 11 00421 g003
Figure 4. The overall transfer probability and landscape pattern indices in buffer zones.
Land 11 00421 g004
Figure 5. Temporal variation of different wetland types in different regions.
Land 11 00421 g005
Figure 6. Stability index of different wetland types in different regions.
Land 11 00421 g006
Figure 7. Stability index and deviation of stability in the different buffer zones.
Land 11 00421 g007
Figure 8. Standard deviation of the landscape pattern indices in different buffer zones.
Land 11 00421 g008
Table 1. Landscape types in Jiangsu coastal wetlands.
CategoriesLandscape Types
Natural wetlandsRiver (RR), grassy marshland (GM),
Phragmites Australis (PA), Suaeda glauca (SG),
Spartina alterniflora (SA), mudflat (MT)
Artificial wetlandsPaddy field (PF), pool (PL),
salt field (SF), mariculture farm (MF)
Non-wetlandsDryland (DL), forest (FT), bareland (BD),
levee (LE), urban land (UL),
rural residential land (RL), construction land (CL)
Table 2. The identification of use types of reclamation according to their start-and end-point landscape types.
Use TypesStart-Point Landscape TypeEnd-Point Landscape Type
AQLNature wetlands: mudflat, Suaeda glauca, Phragmites Australis, grasslands, rivers, and Spartina alternifloraMariculture farm
ARLPaddy land, dryland
POLRural land, urban land, construction land
SALSalt pond
HYLPool, levee
Table 3. Optimal area ratio of various landscapes in Jiangsu coastal area (unit: %).
TypesGMMTDLRRFTPABDSAPLPFSGSFMF
Optimal9.940.070.871.8135.817.272.534.240.4429.530.151.306.00
Table 4. Correlation matrix between stability index and area of reclamation.
Use TypesAffected AreaReclamation AreaNon-Reclamation Area
SWSNWSCWSOWSWSNWSCWSOWSWSNWSCWSOW
CA−0.488−0.936 **−0.525−0.385−0.909 **−0.987 **0.667 *0.596−0.4860.686 *−0.474−0.476
AQL−0.570−0.899 **−0.618 *−0.474−0.932 **−0.962 **0.5810.582−0.5630.712 *−0.441−0.556
ARL−0.675 *−0.749 **−0.777 **−0.589−0.962 **−0.843 **0.2670.593−0.675 *0.821 **−0.397−0.670 *
POL−0.376−0.977**−0.321−0.281−0.794 **−0.965 **0.793 **0.364−0.3430.522−0.418−0.333
SAL−0.631 *−0.707 *−0.737 **−0.547−0.880 **−0.817 **0.3530.666*−0.644 *0.735 *−0.454−0.637 *
HYL−0.405−0.977 **−0.357−0.308−0.824 **−0.979 **0.755 **0.444−0.3840.565−0.444−0.374
“**” Indicates significant correlation at the 0.01 level (two tails); “*” indicates significant correlation at the 0.05 level (two tails); SW, SNW, SCW, and SOW represent the stability index of coastal wetlands, nature wetlands, construction wetlands, and non-wetlands, respectively. CA represents the cumulative area of five use types of reclamation.
Publisher’s Note: MDPI stays neutral with regard to jurisdictional claims in published maps and institutional affiliations.

