Review

Factors Affecting Wetland Loss: A Review

by
Gastón Antonio Ballut-Dajud
1,†,
Luis Carlos Sandoval Herazo
1,†,
Gregorio Fernández-Lambert
1,
José Luis Marín-Muñiz
2,
María Cristina López Méndez
1 and
Erick Arturo Betanzo-Torres
1,*,†
1
Wetlands and Environmental Sustainability Laboratory, Division of Graduate Studies and Research, Tecnológico Nacional de México/Instituto Tecnológico de Misantla, Km 1.8 Carretera a Loma del Cojolite, Misantla 93821, Veracruz, Mexico
2
Academy of Sustainable Regional Development, El Colegio de Veracruz, Xalapa 91000, Veracruz, Mexico
*
Author to whom correspondence should be addressed.
These authors contributed equally to this work.
Land 2022, 11(3), 434; https://doi.org/10.3390/land11030434
Submission received: 12 February 2022 / Revised: 13 March 2022 / Accepted: 14 March 2022 / Published: 17 March 2022
(This article belongs to the Special Issue Celebrating 25 Years of World Wetlands Day)

Abstract

:
Despite occupying an area no greater than 8% of the earth’s surface, natural wetland ecosystems fulfill multiple ecological functions: 1. Soil formation and stabilization support, 2. Food, water, and plant biomass supply, 3. Cultural/recreational services, landscape, and ecological tourism, 4. Climate regulation, and 5. Carbon sequestration; with the last one being its most important function. They are subject to direct and indirect incident factors that affect plant productivity and the sequestration of carbon from the soil. Thus, the objective of this review was to identify the incident factors in the loss of area and carbon sequestration in marine, coastal, and continental wetlands that have had an impact on climate change in the last 14 years, globally. The methodology consisted of conducting a literature review in international databases, analyzing a sample of 134 research studies from 37 countries, organized in tables and figures supported by descriptive statistics and content analysis. Global results indicate that agriculture (25%), urbanization (16.8%), aquaculture (10.7%), and industry (7.6%) are incident factors that promote wetlands effective loss affecting continental wetlands more than coastal and marine ones. Regarding carbon sequestration, this is reduced by vegetation loss since GHG emissions raise because the soil is exposed to sun rays, increasing surface temperature and oxidation, and raising organic matter decomposition and the eutrophication phenomenon caused by the previous incident factors that generate wastewater rich in nutrients in their different activities, thus creating biomass and plant growth imbalances, either at the foliage or root levels and altering the accumulation of organic matter and carbon. It is possible to affirm in conclusion that the most affected types of wetlands are: mangroves (25.7%), lagoons (19.11%), and marine waters (11.7%). Furthermore, it was identified that agriculture has a greater incidence in the loss of wetlands, followed by urbanization and industry in a lower percentage.

1. Introduction

The ecosystemic value of wetlands is the set of functions, characteristics, or processes that indirectly or directly contribute to human well-being [1]. The most stand out functions are: wildlife habitat, water supply, and carbon sequestration [2,3]. They additionally produce food, medicine, and recreational uses [4], along with water purification and filtration of agricultural pollutants [5]. In addition, they counteract the effects of climate change through atmospheric CO2 sequestration that they capture and store in the long term either naturally or through man-made sinks [6].
It is important to consider that wetlands represent between 5% and 8% of the earth’s surface [7,8], constituting 29.83 million km2 distributed in Asia (9.2 million), South America (7.95 million) and North America (5.65 million), and representing 78% of the global percentage [9]. Africa has 19% (5.6 million) [10]; especially vegetated coastal wetlands, that store organic and inorganic carbon in greater quantities [11].
Despite the benefits provided by wetlands, the dense populations that develop in coastal areas along with their added poverty, are both responsible for 1% to 3% of annual deforestation [12]. It is estimated that this population around wetlands, favored with its benefits, would reach half the world population located within a radius of 100 km from the coast [13] as a result of the damages caused to their vegetation. Davidson [14] made a balance of area losses by continents since 1900 and adjusted the deforestation rate from 64% to 71%, being higher in coastal wetlands.
One of the main environmental services provided by natural wetlands is carbon sequestration that takes place both in the soil and biomass. In sediments, it is in a 2 to 3 ratio compared to biomass storage [15]. In addition, Marin-Muñiz et al. [16], from their research on several marshes and swamps from the Gulf of Veracruz in Mexico, determined that accumulated carbon was higher in swampy soils than marshes, (0.92 ± 0.12 KgC/m2Yr and 0.31 ± 0.08 KgC/m2Yr, respectively) in a ratio of 3 to 1.
Riparian and coastal wetlands can sequester 50 times more carbon in the soil than other land forest systems [17]. Other more conservative authors such as Donato et al. [18] manifest that in the first 30 cm of soil in wetlands such as mangroves, twice more carbon can be stored in one hectare than boreal forests. This thickness or layer is the most susceptible to changes in land use. On the other hand, Adame et al. [19], citing the Intergovernmental Panel on Climate Change (IPCC), state that mangroves can store two or three times more carbon than tropical and temperate forests.
The largest soil organic carbon reserves are found in tropical wetlands. Köchy et al. [20] and Villa and Bernal [21] confirm that they can store up to one-third of global carbon. Mangroves store 218-ton C/year from the atmosphere, a key component of the so-called ‘blue carbon’ (Cui et al.) [22] referring to the carbon exchanged by habitats near the coast with vegetation [23].
Therefore, determining natural wetland conditions and their evolution over time is important for the global context since the value of ecosystem services per unit area would be known, including areas where vegetation losses develop. They are desirable to restore and protect, as well as to enhance through priority policies [24] due to their quality of being natural carbon sinks.
Vegetation loss implies loss of its functions not only in the ecosystem services for man, but also in the breakdown of the world carbon cycle, and in the water and nutrient cycles [25]. Furthermore, global warming as a result of climate change born from the industrial revolution puts future human survival at risk and has become a challenge to mitigate gas emissions and conserve ecosystems such as wetlands that absorb CO2 [26].
In this context, the objective of this review was to identify the incident factors of loss of area and carbon sequestration in marine, coastal, and continental wetlands that have had an impact on climate change in the last 14 years at a global level.

2. Materials and Methods

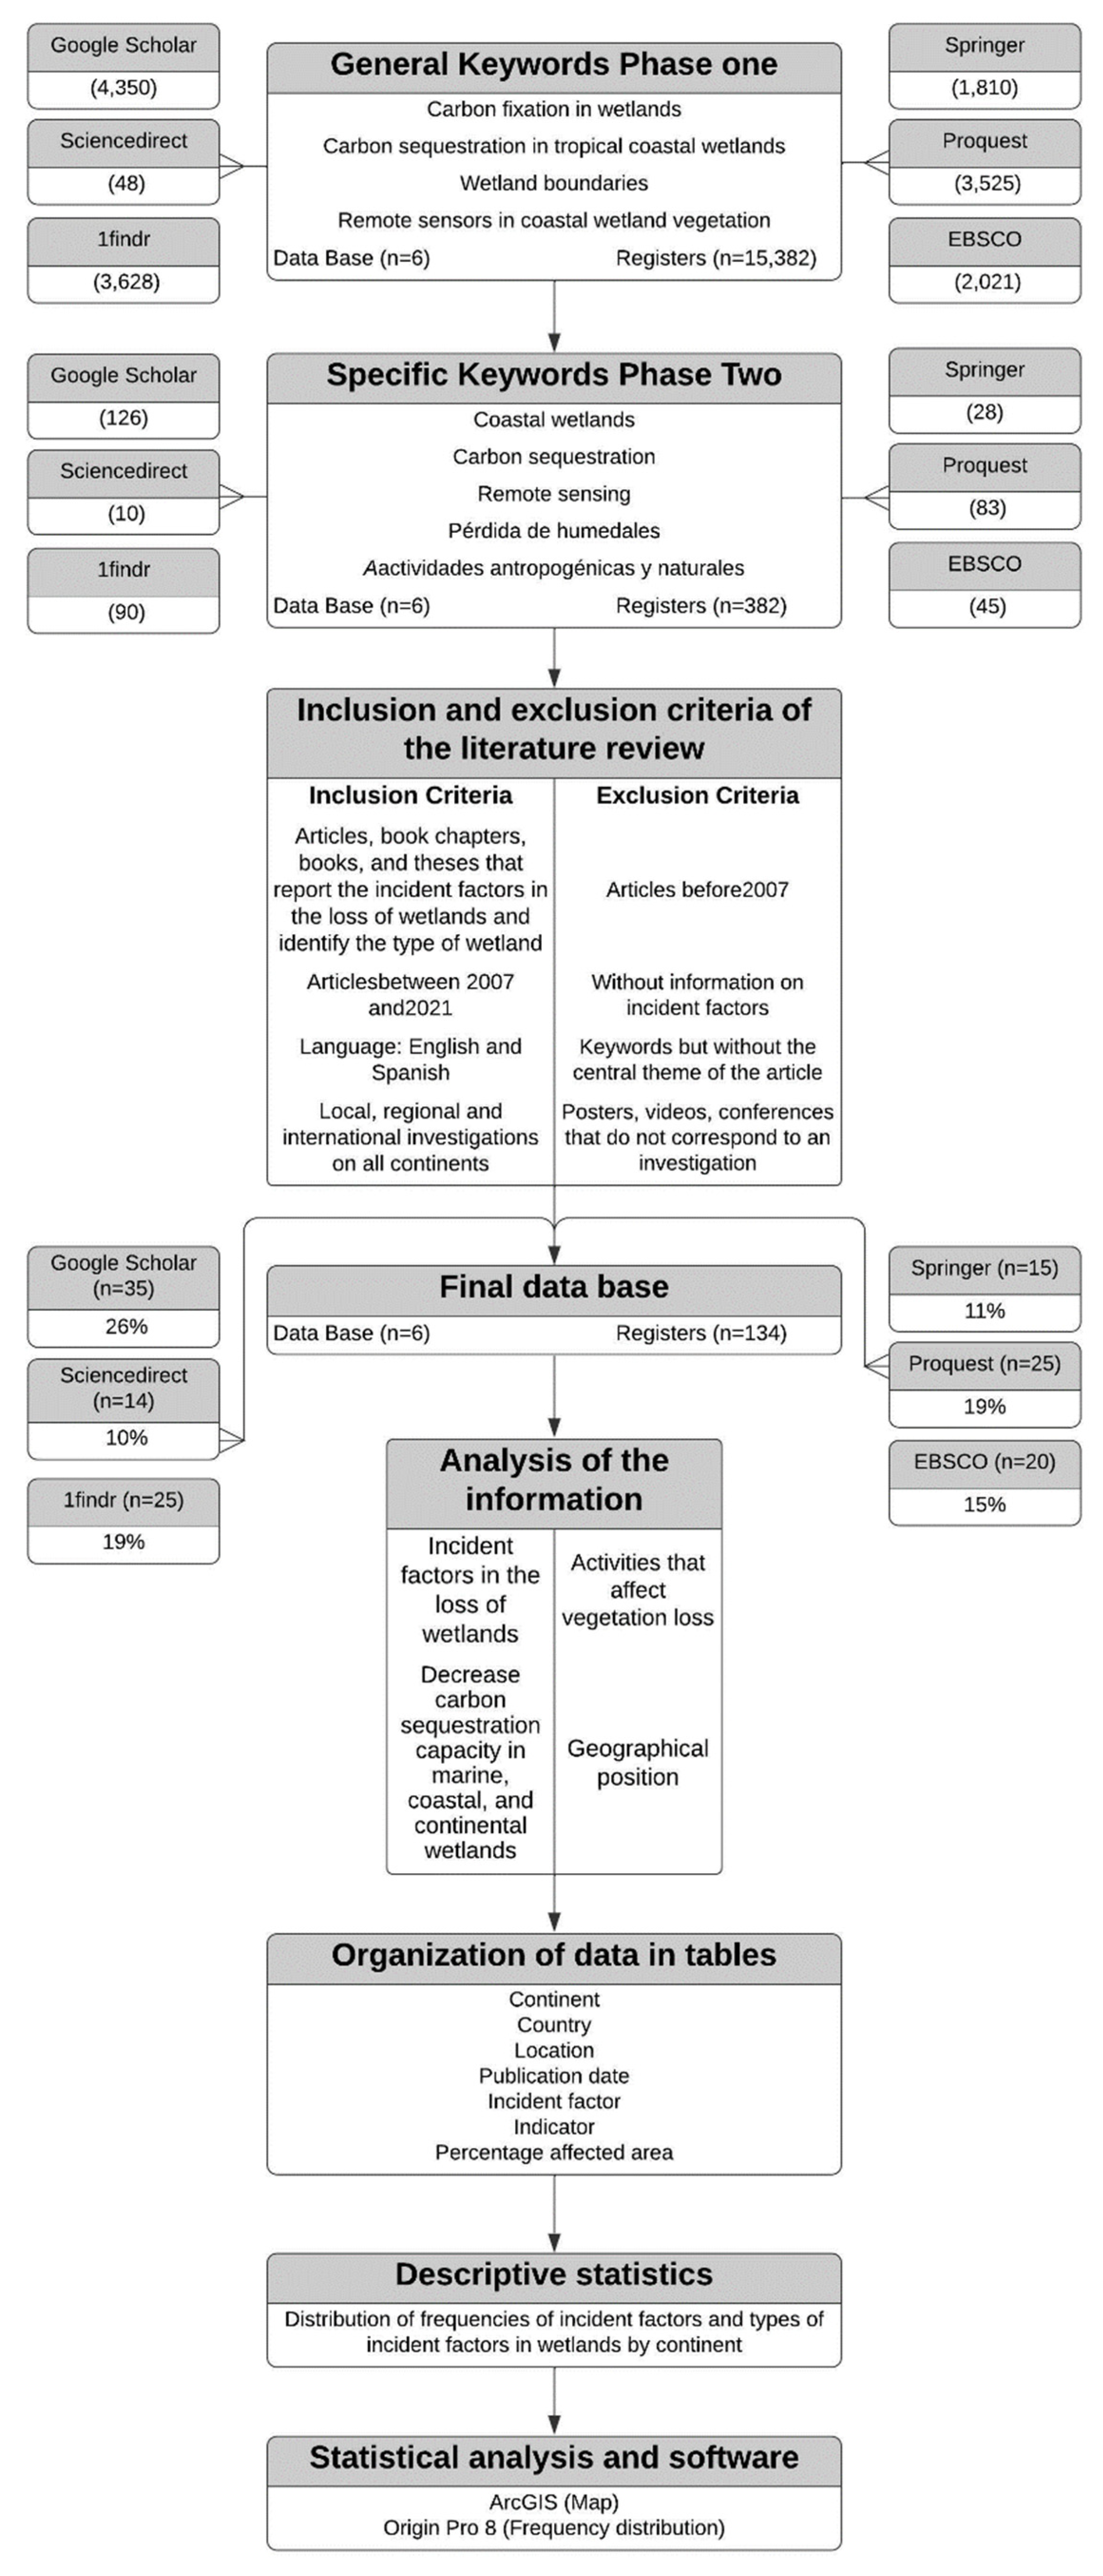
2.1. Information Sources

This research is of a qualitative type, made up of articles integrated with a database of 134 publications from the last decade, adding some research from the second last one to further strengthen the search. This temporality was determined following what was suggested by von Uexkull and Buhaug [27] indicating that in the last decade, scientific research has abundantly been carried out in relation to conflicts associated with climate, considering variable incidents in losses. Such is the case of natural events such as floods, cyclones, pests, or diseases because mangroves and wetlands show resistance to this kind of disturbance [12].
The review was structured by articles, book chapters, books, and theses, and was published in both English (93%) and Spanish (7%). For the search, Google Scholar (26%), Sciencedirect (10%), 1findr (19%), Springer (11%), Proquest (19%), and EBSCO (15%) were used. The selected articles were reviewed by academic peers, who guaranteed the quality of the collected data. When starting the search, keywords were used at phase one such as: carbon fixation in wetlands, carbon in tropical wetlands, carbon in tropical coastal wetlands, carbon sequestration in tropical coastal wetlands, wetland boundaries, and remote sensors in coastal wetland vegetation. At phase two, more specific words such as: coastal wetlands, carbon sequestration, remote sensing, and others. Finally, in Spanish, pérdida de humedales [loss of wetlands] and actividades antropogénicas y naturales [anthropogenic and natural activities], four inclusion and exclusion criteria were used to review the literature and obtain the final database, as shown in Figure 1.

2.2. Information Analysis

This document was organized with all the extracted data highlighting activities that affect vegetation loss and decrease carbon sequestration capacity in marine, coastal, and continental wetlands, considering its geographical position, and organizing it in tables by continent, country, wetland location, incident factor, indicator, and percentage of affected area.
Descriptive statistics were applied, constructing frequency histograms by incident factor by country, continent, and type of affected wetland.
According to the Ramsar International Convention, a classification for wetlands was followed in five levels: system, subsystem, class, subclass, and wetland type. This review was focused on two levels: the system including the marine, coastal, and continental ones; and the wetland type, here, the mangroves, lagoons, marshes, rivers, marine waters, peatlands, swamps, and river deltas. Some wetlands considered natural reserves and those within national parks were also included.

2.3. Statistical Analysis

For mapping locations of sites studied in the investigations, the software ArcGIS, Version 10.0 was used. In addition, content analysis was the technique used, and an analysis guide was used as an instrument for the information by continents regarding the incident factors, countries, and types of wetlands. The Origin Pro Software, version 2021 (OriginLab Corporation, Northampton, MA, USA) was used to elaborate the frequency histograms. Figure 1 shows the methodology in a flowchart.

3. Results and Discussion

Figure 2 shows the spatial location of the number of investigations reviewed that highlighted the incident activities in the loss of coverage and reduction of carbon sequestration capacity in marine, coastal, and continental wetlands. These include 134 documents structured by countries and continents, where the United States of America and China hold first place with the most publications on the subject, followed by Australia, Mexico, India, and Brazil.
This information makes it possible to visualize the distribution and importance required for research on natural wetlands, to gain a better understanding of the current state of the effects on wetlands in the world. Although it is possible that there are other unreported or unavailable research studies, it is very likely that the incident factors reported are similar. The collected information became the sample that was classified by continent for analysis, which allowed us to find the following results.

3.1. Research on the African Continent

Table 1 presents 10 studies found in Africa where location and wetland type, impact period, incident factor in vegetation loss and sequestration, loss indicator, sequestration and impact percentage are analyzed, showing a pattern of continental behavior and helping to build an analysis. It is evident that although few investigations were recorded, the eastern part of the continent allows us to analyze the following:
First, it was found that in the Gazi-Kenya Bay, mangrove forests are used by inhabitants for construction and firewood, authorized by the government for being the only forests. This has brought erosion consequences that finally lower sequestration capacity, experimentally observed in a small-scale plot [28]. On the other hand, Githaiga et al. [29] and Juma et al. [30] indicated that Gazi-Kenya Bay contains some seagrasses that have been degraded by daily fishing with trawls and purse seines by artisanal fishermen. These pastures have not been studied on their vulnerability and carbon sequestration capacity. However, it was determined that pastures with sediments and vegetation sequestered more carbon than others with a scarcity of these.
Second, in another latitude, the coastal area of the Nile River is also affected by salinity when the tide rises, implying a low nitrogen and carbon content since vegetation is scarce. Restoration and ecosystem management with crops was recommended to improve sequestration and mitigate climate change [31]. Authors such as Eid and Shaltout [32], emphasized that Lake Burullus is a Ramsar site and before being declared as such it had lost almost 62.5% of its area due to erosion and sediment deposit loaded with allochthonous carbon and pollutants resulting from agricultural land drainage in the Nile River Delta.
Furthermore, in Ghana, an ecosystem health study was conducted in three coastal Ramsar wetlands, Sakumo II, Densu Delta, and Muni-Pomadze; using structure, function, and resilience indicators such as the Landscape Deviation Degree (LDD), Normalized Difference Vegetation Index (NDVI), and Normalized Difference Water Index (NDWI). The result showed that in 1985, 2002, and 2017, the LDD indicator increased due to urban development activity as the main fragmentation cause in the three wetlands, and the NDVI behaved inversely due to the reduction of areas covered by vegetation. The NDWI was variable due to flooding processes and erosion caused by the sea [33].
In Tanzania, coastal ecosystems not only protect but also serve as habitats for population and fauna. This last function has been threatening animals, transforming their vegetation, especially by man. Thus, these changes along with their dynamics, and socioeconomic drivers were studied between 2000 and 2016. It was evidenced that urban development, agriculture, livestock, and the logging industry are the main activities affecting ecosystems [34].
Comparatively, Lagomasino et al. [35] conducted research in four deltas of two continents on carbon in mangroves, its losses and gains. In the African Deltas, Rufiji (Tanzania), and Zambeze (Mozambique), they identified that incident factors in vegetation loss were illegal logging of mangrove forests and coastal erosion, respectively. Remote sensing techniques were used in the study to determine the changes. The other two deltas will be observed in the Asian continent sections.
On the other hand, agricultural intrusion into Ugandan wetlands, especially Kirinya and Nakivudo, very close to Lake Victoria, has replaced native endemic papyrus vegetation with Cocoyam cultivation. The impact suffered by these incident changes in carbon sequestration and CO2 emission was determined using the Eddy Covariance Technique [36]. Therefore, it is very important to increase statistics of carbon sequestration worldwide. Were et al. [37] studied the Naigombwa wetland located in Iganga, Uganda, where the estimate was determined since a large part of freshwater wetland is being transformed into rice fields. It was found that in the natural wetland carbon sequestration was higher than in the transformed area and it was recommended to use other options of sites for rice cultivation and not in the wetlands.
Finally, the Mkuze floodplain is the largest wetland area in Kwazulu-Natal, South Africa which has been affected by agriculture and construction of the Pongola dam to regulate hydrology, consequently varying the thickness and width of peat deposits as well as sediments along the tributary valley towards Lake Mpanza [38].
Figure 3 and Figure 4, shows eleven (11) incident factors that affect wetlands and the types of wetlands affected respectively in Africa. The descriptive analysis is premature to infer what happens continentally, but it is possible to affirm that there is a trend of incident factors of agricultural activities in the first place, such as farming, fishing, livestock (40%), urbanization, and industry. The latter being directly correlated with each other. Nevertheless, they represent 20% of the analyzed sample.
On the other hand, direct anthropogenic factors alternate; understood as those where pressure is exerted by man on ecosystems first-hand, with indirect factors, negative externalities, consequences, or collateral damage that were classified as coastal erosion, salinity, and flood.
The effects in Africa are mainly due to agricultural activities since this continent is the second most populated but at the same time the poorest on the planet, being rich in natural minerals such as platinum, diamonds, chromium, and so on. It also has a high number of countries without access to the sea and cities with high population density. Its development has been slowed down in terms of continental trade, due to its large desert and jungle area that prevent people from transit [39].
The interpretation given to the previous results can be focused on two aspects: In the first instance, the two figures show a trend in data behavior in Africa, because, with only ten investigations, they represent 7.46% of the total research. However, in the second one, this information indicates a consistent trend of what is happening with wetlands due to the lack of an appropriate conservation policy and extreme poverty. Therefore, farmers do not consider the effects on wetlands from their productive activities.

3.2. Research in the American Continent

In Table 2, fifty-five (55) studies found in the American continent are described, occupying the first place among all the continents with 41.04% of the total sample, making it an important number, covering research from the United States to Argentina.
It is important to highlight that from the total investigations in this continent (n = 55), 41.82% were developed in the United States and the rest in Latin America (Mexico, Brazil, and Colombia). Results show that agriculture, urbanization, and ranching occupy the first places with a frequency of double digits in the entire continent. Wetlands in the United States have had more impact.
In contrast, regarding agriculture and urbanization in Latin America: Although Quimbayo Ruiz [40] stated that Latin America and the Caribbean are the most urbanized regions in the world, in this region, the territory has been developed by socio-political appropriations of space degrading ecological issues, so it could be assumed that it is not due to socio-economic activities.
From the ecosystem point of view, it is evident that coastal wetlands (mangroves, lagoons, and marshes) are more affected than continental ones. It is important to highlight that they correspond to the spatial location of the most important and populated cities of the continent. On another level, global efforts have been made to tackle climate change by trying to reduce net carbon emissions, but they have not been enough. Only two countries in Latin America and the Caribbean have mitigation plans [41]. Consequently, conservation and preservation of these ecosystems should be on the political agenda of current leaders, for the planet’s sustainability due to its great capacity to sequester carbon and counteract the effects of global warming.
A first aspect to analyze is the repeated entry of saltwater during drought times that abruptly decreases concentrations of dissolved organic carbon in the freshwater coastal wetlands of the Albermarle Strait, reaching a salinity of 12 ppt in the dry season. These conditions are given by agricultural development that has connected the area with drainage channels [42].
It was also found that a SLAMM/HEA model or approach was developed to predict effects and economic costs caused by sea-level rise in the Delaware Bay and Indian River Florida Estuaries, USA since 1970. Finally, it was shown that it can be achieved with a resolution of 10 MT, a large-scale analysis, useful for ecosystem managers [43]. According to St. Laurent et al. [44], organic matter and carbon variability in sediments from two marshes in Delaware were studied. Results showed significant differences in sequestration and even in vegetation. Stream basins that supply wetlands are affected by agriculture and urbanization.
On the other hand, a disease such as mud mold and a hurricane in 1933 extinguished seagrasses in the Virginia-USA Coastal Reserve, causing the closure of the fishing industry. Starting in 2001, new grasslands were planted and were subject to study to determine carbon sequestration at different ages of pastures, resulting in higher values in pastures of 10 years [45]. The restoration of wetlands has been carried out since 2004 subject to deforestation and agriculture in the 20th century. Then, through monitoring with Lidar sensors, biomass in this young vegetation was estimated with limited results, and the use of optical sensors and high spatial resolution was recommended [46].
Furthermore, Moseman-Valtierra et al. [47], consider that some anthropogenic activities deposit low nitrogen concentrations in the saltwater marshes in Rowley, Massachusetts. For this reason, the effects of nitrate in gas production were studied during a time through parcels. It was concluded that anthropogenic additions alter emissions substantially.
According to the point of view of Stralberg et al. [48], the San Francisco Bay in the USA contains marshes that will be threatened by the rise in sea level and supply of sediments limited by works upstream with a possible vegetation loss. However, it was evident that since European colonization, about 90% of marshes were lost to agriculture and urbanization.
Regarding the wetland degradation process, it was determined that on the coasts of New England, not only has overgrazing determined vegetation loss due to population growth, but also burrows of crabs because they weaken the peat and cause erosion with tides [49].
On the Georgia coasts, properties of soil, carbon sequestration, and accretion in freshwater forests from three rivers affected by increases in sea level were studied. It was concluded that the accelerated level will decrease the forests and expand saline marshes, and the conversion into marshes will improve carbon sequestration [50].
Now, Siciliano et al. [51], used three approaches to determine changes in nutrient enrichment in the Elkhorn Slough wetland, California. This served to measure how an estuary is affected by agricultural activities where amounts of nutrients are discharged to its waters causing eutrophication. He also used hyperspectral images to detect the spatial changes that vegetation underwent when using two spectral indices. They found a relationship between reflectance, chlorophyll, and nutrients.
Similarly, researchers analyzed the impacts that coastal ecosystems can suffer in their flora and fauna due to the spills of different types of oil, either due to transport or production in the high seas, especially the one caused in 2010 off the coast of the Gulf of Mexico. The spilled oil reached the coasts by high tides or winds, stagnated in the vegetation and soil, and caused damage to fish and wildlife due to its chemical toxicity [52].
In contrast, the agricultural activity in the Marlens Tract wetland, located in the Montezuma Wild Management Area in New York State, has partly affected its 99 ha area, reducing its spatial heterogeneity in soil and microbial properties [53].
In the Corn Belt located in the USA Midwest (Indiana, Illinois), Craft et al. [54] argued that almost 90% of wetlands have been drained in 150 to 200 years, for agricultural activities that require large amounts of soil nutrients.
On the other hand, Lane et al. [55] reported that the construction of dams to control floods has been affecting the forested coastal wetlands of Louisiana, USA, largely due to scarcity of sediments and the contribution of fresh water. Failing that, these receive effluents have been treated by wastewater treatment plants. The potential of these wetlands as carbon pools was researched. Louisiana has 40% of the wetlands in the USA and they accumulate 42% of the world’s carbon reserve. Furthermore, 80% of losses from the 19th to the 20th century in Louisiana were due to drainage to convert wetlands into agricultural land, which accelerated organic matter loss, carbon oxidation, and its release into the atmosphere as CO2 [56]. In the same state in Barataria Bay, the coastal subsidence of 5 to 16 mm/year and the increase in sea level of 3.4 mm/year has given rise to the loss of 25.9 km2 per year of wetlands due to erosion, causing soil carbon to be dissolved and degraded until it is released into the atmosphere [57].
Fennessy et al. [58], studied the variation of carbon sequestration depending on the ecological condition and by eco-region in the USA. Nine (9) freshwater wetlands were taken in the Erie Drift Plain region (Ohio) and 10 in Ridge and Valley (Pennsylvania). Results showed that in the Ohio region soil accretion rates were higher because agriculture dominates there and there was greater sediment carry-over, while in Pennsylvania the region is made up of mountains and wooded areas that limit erosion and sediment transport.
In the Sacramento-San Joaquin Delta located in the central valley of northern California, Hemes et al. [59] studied the carbon that accumulated organic matter in freshwater marshes for more than 7000 years, generating a peat layer with more than 15 m deep rich in carbon, but a large part of it was eliminated in just 100 years due to dams’ construction, drains for agriculture and livestock, generating a high emission of greenhouse gases. Therefore, their restoration was proposed.
The nutrient load that the peatlands from the Everglades in the USA receive has allowed phosphorus to be the main cause of changes in the ecosystem, especially in vegetation structure. This element has been deposited with the construction of drainage channels [60]. The Everglades in Florida have historically been subject to agricultural exploitation on the north and urbanization on the east, thus becoming the subject of restoration. In addition, the Great Dismal Swamp is a swamp affected by fire, drainage, and deforestation in the last 200 years [61].
Verhoeven et al. [62] stated that insects are being controlled globally through the Rotational Impoundment management (RIM) approach, which consists of creating reservoirs and pumping water from wetlands, then returning it through sewers, which has caused changes in vegetation due to the nitrogen cycle. It was implemented in Florida until 1985 causing the vegetation cover to decrease from 75% to 30%.
In another research, Dontis et al. [63] deduced that in Tampa Bay, Florida, mangroves have been displacing marshes to a great extent due to climate change. However, wetlands lost an average of 2000 ha between 1950 and 1990 to urban development. In Naples Bay, approximately 70% of mangroves have been lost due to urbanization. Where soil samples were taken, carbon was estimated, and sequestration data were lower than world averages [64].
In Mexico, more than 50% of mangroves in the coastal area of the Nuxco sub-basin from Guerrero State have been lost in 34 years. Geographic information systems were used to prepare thematic maps that identified agriculture, livestock activities, and developers as the main causes of vegetation losses [65].
Furthermore, as highlighted by Cerón et al. [66], the Laguna de Terminos in the Yucatan Peninsula, has been considered a Ramsar site since 2004. Two research sites Esterero-Pargo and Bahamitas were chosen, both sites affected by human pollution, especially wastewater. Carbon content was determined at different seasonal times and in relation to depth.
In addition, Vázquez-González et al. [67] in relation to current vulnerability and, current and strategic trend, using a scale index for coastal wetlands, found in the lagoon system of Alvarado, Mexico, that the main anthropogenic factors that have affected them have been livestock since the arrival of conquerors and sugar cane agriculture. As a result, they found that vulnerability in the current scenario and current trend increases in all municipalities of the State of Veracruz.
In Mexico, the area with the highest aquaculture shrimp production is the Sinaloa state. Berlanga-Robles et al. [68] found with satellite images that 75% of shrimp farming occurred in marshes and 1% on mangroves, modifying the spatial vegetation pattern in coastal wetlands.
Now, due to livestock, petrochemical, and urbanization activities, coastal wetlands in the State of Veracruz have been transformed, and their capacity to retain water and sequester carbon has decreased. It was determined that marshes and swamps are important for these two functions [69].
The Gulf of Mexico was subject to a historical reconstruction of mangroves in its area, given its significance on carbon sequestration and the effects of climate change it has suffered. It was concluded that in 1983 the sub-freezing in Texas affected approximately 80% of mangroves. On the other hand, those without vegetation (open water), decreased from 1951 to 1967 because the substrate increased due to sediments driven by Hurricane Carla in 1961 [70].
Additionally, Adame et al. [71], in research developed on the Pacific coast of southern Mexico, in Chiapas to be exact, located La Encrucijada Biosphere Reserve (LEBR) with an area of 144,868 ha and different types of wetlands. There, the carbon pool, as well as sequestration rates, were determined by comparing stocks in trees, fallen wood, and soil. The degradation of wetlands was evidenced thanks to a load of sediments resulting from the dredging of the river upstream and fires threatening the potential sequestration estimated at 38 tons of carbon.
Furthermore, in Mexico, Ochoa-Gómez et al. [72] studied in the region of the Gulf of California, the coastal zone including Bahía de la Paz that covers an extensive area of 14 mangrove patches with a total area of 270 ha, affected by the expansion of the urban center of La Paz adjacent to the mangroves. This region has the second-highest rate in Mexico in terms of population growth and urban development, reducing the mangrove area in some cases up to 50%.
In the Ramsar site of Sian Ka’an Biosphere Reserve (SKBR), in the Yucatan peninsula, carbon reserve in its wetlands was quantified with three vegetation types, finding that tall mangroves had the largest reserves. It was also concluded that climate change has affected mangroves with the rise of sea levels, road construction, and water pollution due to tourism [19].
On the other hand, in Belize and Guatemala, carbon isotope relationships were analyzed over time since the lowland wetlands have been cultivated by Mayan indigenous people, finding variations in the different soil layers in the Milpa wetlands [73].
Interestingly, in order to increase carbon data in wetlands, a study was carried out in three areas of Honduras: Laguna de los Micos, Roatan islands (Guanaja, Utila), and Gulf of Fonseca. The latter affected by aquaculture since 1985, aimed to transform 5800 ha of mangroves. The results did not show significant differences among the three sites [74].
Now, according to Rodríguez-Arias and Silva Benavides [75], the wetlands of the Estereo brook, located in San Ramon, Costa Rica, are being prioritized due to degradation suffered from urban expansion and wastewater generated by the population, largely losing the functions of its ecosystem services in the last 10 years.
Ref. [25] studied 12 wetland communities on two continents with different characteristics to compare carbon sequestration: two freshwater wetlands in the humid tropics in Costa Rica and two wetlands in the dry tropics, one in the Okavango north of Botswana and the other one in Costa Rica. Authors stated for the latter, that in the previous three decades it has been the object of cattle grazing. It was found that humid tropical wetlands had higher carbon content than dry ones and also, the dry ones had similar data, but the humid ones differed significantly. This research was developed at the Earth University, it has an approximate area of 3300 ha and is located in the Parismina river basin. The study described how wetlands are being used internally within the campus, finding that farming activities with plantations of bananas and pineapples have been affecting the basin [76].
In Cuba, since the middle of the 19th century, the cultivation of sugar cane increased, deforesting and draining hectares of forests and swamps. Then, when the Soviet Union ended, these areas were switched to large-scale livestock activity. Through an agreement between American universities, the environmental threats that affect these ecosystems in the Caguanes National Park were determined. The complexity of the research relationships was evident due to political causes, and it was considered that the community should be involved in the wetland’s conservation [77].
Kauffman et al. [78], quantified carbon reserves in wetlands in the province of Montecristi, Dominican Republic, including abandoned shrimp ponds since 1993. Results showed that they represented only 11% of the mangroves in their reserve and that they also emitted more CO2 gases. The construction of dikes for aquaculture blocked the flow of fresh water and tides.
Now, in Colombia, in the Magdalena River basin, two types of wetlands, one fluvial and the other one isolated, were compared in relation to carbon sequestration. The result was higher in the isolated one. On the other hand, in the same research, Pérez-Rojas et al. [79], stated in the discussion, that this basin has been too deteriorated due to having the main river artery of the country and a high settlement of the population in its surroundings. In general, from 2007 to 2012, the area of wetlands decreased by 24% in Colombia, due to livestock, agroindustry, mining, energy activities, and urban expansion.
The Gulf of Uraba region, also in Colombia, is suffering from the excessive deforestation of mangroves attributed to agricultural and urban activities among others, greatly affecting mangrove structure. In terms of biomass, diameter varied; in terms of species, there was a reduction of some and proliferation of others [80].
Furthermore, Ricaurte et al. [81], analyzed the loss of wetlands with remote sensor images. Results highlight that, in the Orinoco and Caribbean regions, the most incidents of anthropogenic activities are oil palm cultivation.
According to Palacios Peñaranda et al. [82], mangroves of the Colombian Pacific, and especially the bay of Malaga and Buenaventura, served as scenarios to quantify carbon reserves, finding that they were similar to other tropical mangroves. They determined that these mangroves are being degraded by deforestation, urbanization, expansion of docks, and ports.
In addition, in El Tunjo wetland located in the Colombian capital of Bogota, Mateus and Caicedo [83] confirmed that it underwent a transformation process from 1940 to 2014, determined through satellite images, where it was evidenced that urban processes affected up to 90% of the area, causing fragmentation.
The study area located at the Technical University of Machala, Ecuador, is a wetland with approximately 12,500 m2. This has been affected not only by the enclosure of the university campus, but also by the deposit of solid waste, especially construction debris [84].
The Santa Rosa wetland, located on the north coast of Lima, is an environmental lung filtering air and water due to its great biodiversity. It has been affected by activities such as agriculture, pig farming, livestock, and wastewater, developing in it, a large number of invasive species such as Pistia stratiotes, which is a floating plant that causes eutrophication [85].
Regarding the Caribbean islands, Trinidad and Tobago has approximately 362 km of coasts. It is considered as the country in the Caribbean with the industry most heavily dependent on oil and natural gas. On its coasts, port industries, agriculture, and urbanization have been developed affecting the ecosystem value of its wetlands, especially the economic valuation of carbon sequestration [86].
In 2014 and over 2 years, Ding et al. [87] sampled three wetlands in different continents, Everglades, Pantanal, and Okavango, in order to determine the effects of natural and provoked fires that burn aerial biomass and its final deposit as black carbon dissolved not only in the soil but also in the atmosphere, water, and sediments; representing large significant amounts.
Similarly, in Brazil, Rovai et al. [88] determined that the hydrological alterations made by man 165 years ago in the Valo Grande canal river modified the deposit patterns and biogeochemistry of the water by diverting the river. Similarly, the mangrove area was reduced due to the intrusion of freshwater macrophyte species in the estuarine system of the Cananeia-Iguape lagoon. With this county being the second largest mangrove area in the world.
Furthermore, the disorderly growth of eucalyptus forestry, agriculture, and urbanization have been occupying the coastal wetlands of Costa das Baleias, Brazil for the last 34 years. Therefore, it is urgent to research this area to value and preserve this natural environment to counteract human actions [89]. In the Varzea alluvial plain in the Amazon River, cultivation of cocoa, jute, and rubber occurred between 1940 and 1990. Currently, they are secondary forests that keep livestock among their trees causing soil compaction. Remote sensors were used to understand how the stored carbon suffered variability over time as a consequence of livestock, floods, and forest age [90].
The basin areas of the Atibaia and Jaguari rivers in Brazil have been affected by the eutrophication of agricultural lands, mainly by the cultivation of sugar cane and urbanization, respectively, affecting the physical characteristics of the streams and fish community [91]. Now, in the Jaguaribe River, there is a mangrove area where Ferreira et al. [92], studied the effects on vegetation and soil by herbivorous crabs and also, biomass restoration as a result of deforestation. The main factors that affected the area are wastewater and aquaculture. After 10 years it was found that the restored area sequestered more carbon than the self-recovered one.
Regarding pollutants, there are metallurgical companies that produce Zn that contaminate the Sepetiba Bay with toxic metals generated when processing minerals such as bauxite. Concentrations of these metals affect the population when consuming diets based on shellfish from the bay [93].
Finally, in Argentina in the Paraná River delta, studies were conducted using remote sensors to identify anthropogenic activities that cause area losses. It was concluded that from 1994 to 2013, the main cause was the change of use of the soil for cattle production [5].
Figure 5 shows the 14 incident factors that affect wetlands in the American continent, highlighting agriculture, urbanization, livestock, and wastewater, among others.
On the other hand, and according to the bibliography consulted, it is observed in Figure 6 that the most affected types of wetlands are mangroves, lagoons, and swamps, followed by various types of wetlands and rivers. In America, it is where the greatest evidence of work related to the effects was found, which may indicate the interest in their study, restoration, and of course the economic capacity to finance this type of project, especially in the United States of America, which represented more than 50% of the studies in that continent.

3.3. Research in the Asian Continent

Table 3 shows studies found in Asia, with a total of 46 investigations, highlighting China, India and Malaysia, with a highly significant presence of wetlands, where affectations were also reported.
China is the country with the largest area in the Asian continent and the longest length of its coasts, hence the greatest number of research studies (n = 23). It is considered the second most important economy in the world and results from Table 3, and Figure 6 and Figure 7 indicate this. Factors such as aquaculture (the largest producer in the world), agriculture, urbanization, industry, coastal erosion, wastewater, and population growth, and the affected wetlands such as: bays, mangroves, lagoons, estuaries, and river deltas are related to each other in a cause–consequence relationship [94], where population and urbanization have affected its coastal wetlands such as bays and estuaries because three large groups of industrial cities settled in the bays of the most important rivers in the country.
Exports from Japan, Taiwan, South Korea, and Hong Kong together represent much more than twice those of the third world. Similarly, their growth rate is higher than other countries. Their Gross National Product is comparable to that of the United States of America [95].
Table 3. Data from the Asian continent on wetlands in coastal, marine, and continental zones (n = 46).
CountrySite and Type of Wetland or Flooded AreaAffectation Time (Years)Incident Factor in Vegetation Loss and SequestrationLoss and Sequestration IndicatorAffectation PercentageAuthor
ChinaYellow River1990–2015UrbanizationLand Use Cover Change LUCC15[17]
ChinaXiamen Coast WetlandsN.A.Urbanization, Population GrowthVegetation LossN.A.[96]
ChinaMangroves Northeast Coast Hainan Island1960–AquacultureVegetation Loss73[97]
ChinaXincun Bay, Hainan IslandN.A.AquacultureEutrophicationN.A.[98]
ChinaShanyutan Swamp, Minjiang River Estuary19th CenturyAquaculture, Agriculture and WastewaterCarbon MineralizationN.A.[99]
ChinaSanjiang PlainLast 50 yearsAgricultureVegetation LossN.A.[100]
ChinaLiaoche Rivel DeltaN.A.Agriculture, Aquaculture, Oil Exploitation, Forestry, Industrial ConstructionVegetation LossN.A.[101]
ChinaDaya BayLast Decades.Domestic, Industrial, Agricultural and Aquacultural Waste Water.EutrophicationN.A.[102]
ChinaNorth Hangzhou BayLast YearsUrbanization, Agriculture and RoadsVegetation Loss.N.A.[103]
ChinaShenzhen BayN.A.MicroplasticsHeavy and Organic Metal PollutionN.A.[104]
ChinaYellow River Delta, Shandong ProvinceLast CenturyAgricultural Fertilization and Fossil Fuel CombustionPlant Growing. [105]
ChinaChongming Island, Yangtze EstuaryTwo DecadesBreakwater Construction Agricultural UsePuddling below Ground Level (30 cm)N.A.[106]
ChinaZhangjiang EstuaryN.A.Shrimp AquacultureVariation of Mangrove Height by NutrientsN.A.[107]
ChinaPoyang Lake, Yangtze RiverLast DecadesClimate change and intensive human activitiesLoss of Water Level, Change in VegetationN.A.[108]
ChinaNortheastLast CenturiesAgricultureVegetation LossN.A.[109]
ChinaHangzhou Bay2000, 2010Industry and urbanizationEconomic Development35.81, 15.19[110]
ChinaJiaozhou BayN.A.AquacultureHigh Alkalinity and SalinityN.A.[111]
ChinaBohai Bay1979–2014Urbanization and agricultureEconomic DevelopmentN.A.[112]
ChinaHeilongjiang, Jilin and Liaoning Provinces50Climate ChangeDesiccationN.A.[113]
ChinaYangtze RiverN.A.Waste waterDecreasing BiomassN.A.[114]
ChinaSanjiang Plain50AgricultureDrainageN.A.[115]
ChinaYancheng Natural National Reserve1988–2006Agriculture, aquaculture urbanizationLandscape FragmentationN.A.[116]
ChinaBaiyangdian Freshwater Wetland1970–Reservoir ConstructionWetland DryingN.A.[117]
ThailandPhang-nga Bay Phuket ProvinceVariableMining, Agriculture, Aquaculture and UrbanizationChange in UseN.A.[118]
Saudi ArabiaPérsian GulfLast CenturyOil Industry, Urbanization, Population GrowthVegetation Loss90[119]
KoreaMarshes Mud Flat1987–IndustryPressure due to Development22[120]
KoreaSeagrasses Korea PeninsulaLast two or three decadesConstruction of Levees, Urbanization and IndustrializationVegetation LossN.A.[121]
IndiaCoastal zone Cambay Gulf, GujaratN.A.Industry, Aquaculture, Urbanization and Coastal ErosionVegetation LossN.A.[122]
IndiaLake wetlands University of Kalyani West Bengal.N.A.Industrial Waste WaterEutrophicationN.A.[123]
IndiaKerala State Coastal MangrovesLast 50 yearsAquaculture and Coastal ErosionVegetation LossN.A.[124]
IndiaChilika brackish water lagoonN.A.Nitrogen FertilizersEutrophicationN.A.[125]
IndiaKannur, Kerala, and kunhimangalamCurrentlyAgriculture, Aquaculture, Urbanization, RoadsVegetation Loss.N.A.[126]
IndiaKodungallur-Azhikode EstuaryN.A.Aquaculture y AgricultureOrganic and Inorganic Waste.N.A.[127]
MalaysiaKalimantan indoor bog, BorneoLast DecadesFires and DrainageVegetation LossN.A.[128]
N.A.: Not Available. LUCC: Land Use Cover Change.
The northeast coast of Hainan Island, in southern China, has lost around 73% of its mangrove area due to aquaculture activities since 1960, generating high rates of suspended matter and nutrients such as nitrogen, causing eutrophication of waters, and possibly causing damage to reefs, seagrasses, and corals [96]. In another area of China Fan et al. [97] found that the loss of coastal wetlands in Xiamen is due to high urbanization and high population from recent years, which has caused an expansion of reclamation lands and a decrease in land for cultivation.
On another level, Jiang et al. [98] stated that contributions of nutrients generated by shrimp aquaculture in Xincun Bay, Hainan Island, South China Sea, have allowed eutrophication to indirectly reduce the seagrass, sequestering organic carbon, and conversely enhancing labile organic carbon. Carbon mineralization in the Mianjiang River, China has been affected by anthropogenic activities, mainly aquaculture, agriculture, and pollutant discharge, inhibiting the sequestration process [99].
Now, the Sanjiang plain is a region with different types of wetlands, bathed by the Heilong, Wusuli, and Songjhua rivers. Marshes have been converted to farmland for 50 years before this publication, becoming one of the most productive regions in China. They were converted into Ramsar sites and the rate of carbon accumulation in the short and long term was estimated [100].
One of the largest coastal wetlands in Asia is the Liaoche River delta, which has suffered the impact of changes in land use due to different anthropogenic activities, which led to research on how land reclamation affects the storage of organic carbon and total nitrogen. It was identified that: oil pollution had a higher concentration of carbon and nitrogen but does not serve as a fertility test. Sugar cane released both elements quite a lot. In terms of uses, there were also differences in storage [101].
In another place of high economic importance such as Daya Bay, an industrialized and highly-populated area, Zhao et al. [102] identified a discharge process of wastewater product of different anthropogenic activities, causing the eutrophication phenomenon in its waters due to nitrogen. That is why the incidence of some environmental attributes within the denitrification process was researched, studying key enzymes that favorably act to achieve it. It was concluded that temperature and ammonia are key factors in the removal. Furthermore, the mangrove has a 48% efficiency in relation to other types of wetlands.
In the Yangtze Delta, North Hangzhou Bay is the largest economic center in China with a dense population. Demand for land has been such that it has been used for urbanization, agriculture, and road construction. Huang et al. [103], conducted their analysis, thanks to the use of remote sensing and geographic information systems, as well as a weighted linear model used to evaluate the risk of loss and degradation of wetlands.
Moreover, a very serious environmental problem generating pollution is micro-plastics, not only in the fauna transferred through the food chain causing energy depletion, slowing growth, and even causing death, but also in the flora because they function as adsorption vectors and carry heavy metals such as (lead, cadmium, and chromium) and organic pollutants (polychlorinated, pesticides, biphenyls, and so on) affecting the growth of microalgae and macrophytes. Depending on the wetland characteristics, whether they were deposited in it, a study was carried out in Shenzhen Bay, and it was determined that severe pollution in the mangrove accumulates more in the edge strip than in the inside and on the floor [104].
The deposition of nitrogen in the soil of wetlands, a product of anthropogenic activities of fertilization or fossil combustion, affects carbon dynamics and the soil physicochemical properties, being reflected in the growth of plants and soil microorganisms. The delta of the yellow river in the Shandong province does not escape this reality, that is why an experiment was carried out at the mesocosmic level with different amounts of nitrogen. The effect on plant growth and carbon decomposition was evidenced [105].
Additionally, the effects of climate change at the global level and the constant rise in temperature, brings with it damaging and catastrophic effects on land ecosystems, especially in wetlands and in their soil, affecting the microbial activity and the same soil chemical properties that directly affect the wetland vegetation, for which the possible changes in the reserves of Carbon, Nitrogen, Phosphorus of the soil and the related microbial activities were examined after 7 years of experimental heating in situ through open chambers (OTC) in a Phragmites wetland in the Yangtze estuary. The researchers concluded that global warming in this estuary without tidal impacts could increase C reserves, while N and P reserves could increase with moderate warming [106].
Floods are equally important since they cause a distribution of the different mangrove species with their tides. As determined by Zhu et al. [107], many times they are used by the inhabitants to establish aquaculture activities, especially shrimp farming, resulting in variability in mangrove growth due to the nutrients in the drainage of the shrimp ponds. Some species are more sensitive than others.
Researchers Mu et al. [108] showed that Lake Poyang is hydrologically suffering, due to climate change and anthropogenic activities, affecting its water level, and increasingly reducing its vegetation cover as well as its distribution in the dry season as a critical period, thus minimizing its ecological function. Remote sensing images from multiple sources, using the Random Forest technique, digital elevation models, meteorological data, and so on, were used to examine long-term vegetation changes during the dry season.
Similarly, a review article was prepared whose main axis was the carbon budget in Chinese wetlands. The prevailing problem showed uncertainties in the different sequestration data in multiple investigations, so all the pertinent information was synthesized. On another level within the document, it was discussed that a large part of marshes in northeast China, without specifying location, have been lost due to agricultural activities in recent centuries [109].
Now, wetlands in Hangzhou Bay China are in a very economically developed coastal area. Consequently, industrialization and urbanization have had an impact on surrounding ecosystems in recent decades due to changes in land use, being in descending order among the most affected: rice fields, shallow waters, reservoirs and ponds. The total sum of area among all ecosystems in 1990 was approximately 6000 km2. By 2000 they were reduced by 35.81% and by 2010 by 15.19% [110].
Likewise, Jiaozhou Bay located in the Shandong-China peninsula has an area of approximately 500 km2, where ponds have been built for aquaculture, becoming the main use of the land of the Dagu estuary, which has generated high alkalinity and salinity in the soil, causing a more complex carbon cycle [111].
China suffers rapid urbanization and industrialization, as estimated by Meng et al. [112], especially Bohai Bay affecting blue carbon ecosystems due to economic development, affecting wetlands from 1979 to 2014 in 1.11 × 10⁵ km2 of soils for construction and agricultural activities such as aquaculture, represented by 2/3 of the world total.
Indirectly Zhang et al. [113], state that in northeast China in the provinces of Heilongjiang, Jilin, and Liaoning there are different types of wetlands including Ramsar, with a total area of approximately 753.6 km2. In the last 50 years, these boreal and temperate ecosystems have undergone transformations as a result of climate change due to variation in temperature and rainfall, exerting negative effects on carbon sequestration due to wetland desiccation.
The Jiuduansha Wetland has an area of 423.2 km2 and is located in the estuary of the Yangtse River. Carbon sequestration and its ecological function, are being affected by the discharge of wastewater by plants located upstream, causing the eutrophication phenomenon and also the increase in tides, high soil respiration and decreasing biomass, thus reducing carbon sequestration [114].
The microbial activity was related to the labile organic carbon of the soil, i.e., dissolved, in the Sanjiang plain in northeast China, with a wetland area of approximately 1.04 × 10⁴ km2, specifically, in the Honghe International Nature Reserve wetland, a Ramsar site since 2001, but despite its category, agriculture around the reserve has affected the water level in the last 50 years, causing it to drop 4.02 m between 2005 and 2014, affecting its function as a carbon sink [115].
In the Yellow River Delta in China, an attempt was made to reduce carbon loss by improving the connections between wetlands fragmented by anthropogenic activities and land use and cover change (LUCC), moving from crops to urbanization, for which maps were used to observe the variability over time and proposed to protect the wetlands with the regulation of sediments and to observe the dynamic changes of landscapes in some lower reaches and in the delta itself [17].
Bearing in mind Ke et al. [116] who state that the Yancheng National Nature Reserve in China has received all kinds of considerations because it is a place of protection for endangered birds, and despite its international importance, it does not escape anthropogenic activities such as agriculture, aquaculture, and urban expansion, which have degraded and fragmented the landscape due to population growth and economic development. The damage caused was evidenced by remote sensing techniques.
In the north of China, the Baiyandian wetland is the largest freshwater lake in that area, Dong et al. [117] studied its storage capacity because it has been affected by the construction of 150 reservoirs upstream, which has allowed a reduction of its humid area in drought periods, affecting the Pharagmites australis as the main biomass plant and primary wetland productivity, reducing its carbon fixation.
On the other hand, in Thailand, the first aspect to highlight is the use of the land around Phang-nga Bay, province of Phuket, tin mining has been present there since 1600. Furthermore, other actions such as palm oil, rubber cultivation, and recently, urbanization. The particulate organic matter in the sediments of the bay was researched, comparing it with seagrasses and mangroves [118].
Similarly, due to its oil wealth, the Arabian Gulf has undergone transformations in its wetlands due to industry, population, and urbanization, achieving mass losses of up to 90% in the last century. Carbon sequestration was found to be higher in mangroves, seagrasses, and marshes, respectively [119].
Now, In Korea, Byun et al. [120], studied the Mud Flat 2 tidal plain, finding that it experiences an anthropogenic impact and pressure for development more than Mud Flat 1, affecting carbon sequestration. Marshes on its shores have been lost by 22% since 1987. Furthermore in the Korean peninsula, Sondak and Chung [121], pointed out that seagrasses have been lost in the last two or three decades due to urbanization, dam construction, and industrialization, reducing the potential for blue carbon sequestration.
In India, in the Gulf of Cambay or Khambhat in the Arabian Sea, there are three districts with approximately 10 million inhabitants. There is an important industrial center, deteriorating estuaries such as marshes, mangroves, and cliffs which also suffer coastal erosion since the last decades. Remote sensing analyses determined that aquaculture and urbanization affect marshes [122].
In West Bengal-India, five districts were chosen to measure water quality, especially inorganic carbon content in algae, which depends on the amount of nutrients since some wetlands receive moderate industrial wastewater. Inorganic carbon and nitrogen may be important for microalgae in their phytocarbonate content [123].
On the coasts of Kerala, mangroves have lost vegetation in the last 50 years due to shrimp farming and coastal erosion as expressed by Harishma et al. [124]. Despite this, results showed that biomass is high and with six varieties of mangroves, highlighting the Avicenia marina with the highest amount of biomass and Sonneratia alba with the least. It was concluded that they must be conserved due to the high volume of carbon they sequester.
The Chilika lagoon is the largest in Asia with brackish water. It was declared a Ramsar site in 1981. It receives a high load of nitrogen fertilizers in agricultural activities by several freshwater streams. Nutrient concentrations were evaluated showing both spatial and temporal variations regulating chlorophyll [125].
In Kerala, Kannur, among others, the wetlands belong 50% to the state and 50% to individuals. In these, cultivation of coconut trees, excessive exploitation of resources, shrimp farming, urbanization, and roads are developed as the main activities that degrade mangroves. Researchers monitored with remote sensors and geographic information systems to make an assessment of carbon stocks in the ecosystem [126].
The Karuvannur and Chalakkudy rivers discharge a large quantity of nutrient-rich waters to the Kodungallur-Azhikode estuary on the southwest coast of India. The product is from anthropogenic activities, mainly aquaculture, and agriculture because they release inorganic and organic waste that causes quality effects of water and therefore, in the fixation of carbon through phytoplankton [127].
In contrast, an important aspect that Dommain et al. [128] found about carbon sequestration in peat from Southeast Asia, in Kalimantan, Borneo to be exact, is that it decreased with the decrease in sea level. In the Holocene, there was the availability of new lands allowing the formation of mobs, disturbed by anthropic activities such as fires and drainage for agriculture; thus, releasing carbon to a depth of 30 cm.
The Berbak National Park according to Miettinen et al. [129] was subject to changes in its coverage by oil palm plantations despite its state protection. Illegal invasions have grown by cutting down the forest, increasing its vulnerability.
Something important that Bal and Banerjee [130] highlighted is that little is known about mangroves in India, especially their biomass and carbon sequestration, so it was decided to evaluate them in the Bitharkanika Wildlife Sanctuary Wetland and relate them to physicochemical factors to understand the relationship. Carbon per hectare of biomass and that of soil was quantified. They showed that the wetland is affected by aquaculture, agriculture, and urbanization.
In Bangladesh in the Ganges River Delta, agricultural land has progressively changed from use to wetland aquaculture due to salinization, industrialization, population, and so on. Shrimp aquaculture has destroyed 45% of mangroves, reducing their ecosystem services [131].
Now, on the island of Pulau Indah, Malaysia, a multitemporal analysis was carried out with remote sensors using Landsat images and it was identified that the main factor of vegetation loss from the mangroves was the growth of the port infrastructure [132,133].
Due to the very high rates of deforestation in the peatland forests in Borneo, the importance of knowing the impact and magnitude of the disturbance from the past is born, so the researchers used the paleoecological technique of fossil pollen and charcoal to determine the changes, confirming that the last 500 years has been the most critical period of human disturbance with the oil palm cultivation and the logging industry [134].
There is a special type of activity that has been affecting mangroves of Tanjung Piai National Park in the south of Johor, Peninsular Malaysia, and it is the river traffic of boats through the Strait of Malacca towards Singapore, causing waves that generate erosion on the coasts in addition to road construction [135].
In Indonesia, Tareq et al. [136] found that vegetation underwent changes in the Rawa Danau wetland in West Java, in the last 7428 years. It was documented based on forest fires and land uses due to human influences using an elemental analyzer to determine the content of organic carbon and nitrogen. The results allowed us to conclude that these effects are not only related to climate change but also to man.
In another Indonesian wetland, Kusumaningtyas et al. [137], identified that the Segara coastal lagoon is affected by sediment deposition of rivers in the west, achieving reductions in mangrove vegetation. Furthermore, in the center of the lagoon, there is less vegetation than in the east of it. In the lagoon, the carbon reserves were measured and compared with another wetland, Kalimantan, where great variations were evidenced due to the effects on the ecosystem, especially due to activities such as: sedimentation, aquaculture, and overexploitation of resources.
Mangroves and coastal wetlands of Mimika district, Papua province, Indonesia, have undergone modifications due to small indigenous settlements with little impact on them, unlike the mining industry, and palm plantations as the biggest threats [138].
The PT Setia Alam Jaya logging concession has been cutting down the peat forest in the upper basin of the Sebangau river, in Indonesia since before 1998. There, the flow of carbon was studied, especially in the form of greenhouse gases in areas with or without affected vegetation. Due to the water table, more gases were emitted in the dry season [139].
Now, in Sri Lanka, the tourism industry in recent years has specifically focused on four natural parks and due to the high influx of visitors it has led to a degradation of attractions and they should be developed with caution because tourism is already being considered a source of disturbance. Therefore, other forms of tourism must be diversified. A study was made through a survey to estimate the perception of tourists, where they showed their satisfaction with the tour, they evidenced the dirt in the river and other attributes. The study served as input for the necessary corrections to be taken [140].
Likewise, in Sri Lanka Perera and Amarasinghe [141] studied carbon sequestration in micro estuaries and tidal lagoons. The general objective was to assess carbon reserves in the soil in different wetlands. In addition, it was evidenced that the incident factor in the degradation of these, was the population growth that leads to a depletion of the ecosystem and its reserves.
Interestingly, research was carried out in four deltas of two continents on carbon in mangroves, their losses, and gains, in the Asian deltas: Ganges (Bangladesh) and Mekong (Vietnam). This identified that the incident factors in the vegetation loss were coastal erosion and deforestation, respectively. Remote sensing techniques were used to determine the changes in the study [35].
During the Vietnam War between 1964 and 1970, the Can Gio mangrove forest was sprayed with the orange herbicide causing a 57% loss due to defoliation. Currently, the Kien Vang mangroves are being affected by aquaculture, deforestation, and coastal erosion [142].
In this way, as seen in Figure 7, there are nineteen incident factors in Asia. The main factor is aquaculture because the Asian continent is the world’s largest producer of aquaculture products [143]. It generates economic growth but also many pollution problems due to discharges of nutrients from aquaculture production units to wetlands. On the other hand, despite the fact that China is one of the main economies, agriculture plays an important role in feeding the most populated continent of the world [144]. Therefore, the pressure exerted by the land and the negative effect on wetlands.
Urbanization and industry are factors related to economic growth and the phenomenon of modernization of cities and their industry that has led China to sustain a growth rate of 6.8% GDP even before the pandemic [145].
On the other hand, the fourteen types of wetlands most affected by these activities are observed in Figure 8, where marine waters and mangroves are those that have the greatest effects. This is mainly due to the lack of wastewater treatment from the activities described in Figure 6.

3.4. Research on the European Continent

In Table 4, a limited information base on the European continent is described with nine investigations, highlighting Spain with the largest number of researches.
On Schiermonnikoog island in the Netherlands, Elschot et al. [146] analyzed, in different plots of marshlands, the impact degree on carbon sequestration by cattle grazing, determining that in young plots sequestration is limited and in older ones, it increases because the compaction of the cattle trampling decreases oxygen concentration in the soil and therefore reduces carbon decomposition.
In Spain, the remote sensing technique was used with free software to show changes made in 11 wetlands, 7 from the coast and 4 continentals. It was determined that urban development and tourism are the main cause of vegetation loss. This conclusion was reached through digital Landsat image processing [147].
Wetlands in the Ebro River delta are being affected by the construction of dams and the adaptation of rice crops, bringing with it an alteration of the accumulation of allochthonous carbon transported in the sediments. Furthermore, there are alterations in the soil level, showing that where there is greater connectivity, there will be greater results of organic carbon accumulation [148].
On the other hand, Sánchez-Espinosa and Schröder [4], affirm that agriculture expansion has led to changes in land use in recent decades within and around the limits of water resources by modifying water level. The Fuente de Piedra saline lake located in the Malaga province, with an area of 1400 ha, a Ramsar site since 1983, does not escape this problem of the effects of olive groves, vineyards, fruit trees, and small urban settlements.
Similarly, Morris et al. [149] assure that the Doñana National Park is the best-protected wetland in Europe by UNESCO and Ramsar. In this, only activities such as forestry are allowed. However, on the surrounding wetlands in private properties, aquaculture and agriculture are the main anthropogenic activities developed. In Doñana, some anthropogenic impacts have reduced the water hydroperiod and when they are extensive, it favors carbon sequestration.
Now, in the Czech Republic from 400 to 600 years ago, some of the wetlands have been used for aquaculture (30%) to this day and others drained for sowing pastures [54].
Greece has 10 Ramsar sites. The wetland area including its catchment area covers 1,858,666 ha and, despite enormous conservation efforts, there have been profit and loss balances as a result of anthropogenic activities from 1986 to 1987 until 2016 to 2017 (30 years). Among the most relevant is the conversion of forested and natural lands to agriculture (22,264 ha), in addition to urban expansion with (14,044 ha) [150].
In Nova Scotia Gallant et al. [3] argue that in the Bay of Fundi, a high percentage of marshes (close to 80%) have been lost due to conversion to agriculture, reducing the wetland social and environmental benefit in carbon sequestration. The Integrated Dynamic Climate and Economy Model (DICE) was used for its economic valuation, estimating an approximate value in the total range from $5105/ha/year to $39,795/ha/year.
In the United Kingdom, as agricultural and livestock production has been historically exploited in the Tadham Moor and Somerset Levels, moors and wetlands have been affected due to their drainage. It became necessary to develop a carbon balance and controls to design conservation management policies. For this, the Eddy Correlation Technique based on flows in the ecosystem was used [151].
In Spain, there are two wetlands dependent on groundwater, the Tablas de Daimiel and the Lagos de Ruidera, some 75 km apart. They have different hydro-geomorphological conditions, both are Ramsar sites and also nature reserves; the first has a humid area of 250 km2 and only has 20% of its initial area, the Gigüela river provides brackish water and the Guadiana fresher water apart from other sources that feed it; it is affected by potentially toxic trace elements (PTEs) dragged by the river and sediments as stated by Jiménez et al. [152]. In another plane, its water table is 3 m deep because its aquifer has been affected since 1970 with overexploitation, extracting 20,000 million m3 in the last 40 years, which has caused a drop in the water level of 20 m. Likewise, the second, the Ruidera Lakes, are a series of wetlands interconnected with each other by different water sources, which have had drainage problems since the 1980s due to the pumping of wells for irrigation and have been declared overexploited [153].
Furthermore, in Belgium, the Scheldt estuarine wetland downstream of the city of Ghent is affected by anthropic activities, such as the case of intertidal marshes with heavy metals such as Cd, Cu, Pb, and also Zn in their sediments up to a pro- depth of 1 m, with spatial and temporal variations in its sediments in the short term [154].
In a combined way, Figure 9 and Figure 10 can be explained based on Coles [155], who states that human alteration on wetlands encompasses a wide history of degradation since prehistoric settlements. A first aspect to highlight is that they implemented the cultivation by draining the wetlands, especially when food became scarce in the middle of the 20th century due to the two world wars. Subsequently, since 1950, the drainage process for housing construction, industrialization, and of course, agriculture continued. That explains why agriculture tops the list.
On the other hand, affected wetlands in Europe are varied as can be seen in Figure 9, with seven different types of natural wetlands affected by the six incident factors found in the review. The majority coincide with Asia, with agriculture being the most relevant. Nonetheless, all have their relative importance. Due to lack of information, it is not possible to generalize, but the information gives support in trying to understand that several incident factors are similar in most of the cases analyzed.

3.5. Research in the Oceania/Australia Continent

Oceania and Australia are continents with very important biodiversity for the whole world, the studies on the effects were 14 as can be seen in Table 5, and the majority are focused on Australia with 12 investigations.
Overall, 86% of research studies were developed in Australia, so it is relevant to focus the discussion based on this country. Agriculture as an incident and relevant factor affecting wetlands, and is attributable to the fact of water regulation for agricultural purposes, industry, and urbanization. These externalities are expected to influence climate change to be a preponderant factor in land-use change [156].
In Micronesia, carbon reserves were estimated because they have been little studied by scientists, being an ecosystem service of high value. Two wetlands were studied on two different islands. It was found that the mangroves lost vegetation due to climate change, deriving other effects such as ocean acidification, changes in marine currents, among others that could decrease their productivity and increase mangrove mortality [157].
On Kosrae Island, there are wooded wetlands that are being replaced with agroforestry systems, especially by Colocasia esculenta for forestry. Effects of this crop on the carbon cycle within the forest peat were researched [158].
In Australia, Wong et al. [159] found that estuary drainage in the Richmond and Clarence River basins, a product of agricultural activities since 1900, has caused the growth of non-flood-tolerant vegetation in dry or drained areas, and when these occur, organic matter decomposes causing oxygen consumption by microorganisms and providing anoxic conditions within the wetland.
On the other hand, eutrophication that occurs in the Queensland urbanized wetlands, due to the load of anthropogenic pressures that add organic matter and nutrients, generated a water quality loss due to decrease in dissolved oxygen reaching a saturation <5% exposing the fish to that level daily (Dubuc et al.) [160] which under these conditions are susceptible to dying due to lack of dissolved oxygen in the water.
Wetland vegetation loss in Queensland, since the last century, can be attributed to agriculture especially 56% with stagnant pastures, sugar cane cultivation with 8%, and 4% for other uses. These changes of uses have significantly altered the emission process of greenhouse gases such as CO2, CH4, N2O2 which varied in emission according to land use [161].
Maleleuca spp. was researched in several wetlands in Australia where there are large areas of forests because it is considered an invasive species and offers antimicrobial properties thanks to the oil extracted from its leaves. More than 1 million ha are found on private land. They suffer high risks of deforestation, preventing their high capacity to retain sediment during floods and sequester carbon [162].
Based on what was researched by Carnell et al. [163], in the State of Victoria a study of carbon sequestration and gas emissions was conducted in different types of wetlands. It was reported that since 1834 (European colonization), 27% of wetlands (147,053 ha) have been lost out of a total of 530,400 ha, which has generated a gas emission between 22.5 and 74.2 million MgCO2. More than 40% of the carbon reserves of these ecosystems are a product of the expansion of the agricultural frontier through the drainage of wetlands.
Exchange of greenhouse gases in the Fogg dam wetland and control exerted by climatological and environmental conditions over these exchanges. It was identified that an influencing factor is floods and also natural fires caused in 1 to 4 years on average, burning extensive areas of alluvial plains. These changes in land use have altered the fragile balance between gas emission and net absorption [164].
Carbon sequestration and area were studied in some undisturbed and disturbed wetlands, mostly by industry development activities coupled with drainage works on Kooragang Island, Australia. It was concluded that rehabilitation has positive benefits and depending on how these wetlands adapt to disturbances, so will their capacity to sequester carbon [165].
Rogers et al. [166], report that the Hunter Natural Park Wetland will possibly lose 100% with a large rise in sea level. Otherwise, if the levels were kept low, it could expand by 35%. This theory resulted from modeling of the management of gates given that this area, despite being a Ramsar site, which with the opening and closing of these, would increase or decrease carbon sequestration, respectively.
In the 1950s and 1960s in Queensland and New South Wales, some hydraulic works were built that affected their rivers, causing losses in wetlands. In another hand, around 4200 structures were also identified preventing the tidal flow towards them [167].
Agriculture, industry and urbanization have degraded melaleuca forests in the Westernport Bay, a site chosen to assess greenhouse gas emissions in sediments, mangrove soils, and marshes. Results showed less carbon content than more tropical wetlands [168].
Assessing the incidence of nutrients in mangroves is important, so in the Moreton Bay-Queensland forests, nutrient-rich pollutants from agricultural runoff caused eutrophication. It was determined that aerial biomass increased more than soil seedlings [169].
Construction of dikes and roads since the European colonization made changes in the hydrology of the Duck Creek North freshwater wetland, because normal flow of water was modified, causing periods of drought and floods that in turn oxygenate or not the soil, varying microbial activity, altering the carbon cycle and emitting greenhouse gases [170].
In the same case as Asia and Europe, agriculture is the incident factor with the highest proportion of the ten identified in this continent. This revelation allows us to clearly observe that the need to produce food is affecting wetlands in these continents, despite the unfavorable climatic conditions in Australia, the Oceania region where the largest number of investigations were found as can be seen in Figure 11 and Figure 12.
Regarding wetland type, seven were identified, being mangroves the most affected, followed by rivers and lagoons. It is very important to notice that agricultural activity in Australia such as the cultivation of Saccharum officinarum and Colocasia esculenta are highly demanding of water and fertilization, and all nutrient discharges affect wetlands.
In addition, Australia produces wheat, grains (barley, oats, millet, corn, and triticale), rice, oilseeds (rapeseed, sunflower, soybeans, and peanuts), legumes (lupins and chickpeas), cotton, fruits, grapes, tobacco, and vegetables. The main livestock consists of sheep (lamb and wool), beef, pork, poultry, and dairy products. More than 90% of wool and cotton are exported, almost 80% of wheat, more than 50% of barley and rice, more than 40% of meat and grain legumes, more than 30% of dairy products, and almost 20% of fruit production [144].

3.6. Incident Factors and Effective Losses Globally

Urban and agricultural development of some continents such as Europe, North America, Asia, have deteriorated many wetlands, unlike South America, where populations are widely separated from continental wetlands; but failing that, they deteriorate the coastal areas by urban settlements [171].
On the other hand, in terms of carbon capture, it is diminished every time wetland vegetation is lost, or wastewater is added, causing eutrophication. Consequently, the carbon cycle is broken. First, more greenhouse gases are emitted due to vegetation loss when the soil is exposed, and second, vegetation is affected due to changes in nutrients, especially nitrogen.
Characteristic aspects in all continents are in the loss and sequestering indicators:
  • Vegetation loss;
  • Eutrophication by wastewater.
Differing aspects are in some incident factors:
  • Oil spills;
  • Salinity;
  • Fires;
  • Sea level.
Sixteen factors identified in the different regions are observed in Figure 13, being agriculture farming the most important, followed by urbanization and aquaculture. Two aspects have to do with food and one with industrial development.
Furthermore, fourteen different types of wetlands have been established on all continents with effective losses as shown in Figure 14. Mangroves, lagoons, marine waters, and several wetlands stand out.
This information is useful because global efforts should be focused on this type of system for future planning, mainly because demand for food will grow together with the population by 2050 [172]. This indicates that wetlands are at risk if measures are not taken to work on their protection and on sustainable agricultural production practices.
By grouping wetlands according to the Ramsar system, they can be classified into marine, coastal, and continental. In Figure 15, results confirm what was stated by [14], “continental wetlands have been more affected than marine and coastal ones”. He also debated the theory that wetlands have been lost by 50%, estimating that the value is between 54% and 57% since losses are attributed to economic growth, population, extensive and intensive agriculture, changes in use, and urbanization. The results of this research study identified the most frequent incident factors by continents, establishing a broad panorama of direct and indirect factors that affect them.
In another context, global ineffective public development policies have been having an impact on wetlands, because they uncontrollably allow or promote anthropogenic activities, being urban or economic. Territorial planning goes in a diametrically opposite direction to the ecological function of wetlands because the economic point of view prevails in the first instance. Consequently, it is recommended that the local population participate in decision-making for the conservation of their territories [173].
Proposal to implement the care and environmental management of wetlands in a significant way.
The results, however, will be useful for the entities in charge of monitoring wetlands, especially those that are most susceptible to changes, on which the most incident factors are, in such a way that it serves as an early warning to prevent damage. Unfortunately, those interested in the study of wetlands are very few in Mexico and Colombia. It is an opportunity to make significant contributions. More studies are required. It is important that young people join the research of these environments, from biological, economic and engineering aspects. In Mexico, research is supported in the Laboratory of Wetlands and environmental sustainability of the National Technology of Mexico campus Misantla, as well as in the College of Veracruz, the Institute of Ecology AC, and the Research Institute on Ecosystems and Sustainability (IIES) of the National Autonomous University of Mexico. In the Colombia University of Sucre, its research group GIMAGUAS supports this type of research.
This research work is the starting point that can serve as a guide for wetland studies to consider: biogeochemical factors, geographic location in severe loss, ‘vegetation loss’, and ‘blue carbon loss’.
A comprehensive view of the current situation regarding factors that affect the loss of wetlands at a global level, on the other hand, shows that the impacts are influenced by human activities related to agricultural, industrial and urban development. Therefore, decision-makers are the ones to take measures to manage quality towards healthier wetlands. This study fulfills its objective, and we hope that it will be useful in the future while we continue working on this topic with the same interest.
The sustainable development of wetlands must be linked to the Sustainable Development Goals of the United Nations. Every country with its commitments acquired for its fulfillment must consider actions to maintain them in the future, one of them is the one established by the Ramsar Convention that focuses around three pillars: the wise use of all wetlands, the designation and conservation of Ramsar sites, and the promotion of transboundary management. The Ramsar Strategic Plan for 2016–2024 has four closely related objectives: address wetland loss and degradation, effectively conserve and manage the Ramsar Site network, wisely use wetlands, and improve enforcement. SCR [174]. Furthermore, in the study carried out by the Secretary of the Ramsar Commission in 2018 [174], quantitative data on wetland losses in different continents were reported, however, incident factors were not considered as they were in this research.
This research is pertinent because the level of affectation that the different types of wetlands have suffered at a global level is described in a timely manner and not independently without any type of compilation, considering that their functions are of great importance to counteract the effects of greenhouse gases that produce global warming. The study is original as well because the results of previous investigations were found and served as the basis for the construction of a global map where the countries that do the most research on issues related to wetlands and the factors that affect them are identified, and the little or no research in some regions is also observed.
The contribution of this research is built on the description of factors affecting updated natural wetlands due to population dynamics related to urbanization, and agricultural activities due to the connection they have between the production of housing and food for the population. Nonetheless, despite the fact that the sample studied does not have information from many other countries, it is important to notice that it is very possible that these factors are common factors in other parts of the world. This is mainly because they are factors related to the direct pressures exerted by the human being, also bearing in mind that towards 2050, projections of food and population requirements are alarming and pressure on wetlands may proportionally increase as well [143,175,176,177].
These damages degrade wetlands that are losing their sequestration functionality and consequently, climate regulation, confirming that global warming will continue to gradually increase in proportion to the damage caused. IPCC [178], unless an international public policy is applied that minimizes consumption of water-soil resources, we will not exceed the capacity for nature self-regulation.

Future Lines of Research

Due to the effects that wetlands suffer from distinct factors, it is advisable to monitor them using remote sensing techniques to identify and quantify the vegetation type, that serves to make comparisons among wetlands of different latitudes using the spectral signatures useful in the identification of coverage and study of the phenology of the wetland vegetation.
It is important to analyze the health status of wetlands using remote sensors through indices that work with the reflectance of the cover and show the degree of health of the vegetation, such as the Normalized Difference Vegetation Index (NDVI), the Normalized Difference Water Index (NDWI), and the Enhanced Vegetation Index (EVI), which will help identify health problems that possibly affect wetlands such as nitrification of their waters. With this information, it is possible to make models of artificial intelligence and large volumes of satellite images from specialized sensors in water and wetlands. A predictive analysis of the future behavior of ecosystems is recommended, considering variables such as population, temperature rise, land-use change, vegetation loss and blue carbon.
Increasing carbon quantification studies to increase global inventory statistics on different continents is suggested.
Rethinking land use planning policies is also advisable because economic interests take precedence over the land ecological component, greatly affecting ecosystems. Thus, sustainability evaluations are necessary with existing methodologies and, failing that, generate new methodologies for their evaluation.
Some indicators shown in the different tables were not analyzed in this document because they were not included within the objective of the research. However, they can be useful for new studies on loss of areas and/or degree of affectation of a quantitative but not qualitative way as it was in this study.

4. Conclusions

After carrying out a macro-analysis of the incident factors and the types of wetlands affected at a global level, of 134 articles, the objective set in the investigation was fulfilled, ‘to identify the incident factors in the effective loss of area and carbon sequestration in marine, coastal, and continental wetlands that have had an impact on climate change in the last 14 years at a global level’, and it is possible to affirm that this work ratifies the importance of conserving and preserving wetlands due to the incident factors found.
It is confirmed that all over the world, anthropogenic activities that most affected natural wetlands were agriculture (25%), urbanization (16.8%), aquaculture (10.7%), and industry (7.6%). These are direct impacts or pressures exerted by human beings, implying that, increasingly, population growth will be an important factor as a determining agent of damage in the future if this trend is followed.
On the other hand, it was determined that the types of wetlands most affected are: mangroves (25.7%), lagoons (19.11%) and marine waters (11.7%). Nevertheless, after making a summation between marine-coastal and continental wetlands, we find that these systems are affected by 35.7% and 64.3%, respectively. This confirms that more effective environmental management and control measures are urgently needed in order to conserve and preserve them, given the multiple ecological functions that such ecosystems provide.
Finally, this research work is unique and relevant because it exposes the different incident factors at a global level together, evidence was found of little research in other continents on a topic of global interest, the percentages found by continent stand out, they show that there are some with more studies than others, i.e., America (41.04%), Asia (34.32%), Oceania/Australia (10.44%), Africa (7.46%), and Europe (6.74%). Thus, it should be said that the first two have the largest number of coastal wetlands, especially mangroves. Nonetheless, research should be increased in all of them because economic and population development as a result of globalization have been affecting the global climate with GHGs. Therefore, environmental management of conservation and handling of these ecosystems is recommended to reduce their ecological issues by 2050.

Author Contributions

Conceptualization, G.A.B.-D., E.A.B.-T. and L.C.S.H.; methodology, G.F.-L., G.F.-L. and M.C.L.M.; software, E.A.B.-T.; validation, G.F.-L., J.L.M.-M. and M.C.L.M.; formal analysis, G.A.B.-D., E.A.B.-T. and L.C.S.H.; investigation, G.A.B.-D., E.A.B.-T. and L.C.S.H.; resources, J.L.M.-M.; data curation, M.C.L.M.; writing—original draft preparation, G.A.B.-D., L.C.S.H. and G.F.-L.; writing—review and editing, J.L.M.-M., M.C.L.M. and E.A.B.-T.; visualization, G.F.-L., M.C.L.M. and J.L.M.-M.; supervision, G.F.-L., M.C.L.M. and J.L.M.-M.; project administration, G.A.B.-D., L.C.S.H. and E.A.B.-T., funding acquisition, G.A.B.-D., E.A.B.-T. and L.C.S.H. All authors have read and agreed to the published version of the manuscript.

Funding

The study received external funding from the National Council of Science and Technology (CONACYT) with the first author (G.A.B.D.) doctoral fellowship and the correspondence author (E.A.B.-T.) postdoctoral academic stay.

Data Availability Statement

The data supporting the reported results can be requested with the corresponding authors.

Acknowledgments

Thanks to the National Council of Science and Technology (CONACYT) for the scholarship awarded to him to pursue his Doctorate in Engineering Sciences offered by the National Technological Institute of Mexico, Campus Misantla registered in the Quality Postgraduate Register (PNPC), the author also expresses his gratitude to the University of Sucre for all the support provided and received for conducting this research study. Thanks to Luis Carlos Sandoval Herazo, director of the first author’s doctoral thesis and advisor to the corresponding author’s postdoctoral stay project.

Conflicts of Interest

The authors declare no conflict of interest.

References

  1. Costanza, R.; de Groot, R.; Sutton, P.; van der Ploeg, S.; Anderson, S.J.; Kubiszewski, I.; Farber, S.; Turner, R.K. Changes in the global value of ecosystem services. Glob. Environ. Change 2014, 26, 152–158. [Google Scholar] [CrossRef]
  2. Owers, C.J.; Rogers, K.; Woodroffe, C.D. Spatial variation of above-ground carbon storage in temperate coastal wetlands. Estuar. Coast. Shelf Sci. 2018, 210, 55–67. [Google Scholar] [CrossRef]
  3. Gallant, K.; Withey, P.; Risk, D.; van Kooten, G.C.; Spafford, L. Measurement and economic valuation of carbon sequestration in Nova Scotian wetlands. Ecol. Econ. 2020, 171, 106619. [Google Scholar] [CrossRef]
  4. Sánchez-Espinosa, A.; Schröder, C. Land use and land cover mapping in wetlands one step closer to the ground: Sentinel-2 versus landsat 8. J. Environ. Manag. 2019, 247, 484–498. [Google Scholar] [CrossRef] [PubMed]
  5. Sica, Y.V.; Quintana, R.D.; Radeloff, V.C.; Gavier-Pizarro, G.I. Wetland loss due to land use change in the Lower Paraná River Delta, Argentina. Sci. Total Environ. 2016, 568, 967–978. [Google Scholar] [CrossRef]
  6. Were, D.; Kansiime, F.; Fetahi, T.; Cooper, A.; Jjuuko, C. Carbon Sequestration by Wetlands: A Critical Review of Enhancement Measures for Climate Change Mitigation. Earth Syst. Environ. 2019, 3, 327–340. [Google Scholar] [CrossRef]
  7. Mitsch, W.J.; Mander, Ü. Wetlands and carbon revisited. Ecol. Eng. 2018, 114, 1–6. [Google Scholar] [CrossRef]
  8. Xu, S.; Liu, X.; Li, X.; Tian, C. Soil organic carbon changes following wetland restoration: A global meta-analysis. Geoderma 2019, 353, 89–96. [Google Scholar] [CrossRef]
  9. Huang, C.; Yuan, C.; Yang, W.; Yang, L. Temporal variations of greenhouse gas emissions and carbon sequestration and stock from a tidal constructed mangrove wetland. Mar. Pollut. Bull. 2019, 149, 110568. [Google Scholar] [CrossRef] [PubMed]
  10. Boone, J.K.; Bhomia, R.K. Ecosystem carbon stocks of mangroves across broad environmental gradients in West-Central Africa: Global and regional comparisons. PLoS ONE 2017, 12, e0187749. [Google Scholar] [CrossRef] [Green Version]
  11. Ward, R.D. Carbon sequestration and storage in Norwegian Arctic coastal wetlands: Impacts of climate change. Sci. Total Environ. 2020, 748, 141343. [Google Scholar] [CrossRef] [PubMed]
  12. Alongi, D.M. Carbon sequestration in mangrove forests. Carbon Manag. 2012, 3, 313–322. [Google Scholar] [CrossRef]
  13. Sun, X.; Li, Y.; Zhu, X.; Cao, K.; Feng, L. Integrative assessment and management implications on ecosystem services loss of coastal wetlands due to reclamation. J. Clean. Prod. 2017, 163, S101–S112. [Google Scholar] [CrossRef]
  14. Davidson, N.C. How much wetland has the world lost? Long-term and recent trends in global wetland area. Mar. Freshw. Res. 2014, 65, 934–941. [Google Scholar] [CrossRef]
  15. Zhao, C.; Liu, S.; Jiang, Z.; Wu, Y.; Cui, L.; Huang, X.; Macreadie, P.I. Nitrogen purification potential limited by nitrite reduction process in coastal eutrophic wetlands. Sci. Total Environ. 2019, 694, 133702. [Google Scholar] [CrossRef] [PubMed]
  16. Marín-Muñiz, J.L.; Hernández, M.E.; Moreno-Casasola, P. Comparing soil carbon sequestration in coastal freshwater wetlands with various geomorphic features and plant communities in Veracruz, Mexico. Plant Soil 2014, 378, 189–203. [Google Scholar] [CrossRef]
  17. Liu, H.; Yi, Y.; Yue, Y.; Cui, B. Reducing the likelihood of carbon loss from wetlands by improving the spatial connections between high carbon patches. J. Clean. Prod. 2020, 267, 121819. [Google Scholar] [CrossRef]
  18. Donato, D.C.; Kauffman, J.B.; Murdiyarso, D.; Kurnianto, S.; Stidham, M.; Kanninen, M. Mangroves among the most carbon-rich forests in the tropics. Nat. Geosci. 2011, 4, 293–297. [Google Scholar] [CrossRef]
  19. Adame, M.F.; Kauffman, J.B.; Medina, I.; Gamboa, J.N.; Torres, O.; Caamal, J.P.; Reza, M.; Herrera-Silveira, J.A. Carbon Stocks of Tropical Coastal Wetlands within the Karstic Landscape of the Mexican Caribbean. PLoS ONE 2013, 8, e56569. [Google Scholar] [CrossRef] [PubMed] [Green Version]
  20. Köchy, M.; Hiederer, R.; Freibauer, A. Global distribution of soil organic carbon—Part 1: Masses and frequency distributions of SOC stocks for the tropics, permafrost regions, wetlands, and the world. Soil 2015, 1, 351–365. [Google Scholar] [CrossRef] [Green Version]
  21. Villa, J.A.; Bernal, B. Carbon sequestration in wetlands, from science to practice: An overview of the biogeochemical process, measurement methods, and policy framework. Ecol. Eng. 2018, 114, 115–128. [Google Scholar] [CrossRef]
  22. Cui, X.; Liang, J.; Lu, W.; Chen, H.; Liu, F.; Lin, G.; Xu, F.; Luo, Y.; Lin, G. Stronger ecosystem carbon sequestration potential of mangrove wetlands with respect to terrestrial forests in subtropical China. Agric. For. Meteorol. 2018, 249, 71–80. [Google Scholar] [CrossRef]
  23. Lavery, P.S.; Mateo, M.-Á.; Serrano, O.; Rozaimi, M. Variability in the Carbon Storage of Seagrass Habitats and Its Implications for Global Estimates of Blue Carbon Ecosystem Service. PLoS ONE 2013, 8, e73748. [Google Scholar] [CrossRef] [Green Version]
  24. Sanderman, J.; Hengl, T.; Fiske, G.; Solvik, K.; Adame, M.F.; Benson, L.; Bukoski, J.J.; Carnell, P.; Cifuentes-Jara, M.; Donato, D.; et al. A global map of mangrove forest soil carbon at 30 m spatial resolution. Environ. Res. Lett. 2018, 13, 55002. [Google Scholar] [CrossRef]
  25. Bernal, B.; Mitsch, W.J. Carbon sequestration in freshwater wetlands in Costa Rica and Botswana. Biogeochemistry 2013, 115, 77–93. [Google Scholar] [CrossRef]
  26. Zhang, T.; Cao, G.; Cao, S.; Zhang, X.; Zhang, J.; Han, G. Dynamic assessment of the value of vegetation carbon fixation and oxygen release services in Qinghai Lake basin. Acta Ecol. Sin. 2017, 37, 79–84. [Google Scholar] [CrossRef]
  27. Von Uexkull, N.; Buhaug, H. Security implications of climate change: A decade of scientific progress. J. Peace Res. 2021, 58, 3–17. [Google Scholar] [CrossRef]
  28. Lang’at, J.K.S.; Kairo, J.G.; Mencuccini, M.; Bouillon, S.; Skov, M.W.; Waldron, S.; Huxham, M. Rapid losses of surface elevation following tree girdling and cutting in tropical mangroves. PLoS ONE 2014, 9, e107868. [Google Scholar] [CrossRef] [Green Version]
  29. Githaiga, M.N.; Kairo, J.G.; Gilpin, L.; Huxham, M. Carbon storage in the seagrass meadows of Gazi Bay, Kenya. PLoS ONE 2017, 12, e0177001. [Google Scholar] [CrossRef]
  30. Juma, G.A.; Magana, A.M.; Michael, G.N.; Kairo, J.G. Variation in Seagrass Carbon Stocks Between Tropical Estuarine and Marine Mangrove-Fringed Creeks. Front. Mar. Sci. 2020, 7, 696. [Google Scholar] [CrossRef]
  31. Elbasiouny, H.; Abowaly, M.; Gad, A.A.; Abu Alkheir, A.; Elbehiry, F. Restoration and sequestration of carbon and nitrogen in the degraded northern coastal area in Nile Delta, Egypt for climate change mitigation. J. Coast Conserv. 2017, 21, 105–114. [Google Scholar] [CrossRef]
  32. Eid, E.M.; Shaltout, K.H. Evaluation of carbon sequestration potentiality of Lake Burullus, Egypt to mitigate climate change Egypt. J. Aquat. Res. 2013, 39, 31–38. [Google Scholar] [CrossRef] [Green Version]
  33. Ekumah, B.; Armah, F.A.; Afrifa, E.K.A.; Aheto, D.W.; Odoi, J.O.; Afitiri, A.R. Geospatial assessment of ecosystem health of coastal urban wetlands in Ghana. Ocean Coast. Manag. 2020, 193, 105226. [Google Scholar] [CrossRef]
  34. Ligate, E.J.; Chen, C.; Wu, C. Evaluation of tropical coastal land cover and land use changes and their impacts on ecosystem service values. Ecosyst. Health Sustain. 2018, 4, 188–204. [Google Scholar] [CrossRef] [Green Version]
  35. Lagomasino, D.; Fatoyinbo, T.; Lee, S.; Feliciano, E.; Trettin, C.; Shapiro, A.; Mangora, M.M. Measuring mangrove carbon loss and gain in deltas. Environ. Res. Lett. 2019, 14, 25002. [Google Scholar] [CrossRef]
  36. Saunders, M.J.; Kansiime, F.; Jones, M.B. Agricultural encroachment: Implications for carbon sequestration in tropical African wetlands. Glob. Chang. Biol. Bioenergy 2012, 18, 1312–1321. [Google Scholar] [CrossRef]
  37. Were, D.; Kansiime, F.; Fetahi, T.; Hein, T. A natural tropical freshwater wetland is a better climate change mitigation option through soil organic carbon storage compared to a rice paddy wetland. SN Appl. Sci. 2020, 2, 1–13. [Google Scholar] [CrossRef]
  38. Ellery, W.N.; Grenfell, S.E.; Grenfell, M.C.; Humphries, M.S.; Barnes, K.; Dahlberg, A.; Kindness, A. Peat formation in the context of the development of the Mkuze floodplain on the coastal plain of Maputaland, South Africa. Geomorphology 2012, 141–142, 11–20. [Google Scholar] [CrossRef]
  39. Torres, J.E. Africa’s Economy: 50 Years of Failed Policies]. Economia 2008. Available online: https://go.gale.com/ps/i.do?id=GALE%7CA351436991&sid=googleScholar&v=2.1&it=r&linkaccess=abs&issn=17947634&p=IFME&sw=w&userGroupName=anon~b76f7591 (accessed on 12 December 2021).
  40. Quimbayo Ruiz, G.A. Territory, sustainability, and beyond: Latin American urbanization through a political ecology. Environ. Plan E Nat. Space 2020, 3, 786–809. [Google Scholar] [CrossRef]
  41. Delgado, R.; Eguino, H.; Lopes, A. (Eds.) Fiscal Policy and Climate Change: Recent Experiences of the Finance Ministries of Latin America and the Caribbean; Inter-American Development Bank (IDB): Washington, DC, USA, 2021. [Google Scholar] [CrossRef]
  42. Ardón, M.; Helton, A.M.; Bernhardt, E.S. Drought and saltwater incursion synergistically reduce dissolved organic carbon export from coastal freshwater wetlands. Biogeochemistry 2016, 127, 411–426. [Google Scholar] [CrossRef]
  43. Kassakian, J.; Jones, A.; Martinich, J.; Hudgens, D. Managing for No Net Loss of Ecological Services: An Approach for Quantifying Loss of Coastal Wetlands due to Sea Level Rise. Environ. Manag. 2017, 59, 736–751. [Google Scholar] [CrossRef] [PubMed]
  44. St. Laurent, K.A.; Hribar, D.J.; Carlson, A.J.; Crawford, C.M.; Siok, D. Assessing coastal carbon variability in two Delaware tidal marshes. J. Coast. Conserv. 2020, 24, 65. [Google Scholar] [CrossRef]
  45. Greiner, J.T.; McGlathery, K.J.; Gunnell, J.; McKee, B.A. Seagrass Restoration Enhances “Blue Carbon” Sequestration in Coastal Waters. PLoS ONE 2013, 8, e72469. [Google Scholar] [CrossRef] [PubMed] [Green Version]
  46. Riegel, J.B.; Bernhardt, E.; Swenson, J. Estimating Above-Ground Carbon Biomass in a Newly Restored Coastal Plain Wetland Using Remote Sensing. PLoS ONE 2013, 8, e68251. [Google Scholar] [CrossRef] [PubMed]
  47. Moseman-Valtierra, S.; Gonzalez, R.; Kroeger, K.D.; Tang, J.; Chao, W.C.; Crusius, J.; Bratton, J.; Green, A.; Shelton, J. Short-term nitrogen additions can shift a coastal wetland from a sink to a source of N2O. Atmos. Environ. 2011, 45, 4390–4397. [Google Scholar] [CrossRef]
  48. Stralberg, D.; Brennan, M.; Callaway, J.C.; Wood, J.K.; Schile, L.M.; Jongsomjit, D.; Kelly, M.; Parker, V.T.; Crooks, S. Evaluating Tidal Marsh Sustainability in the Face of Sea-Level Rise: A Hybrid Modeling Approach Applied to San Francisco Bay. PLoS ONE 2011, 6, e27388. [Google Scholar] [CrossRef] [PubMed] [Green Version]
  49. Coverdale, T.C.; Brisson, C.P.; Young, E.W.; Yin, S.F.; Donnelly, J.P.; Bertness, M.D. Indirect human impacts reverse centuries of carbon sequestration and salt marsh accretion. PLoS ONE 2014, 9, e93296. [Google Scholar] [CrossRef] [PubMed]
  50. Craft, C.B. Tidal freshwater forest accretion does not keep pace with sea level rise. Glob. Chang. Biol. 2012, 18, 3615–3623. [Google Scholar] [CrossRef]
  51. Siciliano, D.; Wasson, K.; Potts, D.C.; Olsen, R.C. Evaluating hyperspectral imaging of wetland vegetation as a tool for detecting estuarine nutrient enrichment. Remote Sens. Environ. 2008, 112, 4020–4033. [Google Scholar] [CrossRef] [Green Version]
  52. Hester, M.W.; Willis, J.M.; Baker, M.C. Oil spills in coastal wetlands. In Encyclopedia of the Anthropocene; Elsevier Inc.: Amsterdam, The Netherlands, 2017; Volume 5, pp. 67–76. [Google Scholar] [CrossRef]
  53. Yavitt, J.B.; Burtis, J.C.; Smemo, K.A.; Welsch, M. Plot-scale spatial variability of methane, respiration, and net nitrogen mineralization in muck-soil wetlands across a land use gradient. Geoderma 2018, 315, 11–19. [Google Scholar] [CrossRef]
  54. Craft, C.; Vymazal, J.; Kröpfelová, L. Carbon sequestration and nutrient accumulation in floodplain and depressional wetlands. Ecol. Eng. 2018, 114, 137–145. [Google Scholar] [CrossRef]
  55. Lane, R.R.; Mack, S.K.; Day, J.W.; Kempka, R.; Brady, L.J. Carbon Sequestration at a Forested Wetland Receiving Treated Municipal Effluent. Wetlands 2017, 37, 861–873. [Google Scholar] [CrossRef]
  56. Suir, G.M.; Sasser, C.E.; DeLaune, R.D.; Murray, E.O. Comparing carbon accumulation in restored and natural wetland soils of coastal Louisiana. Int. J. Sediment Res. 2019, 34, 600–607. [Google Scholar] [CrossRef]
  57. Haywood, B.J.; Hayes, M.P.; White, J.R.; Cook, R.L. Potential fate of wetland soil carbon in a deltaic coastal wetland subjected to high relative sea level rise. Sci. Total Environ. 2020, 711, 135185. [Google Scholar] [CrossRef] [PubMed]
  58. Fennessy, M.S.; Wardrop, D.H.; Moon, J.B.; Wilson, S.; Craft, C. Soil carbon sequestration in freshwater wetlands varies across a gradient of ecological condition and by ecoregion. Ecol. Eng. 2018, 114, 129–136. [Google Scholar] [CrossRef]
  59. Hemes, K.S.; Chamberlain, S.D.; Eichelmann, E.; Knox, S.H.; Baldocchi, D.D. A Biogeochemical Compromise: The High Methane Cost of Sequestering Carbon in Restored Wetlands. Geophys. Res. Lett. 2018, 45, 6081–6091. [Google Scholar] [CrossRef]
  60. Newman, S.; Osborne, T.Z.; Hagerthey, S.E.; Saunders, C.; Rutchey, K.; Schall, T.; Reddy, K.R. Drivers of landscape evolution: Multiple regimes and their influence on carbon sequestration in a sub-tropical peatland. Ecol. Monogr. 2017, 87, 578–599. [Google Scholar] [CrossRef]
  61. Mitsch, W.J.; Hernandez, M.E. Landscape and climate change threats to wetlands of North and Central America. Aquat. Sci. 2013, 75, 133–149. [Google Scholar] [CrossRef]
  62. Verhoeven, J.T.A.; Laanbroek, H.J.; Rains, M.C.; Whigham, D.F. Effects of increased summer flooding on nitrogen dynamics in impounded mangroves. J. Environ. Manag. 2014, 139, 217–226. [Google Scholar] [CrossRef]
  63. Dontis, E.E.; Radabaugh, K.R.; Chappel, A.R.; Russo, C.E.; Moyer, R.P. Carbon Storage Increases with Site Age as Created Salt Marshes Transition to Mangrove Forests in Tampa Bay, Florida (USA). Estuaries Coast 2020, 43, 1470–1488. [Google Scholar] [CrossRef]
  64. Marchio, D.A.; Savarese, M.; Bovard, B.; Mitsch, W.J. Carbon sequestration and sedimentation in mangrove swamps influenced by hydrogeomorphic conditions and urbanization in Southwest Florida. Forest 2016, 7, 116. [Google Scholar] [CrossRef] [Green Version]
  65. Vences Martínez, J.Á.; Sampedro Rosas, M.L.; Castillo Elías, B.; Olmos Martínez, E.; Juárez López, A.L.; Reyes Umaña, M. Affectation of mangrove by anthropogenic activities at sub-basin nuxco, Guerrero, Mexico. Mex. J. Agroecosystems 2016, 3, 163–174. Available online: http://ri.uagro.mx/handle/uagro/621 (accessed on 10 December 2021).
  66. Cerón, R.M.; Cerón, J.G.; Guerra, J.J.; Zavala, J.C.; Amador, L.E.; Endañu, E.; Moreno, G. Determination of the amount of carbon stored in a disturbed mangrove forest in Campeche, MexicoWIT Trans. Ecol. Environ. 2011, 144, 327–338. [Google Scholar] [CrossRef] [Green Version]
  67. Vázquez-González, C.; Fermán-Almada, J.L.; Moreno-Casasola, P.; Espejel, I. Scenarios of vulnerability in coastal municipalities of tropical Mexico: An analysis of wetland land use. Ocean Coast. Manag. 2014, 89, 11–19. [Google Scholar] [CrossRef]
  68. Berlanga-Robles, C.A.; Ruiz-Luna, A.; Bocco, G.; Vekerdy, Z. Spatial analysis of the impact of shrimp culture on the coastal wetlands on the Northern coast of Sinaloa, Mexico. Ocean Coast. Manag. 2011, 54, 535–543. [Google Scholar] [CrossRef]
  69. Campos, C.A.; Hernández, M.E.; Moreno-Casasola, P.; Cejudo Espinosa, E.; Robledo, R.A.; Infante Mata, D. Soil water retention and carbon pools in tropical forested wetlands and marshes of the Gulf of Mexico. Hydrol. Sci. J. 2011, 56, 1388–1406. [Google Scholar] [CrossRef] [Green Version]
  70. Bianchi, T.S.; Allison, M.A.; Zhao, J.; Li, X.; Comeaux, R.S.; Feagin, R.A.; Kulawardhana, R.W. Historical reconstruction of mangrove expansion in the Gulf of Mexico: Linking climate change with carbon sequestration in coastal wetlands. Estuar. Coast. Shelf Sci. 2013, 119, 7–16. [Google Scholar] [CrossRef]
  71. Adame, M.F.; Santini, N.S.; Tovilla, C.; Vázquez-Lule, A.; Castro, L.; Guevara, M. Carbon tocks and soil sequestration rates of tropical riverine wetlands. Biogeosciences 2015, 12, 3805–3818. [Google Scholar] [CrossRef] [Green Version]
  72. Ochoa-Gómez, J.G.; Lluch-Cota, S.E.; Rivera-Monroy, V.H.; Lluch-Cota, D.B.; Troyo-Diéguez, E.; Oechel, W.; Serviere-Zaragoza, E. Mangrove wetland productivity and carbon stocks in an arid zone of the Gulf of California (La Paz Bay, Mexico). For. Ecol. Manag. 2019, 442, 135–147. [Google Scholar] [CrossRef]
  73. Beach, T.; Luzzadder-Beach, S.; Terry, R.; Dunning, N.; Houston, S.; Garrison, T. Carbon isotopic ratios of wetland and terrace soil sequences in the Maya Lowlands of Belize and Guatemala. Catena 2011, 85, 109–118. [Google Scholar] [CrossRef]
  74. Bhomia, R.K.; Kauffman, J.B.; Mcfadden, T.N. Ecosystem carbon stocks of mangrove forests along the Pacific and Caribbean coasts of Honduras. Wetl. Ecol. Manag. 2016, 24, 187–201. [Google Scholar] [CrossRef]
  75. Rodríguez-Arias, C.E.; Silva Benavides, A.M. Los Humedales de la Quebrada Estero en San Ramón, Costa Rica: Importancia y estado actual. Posgrado Sociedad Revista Electrónica Sistema Estudios Posgrado 2017, 15, 13–26. [Google Scholar] [CrossRef]
  76. Mitsch, W.J.; Tejada, J.; Nahlik, A.; Kohlmann, B.; Bernal, B.; Hernández, C.E. Tropical wetlands for climate change research, water quality management and conservation education on a university campus in Costa Rica. Ecol. Eng. 2008, 34, 276–288. [Google Scholar] [CrossRef]
  77. Ramenzoni, V.C.; Besonen, M.R.; Yoskowitz, D.; Sánchez, V.V.; Rivero, A.R.; González-Díaz, P.; Méndez, A.F.; Escuela, D.B.; Ramos, I.H.; Hernández López, N.V.; et al. Transnational research for coastal wetlands conservation in a Cuba–US setting. Glob. Sustain. 2020, 3, 1–11. [Google Scholar] [CrossRef]
  78. Kauffman, J.B.; Heider, C.; Norfolk, J.; Payton, F. Carbon stocks of intact mangroves and carbon emissions arising from their conversion in the Dominican Republic. Ecol. Appl. 2014, 24, 518–527. [Google Scholar] [CrossRef] [PubMed]
  79. Pérez-Rojas, J.; Moreno, F.; Quevedo, J.C.; Villa, J. Soil organic carbon stocks in fluvial and isolated tropical wetlands from Colombia. Catena 2019, 179, 139–148. [Google Scholar] [CrossRef]
  80. Blanco, J.F.; Estrada, E.A.; Ortiz, L.F.; Urrego, L.E. Ecosystem-Wide Impacts of Deforestation in Mangroves: The Urabá Gulf (Colombian Caribbean) Case Study. ISRN Ecol. 2012, 2012, 1–14. [Google Scholar] [CrossRef] [Green Version]
  81. Ricaurte, L.F.; Olaya-Rodríguez, M.H.; Cepeda-Valencia, J.; Lara, D.; Arroyave-Suárez, J.; Max Finlayson, C.; Palomo, I. Future impacts of drivers of change on wetland ecosystem services in Colombia. Glob. Environ. Chang. 2017, 44, 158–169. [Google Scholar] [CrossRef]
  82. Palacios Peñaranda, M.L.; Cantera Kintz, J.R.; Peña Salamanca, E.J. Carbon stocks in mangrove forests of the Colombian Pacific. Estuar. Coast. Shelf Sci. 2019, 227, 106299. [Google Scholar] [CrossRef]
  83. Mateus, F.; Caicedo, Y. Effect of the Transformation of the Landscape on the Provision of the Ecosystem Service of Provision of Habitat of the Wetland “El Tunjo” (Bogotá-Colombia), from 1940 to 2014; University of Applied and Environmental Sciences: Bogotá, CO, USA, 2014; Available online: https://core.ac.uk/download/pdf/326431054.pdf (accessed on 15 December 2021).
  84. Ayala, K.; Torres, J. A Socio-Environmental Study of “El Pantanal” Wetland from the Technical University of Machala; Universidad Técnica de Machala: Machala, Ecuador, 2016; Available online: http://investigacion.utmachala.edu.ec/proceedings/index.php/utmach/article/view/50 (accessed on 27 November 2021).
  85. Zamora, A. Ecosystem Services in Coastal Wetlands from Peru; University of the South: Sewanee, TN, USA, 2019; Available online: https://repositorio.cientifica.edu.pe/handle/20.500.12805/1383 (accessed on 30 November 2021).
  86. Ghermandi, A.; Agard, J.; Nunes, P.A.L.D. Applying Geographic Information Systems to ecosystem services valuation and mapping in Trinidad and Tobago. Lett. Spat. Resour. Sci. 2018, 11, 289–306. [Google Scholar] [CrossRef]
  87. Ding, Y.; Cawley, K.M.; da Cunha, C.N.; Jaffé, R. Environmental dynamics of dissolved black carbon in wetlands. Biogeochemistry 2014, 119, 259–273. [Google Scholar] [CrossRef]
  88. Rovai, A.S.; Coelho-Jr, C.; de Almeida, R.; Cunha-Lignon, M.; Menghini, R.P.; Twilley, R.R.; Cintrón-Molero, G.; Schaeffer-Novelli, Y. Ecosystem-level carbon stocks and sequestration rates in mangroves in the Cananéia-Iguape lagoon estuarine system, southeastern Brazil. For. Ecol. Manag. 2021, 479, 118553. [Google Scholar] [CrossRef]
  89. Finkl, C.W.; Makowski, C. (Eds.) Coastal Wetlands: Alteration and Remediation; Springer: Berlin/Heidelberg, Germany, 2017; pp. 159–186. [Google Scholar] [CrossRef] [Green Version]
  90. Lucas, C.M.; Schöngart, J.; Sheikh, P.; Wittmann, F.; Piedade, M.T.F.; McGrath, D.G. Effects of land-use and hydroperiod on aboveground biomass and productivity of secondary Amazonian floodplain forests. For. Ecol. Manag. 2014, 319, 116–127. [Google Scholar] [CrossRef]
  91. Dos Santos, F.B.; Ferreira, F.C.; Esteves, K.E. Assessing the importance of the riparian zone for stream fish communities in a sugarcane dominated landscape (Piracicaba River Basin, Southeast Brazil). Environ. Biol. Fishes 2015, 98, 1895–1912. [Google Scholar] [CrossRef]
  92. Ferreira, A.C.; Bezerra, L.E.A.; Matthews-Cascon, H. Aboveground carbon stock in a restored neotropical mangrove: Influence of management and brachyuran crab assemblage. Wetl. Ecol. Manag. 2019, 27, 223–242. [Google Scholar] [CrossRef]
  93. Portela, A.; Dos Santos, A.; De Lima, J.; Silveira Graudenz, G.; Silva Ruiz, M.; de Mahiques, M.M.; Lopes Figueira, R.C.; de Faria Alvim Wasserman, J.C. Management of Environmental Quality: An International Journal Article Information. 2011. Available online: http://repositorio.ipen.br/bitstream/handle/123456789/31131/26909.pdf?sequence=1&isAllowed=y (accessed on 2 December 2021).
  94. Lin, Q.; Yu, S. Losses of natural coastal wetlands by land conversion and ecological degradation in the urbanizing Chinese coast. Sci. Rep. 2018, 8, 1–10. [Google Scholar] [CrossRef] [PubMed]
  95. Cumings, B.; Deyo, F.C. The Origins and Development of the Northeast Asian Political Economy: Industrial Sectors, Product Cycles, and Political Consequences. In The Political Economy of the New Asian Industrialism; Cornell University Press: Ithaca, NY, USA, 2019. [Google Scholar] [CrossRef]
  96. Herbeck, L.S.; Unger, D.; Wu, Y.; Jennerjahn, T.C. Effluent, nutrient and organic matter export from shrimp and fish ponds causing eutrophication in coastal and back-reef waters of NE hainan, tropical China. Cont. Shelf Res. 2013, 57, 92–104. [Google Scholar] [CrossRef]
  97. Fan, B.; Li, Y.; Pavao-Zuckerman, M. The dynamics of land-sea-scape carbon flow can reveal anthropogenic destruction and restoration of coastal carbon sequestration. Landsc. Ecol. 2021, 36, 1933–1949. [Google Scholar] [CrossRef]
  98. Jiang, Z.; Liu, S.; Zhang, J.; Wu, Y.; Zhao, C.; Lian, Z.; Huang, X. Eutrophication indirectly reduced carbon sequestration in a tropical seagrass bed. Plant Soil 2018, 426, 135–152. [Google Scholar] [CrossRef]
  99. Mou, X.; Liu, X.; Sun, Z.; Tong, C.; Huang, J.; Wan, S.; Wang, C.; Wen, B. Effects of Anthropogenic Disturbance on Sediment Organic Carbon Mineralization Under Different Water Conditions in Coastal Wetland of a Subtropical Estuary. Chin. Geogr. Sci. 2018, 28, 400–410. [Google Scholar] [CrossRef] [Green Version]
  100. Bao, K.; Zhao, H.; Xing, W.; Lu, X.; McLaughlin, N.B.; Wang, G. Carbon Accumulation in Temperate Wetlands of Sanjiang Plain, Northeast China. Soil Sci. Soc. Am. J. 2011, 75, 2386–2397. [Google Scholar] [CrossRef] [Green Version]
  101. Li, X.; Chen, W.; Song, X.; Wang, M.; Hu, Q.; Deng, C. Effects of reclamation on distribution of soil carbon and nitrogen in saline soil of the yellow river delta. Acta Pedol. Sin. 2018, 55, 1032–1041. [Google Scholar] [CrossRef]
  102. Zhao, G.; Ye, S.; Laws, E.A.; He, L.; Yuan, H.; Ding, X.; Wang, J. Carbon burial records during the last ~40,000 years in sediments of the Liaohe Delta wetland, China. Estuar. Coast. Shelf Sci. 2019, 226, 106291. [Google Scholar] [CrossRef]
  103. Huang, Y.; Zhang, T.; Wu, W.; Zhou, Y.; Tian, B. Rapid risk assessment of wetland degradation and loss in low-lying coastal zone of Shanghai, China. Hum. Ecol. Risk Assess. Int. J. 2017, 23, 82–97. [Google Scholar] [CrossRef]
  104. Duan, J.; Han, J.; Cheung, S.G.; Chong, R.K.Y.; Lo, C.M.; Lee, F.W.F.; Xu, S.J.L.; Yang, Y.; Tam, N.F.; Zhou, H.C. How mangrove plants affect microplastic distribution in sediments of coastal wetlands: Case study in Shenzhen Bay, South China. Sci. Total Environ. 2021, 767, 144695. [Google Scholar] [CrossRef] [PubMed]
  105. Qu, W.; Han, G.; Eller, F.; Xie, B.; Wang, J.; Wu, H.; Li, J.; Zhao, M. Nitrogen input in different chemical forms and levels stimulates soil organic carbon decomposition in a coastal wetland. Catena 2020, 194, 104672. [Google Scholar] [CrossRef]
  106. Zhong, Q.; Wang, K.; Nie, M.; Zhang, G.; Zhang, W.; Zhu, Y.; Fu, Y.; Zhang, Q.; Gao, Y. Responses of wetland soil carbon and nutrient pools and microbial activities after 7 years of experimental warming in the Yangtze Estuary. Ecol. Eng. 2019, 136, 68–78. [Google Scholar] [CrossRef]
  107. Zhu, X.; Hou, Y.; Weng, Q.; Chen, L. Integrating UAV optical imagery and LiDAR data for assessing the spatial relationship between mangrove and inundation across a subtropical estuarine wetland. ISPRS J. Photogramm. Remote Sens. 2019, 149, 146–156. [Google Scholar] [CrossRef]
  108. Mu, S.; Li, B.; Yao, J.; Yang, G.; Wan, R.; Xu, X. Monitoring the spatio-temporal dynamics of the wetland vegetation in Poyang Lake by Landsat and MODIS observations. Sci. Total Environ. 2020, 725, 138096. [Google Scholar] [CrossRef] [PubMed]
  109. Xiao, D.; Deng, L.; Kim, D.G.; Huang, C.; Tian, K. Carbon budgets of wetland ecosystems in China. Glob. Chang. Biol. Bioenergy 2019, 25, 2061–2076. [Google Scholar] [CrossRef] [PubMed]
  110. Lin, W.; Xu, D.; Guo, P.; Wang, D.; Li, L.; Gao, J. Exploring variations of ecosystem service value in Hangzhou Bay Wetland, Eastern China. Ecosyst. Serv. 2019, 37, 100944. [Google Scholar] [CrossRef]
  111. Wang, X.; Jiang, Z.; Li, Y.; Kong, F.; Xi, M. Inorganic carbon sequestration and its mechanism of coastal saline-alkali wetlands in Jiaozhou Bay, China. Geoderma 2019, 351, 221–234. [Google Scholar] [CrossRef]
  112. Meng, W.; Feagin, R.A.; Hu, B.; He, M.; Li, H. The spatial distribution of blue carbon in the coastal wetlands of China. Estuar. Coast. Shelf Sci. 2019, 222, 13–20. [Google Scholar] [CrossRef]
  113. Zhang, Z.; Craft, C.B.; Xue, Z.; Tong, S.; Lu, X. Regulating effects of climate, net primary productivity, and nitrogen on carbon sequestration rates in temperate wetlands, Northeast China. Ecol. Indic. 2016, 70, 114–124. [Google Scholar] [CrossRef] [Green Version]
  114. Hu, Y.; Wang, L.; Fu, X.; Yan, J.; Wu, J.; Tsang, Y.; Le, Y.; Sun, Y. Salinity and nutrient contents of tidal water affects soil respiration and carbon sequestration of high and low tidal flats of Jiuduansha wetlands in different ways. Sci. Total Environ. 2016, 565, 637–648. [Google Scholar] [CrossRef] [PubMed]
  115. Xiao, Y.; Huang, Z.; Lu, X. Changes of soil labile organic carbon fractions and their relation to soil microbial characteristics in four typical wetlands of Sanjiang Plain, Northeast China. Ecol. Eng. 2015, 82, 381–389. [Google Scholar] [CrossRef]
  116. Ke, C.Q.; Zhang, D.; Wang, F.Q.; Chen, S.X.; Schmullius, C.; Boerner, W.M.; Wang, H. Analyzing coastal wetland change in the Yancheng National Nature Reserve, China. Reg. Environ. Chang. 2011, 11, 161–173. [Google Scholar] [CrossRef]
  117. Dong, W.; Shu, J.; He, P.; Ma, G.; Dong, M. Study on the Carbon Storage and Fixation of Phramites autralis in Baiyangdian Demonstration Area. Procedia Environ. Sci. 2012, 13, 324–330. [Google Scholar] [CrossRef] [Green Version]
  118. Gillis, L.G.; Ziegler, A.D.; Van Oevelen, D.; Cathalot, C.; Herman, P.M.J.; Wolters, J.W.; Bouma, T.J. Tiny is mighty: Seagrass beds have a large role in the export of organic material in the tropical coastal zone. PLoS ONE 2014, 9. [Google Scholar] [CrossRef] [Green Version]
  119. Cusack, M.; Saderne, V.; Arias-Ortiz, A.; Masqué, P.; Krishnakumar, P.K.; Rabaoui, L.; Qurban, M.A.; Qasem, A.M.; Prihartato, P.; Loughland, R.A.; et al. Organic carbon sequestration and storage in vegetated coastal habitats along the western coast of the Arabian Gulf. Environ. Res. Lett. 2018, 13, 74007. [Google Scholar] [CrossRef]
  120. Byun, C.; Lee, S.H.; Kang, H. Estimation of carbon storage in coastal wetlands and comparison of different management schemes in South Korea. J. Ecol. Environ. 2019, 43, 8. [Google Scholar] [CrossRef]
  121. Sondak, C.F.A.; Chung, I.K. Potential blue carbon from coastal ecosystems in the Republic of Korea. Ocean Sci. 2015, 50, 1–8. [Google Scholar] [CrossRef]
  122. Misra, A.; Balaji, R. Decadal changes in the land use/land cover and shoreline along the coastal districts of southern Gujarat, India. Environ. Monit. Assess. 2015, 187, 461. [Google Scholar] [CrossRef]
  123. Jana, B.B.; Nandy, S.K.; Lahiri, S.; Bhakta, J.N.; Biswas, J.K.; Bag, S.K.; Ghosh, P.; Maity, S.M.; Jana, S. Heterogeneity of water quality signature and feedbacks to carbon sequestration in wetlands across some districts of West Bengal, India. J. Water Clim. Chang. 2020, 11, 434–450. [Google Scholar] [CrossRef]
  124. Harishma, K.M.; Sandeep, S.; Sreekumar, V.B. Biomass and carbon stocks in mangrove ecosystems of Kerala, southwest coast of India. Ecol. Process. 2020, 9, 31. [Google Scholar] [CrossRef]
  125. Ganguly, D.; Patra, S.; Muduli, P.R.; Vishnu Vardhan, K.; Abhilash, K.R.; Robin, R.S.; Subramanian, B.R. Influence of nutrient input on the trophic state of a tropical brackish water lagoon. Earth Syst. Sci. 2015, 124, 1005–1017. [Google Scholar] [CrossRef]
  126. Bindu, G.; Rajan, P.; Jishnu, E.S.; Ajith Joseph, K. Carbon stock assessment of mangroves using remote sensing and geographic information system. Egypt. J. Remote Sens. Space Sci. 2020, 23, 1–9. [Google Scholar] [CrossRef]
  127. Bijoy Nandan, S.; Jayachandran, P.R.; Sreedevi, O.K. Spatio-Temporal Pattern of Primary Production in a Tropical Coastal Wetland (Kodungallur-Azhikode Estuary), South West Coast of India. J. Coast. Dev. 2014, 17, 392. [Google Scholar] [CrossRef]
  128. Dommain, R.; Couwenberg, J.; Joosten, H. Development and carbon sequestration of tropical peat domes in south-east Asia: Links to post-glacial sea-level changes and Holocene climate variability. Quat. Sci. Rev. 2011, 30, 999–1010. [Google Scholar] [CrossRef]
  129. Miettinen, J.; Wang, J.; Hooijer, A.; Liew, S. Peatland conversion and degradation processes in insular southeast asia: A case study in Jambi, Indonesia. Land Degrad. Dev. 2013, 24, 334–341. [Google Scholar] [CrossRef]
  130. Bal, G.; Banerjee, K. Carbon storage potential of tropical wetland forests of South Asia: A case study from Bhitarkanika Wildlife Sanctuary, India. Environ. Monit. Assess. 2019, 191, 795. [Google Scholar] [CrossRef] [PubMed]
  131. Islam, G.M.T.; Islam, A.K.M.S.; Shopan, A.A.; Rahman, M.M.; Lázár, A.N.; Mukhopadhyay, A. Implications of agricultural land use change to ecosystem services in the Ganges delta. J. Environ. Manag. 2015, 161, 443–452. [Google Scholar] [CrossRef] [PubMed]
  132. Ahmad, S.; Suratman, M.N. Detection of changes in mangrove forests using Landsat TM in Pulau Indah, Malaysia. 2007. In Proceedings of the Conference of Forestry and Forest Products (CFFPR 2007), Monterey, CA, USA, 26–31 August 2007. [Google Scholar]
  133. Suratman, M.N. Carbon sequestration potential of mangroves in Southeast Asia. In Managing Forest Ecosystems: The Challenge of Climate Change; Springer: Dordrecht, The Netherlands, 2008; pp. 297–315. Available online: https://link.springer.com/chapter/10.1007/978-1-4020-8343-3_17 (accessed on 1 January 2022).
  134. Cole, L.E.S.; Bhagwat, S.A.; Willis, K.J. Long-term disturbance dynamics and resilience of tropical peat swamp forests. J. Ecol. 2015, 103, 16–30. [Google Scholar] [CrossRef] [PubMed] [Green Version]
  135. Friess, D.A. Tropical wetlands and REDD+: Three unique scientific challenges for policy. Int. J. Rural. Law Policy 2013, 1, 1–6. [Google Scholar] [CrossRef] [Green Version]
  136. Tareq, S.M.; Tanoue, E.; Tsuji, H.; Tanaka, N.; Ohta, K. Hydrocarbon and elemental carbon signatures in a tropical wetland: Biogeochemical evidence of forest fire and vegetation changes. Chemosphere 2005, 59, 1655–1665. [Google Scholar] [CrossRef]
  137. Kusumaningtyas, M.A.; Hutahaean, A.A.; Fischer, H.W.; Pérez-Mayo, M.; Ransby, D.; Jennerjahn, T.C. Variability in the organic carbon stocks, sources, and accumulation rates of Indonesian mangrove ecosystems. Estuar. Coast. Shelf Sci. 2019, 218, 310–323. [Google Scholar] [CrossRef]
  138. Aslan, A.; Rahman, A.F.; Warren, M.W.; Robeson, S.M. Mapping spatial distribution and biomass of coastal wetland vegetation in Indonesian Papua by combining active and passive remotely sensed data. Remote Sens. Environ. 2016, 183, 65–81. [Google Scholar] [CrossRef]
  139. Jauhiainen, J.; Takahashi, H.; Heikkinen, J.E.P.; Martikainen, P.J.; Vasander, H. Carbon fluxes from a tropical peat swamp forest floor. Glob. Chang. Biol. 2005, 11, 1788–1797. [Google Scholar] [CrossRef]
  140. Marasinghe, S.; Perera, P.; Simpson, G.D.; Newsome, D. Nature-based tourism development in coastal wetlands of Sri Lanka: An Importance—Performance analysis at Maduganga Mangrove Estuary. J. Outdoor Recreat. Tour. 2021, 33, 100345. [Google Scholar] [CrossRef]
  141. Perera, K.A.R.S.; Amarasinghe, M.D. Carbon sequestration capacity of mangrove soils in micro tidal estuaries and lagoons: A case study from Sri Lanka. Geoderma 2019, 347, 80–89. [Google Scholar] [CrossRef]
  142. Nam, V.N.; Sasmito, S.D.; Murdiyarso, D.; Purbopuspito, J.; MacKenzie, R.A. Carbon stocks in artificially and naturally regenerated mangrove ecosystems in the Mekong Delta. Wetl. Ecol. Manag. 2016, 24, 231–244. [Google Scholar] [CrossRef]
  143. FAO. The State of World Fisheries and Aquaculture 2020. Sustainability in Action; FAO: Rome, Italy, 2022. [Google Scholar] [CrossRef]
  144. FAO. The State of Food and Agriculture 2021. Make Agri-Food Systems More Resilient to Shocks and Stresses; FAO: Rome, Italy, 2021; Available online: https://www.fao.org/publications/sofa/sofa-2021/es/ (accessed on 1 January 2022).
  145. World Bank Data for China. Upper Middle Income. 2021. Available online: https://data.worldbank.org/?locations=CN-XT (accessed on 1 January 2022).
  146. Elschot, K.; Bakker, J.P.; Temmerman, S.; Van De Koppel, J.; Bouma, T.J. Ecosystem engineering by large grazers enhances carbon stocks in a tidal salt marsh. Mar. Ecol. Prog. Ser. 2015, 537, 9–21. [Google Scholar] [CrossRef]
  147. Martínez-López, J.; Carreño, M.F.; Palazón-Ferrando, J.A.; Martínez-Fernández, J.; Esteve, M.A. Free advanced modeling and remote-sensing techniques for wetland watershed delineation and monitoring. Int. J. Geogr. Inf. Sci. 2014, 28, 1610–1625. [Google Scholar] [CrossRef]
  148. Fennessy, M.S.; Ibánez, C.; Calvo-Cubero, J.; Sharpe, P.; Rovira, A.; Callaway, J.; Caiola, N. Environmental controls on carbon sequestration, sediment accretion, and elevation change in the Ebro River Delta: Implications for wetland restoration. Estuar. Coast. Shelf Sci. 2019, 222, 32–42. [Google Scholar] [CrossRef]
  149. Morris, E.P.; Flecha, S.; Figuerola, J.; Costas, E.; Navarro, G.; Ruiz, J.; Rodriguez, P.; Huertas, E. Contribution of Doñana wetlands to carbon sequestration. PLoS ONE 2013, 8, e71456. [Google Scholar] [CrossRef] [PubMed] [Green Version]
  150. Fitoka, E.; Tompoulidou, M.; Hatziiordanou, L.; Apostolakis, A.; Höfer, R.; Weise, K.; Ververis, C. Water-related ecosystems’ mapping and assessment based on remote sensing techniques and geospatial analysis: The SWOS national service case of the Greek Ramsar sites and their catchments. Remote Sens. Environ. 2020, 245, 111795. [Google Scholar] [CrossRef]
  151. Lloyd, C.R. 2006 Annual carbon balance of a managed wetland meadow in the Somerset Levels, UK. Agric. For. Meteorol. 2006, 138, 168–179. [Google Scholar] [CrossRef]
  152. Jiménez-Ballesta, R.; García-Navarro, F.J.; Bravo, S.; Amoros, J.A.; Pérez de los Reyes, C.; Mejias, M. Environmental assessment of potential toxic elements contents in the inundated floodplain área of Tablas de Daimiel wetland (Spain). Environ. Geochem. Health 2017, 39, 1159–1177. [Google Scholar] [CrossRef] [PubMed]
  153. De la Hera, A.; Villarroya, F. Services Evolution of Two Groundwater Dependent Wetland Ecosystems in the “Mancha Húmeda” Biosphere Reserve (Spain). Resources 2013, 2, 128–150. [Google Scholar] [CrossRef] [Green Version]
  154. Du Laing, G.; De Meyer, B.; Meers, E.; Lesage, E.; Van de Moortel, A.M.K.; Tack, F.M.G.; Verloo, M.G. Metal accumulation in intertidal marshes: Role of sulphide precipitation. Wetlands 2008, 28, 735–746. [Google Scholar] [CrossRef]
  155. Coles, B. Steps towards the Heritage Management of Wetlands in Europe. J. Wetl. Archaeol. 2004, 4, 183–198. [Google Scholar] [CrossRef]
  156. Finlayson, C.M.; Davis, J.A.; Gell, P.A.; Kingsford, R.T.; Parton, K.A. The status of wetlands and the predicted effects of global climate change: The situation in Australia. Aquat. Sci. 2013, 75, 73–93. [Google Scholar] [CrossRef]
  157. Kauffman, J.B.; Heider, C.; Cole, T.G.; Dwire, K.A.; Donato, D.C. Ecosystem carbon stocks of micronesian mangrove forests. Wetlands 2011, 31, 343–352. [Google Scholar] [CrossRef]
  158. Chimner, R.A.; Ewel, K.C. Differences in carbon fluxes between forested and cultivated micronesian tropical peatlands. Wetl. Ecol. Manag. 2004, 12, 419–427. [Google Scholar] [CrossRef]
  159. Wong, V.N.L.; Johnston, S.G.; Burton, E.D.; Bush, R.T.; Sullivan, L.A.; Slavich, P.G. Anthropogenic forcing of estuarine hypoxic events in sub-tropical catchments: Landscape drivers and biogeochemical processes. Sci. Total Environ. 2011, 409, 5368–5375. [Google Scholar] [CrossRef] [PubMed]
  160. Dubuc, A.; Waltham, N.; Malerba, M.; Sheaves, M. Extreme dissolved oxygen variability in urbanised tropical wetlands: The need for detailed monitoring to protect nursery ground values. Estuar. Coast. Shelf Sci. 2017, 198, 163–171. [Google Scholar] [CrossRef]
  161. Iram, N.; Kavehei, E.; Maher, D.; Bunn, S.; Rashti, M.R.; Farahani, B.S.; Adame, M.F. Greenhouse gas emissions from tropical coastal wetlands and their alternative agricultural lands: Where significant mitigation gains lie. Biogeosciences Discuss. 2021, 1–27. [Google Scholar] [CrossRef]
  162. Adame, M.F.; Reef, R.; Wong, V.N.L.; Balcombe, S.R.; Turschwell, M.P.; Kavehei, E.; Rodríguez, D.C.; Kelleway, J.J.; Masque, P.; Ronan, M. Carbon and Nitrogen Sequestration of Melaleuca Floodplain Wetlands in Tropical Australia. Ecosystems 2020, 23, 454–466. [Google Scholar] [CrossRef]
  163. Carnell, P.E.; Windecker, S.M.; Brenker, M.; Baldock, J.; Masque, P.; Brunt, K.; Macreadie, P.I. Carbon stocks, sequestration, and emissions of wetlands in south eastern Australia. Glob. Chang. Biol. 2018, 24, 4173–4184. [Google Scholar] [CrossRef] [PubMed]
  164. Beringer, J.; Livesley, S.J.; Randle, J.; Hutley, L.B. Carbon dioxide fluxes dominate the greenhouse gas exchanges of a seasonal wetland in the wet-dry tropics of Northern Australia. Agric. For. Meteorol. 2013, 182–183, 239–247. [Google Scholar] [CrossRef]
  165. Howe, A.J.; Rodríguez, J.F.; Saco, P.M. Surface evolution and carbon sequestration in disturbed and undisturbed wetland soils of the Hunter estuary, southeast Australia. Estuar. Coast. Shelf Sci. 2009, 84, 75–83. [Google Scholar] [CrossRef]
  166. Rogers, K.; Saintilan, N.; Copeland, C. Managed Retreat of Saline Coastal Wetlands: Challenges and Opportunities Identified from the Hunter River Estuary, Australia. Estuaries Coast 2014, 37, 67–78. [Google Scholar] [CrossRef] [Green Version]
  167. Saintilan, N.; Rogers, K.; Kelleway, J.J.; Ens, E.; Sloane, D.R. Adaptation to Climate Change Impacts on the Coastal Wetlands in the Gulf of Mexico. Wetlands 2018. Available online: http://www.ine.gob.mx/descargas/cclimatico/env_framework_feb09.pdf (accessed on 22 December 2021).
  168. Livesley, S.J.; Andrusiak, S.M. Temperate mangrove and salt marsh sediments are a small methane and nitrous oxide source but important carbon store. Estuar. Coast. Shelf Sci. 2012, 97, 19–27. [Google Scholar] [CrossRef]
  169. Hayes, M.A.; Jesse, A.; Tabet, B.; Reef, R.; Keuskamp, J.A.; Lovelock, C.E. The contrasting effects of nutrient enrichment on growth, biomass allocation and decomposition of plant tissue in coastal wetlands. Plant Soil 2017, 416, 193–204. [Google Scholar] [CrossRef]
  170. Limpert, K.E.; Carnell, P.E.; Trevathan-Tackett, S.M.; Macreadie, P.I. Reducing Emissions from Degraded Floodplain Wetlands. Front. Environ. Sci. 2020, 8, 1–18. [Google Scholar] [CrossRef]
  171. Kingsford, R.T.; Basset, A.; Jackson, L. Wetlands: Conservation’s poor cousins. Aquat. Conserv. Mar. Freshw. Ecosyst. 2016, 26, 892–916. [Google Scholar] [CrossRef] [Green Version]
  172. Department of Economic and Social Affairs, Population Division, United Nations. World Population Prospects 2019: Highlights. ST/ESA/SER.A/423. Available online: https://population.un.org/wpp/Publications/Files/WPP2019_Highlights.pdf (accessed on 5 January 2022).
  173. Mojica Vélez, J.M.; Barrasa García, S.; Espinoza Tenorio, A. Policies in coastal wetlands: Key challenges. Environ. Sci. Policy 2018, 88, 72–82. [Google Scholar] [CrossRef]
  174. Convención De Ramsar Sobre Los Humedales. Perspectiva Mundial Sobre Los Humedales: Estado De Los Humedales Del Mundo Y Sus Servicios a Las Personas. Gland (Suiza). 2018. Available online: https://www.ramsar.org/sites/default/files/flipbooks/ramsar_gwo_spanish_web.pdf (accessed on 10 November 2021).
  175. FAO. Foro de Expertos de Alto Nivel, del 13-13 de Octubre, Roma 2009 FAO 2009-“Cómo Alimentar al Mundo en 2050”. 2009. Available online: https://www.fao.org/fileadmin/templates/wsfs/docs/synthesis_papers/C%C3%B3mo_alimentar_al_mundo_en_2050.pdf (accessed on 15 November 2021).
  176. FAO. The State of Food Insecurity in the World, Addressing Food Insecurity in Protracted Crises; FAO: Rome, Italy, 2010. [Google Scholar]
  177. FAO. The State of Food and Agriculture. Climate Change, Agriculture and Food Security; FAO: Rome, Italy, 2016. [Google Scholar]
  178. IPCC. Global Warming of 1.5 °C: An IPCC Special Report on the Impacts of Global Warming of 1.5 °C above Pre-Industrial Levels and Related Global Greenhouse Gas Emission Pathways, in the Context of Strengthening the Global Response to the Threat of Climate Chang. 2018. Available online: https://www.ipcc.ch/sr15/download/#full (accessed on 20 November 2021).
Figure 1. Methodology for the literature review.
Land 11 00434 g001
Figure 2. Number of investigations reviewed globally.
Land 11 00434 g002
Figure 3. Frequency distribution of incident factors of wetland loss in Africa.
Land 11 00434 g003
Figure 4. Frequency distribution by type of affected wetland in Africa.
Land 11 00434 g004
Figure 5. Frequency Distribution of Incident Factors affecting wetlands in America.
Land 11 00434 g005
Figure 6. Frequency distribution of the type of wetland affected in America.
Land 11 00434 g006
Figure 7. Frequency distribution of incident factors that affect wetlands in Asia.
Land 11 00434 g007
Figure 8. Frequency distribution of the types of wetlands affected in Asia.
Land 11 00434 g008
Figure 9. Frequency distribution of incident factors in Europe.
Land 11 00434 g009
Figure 10. Frequency Distribution of the Types of Wetlands Affected in Europe.
Land 11 00434 g010
Figure 11. Frequency Distribution of Incident Factors in Oceania/Australia.
Land 11 00434 g011
Figure 12. Frequency Distribution of the type of wetlands affected in Oceania/Australia.
Land 11 00434 g012
Figure 13. Frequency distribution of incident factors at a global level.
Land 11 00434 g013
Figure 14. Frequency Distribution of Affected Wetlands at a Global Level.
Land 11 00434 g014
Figure 15. Classification of Wetlands Affected Globally.
Land 11 00434 g015
Table 1. Data from the African continent on wetlands in coastal, marine, and continental zones (n = 10).
CountrySite and Type of Wetland or Flooded AreaAffectation Time (Years)Incident Factor in Loss of Vegetation and SequestrationLoss and Sequestration IndicatorAffectation PercentageAuthor
KeniaGazi Bay MangrovesYearlyLoggingVegetation Loss0.7[28]
KeniaGazi Bay SeagrassesLast 140Fishing with netsDegradationN.A.[29,30]
EgyptCoastal Area Governorate of Kafr Elsheikh-Nile River Delta,N.A.SalinityProductivityN.A.[31]
EgyptBurullus LakeLast two centuriesSoil erosion, agricultural soil drainage.High Sedimentation and Eutrophication62.5[32]
GhanaDensu Delta, Sakumo II and Muni-Pomadze1985, 2002, 2017Flood, marine erosionLDD, NDVIN.A.[33]
TanzaniaTanzania, Kenia and Mozambique Coastal Zone2000–2016Urbanization, agriculture, livestock, lumber industryVegetation LossN.A.[34]
Tanzania and MozambiqueRufiji and ZambezeN.A.Illegal Logging and Coastal ErosionVegetation LossN.A.[35]
UgandaKirinya Wetland and Nakivo1950–AgricultureVegetation LossN.A.[36]
UgandaWetland NaigombwaN.A.AgricultureVegetation LossN.A.[37]
South AfricaMkuse Floodable PlainN.A.Agriculture, DamsVegetation Loss, Flood and Sediment ControlN.A.[38]
N.A.: Not Available. LDD: Landscape Deviation Degree. NDVI: Normalized Difference Vegetation Index.
Table 2. Data from the American continent on wetlands in coastal, marine, and continental zones (n = 55).
CountrySite and Type of Wetland or Flooded AreaAffectation Time (Years)Incident Factor in Loss of Vegetation and SequestrationLoss and Sequestration IndicatorAffectation PercentageAuthor
USAWetlands of Albermarle Strait, North CarolinaN.A.AgricultureDrainageN.A.[40]
USAEstuaries from Delaware Bay and the Indian River Florida1970–Rising Sea LevelsVegetation LossN.A.[41]
USATidal Marshes Estuaries- National Research Reserve, Delaware1780–Agriculture and UrbanizationVegetation Loss54[42]
USASeagrasses from the Virginia Coastal ReserveN.A.Mud Mold and a Hurricane.Vegetation LossN.A.[43]
USATimberlake, Albemarle Peninsula, North Carolina1900–1980Deforestation AgricultureVegetation LossN.A.[44]
USASalt Marsh in Rowley MassachusettsN.A.Waste WaterEutrophicationN.A.[45]
USASan Francisco Bay20th centuryAgriculture and UrbanizationVegetation Loss90[46]
USANew England CoastLast 30 yearsOvergrazingVegetation LossN.A.[47]
USAGeorgia Coast–2100Rising Sea LevelsVegetation Loss20[48]
USAElkhorn Slough WetlandLast centuryAgricultureEutrophicationN.A.[49]
California
USACoasts1960–1970Oil SpillPollutionN.A.[50]
USANew YorkN.A.AgricultureRespiration and Nitrogen MineralizationN.A.[51]
USAIndiana and Illinois150–200AgricultureDrainage90[52]
USACoastal Wetlands of LouisianaLast two centuriesFlood Control LeveesDegradationN.A.[53]
USAContinental Wetlands Louisiana200AgricultureDrainage80[54]
USABarataria Bay, Lousiana Coastal SinkingRising Sea Levels, Erosion [55]
USAOhio Freshwater Wetlands AgricultureErosionN.A.[56]
USAMarshes, California100Agriculture, LivestockDrainageN.A.[57]
USAEverglades Boglands19th CenturyWaste waterEutrophicationN.A.[58]
USAEverglades Wetlands, Great Dismal Swamp200Agriculture, Urbanization and FireVegetation LossN.A.[59]
USAIndian River LagoonAt the end of the 20th CenturyReservoir ConstructionDrainagevariables[60]
Vero Beach and Fort Pierce Florida
USAMangroves in Tampa Bay1950–1990UrbanizationVegetation Loss21[61]
USANaples Bay Mangroves, Florida2005UrbanizationVegetation Loss70[62]
MexicoNuxco Sub-basin Mangroves, Municipality of Tecpan de Galeana1981–2015Agriculture and UrbanizationVegetation Loss50[63]
MexicoTerminos LagoonLast YearsWaste water and GarbageDisturbanceN.A.[64]
MexicoAlvarado Lagoon SystemColonial PeriodAgriculture and LivestockChange in vegetationvariable[65]
MexicoSinaloa MarshesLast Three (3) DecadesAquacultureVegetation Lossvariable[66]
MexicoMarshes and Swamps State of VeracruzN.A.Livestock, Petrochemistry and Urbanization.Vegetation LossN.A.[67]
MexicoGulf of México Mangroves100Sub-freezing and Increased level of the substrate due to sedimentsVegetation Loss vegetalvariable[68]
MexicoLa Encrucijada Biosphere ReserveN.A.River dredging and FiresDegradationN.A.[69]
Chiapas
MexicoCalifornia Gulf MangrovesN.A.UrbanizationPopulation Growth50[70]
MexicoBiosphere Reserve of Sian Ka’an Yucatán PeninsulaN.A.Climate ChangeSea Level, Roads, tourismN.A.[71]
Belize and GuatemalaMilpa, blue creek and Zotz. Wetlands.Recent YearsAgricultureCarbon Isotope VariationN.A.[72]
HondurasFonseca Gulf Mangroves1985–2013AquacultureVegetation loss5800 ha[73]
Costa RicaEstereo Brook BasinLast ten yearsUrbanization, Waste waterVegetation Loss and EutrophicationN.A.[74]
Costa RicaPalo Verde Freshwater W30LivestockGrazingN.A.[24]
Costa RicaEarth University, Parismina River BasinN.A.AgricultureVegetation LossN.A.[75]
CubaCaguanes National Park19th CenturyAgriculture and livestockDeforestationN.A.[76]
Dominican RepublicProvidence of Montecristi Mangroves1983–1993AquacultureVegetation lossN.A.[77]
ColombiaMagdalena River2007–2012Livestock, Agroindustry, Mining, Energy and Urban ExpansionPopulation Growth24[78]
ColombiaUraba Gulf MangrovesTwo (2) decadesDeforestation, Agrícultural soils and Urban areas.Population Growth29.8[79]
ColombiaOrinoco River Basin and the CaribbeanLast four (4) yearsAgricultureChange in Land Usevariable[80]
ColombiaMalaga Bay Mangroves and Buenaventura BayN.A.Deforestation, Urbanization, Expansion of ports and docks.Vegetation LossN.A.[81]
ColombiaEl Tunjo Freshwater Wetland1940–2016UrbanizationFragmentation90[82]
EcuadorEl Pantanal Wetland, Technical University of Machala2007–2016Solid waste and EnclosureVegetation Loss40[83]
PeruSanta Rosa Wetland, LimaN.A.Agriculture, Porciculture, Livestock and Waste waterInvasive Plants, EutrophicationN.A.[84]
Trinidad and TobagoCoasts of the IslandsN.A.Port Industry, Agriculture and UrbanizationEcological Stress and Loss of CoverN.A.[85]
BrazilO PantanalN.A.Natural and Arson FiresBiomass BurningN.A.[86]
BrazilCananeia-Iguape Lagoon165River DiversionIntrusion of Macrophyte SpeciesN.A.[87]
BrazilWhale Coast in BahíaLast 34 yearsEucalyptus Forestry, Agriculture, UrbanizationVegetation LossN.A.[88]
BrazilVarzea Clear Water Alluvial PlainCurrentlyLivestockSoil CompactionN.A.[89]
BrazilAtibaia River Basin and Jaguari RiverN.A.Agriculture and UrbanizationEutrophication and Vegetation Loss72.4[90]
BrazilJaguaribe RiverN.A.Wastewater and AquacultureEutrophicationVegetation LossN.A.[91]
BrazilSepetiba BayN.A.Metallurgical industry and UrbanizationHeavy MetalsN.A.[92]
Rio de Janeiro
ArgentinaParana River Delta19LivestockVegetation Loss58.3[93]
N.A.: Not Available.
Table 4. Data from the European continent on wetlands in coastal, marine, and continental areas (n = 9).
CountryLocation and Type of HumidityAffectation Time (Years)Incident Factor in Loss of Vegetation and SequestrationLoss and Sequestration IndicatorAffectation PercentageAuthor
New ScotlandFundi BayN.A.AgricultureChange of Use80[3]
SpainLago Fuente de piedra Last decadesAgriculture and UrbanizationChange of UseN.A.[4]
Czech RepublicBiosphere Reserve UNESCO MAB Třeboň400–600Aquaculture and Sowing PasturesDrainage30[54]
HollandBack Barrier Swamp Island of SchiermonnikoogLast 120LivestockCompactionN.A.[146].
Spain11 wetlands in MurciaLast decadesAgriculture, Urbanization, tourismLoss of areaN.A.[147]
SpainEbro River DeltaN.A.Dam Construction and Rice PlantingReduction of Sediment Flow and Organic Matter99[148]
SpainWetlands adjacent to the Doñana National ParkN.A.Aquaculture and AgricultureChange of UseN.A.[149]
GreeceTen Greek Ramsar sites30AgricultureChange of Use [150]
United KingdomTadham Moor Somerset Levels and MoorsHistoricallyAgriculture and LivestockDrainageN.A.[151]
N.A.: Not Available.
Table 5. Data from the Oceania/Australia continent on wetlands in coastal, marine, and continental zones (n = 14).
CountryLocation and Type of HumidityAffectation Time (Years)Incident Factor in Loss of Vegetation and SequestrationLoss and Sequestration IndicatorAffectation PercentageAuthor
MicronesiaMangroves Babeldoab Island and Yap IslandN.A.Climate ChangeVegetation LossN.A.[156]
MicronesiaWooded Wetland Kosrae IslandLast 50 yearsAgroforestry CropsChange of UseN.A.[157]
Australia Richmond and Clarence River Basins Estuaries1900–1970AgricultureDrainageN.A.[158]
AustraliaQueensland wetlandN.A.Urbanization (Waste Water)Oxygenation, Water, and Soil Quality.N.A.[159]
AustraliaHerbert River Queensland20th CenturyAgricultureVegetation Lossvariable[160]
AustraliaHalifax bay Wetlands, National Park Insulator Creek among othersLast CenturyDeforestation and DegradationVegetation Loss50[161]
AustraliaVictoria State187Agricultural FrontierDrainage27[162]
AustraliaFogg Dam WetlandN.A.Floods and, natural and arson firesGas emissionN.A.[163]
AustraliaHunter Estuary1954–1994Industry, drainage.Vegetation Loss30[164]
Australia Hunter River EstuaryN.A.Rising sea levelPossible loss of vegetation100[165]
AustraliaEast Coast Rivers of New South Wales and Queensland1950–1960Flood control projectsVegetation LossN.A.[166]
AustraliaWesternport BayN.A.Agriculture, industry and urbanizationVegetation LossN.A.[167]
AustraliaMangrove forests on western shores Moreton Bay-QueenslandN.A.Waste waterEutrophicationN.A.[168]
AustraliaDuck Creek North Freshwater WetlandEuropean ColonizationDams, roadsChange in hydrologyN.A.[169]
N.A.: Not Available.
Publisher’s Note: MDPI stays neutral with regard to jurisdictional claims in published maps and institutional affiliations.

