
Tracking Changing Evidence of Water Erosion in Ordos Plateau, China Using the Google Earth Engine

Abstract
:1. Introduction
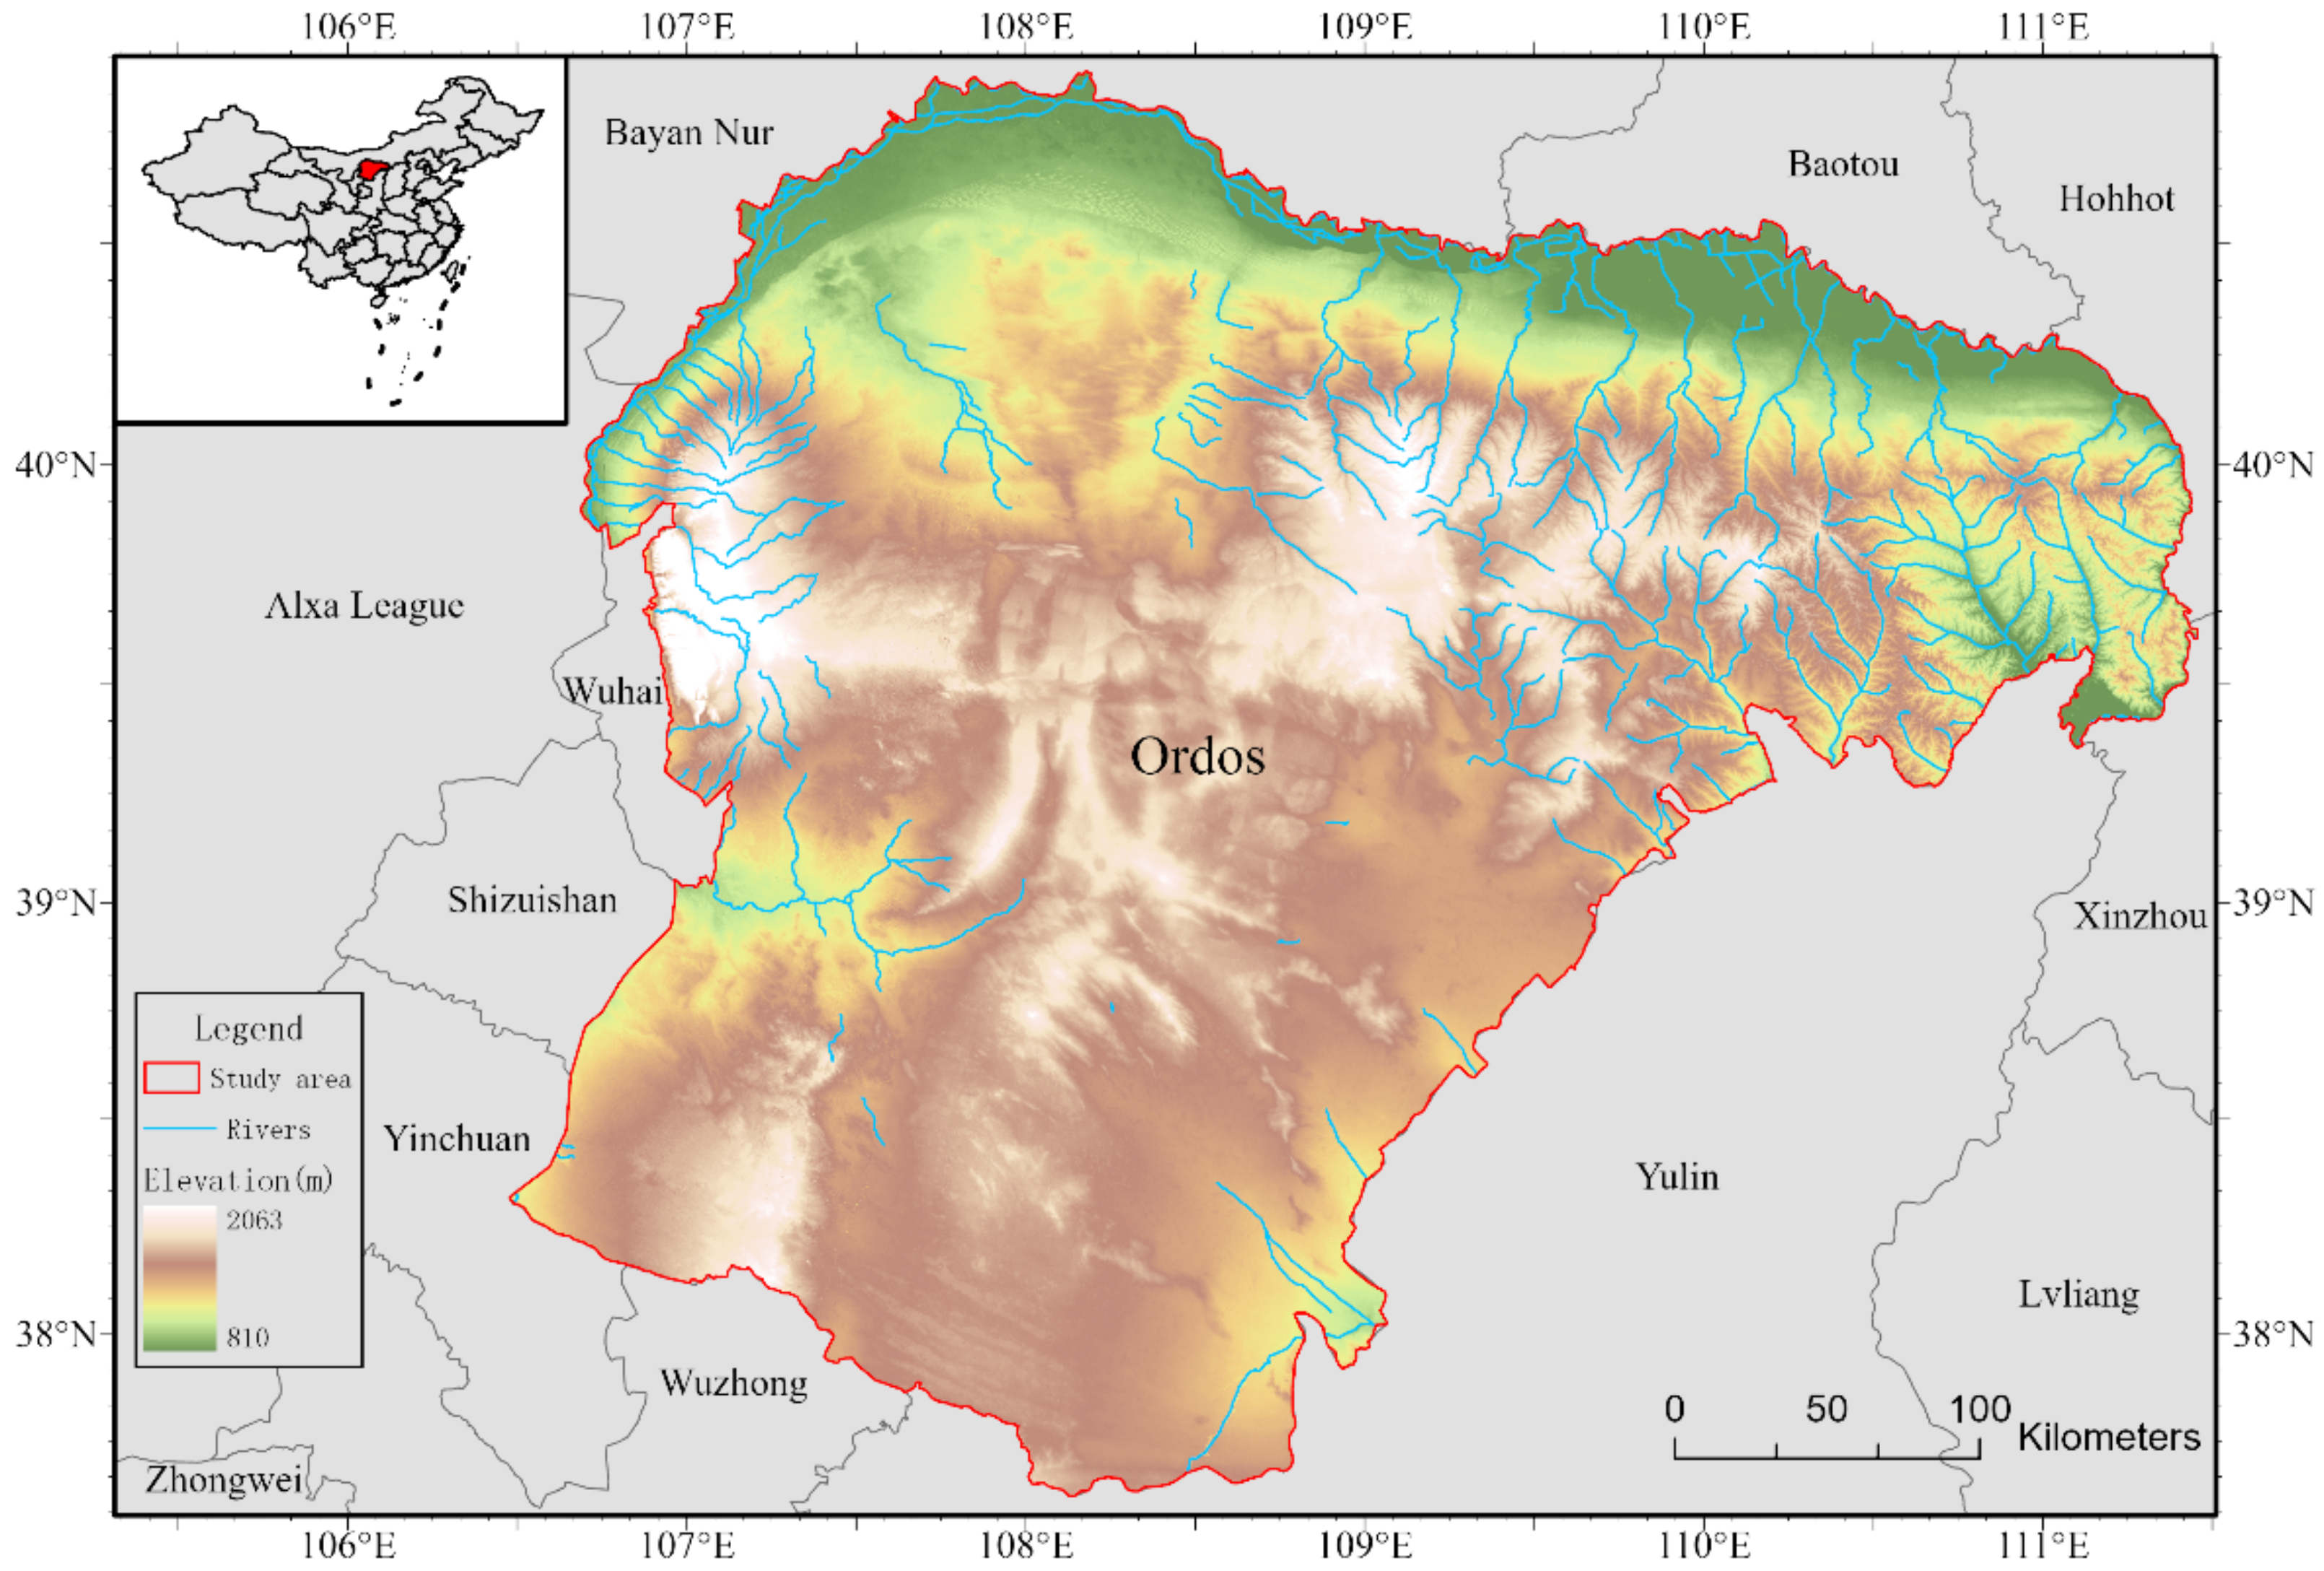
2. Study Area
3. Materials and Methods
3.1. Satellite Data
3.2. Method
3.2.1. Calculation Based on Goggle Earth Engine Platform
3.2.2. Trend Analysis
3.2.3. Model Validation
4. Results
4.1. Model Validation
4.2. Soil Erosion Changes in Loess Plateau
4.3. Staged Characteristics of Soil Erosion Changes in the Ordos
4.4. Change Tendency of Soil Erosion
5. Discussion
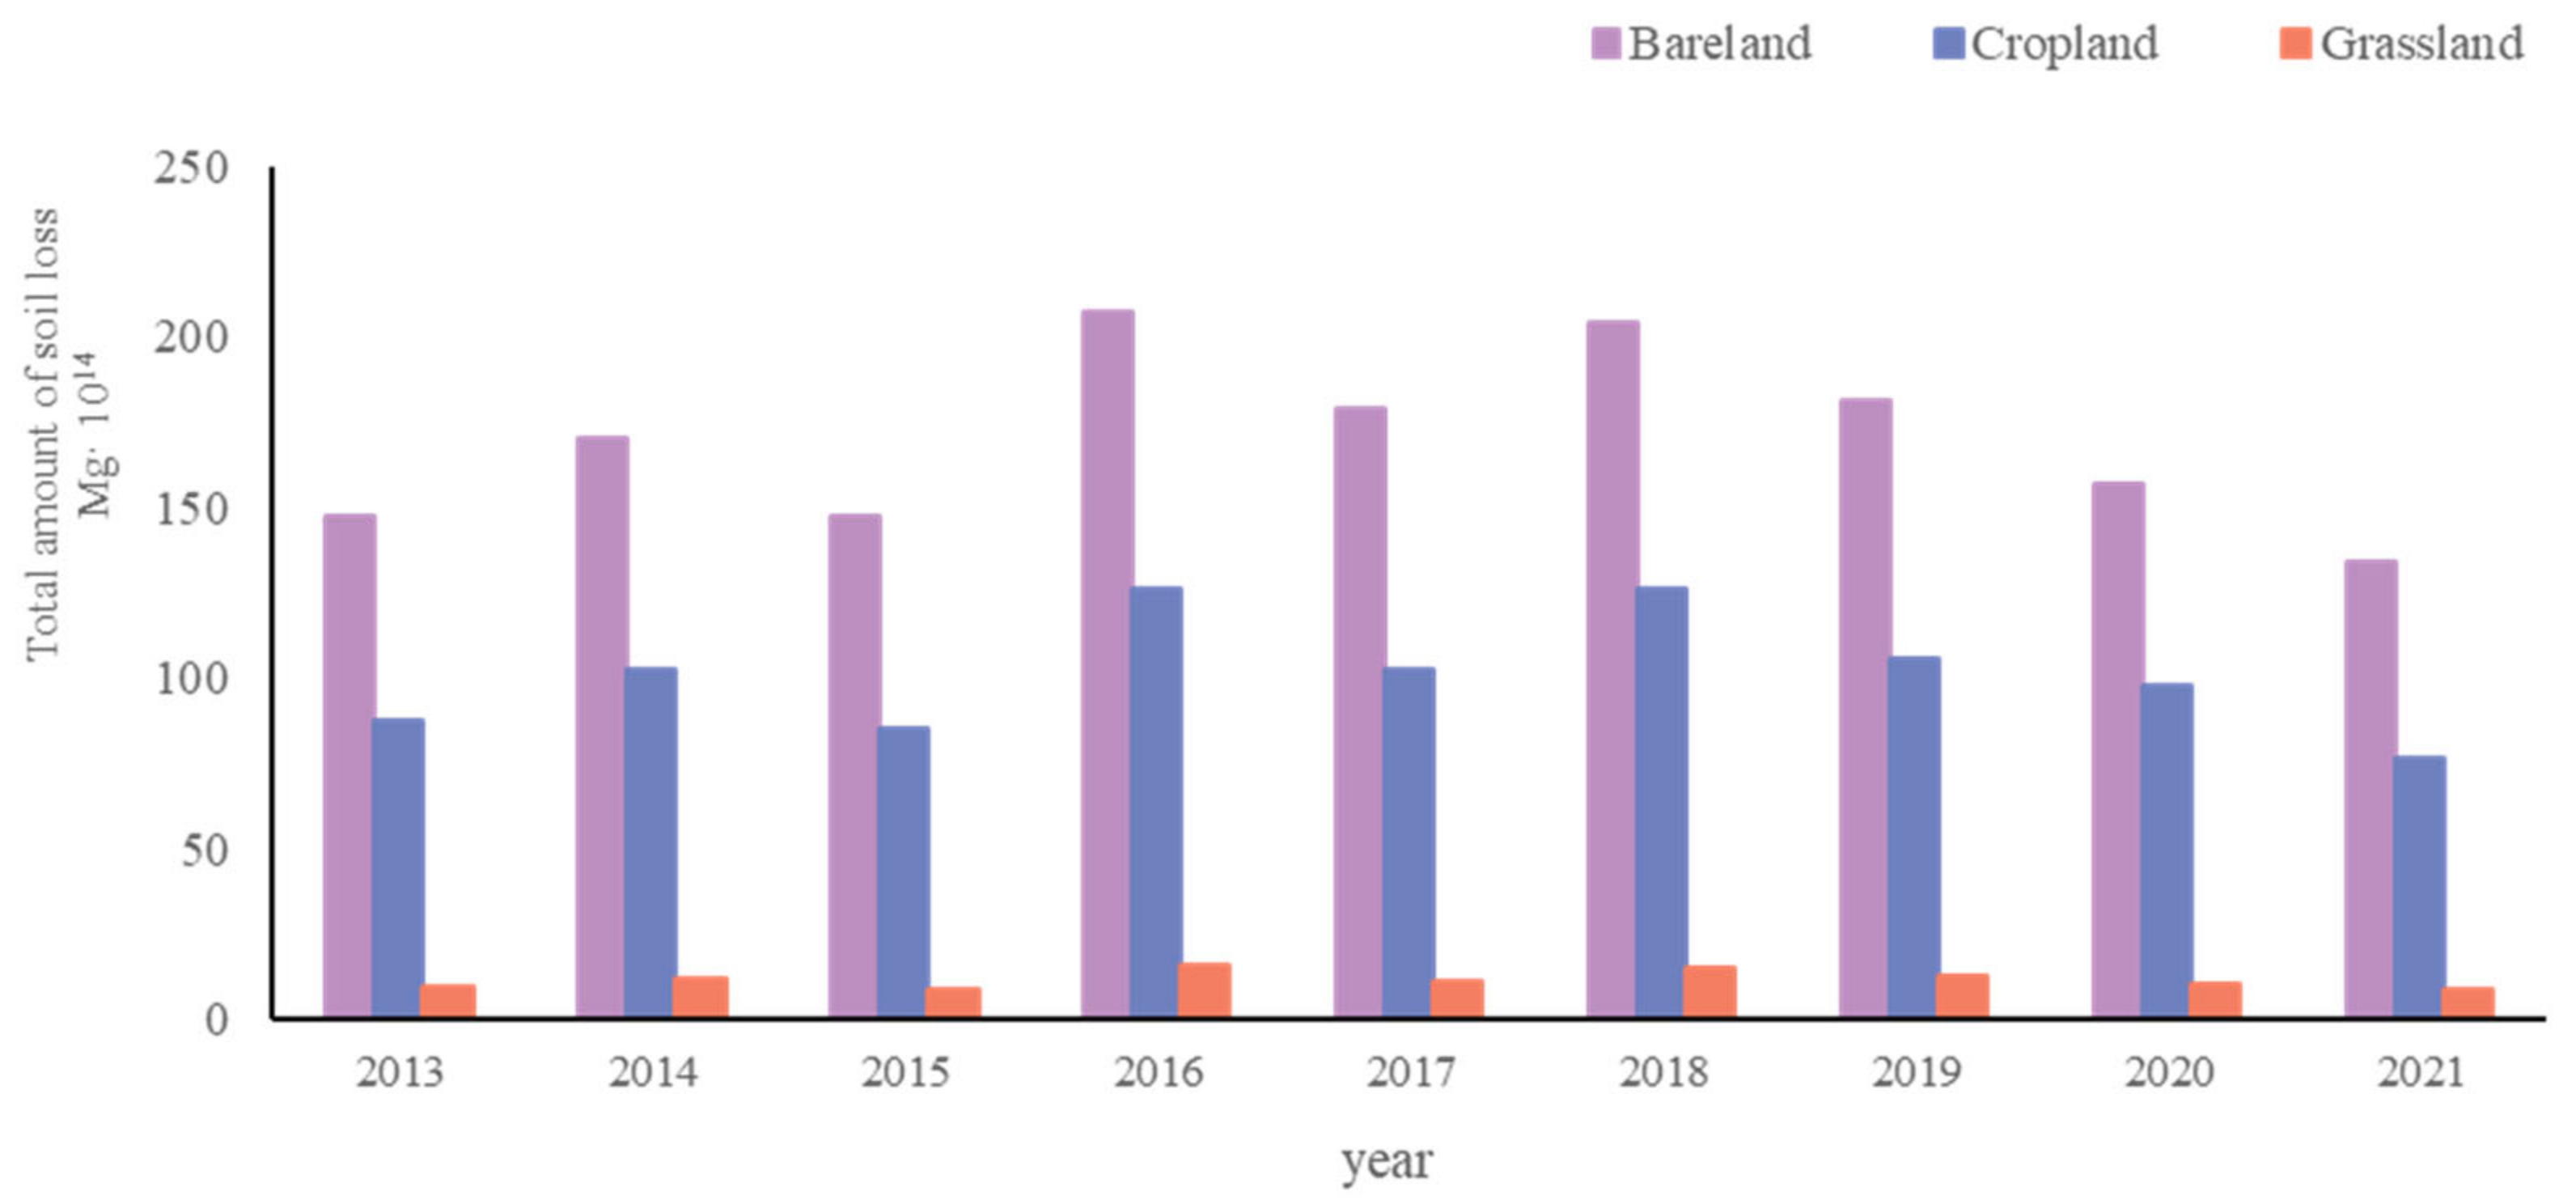
5.1. Soil Erosion Characteristics of Different Land Use Types
5.2. Soil Erosion Influenced by Climate and Human Activities
5.3. Advantages of the Google Earth Engine Platform
6. Conclusions
- (1)
- From 2013 to 2021, the trend of soil and water loss increased at first, then decreased after treatment, which was mainly divided into three stages: 2013–2015, 2106–2018, and 2018–2021. Soil erosion in 2021 was slightly lower than that in 2013, and it showed an improving trend compared with 2016 under the restoration and protection projects implemented by the government.
- (2)
- The results of testing the trend of land erosion in the Ordos area from 2013 to 2021 showed that 40.9% of the region experienced a significant decrease in soil erosion, while 45.7% experienced a slight decline. Only 13.3% of the region had an increasing trend in soil erosion.
- (3)
- Compared with the measured data, it shows that the result of soil erosion detection using Google Earth Engine is reliable. Using Google Earth Engine, we can better understand the current situation and changes in soil and water loss and identify the original or less manufactured landscapes by tracking the evidence of historical changes to provide support for environmental restoration and protection management. The long-term changes in soil erosion can be used as one of the target indicators of sustainable development, which can be used to evaluate the sustainable management of land resources and provide a basis for evidence-based decision-making.
Author Contributions
Funding
Institutional Review Board Statement
Informed Consent Statement
Conflicts of Interest
References
- Wang, F.; Liu, T.; Gao, H.; Qi, F. Study on Spatial-Temporal Differentiation Characteristics and Influencing Factors of Soil Erosion in Taihang Mountain Area Based on RUSLE Model. Chin. J. Ecol. Agric. 2022, 30, 10641076. [Google Scholar]
- Igwe, P.U.; Onuigbo, A.A.; Chinedu, O.C.; Ezeaku, I.I.; Muoneke, M.M. Soil Erosion: A Review of Models and Applications. Int J. Adv. Eng. Res. Sci. 2017, 4, 138–150. [Google Scholar] [CrossRef]
- Borrelli, P.; Alewell, C.; Alvarez, P.; Anache, J.A.A.; Baartman, J.; Ballabio, C.; Bezak, N.; Biddoccu, M.; Cerdà, A.; Chalise, D.; et al. Soil Erosion Modelling: A Global Review and Statistical Analysis. Sci. Total Environ. 2021, 780, 146494. [Google Scholar] [CrossRef]
- Wuepper, D.; Borrelli, P.; Finger, R. Countries and the Global Rate of Soil Erosion. Nat. Sustain. 2020, 3, 51–55. [Google Scholar] [CrossRef]
- Fenta, A.A.; Tsunekawa, A.; Haregeweyn, N.; Poesen, J.; Tsubo, M.; Borrelli, P.; Panagos, P.; Vanmaercke, M.; Broeckx, J.; Yasuda, H. Land Susceptibility to Water and Wind Erosion Risks in the East Africa Region. Sci. Total Env. 2020, 703, 135016. [Google Scholar] [CrossRef]
- Li, T.H.; Zheng, L.N. Soil Erosion Changes in the Yanhe Watershed from 2001 to 2010 Based on RUSLE Model. J. Nat. Resour. 2012, 27, 1164–1175. [Google Scholar]
- Masroor, M.; Sajjad, H.; Rehman, S.; Singh, R.; Rahaman, H.; Sahana, M.; Ahmed, R.; Avtar, R. Analysing the Relationship between Drought and Soil Erosion Using Vegetation Health Index and RUSLE Models in Godavari Middle Sub-Basin, India. Geosci. Front. 2022, 13, 101312. [Google Scholar] [CrossRef]
- Wang, H.; Zhao, H. Dynamic Changes of Soil Erosion in the Taohe River Basin Using the RUSLE Model and Google Earth Engine. Water 2020, 12, 1293. [Google Scholar] [CrossRef]
- Wischmeier, W.H.; Smith, D.D. Predicting Rainfall Erosion Losses: A Guide to Conservation Planning (USA). In Agriculture Handbook (USA); United States Department of Agriculture: Washington, DC, USA, 1978; p. 537. [Google Scholar]
- Renard, K.G.; Ferreira, V.A. RUSLE Model Description and Database Sensitivity. J. Env. Qual. 1993, 22, 458–466. [Google Scholar] [CrossRef]
- Ma, Z. A method for determining factors of USLE by using satellite photos. Soil Water Conserv. 1989, 3, 24–27. [Google Scholar]
- Zha, L.; Deng, G.; Gu, J. Dynamic Changes of Soil Erosion in the Chaohu Watershed from 1992 to 2013. Acta Geogr. Sin. 2015, 70, 1708–1719. [Google Scholar]
- Renard, K.G.; Foster, G.R.; Weesies, G.A.; Mccool, D.K.; Yoder, D.C. Predicting Soil Erosion by Water: A Guide to Conservation Planning with the Revised Universal Soil Loss Equation (RUSLE); United States Department of Agriculture, Agricultural Research Service (USDA-AARS): Washington, DC, USA, 1997. [Google Scholar]
- Gorelick, N.; Hancher, M.; Dixon, M.; Ilyushchenko, S.; Thau, D.; Moore, R. Google Earth Engine: Planetary-Scale Geospatial Analysis for Everyone. Remote Sens. Environ. 2017, 202, 18–27. [Google Scholar] [CrossRef]
- Shelestov, A.; Lavreniuk, M.; Kussul, N.; Novikov, A.; Skakun, S. Large Scale Crop Classification Using Google Earth Engine Platform. In Proceedings of the 2017 IEEE International Geoscience and Remote Sensing Symposium (IGARSS), Fort Worth, TX, USA, 23 July 2017. [Google Scholar]
- Lavreniuk, M.S.; Kussul, N.; Shelestov, A.; Vasiliev, V. Crop Classification and Mapping Based on Sentinel Missions Data in Cloud Environment. In Proceedings of the American Geophysical Union, Fall Meeting 2017, New Orleans, LA, USA, 11 December 2017. [Google Scholar]
- Huang, H.; Chen, Y.; Clinton, N.; Wang, J.; Wang, X.; Liu, C.; Gong, P.; Yang, J.; Bai, Y.; Zheng, Y. Mapping major land cover dynamics in Beijing using all Landsat images in Google Earth Engine. Remote Sens. Env. 2017, 202, 166–176. [Google Scholar] [CrossRef]
- Farda, N.M. Multi-Temporal Land Use Mapping of Coastal Wetlands Area Using Machine Learning in Google Earth Engine. IOP Conf. Ser.: Earth Environ. Sci. 2017, 98, 012042. [Google Scholar] [CrossRef]
- Chen, F.; Zhang, M.; Tian, B.; Li, Z. Extraction of Glacial Lake Outlines in Tibet Plateau Using Landsat 8 Imagery and Google Earth Engine. IEEE J. Sel. Top. Appl. Earth Obs. Remote Sens. 2017, 10, 4002–4009. [Google Scholar] [CrossRef]
- András, Z.; Supan, P.; Zsófia, K. Near Real-Time Qualitative Monitoring of Lake Water Chlorophyll Globally Using GoogleEarth Engine. In Proceedings of the European Geosciences Union General Assembly Conference, Vienna, Austria, 23 April 2017. [Google Scholar]
- Shangguan, W.; Dai, Y.; Duan, Q.; Liu, B.; Yuan, H. A Global Soil Data Set for Earth System Modeling. J. Adv. Model Earth Syst. 2014, 6, 249–263. [Google Scholar] [CrossRef]
- Yamazaki, D.; Ikeshima, D.; Tawatari, R.; Yamaguchi, T.; O’Loughlin, F.; Neal, J.C.; Sampson, C.C.; Kanae, S.; Bates, P.D. A High-Accuracy Map of Global Terrain Elevations. Geophys. Res. Lett. 2017, 44, 5844–5853. [Google Scholar] [CrossRef] [Green Version]
- Funk, C.; Peterson, P.; Landsfeld, M.; Pedreros, D.; Verdin, J.; Shukla, S.; Husak, G.; Rowland, J.; Harrison, L.; Hoell, A. The climate hazards infrared precipitation with stations—A new environmental record for monitoring extremes. Sci. Data 2015, 2, 150066. [Google Scholar] [CrossRef] [Green Version]
- Karra, K.; Kontgis, C.; Statman-Weil, Z.; Mazzariello, J.C.; Mathis, M.; Brumby, S.P. Global Land Use/Land Cover with Sentinel-2 and Deep Learning. In Proceedings of the IGARSS 2021—2021 IEEE International Geoscience and Remote Sensing Symposium; IEEE: Piscataway, NJ, USA; 2021. [Google Scholar]
- Yesuph, A.Y.; Dagnew, A.B. Soil Erosion Mapping and Severity Analysis Based on RUSLE Model and Local Perception in the Beshillo Catchment of the Blue Nile Basin, Ethiopia. Environ. Syst. Res. 2019, 8, 17. [Google Scholar] [CrossRef] [Green Version]
- Liu, B.Y.; Nearing, M.A.; Shi, P.J.; Jia, Z.W. Slope Length Effects on Soil Loss for Steep Slopes. Soil Sci. Soc. Am. J. 2000, 64, 1759–1763. [Google Scholar] [CrossRef] [Green Version]
- McCool, D.K.; Brown, L.C.; Foster, G.R.; Mutchler, C.K.; Meyer, L.D. Revised Slope Steepness Factor for the Universal Soil Loss Equation. Trans. ASAE 1987, 30, 1387–1396. [Google Scholar] [CrossRef]
- Zhang, H.M.; Yang, Q.K.; Li, R.; Liu, Q.R. Research on the Estimation of Slope Length in Distributed Watershed Erosion. J. Water Conserv 2012, 43, 437–443. [Google Scholar]
- Zeng, C.; Wang, S.; Bai, X.; Li, Y.; Tian, Y.; Li, Y.; Wu, L.; Luo, G. Soil Erosion Evolution and Spatial Correlation Analysis in a Typical Karst Geomorphology Using RUSLE with GIS. Solid Earth 2017, 8, 721–736. [Google Scholar] [CrossRef] [Green Version]
- Cai, C.; Ding, S.; Shi, Z.; Huang, L.; Zhang, G. Study of Applying USLE and Geographical Information System IDRISI to Predict Soil Erosion in Small Watershed. J. Soil Water Conserv. 2000, 14, 19–24. [Google Scholar]
- Qian, Q.; Bai, X.; Zhou, D.; Xiao, J.; Chen, F.; Li, Y. Study on Soil Erosion in Beipanjiang River Basin Based on RULSE Model. Sustainability 2018, 39, 19–25. [Google Scholar]
- De Vente, J.; Poesen, J. Predicting Soil Erosion and Sediment Yield at the Basin Scale: Scale Issues and Semi-Quantitative Models. Earth-Sci. Rev. 2005, 71, 95–125. [Google Scholar] [CrossRef]
- Guo, B.; Zang, W.; Yang, F.; Han, B.; Chen, S.; Liu, Y.; Yang, X.; He, T.; Chen, X.; Liu, C. Spatial and Temporal Change Patterns of Net Primary Productivity and Its Response to Climate Change in the Qinghai-Tibet Plateau of China from 2000 to 2015. J. Arid Land 2020, 12, 1–17. [Google Scholar] [CrossRef]


| Variables | Source | Dataset | Resolution | |
|---|---|---|---|---|
| RUSLE | Daily rainfall data | UCSB/CHG | CHIRPS | 5566 m |
| Soil organic carbon | Beijing Normal University | GSDE | 10 km | |
| Sand content | Beijing Normal University | GSDE | 10 km | |
| Silty content | Beijing Normal University | GSDE | 10 km | |
| Clay content | Beijing Normal University | GSDE | 10 km | |
| Digital elevation model (DEM) | University of Tokyo | MERIT | 3 arc-second | |
| NDVI | USGS | Landsat 8 | 30 m | |
| Land cover | European Space Agency | WorldCover (2020) | 10 m |
| Land Use Types | Trees | Shrubland | Grassland | Cropland | Built-Up | Barren | Water |
|---|---|---|---|---|---|---|---|
| P | 1 | 1 | 1 | 0.24 | 0 | 1 | 0 |
| SD | Z | Trend Feature |
|---|---|---|
| SD > 0 | |Z| > 1.65 | significant increase |
| |Z| < 1.65 | slight increase | |
| SD = 0 | Z | insignificant change |
| SD < 0 | |Z| > 1.65 | slight decrease |
| |Z| < 1.65 | significant decrease |
| Soil Erosion Intensity Grades | Soil Erosion Modulus (Mg/(km2 yr)) |
|---|---|
| Micro-erosion | <1000 |
| Mild erosion | 1000~2500 |
| Moderate erosion | 2500~5000 |
| Strong erosion | 5000~8000 |
| Pole strong erosion | 8000~15,000 |
| Violent erosion | >15,000 |
Publisher’s Note: MDPI stays neutral with regard to jurisdictional claims in published maps and institutional affiliations. |
© 2022 by the authors. Licensee MDPI, Basel, Switzerland. This article is an open access article distributed under the terms and conditions of the Creative Commons Attribution (CC BY) license (https://creativecommons.org/licenses/by/4.0/).
Share and Cite
Liu, Y.; Liu, J.; Zheng, Y.; Kang, Y.; Ma, S.; Zhou, J. Tracking Changing Evidence of Water Erosion in Ordos Plateau, China Using the Google Earth Engine. Land 2022, 11, 2309. https://doi.org/10.3390/land11122309
Liu Y, Liu J, Zheng Y, Kang Y, Ma S, Zhou J. Tracking Changing Evidence of Water Erosion in Ordos Plateau, China Using the Google Earth Engine. Land. 2022; 11(12):2309. https://doi.org/10.3390/land11122309
Chicago/Turabian StyleLiu, Yang, Junhui Liu, Yingjuan Zheng, Yulin Kang, Su Ma, and Jianan Zhou. 2022. "Tracking Changing Evidence of Water Erosion in Ordos Plateau, China Using the Google Earth Engine" Land 11, no. 12: 2309. https://doi.org/10.3390/land11122309