Article

Evolution of Land Use Landscape Patterns in Karst Watersheds of Guizhou Plateau and Its Ecological Security Evaluation

College of Public Administration, Guizhou University of Finance and Economics, Guizhou 550025, China
*
Author to whom correspondence should be addressed.
Land 2022, 11(12), 2225; https://doi.org/10.3390/land11122225
Submission received: 26 October 2022 / Revised: 4 December 2022 / Accepted: 4 December 2022 / Published: 7 December 2022
(This article belongs to the Special Issue Karst Land System and Sustainable Development)

Abstract

:
Landscape ecological safety is of great significance in maintaining ecological balance, ecological protection, economic development, and promoting the sustainable use of regional land resources. This study collects three-phase remote sensing (RS) image data of 2000, 2010, and 2020 to elucidate the spatial and temporal changes in land use of the Guizhou Plateau Karst Watershed. We construct a landscape ecological security index using the ArcGIS and landscape pattern index method. With the spatial autocorrelation theory, we analyze the evolution of watershed landscape patterns and changes in characteristics of ecological security. The results show that the cultivated land is being converted to construction land in the watershed from 2000 to 2020. The percentage of the patch area of the constructed land is increasing. However, the patch cohesion of the cultivated land, grassland, and watershed is decreasing. The ecological safety of the Nanming River Basin landscape is in a positive trend, clustering in the central urban areas. The growth rate of the landscape ecological safety index increased by 5.80% from 2000 to 2020, and the aggregation of the ecological safety index was dominated by high–high aggregation and low–low aggregation, which was spatially positively correlated with the spatial aggregation effect. The findings provide a scientific reference for managing ecological balance and optimizing the land resource allocation in karst watersheds.

1. Introduction

Landscape patterns are the spatial characteristics and structural composition of landscape elements that determine the environment, distribution, and composition of resources [1]. Landscape patterns play a vital role in understanding the ecological processes of a region and in evaluating and optimizing ecological security [2,3]. For decades, a direct influence has been observed between the landscape pattern’s evolution and the ecosystem [4], bringing significant changes to the quality of the landscape ecosystem and land use patterns of natural and anthropogenic activities [5,6]. Landscape ecological security is a subsystem of land resource security [7], which is crucial to national and regional development and construction. Landscape ecological safety has been a new issue facing human society’s long-term development since 2001. The Southwest Karst Region, in the central part of the Guizhou Plateau, is the largest and most populous continuous karst ecologically vulnerable area in the world [8]. This region is a hotspot and a key area for global climate change research. It also serves as a scientific research paradigm in the world and enhances an understanding of the comprehensive governance of degraded ecosystems [9,10]. However, the non-agricultural population is increasingly being concentrated in the region owing to recent large-scale urbanization, the expansion of industrial and commercial space, rapid changes in urban land use, and the consequent evolution of landscape patterns. Thus, a change in the landscape pattern can improve the urban green landscape layout [11], since the landscape structure is gradually showing strong rapid urbanization [12,13]. Moreover, the anthropogenic pressure and the transformation of regional ecosystems are increasing. Unreasonable human activities are also causing serious ecological and environmental problems [14,15], making ecological security face great challenges [16,17]. Thus, adopting a scientific and reasonable research method is critical in conducting an in-depth analysis of the ecological safety of the karst landscape.
Presently, ecological safety has become a research hot spot globally [18,19,20,21,22,23,24]. Studies have evaluated domestic and international landscape ecological safety, the ecological risk of the hotspot regional landscape, and the safety of urban clusters [25], coastal zones [26], and plateau mountains [27]. Ghosh et al. used the DEMATHE-ANP model to evaluate the ecological safety of the Kolkata Metropolitan Area in India [28]. Jiang et al. developed landscape classification on remote sensing (RS) images of the core region of Lijiang City and calculated the landscape pattern index as a driving factor [29]. From the perspectives of landscape patterns at the domestic and international levels, previous studies have established a solid conceptual base and methodological reference for exploring the evolutionary characteristics of regional landscape patterns and changes in ecological security patterns. Moreover, studies have explored landscape patterns and ecological security at a large scale, focusing on lakes [30], cultivated lands [31], and wetlands [32] in karst areas. Ren et al. used geographic information systems (GIS) and RS technology to analyze the spatial granularity effect of landscape patterns and identify the suitable spatial granularity of karst mountainous urban landscapes. However, these authors only explored a single landscape pattern index, which could not detect the regional ecological security status [33]. Liu et al. used the InVEST (Integrated Valuation of Ecosystem Services and Tradeoffs) model to explore the spatial and temporal variation characteristics of habitat quality in the Chishui River Basin and its coupling relationship with the landscape pattern [34]. Wang et al. constructed a landscape security index using the ArcGIS software and a landscape pattern index to study the evolution of landscape patterns in trough valley areas. These authors also used this software to explore the spatial and temporal divergence patterns in ecological security [35]. Peng et al. used the landscape ecological security theory to develop an evaluation model and understand the ecological security of cultivated landscapes in the karst mountains. These authors also used this theory to understand the direction of ecological security transfer and driving factors of cultivated lands in the karst mountains [36]. However, most of these studies only based their investigation on short-term time series data, with a lag in data updating. Studies that used long time-series data to evaluate ecological safety are scanty. Furthermore, non-karst places have been the primary focus of research on patterns of landscape ecological safety at large-scale levels, such as regions, watersheds, and municipal territories. As a significant ecologically sensitive territory in China, Guizhou is also one of the most extensive karst landscapes in China, and overcoming its ecological and environmental problems is the key to solving earth system science, which can assist in the promotion of the construction of ecological civilization in China and even worldwide. The Nanming River basin is a tributary of the Wu River in the Yangtze River system, and more than 90% of the basin’s total area is comprised of karst landscapes; it is a crucial ecological barrier in the upper reaches of the Yangtze River and an essential cornerstone of ecological civilization development. However, due to the relative fragility of the watershed ecosystem, it is vulnerable to the effects of urbanization. With the expansion of urbanization, high-density human activities, land development, water quality degradation, and other issues are altering the land use type, landscape pattern, and ecological mechanism of the watershed, posing a significant threat to the ecological security of the watershed landscape, and coordinating the relationship between ecological preservation and utilization in the study area is a significant issue at now. Therefore, to effectively sustain a well-functioning ecosystem in the study region in the future, a scientific evaluation of the evolution of the land use landscape pattern and its ecological safety is essential.
Based on 2000, 2010, and 2020 RS image data, this study used the theory of spatial autocorrelation, GIS spatial analysis, and landscape pattern index to elucidate the characteristics of spatial and temporal changes in land use in the watershed. The study also reveals the evolution in landscape pattern in the watershed since 2001, analyzes the spatial and temporal changes of ecological security, and makes a scientific evaluation and diagnosis of ecological security. It aims to realize quantitative analysis and visualization of the dynamic evaluation of landscape patterns and ecological security in the study area from the spatial and temporal scales, disclose the evolution characteristics of the landscape pattern and the logic of ecological security pattern in the karst watershed under the human–land relationship, and provide scientific basis and advice for the sustainable development, proper development planning, scientific ecological planning and construction of the karst watershed. It also provides data references for maintaining ecological balance and optimizing land resource allocation and control in other karst areas of the same resource type in China as well as scientific and practical references for expanding international research on karst landscapes and ecological security.

2. Materials and Methods
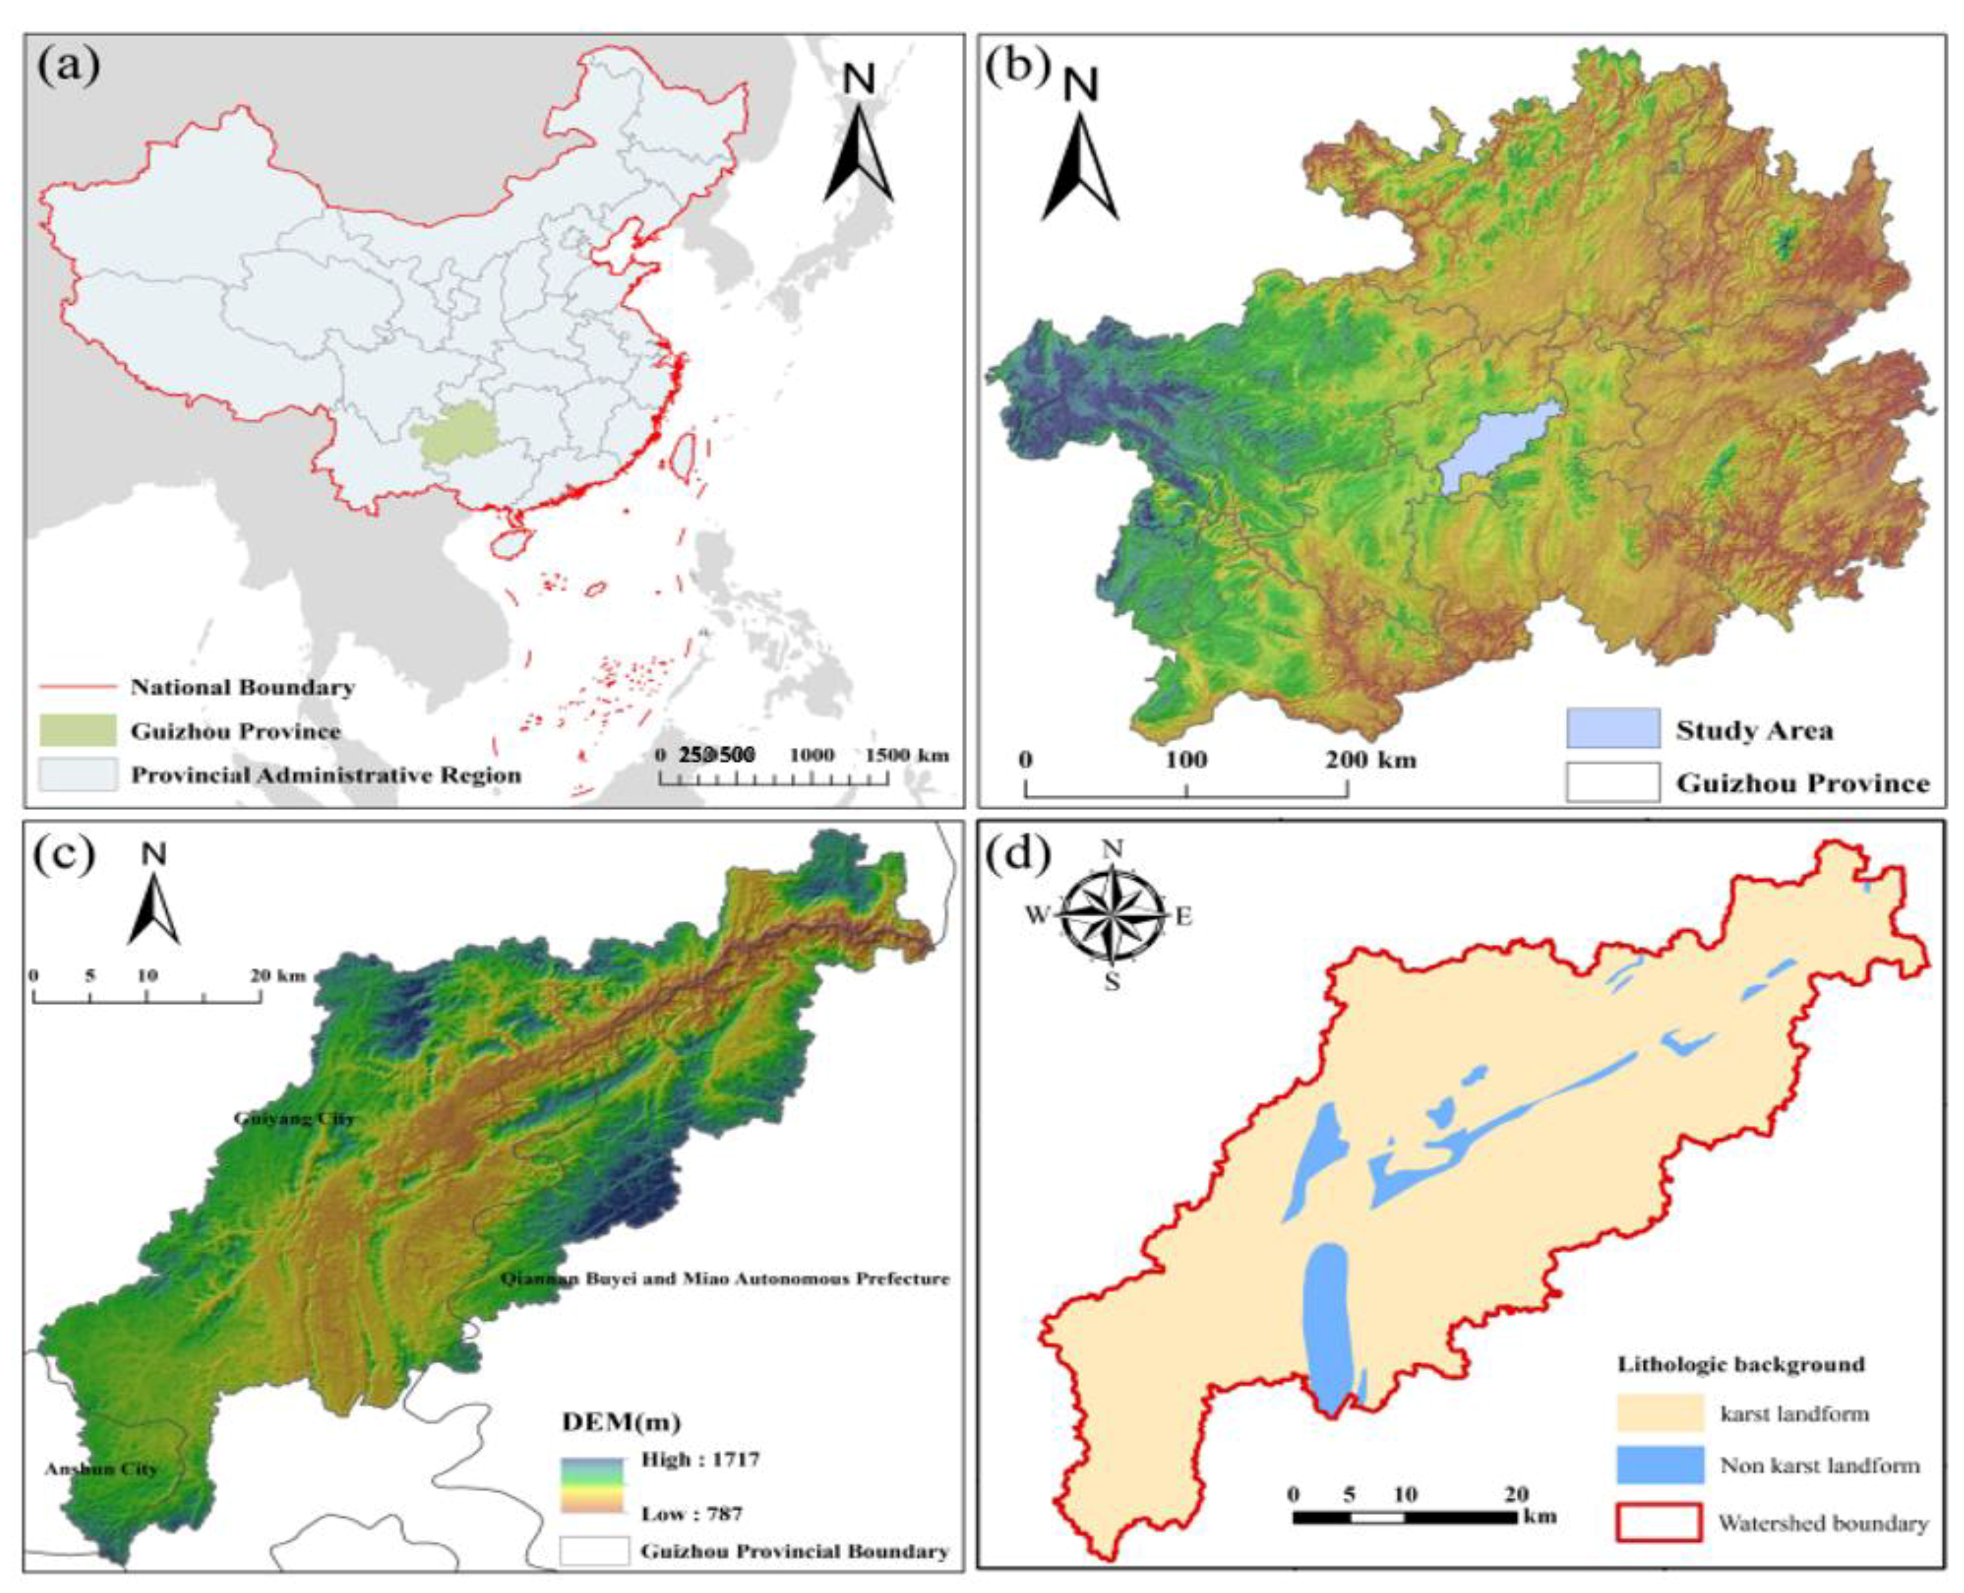
2.1. Study Area

The Nanming River Basin is a tributary of the Wu River in the Yangtze River system. This Nanming River Basin is an important part of the Yangtze River Economic Belt, which is located at the social, economic, and cultural center of Guizhou Province of 26°15′–26°54′ N and 106°26′–107°15′ E. The watershed covers approximately 2158 km2, and it is characterized by a subtropical monsoonal humid climate with an annual mean precipitation of 1200 mm. Meanwhile, its topographic is high in the southwest and low in the northeast, with an average slope drop of approximately 3.44. The karst landscape in the watershed is extremely developed; its soil is dominated by rice soil, limestone soil, and loam. The karst landscape comprises 93.17% of the study area (Figure 1).

2.2. Methods and Data Sources

2.2.1. Landscape Pattern Index Selection

The study combined previous studies that explored landscape characteristics of the basin [37,38,39], Patch Density (PD), and Patch Cohesion Index (COHESION) from the patch type level to reflect the degree of patch fragmentation in different landscape types. We also selected the Largest Patch Index (LPI) and Percentage of Landscape (PLAND) to identify dominant landscapes. The Patch Density (PD) and Contagion (CONTAG) were selected from the landscape level to reflect the degree of landscape fragmentation in the study area. Then, the Shannon Evenness Index (SHEI) and Shannon Diversity Index (SHDI) were selected to reflect the degree of landscape type diversification. The calculation formula and ecological significance of each index are detailed in the literature [40,41].

2.2.2. Moving Window Method

The moving window method in Fragstats 4.2 software was used to generate the landscape index raster map, and 1500 m was selected as the moving window radius after several calculations and comparisons [42].

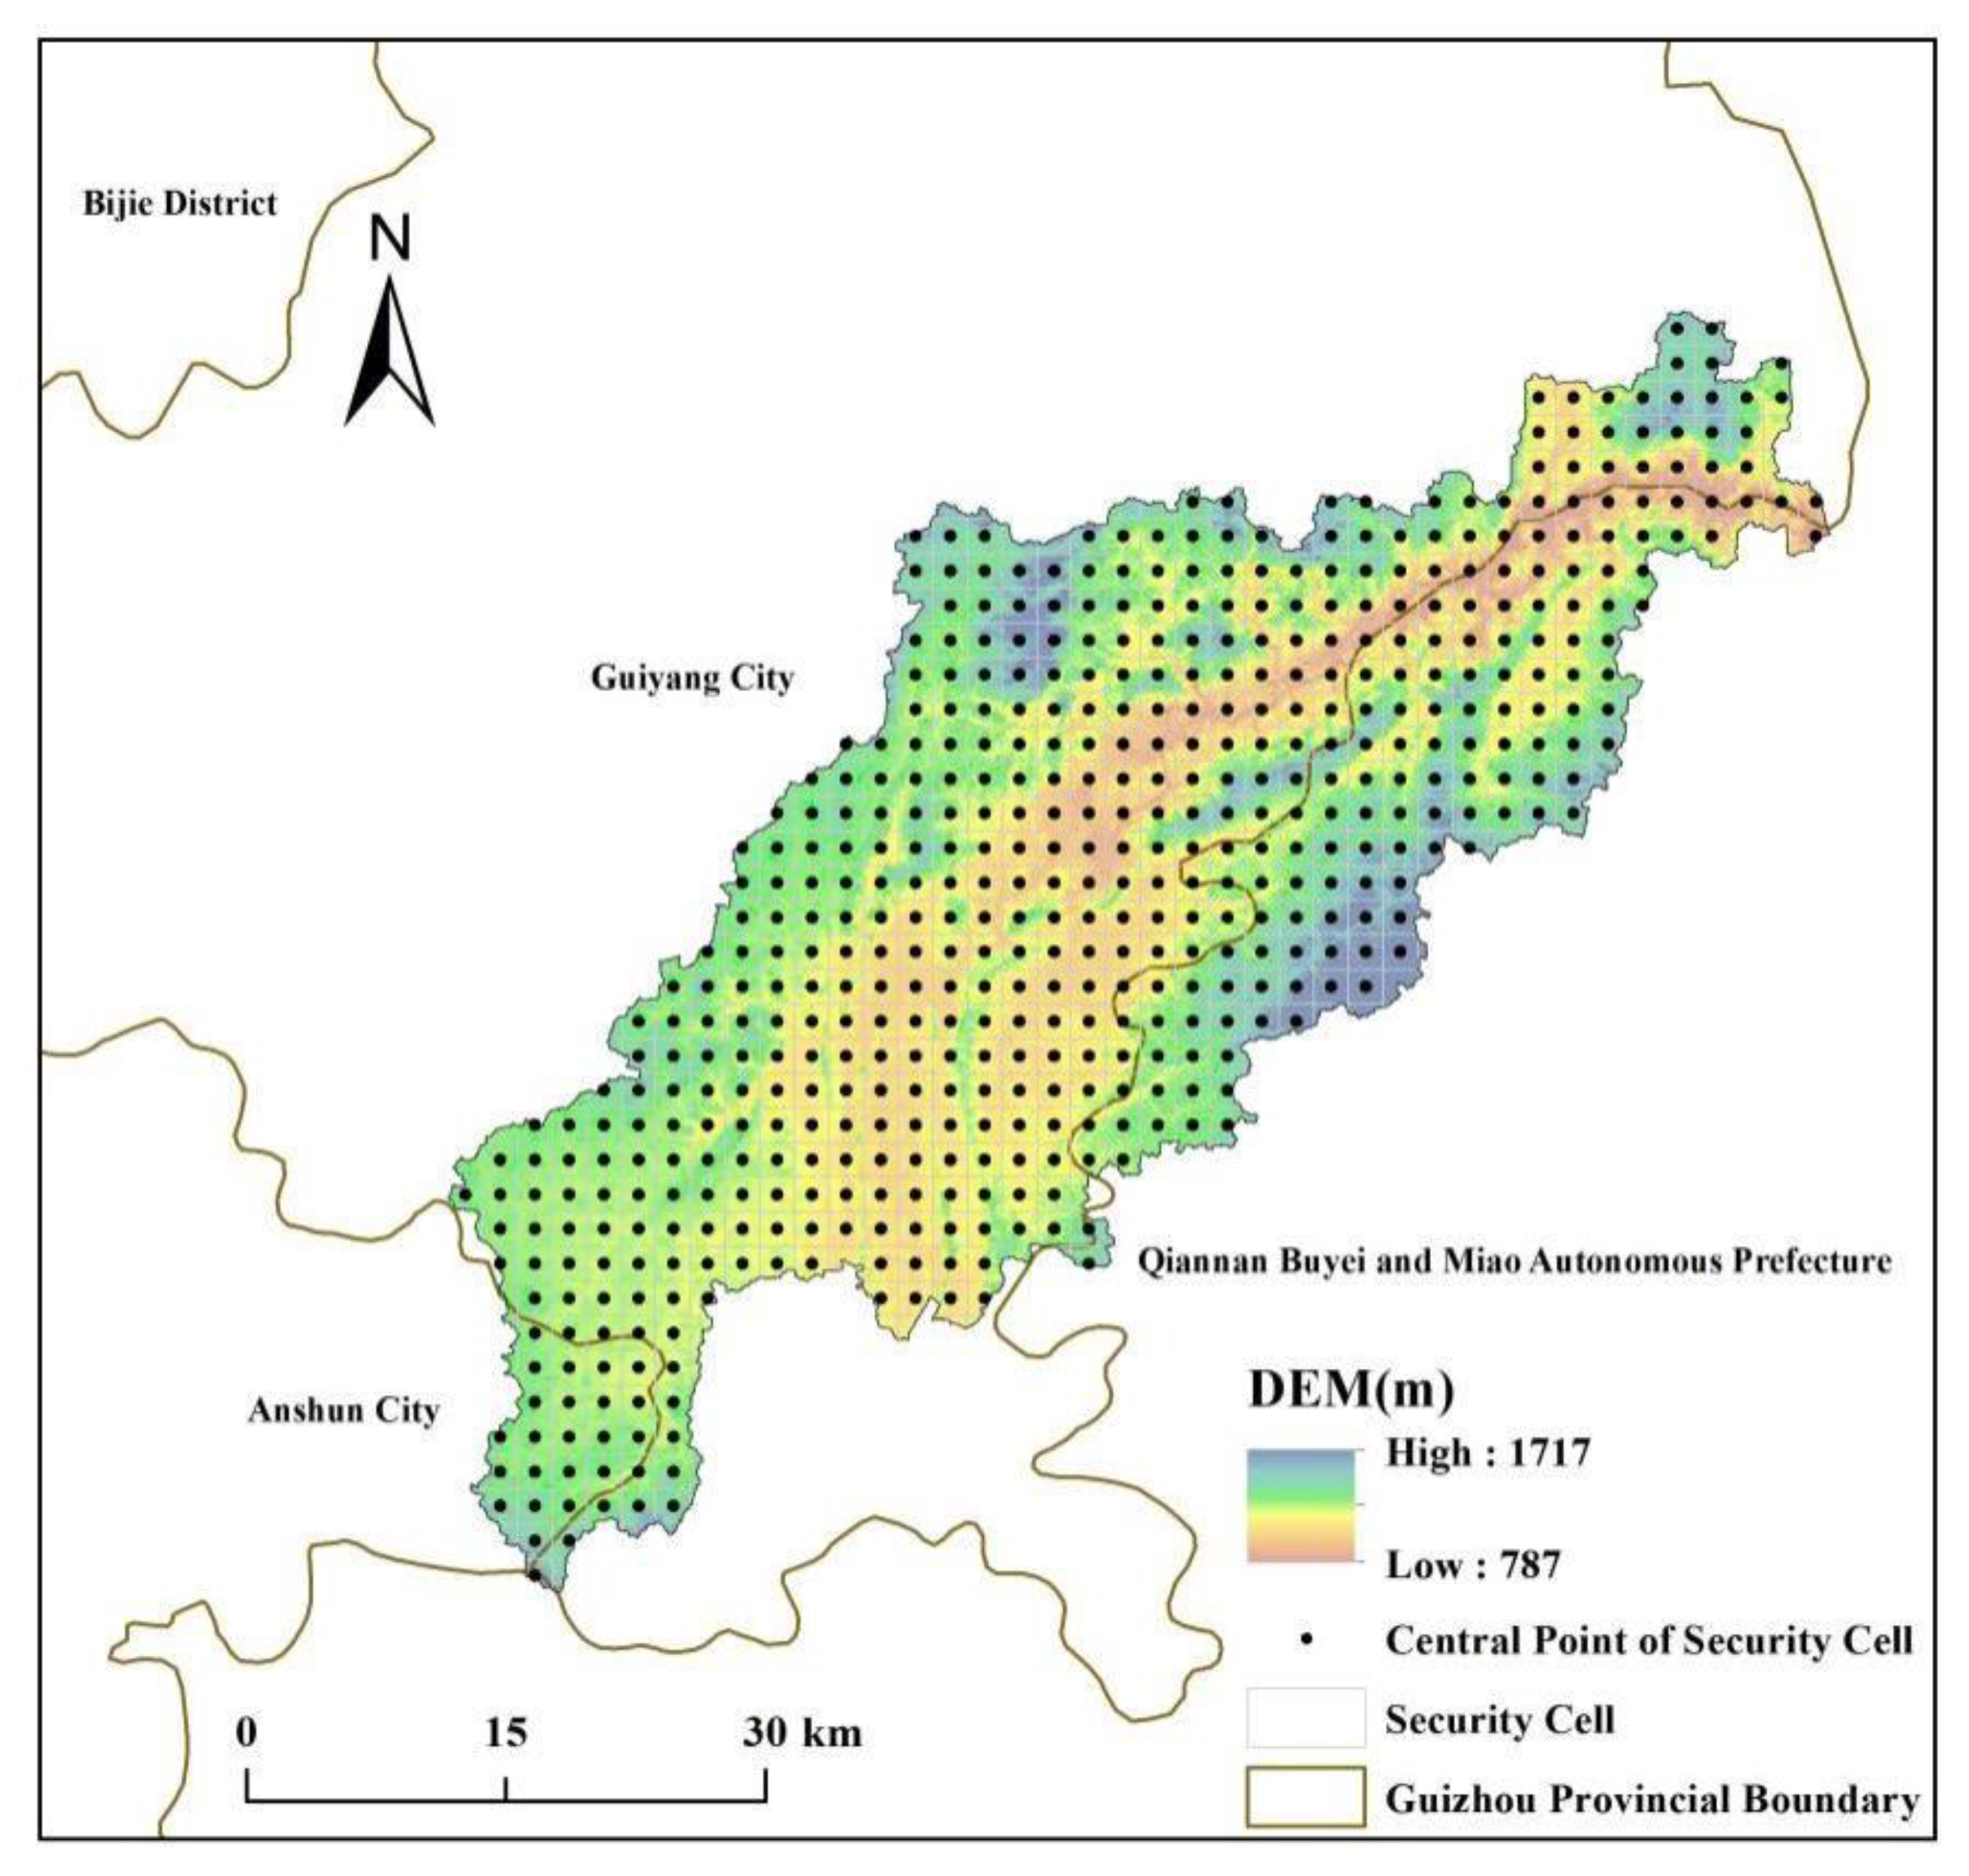
2.2.3. Determination of Evaluation Unit

Considering the scope of the Nanming River watershed and sampling workload, referring to existing studies [43], the watershed was divided into 2 km × 2 km evaluation units as ecological safety evaluation plots, with a total of 640 sampling areas. Based on this, the landscape ecological safety index of each plot was calculated separately (Figure 2).

2.2.4. Construction of the Landscape Ecological Security Index

The ecological safety index (ESIk) of the land use landscape was calculated based on the landscape disturbance index and vulnerability index [44]. The equations are as follows:
E S I k = i = 1 n A k i A k   ×   ( 1 10   ×   L D I I × L V I i )
L D I i = a C i + b H i + c F i
where ESIk in (1) is the landscape ecological safety index of the k-th evaluation unit, and a larger ESIk indicates a higher degree of ecological safety in the landscape and vice versa; LDIi is the index of landscape disturbance; and LVIi is the fragility index, based on the results of a previous study [45]. Each land use landscape fragility is specifically set to 5 levels: the value of constructed land is 1; a forest is 2; grassland is 3; cultivated land is 4, and water is 5. In this case, n is the number of landscape types; k is the number of evaluation units; Aki is the area of the class i landscape of the k-th evaluated cell; and Ak is the total area of the k-th evaluation cell. In (2), Ci is landscape fragmentation, and Hi indicates the diversity index. Fi denotes the number of watershed landscape sub-dimensions; a, b, and c are the weights of Ci, Hi, and Fi, respectively, which are assigned to 0.5, 0.3, and 0.2, following the existing research results and the conditions in the study area [46].

2.2.5. Spatial Autocorrelation Analysis

We used spatial autocorrelation analysis to detect the spatial agglomeration of regional geographical phenomena [47]. Global Moran’s I index was used to measure the overall spatial agglomeration characteristics of landscape ecological safety. The local spatial extent between regions was measured using the local Moran’s I index [48,49]. The equations are as follows:
Global   Moran s   I = n i = 1 n j = 1 m W i j ( x i x ¯ ) ( x j x ¯ ) i = 1 n j = 1 m W i j i = 1 n ( x i x ¯ ) 2
Local   Moran s   I i = ( n 1 ) ( x i x ¯ ) j = 1 n W i j ( x j x ¯ ) j = 1 n W i j ( x j x ¯ ) 2
where n is the number of grids; x ¯ is the average vulnerability in the study area; xi and xj are the attribute values of the i-th, j-th raster, respectively (i ≠ j), where i = 1, 2, 3, …, n; j = 1, 2, 3, …, m; Wij is the weight value; Wij = 1 when i and j are adjacent, and Wij = 0 when they are far apart.

2.3. Data Sources

Landsat TM satellite 2000 images, 2010 images, and Landsat 8 satellite images of 2020 were used as the base data, which were obtained from the Geospatial Data Cloud platform (http://www.gscloud.cn/ accessed on 10 September 2022) with a spatial resolution of 30 m. First, the ENVI 5.3 software is used to pre-process the remote sensing images, such as geometric correction [50], atmospheric correction [51], and image enhancement [52], to complete the preparation and processing of fundamental geographic data. Second, a combination of supervised classification and human–computer interaction [53] was used to interpret and decipher the land use data into the waters, cultivated land, grassland, forest land, and constructed land according to the actual state of the watershed, which was not accounted for in the land use classification due to the tiny amount of unused land in the Nanming River watershed. Finally, the confusion matrix was utilized to rectify and validate the correctness of the results after land use classification [54], and the overall classification accuracy surpassed 85%, indicating that it could meet the analysis goals of this study. Furthermore, we obtained land use status maps for the study region in 2000, 2010, and 2020.

3. Analysis and Results

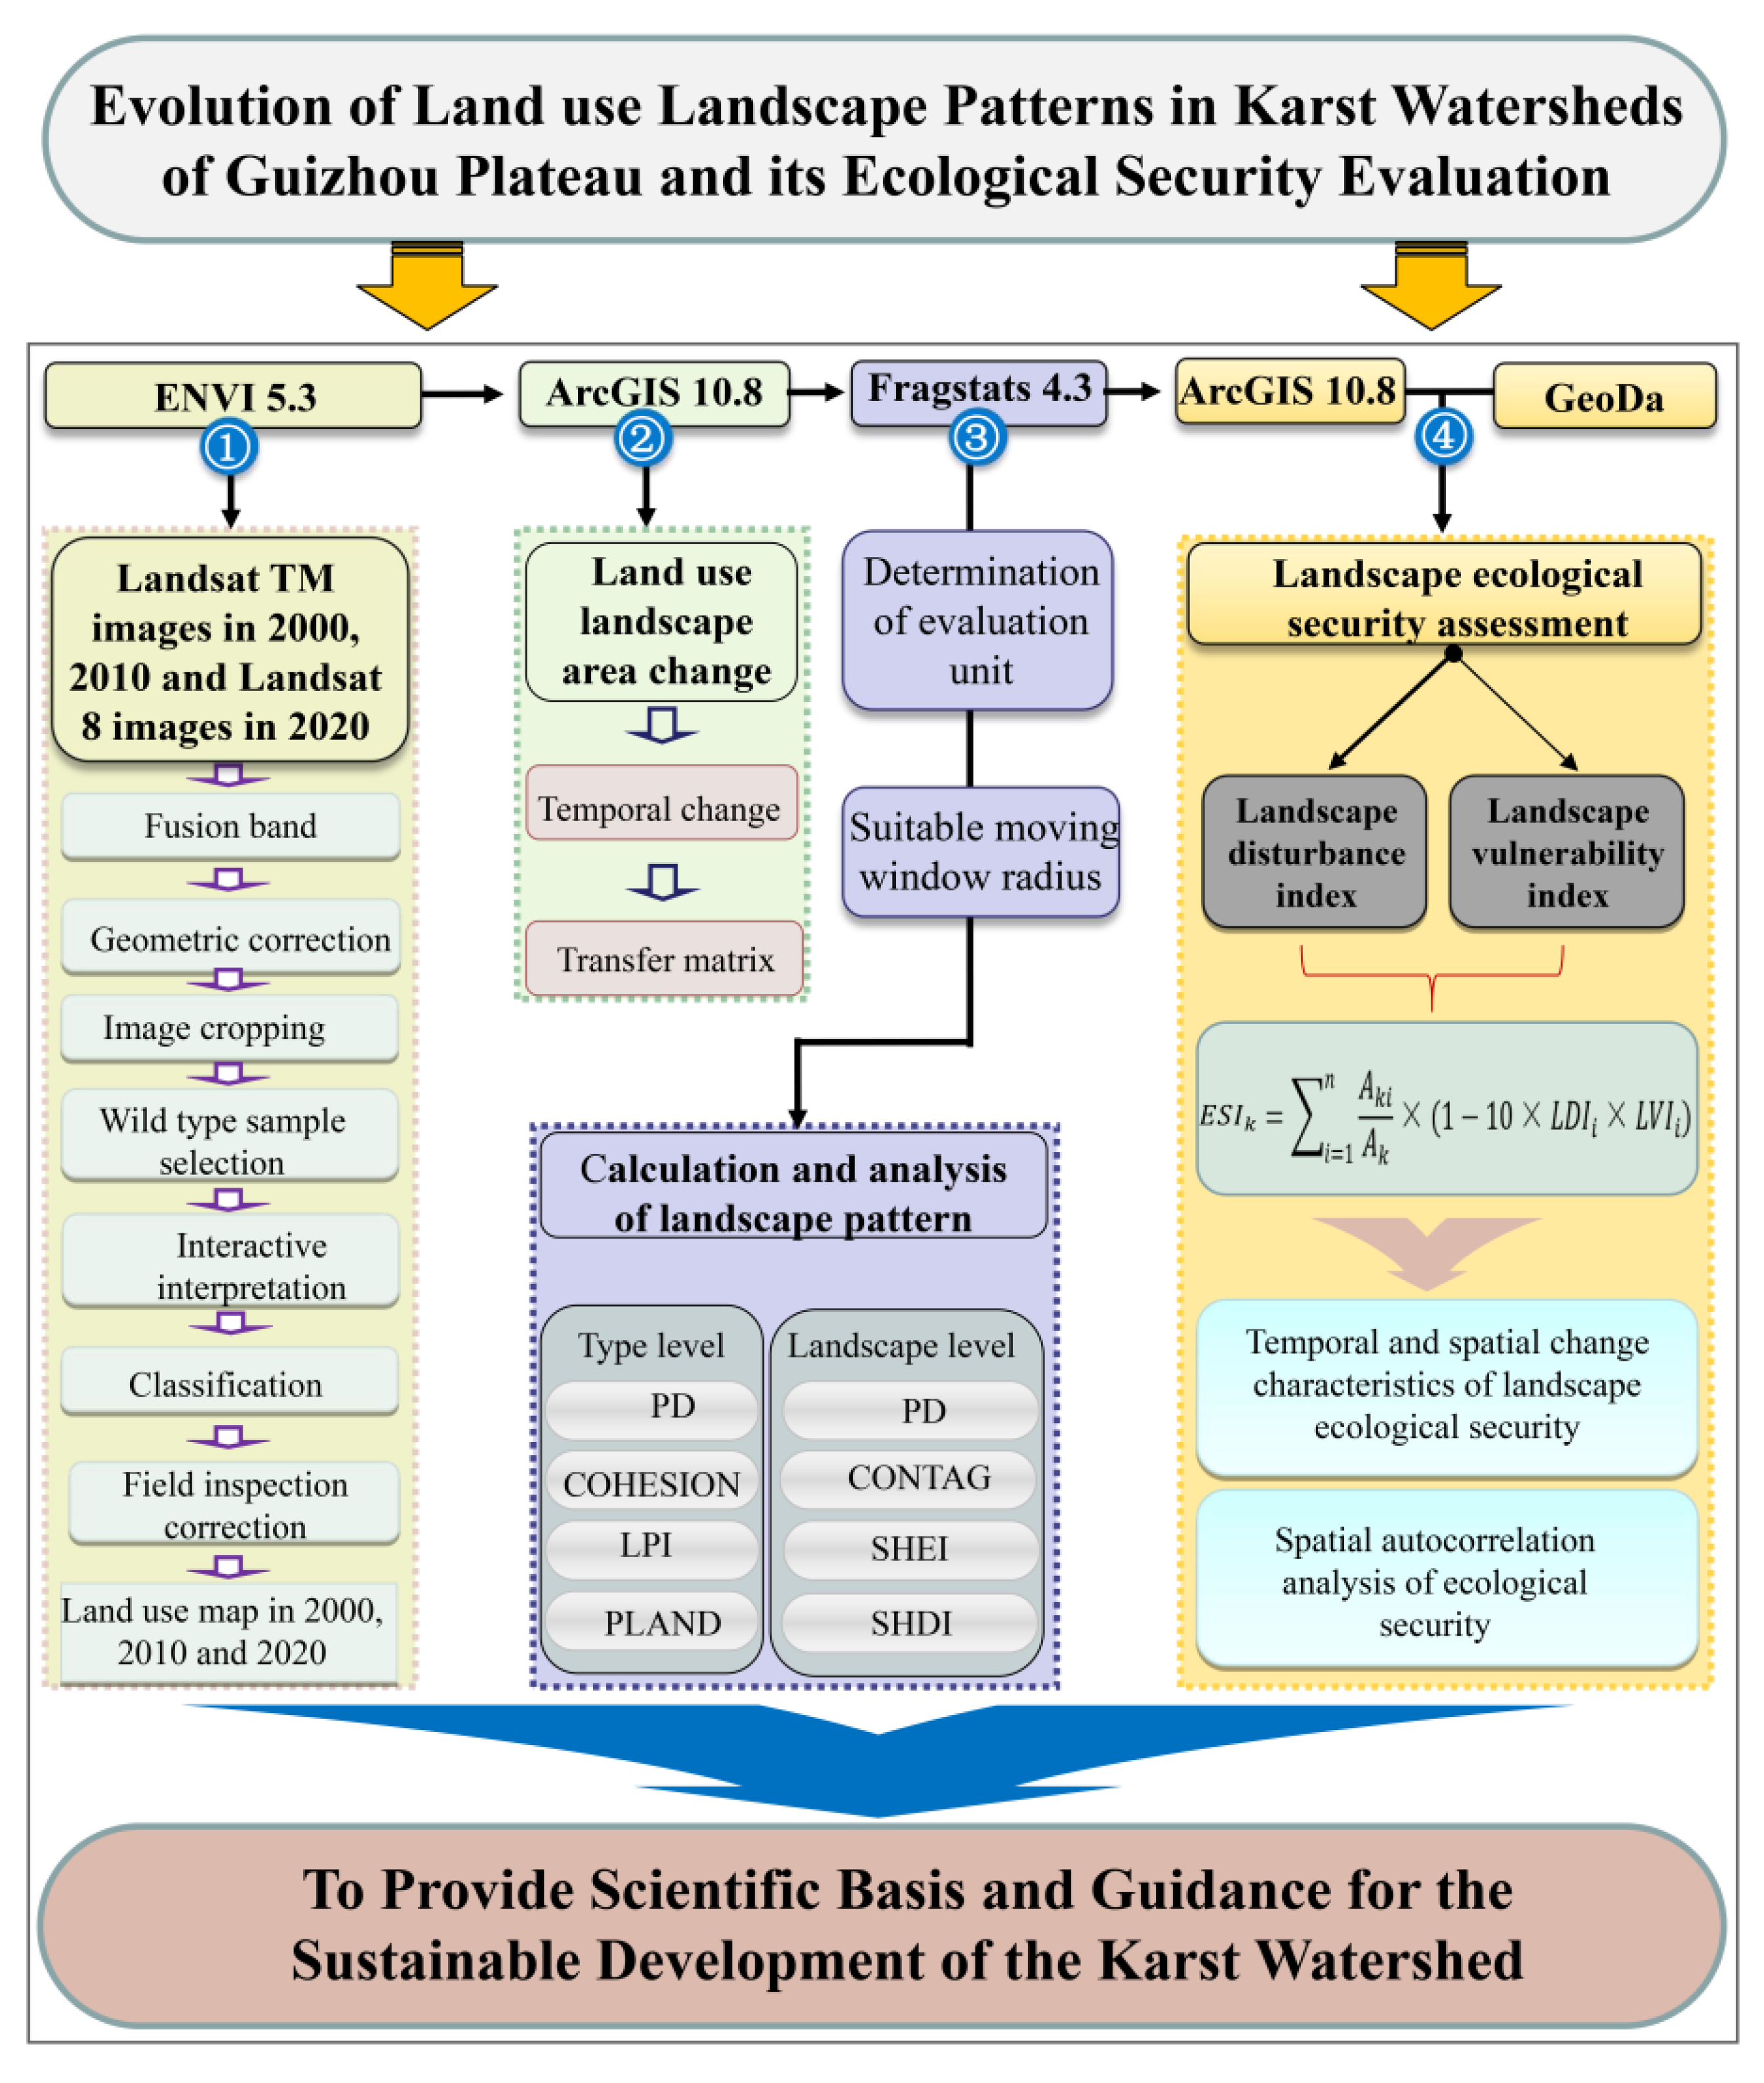
3.1. Research Framework

The changes in the characteristics of land use landscape were analyzed from 2000 to 2020 using GIS and RS technology. We also analyzed changes in the land use landscape pattern index from landscape patch scale and landscape scale. ArcGIS and landscape pattern index methods were used to construct the landscape ecological security index and to analyze the spatial and temporal variation mode of landscape pattern evolution and its ecological security (Figure 3).

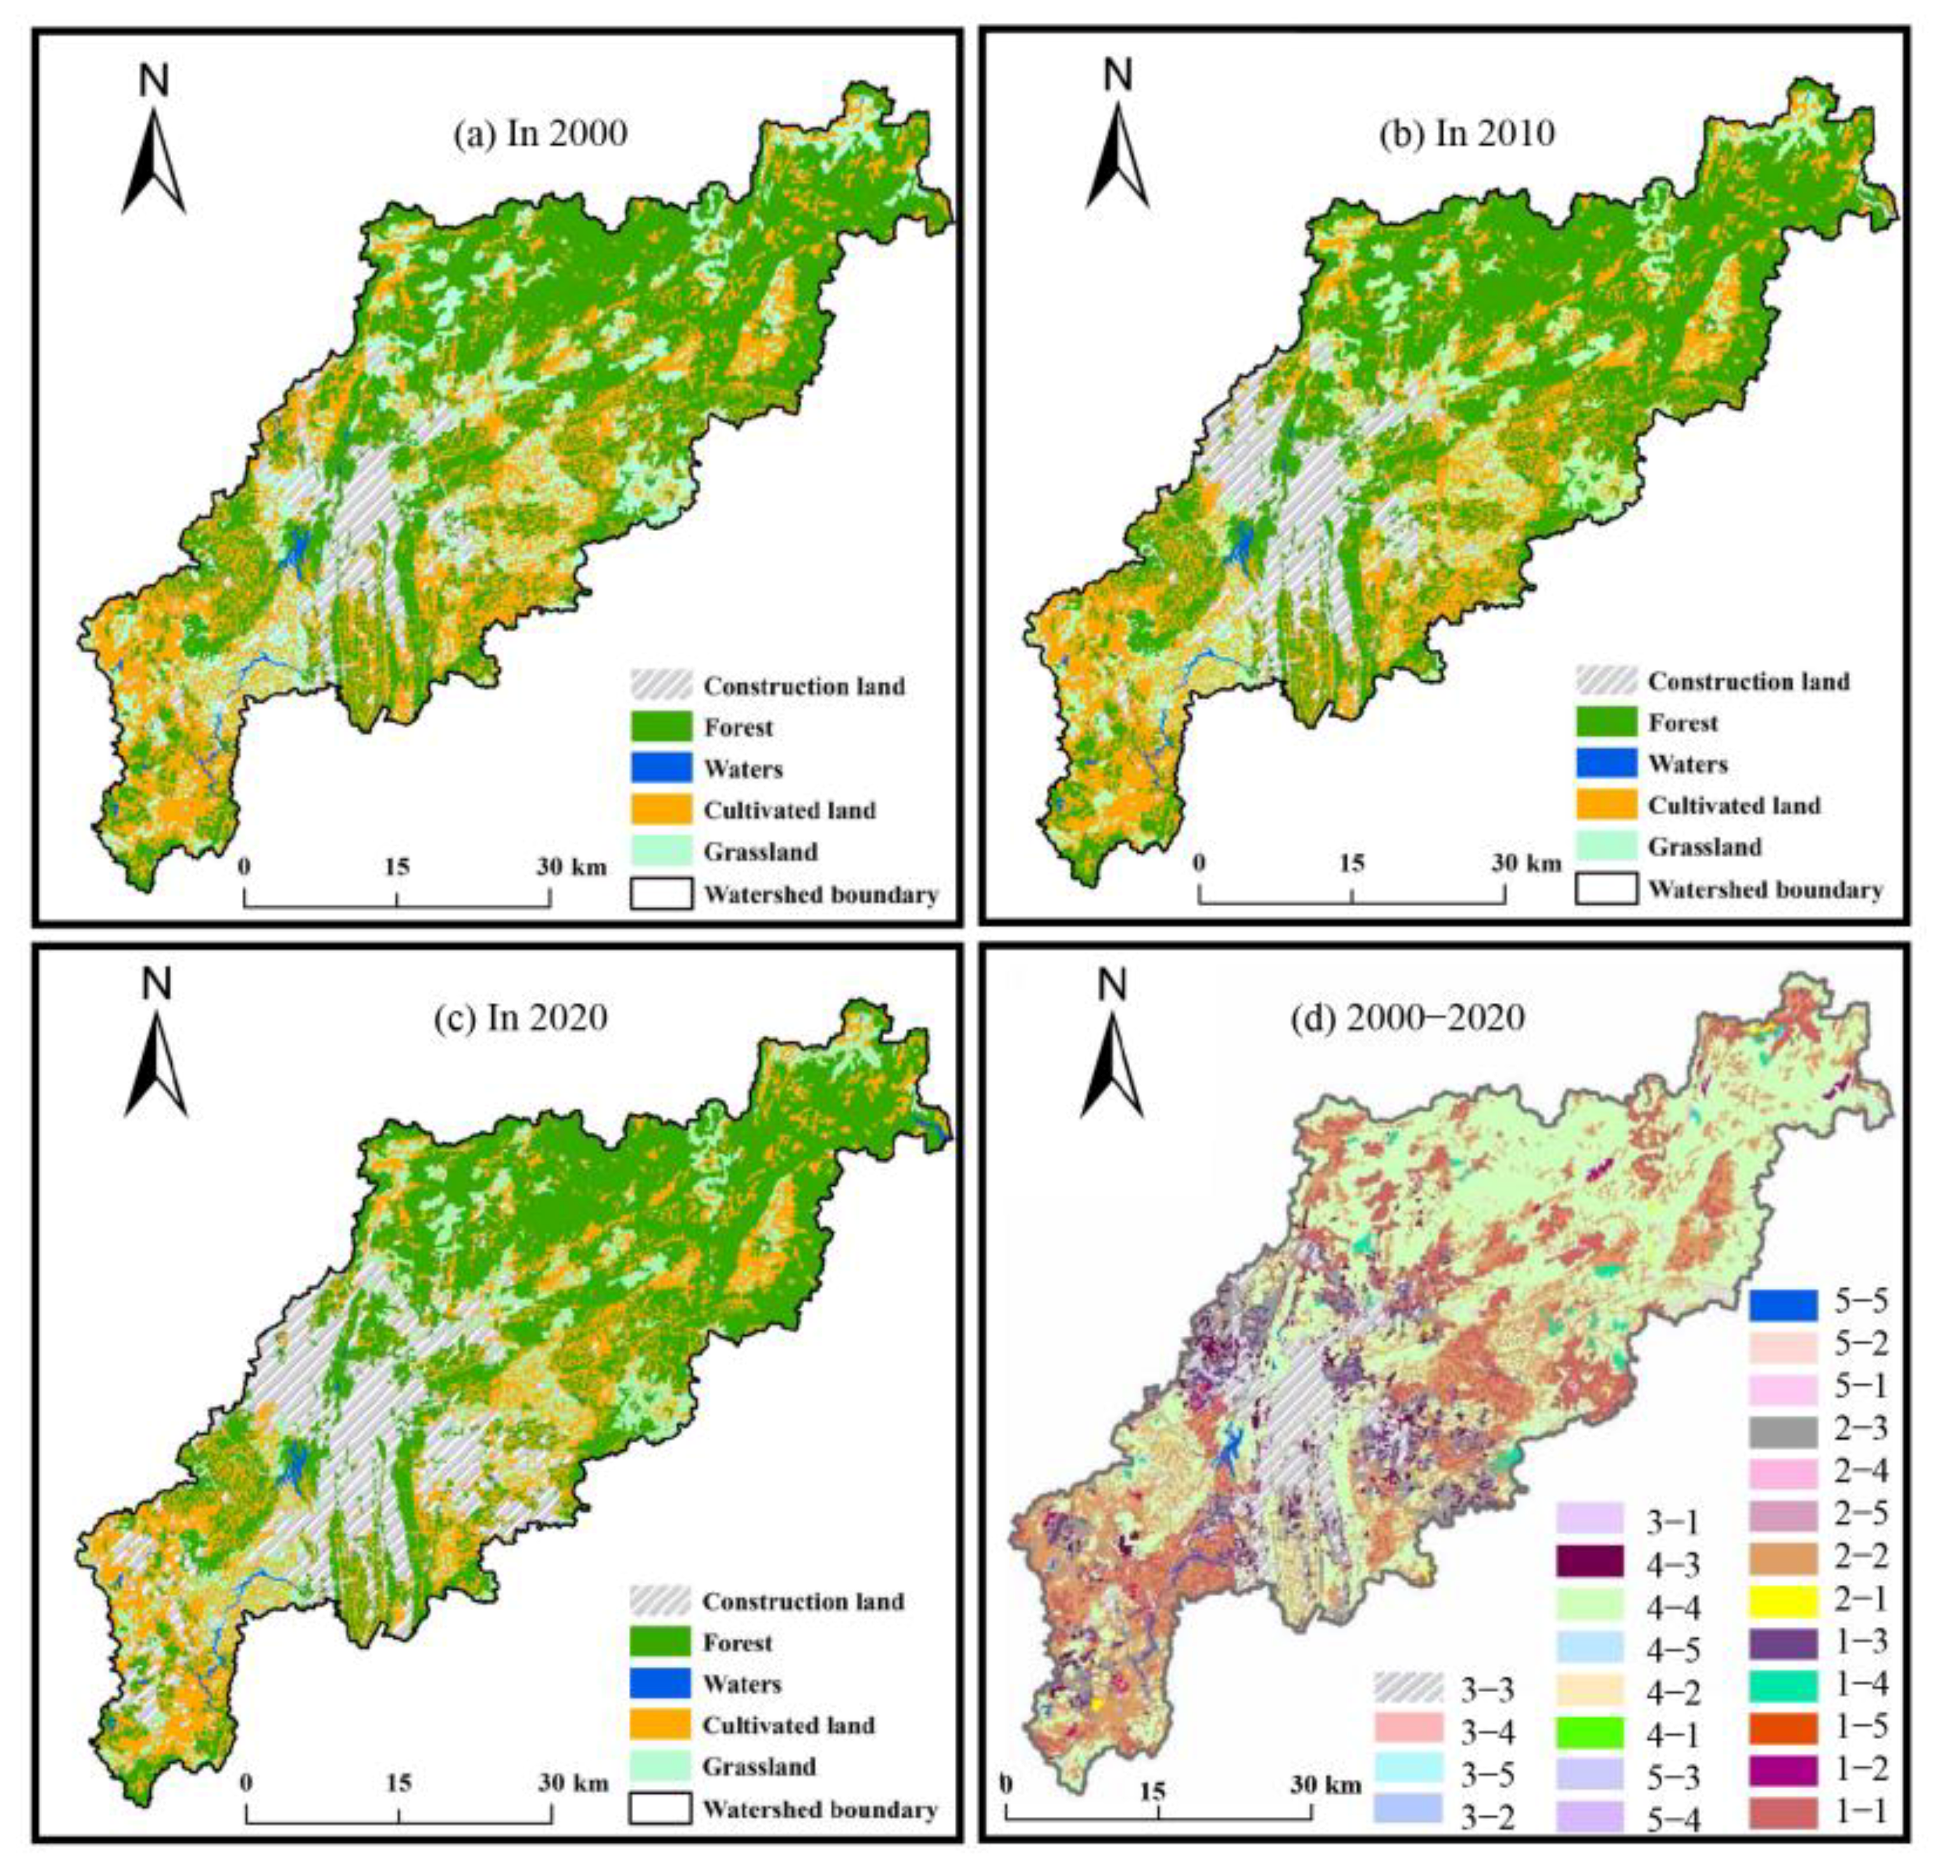
3.2. Analysis of the Characteristics of Land Use Landscape Area Change

Land use changes were influenced by the expansion of constructed land and loss of cultivated land in 2000–2020 (Figure 4) because of the influence of strong urban development activities. During this period, the cultivated land flowing to constructed land accounts for 36.48% of the landscape in the watershed. By 2020, constructed land accounted for approximately 20% of the watershed area, which was 2.31 times the shared area in 2000. After analyzing the changes in the land landscape in each period with the help of the land use transfer matrix, constructed land recorded the largest growth rate of 130.72% from 2000 to 2020. However, the proportion of grassland and cultivated land was decreasing, and the proportion of forest showed an increasing trend at first but later showed a decreasing trend. With the growth in urbanization, the Nanming River Basin has undergone a dynamic process of changing from natural to unnatural landscapes, indicating that the impact of human activities on the ecosystem of the watershed is more intense. This shows that the Nanming River Basin has undergone continuous economic development in the past 20 years since 2001.

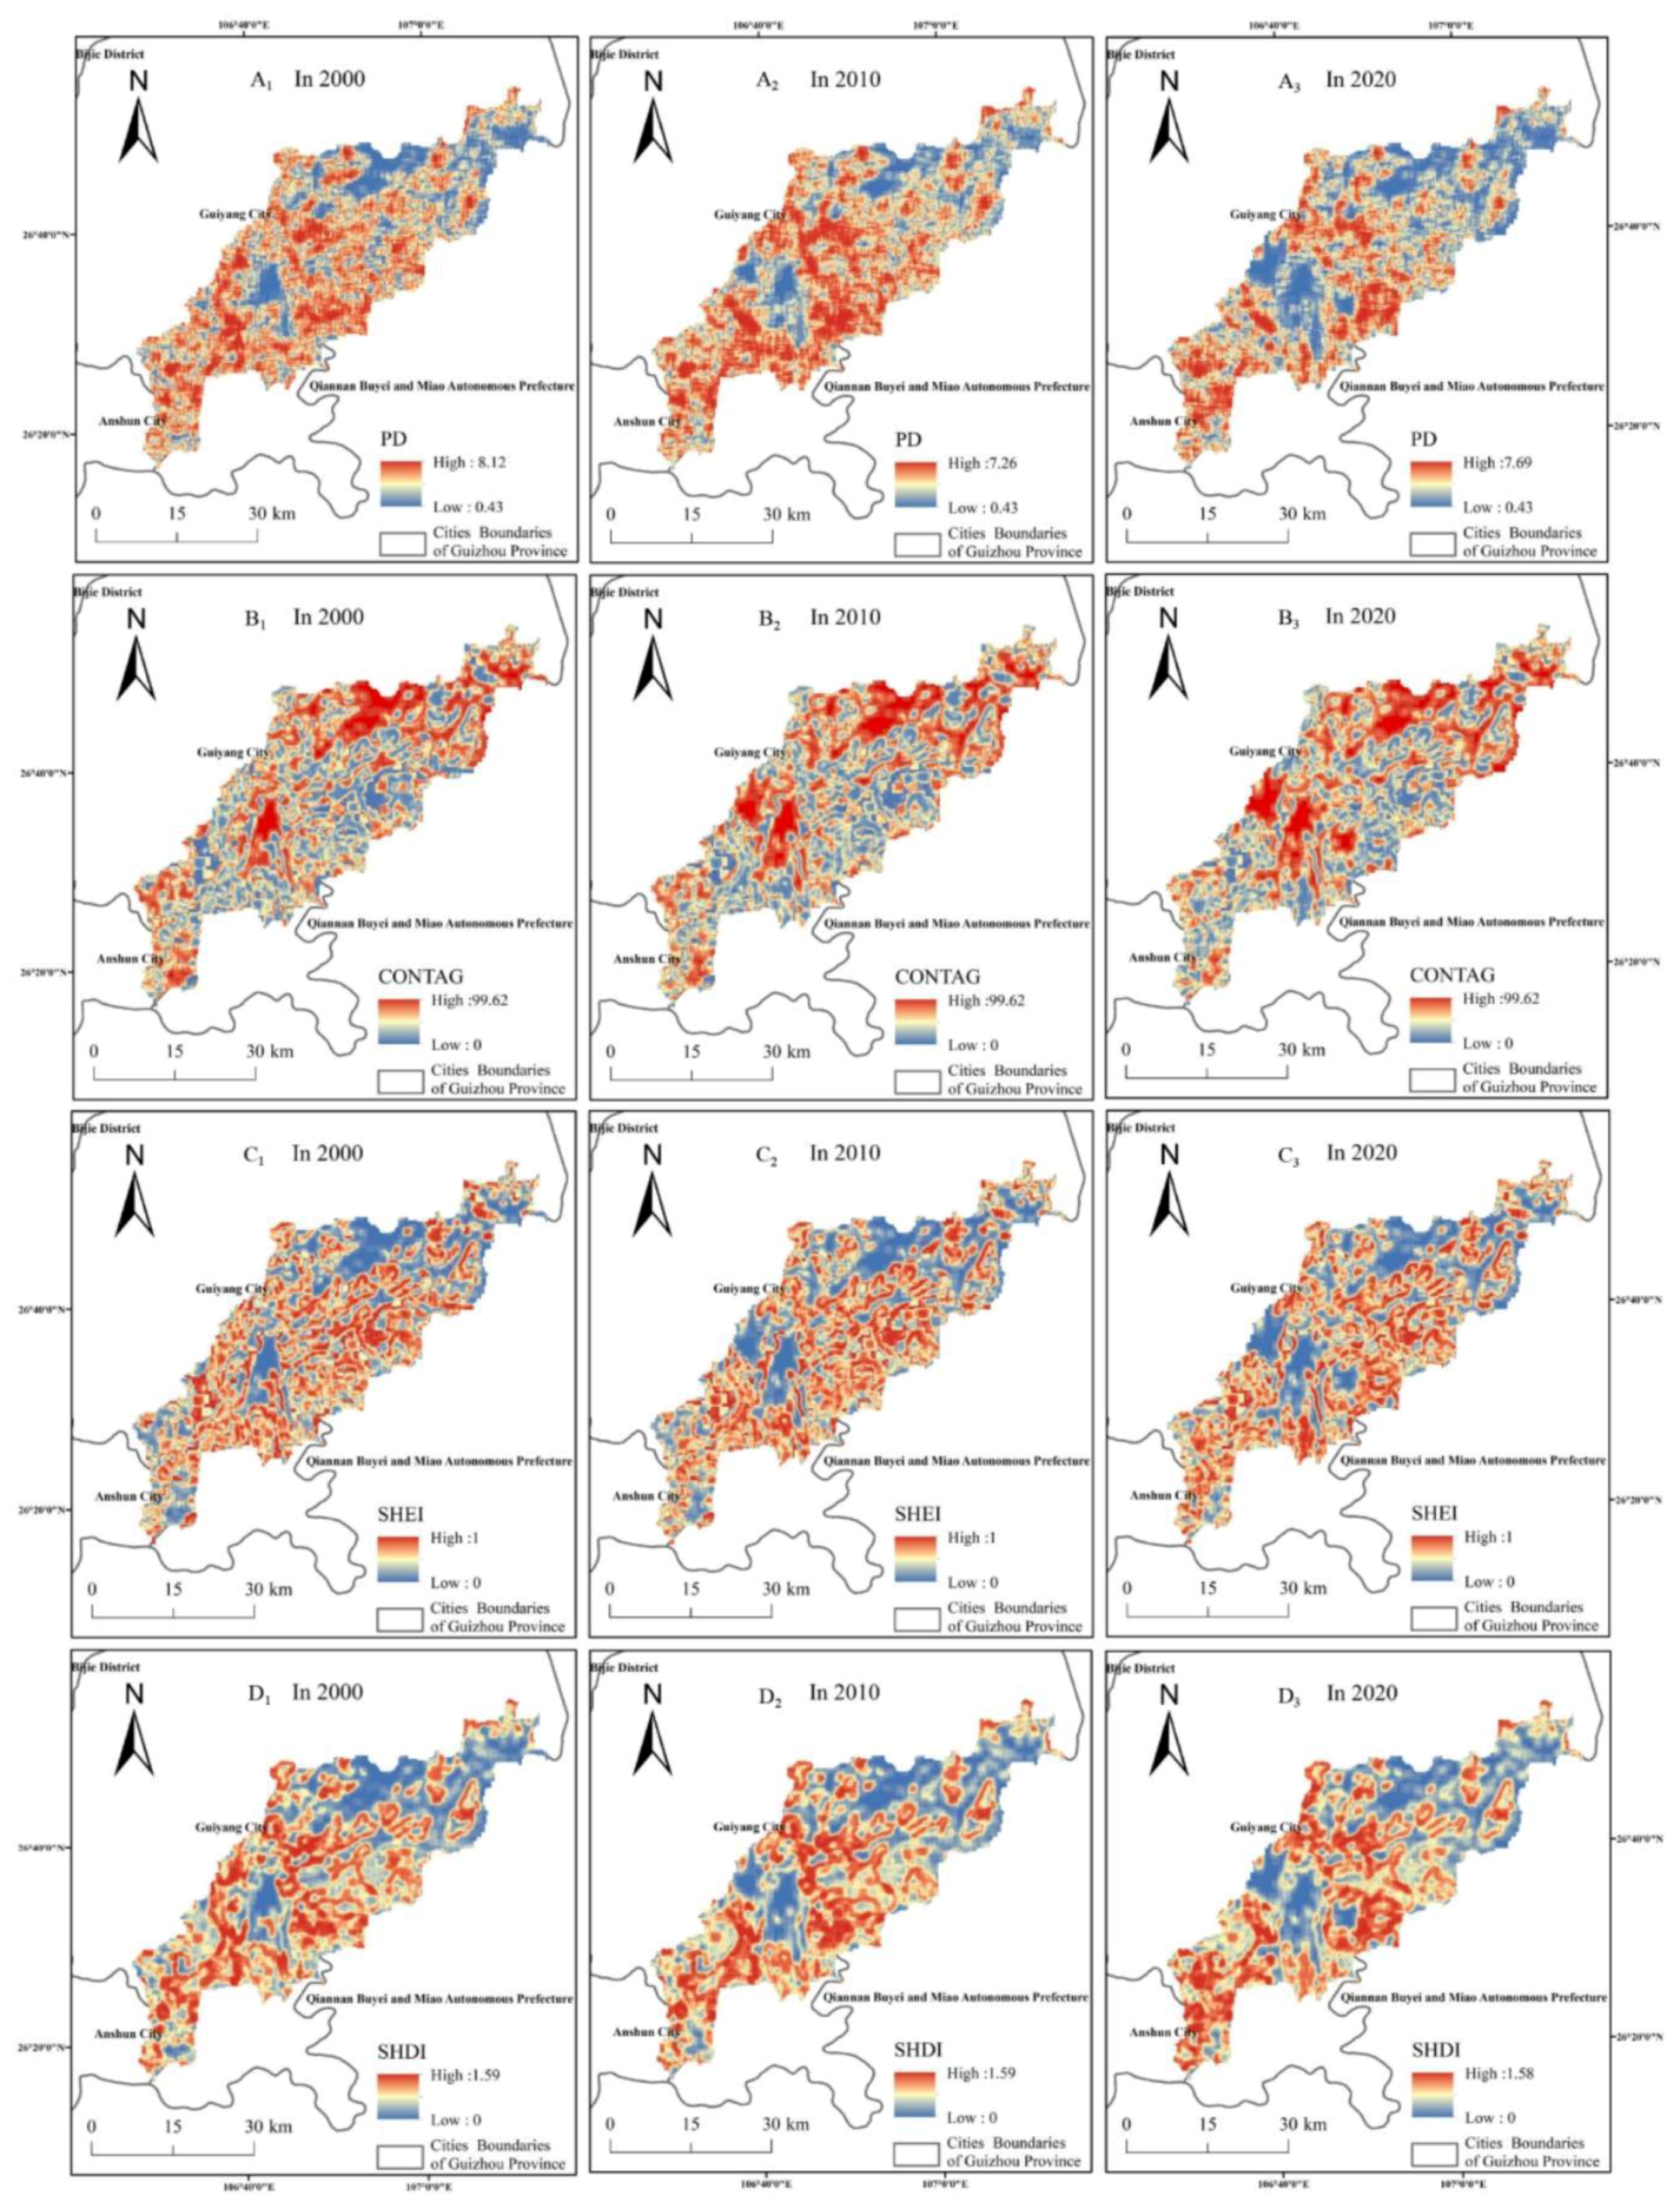
3.3. Analysis of Spatial and Temporal Changes of Landscape Pattern Index

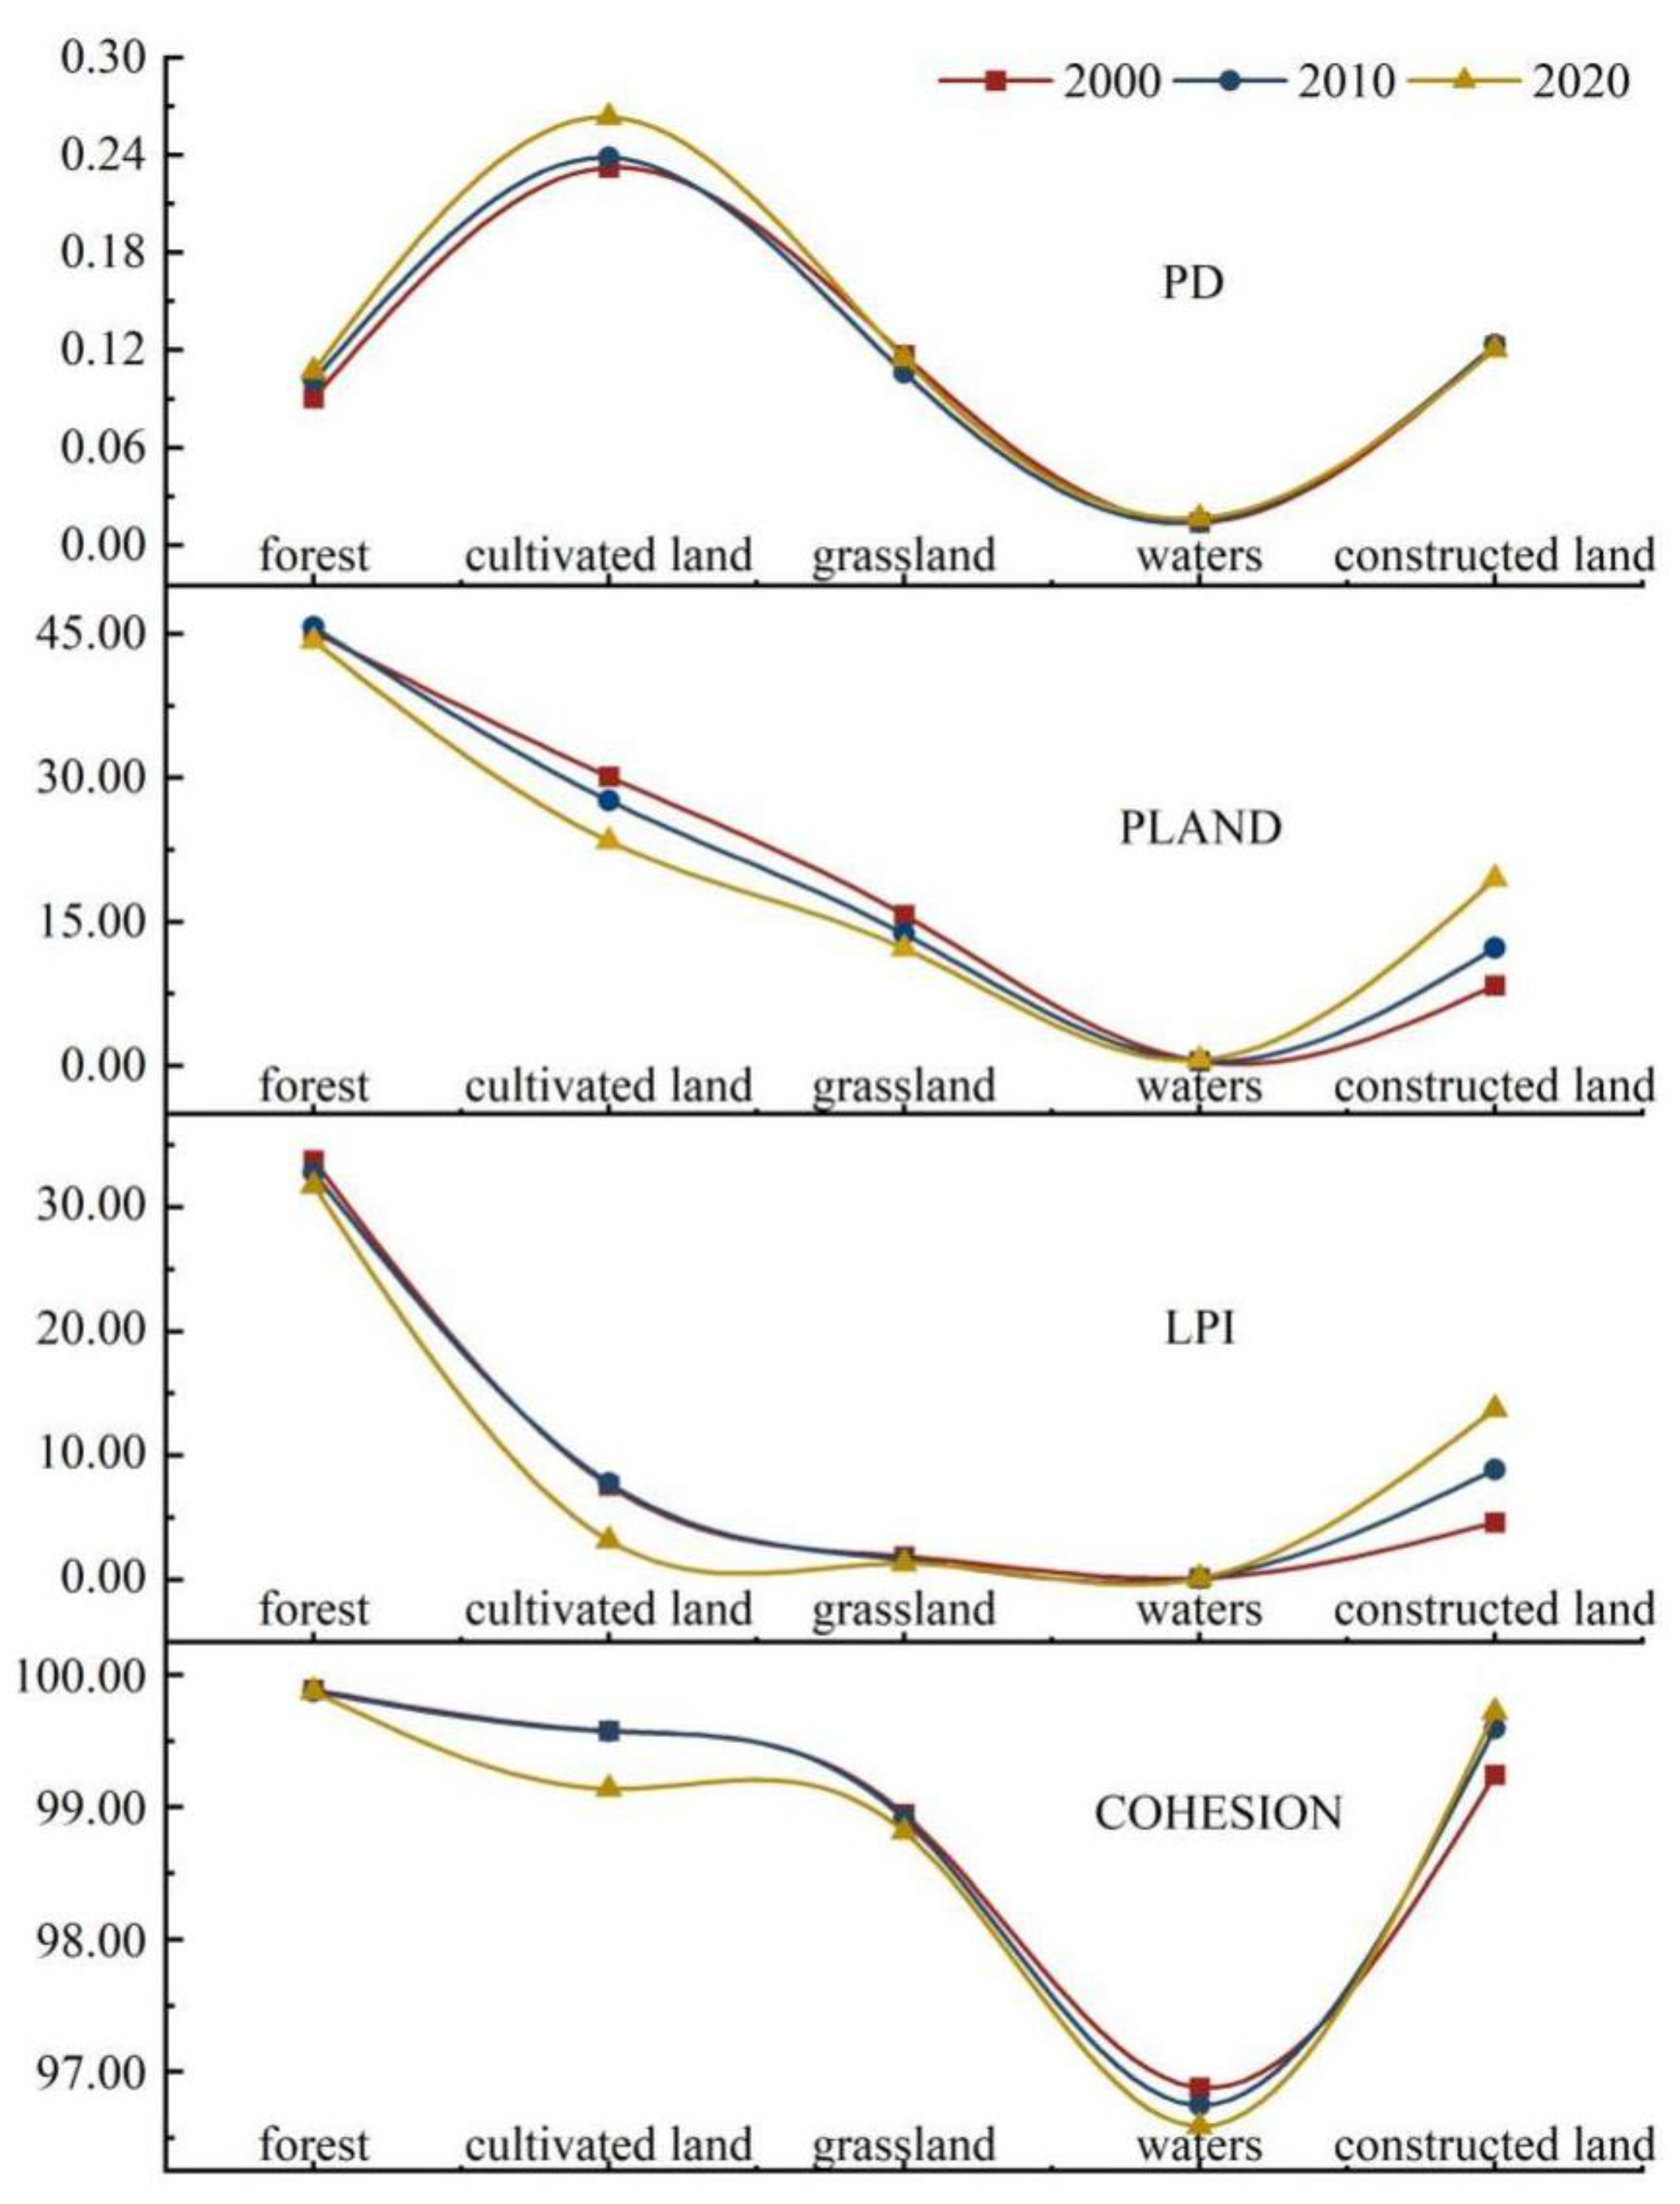
3.3.1. Analysis of Landscape Pattern Index Change on Patch Type Scale

As shown in Figure 5, the PD of the cultivated land is the largest among all land types, with a mean value of 0.24. This shows that the cultivated land has a profound influence on the landscape pattern of the Nanming River Basin. From 2000 to 2010, the PD of the forest, cultivated land, and constructed land increased. However, the PD of grassland showed a decreasing trend from 2010 to 2020. Except for the constructed land, the PD of the forest, constructed land, grassland, and water showed an increasing trend. The human ecological footprint has had a greater impact on the forest and cultivated landscapes over the past 20 years. Moreover, their ecological processes were more active, in which the expansion of the constructed landscapes was reasonably restrained during 2010–2020.
Among the landscapes in the watershed, the mean of the PLAND of the forest is the maximum of approximately 45.08%, which is about 28 times that of the smallest PLAND (waters), indicating that the forest offers more advantages in the landscape. This result agrees with the results of the spatial characterization of land use described above. From 2000 to 2010, the forest area and constructed land patches showed an increasing trend. From 2010 to 2020, the PLAND of the constructed land increased by 19.53%, which was 12% more than that of 2000. Nevertheless, the constructed land patches experienced continuously increasing trends during the study period. Since 2001, Nanming River Basin experienced comprehensive environmental improvement, which includes increasing projects on cultivated land, forest, and the construction of a comprehensive landscape on both sides of the river. With a rise in urbanization, a large construction continues to expand to the periphery of the city. However, patches of cultivated land and grassland continue to decline.
From the LPI, the LPI of the forest land far exceeds that of other land types, indicating that forest is the major land substrate in the watershed. From 2000 to 2020, the LPI of constructed land continues to increase.
From the COHESION, the patch cohesiveness of the forest and constructed land is higher, indicating that the natural connectivity of these two types of land is efficient, and the distributions are patchy in spatial distribution. From 2000 to 2020, the COHESION of cultivated land, grassland, and waters generally declined, whereas the COHESION of constructed land continued to increase, reaching 35% from 2000 to 2010, which was three times that of 2010–2020. With large-scale land exploitation, the distribution of patches of cultivated land, grassland, and water fragments go through aggregation to fragmentation, with a decrease in the natural connectivity of the landscapes. However, the patches of constructed land gradually turn into aggregated blocks of spatial distribution.

3.3.2. Analysis of the Landscape Pattern Index Change on Landscape Scale

As shown in Figure 6, the PD and CONTAG have a more pronounced geographical variability. The CONTAG increased significantly in the southwestern part of the basin, and the PD was high in most of the northeastern part of the basin. Moreover, the spatial distribution of the CONTAG in these areas showed the opposite PD characteristics. We found that the high-value areas of CONTAG are concentrated in the urban center of Guiyang City, owing to its simple landscape structure, its constructed land as the matrix land, and a high degree of agglomeration, which greatly reduces the fragmentation of the landscape patches. Moreover, the low-value areas comprise the interspersed distribution of cultivated land, constructed land, and grassland, consisting of an intricate landscape structure with a high degree of landscape fragmentation in the watershed. The lower stream of the basin, at Wudang and Longli, has a lower level of landscape diversity, indicating that human activities in this area are infrequent, and the development is low. The SHEI and SHDI in the basin have similar spatial variations. In the southern part of Nanming District and the eastern part of Guanshan Lake District and Yunyan District upstream, the SHEI and SHDI have decreased significantly with a rise in urbanization and an increase in the project construction, which have become the main advantages of the landscape.

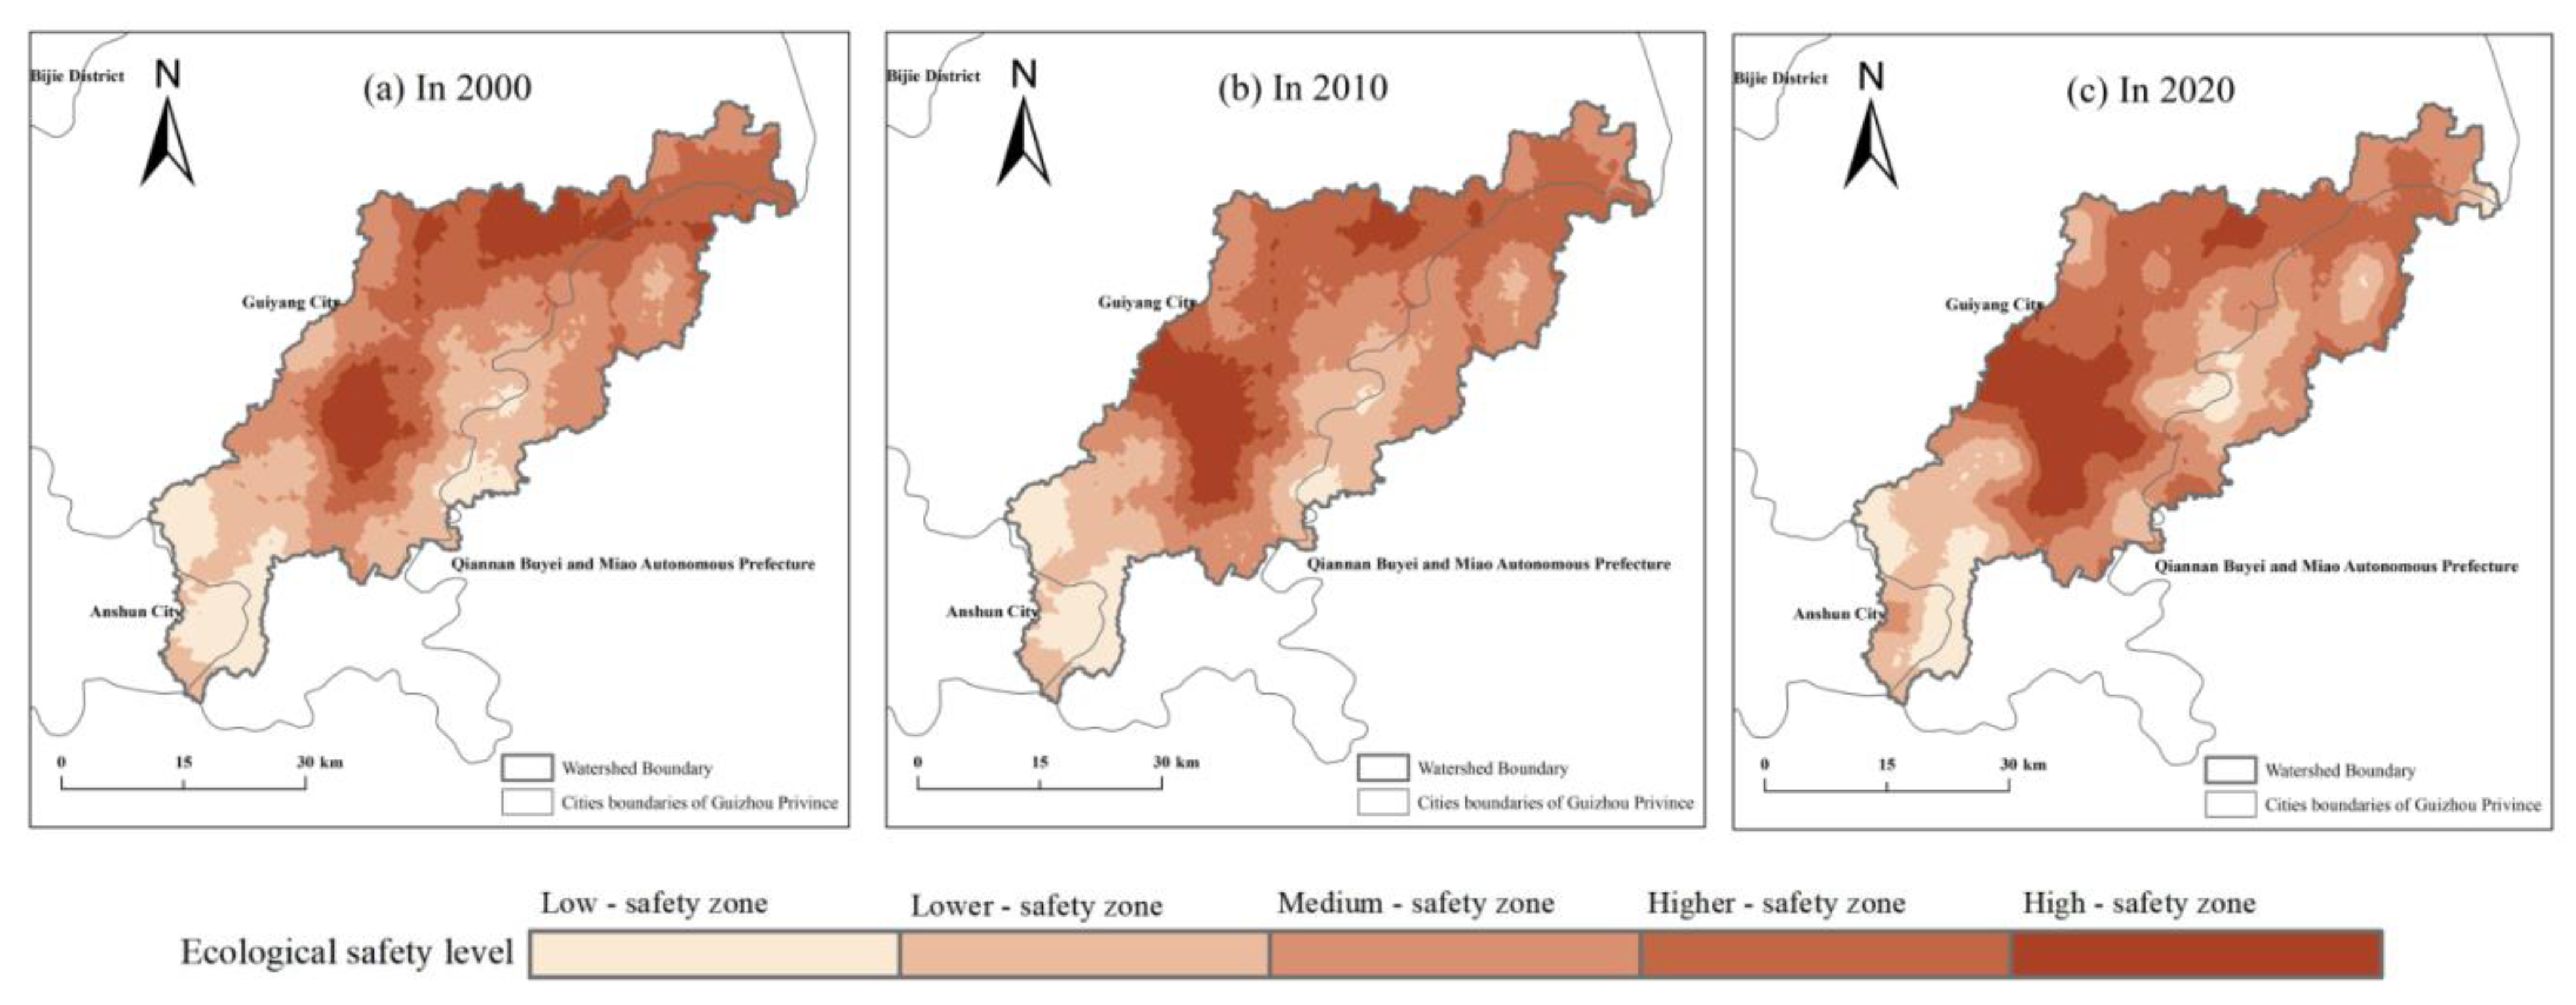
3.4. Landscape Ecological Safety Evaluation

3.4.1. Landscape Ecological Safety Changes of Nanming River Watershed

The ecological safety index of the Nanming River Basin was divided into five classes (refer to related studies regarding each grade [55]). As shown in Figure 7 and Table 1, the overall landscape ecological safety shows a continuous positive trend in the last 20 years. The medium ecological safety zone is the largest area. The low-security area is concentrated in the southwest part of the watershed, which is characterized by a farming economy, underdeveloped economy, extensively cultivated land, and interspersed distribution of grassland, forest, and waters, which destroys the stability of the landscape. Driven by urbanization, a large patch of arable land is used for infrastructure construction to improve the standard of living. The construction of residential housing is increasing on the large arable land, leading to a rise in the landscape ecological risk. However, the low-security areas decline by about 25% in 2020. The shrinkage rate in the lower security zone was 11.13%. Spatially, the constructed land is connected to patches. The patches also converge and shift to the middle-security zone, revealing a gradual increase in ecological security. The higher security zone is increasing yearly, which is mainly concentrated in the northern part of the watershed, showing that the forest offers advantages to the landscape. Despite the recent government’s policy of encouraging people to return to cultivated land, the forest has not yet been encroached upon by other landscape types, providing policy support to maintain a higher security-level state. The trend of a high-security zone is increasing, which is distributed in the center of Guiyang City and at a lower elevation at the watershed. With the obvious landscape advantages and contiguous urban housing, this area has become a stable landscape structure and has low landscape fragmentation.

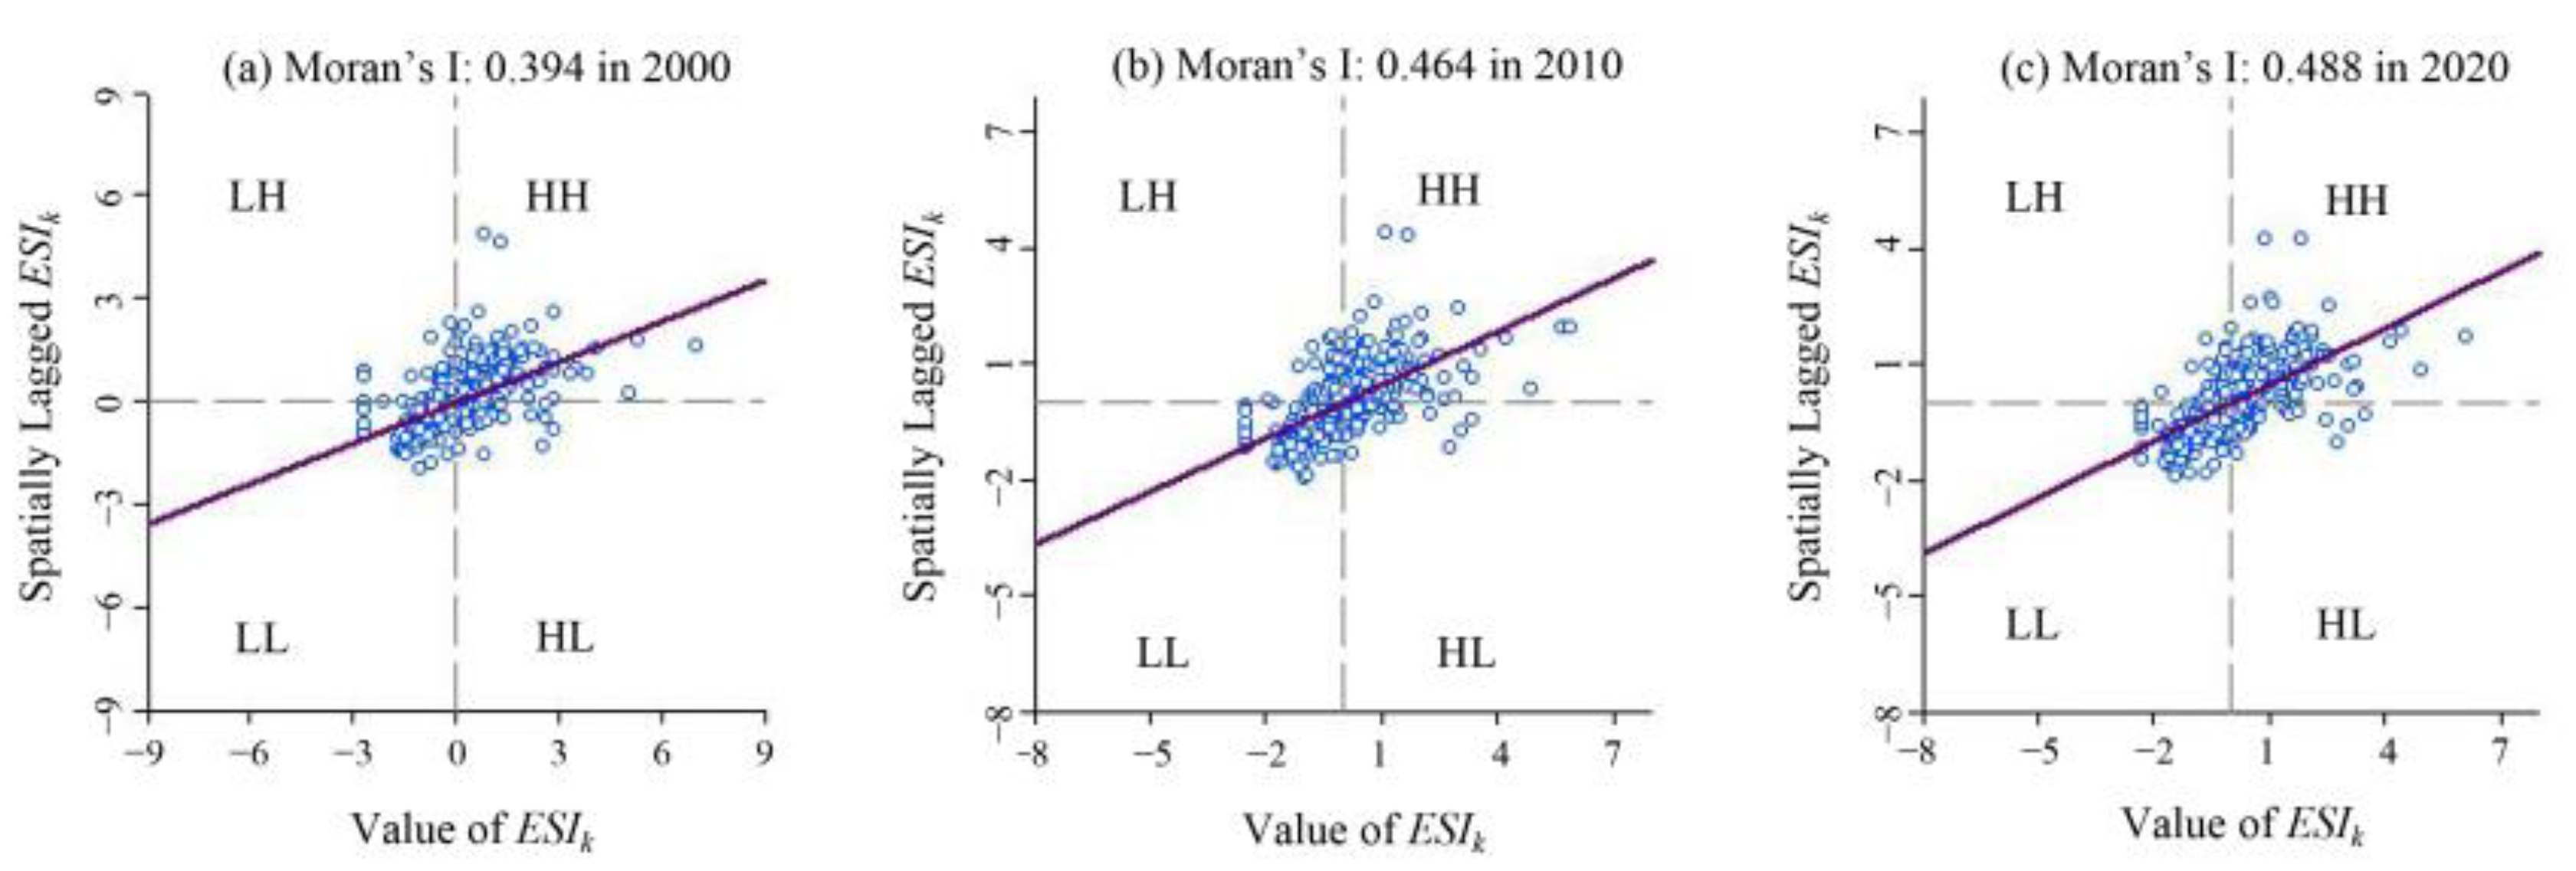
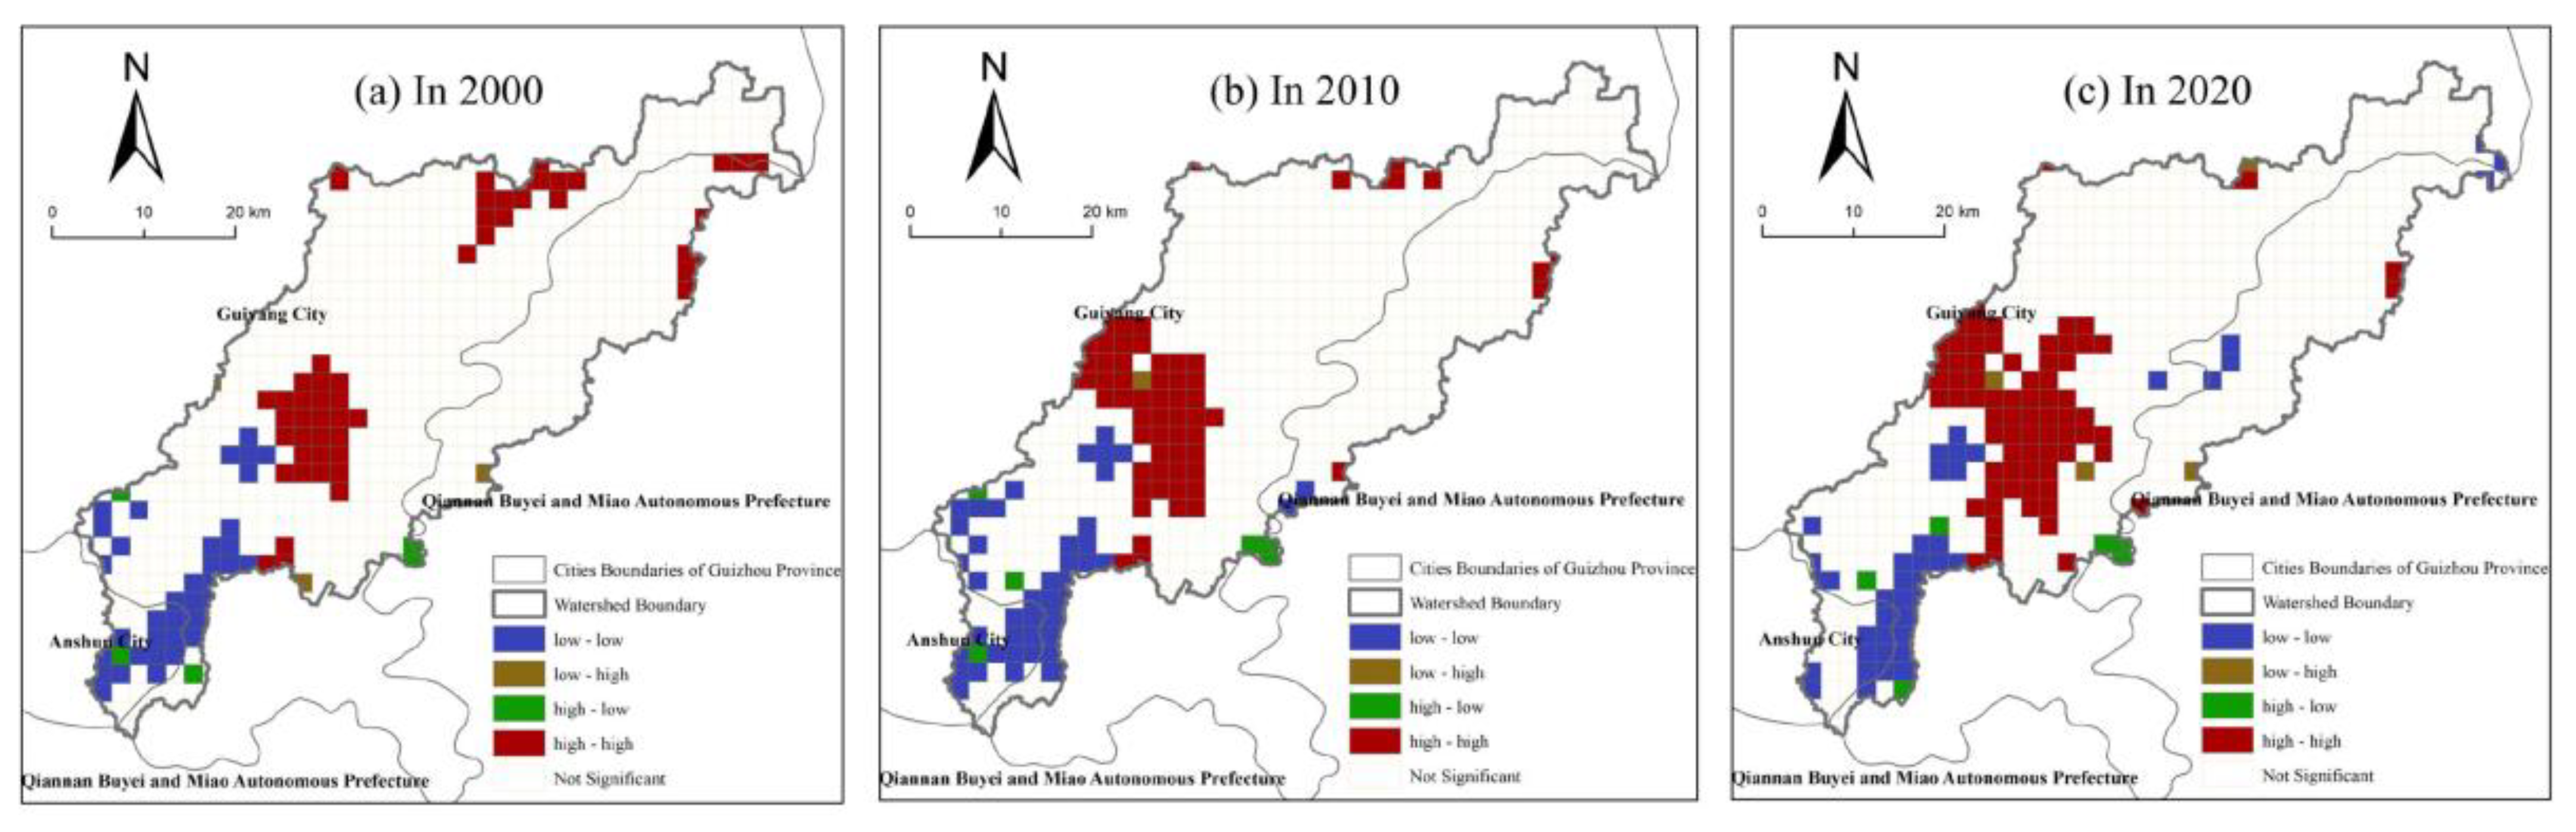
3.4.2. Spatial Autocorrelation Analysis of Landscape Ecological Security Index

As shown in Figure 8, the Moran’s I values of the landscape ecological safety index of the Nanming River Basin were 0.394, 0.464, and 0.488, greater than 0 for the study periods 2000, 2010, and 2020 at a significance level of p < 0.05. This indicates that the landscape ecological safety index in the study zone is correlated, and the spatial convergence is gradually increasing.
As shown in Figure 9, the spatial clustering pattern of landscape ecological safety values in the Nanming River basin is characterized by high–high clustering and low–low clustering. The percentage of high–high concentration sample areas gradually increased over the three periods, ranging from 7.66% to 12.66%. From the local autocorrelation of the study area, the cluster structure of “high–high” values of the landscape ecosystem security index continues to extend outward from 2000. However, the range of “low–low” values continues to shrink. In terms of spatial distribution, the ecological safety high-value catchment area of the watershed is concentrated in the center of Guiyang City, with little distribution in the eastern part of the downstream Wuzhong. In this area, the terrain is relatively flat, and the topographic conditions are simple, with a single land-use landscape type as the main feature. Low-value ecological security catchment areas are focused on the central Huaxi and southern Pingba in the upper part of the watershed. At the same time, we found that the internal structure of the landscape in the adjacent areas of the region is finely fragmented. Additionally, each land use landscape type is disturbed by human activities and interspersed with each other; so the ecological safety is in a low-value state, and its stability may be difficult to maintain.

4. Discussion

4.1. Landscape Ecological Safety Evolution Rules

(1)
Change in the Landscape Ecological Safety Index
From 2000 to 2020, the landscape ecological security index showed an increasing trend, indicating that the ecological security of the Nanming River Basin gradually increased. Driven by the market economy, crop cultivation has increased in the upper watershed, making a certain amount of forest and grassland reclaimed as cropland. Moreover, a huge number of cultivated land has been converted to forest and constructed land, which was driven by the policy of returning farmland to forest and the construction of land expansion. This policy has increased the fragmentation of forest and cropland landscapes, decreased connectivity, and decreased the ecological security index. With urbanization and rapid economic development, the non-farm population has increased, and the disturbance to the watershed landscape from human activities has risen. This development enhances the distribution of the construction of landscapes favoring human ecological and living needs. Moreover, the contiguous distribution of constructed land decreases the fragmentation of landscape patches and increases the degree of stability because of the low vulnerability in the flat topography. Thus, the ecological safety index of the constructed land has maintained its maximum value in the last 20 years. Additionally, the implementation of artificial landscaping projects in the watershed has rationalized the layout of the grassland landscape and increased the landscape ecological safety index.
(2)
Spatial Distribution of Landscape Ecological Safety Index
Table 2 shows a comparative analysis of the relevant literature [56,57,58,59,60,61,62,63,64,65,66,67,68]. In karst areas, the regional characteristics above the higher ecological safety level are manifested as follows: ① They are located at lower elevations and in urban centers with faster economic development. ② These areas are also the most concentrated belt of forest or the constructed land and forest of the landscape. Low-security and lower-security areas are characterized by cultivated land, grassland, and water. In non-karst areas, areas above medium security level are dominated by natural ecosystems such as forest and grassland, which are concentrated in agricultural areas or natural landscape protection zones far from urban centers. However, low-security level areas are distributed on constructed land, and natural landscape structures are fragmented by human interference.
Thus, the higher safety-level areas of the watershed are distributed in the central urban areas, whereas the constructed land is concentrated and contiguous. Moreover, the low and lower ecological safety areas are characterized by a distribution of interspersed and scattered forest, grassland, and cultivated land.
These results contradict results presented by previous studies conducted in non-karst areas. Compared with related studies in karst areas, the Panlong River Basin located in Kunming [60] has a social and geomorphic environment comparable to the study area. Lin et al. found that the ecological safety index of the constructed land within the Panlong River Basin was higher than that of other landscape types. Moreover, the landscape types formed by human behavioral activities have the characteristics of being the most resistant and stable to external disturbances. Taking the Dianchi watershed as a case study, Wu et al. analyzed ecological security and found that the high-security areas were located in the urban areas because urban housing was distributed in a row, with almost no other land use landscape. Moreover, the patches are highly connected and less fragmented, making them capable of resisting external disturbances [61]. These findings are in line with the results of this study.
From the above comparison of the landscape ecological security research in non-karst and karst areas, it is recommended to give more attention to the fallibility and fragility of natural ecosystems during the process of karst ecosystem restoration and reconstruction, such as forests and grassland. In non-karst areas, we should pay more attention to the uncontrolled expansion of constructed land and the quality of the surrounding natural ecosystem. In addition, in the follow-up study, the factors influencing the spatial distribution difference of ecological security of landscape patterns in non-karst and karst areas should be discussed in depth.

4.2. Limitations and Shortcomings

In interpreting land use type data through RS images and analyzing land use changes and landscape patterns in the Nanming River Basin, this study evaluated the spatiotemporal variation characteristics of ecological security in the basin. However, some shortcomings are found that require improvement. The results inevitably have certain errors when interpreting images through RS technology because the results have been influenced by objective factors and human subjective factors, thereby affecting the accuracy verification. Thus, the ground-based field data surveys and historical record data must be rectified to improve the accuracy of the interpretation results. The dynamic and landscape indicators of land use types only reflect the macro-structural changes influenced by topographic factors [68]. However, it is difficult to reveal the microstructural changes in the landscape. Thus, the microstructural changes in the landscape should be explored in future studies.
As a natural geographical unit, a watershed is the unification of multiple catchment areas within a natural environment [69]. However, watershed boundaries and administrative boundaries cannot completely overlap [70]. Thus, when exploring the influence of the natural environment and anthropogenic activities on watershed landscape patterns and ecological security, these influences cannot be fully quantified because of some constraints on the analysis of watershed change.

5. Conclusions

This study used 3S technology, the landscape pattern index method, and spatial autocorrelation theory to systematically analyze the landscape pattern evolution characteristics of the Nanming River watershed and evaluate the ecological security of the karst watershed in the Guizhou plateau. Several conclusions were obtained as follows. Forest was the leading landscape and mainland substrate in the watershed from 2000 to 2020. The cohesiveness of constructed land patches continues to increase. Moreover, the fragmentation and diversity of landscape pattern in the patchy distribution of forest and constructed land have declined. The growth rate of the Nanming River Basin Landscape Ecological Safety Index has increased by 5.80%, and the overall ecological safety has shown a continuous positive trend. The high-value ecological safety clusters are distributed in the central urban areas, where the constructed land is concentrated and contiguous. Moreover, the low-value clusters show the scattered distribution characteristics of forest, grassland, and cultivated land. Thus, the spatial clustering effect of the ecological security index is obvious, which is dominated by high–high clustering and low–low clustering types. The study reveals the landscape pattern evolution rules of the typical karst watershed in the Guizhou plateau since 2001 by systematically evaluating the spatiotemporal distribution characteristics of ecological security in the watershed. The findings provide scientific reference for maintaining the ecological balance in the watershed, optimizing land resource allocation and regulation, and improving the ecological environment of typical karst watershed geomorphic units.

Author Contributions

Y.L.: Methodology, Investigation, Formal Analysis, Visualization, Writing—Original Draft, Writing—Review and Editing. H.G.: Data Curation, Resources, Formal Analysis. All authors have read and agreed to the published version of the manuscript.

Funding

This study was jointly supported by the Youth Talent Growth Project of Guizhou Provincial Department of Education (Qian Jiao He KY [2022] No. 202), the Water Conservancy Science and Technology Funding Projects in Guizhou Province (KT202114), the Water Conservancy Science and Technology Funding Projects in Guizhou Province (KT202223), National Natural Science Foundation of China (42261044).

Institutional Review Board Statement

Not applicable.

Informed Consent Statement

Not applicable.

Data Availability Statement

Not applicable.

Conflicts of Interest

The authors declared that they have no conflict of interest to this work. We declare that we do not have any commercial or associative interest that represents a conflict of interest in connection with the work submitted.

References

  1. O’Neill, R.V.; Krummel, J.R.; Gardner, R.H. Indices of landscape pattern. Landsc. Ecol. 1998, 1, 153–162. [Google Scholar] [CrossRef]
  2. Wu, J.S.; Zhang, P.H. The effect of urban landscape pattern on urban waterlogging. Acta Geogr. Sin. 2017, 72, 444–456. [Google Scholar]
  3. Wang, P.; Wang, Y.J.; Liu, X.P.; Wen, S.Q. Change of land use and landscape pattern in ecological resettlement area in central Ningxia. J. Arid. Land Resour. Environ. 2018, 32, 69–74. [Google Scholar]
  4. Polasky, S.; Nelson, E.; Pennington, D.; Johnson, K.A. The impact of land-use change on ecosystem services, biodiversity and returns to landowners: A case study in the state of Minnesota. Environ. Resour. Econ. 2011, 48, 219–242. [Google Scholar] [CrossRef]
  5. Macfarlane, R. Implementing agri-environment policy: A landscape ecology perspective. J. Environ. Plan. Manag. 1998, 41, 575–596. [Google Scholar] [CrossRef]
  6. Yu, X.; Wu, K.N.; Yun, W.J.; Wei, H.B.; Song, Y.H.; Gao, X. Analysis on temporal and spatial variation of landscape ecological security in modern agricultural area. Trans. Chin. Soc. Agric. Eng. 2016, 32, 253–259. [Google Scholar]
  7. Ou, D.H.; Xia, J.G. Landscape pattern optimization in peri-urban areas based on the particle swarm optimization method: A case study in Longquanyi District of Chengdu. Geogr. Res.-Aust. 2017, 36, 553–572. [Google Scholar]
  8. Xiong, K.N.; Chen, Q.W. Discussion on karst rocky desert evolution trend based on ecologically comprehensive treatment. Carsologica Sin. 2010, 29, 267–273. [Google Scholar]
  9. Wu, L.H.; Wang, S.J.; Bai, X.Y.; Chen, F.; Li, C.J.; Ran, C.; Zhang, S.R. Identifying the multi-scale influences of climate factors on runoff changes in a typical karst watershed using wavelet analysis. Land 2022, 11, 1284. [Google Scholar] [CrossRef]
  10. Chen, F.; Bai, X.Y.; Liu, F.; Luo, G.J.; Tian, Y.C.; Qin, L.Y.; Li, Y.; Xu, Y.; Wang, J.F.; Wu, L.H.; et al. Analysis long-term and spatial changes of forest cover in typical karst areas of China. Land 2022, 11, 1349. [Google Scholar] [CrossRef]
  11. Fu, F.J.; Liu, Z.H.; Huang, Q.D. Three-dimensional urban landscape pattern changes: A case study in the Central Business District of Futian, Shenzhen. Acta Ecol. Sin. 2019, 39, 4299–4308. [Google Scholar]
  12. Hu, H.B.; Liu, H.Y.; He, J.F.; An, J. Influence of spatial difference on water quality in Jiuxiang River Watershed, Nanjing. Environ. Sci. 2012, 33, 794–801. [Google Scholar]
  13. Hu, H.B.; Liu, H.Y.; He, J.F.; An, J. Effects of urbanization on the spatial heterogeneity of watershed ecosystem services value: A case study of Jiuxiang River Watershed in Nanjing City. J. Nat. Resour. 2011, 26, 1715–1725. [Google Scholar]
  14. Song, F.J.; Wang, S.J.; Bai, X.Y.; Wu, L.H.; Wang, J.F.; Li, C.J.; Chen, H.; Luo, X.L.; Xi, H.P.; Zhang, R.R.; et al. A new indicator for global food security assessment: Harvested area rather than cropland area. Chin. Geogr. Sci. 2022, 32, 204–217. [Google Scholar] [CrossRef]
  15. Du, C.C.; Bai, X.Y.; Li, Y.B.; Tan, Q.; Zhao, C.W.; Luo, G.J.; Wu, L.H.; Chen, F.; Li, C.L.; Ran, C.; et al. Inventory of China’s net biome productivity since the 21st century. Land 2022, 11, 1244. [Google Scholar] [CrossRef]
  16. Zhang, S.R.; Bai, X.Y.; Zhao, C.W.; Tan, Q.; Luo, G.J.; Wu, L.H.; Xi, H.P.; Li, C.J.; Chen, F.; Ran, C.; et al. China’s carbon budget inventory from 1997 to 2017 and its challenges to achieving carbon neutral strategies. J. Clean. Prod. 2022, 347, 130966. [Google Scholar] [CrossRef]
  17. Besser, H.; Mokadem, N.; Redhouania, B.; Rhimi, N.; Khlifi, F.; Ayadi, Y.; Omar, Z.; Bouajila, A.; Hamed, Y. GIS-based evaluation of groundwater quality and estimation of soil salinization and land degradation risks in an arid Mediterranean site (SW Tunisia). Arab. J. Geosci. 2017, 10, 350–370. [Google Scholar] [CrossRef]
  18. Harvey, E.; Gounand, I.; Ward, C.L.; Altermatt, F. Bridging ecology and conservation: From ecological networks to ecosystem function. J. Appl. Ecol. 2017, 54, 371–379. [Google Scholar] [CrossRef]
  19. Peng, J.; Pan, Y.J.; Liu, Y.X.; Zhao, H.J.; Wang, Y.L. Linking ecological degradation risk to identify ecological security patterns in a rapidly urbanizing landscape. Habitat Int. 2018, 71, 110–124. [Google Scholar] [CrossRef]
  20. Xiong, L.; Bai, X.Y.; Zhao, C.W.; Li, Y.B.; Tan, Q.; Luo, G.J.; Wu, L.H.; Chen, F.; Li, C.J.; Ran, C.; et al. High-resolution datasets for global carbonate and silicate rock weathering carbon sinks and their change trends. Earth’s Future 2022, 10, e2022EF002746. [Google Scholar] [CrossRef]
  21. Yu, C.L.; Liu, D.; Feng, R.; Tang, Q.; Guo, C.L. Construction of ecological security pattern in Northeast China based on MCR model. Acta Ecol. Sin. 2021, 41, 290–301. [Google Scholar]
  22. Liu, M.; Bai, X.Y.; Tan, Q.; Luo, G.J.; Zhao, G.W.; Wu, L.H.; Luo, X.L.; Ran, C.; Zhang, S.R. Climate change enhances the positive contribution of human activities to vegetation restoration in China. Geocarto Int. 2022, 37, 1–21. [Google Scholar] [CrossRef]
  23. Cui, X.Y.; Fang, L.; Wang, X.R.; Kang, J.F. Urban eco-security assessment in the urban agglomerations based on DPSIR model:A case study of Yangtze River Delta, China. Acta Ecol. Sin. 2021, 41, 302–319. [Google Scholar]
  24. Li, C.J.; Bai, X.Y.; Tan, Q.; Luo, G.J.; Wu, L.H.; Chen, F.; Xi, H.P.; Luo, X.L.; Ran, C.; Chen, H.; et al. High-resolution mapping of the global silicate weathering carbon sink and its long-term changes. Glob. Chang. Biol. 2022, 28, 4233–4398. [Google Scholar] [CrossRef]
  25. Tieskens, K.F.; Schulp, C.J.E.; Levers, C.; Lieskovský, J.; Kuemmerle, T.; Plieninger, T.; Verburg, P.H. Characterizing European cultural landscapes: Accounting for structure, management intensity and value of agricultural and forest landscapes. Land Use Policy 2017, 62, 29–39. [Google Scholar] [CrossRef] [Green Version]
  26. Li, Q.H.; Yan, J.Y. An evaluation of ecological security of coastal zone of sanya with DPSIR model. Trans. Oceanol. Limnol. 2021, 43, 147–154. [Google Scholar]
  27. Zhang, Y.Y.; Li, Y.B.; Luo, G.J.; Bai, X.Y.; Huang, J.; Tang, F.; Yu, M. Analysis of the land use dynamics of different rural settlement types in the Karst Trough Valleys of Southwest China. Land 2022, 11, 1572. [Google Scholar] [CrossRef]
  28. Ghosh, S.; Das Chatterjee, N.; Dinda, S. Urban ecological security assessment and forecasting using integrated DEMATEL-ANP and CA-Markov models: A case study on Kolkata Metropolitan Area, India. Sustain. Cities Soc. 2021, 68, 102773. [Google Scholar] [CrossRef]
  29. Jiang, W.K.; Xie, D.T.; Wang, S.; Yan, J.Z.; Liu, F.S. Study on landscape pattern change in a cultural heritage protection area and its driving factors—A case study of the core area of Lijiang City. J. Southwest Univ. 2018, 40, 133–142. [Google Scholar]
  30. Cao, B.S.; Shan, N.; Gu, Y.Y.; Ao, W.; Pang, B.; Dou, H.S.; Wang, W.L.; Zou, C.X. Evaluation of ecological security in Hulun Lake Watershed and its spatio-temporal distribution trend. Res. Environ. Sci. 2021, 34, 801–811. [Google Scholar]
  31. Liu, Y.F.; An, R.; Qu, S.Q.; Liu, Y.L. Ecological security evaluation and obstacle factor diagnosis of the cultivated land in Fujian Province. Chin. J. Agric. Resour. Reg. Plan. 2022, 43, 1–15. [Google Scholar]
  32. Wei, Q.Q.; Zhong, Y.X.; He, J.; Luo, L.L.; Qi, Y.R. Land use changes and ecological water requirement of Xinghai Lake Wetland. J. Hydroecol. 2022, 43, 27–34. [Google Scholar]
  33. Ren, M.; Wang, Z.J.; Wang, Z.T.; Zeng, Y.J.; He, L.Y. Grain size effect of karst mountainous urban landscape pattern indices in the central Guizhou: A case study of Anshun City. Chin. J. Ecol. 2018, 37, 3137–3145. [Google Scholar]
  34. Liu, C.J.; Zhou, G.F.; Huang, Q.F.; Cai, X.F. Spatio-temporal evolution analysis on habitat quality in mountainous watershed based on InVEST Model: Case of Chishui River Basin in Guizhou Province. Yangtze River 2021, 52, 62–69. [Google Scholar]
  35. Wang, Q.; Li, Y.B.; Huang, J.; Hu, X.P.; Zhong, S.N. Effect of land use transformation process on ecosystem service value in Karst Trough Valley Area. Res. Soil Water Conserv. 2019, 26, 192–198. [Google Scholar]
  36. Peng, W.J.; Shu, Y.G. Analysis of landscape ecological security and cultivated land evolution in the Karst mountain. Acta Ecol. Sin. 2018, 38, 852–865. [Google Scholar]
  37. Zhao, Y.J.; Zeng, L.; He, Z.; Liang, Q. Interpretation and landscape pattern of Karst Landform based on multi-source remote sensing images. Res. Soil Water Conserv. 2017, 24, 158–162. [Google Scholar]
  38. Zhang, X.; Wang, Z.J. Evaluation and characteristic analysis of urban landscape stability in karst mountainous cities in the central Guizhou Province. Acta Ecol. Sin. 2022, 42, 5243–5254. [Google Scholar]
  39. Shi, S.N.; Li, X.Q.; Xie, B.G.; Hu, B.Q.; Tang, C.Y.; Yan, Y. Change and comparison of agricultural landscape patterns and ecological service values in Karst and Non-Karst Areas: A case study of Quanzhou County. Trop. Geogr. 2018, 38, 487–497. [Google Scholar]
  40. Bu, R.C.; Hu, Y.M.; Chang, Y.; Li, X.Z.; He, H.S. A correlation analysis on landscape metrics. Acta Ecol. Sin. 2005, 25, 2764–2775. [Google Scholar]
  41. Zhou, D.M.; Chen, C.Y.; Wang, M.J.; Luo, Z.W.; Kang, L.T.; Wu, S. Gradient and directional differentiation in landscape Pattern characteristics of urban ecological space based on optimal spatial scale: A case study in Changsha City, China. J. Ecol. Rural Environ. 2022, 38, 566–577. [Google Scholar]
  42. Mei, Z.R.; Li, Y.J.; Kang, X.; Wei, S.B.; Pan, J.J. Temporal and spatial evolution in landscape pattern of mining site area based on moving window method. Remote Sens. Nat. Resour. 2019, 31, 60–68. [Google Scholar]
  43. Yang, K.; Xin, G.X.; Jiang, H.Y.; Yang, C.X. Study on spatiotemporal changes of landscape ecological risk based on the optimal spatial scale: A case study of Jiangjin District, Chongqing City. J. Ecol. Rural Environ. 2021, 37, 576–586. [Google Scholar]
  44. Dai, W.Y.; Huang, H.F.; Huang, W.L.; Wu, X.H.; Huang, J.B. Features of spatiotemporal differentiation of landscape ecological security in island ecologically fragile zones in Haitan Island. Ecol. Sci. 2017, 36, 152–159. [Google Scholar]
  45. Ren, J.T.; Yang, K.M.; Chen, Q.L.; Mo, S.J.; Wang, Z.H. Evaluation on ecological security of land use landscape in Guizhou Caohai Wetland. Environ. Sci. Technol. 2018, 41, 158–165. [Google Scholar]
  46. Zhang, Y.; Zhang, F.; Zhou, M.; Li, X.H.; Ren, Y.; Wang, J. Landscape ecological risk assessment and its spatio-temporal variations in Ebinur Lake region of inland arid area. Chin. J. Appl. Ecol. 2016, 27, 233–242. [Google Scholar]
  47. Xiong, Y.; Wang, M.; Yuan, H.P.; Du, C.Y.; Wu, H.P. Landscape ecological risk assessment and its spatio-temporal evolution in Dongting Lake Area. Ecol. Environ. Sci. 2020, 29, 1292–1301. [Google Scholar]
  48. Chen, Y.G. Reconstructing the mathematical process of spatial autocorrelation based on Moran’s statistics. Geogr. Res. 2009, 28, 1449–1463. [Google Scholar]
  49. Wu, J.; Chen, P.; Wen, S.F.; Fu, S.F.; Chen, Q.H. Ecological risk assessment of land use based on exploratory spatial data analysis (ESDA): A case study of Haitan Island, Fujian Province. Chin. J. Appl. Ecol. 2014, 25, 2056–2062. [Google Scholar]
  50. Sun, Y.W.; Liu, B.; Di, K.C.; Liu, Z.Q. Automatic accurate geo-rectification of planetary remote sensing image based on reference image. Remote Sens. Nat. Resour. 2015, 27, 23–28. [Google Scholar] [CrossRef] [Green Version]
  51. Han, X.Q.; Su, Y.; Li, J.; Zhang, Y.; Liu, J.; Gao, W.M. Atmospheric correction and verification of the SPOT remote sensing image in coastal zones. Geogr. Res. 2012, 31, 2007–2016. [Google Scholar]
  52. Huang, K.Q.; Wang, Q.; Wu, Z.Y. Natural color image enhancement and evaluation algorithm based on human visual system. Comput. Vis. Image Underst. 2006, 103, 52–63. [Google Scholar] [CrossRef]
  53. Zhou, K.; Yang, Y.Q.; Zhang, Y.N.; Miao, R.; Yang, Y.; Liu, L. Review of land use classification methods based on optical remote sensing images. Sci. Technol. Eng. 2021, 21, 13603–13613. [Google Scholar]
  54. Song, J.W.; Zhang, Y.J.; Li, X.C.; Yang, W.Z. Comparison between GF-1 and Landsat-8 images in land cover classification. Prog. Geogr. 2016, 35, 255–263. [Google Scholar]
  55. Ou, Z.R.; Zhu, Q.K.; Sun, Y.Y. Temporal and spatial variation of landscape ecological security in Yuanmou Dry-hot Valley. Sci. Soil Water Conserv. 2018, 16, 131–140. [Google Scholar]
  56. Guo, C.J.; Liu, Y.X.; Li, H.F.; Sun, Y.T.; Yu, Y.C. Landscape characteristics and construction of landscape ecological security pattern in West Open Pit of Fushun Mine. J. Shenyang Agric. Univ. 2021, 52, 442–450. [Google Scholar]
  57. Wang, Y.S.; Zhang, F.; Chen, R.; Qi, Y.X.; Liu, C.J. Comprehensive ecological security assessment: A case study of Urumqi City. Arid Land Geogr. 2021, 44, 427–440. [Google Scholar]
  58. Yuan, Y.; Luo, Z.J.; Zhao, J.; Qi, S. Landscape ecological security evaluation of Nanchang City based on landscape structure and spatial statistics. Res. Soil Water Conserv. 2020, 27, 247–255. [Google Scholar]
  59. He, C.L.; Pu, J.W.; Shen, J.X. Spatial-temporal changes and driving mechanisms of landscape ecological security in lower reaches of Lancang River during 2005–2018. Bull. Soil Water Conserv. 2020, 40, 219–227. [Google Scholar]
  60. Lin, J. Research on the Construction of Ecological Security Pattern of Panlong River Basin Based on the Evolution of Landscape Pattern. Master’s Thesis, Kunming University of Science and Technoligy, Kunming, China, 2021; pp. 19–22. [Google Scholar]
  61. Wu, Z.M.; Yu, Z.X.; Li, Y.; Liu, J.; Wang, J.S.; Zhang, C. The study of land use evolution and landscape ecological security evaluation in Dianchi Lake Basin. J. Southwest For. Univ. 2021, 41, 122–129. [Google Scholar]
  62. Ren, J.T.; Wang, Z.H.; Zuo, T.A.; Feng, T.; Yang, J.; Zu, W.T.; Li, H. Spatial-temporal dynamic analysis on landscape ecological safety of Chishuihe River Basin in Guizhou Province. Water Resour. Hydropower Eng. 2021, 52, 96–104. [Google Scholar]
  63. Ma, S.W.; Xie, D.T.; Zhang, X.C.; Peng, Z.T.; Hong, H.K.; Luo, Z.; Xiap, J.J. Measures of land ecological security early warning and its spatial-temporal evolution in the ecologically sensitive area of the Three Gorges reservoir area: A case study of Wanzhou District, Chongqing City. Acta Ecol. Sin. 2017, 37, 8227–8240. [Google Scholar]
  64. Zhang, X.D.; Zhao, Z.P.; Zhao, Y.X.; Gao, X.H.; Ma, Y.X.; Liu, N.J.; Ji, W.B. Landscape ecological risk assessment and ecological security pattern optimization construction in Yinchuan City. Arid Land Geogr. 2022, 45, 1626–1636. [Google Scholar]
  65. Ma, J.; Jiao, L. Landscape ecological security evaluation of Xinjiang Uygur Autonomous Region from the perspective of production-life-ecological space. Hubei Agric. Sci. 2022, 61, 100–105. [Google Scholar]
  66. Li, Z.; Hou, H.T.; Huang, Y.M.; Xu, H. Land ecological security evaluation of Coal- Resource Cities in Heilongjiang Province: A case study of Shuangyashan City. Sci. Technol. Manag. Land Resour. 2011, 28, 46–51. [Google Scholar]
  67. He, W.L.; Huo, J.; Meng, M.X.; Yin, S.Q. The land use change and landscape ecological security assessment in Huailai County. Chin. J. Soil Sci. 2016, 47, 15–20. [Google Scholar]
  68. Zang, Y.Z.; Liu, Y.S.; Yang, Y.Y. Land use pattern change and its topographic gradient effect in the mountainous areas: A case study of Jinggangshan city. J. Nat. Resour. 2019, 34, 1391–1404. [Google Scholar]
  69. Lu, Y.P.; Jiang, Y.B.; Gao, J.Y.; Cai, Z.X. The division of the Ordovician small watershed in the west of Tahe and its geological significance. Fault-Block Oil Gas Field 2021, 28, 440–445. [Google Scholar]
  70. Wu, Y.; Li, C.Y.; Zhang, C.F.; Shi, X.H.; Zhao, S.N.; Lin, T.T. A watershed delineation method for mountains, plains complex landform area based on ArcGIS and SWAT. Arid. Land Geogr. 2016, 39, 413–419. [Google Scholar]
Figure 1. The basic information of the study area. Note: (a) shows location of Guizhou in China. (b) shows location of the study area in Guizhou. (c) shows the elevation of the study area. (d) shows the lithologic background.
Land 11 02225 g001
Figure 2. Sampling areas for ecological security assessment of landscape pattern in the study area.
Land 11 02225 g002
Figure 3. Research framework.
Land 11 02225 g003
Figure 4. Land use status map of the study area in 2000 (a), 2010 (b), 2020 (c), and land use transfer map from 2000 to 2020 (d). Note: 1 indicates grassland; 2 indicates cultivated land; 3 indicates constructed land; 4 indicates forest; and 5 indicates waters.
Land 11 02225 g004
Figure 5. Change of landscape pattern index on patch type scale from 2000 to 2020.
Land 11 02225 g005
Figure 6. Spatial distribution of landscape pattern index at landscape level in the Nanming River Basin from 2000 to 2020. Note: (A1) PD in 2000; (A2) PD in 2010; (A3) PD in 2020; (B1) CONTAG in 2000; (B2) CONTAG in 2010; (B3) CONTAG in 2020; (C1) SHEI in 2000; (C2) SHEI in 2010; (C3) SHEI in 2020; (D1) SHDI in 2000; (D2) SHDI in 2010; (D3) SHDI in 2020.
Land 11 02225 g006
Figure 7. (a) Spatial distribution of landscape ecological security in 2000; (b) Spatial distribution of landscape ecological security in 2010; (c) Spatial distribution of landscape ecological security in 2020.
Land 11 02225 g007
Figure 8. Scatter map of ecological security index of landscape pattern in the study area from 2000 to 2020.
Land 11 02225 g008
Figure 9. (a) LISA Map of Landscape Ecological Security in 2000; (b) LISA Map of Landscape Ecological Security in 2010; (c) LISA Map of Landscape Ecological Security in 2020.
Land 11 02225 g009
Table 1. Statistics of landscape ecological security area in the study area.
Ecological Security Level200020102020
Area/km2ProportionArea/km2ProportionArea/km2Proportion
Low—safety zone24211.21%2198.14%1828.43%
Lower—safety zone49422.89%46728.76%43920.34%
Medium—safety zone63329.33%46334.93%65030.12%
Higher—safety zone54025.02%69332.11%60227.90%
High—safety zone24911.54%2567.63%28613.25%
Table 2. Relevant study on ecological security of landscape pattern.
High SecurityHigher SecurityMiddle-Grade SecurityLower SecurityLow Security
Karst areaPanlong River Basin, Kunming City [60]construction land, forest landUnused land, water area/Grassland, cultivated land/
Dianchi Watershed [61]Most of the main urban area and part of Chenggong DistrictThe main urban area of KunmingAround Dianchi Lake,
Most areas in Chenggong
The shore of Dianchi LakeThe water surface of Dianchi Lake
Chishui River Basin [62]Xishui County, Chishui City, and Tongzi County in Zunyi City//The junction of Guizhou and Sichuan where the Chishui River flows
Wanzhou District, Chongqing [63]Town center, suburb, and mountainous area with high altitude/Mainly low mountains and hillsDistributed along the Yangtze River basin
Caohai Wetland, Guizhou [45]Forest land in the northeast and southwest mountainsThe central region is dominated by cultivated landAround Caohai Lake District
This paperProvincial capital city center with low altitudeNorth of the study area (mainly forest land)Southeast of the study area (mainly forest land)Southwest of the study area (mainly cultivated land)In the southwest of the study area, mainly cultivated land, grassland, forest land, and water area are interlaced
Non-karst areaYinchuan City [64]//Forestland and grasslandCultivated land, construction land, and unused land
Xinjiang Uygur Autonomous Region [65]Oasis agricultural area/Taklimakan Desert, Turpan Basin Desert and the hinterland of Gurbantunggut Desert
State-operated Friendship Farm in Shuangyashan City, Heilongjiang Province [66]Natural wetlands and woodlands in the north and east of the study area (1984)/Cultivated land or degraded grassland in the north and east of the study area (originally a natural wetland in 1984)
Huailai County, Zhangjiakou City, Hebei Province [67]Mountains in the north and south of the study area and near Miyun ReservoirPlain area and around the county seatCounty town
Haitan Island, Pingtan County, Fujian Province [44]Hilly forest area and coastal protection forestSea reclamation area
Publisher’s Note: MDPI stays neutral with regard to jurisdictional claims in published maps and institutional affiliations.

