Article

Hierarchical Correlates of the Shrinkage of Cities and Towns in Northeast China

1
School of Geographical Sciences, Northeast Normal University, 5268 Renmin Street, Changchun 130024, China
2
Northeast Institute of Geography and Agroecology, Chinese Academy of Sciences, 4888 Shengbei Street, Changchun 130102, China
*
Author to whom correspondence should be addressed.
Land 2022, 11(12), 2208; https://doi.org/10.3390/land11122208
Submission received: 9 November 2022 / Revised: 30 November 2022 / Accepted: 2 December 2022 / Published: 5 December 2022
(This article belongs to the Special Issue Urban Land Development in the Process of Urbanization)

Abstract

:
The growth and shrinkage of cities and towns are normal phenomena in the evolution of regional town systems. The growth and shrinkage of different levels of cities and towns are mutually influential. This study uses ArcGIS and the Hierarchical Linear Model to analyze the hierarchical differences and correlations in the characteristics and mechanisms of shrinking cities and towns in Northeast China from 2000 to 2020. The results indicate that the shrinkage of cities and towns is characterized by hierarchical differences. High-level cities show widespread and slight shrinkage, while low-level towns show the most severe and continued shrinkage. The population shrinkage of cities and towns within the same municipality is not fully synchronized. In terms of spatial patterns, the multi-level relationship between cities and towns is divided into growth-driven, central siphon, peripheral growth, local growth, and global shrinkage. The shrinkage of high-level cities is mainly influenced by economic and industrial development and built-up environment. The shrinkage of low-level towns is constrained by population concentration, economic development, enterprise scale, local arable land resources, and environmental quality. Wages, jobs, and infrastructures in high-level cities have a strong siphoning effect on low-level towns, while technology and industrial development drive the population and economic development of low-level towns.

1. Introduction

Urban shrinkage, first proposed by Häußermann and Siebel [1], has become a global socio-economic issue [2]. The related results cover the concept, patterns, causes, governance, and socio-economic effects of urban shrinkage [3,4,5,6,7,8]. The number of shrinking cities in the world has shown accelerated growth since the mid and late 20th century. The phenomenon of urban shrinkage began to spread from developed to developing countries and from small towns to large- and medium-sized cities [9]. Most of the existing studies have taken the same level of towns as the object of study, focusing on large cities and metropolitan areas [10]. However, insufficient attention is given to small- and medium-sized towns [11,12] and longitudinal observations of the differences and correlations of multi-level towns [13,14]. There are significant hierarchical and scaling patterns in the spatial distribution, spatial–temporal evolution, and interaction mechanisms of socio-economic factors [15]. The spatial distribution and spatial–temporal evolution of urban shrinkage show scale variability and dependence [16]. There may be variability in the characteristics and mechanisms of the formation of shrinking towns with different levels, and the picture of regional town shrinkage limited to one level is not comprehensive. Accordingly, conclusions based on one level of cities may not be valid for another level [17].
Urban shrinkage is a multidimensional and complex process [18]. Urban shrinkage is not only affected by local factors such as population aging, natural disasters, environmental degradation, and unemployment but contextual factors such as post-socialist transition, deindustrialization, suburbanization, and globalization [19,20]. Shrinking cities and towns are rooted as part of a regional town system. Different levels of cities and towns are interconnected and interact [13], and there is a close socio-economic division of labor and relationships. Resources and factors in the region are transferred to regional core cities, leading to a gradual shrinkage of disadvantaged towns [21]. The population and economic development of peripheral small- and medium-sized towns in the region (lower-level towns) are influenced by the central or big cities of the region (higher-level cities) [22].
China’s cities and towns are experiencing rapid urbanization and urban shrinkage at present [23]. At present, there are 266 shrinking cities and towns in China [24], mostly resource-based cities and small towns [25], concentrated in the northeast and southwest of China, with obvious marginal location characteristics [10]. The “Key Tasks of New Urbanization Construction in 2019” published by the National Development and Reform Commission specifically proposes that China’s shrinking cities should be “slimmed down and strengthened”, changing the inertial thinking of incremental planning, strictly controlling the increment, revitalizing the stock, and promoting centralized distribution of population and infrastructure in small- and medium-sized towns [26,27].
Northeast China is an old industrial base and a rust belt region characterized with a serious and typical urban shrinkage [24,28]. There are various types of cities in Northeast China, including old industrial cities, resource-based cities, border-crossing cities, and tourist cities [29]. The study of urban shrinkage in Northeast China has implications for other regions. This study analyzes the patterns, characteristics, and urban shrinkage mechanisms from a multi-level perspective, taking prefecture-level cities (higher-level cities), county-level towns, and ordinary towns (lower-level towns) in Northeast China as subjects. First, this study identifies town shrinkage and analyzes the differences and spatial correlation characteristics of town shrinkage from a multi-level perspective; then, based on the Hierarchical Linear Modeling (HLM) model, this study reveals the interrelationship between different levels of city and town shrinkage and investigates the formation mechanism of multi-level town shrinkage. Finally, the conclusions and discussion of the study are presented. Based on the perspective of multi-level differences and associations, this study analyzes the hierarchical differentiation of town shrinkage, classifies the types of regional co-evolution of towns, and explores the interaction between towns at different levels. Furthermore, the study provides ideas for the governance of old industrial cities and regions, such as the relationship between towns and the important role of high-level cities in multi-level co-evolution.

2. Literature Review

2.1. Unbalanced and Dynamic Change of Cities and Towns

The development of cities and towns in the region is a dynamic and unbalanced process, with a wide range of complex and interrelated relationships [30]. Towns of different levels and functions are interconnected and maintain a delicate balance. The dynamic balance of the development of any town collapses when facilities, resources, and policies change in the region. Due to the mobility and volatility of labor, capital, and investment [2], some cities experience shrinkage due to a lack of investment and quality assets, the decline of many industrial enterprises, and a decrease in population attractiveness [31,32]. The object of urban shrinkage studies mainly focuses on a few cases, such as Leipzig in Germany [33], St. Louis and Youngstown in the United States [34,35], Yiwu in China [7], or single-level studies of shrinking cities, such as the study of prefecture-level cities and county-level cities in China [10,11]. However, this study focuses on the differentiation and spatial co-evolution of cities and towns at different levels (prefecture-level cities, county-level towns, and ordinary towns).

2.2. Factors Influencing the Shrinkage of Cities and Towns

City and town shrinkage is characterized by complexity, diversity, and integration [20]. Macroscopic impacts at the regional scale and local impacts at the town scale work together to shrink towns [18]. In addition to regional factors such as deindustrialization, suburbanization, and globalization [36], city and town shrinkage is also affected by local factors such as aging rates, resource depletion, and difficulties registered in industrial transformation [37]. The decline in the young population and the increase in the elderly population have led to a sharp drop in consumer demand and the breakdown of physical space and infrastructure in cities and towns [38]. Infrastructure such as education and health care are a guarantee for the lives of urban residents and the production of enterprises, which influences the attractiveness of the population [39]. The decline in fiscal revenues negatively affects the investment and construction of urban public services, which leads to lagging services and further loss of population [16]. A change in the original political status or a transportation location of a city can also cause a town to shrink [40]. As the material basis of town development, the depletion of natural resources in cities and towns can lead to shrinkage [25]. There are also complex effects of COVID-19 on urban shrinkage. On the one hand, compared to large cities, small towns with low population density and high public green areas per capita have a relatively low risk of transmission and spread of COVID-19, which weakens the incentive and motivation for population movement and migration from small towns to large cities [41]. At the same time, the Chinese government has adopted strict epidemic prevention and control policies, such as quarantine, silence, and closing cities, which have also reduced the intensity of population movement and migration between cities to a certain extent. COVID-19 has affected the socio-economics of consumer-oriented cities with tourism, retail, and entertainment as dominant industries [42], increasing urban unemployment, lowering income levels, and increasing the likelihood that urban dwellers will move to surrounding areas [43,44].
Urban shrinkage has a multi-level spatial correlation. There are frequent flows and close connections of population, economic, and other factors between core cities and peripheral small towns [45]. Theories, such as growth pole theory, cyclic cumulative causation theory, unbalanced growth theory, and core–periphery theory, emphasize the active role of large cities and top–down multilevel town linkages centered on large cities [46,47]. The growth of central cities in the region is not only the result of migration from rural areas but can also be the result of population movement from other towns in the region [10]. The population and economic development of low-level towns are influenced by the “agglomeration and diffusion effects” of high-level towns [45,48,49]. Central cities in the agglomeration development stage have a strong “siphon effect” on subordinate towns, attracting the population and socio-economic factors of surrounding towns to large cities. This process undermines the economic development of small towns [45]. Central cities in the diffusion development stage have the function diffusion or borrowing size effect on their subordinate towns. By borrowing the performance or functions of large cities, small towns share the advantages of agglomeration of large cities and increase the level of town services and attractiveness of the population [49]. Existing studies have neglected the interaction of multi-level influences in shrinking cities and towns. This study explores the interactions between different levels of cities and towns and enriches the literature on urban shrinkage from a multi-level perspective.

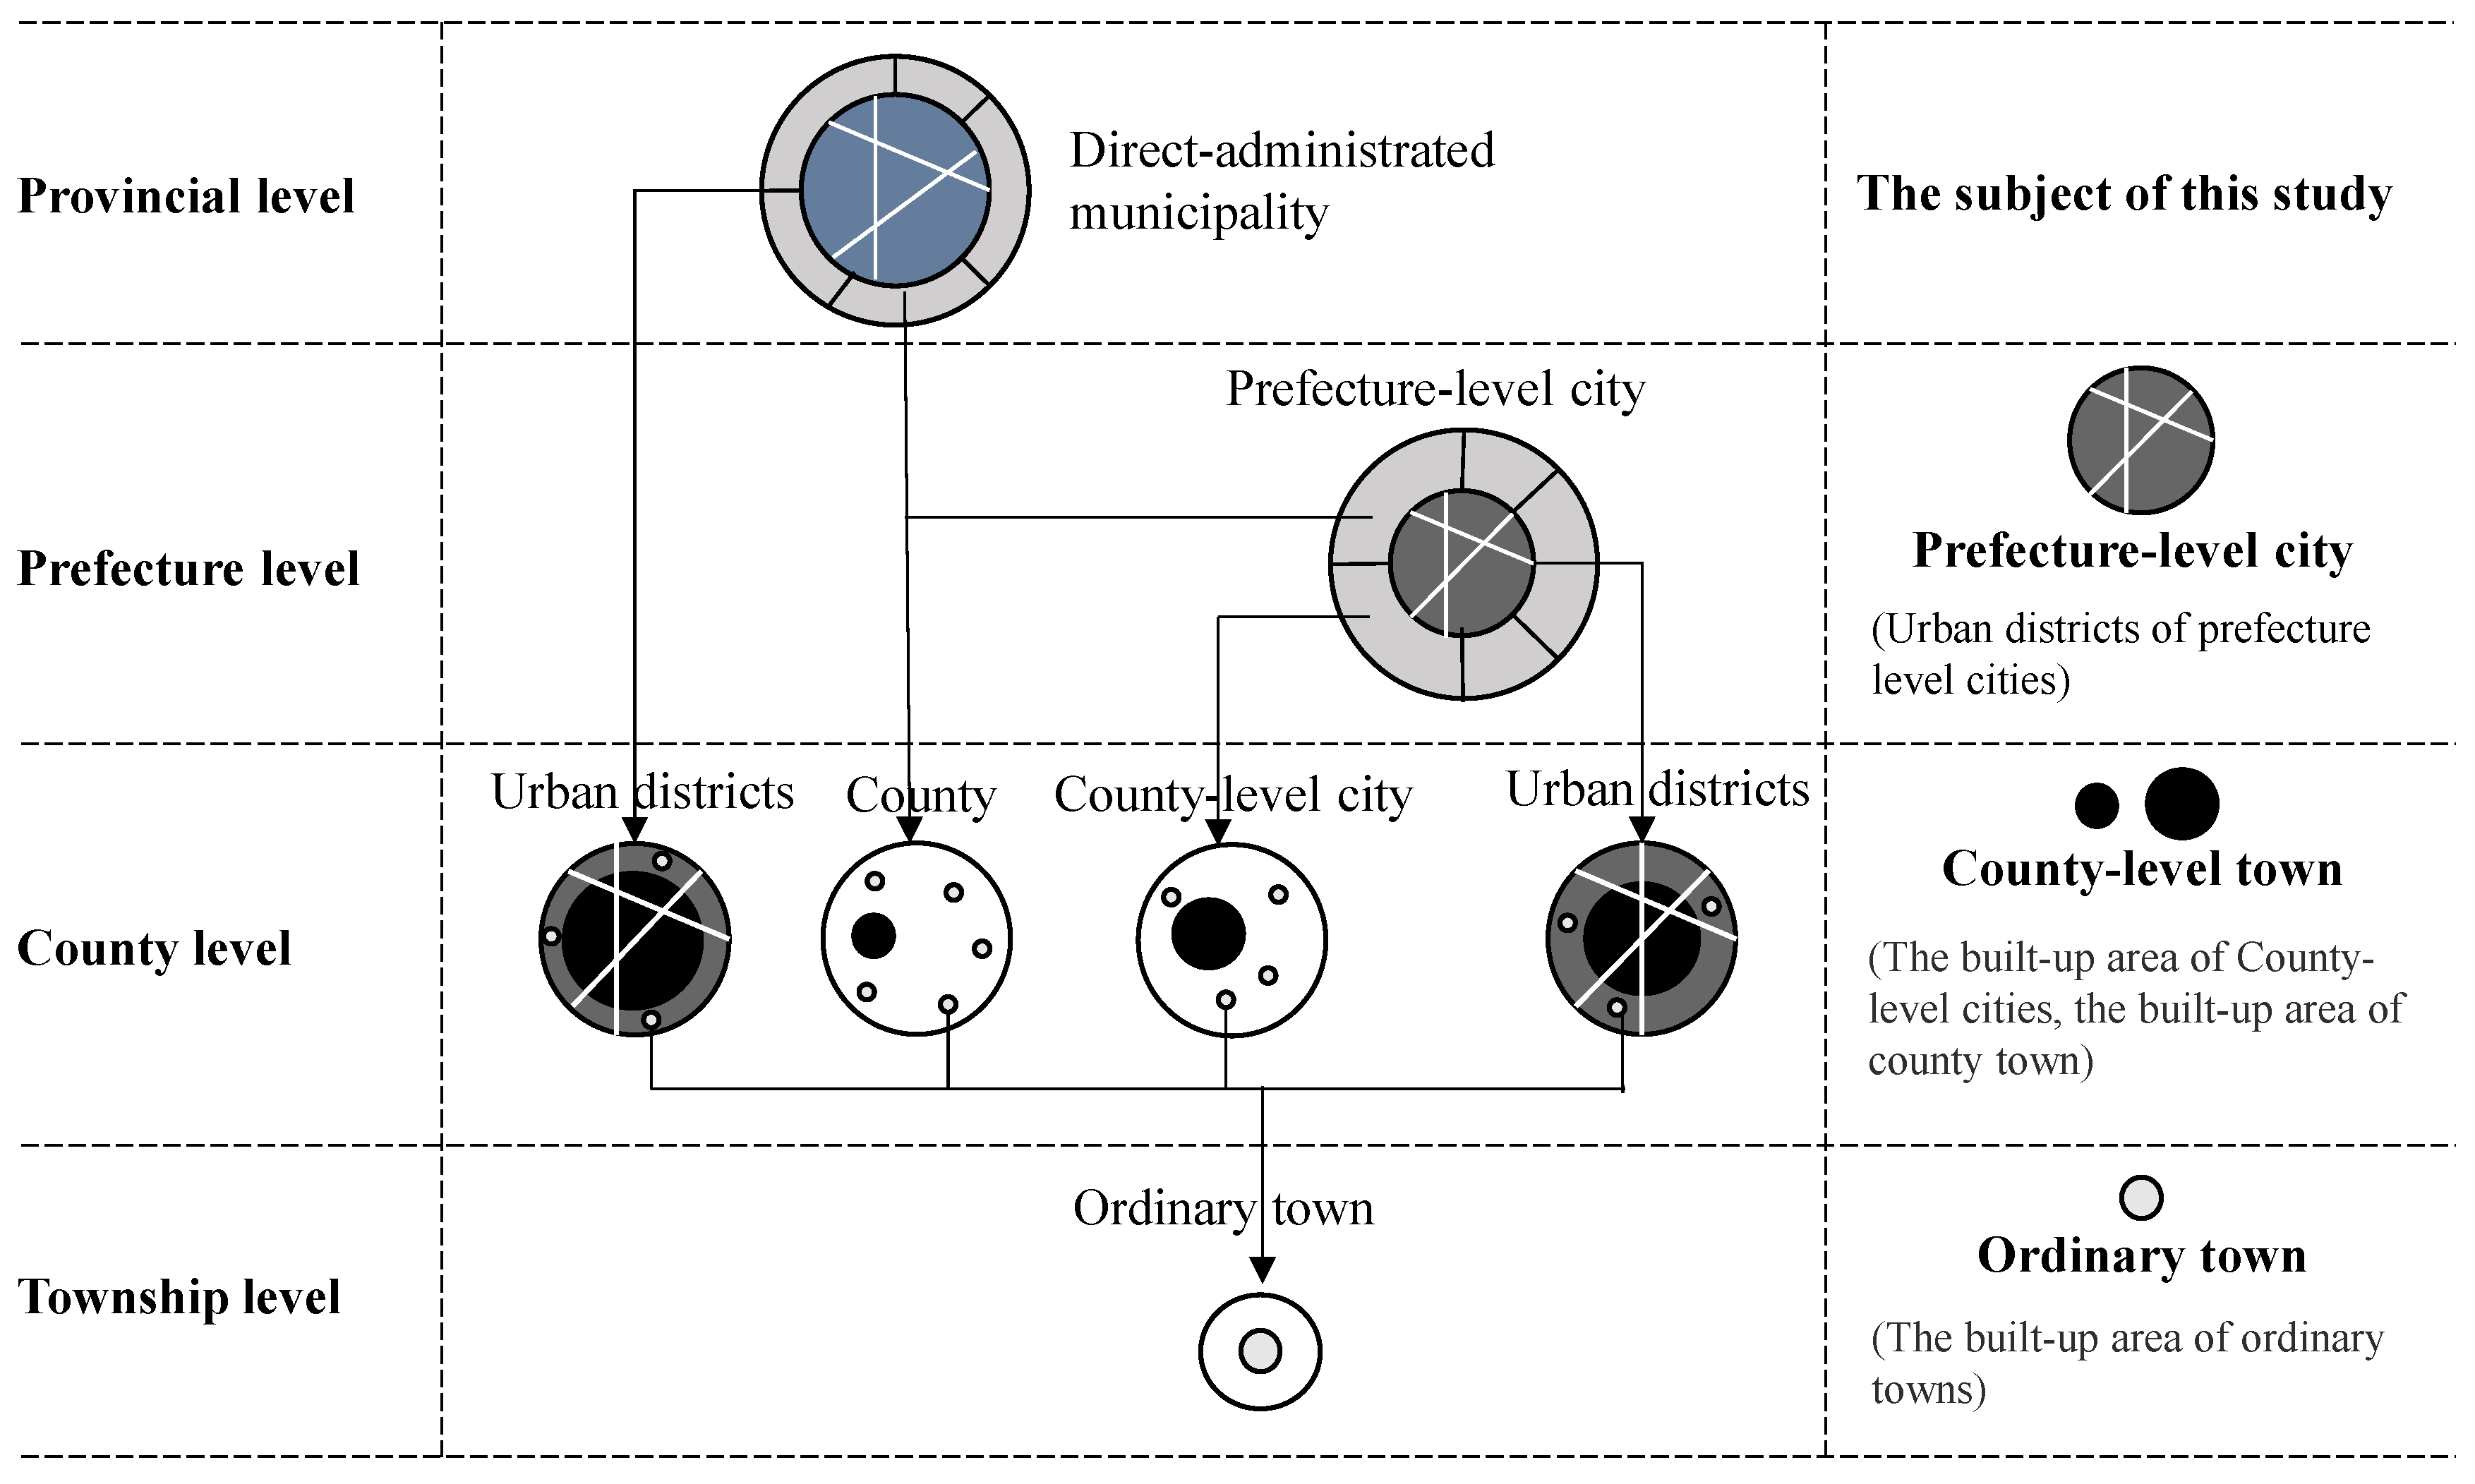
2.3. Mutil-Level Cities and Towns in China

The urban system consisting of prefecture-level cities, county-level towns, and ordinary towns has become the basic unit of regional development in China (Figure 1) [50]. The connectivity of cities and towns at multiple levels is mainly reflected between prefecture-level cities and low-level towns under their jurisdiction. Unlike developed Western countries, China has transformed from a planned economy into a market economy. The administrative hierarchy of cities and towns largely corresponds to the administrative power of the city, the economy, and scale of the facilities. High-level cities play a central role in the region, while low-level towns play peripheral roles [48]. Under the role of administrative divisions and top–down hierarchies, China’s county-level towns and ordinary towns are guided and constrained by prefecture-level cities and do not have full autonomy in urban development, facility distribution, and industrial development. The growth and shrinkage of county-level towns and ordinary towns are not only related to their social and economic development but may also be affected by prefecture-level cities.

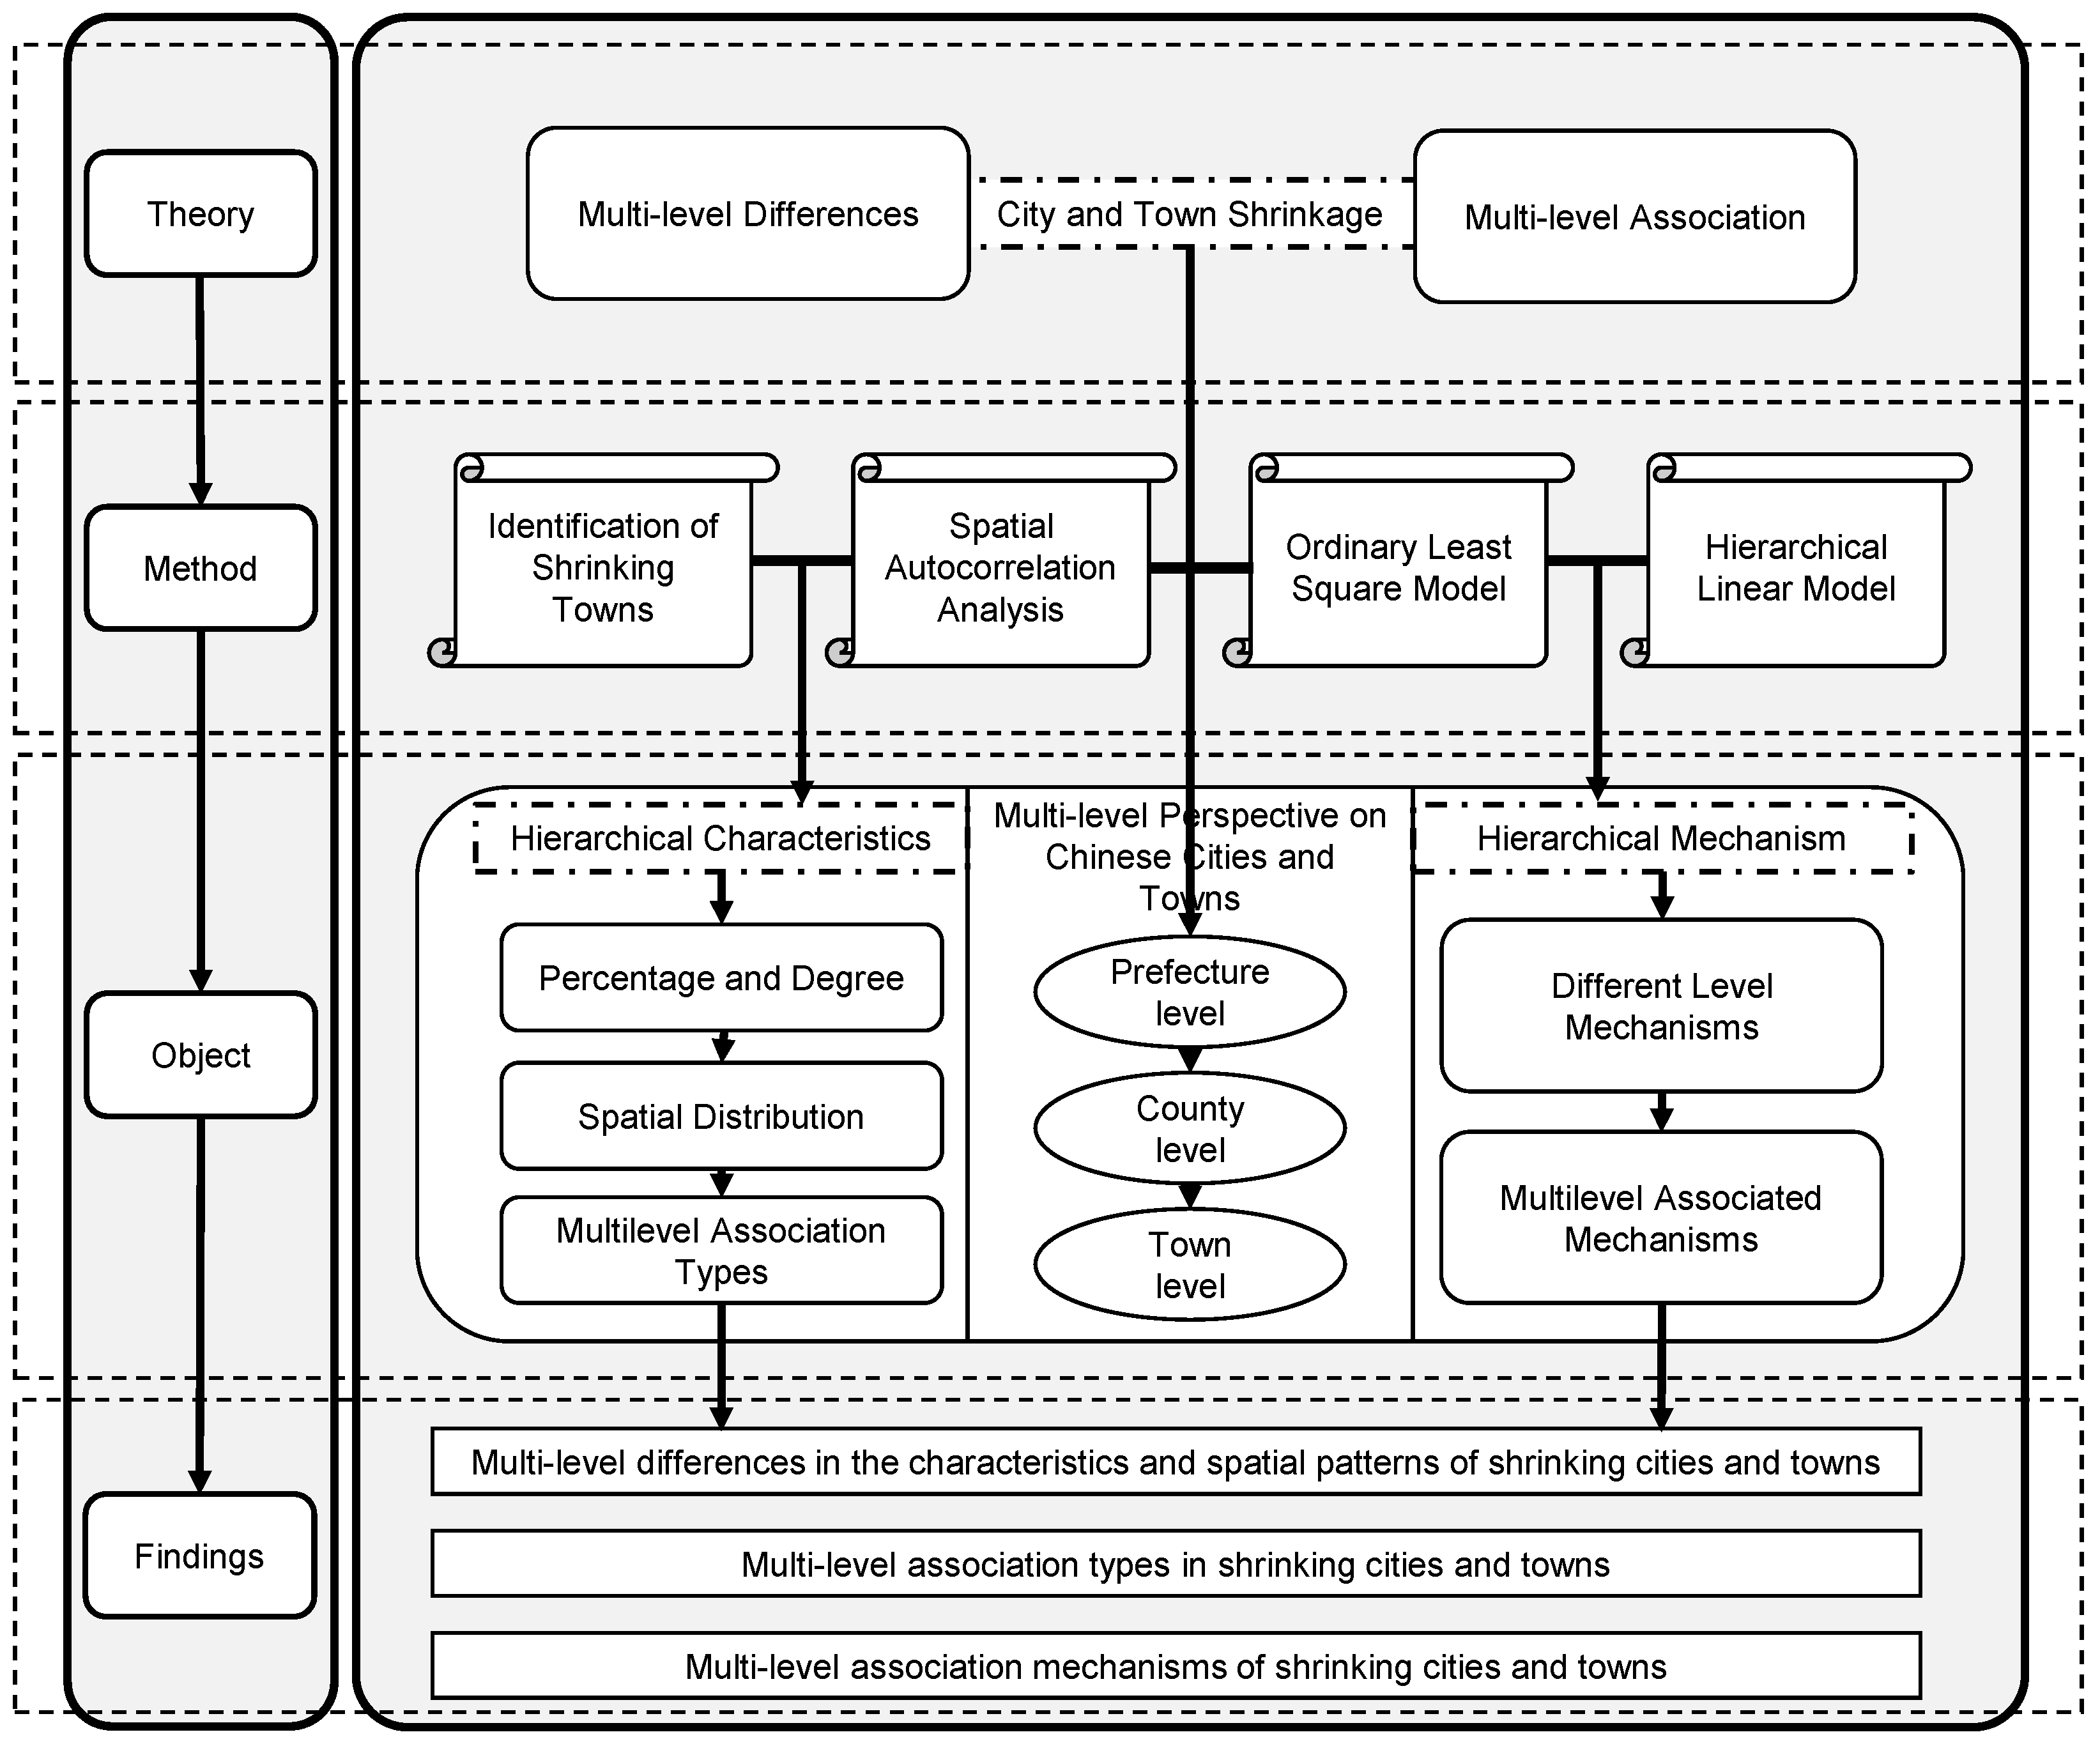
2.4. A Multi-Level Framework for Understanding the Shrinkage of Cities and Towns

Based on a multi-level perspective, this study investigates the influencing factors and multi-level correlation patterns of urban shrinkage, which can more comprehensively reflect the multi-level spatial pattern and formation mechanism of urban shrinkage in Northeast China (Figure 2).

3. Study Area, Data Sources, and Research Methods
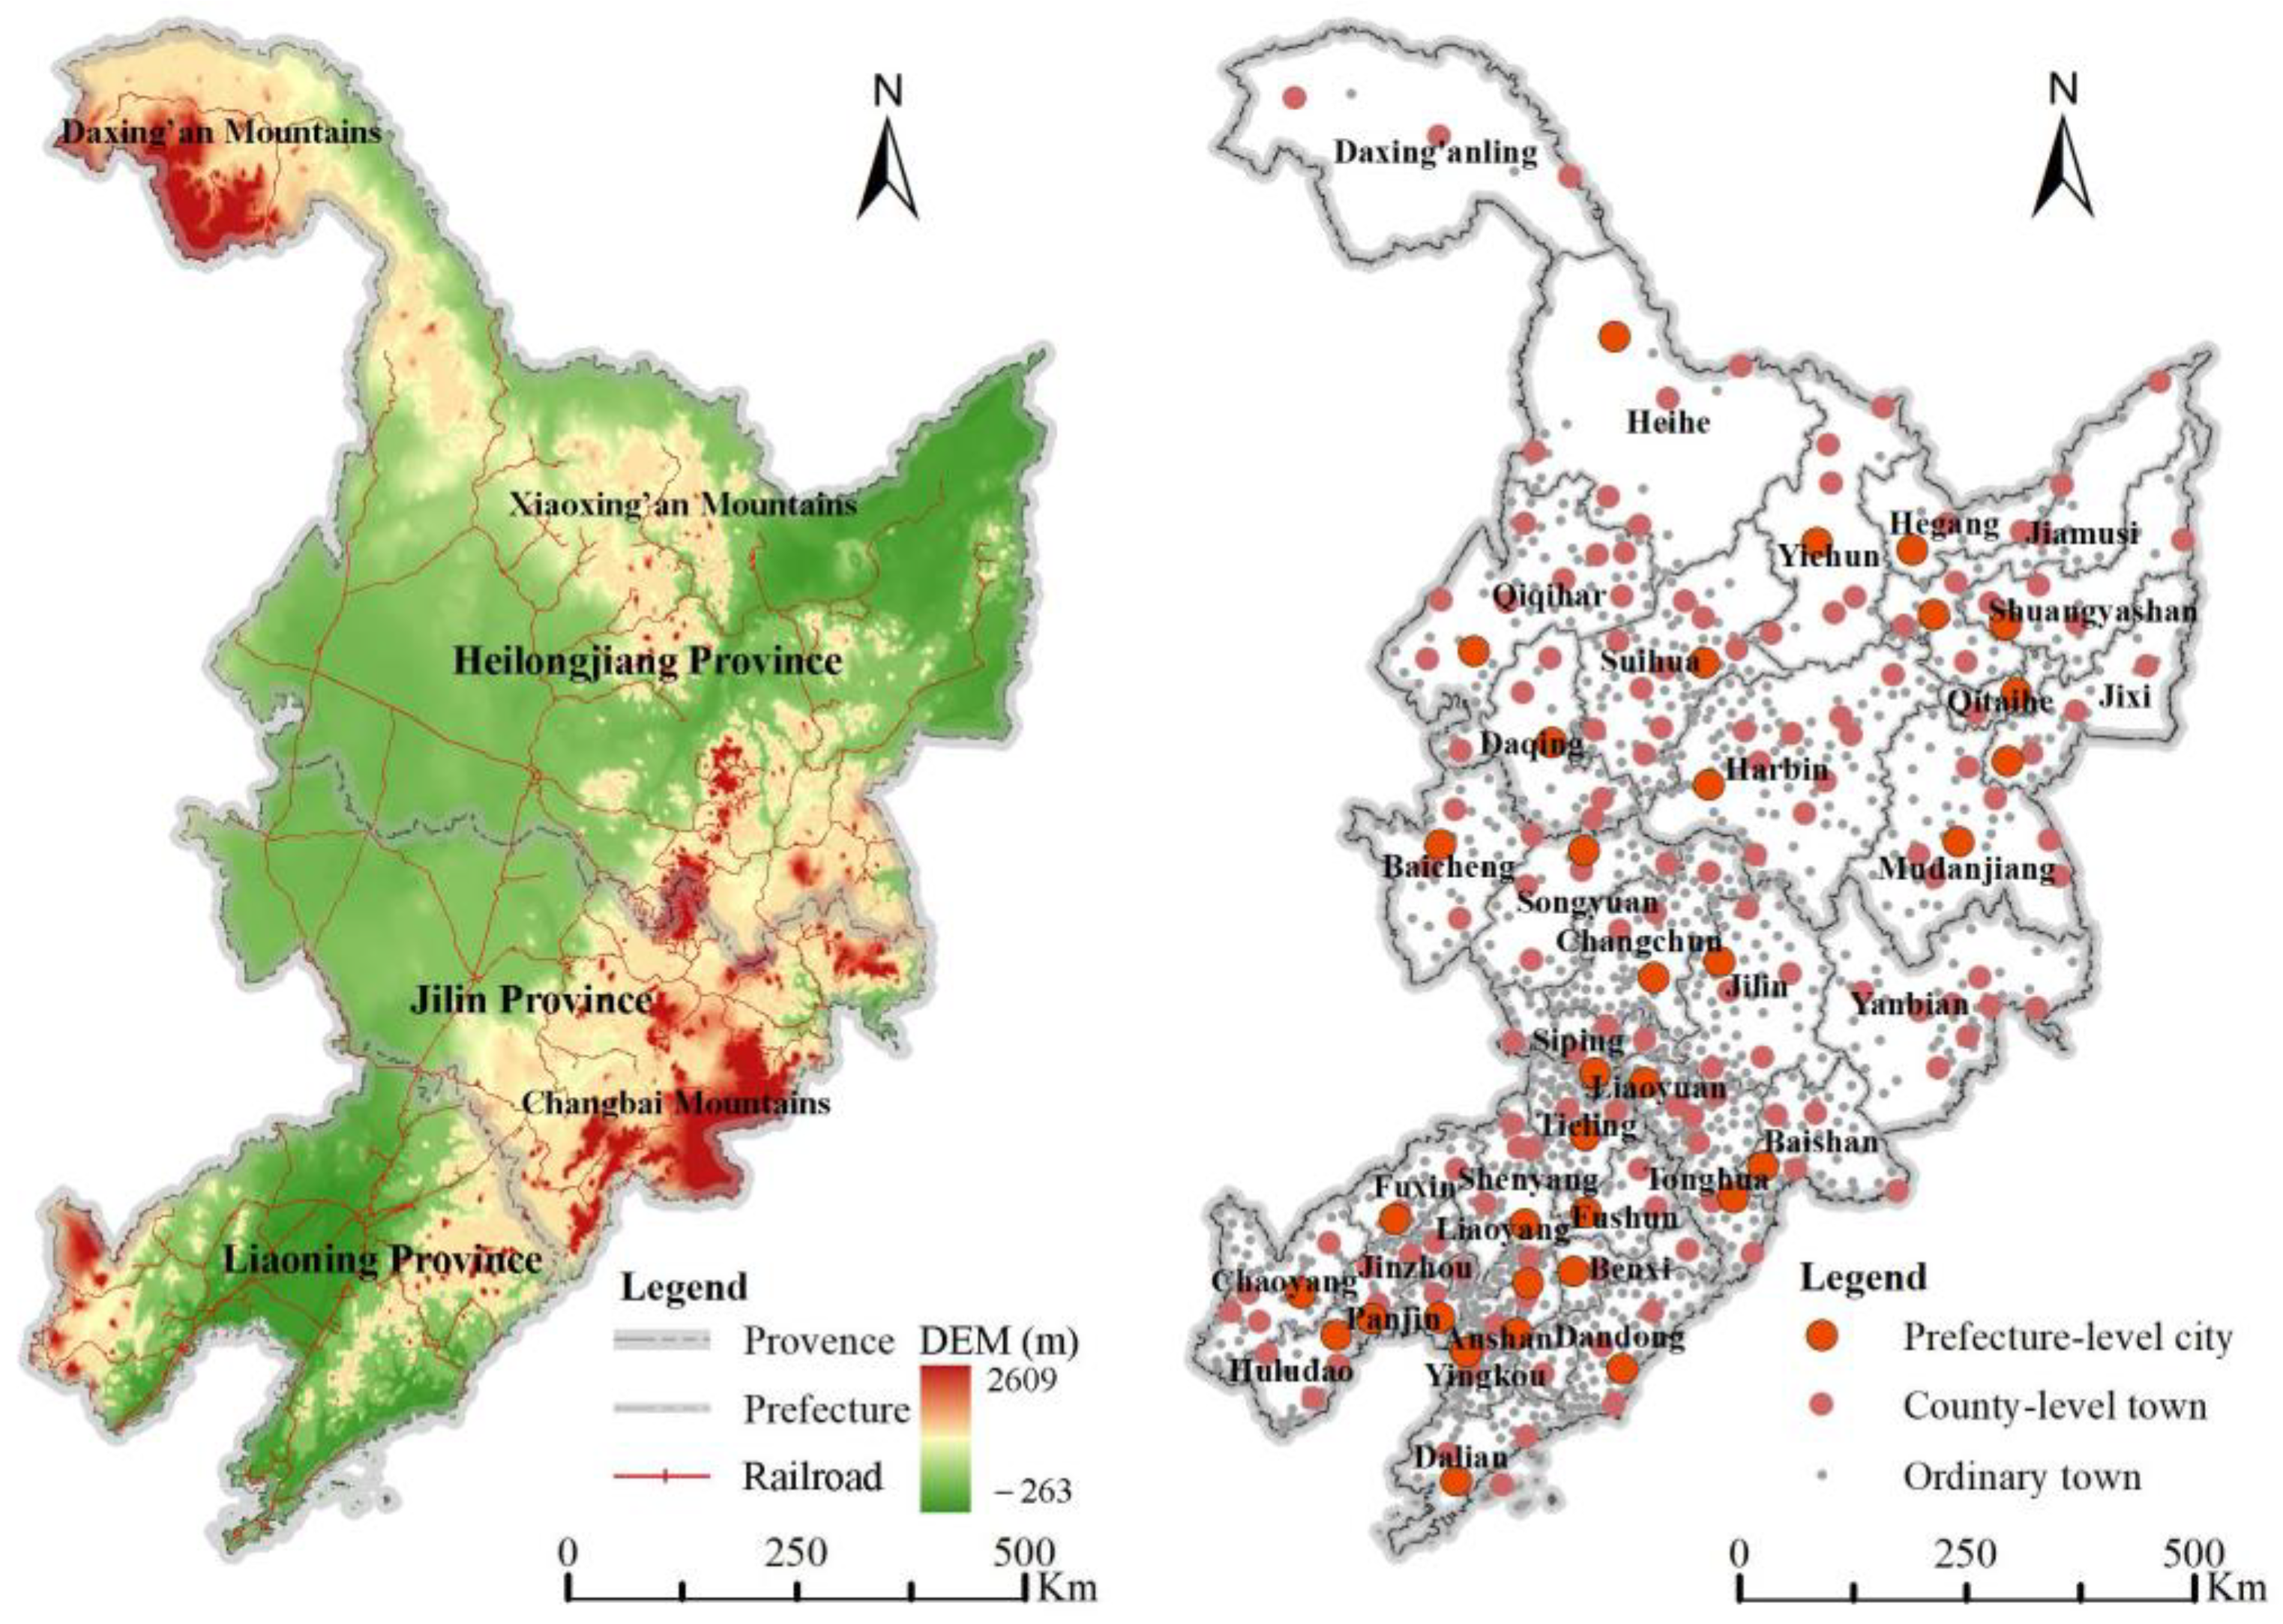
3.1. Study Area

Northeast China, an important old industrial base and a major grain-producing region, is facing the serious challenges of population loss and slowing economic growth. Since the reform and opening up, problems such as stagnant industrial evolution, regional polarization and dual economic structure have gradually become prominent. Since the 21st century, the economic status of Northeast China continues to decline, with some cities and towns even experiencing economic decline. Northeast China is also experiencing increasing population loss of more than 10 million between 2010 and 2020. Except for Shenyang, Changchun, and Dalian, the total population (urban and rural areas) of the 31 prefecture-level cities all declined in different degrees. Therefore, the study chose the period 2000–2020 to observe the multi-level shrinkage of cities and towns in Northeast China. As of 2020, Northeast China includes 34 prefecture-level cities, Daxing’anling Prefecture and the Yanbian Korean Autonomous Prefecture, 147 county-level towns, and 1718 ordinary towns (Figure 3). In this study, three county-level towns with missing data and 538 ordinary towns with zoning adjustments and missing data were excluded.

3.2. Indicators and Data Sources

Referring to the relevant studies of scholars [10,13,16], this study selects the factors affecting the urban shrinkage in Northeast China from five aspects, including population, economy, industry, infrastructure, and environment (Table 1). Population data are mainly derived from information from the fifth, sixth, and seventh Chinese censuses. In addition, the data in the regression analysis include some socio-economic statistics and environmental data. The relevant variables are provided below.

3.2.1. Dependent Variable

The average annual rate of population change is expressed using the average annual rate of change of resident population in municipal districts of prefecture-level cities, the average annual rate of change of population (sum of registered and temporary population) in the built-up area of county-level cities, the average annual rate of change of resident population in the built-up area of county-level towns (Chengguan towns), and the average annual rate of change of resident population in urban areas of ordinary towns1.

3.2.2. Independent Variable

Population data were obtained from census data and statistical yearbooks of ordinary towns. The aging rate uses the proportion of the population aged 65 or older; the proportion of floating population uses the proportion of non-local resident population in municipal districts, counties, and towns in the total resident population; and population concentration uses the ratio of the urban population to the total population of the area. The level of economic development uses the change rate of GDP of municipal districts and counties and the nighttime light value of ordinary towns. Investment in fixed assets uses the amount of investment in fixed assets completed in municipal districts and counties, and average urban wages use the average salary of urban workers in municipal districts and counties. Data on economic performance are obtained from statistical information of provinces and cities and global NPP-VIIRS-like nighttime light data [51]. Enterprise scale uses the number of industrial enterprises in municipal districts and counties, and the number of industrial enterprises with registered capital above 500,000 in ordinary towns; the ratio of secondary and tertiary industries uses the ratio of added value of secondary and tertiary industries in municipal districts and counties; the number of high-tech enterprises uses the number of high-tech enterprises in municipal districts, counties, and towns; and data on industrial development are obtained from statistical information of cities and counties and the commercial query platform Tianyancha (https://www.tianyancha.com, accessed on 14 December 2021). The medical level uses the number of beds per 10,000 people in municipal districts and counties and the number of medical and health facilities per 10,000 people in ordinary towns; the level of road traffic uses road length per capita in municipal districts, counties, and towns. Medical level and road level data are from statistical yearbooks of provinces and cities for 2011 and POI data for 2014. Air pollution index data were obtained from global PM2.5 raster datasets published by the Atmospheric Composition Analysis Group of Washington University in St. Louis (https://sites.wustl.edu/acag/datasets/surface-pm2-5/, accessed on 16 June 2022) [52]. Finally, arable land data were obtained from the Resource and Environment Science and Data Center of the Chinese Academy of Sciences (https://www.resdc.cn, accessed on 14 December 2021).

3.3. Research Methods

3.3.1. Identification of Shrinking Cities and Towns

Most scholars use population decline as the primary criterion for identifying shrinking towns [8,23,53]. Some scholars also identify shrinking towns from multiple dimensions such as demographic, economic, and social [54] or with the help of nighttime light data [12,28]. In this study, the average annual change in urban population was used as an indicator for identifying urban shrinkage.
R P O P = M n 2 M n 1 1 n 2 n 1 1 × 100
Here, R P O P is the rate of shrinkage of the town, M n 1 and M n 2 are the population numbers in the initial and final years, and n 2 n 1 is the population change during the study period. When R P O P < 0 , the town is experiencing shrinkage, and the higher the absolute value of R P O P , the higher the shrinkage of the town. When R P O P < 2 % , the town experiences a significant shrinkage.

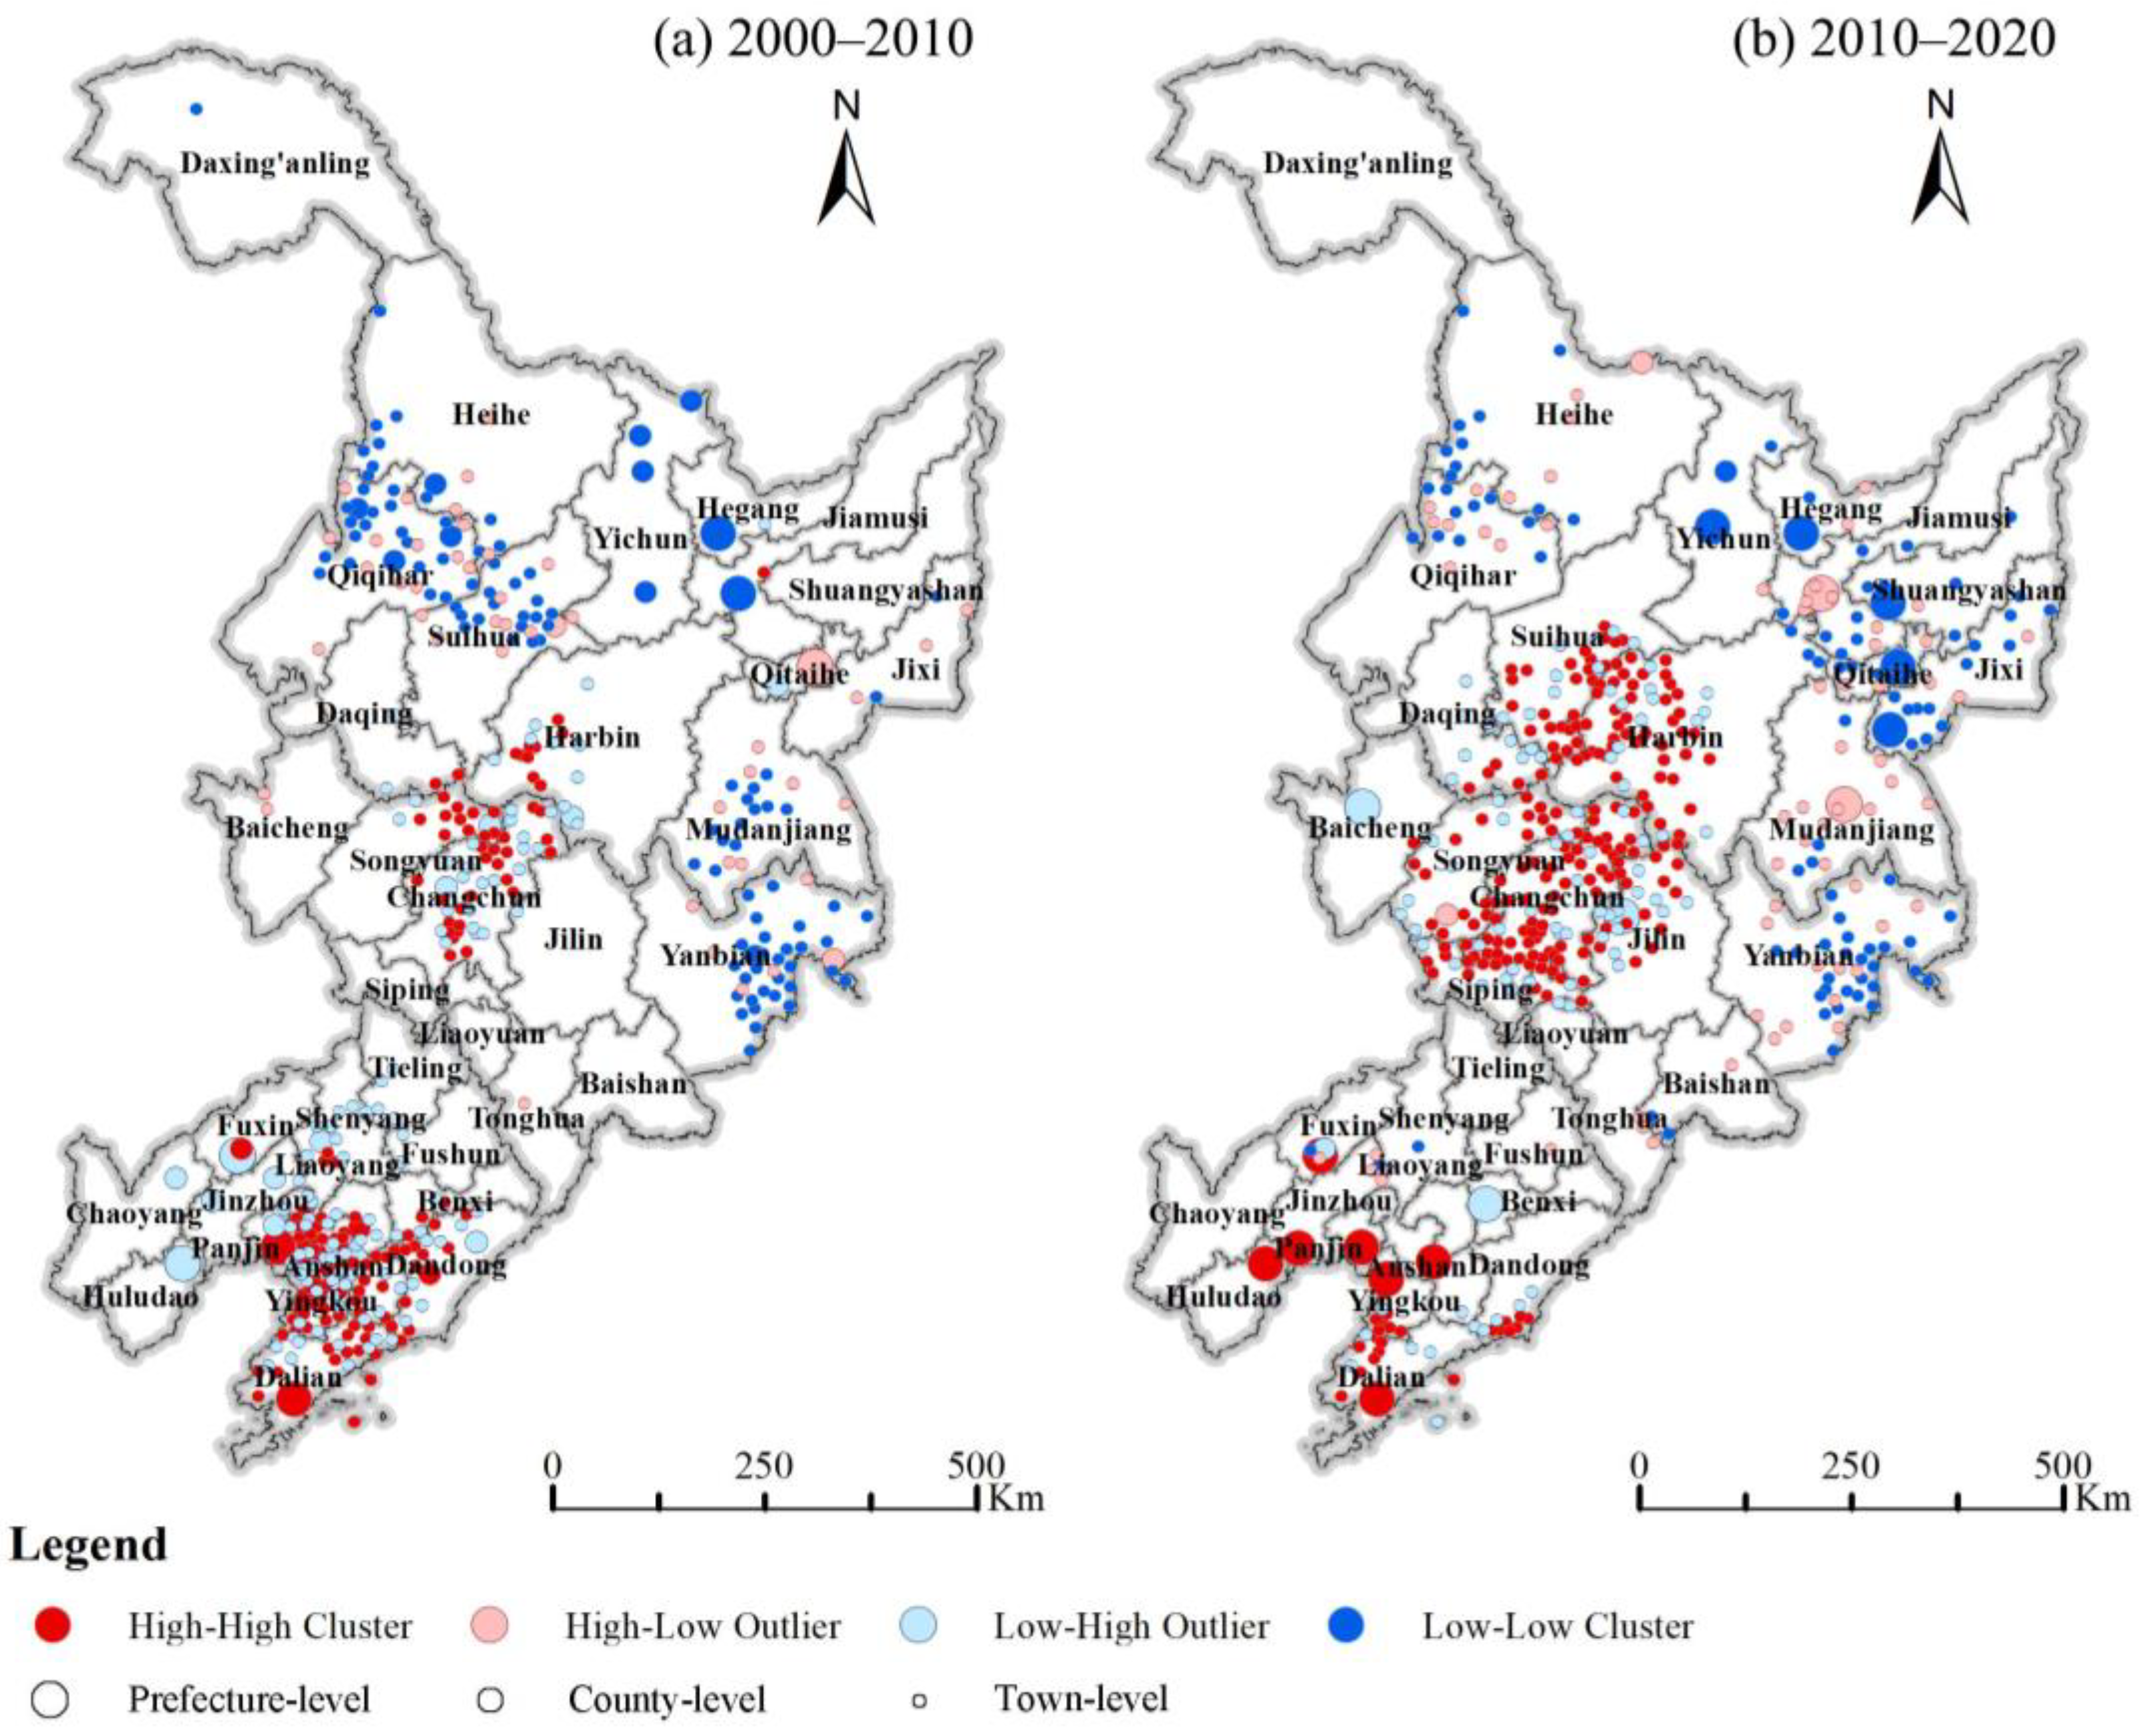
3.3.2. Methods of Spatial Autocorrelation Analysis

Global autocorrelation is usually illustrated using Moran’s I [55], which measures the general trend of the spatial correlation of the shrinkage rate of shrinking towns. It is calculated as follows:
I = n i = 1 n j = 1 n w i j x i x ¯ x j x ¯ i = 1 n j = 1 n w i j x i x ¯
Local autocorrelation is usually illustrated using the local Moran’s I [56], which measures the local spatial relationship between the shrinkage rate of shrinking towns and the shrinkage rate of surrounding shrinking towns. It is calculated as follows:
I = n x i x ¯ i = 1 n x i x ¯ 2 j = 1 n w i j x j x ¯
where n is the total number of shrinking towns. xi and xj are the shrinkage rates of towns i and j, respectively; x ¯ is the mean value of the shrinkage rate; and wij is the spatial weight matrix indicating the proximity of towns i and j; i = 1, 2, 3, …, n; j = 1, 2, 3, …, n; ij.

3.3.3. Methods of Influencing Factors Analysis

This study analyzes the factors influencing the shrinkage of cities and towns in Northeast China. First, this paper uses an ordinary least square (OLS) model [57] to identify the key factors of urban shrinkage in prefecture-level cities, county-level towns, and ordinary towns. The OLS model is as follows:
Y = k X + b
where Y is the average annual rate of change of the urban population as a dependent variable, and X is an independent variable, i.e., indicator that affects the change of the urban population.
However, OLS models can usually only regress data for towns at the same level, making it difficult to observe the impact of higher-level towns on lower-level towns. Based on the HLM model, this study further analyzes the impact of high-level towns on the shrinkage of lower-level towns under their jurisdiction in order to explore the extent and path of the influence of high-level towns on lower-level towns [58]. Specific forms of HLM models can be divided into zero models, random effects models, and full models. The HLM model of the “prefecture-level city-county town” is taken as an example.
Zero model: The null model is the premise and basis for the construction of the HLM model. This model is used to explain the between-group and within-group effects and to determine whether the town shrinkage of each county town is affected by the prefecture-level city and the county town. In the null model, only the dependent variable is added to the first-level (county-level town) model and to the second-level (prefecture-level city) model in order to construct the model directly (as shown in Equations (5)–(7)):
Level   1 :   Y i j = β 0 j + ε i j
Level   2 :   β 0 j = γ 00 + μ 0 j
Mix   model :   Y i j = γ 00 + μ 0 j + ε i j
Random effects model: A random effects model is used to add explanatory variables to the first level of the null model in order to investigate the effects of prefecture levels and county levels on county-level town shrinkage (as shown in Equations (8)–(11)):
Level   1 :   Y i j = β 0 j + β 1 j X i j + ε i j
Level   2 :   β 0 j = γ 00 + μ 0 j
β 1 j = γ 10 + μ 1 j
Mix   model :   Y i j = γ 00 + γ 10 X i j + μ 0 j + μ 1 j X i j + ε i j
Full model: The full model is based on a random effects model with the addition of prefecture-level and city-level variables to the second tier of the model. This approach not only allows testing the multiple effects of influencing factors on county-level town shrinkage at the prefecture-level and county-level but also enables analysis of the effects of prefecture-level and county-level influencing factors on county-level town shrinkage (as shown in Equations (12)–(15)):
Level   1 :   Y i j = β 0 j + β 1 j X i j + ε i j
Level   2 :   β 0 j = γ 00 + γ 01 W j + μ 0 j
β 1 j = γ 10 + γ 11 W j + μ 1 j
Mix   model :   Y i j = γ 00 + γ 01 W j + γ 10 X i j + γ 11 W j X i j + μ 0 j + μ 1 j X i j + ε i j
where i and j denote units at the county town and prefecture-level city; the explanatory variable Yij denotes the shrinkage rate of county town i within the jth prefecture-level city; Xij denotes the county town effects on the shrinkage rate of county town i in prefecture-level city j; β0j and β1j denote the intercept and slope, respectively; εij is the residual variance at the first level; Wj denotes the prefecture-level city influences; γ00 and γ10 show the intercepts of the equation; γ01 and γ11 show the regression coefficients of the cross-level effects of the prefecture-level city influences on the county town; and μ0j and μ1j represent intercept and slope residuals.

4. Hierarchical Differences and Correlations of City and Town Shrinkage

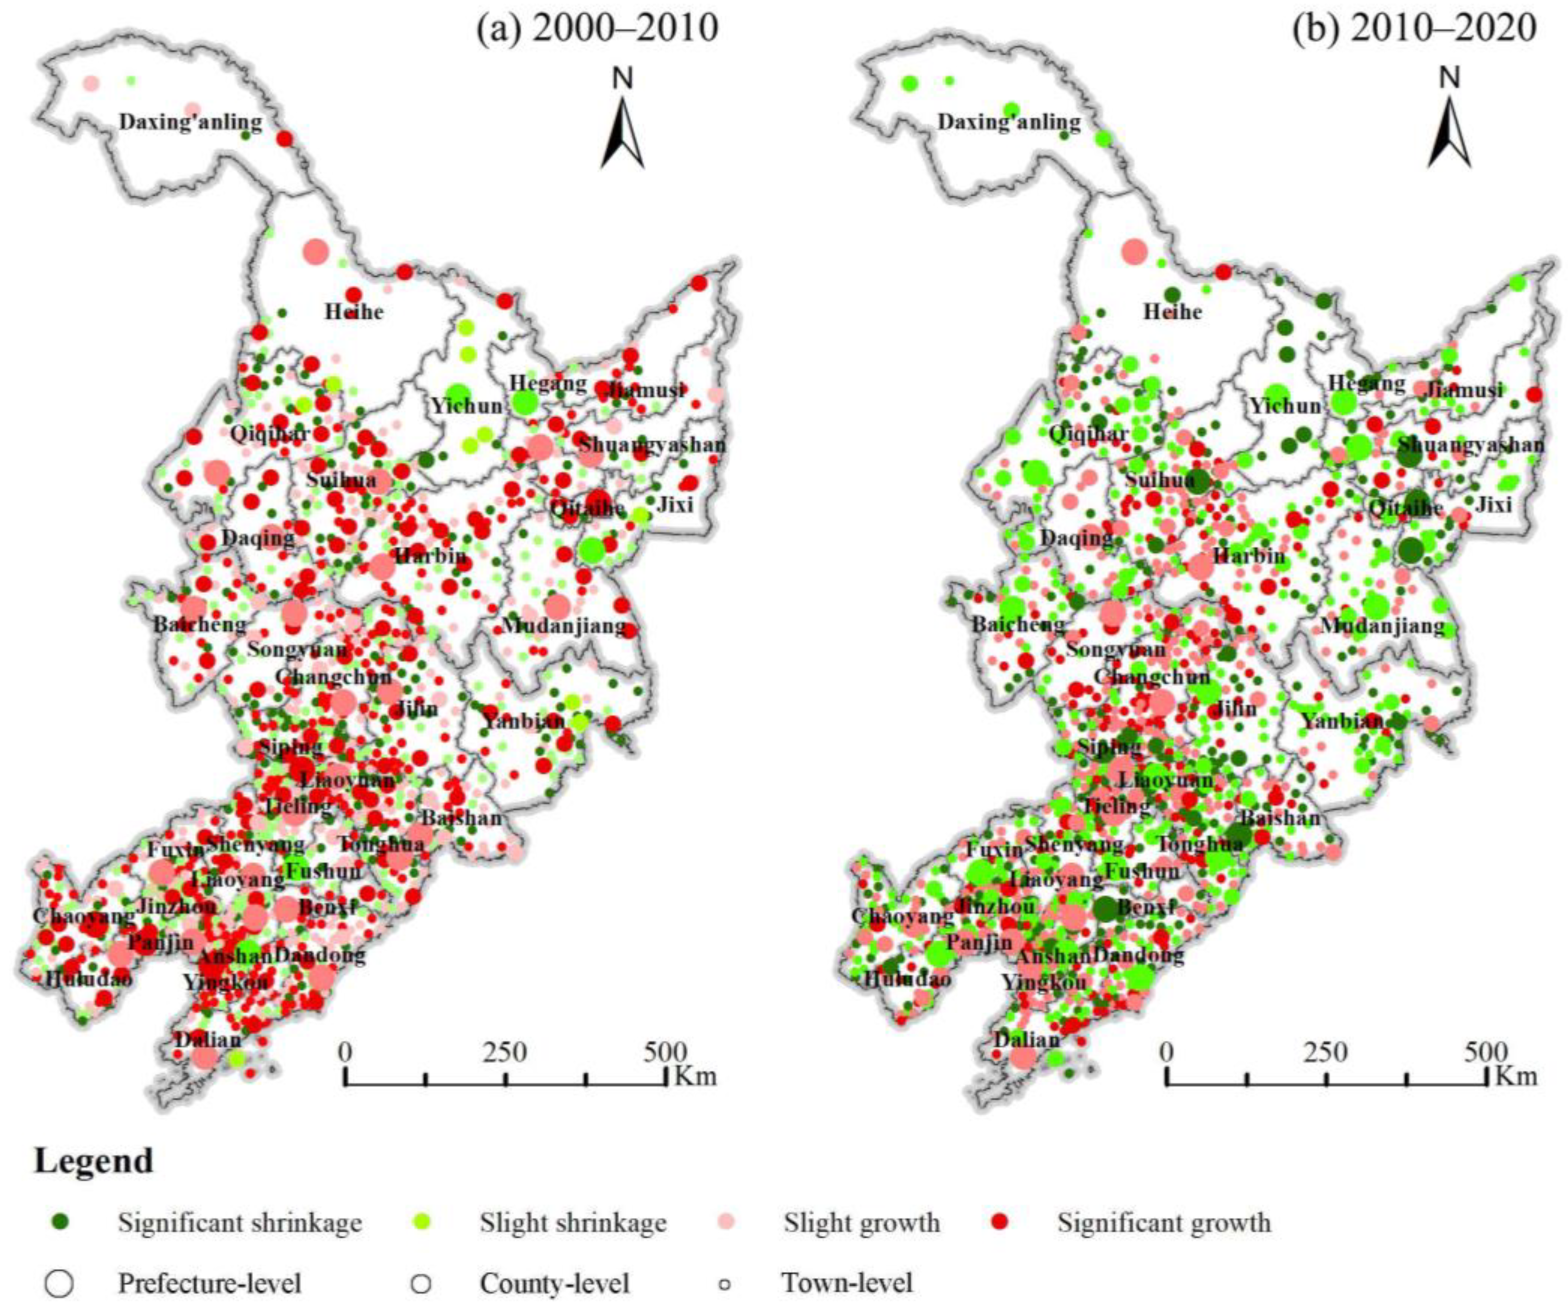
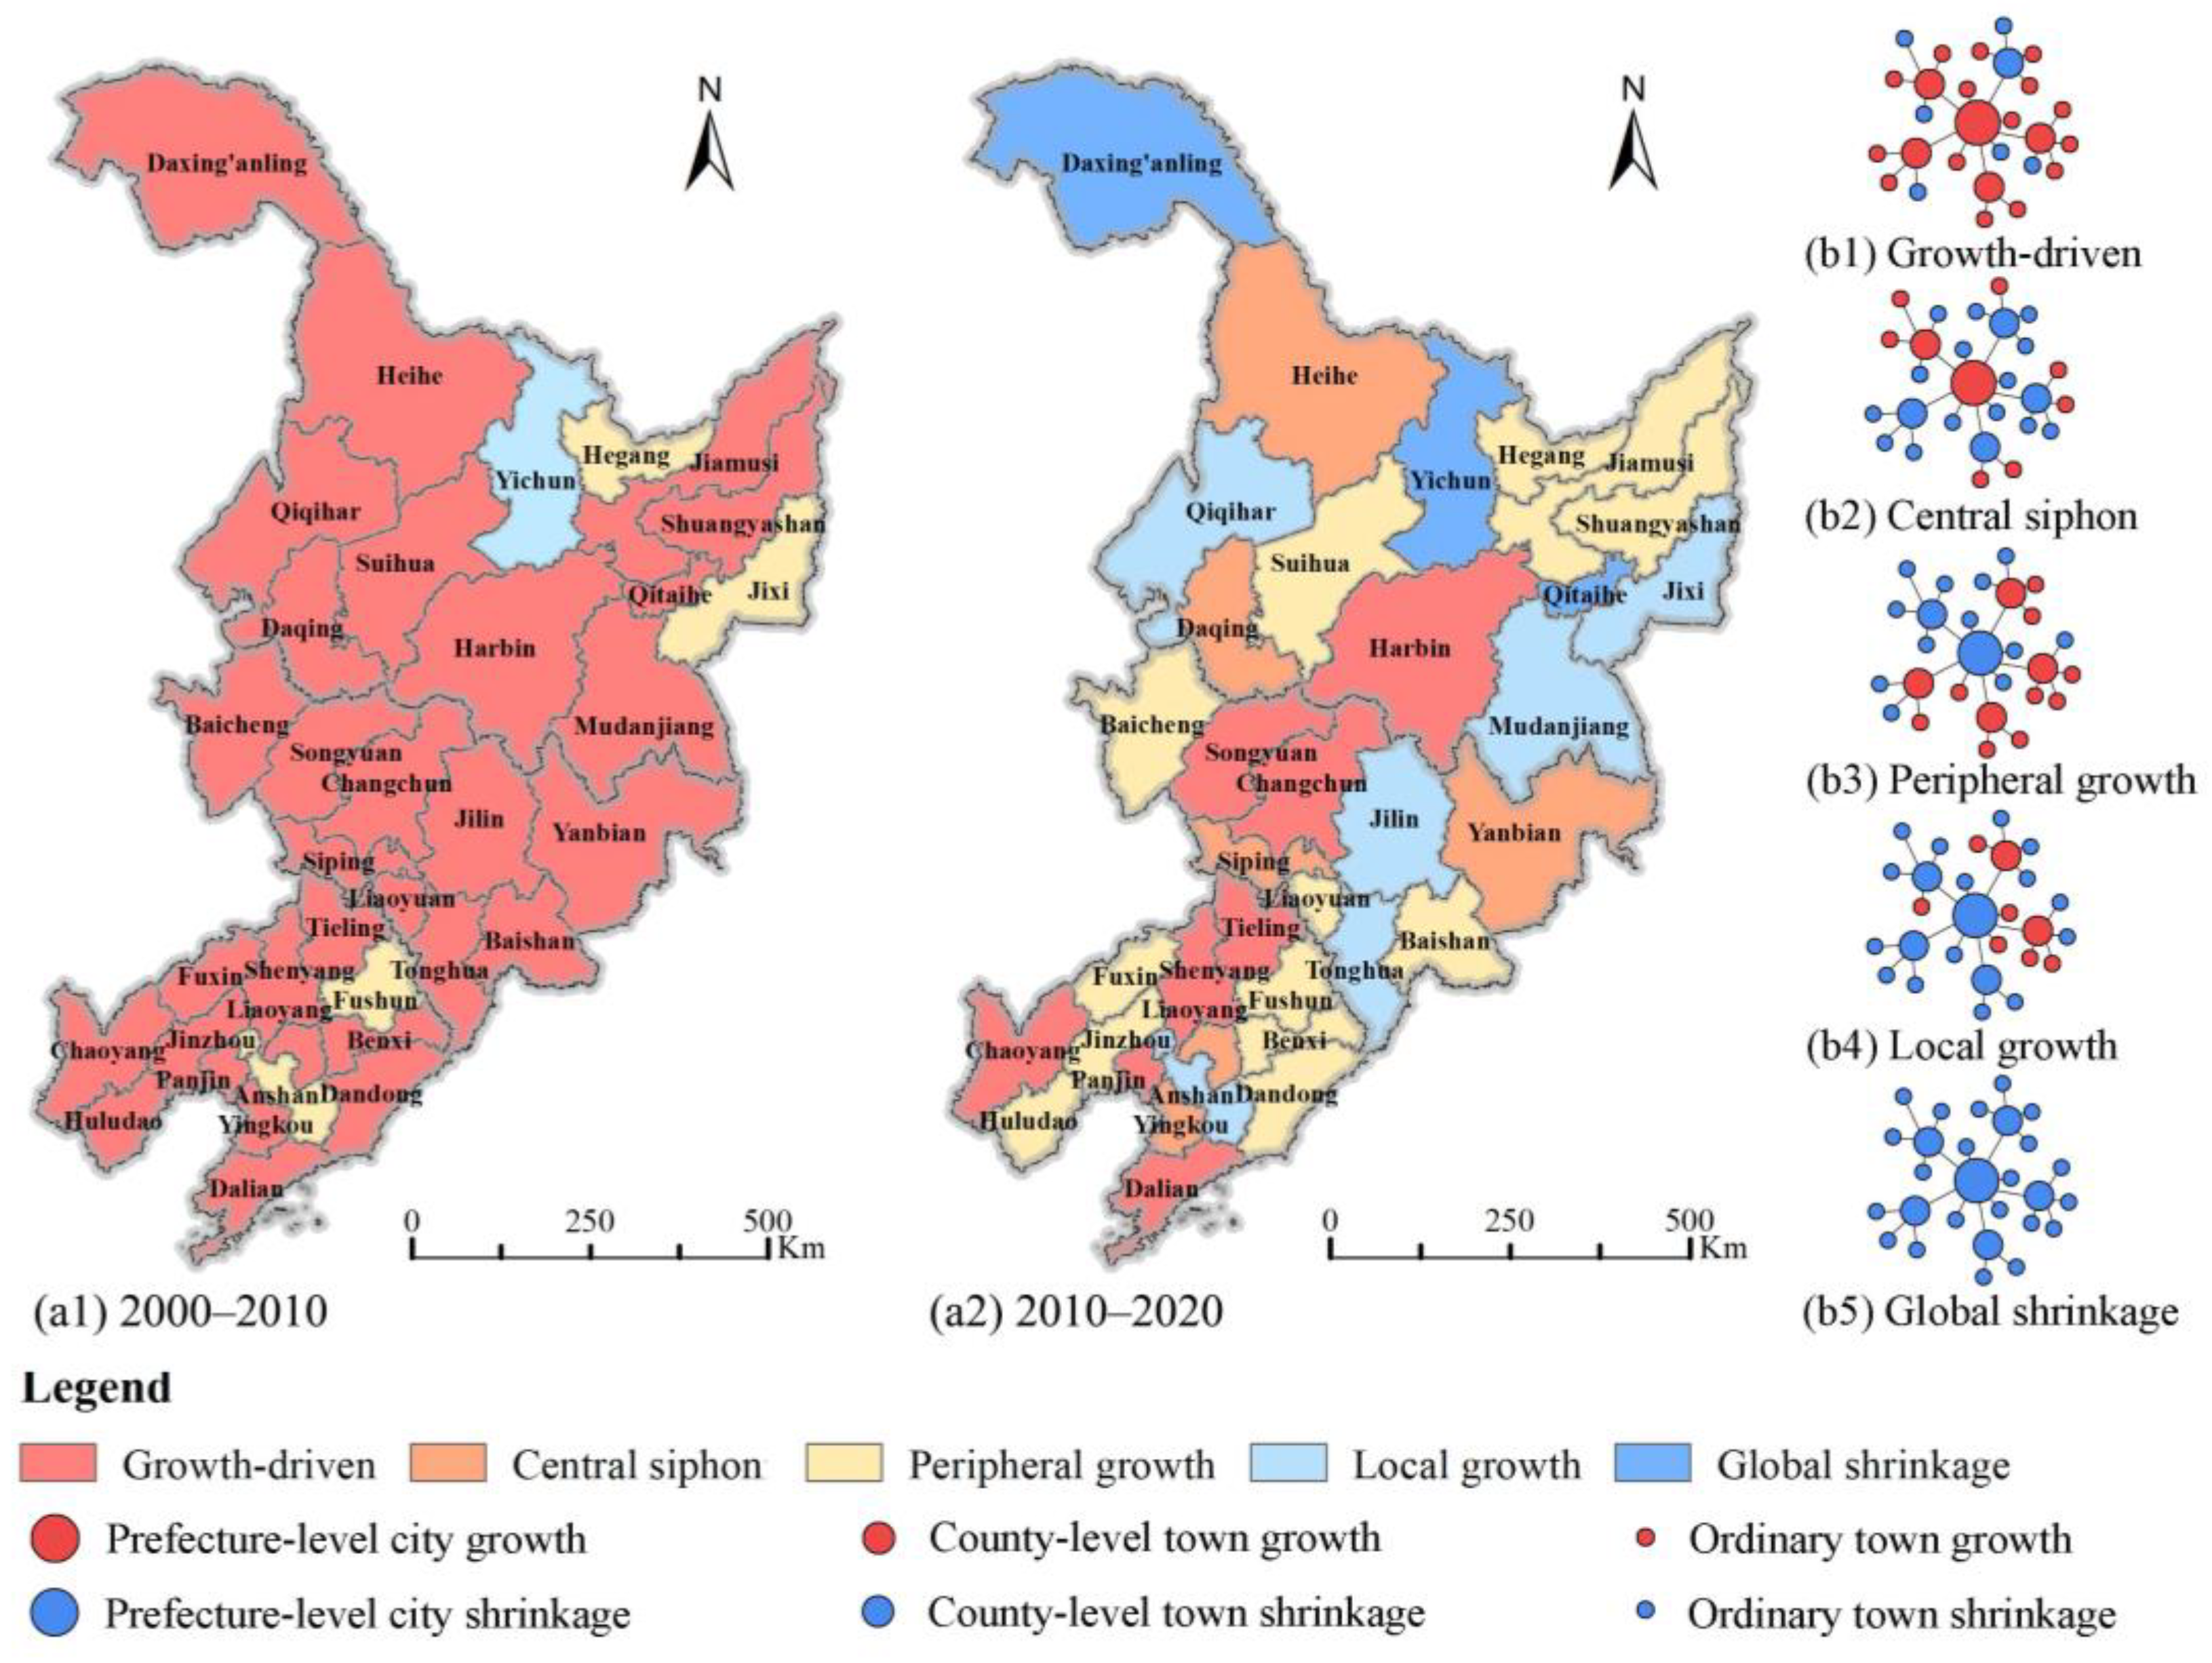
4.1. Hierarchical Differences

Urban shrinkage in Northeast China mainly occurs in the period 2010–2020 and shows multi-level variability (Table 2). From 2000 to 2010, Northeast China shows a normal urbanization trend with population moving from small towns to large and medium cities. Most prefecture-level cities and county-level towns maintain growth and only some ordinary towns experience urban shrinkage. From 2010 to 2020, the spatial polarization of the urban population in Northeast China is becoming more pronounced. More than half of the prefecture-level cities, county-level towns, and ordinary towns will be among the shrinking towns, showing an “overall” shrinkage trend.
The shrinkage of cities and towns in Northeast China varies significantly depending on their level. Prefecture-level cities showed the most widespread shrinkage, with 17.6% showing a significant shrinkage and 41.2% showing a slight shrinkage in the period 2010–2020. The proportion of both slight and significant shrinkage at the county level is slightly lower than at the prefecture level. However, the proportion of shrinking towns at the county level is growing rapidly, from 7.6% in the period 2000–2010 to 54.2% in the period 2010–2020. The ordinary towns showed the most severe and continued shrinkage, with almost half experiencing shrinkage and about 25% experiencing significant shrinkage in both periods.
The spatial distribution of urban shrinkage in Northeast China shows significant differentiation at multiple levels (Figure 4). Shrinking prefecture-level cities are mostly land border cities, showing a spatial pattern of “marginal shrinkage”. Shrinking towns at the county level show evolutionary characteristics from “sporadic” clustering to “balanced” distribution. Most county-level towns in prefecture-level administrative divisions show the coexistence of “growth and shrinkage”. The shrinkage of ordinary towns generally shows an expanding trend from north to south. Shrinking towns at all levels in Northeast China are concentrated in the Changbai Mountains in the east and the Xiaoxing’an Mountains in the north, showing the significant characteristic of “mountain shrinkage”.
The global spatial autocorrelation of city and town shrinkage in Northeast China is not significant, and its spatial agglomeration characteristics are only reflected in local space. There are four types of local spatial autocorrelation. They include High-High type, where both the town and surrounding towns with no shrinkage or low shrinkage are located; High-Low type, where the town with no shrinkage or low shrinkage and surrounding towns with high shrinkage are located; Low-Low type, where both the town and surrounding towns with high shrinkage are located; and Low-High type, where the town with high shrinkage and surrounding towns with no shrinkage or low shrinkage are located.
There are hierarchical differences in the spatial clustering characteristics of urban shrinkage in Northeast China (Figure 5). Spatial agglomeration of cities at the prefecture level is increasingly pronounced in the “high south and low north”. The High-High and Low-High types are concentrated in the coastal areas of Liaoning Province, while the Low-Low types are concentrated in northeastern Heilongjiang Province. The spatial clustering characteristics of county-level towns shift from “localized clustering” to “random distribution”, with the Low-Low type in the northern and western regions of Heilongjiang Province and the Low-High type in the coastal region of Liaoning Province decreasing significantly. The most significant feature of local autocorrelation is noticed in ordinary towns. The High-High and Low-High types gradually shift from the coastal areas of Liaoning Province to the Ha-Chang urban agglomeration, and the Low-Low types are concentrated in the western and eastern parts of Heilongjiang Province and the eastern part of Jilin Province.
General results indicate that: (1) the High-High and Low-High types of the prefecture-level cities, the Low-High types of county-level towns, and the High-High types of ordinary towns overlap in the coastal area of Liaoning Province, which indicates that the development of all levels of towns in the region is generally high; (2) the Low-Low types of prefecture-level cities, county-level towns, and ordinary towns overlap around Yichun City, which indicates that the development level of all towns in the region is much lower than the development level of the surrounding areas; and (3) the High-Low and Low-Low types of prefecture-level cities and ordinary towns overlap in northeastern Heilongjiang Province, and the spatial types of county-level towns are not significant. The main shrinkage in the region is noticed in prefecture-level cities and ordinary towns, and the shrinkage of county-level towns is not significant.

4.2. Hierarchical Correlations

Shrinking towns are a product of the development of a regional town system and do not exist in isolation. In China, prefecture-level cities, county-level towns, and ordinary towns form several relatively common and closely related regional town systems, which are important units of regional development. These regional town systems are an organic whole with prefecture-level cities as the core and a range of towns of different sizes and functions. By changing the constituent elements within the regional system, the dynamic balance of the development of towns in the region also changes. Some towns quickly develop into new growth poles, and those that do not take advantage of the opportunity gradually shrink.
Based on the growth and shrinkage patterns of regional towns, this study classifies the regional town system into five types: growth-driven, central siphon, peripheral growth, local growth, and global shrinkage (Figure 6). Growth-driven type suggests that prefecture-level cities, county-level towns, and ordinary towns are generally in a state of growth. Central-siphon type indicates that prefecture-level cities maintain growth, while most county-level towns and ordinary towns shrink. Peripheral-growth type shows that prefecture-level cities and most ordinary towns are shrinking, but half or more of the county-level towns are still growing. Local-growth type indicates that prefecture-level cities, most county-level towns, and ordinary towns are shrinking. Global-shrinkage type suggests that prefecture-level cities, county-level towns, and most ordinary towns are also shrinking.
The spatial differentiation of urban shrinkage in Northeast China regarding multiple levels and types of association became prominent after 2010. The spatial polarization of the population became more pronounced, shifting from the pattern of “small towns partially shrinking, while large and medium-sized towns maintain growth” to the pattern of “small and medium-sized towns widely shrinking, while some large cities polarize and grow”.
The “growth belt” along the Harbin–Dalian Railway contrasts with the “shrinking belt” in the mountainous areas in the east and north from 2010 to 2020. The growth of cities and towns at all levels in Northeast China has been slow, and in some areas, all cities and towns at the “prefecture-county-town” level have shrunk. The drivers of growth are mainly concentrated around the “Harbin-Dalian Railway”, which is the growth belt of Northeast China. The central cities in this region drove the rapid development of the surrounding small- and medium-sized towns through the decentralization and diffusion of functions and industries. The central siphoning type is represented by Daqing and Heihe City. Cities at the prefecture level have a weak economic and industrial driving ability to subordinate towns, and the diffusion effect is not significant, i.e., it is still in the siphoning development stage. The population and resource factors of subordinate small and medium towns are concentrated in central cities. The peripheral growth type is mainly located in northeastern Heilongjiang Province and northeastern and western Liaoning Province. The central cities are mostly resource-based towns, which are not strongly connected to the industry of county-level towns and ordinary towns under their jurisdiction. When the central cities experience industrial and population decline due to resource depletion, the county-level towns and ordinary towns under their jurisdiction have a certain degree of resilience based on their resource endowments and industrial bases and do not shrink in tandem with the central cities. Local growth and global shrinkage types are mostly found in remote areas away from economic centers and transportation arteries. Central cities of this type suffer from economic and industrial decline, and small and medium towns are also in a state of shrinkage, making it the most severe area of urban shrinkage in Northeast China.

5. Associated Mechanisms of City and Town Shrinkage in Northeast China

5.1. Factors Affecting Shrinkage of Multi-Level Cities and Towns

This paper uses the OLS model to identify the factors influencing different levels of shrinkage of cities and towns in Northeast China (Table 3). The obtained results show that the shrinking of cities at the prefecture level is mainly caused by the lower level of economic development (ECO1), insufficient investment in fixed assets (ECO2), lagging in the development of tertiary industry (IND3), and poor level of traffic facilities (INF2). The shrinkage of county-level towns is mainly caused by a smaller percentage of floating population (POP2), smaller size of county towns (POP3), slow economic development (ECO1), smaller number of enterprises (IND1), proportion of secondary industry (IND2), and a low level of high-tech industry (IND4). The shrinkage of ordinary towns is mainly caused by a smaller number of rural inhabitants (POP3), a larger proportion of secondary industries (IND2), a lower proportion of tertiary industries (IND3), insufficient level of high-tech industry (IND4), poor medical care (INF1), air pollution (ENV1), and lack of arable land (ENV2). However, what is interesting is that more enterprises (IND1) would not stop the population decline in small towns. The robustness tests of the OLS model are shown in Appendix A.
There are significant correlations and differences in the factors affecting the shrinkage of cities and towns at different levels in Northeast China. Poor infrastructure is a common problem in the shrinkage of cities and towns at all levels and has a significant negative impact on the attractiveness of the population, average life expectancy, and natural growth rate of towns. The shrinkage of low-level towns is more limited by factors such as industry, infrastructure, and environment, while the factors affecting the shrinkage of high-level cities are related to economy, technology level and infrastructure. Differences in demographics and average wages between shrinking cities and towns of the same level are small, which leads to insignificant regression results for the aging rate and average wages in towns.

5.2. A Multilevel Correlation Analysis of Factors Influencing Shrinking Cities and Towns

5.2.1. Cross-Level Impact of Prefecture-Level Cities on County-Level Towns

The obtained results show significant cross-level interactions between prefecture-level cities and county-level towns (Table 4). At the prefecture level, the indices of economic level, average wage, medical level, and transportation level pass the significance test. These prefecture-level indicators have significant cross-level effects that can be superimposed to the share of floating population, population concentration, economic level, and proportion of secondary industry of county-level towns.
Improving the level of economic development of prefecture-level cities will slow down the shrinkage of county-level towns under their jurisdiction, while improving the salaries, medical care levels, and traffic levels of prefecture-level cities will aggravate the shrinkage of county-level towns under their jurisdiction. With the improvement in the level of economic development, the influence of prefecture-level cities on county-level towns under their jurisdiction has gradually shifted from the siphoning effect to the diffusion effect. Furthermore, county-level towns have increased their population and economic scale and enhanced population attractiveness in the process of industrial and functional expansion of prefecture-level cities. Increasing the average wages in prefecture-level cities increased the willingness of the labor force in subordinate areas to work and move to municipal districts, relatively weakened the attractiveness of the population in county-level towns, and led to a gradual decline in the population center and population scale of county-level towns under their jurisdiction. The huge gap in the level of infrastructure between prefecture-level cities and county-level towns has reduced the attractiveness of county-level towns to the population. Many county populations are driven by the level of service facilities in order to move to prefecture-level cities. The level of traffic in prefecture-level cities can strengthen the socio-economic links between prefecture-level cities and county-level towns, reduce the temporal and spatial costs of population migration, and aggravate the process of population transfer from county-level cities to prefecture-level cities.

5.2.2. Cross-Level Impact of Prefecture-Level Cities on Ordinary Towns

The obtained results indicate significant cross-level interactions between prefecture-level cities and ordinary towns (Table 5). At the prefecture level, average wage, enterprise size, share of tertiary production, high-tech level, medical level, and traffic level pass the significance test. These prefecture-level indicators show significant cross-level effects that can be superimposed to population concentration, the share of secondary production, the share of tertiary production, and the high-tech level of ordinary towns.
Improving enterprise scale and high-tech level in prefecture-level cities will slow down the shrinkage of lower-level ordinary towns, while increasing salary, the share of third industry, medical level, and traffic level in prefecture-level cities will intensify the shrinkage of lower-level ordinary towns. Due to industrial upgrading and transformation, industrial enterprises in prefecture-level cities begin to shift to key ordinary towns under their jurisdiction. This process improves the scale and high-tech level of industrial enterprises in the surrounding ordinary towns and slows down their shrinkage. The increase in wage levels in prefecture-level cities enhanced the willingness of workers in lower jurisdictions to work and move to municipal areas, which leads to a gradual decline in the population centrality and population size of towns under their jurisdiction. The rapid expansion of tertiary industry in prefecture-level cities created many jobs with lower employment thresholds, attracting the population of subordinate ordinary towns to prefecture-level cities. The higher the level of medical services in prefecture-level cities, the stronger the attraction of the population of subordinate ordinary towns, which further promotes the migration of the population of subordinate ordinary towns to prefecture-level cities. Improving the level of road traffic in prefecture-level cities shortens the time distance from subordinate ordinary towns to prefecture-level cities, which promotes socio-economic connections between prefecture-level cities and subordinate ordinary towns. This process further intensifies the siphoning effect of prefecture-level cities on subordinate ordinary towns.

5.2.3. Cross-Level Impact of County-Level Towns on Ordinary Towns

This study obtained significant cross-level interactions between county-level towns and ordinary towns (Table 6). At the county level, the indices of population concentration, economic level, average wage, high-tech level, medical level, and traffic level pass the test of significance. These prefecture-level indicators have significant cross-level effects that can be superimposed on population concentration, enterprise size, the share of secondary production, the share of tertiary production, high-tech level, medical level, and environmental pollution of ordinary towns.
Technological improvement of enterprises in county-level towns will slow down the shrinkage of ordinary towns, while population concentration, economic level, average wages, medical level, and traffic level of county-level towns will intensify the shrinkage of ordinary towns. The greater the population centrality of county-level towns, the greater the degree of development of the county town and its attractiveness for the population of subordinate towns. The higher the average wages in county-level towns, the stronger the attraction for the labor force of lower-level ordinary towns. This is not conducive to the development of industries in ordinary towns and accelerates the migration of the population of ordinary towns to county cities. Due to industrial upgrading and transformation, industrial enterprises in county-level towns begin to shift to key ordinary towns under their jurisdiction. This process largely increases the competitiveness of industrial enterprises in ordinary towns, expands the scale of industrial enterprises and employment in ordinary towns, and slows down the shrinkage of ordinary towns. Improving traffic level in county-level towns can weaken the positive effect of the scale of the three industries on the population of ordinary towns, which in turn aggravates the shrinkage of ordinary towns. Furthermore, the improvement of traffic level in county-level towns decreases the time distance from lower ordinary towns to county towns and accelerates the socio-economic flow between county towns and lower ordinary towns. This makes the residents of ordinary towns more inclined to go to county towns for medical treatment and consumption, which decreases the local consumption in ordinary towns. In turn, the positive effects of the scale of tertiary industry and medical treatment level in ordinary towns on the population of the ordinary towns are weakened.

5.3. Associated Mechanisms of Multi-Level Shrinking Cities and Towns

The effects of agglomeration and diffusion are important mechanisms of multi-level shrinking towns in Northeast China. Wages, medical care, and road traffic in higher-level cities have a strong siphoning effect on lower-level towns, while the high-tech level and industrial development of higher-level cities have a significant diffusion effect on lower-level towns. However, there are more complex hierarchical differences in population shrinkage due to the interconnectedness of factors at multiple town levels. When a central city shows a shift from growth to shrinkage, population shrinkage between high- and low-level towns will show different effects of aggregation and diffusion.
When a central city grows, it attracts large numbers of people from the low-level towns due to higher wages, better health services, better infrastructure, and more jobs, which in turn expands the size of the central city. When the size of the central city reaches a certain level, the marginal effect of the agglomeration economy tends to decline, and the diffusion effect of the central city to subordinate towns becomes prominent. By absorbing the industry of the central city and borrowing the functions and facilities of the central city, the economy and industry of the low-level towns under its jurisdiction are developing rapidly. When the agglomeration effect of the central city is much greater than the diffusion effect, the population of the central city grows while small- and medium-sized towns continue to lose population. Furthermore, when the diffusion effect of the central city is dominant, the central city and the subordinate small- and medium-sized towns maintain the overall growth trend.
When the central city shrinks, the economic and industrial development of the central city stagnates, and the cross-level influence on the subordinate county-level towns and ordinary towns diminishes. While some county towns with a certain population and industry size have not declined along with the central city, they have shown a resilience and independent development.
Ordinary towns are influenced by central cities and county towns. There is a huge difference between ordinary towns and high-level towns regarding industry, infrastructure, and habitat. Thus, it is difficult for ordinary towns to reverse their shrinking trend by expanding their economies and industries. Most ordinary towns experienced population decline, except for those with abundant arable land resources, which barely maintained a certain population size.

6. Discussion

Northeast China’s multi-level urban system can be seen as a co-evolutionary process, with cities and towns interacting within and between levels. The co-evolutionary process is complex and diverse due to differences in socio-economic status and interactions between cities and towns [59,60]. Industry and infrastructure play a key role in the co-evolution of urban systems. The socio-economic condition of the central city directly affects the growth and shrinkage of other towns in the urban system. However, even when the central city shrinks, the subordinate county-level towns and ordinary towns can still maintain a strong population and economic vitality. As the political, economic, and cultural center of the region, the stage of central city development plays an important role in influencing the spatial patterns of socio-economic development, growth, and shrinkage of towns at all levels under its jurisdiction. The sustainable development of towns’ industries is the basis for harmonious development of multi-level towns in the region. In areas such as Harbin, Changchun, Shenyang, and Dalian, the transformation and upgrading of industry in the central cities have been largely completed. By taking over the original industries of the central cities or by incorporating them into the system of industrial production and borrowing the facilities and functions of the central cities, small- and medium-sized towns in the region grow rapidly. In regions such as Daqing, the central city has a strong industrial base and well-developed infrastructure, which attracts young people from low-level towns and rural areas on the periphery. Due to the over-dependence of the central city’s industrial development on oil extraction and the limited role of industrial diffusion to the low-level towns under its jurisdiction, Daqing developed a spatial pattern of extensive shrinkage of towns under the growth of the central city. In Hegang, employment opportunities and wages in the central city plummeted as the depletion of original coal resources and the decline of related manufacturing industries lagged behind the development of alternative industries and services. The decline of industry and economy in the central cities has accelerated the process of population return to the towns under their jurisdiction. County-level towns in the region have become a new pole of population growth. In Yichun, the central city was the first to experience population loss due to the depletion of forest resources and the decline of the steel and forestry industries. County towns are generally smaller in size, with poorer levels of facilities and sparsely populated rural areas under their jurisdiction and with insufficient arable land resources. Towns at all levels face the challenges of falling behind in industrial development, population loss, and marginalization.
The concept of multi-level coordination and the research framework of shrinking town governance is also important. In the process of shrinking town governance, hierarchical differences and correlations of shrinking towns should be taken into account, and the role of multi-level coordination of “prefecture-county-town” should be emphasized in order to guide the shrinking towns policy in Northeast China. Shrinking cities should solve the unresolved problems and shortcomings in urban development, change the real-estate-based development and construction mode to an intensive construction mode in order to improve urban quality, optimize the distribution of capital and land, and promote the transformation of the urban development mode from the source [61]. Shrinking county-level towns should return the focus of development to the county, which is the preferred settlement and place of employment for rural workers to enter the city. They should also improve the infrastructure and public services of the county, promote the concentration of surrounding rural workers in the county, promote industrial clustering, and improve economic efficiency. Shrinking ordinary towns should first change the homogenous construction pattern and select key towns for priority development. It is also necessary to strengthen the infrastructural development of general towns in order to improve living and production conditions.

7. Conclusions

Urban growth and shrinkage are dynamic and interrelated processes, and there is a significant influence of high-level cities on low-level towns. This study found that: (1) Urban shrinkage has become a common phenomenon at all levels of cities and towns in Northeast China, showing an increasing trend in the number of shrinking cities and towns and a deepening degree of shrinkage. (2) The shrinkage of cities and towns in Northeast China varies significantly by level, with prefecture-level cities having the largest shrinkage percentage, county-level towns having a small shrinkage percentage but the fastest shrinkage speed, and ordinary towns having an earlier shrinkage and a continuous shrinkage trend. (3) The decrease in the population of cities and towns within the same municipality is not completely synchronized. In terms of spatial patterns, the multi-level relationship between cities and towns is divided into growth-driven, central siphon, peripheral growth, local growth, and global shrinkage. (4) Significant differences exist in the factors influencing town shrinkage at each level. The shrinkage of prefecture-level cities and county-level towns is affected by similar factors, mainly economic development, industrial development, and built environment, while the shrinkage of county-level towns can be significantly reduced by increasing the ratio of floating population and population centrality. In areas with poor arable land resources and environment, ordinary towns are more likely to shrink. (5) There is a significant cross-level effect of high-level cities on the shrinkage of low-level towns in Northeast China. With the benefits of higher wages, better medical services, better infrastructure, and more jobs, high-level cities have a powerful effect of siphoning population from low-level towns; meanwhile, high-level cities accelerate the economic and industrial development of low-level towns through industrial transfer and technology diffusion.
A multi-level analysis of urban shrinkage is a useful perspective. Little attention has been paid to the multi-level character of urban shrinkage. This study attempts to theoretically investigate the multi-level variability and correlation of town shrinkage and practically analyzes the correlation and variability of different levels of town shrinkage in Northeast China. However, due to the limitations of the HLM model, the multi-level analysis of towns in this study has certain limitations. The study neglects the differences in the strength of connections between lower and high-level towns. Factors such as the spatial distance between low-level towns and high-level towns and the degree of industrial linkages can cause large differences in the linkages between high-level towns and low-level towns. Due to data availability limitations, this study cannot adopt a quantitative approach to explore the effects of COVID-19 on urban shrinkage. It can only theoretically and qualitatively analyze the effect of COVID-19 on migration and the mobility of people between cities. The pre-2000 population census’s statistical standard and data precision are insufficient to support a longer time series study of urban growth and shrinkage.

Author Contributions

Conceptualization, W.L., J.Z. and Y.L.; methodology, W.L., J.Z. and Y.T.; software, W.L. and Y.T.; formal analysis, W.L.; investigation, W.L. and Y.T.; resources, W.L. and Y.T.; data curation, W.L. and J.Z.; writing—original draft preparation, W.L.; writing—review and editing, W.L., Y.L. and G.Z.; supervision, Y.L., G.Z., J.Z. and Z.M. All authors have read and agreed to the published version of the manuscript.

Funding

This research was funded by the National Natural Science Foundation of China (grant numbers 42171191, 42201211, 41871158, and 41771172); Humanities and Social Sciences General Research Program of the Ministry of Education (grant number 22YJAZH149); Department of Science and Technology of Jilin Province (grant number 20220508025RC); Young Scientist Group Project of Northeast Institute of Geography and Agroecology, Chinese Academy of Sciences (grant number 2022QNXZ02).

Institutional Review Board Statement

Not applicable.

Informed Consent Statement

Not applicable.

Data Availability Statement

Not applicable.

Acknowledgments

We thank the editor and anonymous referees whose remarks have been very constructive and inspiring in preparing the final version of the paper. We are solely responsible for the opinions expressed in this paper.

Conflicts of Interest

The authors declare no conflict of interest.

Appendix A

Table A1. The robustness tests of the OLS model.
CategoriesVariablesPrefecture LevelCounty LevelTown Level
PopulationPOP1
POP2 0.274 ***
POP3 0.219 **−0.099 **
EconomicECO10.347 *0.440 ***
ECO20.493 ***
ECO3
IndustryIND1 0.885 ***−0.100 **
IND2 0.341 **−0.037
IND30.342 * 0.054
IND4 0.546 ***0.109 **
InfrastructureINF1 0.013
INF20.180 *
EnvironmentENV1 −0.236 ***
ENV2 0.084 **
R20.3840.3780.165
This study tests the robustness of the OLS model by replacing the dependent variable. In Appendix A, the rate of change of resident population in municipal districts of prefecture-level cities was replaced by the number of population changes (sum of registered and temporary population) in the built-up area of prefecture-level cities. Considering that the statistical yearbook does not count the number of permanent residents in built-up areas of county-level towns and ordinary towns, the rate of population change for county-level towns and ordinary towns is replaced by the number of population changes. *, **, and *** denote values that are significant at the 0.1, 0.05, and 0.01 levels, respectively.

Note

1. 
Data on the population of the townships in this study were obtained from the China Township Statistics and the China Statistical Yearbook (Township). Considering that the China Statistical Yearbook (Township) no longer counts the population of the built-up area of the town after 2018, statistics from 2018 were used for the town population. Using the average annual rate of population change (Equation (1)) to identify urban shrinkage minimizes the effect of time period on the identification of shrinking towns and comparisons between multiple levels. Missing data in this study are filled in using adjacent years.

References

  1. Häußermann, H.; Siebel, W. Die Schrumpfende Stadt und die Stadtsoziologie. In Soziologische Stadtforschung; Friedrichs, J., Ed.; VS Verlag für Sozialwissenschaften: Wiesbaden, Germany, 1988; pp. 78–94. [Google Scholar]
  2. Martinez-Fernandez, C.; Audirac, I.; Fol, S.; Cunningham-Sabot, E. Shrinking Cities: Urban Challenges of Globalization. Int. J. Urban Reg. Res. 2012, 36, 213–225. [Google Scholar] [CrossRef] [PubMed]
  3. Rieniets, T. Shrinking Cities: Causes and Effects of Urban Population Losses in the Twentieth Century. Nat. Cult. 2009, 4, 231–254. [Google Scholar] [CrossRef]
  4. Liu, Y.; Hu, Y.; Sun, H.; Zhou, G. Study on Residents’ Quality of Life in the Context of Urban Shrinkage: Analysis Based on Subjective and Objective Data. J. Urban Plan. Dev. 2020, 146, 05020015. [Google Scholar] [CrossRef]
  5. Wang, X.; Li, Z.; Feng, Z. Classification of Shrinking Cities in China Based on Self-Organizing Feature Map. Land 2022, 11, 1525. [Google Scholar] [CrossRef]
  6. Wang, T.; Wu, K.; Yao, C.; Liu, X. Complex Pathways to Population Shrinkage: Case Study of Hegang City, China. Chin. Geogr. Sci. 2022, 32, 418–437. [Google Scholar] [CrossRef]
  7. Wu, K.; Wang, X. Understanding Growth and Shrinkage Phenomena of Industrial and Trade Cities in Southeastern China: Case Study of Yiwu. J. Urban Plan. Dev. 2020, 146, 05020028. [Google Scholar] [CrossRef]
  8. Oswalt, P.; Rieniets, T. Atlas of Shrinking Cities; Hatje Cantz: Stuttgart, Germany, 2006. [Google Scholar]
  9. Zhai, W.; Jiang, Z.; Meng, X.; Zhang, X.; Zhao, M.; Long, Y. Satellite monitoring of shrinking cities on the globe and containment solutions. Iscience 2022, 25, 104411. [Google Scholar] [CrossRef]
  10. Zhang, Y.; Fu, Y.; Kong, X.; Zhang, F. Prefecture-level city shrinkage on the regional dimension in China: Spatiotemporal change and internal relations. Sustain. Cities Soc. 2019, 47, 101490. [Google Scholar] [CrossRef]
  11. Tong, Y.; Liu, W.; Li, C.; Rong, Y.; Zhang, J.; Yang, Y.; Yan, Q.; Gao, S.; Liu, Y. County town shrinkage in China: Identification, spatiotemporal variations and the heterogeneity of influencing factors. J. Rural Stud. 2022, 95, 350–361. [Google Scholar] [CrossRef]
  12. Zhou, Y.; Li, C.; Zheng, W.; Rong, Y.; Liu, W. Identification of urban shrinkage using NPP-VIIRS nighttime light data at the county level in China. Cities 2021, 118, 103373. [Google Scholar] [CrossRef]
  13. Tong, Y.; Liu, W.; Li, C.; Zhang, J.; Ma, Z. Understanding patterns and multilevel influencing factors of small town shrinkage in Northeast China. Sustain. Cities Soc. 2021, 68, 102811. [Google Scholar] [CrossRef]
  14. Doeringer, S.; Uchiyama, Y.; Penker, M.; Kohsaka, R. A meta-analysis of shrinking cities in Europe and Japan. Towards an integrative research agenda. Eur. Plan. Stud. 2020, 28, 1693–1712. [Google Scholar] [CrossRef] [Green Version]
  15. Xiu, C.L.; Jin, Y. Issues with Spatial Scale in Urban Research. Chin. Geogr. Sci. 2022, 32, 373–388. [Google Scholar] [CrossRef]
  16. Ma, Z.P.; Li, C.G.; Zhang, J. Understanding Urban Shrinkage from a Regional Perspective: Case Study of Northeast China. J. Urban Plan. Dev. 2020, 146, 05020025. [Google Scholar] [CrossRef]
  17. Yamamoto, D. Scales of regional income disparities in the USA, 1955–2003. J. Econ. Geogr. 2008, 8, 79–103. [Google Scholar] [CrossRef]
  18. Haase, A.; Bernt, M.; Großmann, K.; Mykhnenko, V.; Rink, D. Varieties of shrinkage in European cities. Eur. Urban Reg. Stud. 2016, 23, 86–102. [Google Scholar] [CrossRef]
  19. Peng, W.; Fan, Z.; Duan, J.; Gao, W.; Wang, R.; Liu, N.; Li, Y.; Hua, S. Assessment of interactions between influencing factors on city shrinkage based on geographical detector: A case study in Kitakyushu, Japan. Cities 2022, 131, 103958. [Google Scholar] [CrossRef]
  20. Hartt, M.D. How cities shrink: Complex pathways to population decline. Cities 2018, 75, 38–49. [Google Scholar] [CrossRef]
  21. Wolff, M. Understanding the role of centralization processes for cities—Evidence from a spatial perspective of urban Europe 1990–2010. Cities 2018, 75, 20–29. [Google Scholar] [CrossRef]
  22. Liu, Z.; Liu, S. Urban shrinkage in a developing context: Rethinking China’s present and future trends. Sustain. Cities Soc. 2022, 80, 103779. [Google Scholar] [CrossRef]
  23. Guo, F.; Qu, X.; Ma, Y.; Tong, L. Spatiotemporal pattern evolution and influencing factors of shrinking cities: Evidence from China. Cities 2021, 119, 103391. [Google Scholar] [CrossRef]
  24. Meng, X.F.; Long, Y. Shrinking cities in China: Evidence from the latest two population censuses 2010–2020. Environ. Plan. A Econ. Space 2022, 54, 449–453. [Google Scholar] [CrossRef]
  25. Li, H.; Lo, K.; Zhang, P. Population shrinkage in resource-dependent cities in China: Processes, patterns and drivers. Chin. Geogr. Sci. 2020, 30, 1–15. [Google Scholar] [CrossRef] [Green Version]
  26. National Development and Reform Commission. 2020 New Urbanization and Key Tasks of Urban-Rural Integration Development. Available online: http://www.gov.cn/zhengce/zhengceku/2020-04/09/content_5500696.htm (accessed on 26 November 2022).
  27. National Development and Reform Commission. Key Tasks for the 2019 New Urbanization Construction. Available online: http://www.gov.cn/xinwen/2019-04/08/content_5380457.htm (accessed on 26 November 2022).
  28. Wang, Q.; Xin, Z.L.; Niu, F.Q. Analysis of the Spatio-Temporal Patterns of Shrinking Cities in China: Evidence from Nighttime Light. Land 2022, 11, 871. [Google Scholar] [CrossRef]
  29. Tong, Y.; Liu, W.; Li, C.; Zhang, J.; Ma, Z. Small towns shrinkage in the Jilin Province: A comparison between China and developed countries. PLoS ONE 2020, 15, e0231159. [Google Scholar] [CrossRef] [PubMed] [Green Version]
  30. Wolff, M.; Wiechmann, T. Urban growth and decline: Europe’s shrinking cities in a comparative perspective 1990–2010. Eur. Urban Reg. Stud. 2018, 25, 122–139. [Google Scholar] [CrossRef]
  31. Scott, A.J.; Storper, M. Regions, globalization, development (Reprinted from vol. 37, p. 579, 2003). Reg. Stud. 2007, 41, S191–S205. [Google Scholar] [CrossRef] [Green Version]
  32. Smith, N. New Globalism, New Urbanism: Gentrification as Global Urban Strategy. Antipode 2002, 34, 427–450. [Google Scholar] [CrossRef]
  33. Mace, A.; Volgmann, F. The role of Leipzig’s narrative of shrinking. Urban Geogr. 2018, 39, 803–821. [Google Scholar] [CrossRef]
  34. Prener, C.G. Demographic change, segregation, and the emergence of peripheral spaces in St. Louis, Missouri. Appl. Geogr. 2021, 133, 102472. [Google Scholar] [CrossRef]
  35. Rhodes, J.; Russo, J. Shrinking ‘Smart’?: Urban Redevelopment and Shrinkage in Youngstown, Ohio. Urban Geogr. 2013, 34, 305–326. [Google Scholar] [CrossRef]
  36. Reckien, D.; Martinez-Fernandez, C. Why Do Cities Shrink? Eur. Plan. Stud. 2011, 19, 1375–1397. [Google Scholar] [CrossRef]
  37. Martinez-Fernandez, C.; Weyman, T.; Fol, S.; Audirac, I.; Cunningham-Sabot, E.; Wiechmann, T.; Yahagi, H. Shrinking cities in Australia, Japan, Europe and the USA: From a global process to local policy responses. Prog. Plan. 2016, 105, 1–48. [Google Scholar] [CrossRef]
  38. Iwasaki, Y. Shrinkage of regional cities in Japan: Analysis of changes in densely inhabited districts. Cities 2021, 113, 103168. [Google Scholar] [CrossRef]
  39. Turok, I.; Mykhnenko, V. The trajectories of European cities, 1960–2005. Cities 2007, 24, 165–182. [Google Scholar] [CrossRef]
  40. Deng, T.; Wang, D.; Yang, Y.; Yang, H. Shrinking cities in growing China: Did high speed rail further aggravate urban shrinkage? Cities 2019, 86, 210–219. [Google Scholar] [CrossRef]
  41. Pallagst, K.; Hammer, P.M. Introduction: Shrinking cities research in times of COVID-19. In Handbook on Shrinking Cities; Edward Elgar Publishing: Cheltenham, UK, 2022; pp. 1–7. [Google Scholar]
  42. Kunzmann, K.R. Smart Cities after COVID-19: Ten Narratives. Disp 2020, 56, 20–31. [Google Scholar] [CrossRef]
  43. Bontje, M.; Musterd, S. The multi-layered city: The value of old urban profiles. Tijdschr. Voor Econ. En Soc. Geogr. 2008, 99, 248–255. [Google Scholar] [CrossRef]
  44. Krzysztofik, R.; Kantor-Pietraga, I.; Sporna, T. Spatial and functional dimensions of the COVID-19 epidemic in Poland. Eurasian Geogr. Econ. 2020, 61, 573–586. [Google Scholar] [CrossRef]
  45. Meijers, E.J.; Burger, M.J.; Hoogerbrugge, M.M. Borrowing size in networks of cities: City size, network connectivity and metropolitan functions in Europe. Pap. Reg. Sci. 2016, 95, 181–198. [Google Scholar] [CrossRef]
  46. Myrdal, G.; Sitohang, P. Economic Theory and Underdeveloped Regions; Methuen and Company: London, UK, 1958. [Google Scholar]
  47. Hansen, N.M. Development Pole Theory in a Regional Context. In Regional Economics: A Reader; Richardson, H.W., Ed.; Palgrave Macmillan UK: London, UK, 1970; pp. 134–149. [Google Scholar]
  48. Fang, C.; Yu, D. Urban agglomeration: An evolving concept of an emerging phenomenon. Landsc. Urban Plan. 2017, 162, 126–136. [Google Scholar] [CrossRef]
  49. Lyu, Y.; Jiang, F. Spatial and temporal distribution of population in urban agglomerations changes in China. Sci. Rep. 2022, 12, 8315. [Google Scholar] [CrossRef]
  50. Li, H.; Mykhnenko, V. Urban shrinkage with Chinese characteristics. Geogr. J. 2018, 184, 398–412. [Google Scholar] [CrossRef]
  51. Chen, Z.; Yu, B.; Yang, C.; Zhou, Y.; Yao, S.; Qian, X.; Wang, C.; Wu, B.; Wu, J. An extended time series (2000–2018) of global NPP-VIIRS-like nighttime light data from a cross-sensor calibration. Earth Syst. Sci. Data 2020, 13, 889–906. [Google Scholar] [CrossRef]
  52. Van Donkelaar, A.; Hammer, M.S.; Bindle, L.; Brauer, M.; Brook, J.R.; Garay, M.J.; Hsu, N.C.; Kalashnikova, O.V.; Kahn, R.A.; Lee, C. Monthly global estimates of fine particulate matter and their uncertainty. Environ. Sci. Technol. 2021, 55, 15287–15300. [Google Scholar] [CrossRef] [PubMed]
  53. Schilling, J.; Logan, J. Greening the Rust Belt A Green Infrastructure Model for Right Sizing America’s Shrinking Cities. J. Am. Plan. Assoc. 2008, 74, 451–466. [Google Scholar] [CrossRef]
  54. Du, Z.; Jin, L.; Ye, Y.; Zhang, H. Characteristics and influences of urban shrinkage in the exo-urbanization area of the Pearl River Delta, China. Cities 2020, 103, 102767. [Google Scholar] [CrossRef]
  55. Moran, P.A. Notes on continuous stochastic phenomena. Biometrika 1950, 37, 17–23. [Google Scholar] [CrossRef]
  56. Anselin, L. Local indicators of spatial association—LISA. Geogr. Anal. 1995, 27, 93–115. [Google Scholar] [CrossRef]
  57. Craven, B.; Islam, S.M. Ordinary least-squares regression. In The SAGE Dictionary of Quantitative Management Research; Sage Publications Ltd.: Thousand Oaks, CA, USA, 2011; pp. 224–228. [Google Scholar]
  58. Robinson, T. Multilevel Analysis: Techniques and Applications. J. Am. Stat. Assoc. 2003, 98, 496. [Google Scholar] [CrossRef]
  59. Raimbault, J. Unveiling Co-evolutionary Patterns in Systems of Cities: A Systematic Exploration of the SimpopNet Model. In Theories and Models of Urbanization: Geography, Economics and Computing Sciences; Pumain, D., Ed.; Springer International Publishing: Cham, Swizerland, 2020; pp. 261–278. [Google Scholar]
  60. Simandan, D. Competition, delays, and coevolution in markets and politics. Geoforum 2019, 98, 15–24. [Google Scholar] [CrossRef]
  61. Wang, Y.; Liu, Y.; Zhou, G.; Ma, Z.; Sun, H.; Fu, H. Coordinated Relationship between Compactness and Land-Use Efficiency in Shrinking Cities: A Case Study of Northeast China. Land 2022, 11, 366. [Google Scholar] [CrossRef]
Figure 1. A multi-level perspective of Chinese cities and towns (revised from Li and Mykhnenko [50]).
Land 11 02208 g001
Figure 2. A multi-level framework for understanding the shrinkage of cities and towns.
Land 11 02208 g002
Figure 3. Cities and towns in Northeast China.
Land 11 02208 g003
Figure 4. Spatial pattern of multi-level town shrinkage in Northeast China. Subfigure (a) shows the spatial pattern of multi-level town shrinkage in Northeast China during the period 2000–2010; Subfigure (b) shows the spatial pattern of multi-level town shrinkage in Northeast China during the period 2010–2020.
Land 11 02208 g004
Figure 5. Local spatial autocorrelation of multi-level town shrinkage in Northeast China. Subfigure (a) shows the local spatial autocorrelation of multi-level town shrinkage in Northeast China during the period 2000–2010; Subfigure (b) shows the local spatial autocorrelation of multi-level town shrinkage in Northeast China during the period 2010–2020.
Land 11 02208 g005
Figure 6. Types of multilevel associations of urban shrinkage in Northeast China. Subfigure (a1) and (a2) show the types of multilevel associations of urban shrinkage in Northeast China during the period 2000–2010 and the period 2010–2020, respectively; Subfigure (b1b5) show the five types of multilevel associations of urban shrinkage, respectively.
Land 11 02208 g006
Table 1. Factors influencing the shrinkage of cities and towns.
CategoriesVariablesExplanations
PopulationAging level (POP1)Percentage of the population aged 65 and over
Percentage of floating
population (POP2)
Percentage of non-local resident population
Population centrality (POP3)Urban population as a percentage of the total population
EconomicEconomic development level (ECO1)Rate of GDP (or nighttime light value) change
Fixed asset investment (ECO2)Fixed asset investment completion
Average wage (ECO3)Average wage of urban workers in employment
IndustryEnterprise size (IND1)Number of industrial enterprises above the scale
Secondary industry share (IND2)Secondary industry value-added ratio
Tertiary industry share (IND3)Tertiary industry value-added ratio
Technology level (IND4)Number of high-tech enterprises
InfrastructureMedical level (INF1)Number of medical and health institutions per 10,000 people
Traffic level (INF2)Length of road per capita
EnvironmentAir pollution index (ENV1)PM2.5 average value
Arable land (ENV2)Arable land per capita
Table 2. Number of shrinking cities and towns in Northeast China.
Level2000–20102010–2020
ShrinkageSlight ShrinkageSignificant ShrinkageShrinkageSlight ShrinkageSignificant Shrinkage
Prefecture level55020146
14.7%14.7%-58.8%41.2%17.6%
County level11101785622
7.6%6.9%0.7%54.2%38.9%15.3%
Town level518232286594290304
44.2%19.8%24.4%52.2%24.7%25.9%
Table 3. Factors influencing city and town shrinkage in Northeast China.
CategoriesVariablesPrefecture LevelCounty LevelTown Level
PopulationPOP1
POP2 0.248 **
POP3 0.315 ***−0.562 ***
EconomicECO10.577 ***0.396 ***
ECO20.268 *
ECO3
IndustryIND1 0.678 ***−0.097 ***
IND2 0.315 **−0.337 ***
IND30.639 *** 0.101**
IND4 0.552 **0.313 ***
InfrastructureINF1 0.099 ***
INF20.211 **
EnvironmentENV1 −0.085 ***
ENV2 0.129 ***
R20.5140.3110.338
*, **, and *** denote values that are significant at the 0.1, 0.05, and 0.01 levels, respectively.
Table 4. The cross-level impact of prefecture-level cities on county-level towns.
County-Level
Variables
Regression
Coefficient
Prefecture-Level Variables
ECO1ECO3INF1INF2
POP20.248 **4.3860.045−4.017 *−8.842
POP30.315 ***4.882−4.775 **3.296 *−1.241
ECO10.396 ***2.226 *−0.504−2.115−0.302
IND20.315 **−1.715−0.560−3.406 *−5.213 *
*, **, and *** denote values that are significant at the 0.1, 0.05, and 0.01 levels, respectively.
Table 5. The cross-level impact of prefecture-level cities on ordinary towns.
Town-Level
Variables
Regression
Coefficient
Prefecture-Level Variables
ECO3IND1IND3IND4INF1INF2
POP3−0.562 ***0.483 **0.6880.155−1.115 *0.344 *0.290
IND2−0.337 ***−0.035−4.638 **0.888 *3.5760.7920.898
IND30.101 **−0.6901.006−0.196−0.702−1.975 **−1.410 **
IND40.313 ***0.4711.095−1.194 *0.214−1.196−0.963
*, **, and *** denote values that are significant at the 0.1, 0.05, and 0.01 levels, respectively.
Table 6. The cross-level impact of county-level towns on ordinary towns.
Town-Level
Variables
Regression
Coefficient
County-Level Variables
POP3ECO1ECO3IND4INF1INF2
POP3−0.562 ***−0.434 ***0.601 ***0.019−0.346 *−0.0390.046
IND1−0.097 ***−0.011−0.0740.437 ***−0.111−0.0860.066
IND2−0.337 ***0.059−0.771−0.0270.656−0.591−0.209
IND30.101 **−0.620 **0.2990.078−0.5661.382−0.302 *
INF10.099 ***−0.1170.001−0.0510.1720.306 **−0.076
EVO1−0.085 ***0.0840.1930.234−0.0510.350 **0.139
*, **, and *** denote values that are significant at the 0.1, 0.05, and 0.01 levels, respectively.
Publisher’s Note: MDPI stays neutral with regard to jurisdictional claims in published maps and institutional affiliations.

