
Topographical Gradient Characteristics of Land-Use Changes in the Agro-Pastoral Ecotone of Northern China

Abstract
:1. Introduction
2. Materials and Methods
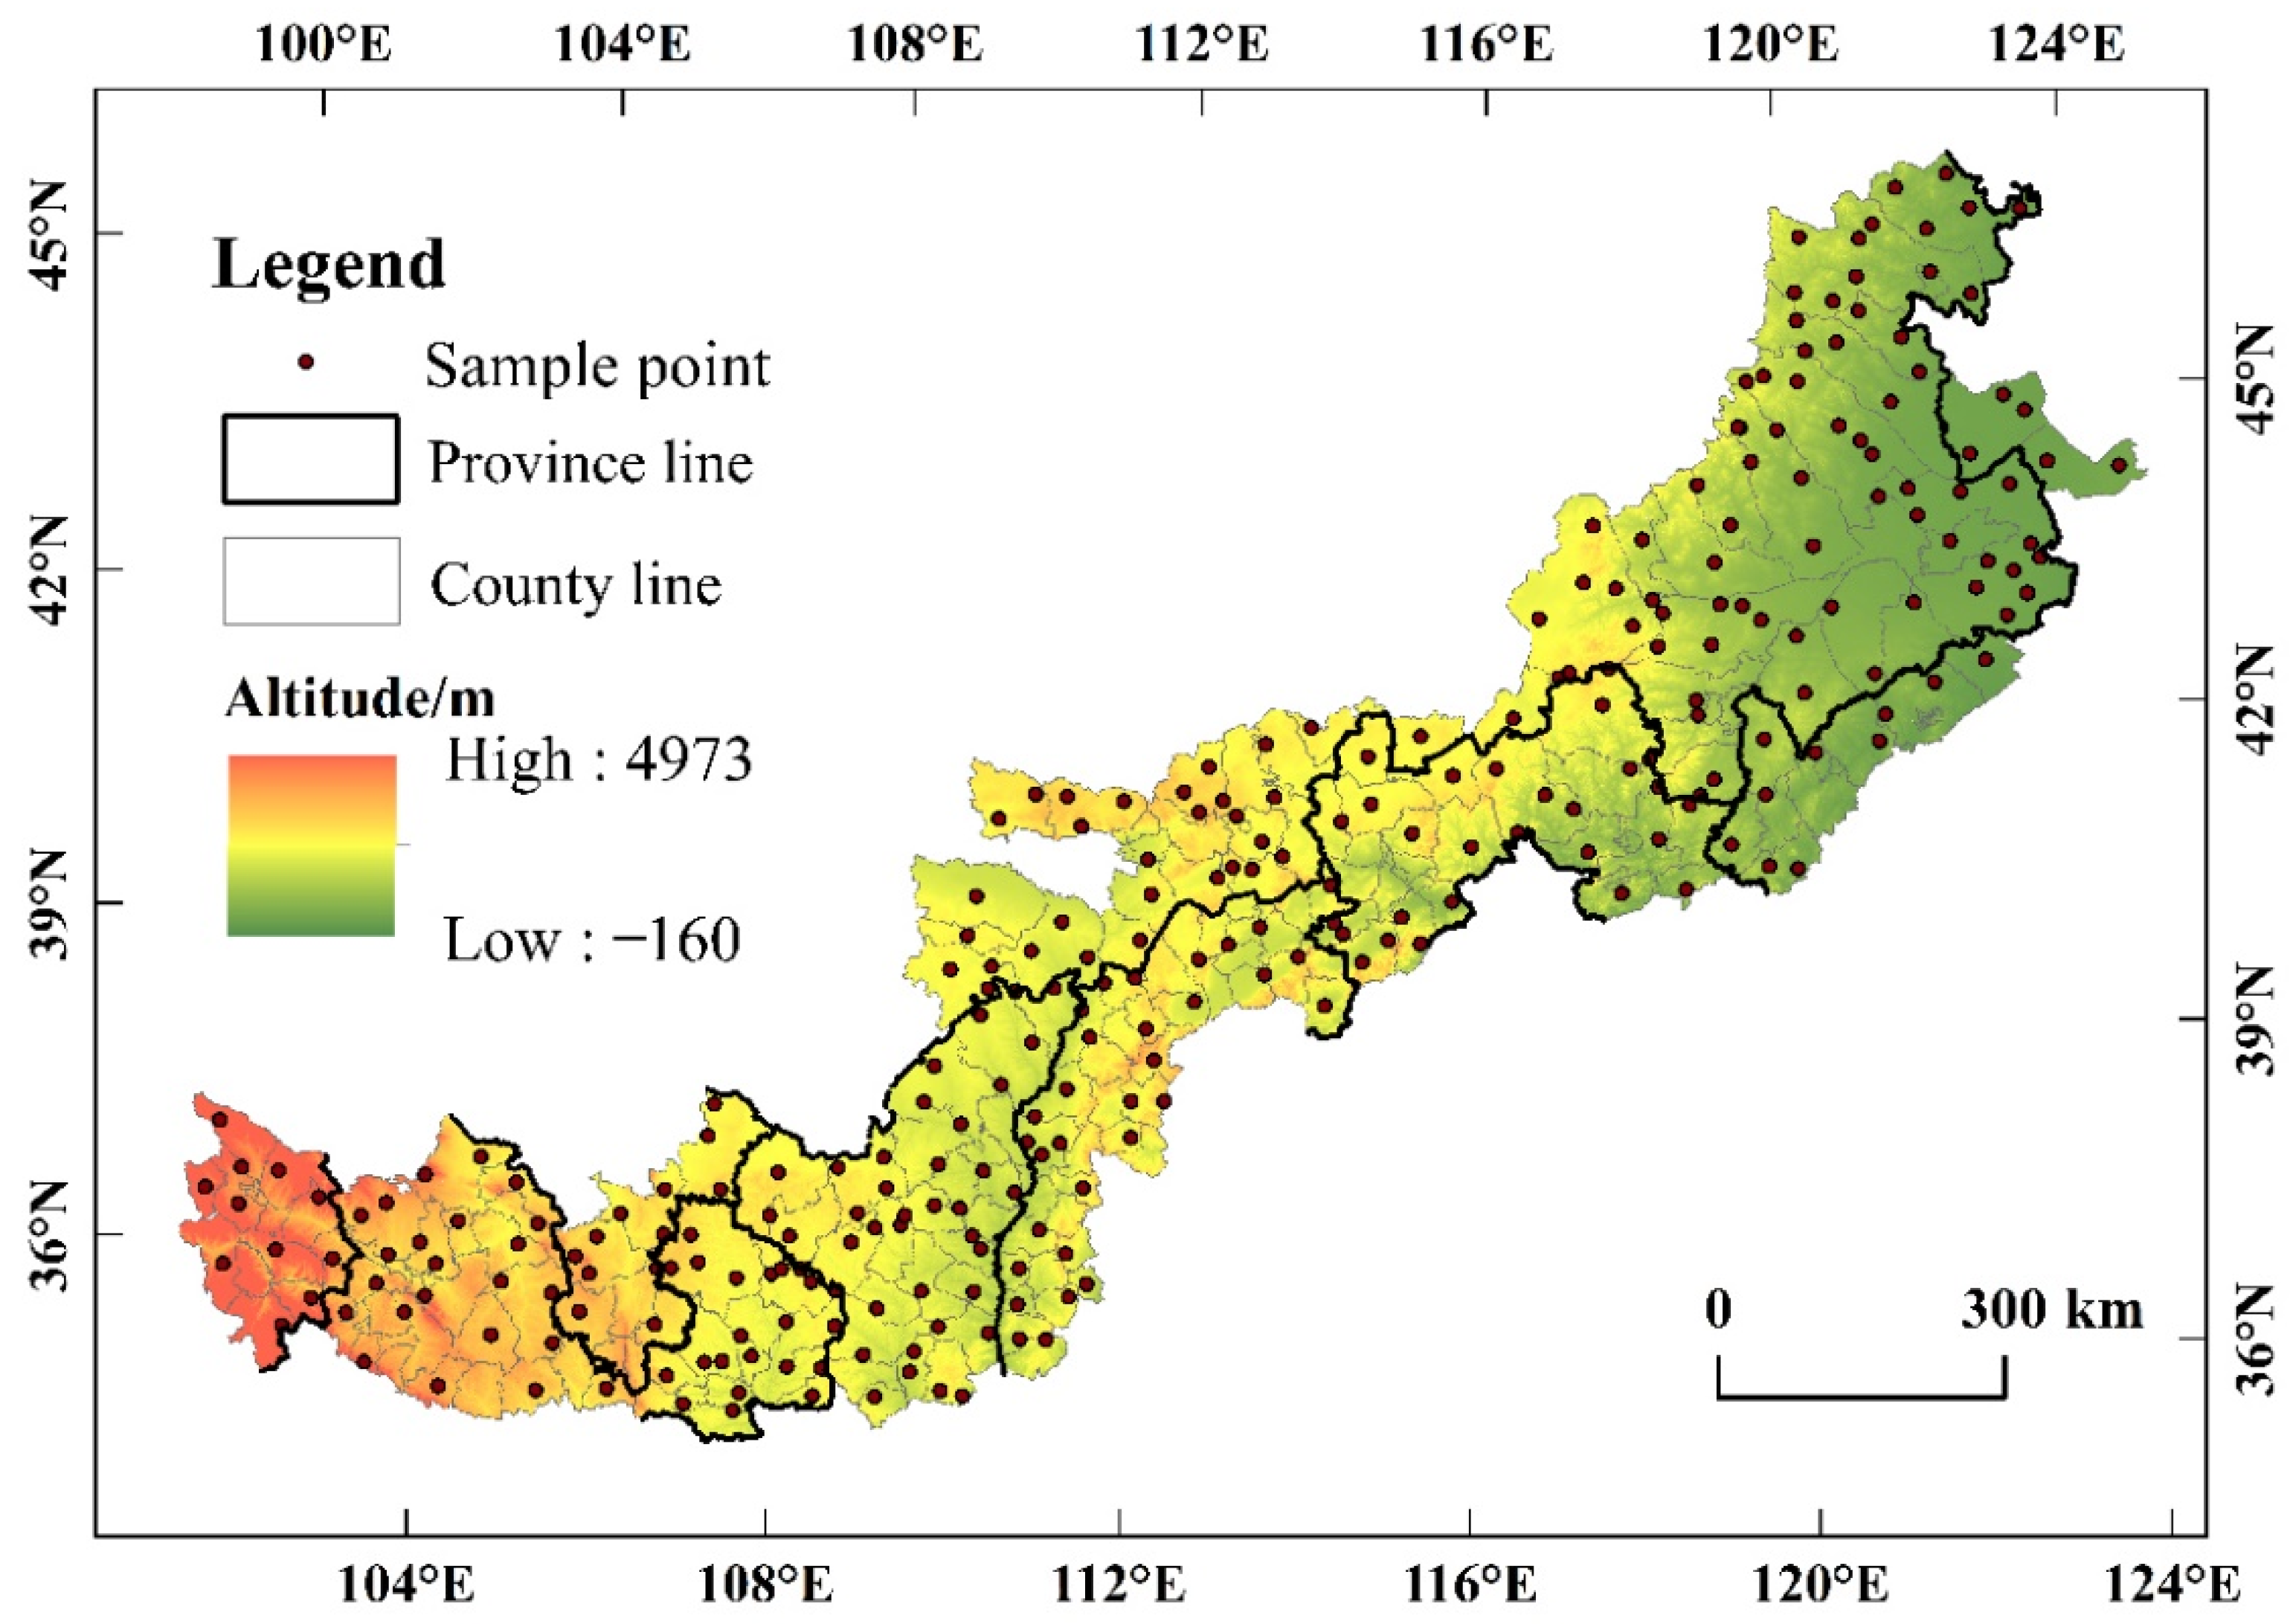
2.1. Study Area
2.2. Data Sources and Processing
2.3. Methods
2.3.1. Land-Use Transfer Matrix
2.3.2. Importance Index of Land-Use Change
2.3.3. Geo-Information Graphics
2.3.4. Terrain Niche
2.3.5. Distribution Index
2.3.6. Geographical Detector
3. Results
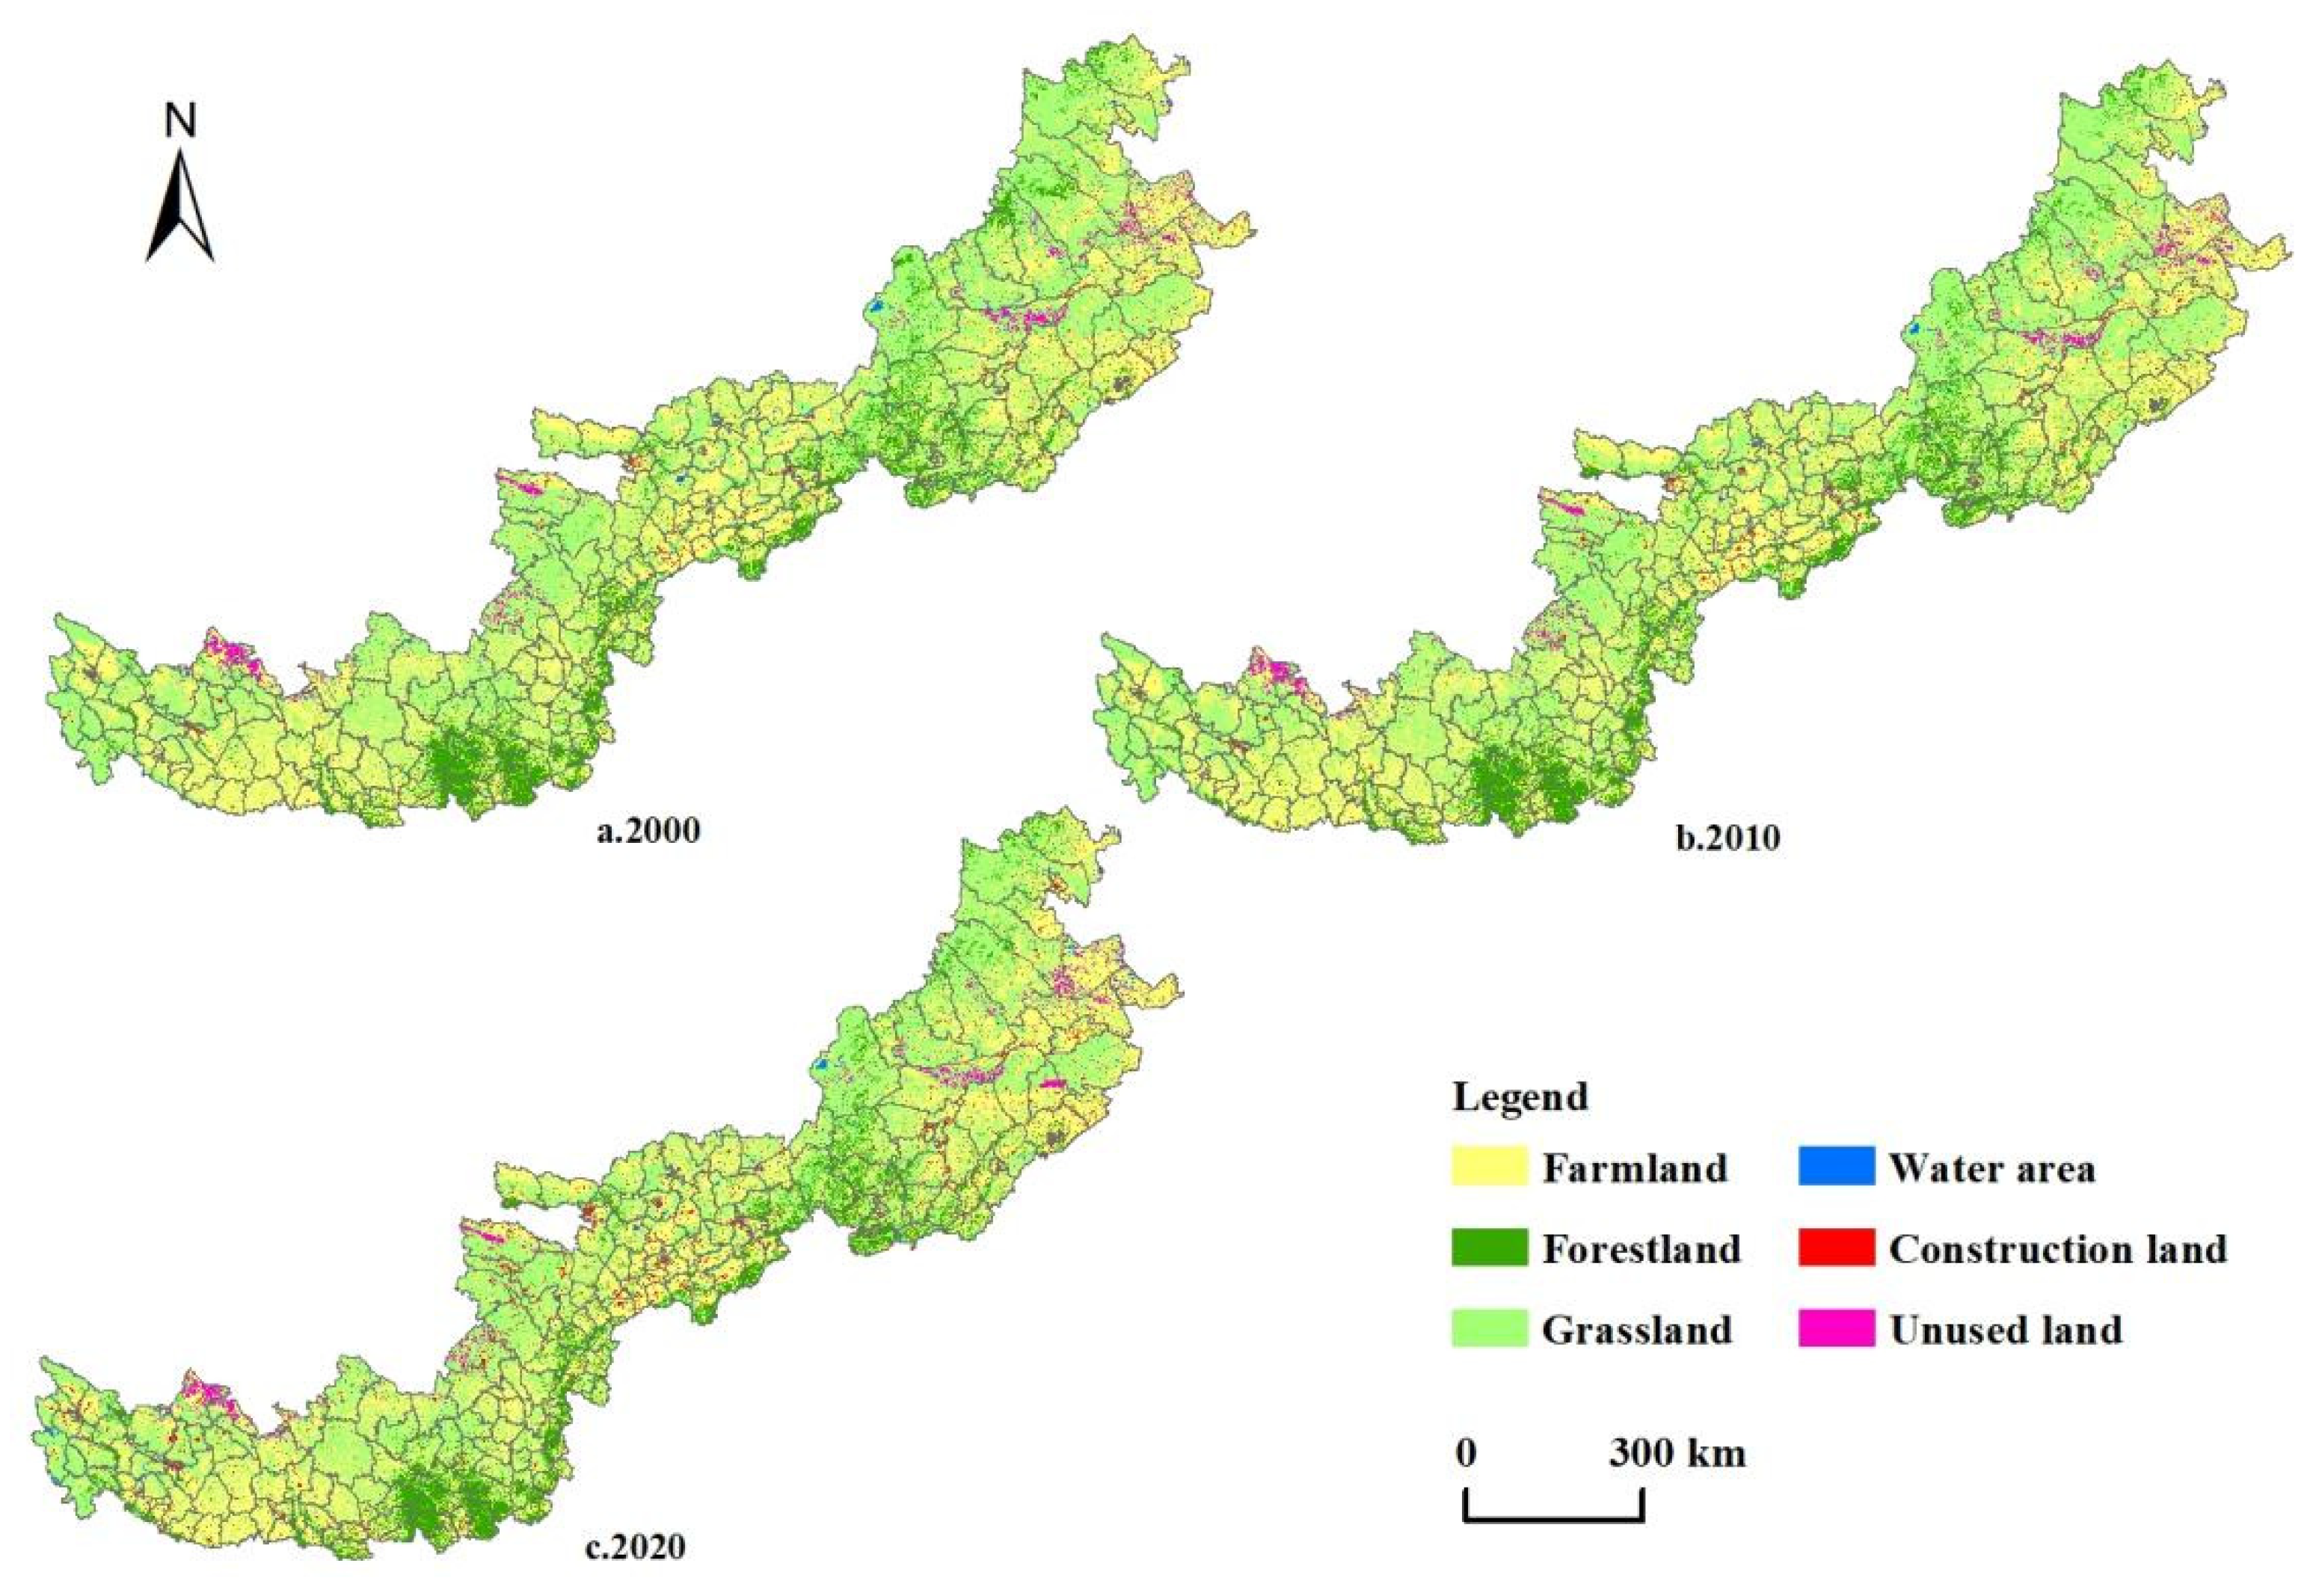
3.1. Land-Use Changes in AENC
3.1.1. Changes in Land-Use Structure
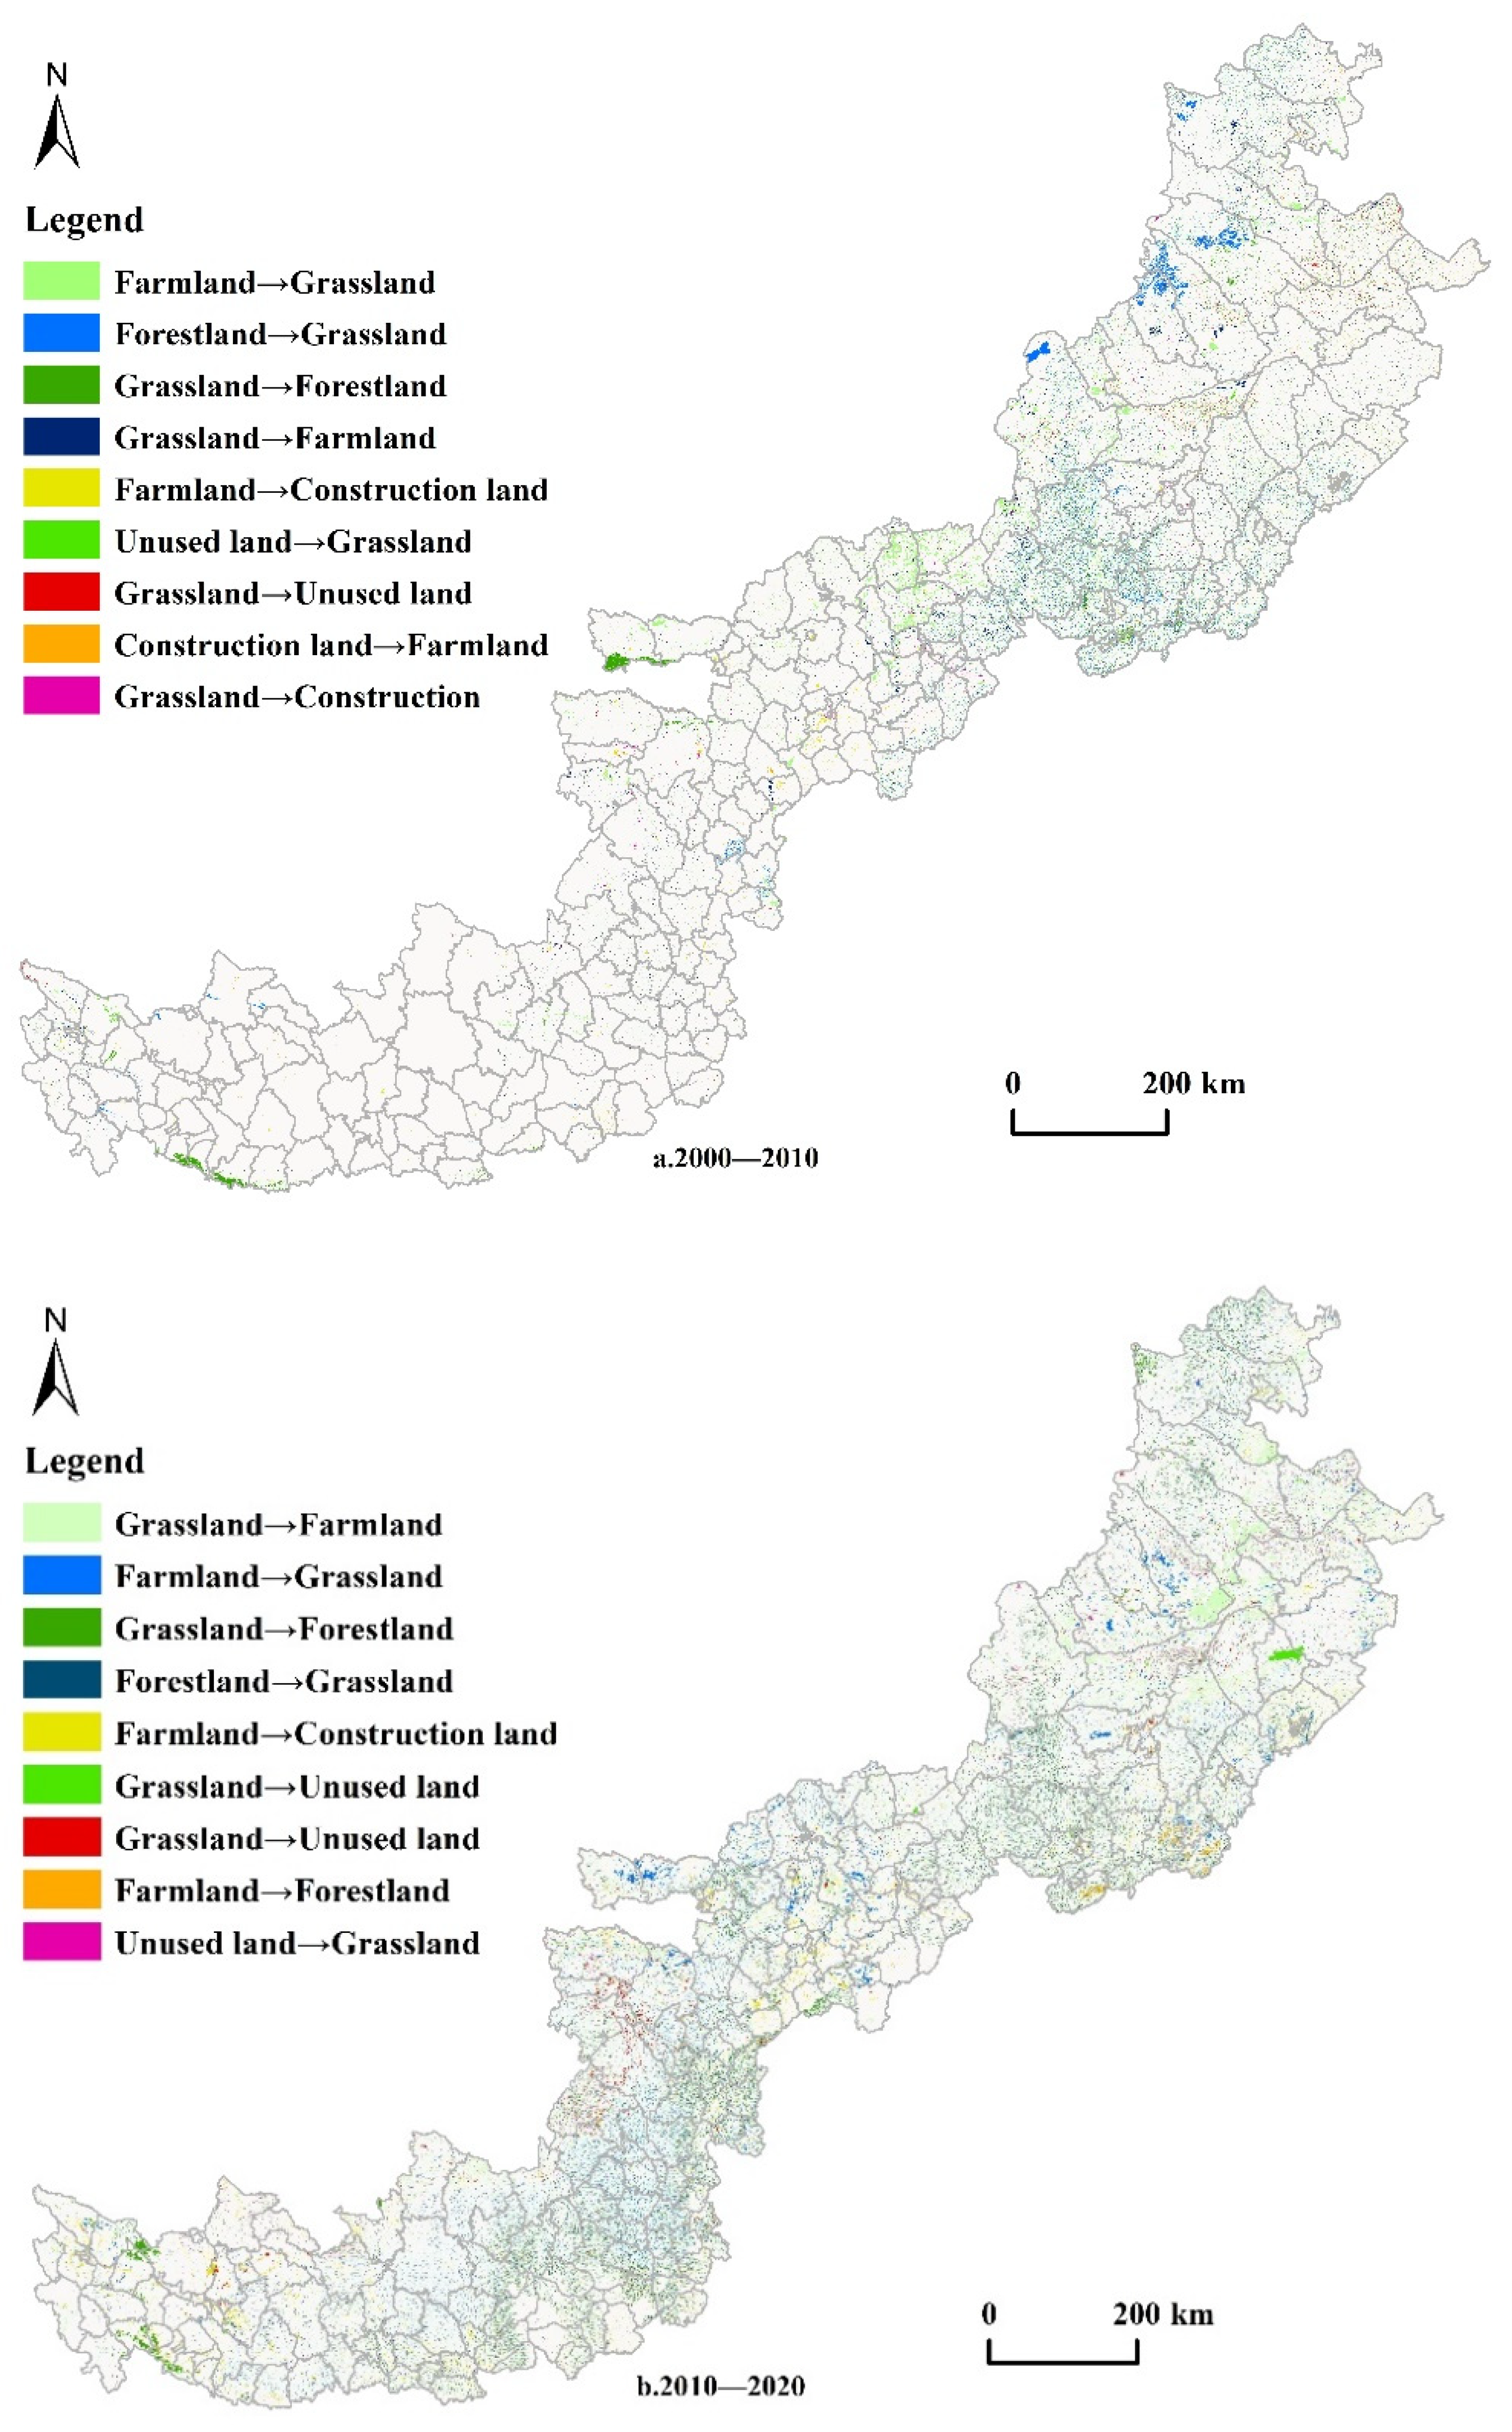
3.1.2. Changes in Land-Use Conversion
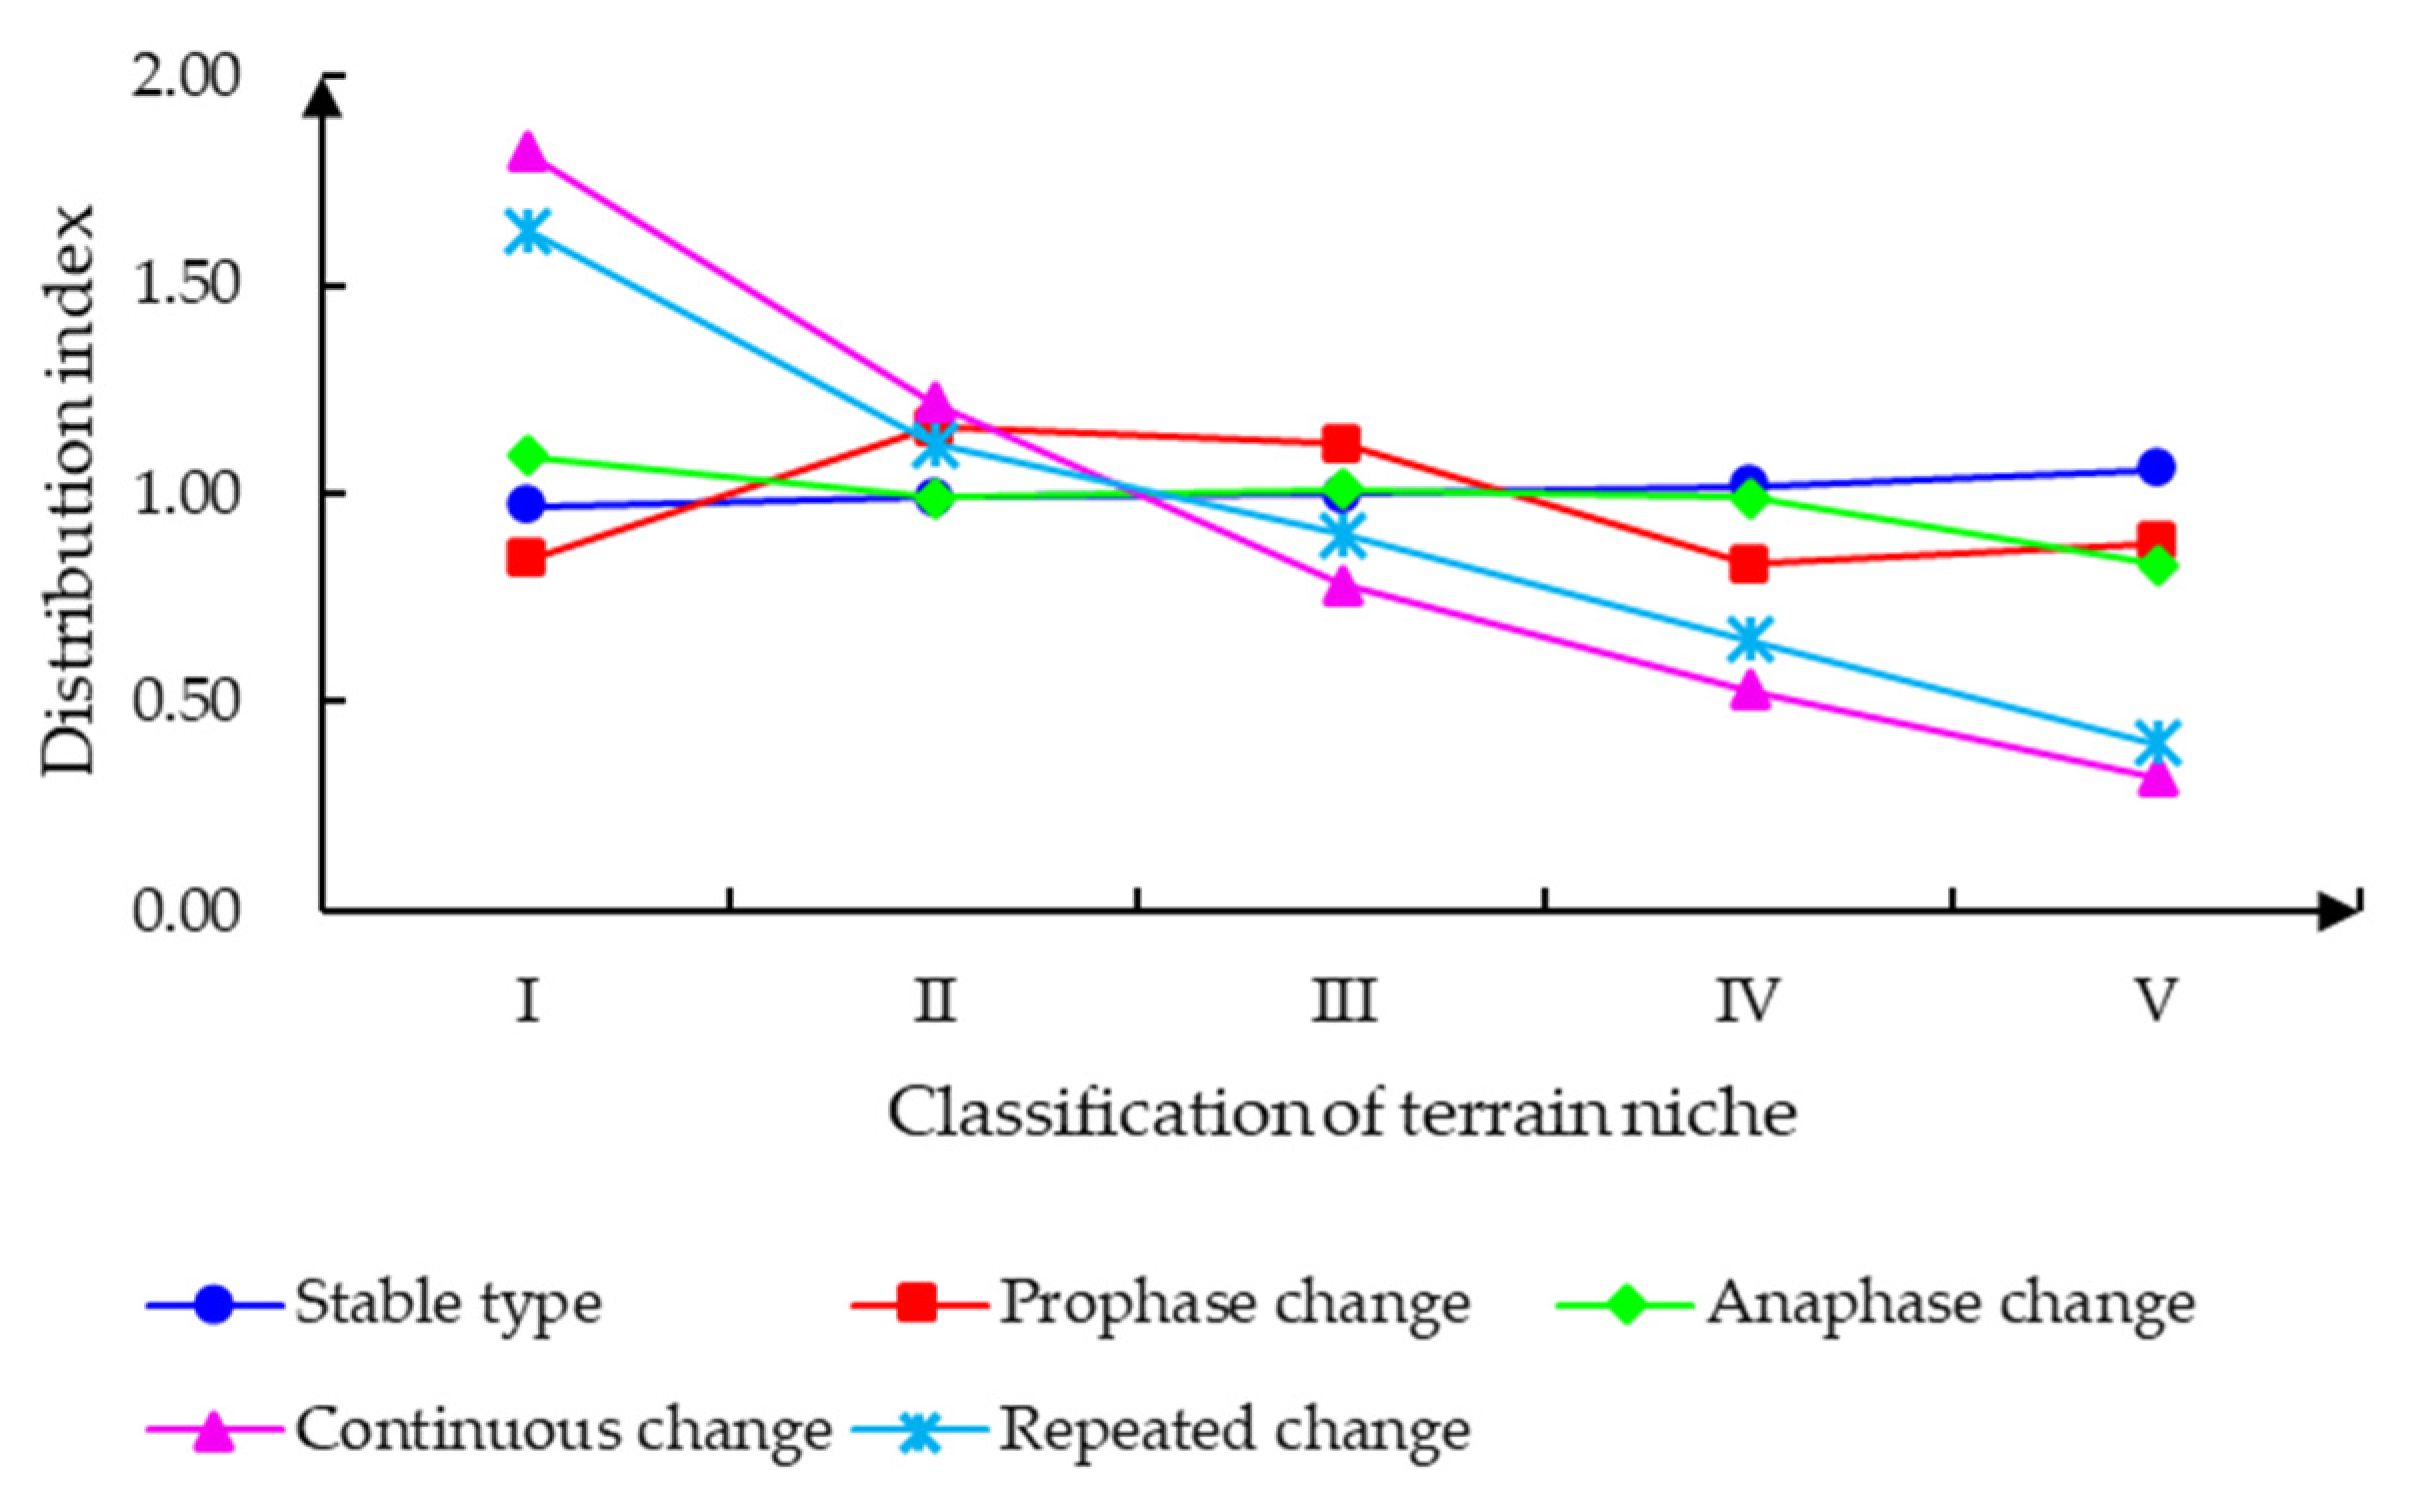
3.2. Topographical Gradient Effect of Land-Use Structure Change in the AENC
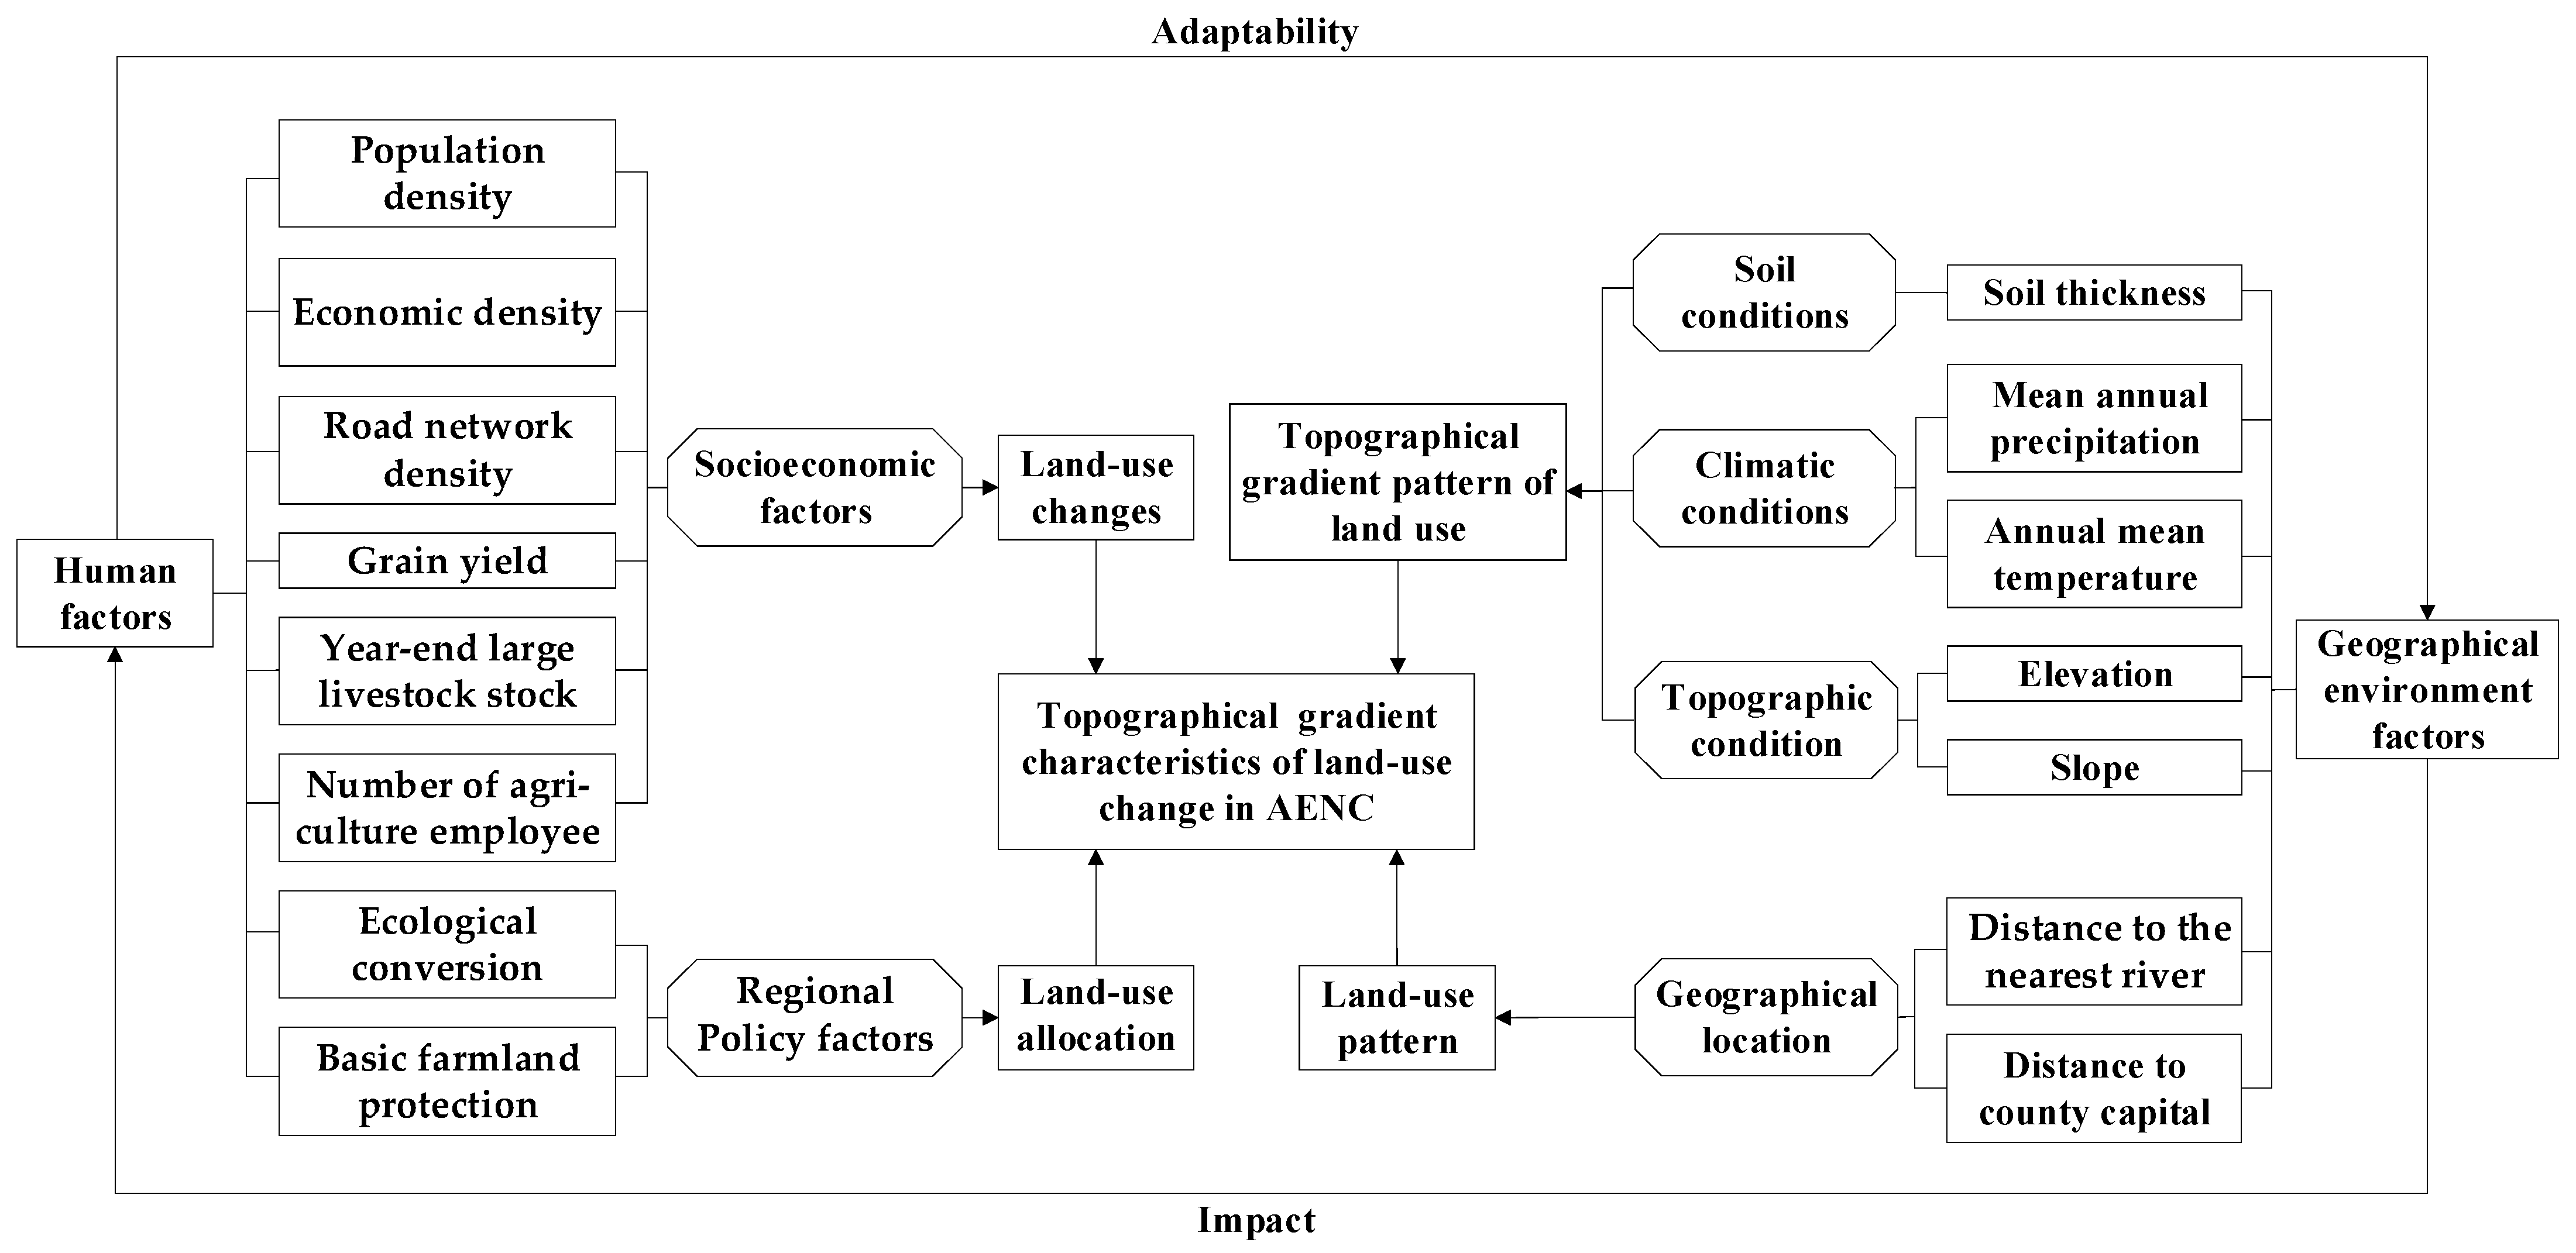
3.3. Driving Factors of Land-Use Structure Change in the AENC
3.3.1. Natural Environment Factors
3.3.2. Geographical Location Factors
3.3.3. Socioeconomic Factors
3.3.4. Regional Policy Factors
4. Discussion
4.1. Topographical Gradient Effect and Driving Factors of Land-Use Structure Change in the AENC
4.1.1. Geographical Environment Determines the Topographic Gradient Pattern of Land-Use Structure
4.1.2. Socioeconomic Conditions Are Key Driving Forces of Land-Use Changes
4.1.3. Regional Policy Regulates Land-Use Allocation
4.2. Limitations and Implications
5. Conclusions
Author Contributions
Funding
Institutional Review Board Statement
Informed Consent Statement
Data Availability Statement
Conflicts of Interest
References
- Mooney, H.; Duraiappah, A.; Larigauderie, A. Evolution of natural and social science interactions in global change research programs. Proc. Natl. Acad. Sci. USA 2013, 110, 3665–3672. [Google Scholar] [CrossRef] [PubMed] [Green Version]
- Zang, H.; Liu, Y.; Yang, Y. Land use pattern change and its topographic gradient effect in the mountainous areas: A case study of Jinggangshan city. J. Nat. Resour. 2019, 34, 1391–1404. [Google Scholar]
- Lambin, E.; Turner, B.; Geist, H.; Agbola, S.; Angelsen, A.; Bruce, J.; Coomes, O.; Dirzo, R.; Fischer, G.; Folke, C.; et al. The causes of land-use and land-cover change: Moving beyond the myths. Glob. Environ. Chang. 2001, 11, 261–269. [Google Scholar] [CrossRef]
- Turner, B.; Lambin, E.; Reenberg, A. The emergence of land change science for global environmental change and sustainability. Proc. Nat. Acad. Sci. USA 2007, 104, 20666–20671. [Google Scholar] [CrossRef] [Green Version]
- Xue, L.; Zhu, B.; Wu, Y.; Wei, G.; Liao, S.; Yang, C.; Wang, J.; Zhang, H.; Ren, L.; Han, Q. Dynamic projection of ecological risk in the Manas River basin based on terrain gradients. Sci. Total Environ. 2019, 653, 283–293. [Google Scholar] [CrossRef]
- Matasov, V.; Prishchepov, A.V.; Jepsen, M.R.; Müller, D. Spatial determinants and underlying drivers of land-use transitions in European Russia from 1770 to 2010. J. Land Use Sci. 2019, 14, 362–377. [Google Scholar] [CrossRef]
- Zaehringer, J.G.; Atumane, A.; Berger, S.; Eckert, S. Large-scale agricultural investments trigger direct and indirect land use change: New evidence from the Nacala corridor, Mozambique. J. Land Use Sci. 2018, 13, 325–343. [Google Scholar] [CrossRef] [Green Version]
- Swette, B.; Lambin, E.F. Institutional changes drive land use transitions on rangelands: The case of grazing on public lands in the American West. Glob. Environ. Chang. 2021, 66, 102220. [Google Scholar] [CrossRef]
- Kanianska, R.; Kizeková, M.; Nováček, J.; Zeman, M. Land-use and land-cover changes in rural areas during different political systems: A case study of Slovakia from 1782 to 2006. Land Use Policy 2014, 36, 554–566. [Google Scholar] [CrossRef]
- Sun, P.; Xu, Y.; Wang, S. Terrain gradient effect analysis of land use change in poverty area around Beijing and Tianjin. Trans. Chin. Soc. Agric. Eng. 2014, 30, 277–288. [Google Scholar]
- Saha, S.; Paul, G.; Hembram, T. Classification of terrain based on geo-environmental parameters and their relationship with land use/land cover in Bansloi River basin, Eastern India: RS/GIS approach. Appl. Geom. 2021, 12, 1–17. [Google Scholar] [CrossRef]
- Zhang, L.; Hu, N. Spatial Variation and Terrain Gradient Effect of Ecosystem Services in Heihe River Basin over the Past 20 Years. Sustainability 2021, 13, 11271. [Google Scholar] [CrossRef]
- Gitima, G.; Teshome, M.; Kassie, M.; Jakubus, M. Spatiotemporal land use and cover changes across agroecologies and slope gradients using geospatial technologies in Zoa watershed, Southwest Ethiopia. Heliyon 2022, 8, e10696. [Google Scholar] [CrossRef]
- Martins, P.; Sano, E.; Martins, E.; Vieira, L.; Salemi, L.; Vasconcelos, V.; Júnior, A. Terrain units, land use and land cover, and gross primary productivity of the largest fluvial basin in the Brazilian Amazonia/Cerrado ecotone: The Araguaia River basin. Appl. Geogr. 2021, 127, 102379. [Google Scholar] [CrossRef]
- Bai, S.; Chen, L.; Wang, L.; Shi, J.; Li, H. The impact of micro-topography on the land use pattern in the agro-pastoral ecotone. Chin. Land Sci. 2011, 25, 22–26. [Google Scholar] [CrossRef]
- Chen, Z.; Huang, Y.; Zhu, Z.; Zheng, Q.; Que, C.; Dong, J. Landscape pattern evolution along terrain gradient in Fuzhou City, Fujian Province, China. China. J. Appl. Ecol. 2018, 29, 4135–4144. [Google Scholar] [CrossRef]
- Liu, X.; Zhu, S.; Zhao, Y.; Li, R. Spatial-Temporal Evolution and Terrain Effects of Land Use Based on Geo-informatic Tupu in Hebei Shallow Mountainous Areas. Geogr. Geo-Inf. Sci. 2020, 36, 94–101. [Google Scholar]
- Wang, X.; Dong, X.; Liu, H.; Wei, H.; Fan, W. Linking land use change, ecosystem services and human well-being: A case study of the Manas River Basin of Xinjiang, China. Ecosyst. Serv. 2017, 27, 113–123. [Google Scholar] [CrossRef]
- Liu, C.; Xu, Y.; Lu, X. Spatiotemporal evolution and optimization of trade-off and synergy of land use functions in cologically fragile and poverty areas: A case study of Zhangjiakou City. Econ. Geogr. 2021, 41, 181–190. [Google Scholar] [CrossRef]
- Liu, M.; Wang, Y.; Pei, H. The changes of land use and carbon storage in the northern farming-pastoral ecotone under the background of returning farmland to forest(grass). J. Desert Res. 2021, 41, 174–182. [Google Scholar]
- Guo, H.; Xu, Y.; Wu, Y. Analysis of the land use spatial pattern and spatio-temporal changes based on terrain gradient: A case study of Pinggu District in Beijing. Econ. Geogr. 2013, 33, 160–167. [Google Scholar] [CrossRef]
- Yang, A.; Zhu, L.; Chen, S.; Jin, H.; Xia, X. Geo-informatic spectrum analysis of land use change in the Manas River Basin, China during 1975–2015. China J. Appl. Ecol. 2019, 30, 3863–3874. [Google Scholar] [CrossRef]
- Qu, Y.; Wang, S.; Zhu, W.; Ping, Z. Spatial-temporal differentiation characteristics and driving force of territorial space evolution in the Yellow River Delta. Trans. Chin. Soc. Agric. Eng. 2021, 37, 252–263+309. [Google Scholar]
- Zhang, H.; Zhou, X.; Tang, G.; Zhou, L.; Ye, X. Hotspot discovery and its spatial pattern analysis for catering service in cities based on field model in GIS. Geogr. Res. 2020, 39, 354–369. [Google Scholar]
- Xu, L.; Luo, W.; Zhou, B. Landscape Ecological Risk Assessment of Farming-Pastoral Ecozone Based on Land Use Change: A Case Study of the Yanghe Watershed, China. J. Nat. Resour. 2015, 30, 580–590. [Google Scholar]
- Yin, X.; Sun, X.; Xu, X.; Zhang, X.; Chen, D. The impact of returning farmland on the soil conservation function in the Western Section of the Farming-pastoral Ecotone of Northern China. J. Geo-Inf. Sci. 2018, 20, 1721–1732. [Google Scholar]
- Liu, B.; Yang, Y.; Li, Y. Quantitative analysis of land use structure characteristics over the farming-pastoral zone in the West Liaohe river basin, northern China. J. Arid Land Resour. Environ. 2018, 32, 64–71. [Google Scholar] [CrossRef]
- Hu, J.; Hu, J.; Lv, Y. Spatial variation of the relationship between annual runoff and sediment yield and land uses based on the regional critical zone differentiation in the Loss Plateau. Acta Eco. Sin. 2021, 41, 1–13. [Google Scholar]
- Li, S.; Shen, Z.; Liu, K.; Xu, Z.; Wang, H.; Jiao, S.; Liu, X.; Lei, Y. Analysis of terrain gradient effects of land use change in Daqing River Basin. Trans. Chin. Soc. Agric. Eng. 2021, 37, 275–284. [Google Scholar]
- Guo, B.; Zhang, G. Land use change in farming-pastoral region of Inner Mongolia based on GIS and Markov model. Trans. Chin. Soc. Agric. Eng. 2009, 25, 291–298. [Google Scholar]
- Yang, L.; Xie, Y.; Zong, L.; Qiu, T.; Jiao, J. Land Use Optimization Configuration based on Multi-Objective Genetic Algorithm and FLUS Model of Agro-pastoral Ecotone in Northwest China. J. Geo-Inf. Sci. 2020, 22, 568–579. [Google Scholar]
- Wang, Y.; Gao, J.; Jin, Y.; Cao, B.; Wang, Y.; Zhang, X.; Zhou, J. Habitat Quality of Farming-pastoral Ecotone in Bairin Right Banner, Inner Mongolia Based on Land Use Change and InVEST Model From 2005 to 2015. J. Ecol. Rural Environ. 2020, 36, 654–662. [Google Scholar] [CrossRef]
- Gao, J.; Luo, F.; Gao, Y.; Dang, X.; Meng, Z.; Chen, X.; Duan, N. Ecological soil C, N, and P stoichiometry of different land use patterns in the agriculture-pasture ecotone of Northern China. Acta Ecol. Sin. 2019, 39, 5594–5602. [Google Scholar]
- Du, G.; Sun, X.; Liu, Y. Analysis of ecological restoration on ecosystem service and its human driving factors in Yan’an city. Res. Soil Water Conserv. 2016, 23, 233–239. [Google Scholar] [CrossRef]
- Du, G.; Sun, X.; Liu, Y.; Zheng, H.; Ma, R. Temporal and spatial-differentiation characteristics of ecological restoration in Loess Plateau. J. Geo-Inf. Sci. 2017, 19, 355–364. [Google Scholar]
- Sun, S.; Zhang, X. Analysis on the Spatiotemporal Evolution of Land Use Transformation and Its Ecological Environment Effect in Shaanxi Province. Res. Soil Water Conserv. 2021, 28, 1–9. [Google Scholar] [CrossRef]
- Liu, C.; Huo, Y.; Xu, Y.; Huang, A.; Sun, P.; Lu, L. Changes in Cultivated Land and Influencing Factors before and after the Implementation of Grain for Green Project in Zhangjiakou City. J. Nat. Resour. 2018, 33, 1806–1820. [Google Scholar]
- Sun, P.; Xu, Y.; Liu, Q.; Liu, C.; Huang, A. Spatiotemporal differentiation and driving factors of multi-functionality of land use in county scale in poverty belt around Beijing and Tianjin. Trans. Chin. Soc. Agric. Eng 2017, 33, 283–292. [Google Scholar]
- Zhou, J.; Zhao, Y.; Huang, P.; Zhao, X.; Feng, W.; Li, Q.; Xue, D.; Dou, J.; Shi, W.; Wei, W.; et al. Impacts of ecological restoration projects on the ecosystem carbon storage of inland river basin in arid area, China. Ecol. Indic. 2020, 118, 106803. [Google Scholar] [CrossRef]
- Wang, J.; Xu, X.; Liu, P. Land ues and land carrying capacity in ecotone between agriculture and animal husbandry in northern China. Resour. Sci. 1999, 21, 21–26. [Google Scholar]
- Ma, L.; Li, T.; Li, T.; Long, D.; Chen, Y. Spatial distribution of rurality and types of rural development in farming-pastoral ecotone in Northern China. Econ. Geogr. 2015, 35, 126–133. [Google Scholar]
- Fang, Z.; He, C.; Liu, Z.; Zhao, Y.; Yang, Y. Climate change and future trends in the Agro-Pastoral Transitional Zone in Northern China: The comprehensive analysis with the historical observation and the model simulation. J. Nat. Resour. 2020, 35, 358–370. [Google Scholar] [CrossRef]
- Kong, D.; Chen, H. Spatio-temporal Patterns of Land Use Transitions and Related Influencing Factors-Comparative Analysis Based on Three Counties of North, Middle and South Jiangsu Province, China. Chin. J. Soil Sci. 2020, 51, 300–307. [Google Scholar] [CrossRef]
- Peng, R.; Luo, Y.; Chen, Q.; Li, Y. Land use change and its driving mechanism in small-scale rocky desertification control area: Take the huajiang rocky desertification control area as an example. Resour. Environ. Yangtze Basin 2017, 26, 2073–2082. [Google Scholar]
- Li, Y.; Yang, F.; Yang, L.; Shang, X.; Hu, G.; Jia, L. Spatial pattern changes and influencing factors of land use in Yulin City in the past 40 years. Arid Land Geogr. 2021, 44, 1011–1021. [Google Scholar]
- Wang, J.; Xu, C. Geodetector: Principle and prospective. Acta Geogr. Sin. 2017, 72, 116–134. [Google Scholar]
- Ma, S.; Qiao, Y.; Wang, L.; Zhang, J. Terrain gradient variations in ecosystem services of different vegetation types in mountainous regions: Vegetation resource conservation and sustainable development. For. Ecol. Manag. 2021, 482, 118856. [Google Scholar] [CrossRef]
- Liu, D.; Li, L. Spatiotemporal change and driving factors of land use in the northern border transect of China, 1995-2015. Resour. Sci. 2021, 43, 1208–1221. [Google Scholar] [CrossRef]
- Xu, Y.; Zhou, L.; Zhang, Z. Effect of cultivated land reclamation tracks on soil fertility changes in Changji Prefecture, Xinjiang. Geogr. Res. 2021, 40, 657–672. [Google Scholar]
- Huang, A.; Xu, Y.; Sun, P.; Zhou, G.; Liu, C.; Lu, L.; Xiang, Y.; Wang, H. Land use/land cover changes and its impact on ecosystem services in ecologically fragile zone: A case study of Zhangjiakou City, Hebei Province, China. Ecol. Indic. 2019, 104, 604–614. [Google Scholar] [CrossRef]
- Yu, Z.; Li, T.; Long, D.; Li, X.; Sun, D. The pattern evolution and it’s reasons about the agricultural modernization in Shaanxi-Gansu-Ningxia region. Sci. Geogr. Sin. 2014, 34, 411–419. [Google Scholar]
- Han, L.; Huo, H.; Liu, Z.; Zhao, Y.; Zhu, H.; Chen, R.; Zhao, Z. Spatial and temporal variations of vegetation coverage in the middle section of Yellow River Basin based on terrain gradient: Taking Yan’an City as an example. China J. Appl. Ecol. 2021, 32, 1581–1592. [Google Scholar] [CrossRef]
- Song, Y.; Xue, D.; Xia, S.; Mi, W. Change characteristics and formation mechanism of the territorial spatial pattern in the Yellow River Basin from 1980 to 2018, China. Geogr. Res. 2021, 40, 1445–1463. [Google Scholar]
- Shen, J.; Wang, X. Spatial-temporal changes in ecological risk of land use before and after Grain-for-Green policy in Zhengning County, Gansu Province. J. Resour. Ecol. 2013, 4, 36–42. [Google Scholar] [CrossRef]
- Zhang, T.; Peng, J.; Liu, Y.; Zhao, M. Eco-geographical regionalization in Loess Plateau based on the dynamic consistency of vegetation. Geogr. Res. 2015, 34, 1643–1661. [Google Scholar]


| Data Types | Data Sources | Data Resolution |
|---|---|---|
| Landsat TM images (2000, 2010) Landsat OLI images (2020) | Geo-spatial Data Cloud (http://www.gscloud.cn/), (accessed on 1 April 2021). | 30 m × 30 m 15 m × 15 m |
| Meteorological data | China Meteorological Science Data Sharing Service Network (http://cdc.cma.gov.cn/), (accessed on 1 April 2021). | 1 km × 1 km |
| Soil data (Soil thickness) | China data set of the World Soil Database (HWSD). | 500 m × 500 m |
| Digital elevation model (DEM) | Resource and Environmental Science and Data Center (http://www.resdc.cn/), (accessed on 1 April 2021). | 30 m × 30 m |
| Socioeconomic statistics | Statistical Yearbooks, Statistical Communiques, and China County Statistical Yearbooks of provinces and cities in the AENC. | - |
| Rank | Elevation | Slope | Terrain Relief | |||
|---|---|---|---|---|---|---|
| Classification (m) | Proportion (%) | Classification (°) | Proportion (%) | Classification (m) | Proportion (%) | |
| I | <200 | 6.96 | <2 | 16.32 | <50 | 19.86 |
| II | 200–500 | 12.81 | 2-6 | 30.11 | 50–100 | 17.06 |
| III | 500–1000 | 17.24 | 6–15 | 32.19 | 100–200 | 51.57 |
| IV | 1000–3500 | 62.09 | 15–25 | 16.29 | 200–300 | 7.76 |
| V | >3500 | 0.90 | >25 | 5.09 | >300 | 3.75 |
| Types | Meaning | Sample |
|---|---|---|
| Stable type | Land-use structure didn’t change during 2000–2020. | Grassland-Grassland-Grassland |
| Prophase change | Land-use structure changed only in 2000–2010. | Forestland-Grassland-Grassland |
| Anaphase change | Land-use structure changed only in 2010–2020. | Grassland-Grassland-Farmland |
| Continuous change | Changes occurred during 2000–2010 and 2010–2020. | Grassland-Forestland-Farmland |
| Repeated change | Change occurred in 2000–2010 and then returned to 2000 use in 2020. | Farmland-Grassland-Farmland |
| Driving Factors | Explanatory Variables | Interpretation | |
|---|---|---|---|
| Natural environment factors | Topographic condition | X1 Elevation | Digital elevation model (DEM) of each unit (m). |
| X2 Slope | Slope of each unit (o). | ||
| Climate condition | X3 Mean annual precipitation | ArcGIS software was used to spatially interpolate the annual mean precipitation for each unit(mm). | |
| X4 Annual mean temperature | ArcGIS software was used to spatially interpolate the annual mean temperature of each unit (°C). | ||
| Soil condition | X5 Soil thickness | Soil reference depth of each unit (cm). | |
| Geographical Location | X6 Distance to the nearest river | Distance of cells to the nearest river (km). | |
| X7 Distance to county capital | Distance of cells to the county capital (km). | ||
| Socioeconomic factors | X8 Grain yield | Total grain yield in the region (×104 t). | |
| X9 Year-end large livestock stock | Number of large livestock stocks in the region at the end of the calendar year (×104 head). | ||
| X10 Number of agriculture employee | Number of people engaged in agriculture in the region (person). | ||
| X11 Population density | Total population was divided by total regional area (×109 person/km2). | ||
| X12 Economic density | Gross domestic product was divided by the total regional area (×109CNY/km2). | ||
| X13 Road network density | Road mileage was divided by the total regional area (km/km2). | ||
| Regional policy factors | X14 Ecological conversion | During 2000–2020, if one unit of conversion from farmland to forestland, grassland or water area assigned the value of 1, or 0 otherwise. | |
| X15 Basic farmland protection | If one unit was located in a basic farmland protection area, assigned the value of 1, or 0 otherwise. | ||
| Land-Use Types | 2000 | 2010 | 2020 | 2000–2020 | |
|---|---|---|---|---|---|
| Area (km2) | Area (km2) | Area (km2) | Change Area (km2) | Change Rate (%) | |
| Farmland | 268,959.49 | 264,216.49 | 269,471.62 | 512.13 | 0.19 |
| Forestland | 75,547.52 | 75,435.97 | 77,359.96 | 1812.44 | 2.40 |
| Grassland | 328,162.60 | 332,665.41 | 313,629.72 | −14,532.90 | −4.43 |
| Water | 4367.72 | 3287.45 | 4614.36 | 246.64 | 5.65 |
| Construction land | 9541.74 | 10,991.71 | 20,861.47 | 11,319.73 | 118.63 |
| Unused land | 12,499.62 | 12,481.72 | 13,141.65 | 642.03 | 5.14 |
| ID | 2000–2010 | 2000–2020 | ||||
|---|---|---|---|---|---|---|
| Conversion Types | Area (km2) | Ni (%) | Conversion Types | Area (km2) | Ni (%) | |
| 1 | Farmland-Grassland | 11,699.20 | 24.34 | Grassland-Farmland | 33,470.63 | 30.01 |
| 2 | Forestland-Grassland | 9142.64 | 19.02 | Farmland-Grassland | 20,878.26 | 18.72 |
| 3 | Grassland-Forestland | 8613.02 | 17.92 | Grassland-Forestland | 14,679.14 | 13.16 |
| 4 | Grassland-Farmland | 7389.44 | 15.38 | Forestland-Grassland | 12,973.33 | 11.63 |
| 5 | Farmland-Construction land | 1730.73 | 3.60 | Farmland-Construction land | 8115.65 | 7.28 |
| 6 | Unused land-Grassland | 1386.84 | 2.89 | Grassland-Unused land | 3664.55 | 3.29 |
| 7 | Grassland-Unused land | 1327.49 | 2.76 | Grassland-Construction land | 3321.32 | 2.98 |
| 8 | Construction land-Farmland | 1036.64 | 2.16 | Farmland-Forestland | 2991.23 | 2.68 |
| 9 | Grassland-Construction land | 1035.93 | 2.16 | Unused land-Grassland | 2780.18 | 2.49 |
| 10 | Other 21 types | 4698.76 | 9.78 | Other 21 types | 8657.84 | 7.76 |
| — | Total | 100 | Total | 100 | ||
| Change Types | Land-Use Structure Changes | Largest Types of Geo-Information Graphics | ||
|---|---|---|---|---|
| Area (km2) | Proportion (%) | Sample | Proportion of Change Types (%) | |
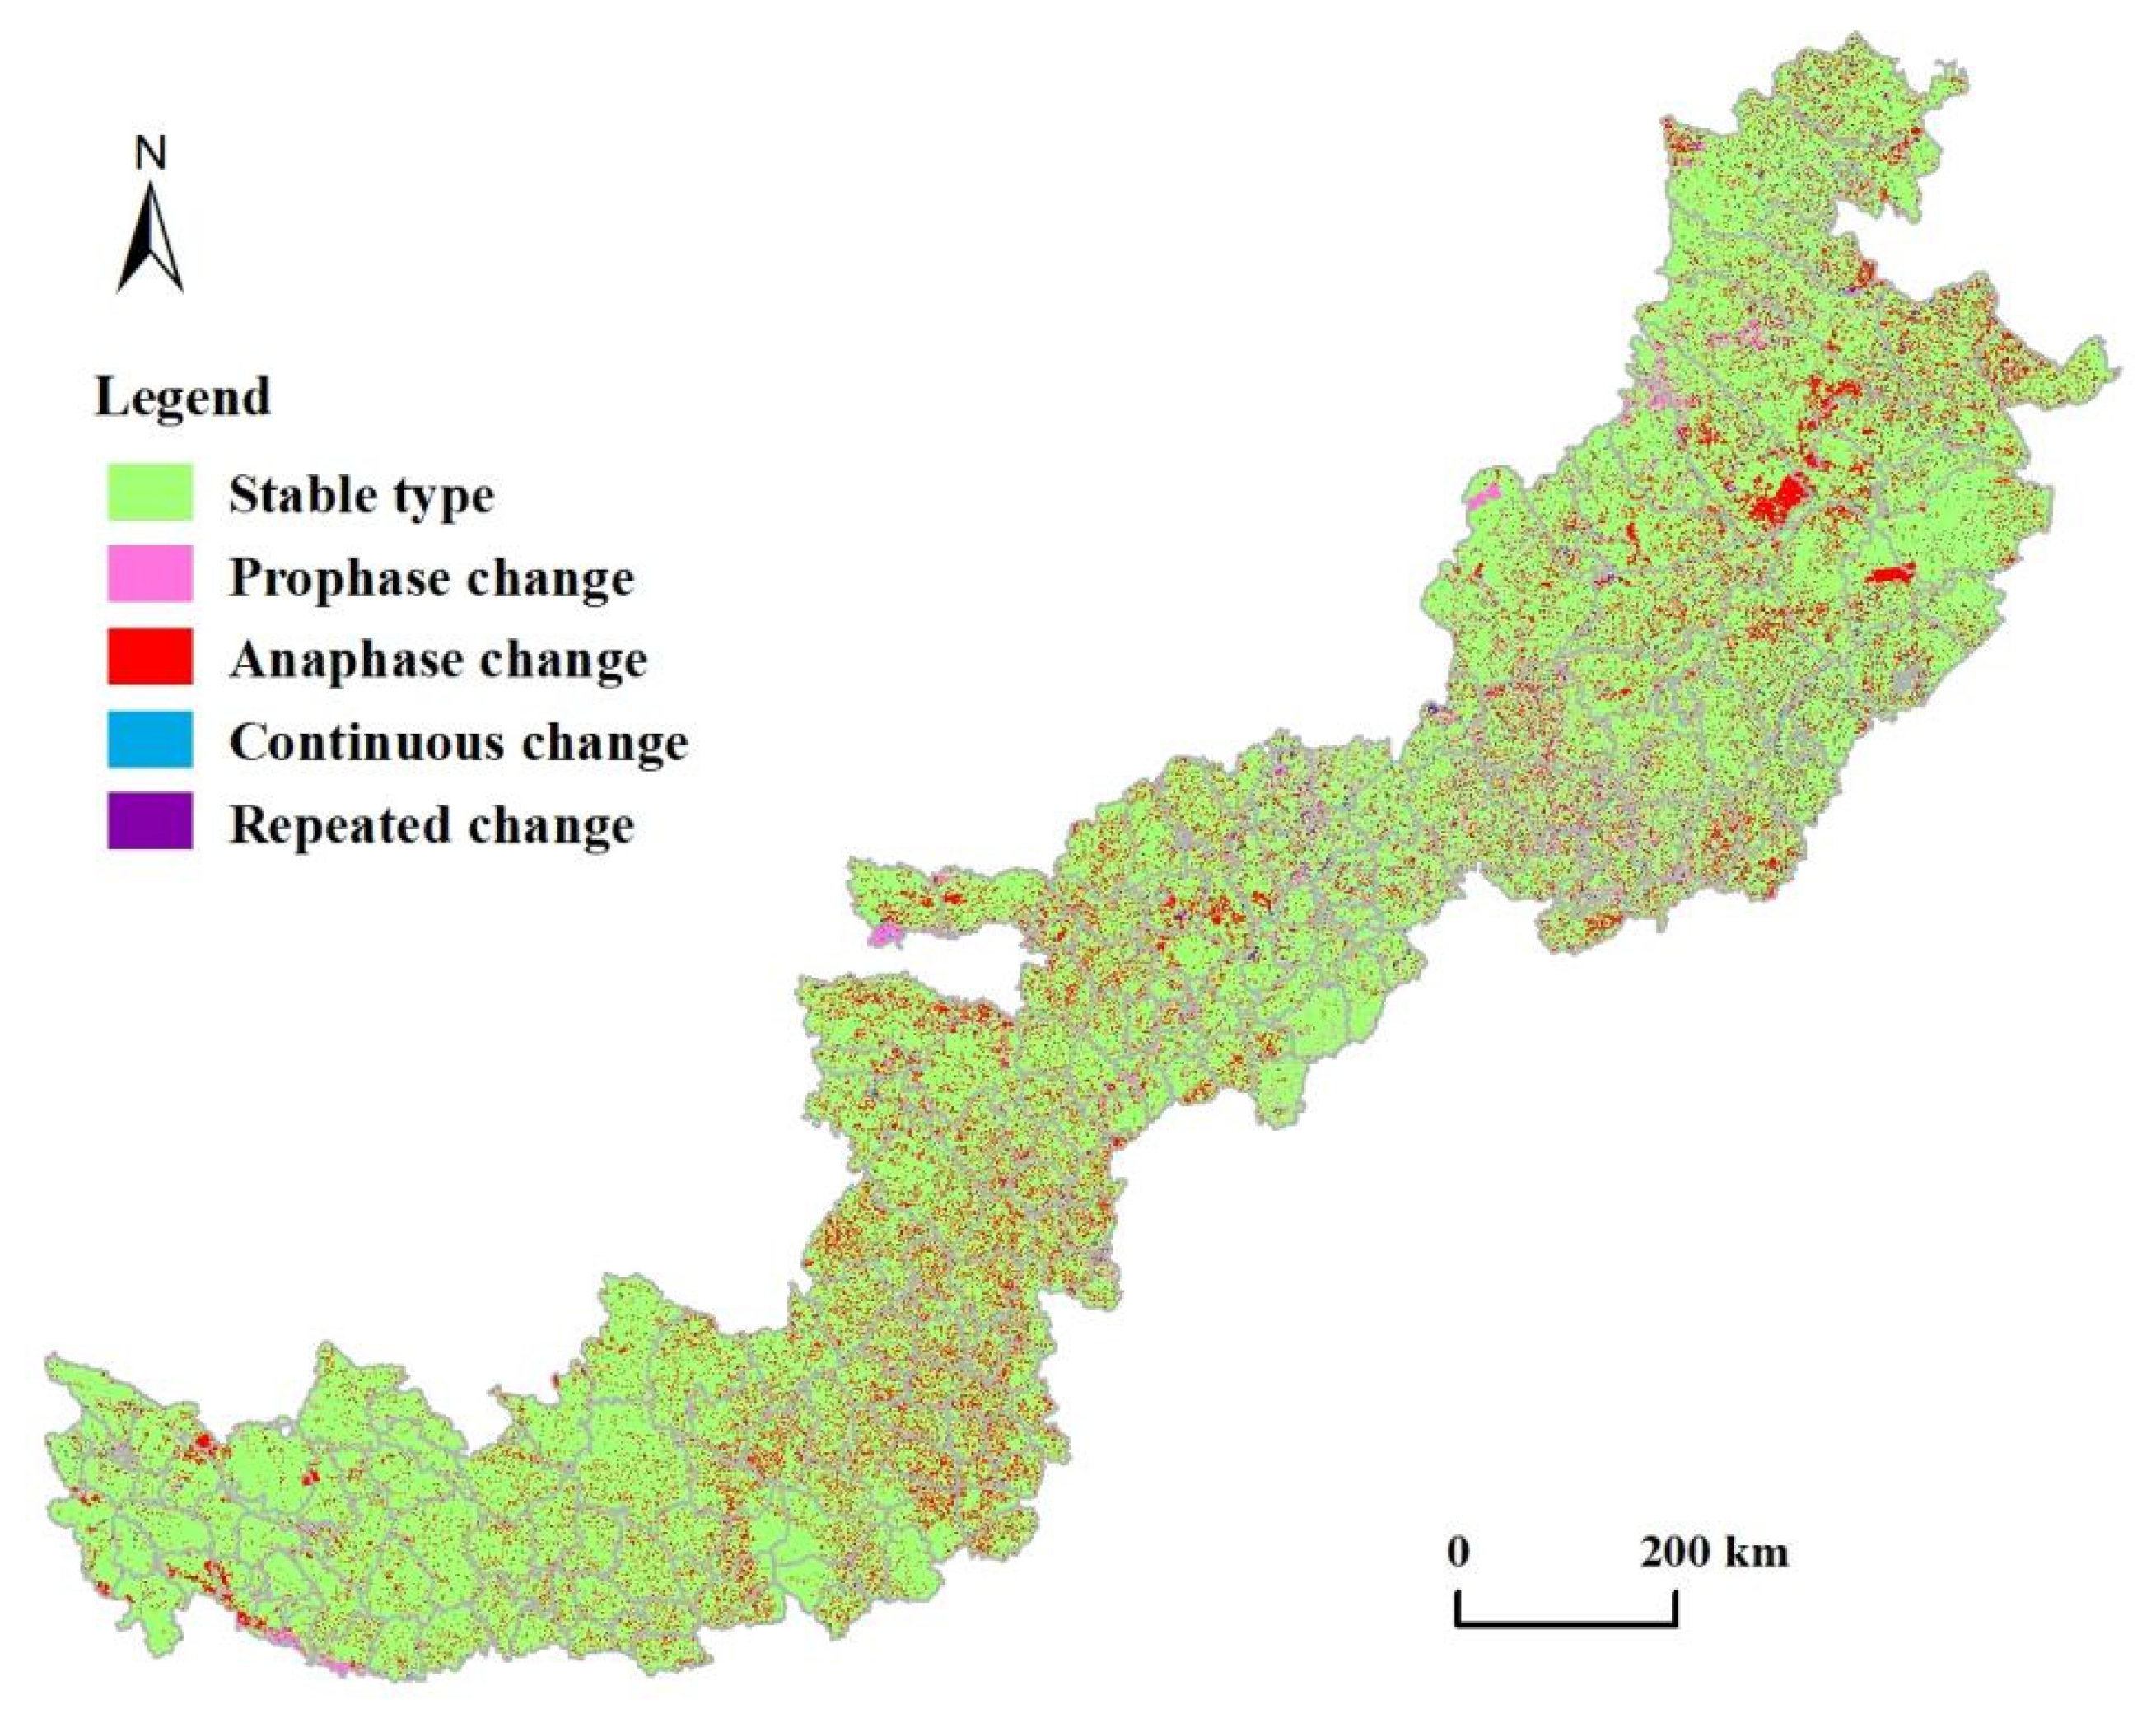
| Stable type | 559,868.86 | 80.09 | Grassland-Grassland-Grassland | 46.90 |
| Farmland-Farmland-Farmland | 40.36 | |||
| Prophase change | 27,635.00 | 3.95 | Forestland-Grassland-Grassland | 23.03 |
| Farmland-Grassland-Grassland | 21.37 | |||
| Anaphase change | 91,080.59 | 13.03 | Grassland-Grassland-Farmland | 30.38 |
| Farmland-Farmland-Grassland | 19.34 | |||
| Continuous change | 3010.81 | 0.43 | Grassland-Forestland-Farmland | 11.88 |
| Repeated change | 17,413.61 | 2.49 | Farmland-Grassland-Farmland | 30.35 |
| Topographic Factors | Elevation | Slope | Terrain Relief | Terrain Niche |
|---|---|---|---|---|
| Elevation | / | |||
| Slope | 0.592 ** | / | ||
| Terrain relief | 0.986 ** | 0.688 ** | / | |
| Terrain niche | 0.893 ** | 0.738 ** | 0.892 ** | / |
| Driving Factors | Stable Type | Prophase Change | Anaphase Change | Continuous Change | Repeated Change | |||||
|---|---|---|---|---|---|---|---|---|---|---|
| Grassland- Grassland- Grassland | Farmland- Farmland- Farmland | Forestland- Grassland- Grassland | Farmland- Grassland- Grassland | Grassland- Grassland- Farmland | Farmland- Farmland- Grassland | Grassland- Forestland- Farmland | Grassland- Farmland- Construction Land | Farmland- Grassland- Farmland | Farmland- Unused Land- Farmland | |
| Elevation | 0.243 *** | 0.439 *** | 0.327 *** | 0.146 *** | 0.361 *** | 0.154 *** | 0.287 *** | 0.311 *** | 0.474 *** | 0.152 *** |
| Slope | 0.214 *** | 0.300 *** | 0.133 *** | 0.176 *** | 0.355 *** | 0.284 *** | 0.165 *** | 0.115 *** | 0.302 *** | 0.230 *** |
| Mean annual precipitation | 0.211 *** | 0.154 *** | 0.125 *** | 0.073 *** | 0.323 *** | 0.320 *** | 0.126 *** | 0.148 *** | 0.229 *** | 0.067 *** |
| Annual mean temperature | 0.450 *** | 0.149 *** | 0.299 *** | 0.490 *** | 0.158 *** | 0.154 *** | 0.228 *** | 0.265 *** | 0.290 *** | 0.107 *** |
| Soil thickness | 0.108 *** | 0.157 *** | 0.114 *** | 0.055 *** | 0.203 *** | 0.154 *** | 0.101 *** | 0.138 *** | 0.228 *** | 0.067 *** |
| Distance to the nearest river | 0.252 *** | 0.089 *** | 0.131 *** | 0.080 *** | 0.173 *** | 0.095 *** | 0.152 *** | 0.133 *** | 0.163 *** | 0.132 *** |
| Distance to county capital | 0.734 *** | 0.216 *** | 0.446 *** | 0.265 *** | 0.560 *** | 0.282 *** | 0.341 *** | 0.254 *** | 0.402 *** | 0.089 *** |
| Grain yield | 0.305 *** | 0.725 *** | 0.273 *** | 0.145 *** | 0.557 *** | 0.261 *** | 0.332 *** | 0.395 *** | 0.601 *** | 0.166 *** |
| Year-end large livestock stock | 0.348 *** | 0.490 *** | 0.367 *** | 0.187 *** | 0.521 *** | 0.257 *** | 0.390 *** | 0.260 *** | 0.468 *** | 0.181 *** |
| Number of agriculture employee | 0.247 *** | 0.541 *** | 0.252 *** | 0.084 *** | 0.252 *** | 0.192 *** | 0.211 *** | 0.173 *** | 0.289 *** | 0.130 *** |
| Population density | 0.699 *** | 0.125 *** | 0.402 *** | 0.227 *** | 0.462 *** | 0.229 *** | 0.253 *** | 0.165 *** | 0.254 *** | 0.069 *** |
| Economic density | 0.346 *** | 0.147 *** | 0.171 *** | 0.112 *** | 0.174 *** | 0.144 *** | 0.088 *** | 0.067 *** | 0.141 *** | 0.055 *** |
| Road network density | 0.238 *** | 0.238 *** | 0.131 *** | 0.116 *** | 0.271 *** | 0.254 *** | 0.136 *** | 0.069 *** | 0.208 *** | 0.152 *** |
| Ecological conversion | 0.117 *** | 0.129 *** | 0.117 *** | 0.120 *** | 0.168 *** | 0.283 *** | 0.070 *** | 0.220 *** | 0.123 *** | 0.090 *** |
| Basic farmland protection | 0.076 *** | 0.127 *** | 0.016 ** | 0.043 *** | 0.009 * | 0.005 | 0.003 | 0.032 *** | 0.001 | 0.025 *** |
Publisher’s Note: MDPI stays neutral with regard to jurisdictional claims in published maps and institutional affiliations. |
© 2022 by the authors. Licensee MDPI, Basel, Switzerland. This article is an open access article distributed under the terms and conditions of the Creative Commons Attribution (CC BY) license (https://creativecommons.org/licenses/by/4.0/).
Share and Cite
Gong, Q.; Sun, P.; Liu, Q.; Mo, J. Topographical Gradient Characteristics of Land-Use Changes in the Agro-Pastoral Ecotone of Northern China. Land 2022, 11, 2195. https://doi.org/10.3390/land11122195
Gong Q, Sun P, Liu Q, Mo J. Topographical Gradient Characteristics of Land-Use Changes in the Agro-Pastoral Ecotone of Northern China. Land. 2022; 11(12):2195. https://doi.org/10.3390/land11122195
Chicago/Turabian StyleGong, Qiaoqiao, Piling Sun, Qingguo Liu, and Junxiong Mo. 2022. "Topographical Gradient Characteristics of Land-Use Changes in the Agro-Pastoral Ecotone of Northern China" Land 11, no. 12: 2195. https://doi.org/10.3390/land11122195