Article

Evaluation of Suitability and Spatial Distribution of Rural Settlements in the Karst Mountainous Area of China

1
Department of Tourism and Geography, Tongren University, Tongren 554300, China
2
Research Center for Grassland Ecology and Resources, School of Grassland Science, Beijing Forestry University, Beijing 100083, China
*
Author to whom correspondence should be addressed.
Land 2022, 11(11), 2101; https://doi.org/10.3390/land11112101
Submission received: 2 October 2022 / Revised: 11 November 2022 / Accepted: 18 November 2022 / Published: 21 November 2022
(This article belongs to the Special Issue Smart Land Use Planning: New Theories, New Tools and New Practice)

Abstract

:
With the acceleration of urbanization and the implementation of the rural revitalization strategy, the spatial pattern of rural settlements in China has changed significantly. The suitability of rural settlements is a requirement for rural revitalization. The objective of this paper is to quantitatively depict, analyze, and evaluate the suitability of rural settlements in karst mountain areas to eliminate poverty and accelerate the process of new urbanization by constructing rural settlements. Taking 525 rural settlements in Songtao Miao Autonomous County, Guizhou Province, in the karst mountainous area as the research object, the distribution of rural settlements is studied using point mode spatial analysis and neighborhood analysis. The impacts of natural and regional environmental factors are detected using Geodetector. To make the evaluation results more scientific and reasonable, a suitability evaluation model based on Geodetector and AHP was constructed to solve the subjective problem of the weight assignment of the AHP method and reflect the interaction between the influencing factors. The results demonstrate the following. (1) The variation coefficient of the Thiessen polygon area in the Voronoi diagram shows that the spatial distribution of rural settlements is mainly random. The spatial distribution of kernel density in rural settlements presents multiple nuclear centers, with obvious spatial differentiation, with Changping Township being the densest and Waxi Township the sparsest. (2) Rural settlements are mainly distributed below a 15° slope, 800 m above sea level, within 6 km from rivers, 4 km from roads, and 7 km from the township center. Slope and distance from the river are the main driving forces of spatial differentiation. The spatial distribution of rural settlement areas is affected by natural and regional environmental factors, and the interaction between slope and distance from the river is the strongest explanatory power. (3) The results of suitability evaluation show that 87.40% of the rural settlement areas are categorized as “suitable” and “relatively suitable” for living. The “suitable” rural settlement areas are mainly concentrated in the hilly and low mountain areas and river valleys, with relatively gentle terrain in the middle and east, distributed in two north–south trending strips. The “relatively suitable” rural settlements are mainly scattered in the surrounding livable areas. This study could provide a reference for the planning and reconstruction of rural residential areas in karst mountain areas and expand the research means of suitability evaluation of rural residential areas, and it is applicable to other settings.

1. Introduction

Rural settlements are the main spaces for people to live, work, and carry out political and cultural activities in rural areas. They serve the main functions of rural life and production, and are related to the quality of life of rural residents [1,2,3]. The formation and development of rural settlements are often influenced by economic, social, and cultural factors [3], thereby forming certain agglomeration characteristics. Therefore, the spatial distribution pattern and coupling with regional natural and social environments can reflect the basic characteristics and development direction of rural space [4,5,6]. The exploration of the spatial distribution and driving factors of rural settlements and the optimization of the spatial structure and scientific and rational layout have important theoretical value and practical significance for formulating correct spatial development strategies and promoting rural sustainable development [1].
With the rapid development of China’s economy and the acceleration of urbanization, rural transformation and reconstruction have intensified, giving rise to various reconstruction forms such as urbanized villages, specialized villages, and hollow villages [7]. At the same time, the spatial distribution scale and structure of rural settlements have changed significantly, and the problems of scattered and disorderly rural settlements, extensive planning, building new settlements and abandoning old ones, “expanding outside and emptying inside”, encroaching on cultivated land, and deteriorating ecological environments have become increasingly prominent [1,8]. Although the level of urbanization in China has been greatly improved, rural settlements will remain the main long-term settlement form for farmers to engage in agricultural production and living activities [9]. Therefore, the central government emphasizes that agriculture, rural areas, and farmers are fundamental concerns related to the national economy and that livelihood, agriculture, and rural areas should be prioritized to implement high-quality development. The National Strategic Plan for Rural Revitalization (2018–2022) proposes “optimizing the spatial pattern of production, living, and ecology in rural areas” and “building a beautiful countryside”, providing a new development opportunity for the reconstruction of rural production and living space and the realization of sustainable and high-quality development. The scientific evaluation of selecting suitable rural residential areas and the rational optimization of land resources constitute the premise of rural planning and rational layout and the key fields of current rural development research and rural revitalization strategy implementation [9,10,11].
Guizhou Province is located in the southwest karst mountain area of China, a typical ecologically fragile area [12], with a small ecological environment capacity [13], poor coordination of social and economic development, low land carrying capacity [14], and a marked contradiction between people and land. Since the implementation of the precise poverty alleviation strategy in 2013, significant human and financial resources have been invested in rural ecological environment governance and infrastructure construction. There has been ecological migration, poverty alleviation, and relocation in different places, and rural “group-to-group” highway projects have been completed. The living and development conditions in poor rural areas have been greatly improved, and the spatial pattern of rural settlements has changed significantly. There is now a need to evaluate the suitability of rural settlements in the Guizhou karst mountainous areas after tackling poverty in rural areas and the overall regional poverty to scientifically and reasonably reflect the current development situation. Based on analyzing the spatial distribution characteristics of rural settlements, considering the spatial heterogeneity of geographical factors and the interaction between influencing factors, this study explores the relationship between the distribution characteristics of rural settlements and various environmental factors. We used Geodetector to explore the relationship between the distribution characteristics of rural settlements and various environmental factors, constructed an evaluation index system of the suitability of rural settlements, and applied the detection results of Geodetector to objectively weigh the evaluation indexes, thereby constructing a suitability evaluation model based on Geodetector and analytic hierarchy process (AHP). We explored the following problems that need to be solved urgently in the process of rural revitalization and high-quality development in Guizhou to provide a reference for the renovation and spatial layout optimization of rural settlements in karst mountainous areas: What are the spatial distribution characteristics of rural settlements in Guizhou Province and their relationship with various environmental factors? How can the suitability of existing rural settlements be objectively and quantitatively evaluated?

2. Literature Review

Against the background of new urbanization, rural revitalization, and rural structural transformation, the suitability evaluation of rural settlements has become an important basis for rural spatial planning and management. In recent years, scholars have conducted substantial research on the spatial pattern characteristics and suitability of rural settlements from the perspectives of geography, landscape ecology, and regional planning, combined with GIS spatial analysis.

2.1. Spatial Distribution Characteristics of Rural Settlements

As an essential human landscape, the spatial distribution of rural settlements is an important expression of the evolution of the relationship between humans and land [15,16]. In recent years, scholars have made abundant research progress on the spatial distribution and evolution of rural settlements from different perspectives. Research methods have focused mainly on the spatial scale [17,18], clustering degree [19,20], morphological characteristics [21,22], and location distribution [23] of rural settlements using methods such as kernel density [15,24,25], scale number [26,27], nearest neighbor distance [28,29], fractal dimension [30,31,32], Voronoi diagram [33,34], and landscape index [35,36] to carry out multi-level, multi-form, and multi-space research. The study areas have included a hilly area, a plain area, a karst trough and valley area, and a mountain area. Scholars usually combine the spatial and temporal evolution of rural settlements with the analysis of influencing factors, and scientifically identify the spatial distribution characteristics and influencing mechanisms of rural settlements. Scholars have used multiple linear regression [37], logistic regression [38], buffer analysis [39], principal component analysis [40], ESDA [41], GWR [36], and other methods to quantitatively analyze the influencing factors of the spatial pattern of rural settlements, such as nature and location. Research has concluded that the spatial distribution of rural settlements in most areas of China has the characteristics of low altitude, low slope, near water system, and near road, and the spatial variation shows the characteristics of decreasing number, expanding area, and complex shape.

2.2. Suitability Evaluation Method of Rural Settlements

A clear understanding of the spatial pattern characteristics of rural settlements and their influencing factors is the basis for carrying out suitability evaluation. Most suitability evaluation studies are based on the thousand-layer cake planning model proposed by the American scholar McHarg [42]. In this method, multiple evaluation factors are first de-scribed as separate layers, and then all layers are superimposed, a method also known as graph stacking addition. However, for different researchers, the determination of the weight of each factor is not fixed, and most of them rely on subjective judgment. With the increasing maturity of GIS technology, scholars selected different evaluation factors from the dimensions of nature, location, and the social economy based on research orientation to construct an evaluation index system of the suitability of rural settlements. Based on AHP [43], cluster analysis [44], AVC theory [45], the MCR model [46,47], and other methods, the weight of each evaluation index was quantified, and a series of academic achievements rich in reference value were obtained. However, although these methods enhance the objectivity of suitability evaluation to a certain extent, they also fail to fundamentally solve the subjectivity of weight assignment. The premise of the above evaluation method is that the influencing factors are independent of each other. However, the different spatial forms of rural settlements are the comprehensive reflection of regional nature, location, culture, and economy [1,2]. The relationship between the factors affecting the suitability of rural settlements is usually mutual influence and restriction. This interaction in the above method is not taken into account, and the interaction force of different factors on the dependent variable cannot be quantified. It is also impossible to quantify the interaction force of different factors on the dependent variable. Therefore, it cannot fully reflect the spatial distribution of rural settlements and the relationship between various environ-mental factors. Geodetector can quantify the influence of each factor by analyzing the statistical data of each evaluation factor, and the quantitative results can be used to guide the AHP to generate the weight value of each factor. Based on this, we constructed a suitability evaluation model of rural settlements based on Geodetector and AHP to evaluate the suitability of rural settlements in the karst mountainous areas, effectively addressing the shortcomings of the above methods, expanding the research means of suitability evaluation of rural settlements to a certain extent, and making them applicable in other areas.

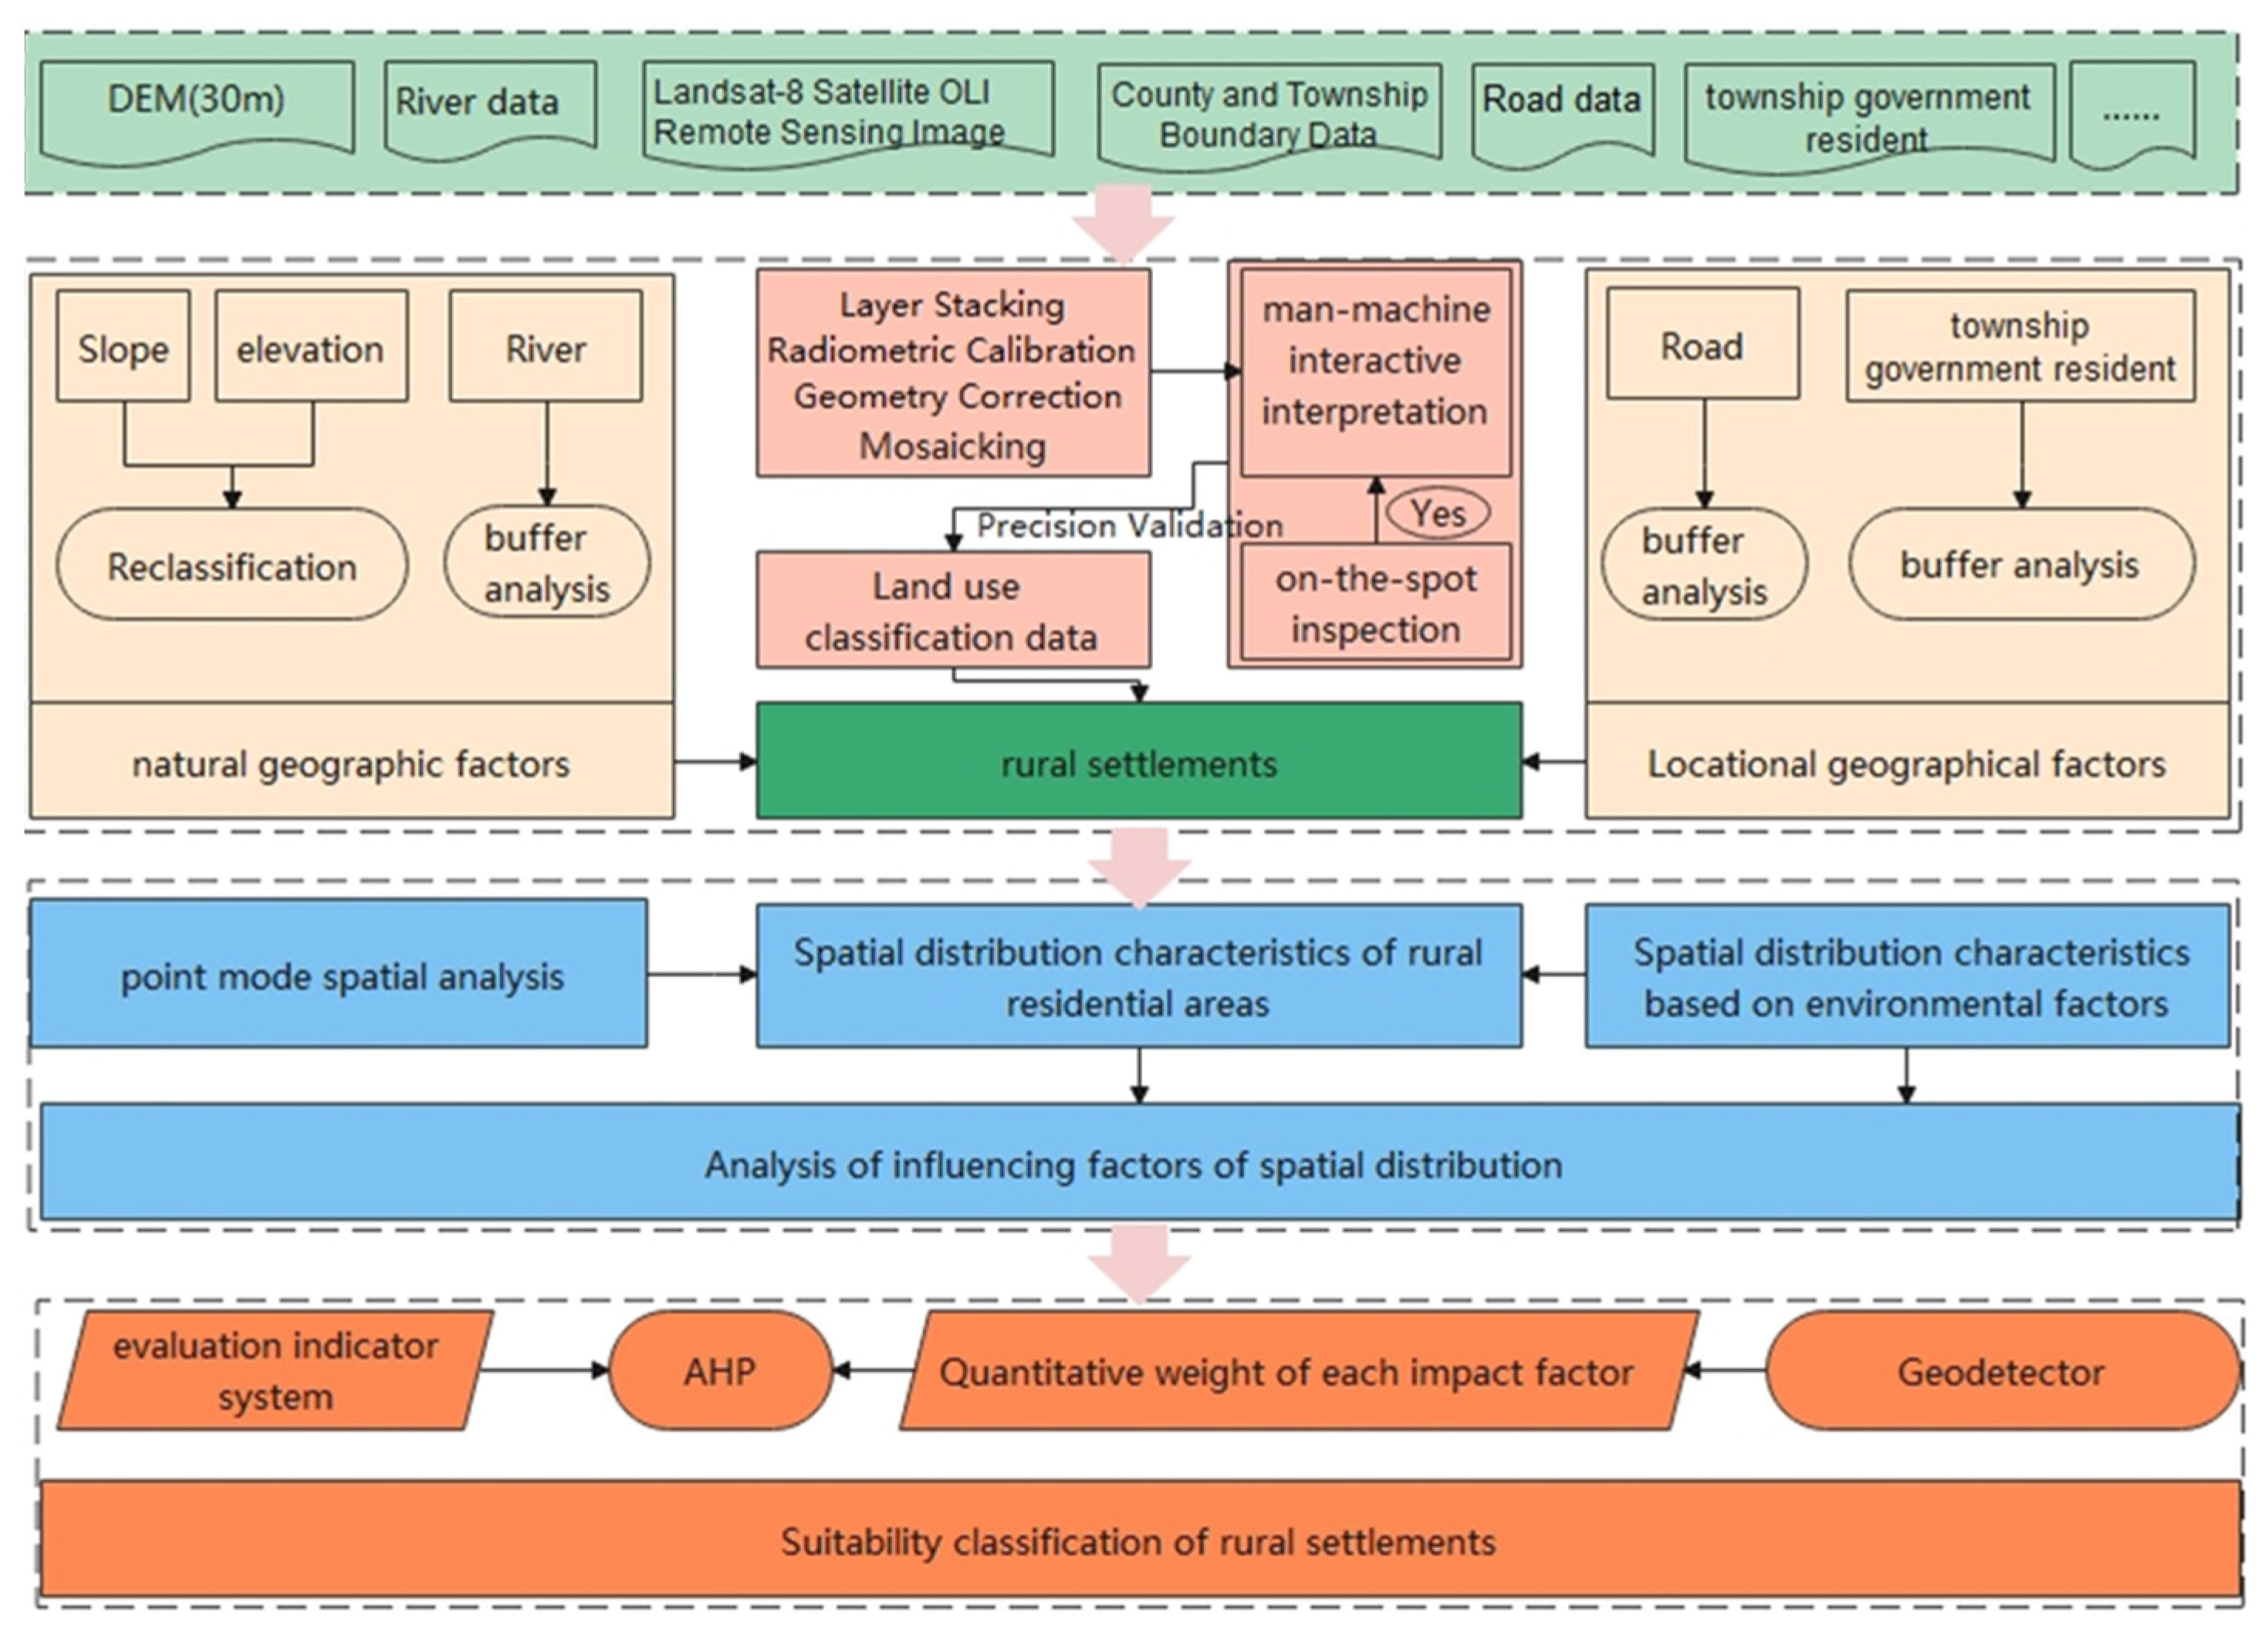
3. Materials and Methods
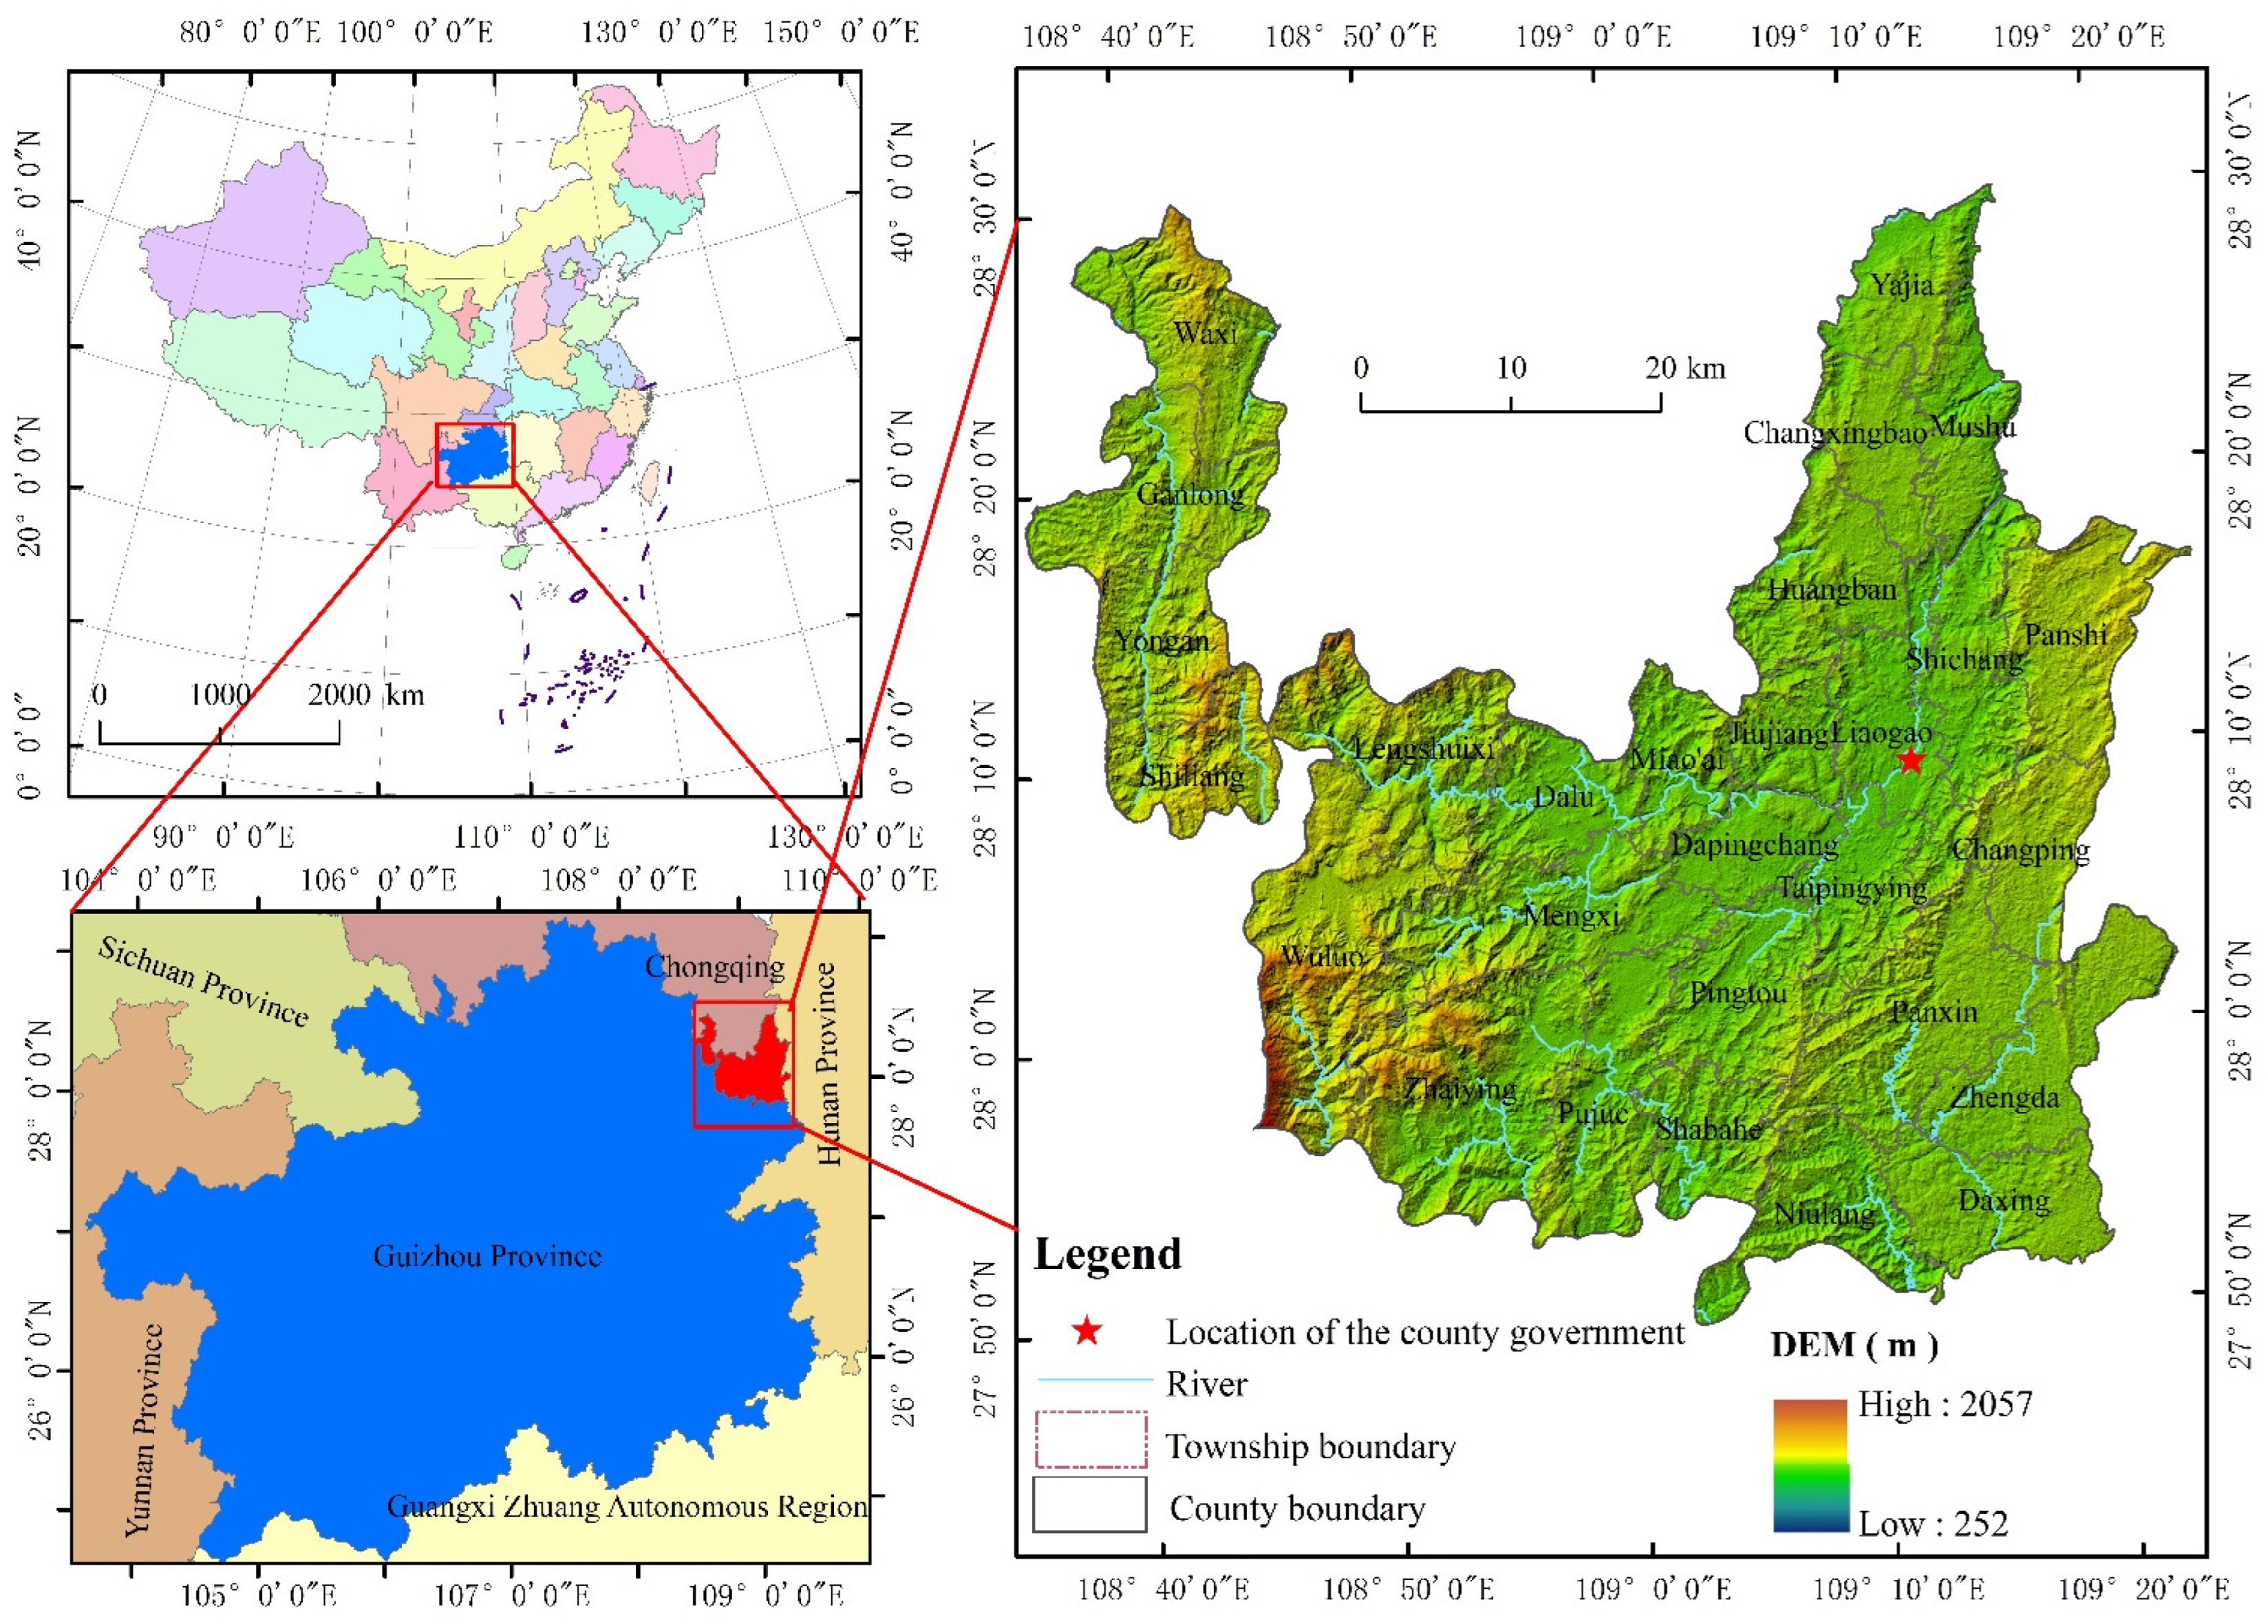
3.1. Study Area

Songtao Miao Autonomous County is located in the northeast of Guizhou Province, at the junction of Chongqing, Hunan, and Guizhou Provinces. It is connected to Huayuan County and Fenghuang County in Hunan Province in the east, Tongren city and Jiangkou County in the south, Yinjiang County and Yanhe County in the west, and Youyang County and Xiushan County in Chongqing in the north. In ancient times, it was known as “the land that connects Sichuan and Chu”, and it is the gateway of Sanxiang and the northeast of Guizhou, with a county area of 3409 km2. It is located in the middle of the transition from the eastern slope of the Yunnan–Guizhou Plateau to the hills of western Hunan, at the northeast foot of Fanjing Mountain, the main peak of Wuling Mountain. It slowly transitions from west to east to the slopes of western Hunan(Figure 1). The terrain is a basin with high east and west sides, slightly higher north and south sides, and a low middle area, with an average elevation of about 650 m. The county has an obvious karst landform, and is one of the pilot counties for comprehensive control of karst rocky desertification in China. The western part of the county has a steep slope, and it is a mid-mountain gorge area. The eastern part has gentle folds, and the terrain fluctuates little. It is a hilly, medium, and low mountain landform, with hills, valleys, and dams in the middle, and low mountain valleys in the north and south. The water system mostly follows the northeast trend of Fanjing Mountain, and there are many rivers with a total length of 744.9 km.
Songtao Miao Autonomous County has jurisdiction over 525 administrative villages (communities) in 28 townships (streets) of the county, with a population of 487,700. Affected by karst vulnerability, the ecological environment capacity is small, soil erosion is serious, arable land resources are tight, and the contradiction between people and land is prominent. There are high mountains and deep gullies, scattered living, and inconvenient transportation. A total of 291 poverty-stricken villages (including 42 deep poverty-stricken villages) were identified in 2014, with a poverty incidence rate of 24.03%. It is a key poverty-stricken county in the seventh national plan and a key poverty-stricken county in the new stage. It is a typical “old” county. In recent years, 33 resettlement sites for ex situ poverty alleviation have been built, and roads connecting villages to villages have been constructed, bringing about practical improvements in rural production and living conditions. The interconnection of expressways, such as those connecting Hangrui, Xiangyu, Songtong, Baomao, and Songcong, has further accelerated economic development.

3.2. Data Source and Pretreatment

The original data required for the study are mainly Landsat 8 OLI remote sensing images and DEM data of Tongren City, with a spatial resolution of 30 m. The Landsat 80 LI remote sensing images have a band number of 126, row numbers of 40 and 41, an imaging date of 12 November 2020, and total cloud cover of less than 5%. All the above data are provided by Geospatial Data Cloud site, Computer Network Information Center, Chinese Academy of Sciences (www.gscloud.cn/ (accessed on 1 October 2022)). A Bigemap map downloader was used to obtain the data of area elements and river and road line elements in the study area and the villages and towns.
Based on ENVI5.3, the Landsat8 OLI remote sensing images were subjected to radiometric calibration, geometric correction, image registration, multi-band image synthesis, and cropping. The land use type map of the study area was obtained by manual interpretation according to the actual land use situation and the land use cover classification system of the Chinese Academy of Sciences. The classification accuracy was evaluated by field investigation and repeated interpretation of randomly selected dynamic patches, and the classification error and Kappa coefficient were tested. The overall accuracy was above 85%. On this basis, the extracted rural settlement data in the study area were converted into point data by ArcGIS, and their spatial distribution was studied based on the Thiessen polygons method. ArcGIS was used to extract topographic factors such as elevation and slope from DEM data.

3.3. Research Methods

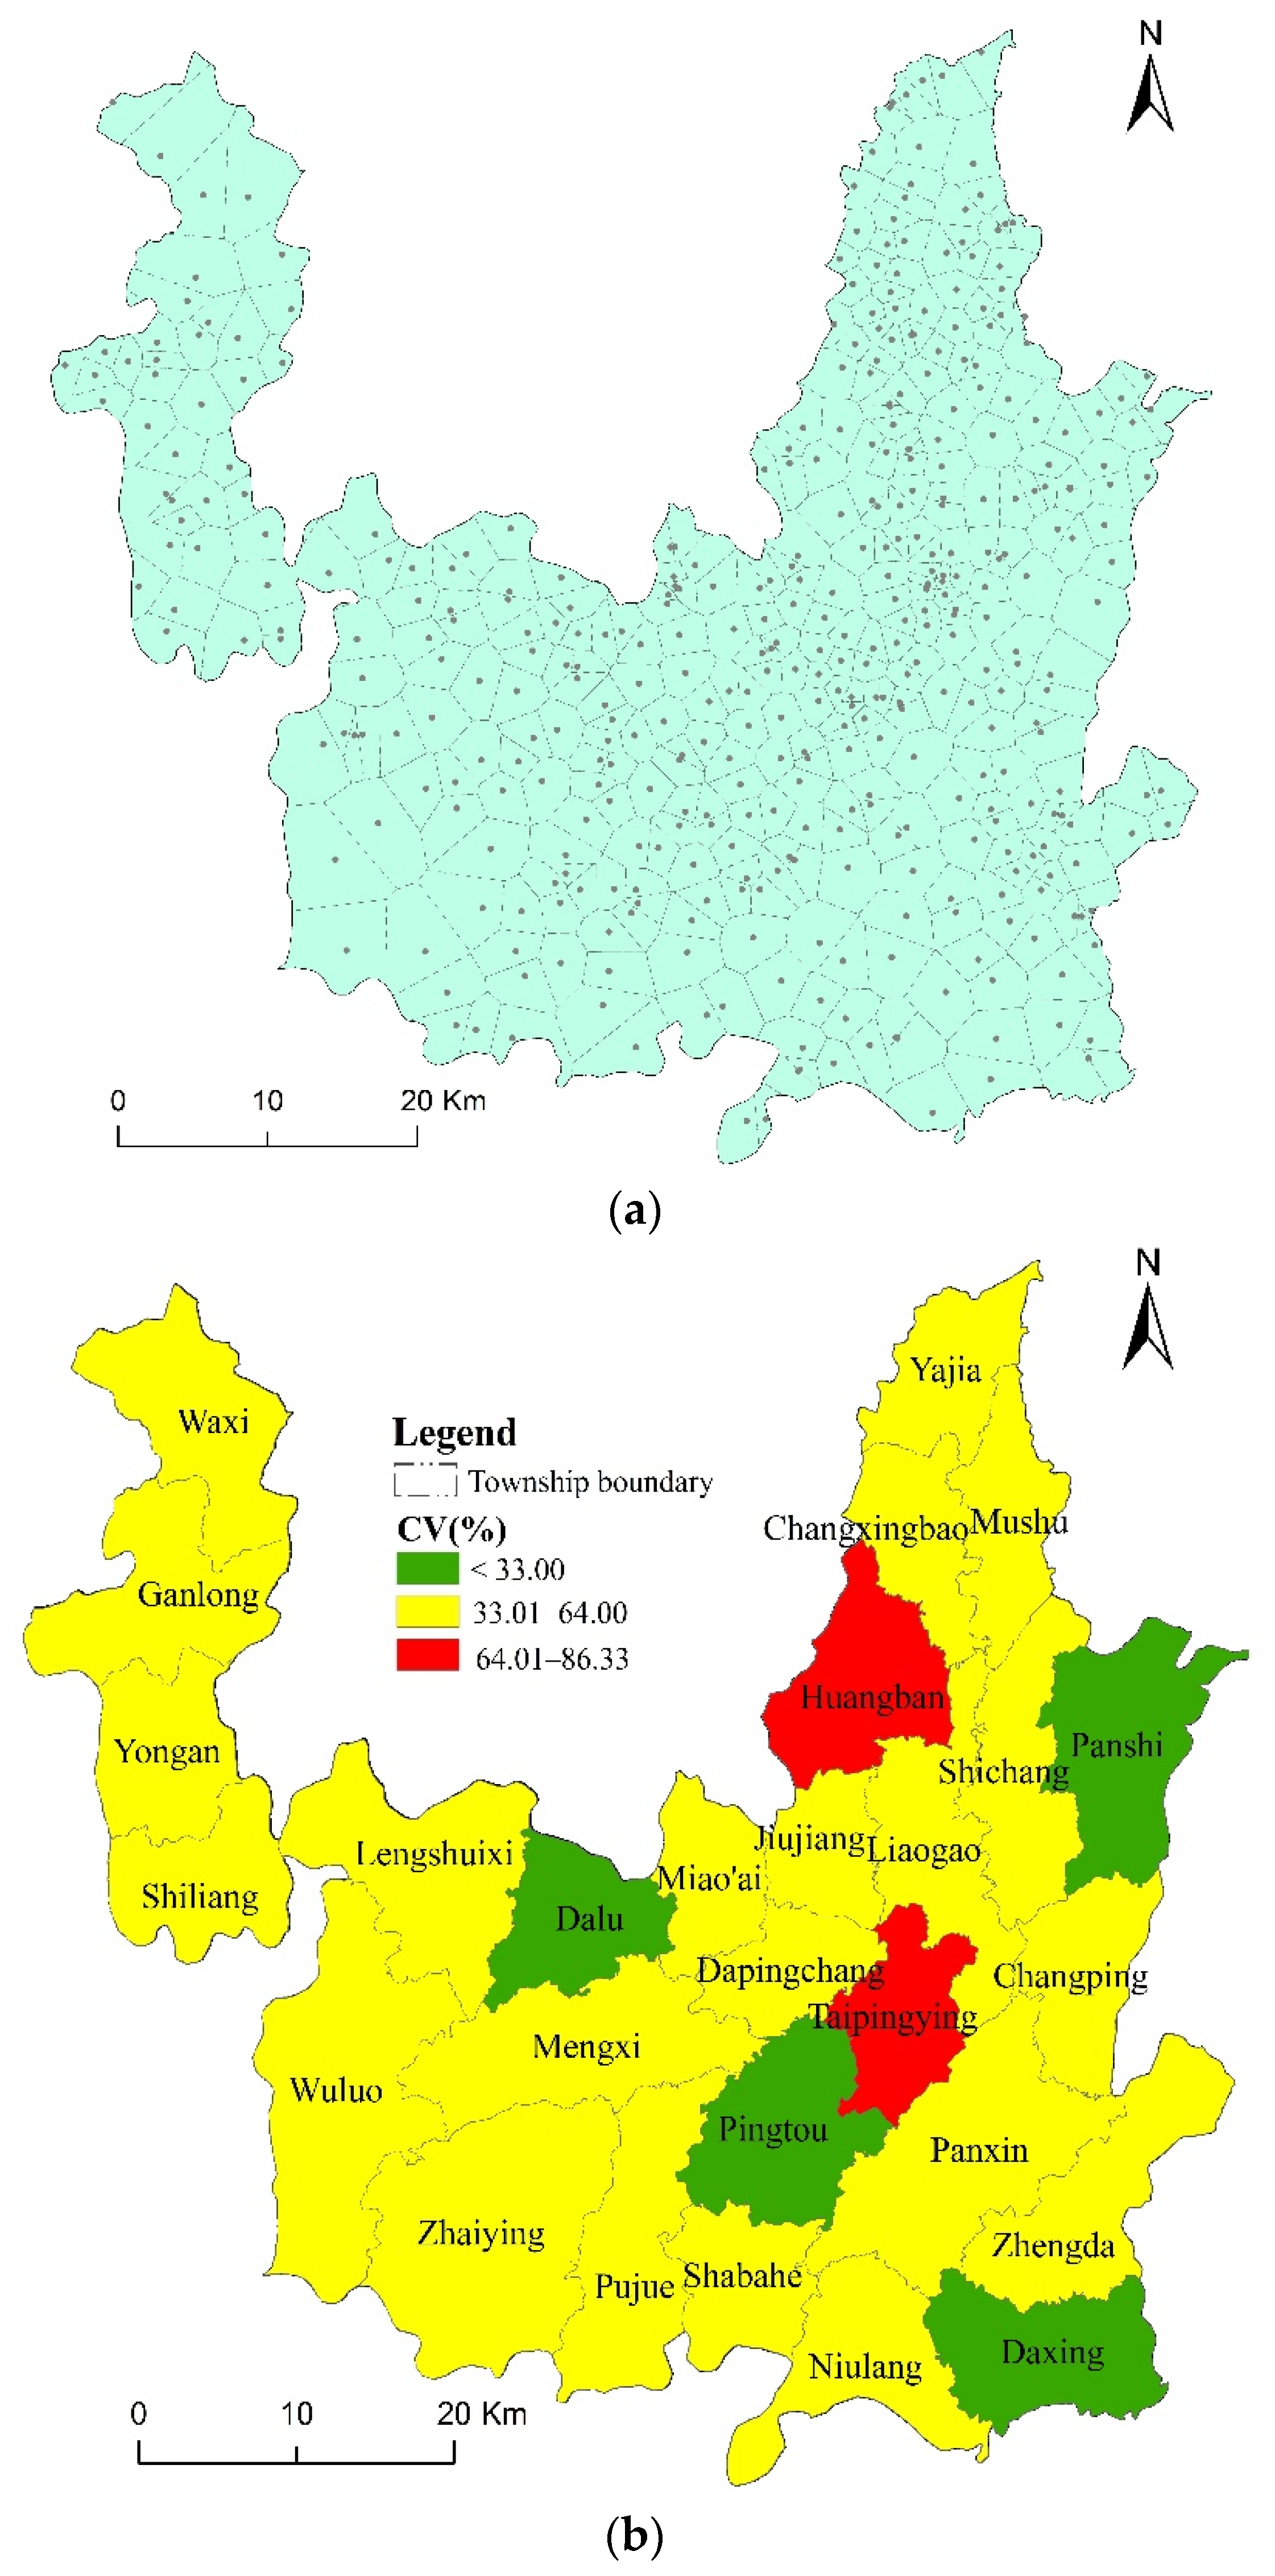
3.3.1. Thiessen Polygon

A Thiessen polygon is a spatial plane division of point sets, and the different distribution of point sets leads to the variation in the area of the constructed Thiessen polygons. The relative variation degree can be measured by calculating the variation coefficient of the Thiessen polygon area. This method is often used as an effective way of measuring the spatial distribution of point sets. A Thiessen polygon is generated by connecting Pi points with multiple discrete points a, b, c, d, and e, and then making vertical bisectors of lines to form a polygon. It is often described as follows:
x x i 2 + y y i 2 1 / 2   <   x x i 2 + y y j 2 1 / 2
where the distance between any point M (x, y) and Pi (xi, yi) of the Thiessen polygon is less than its distance from other discrete points Pj (xj, xj).
The spatial distribution characteristics of rural settlements in the study area were analyzed by calculating the coefficient of variation of the area of Thiessen polygons. The points data of rural settlements in Songtao Miao Autonomous County were obtained through the software ArcGIS. The Thiessen polygons of rural settlements were then generated using the Create Thiessen polygons module, and then the spatial distribution type was determined according to the recommended value of the coefficient of variation in the existing literature [48].
σ = ( S i S ) 2 n
C V = σ S
where σ is the standard deviation of the Thiessen polygon area; Si is the area of the ith Thiessen polygon, i = 1, 2, …, n; S is the average area of the Thiessen polygon; N is the number of Thiessen polygons; and CV is the coefficient of variation.

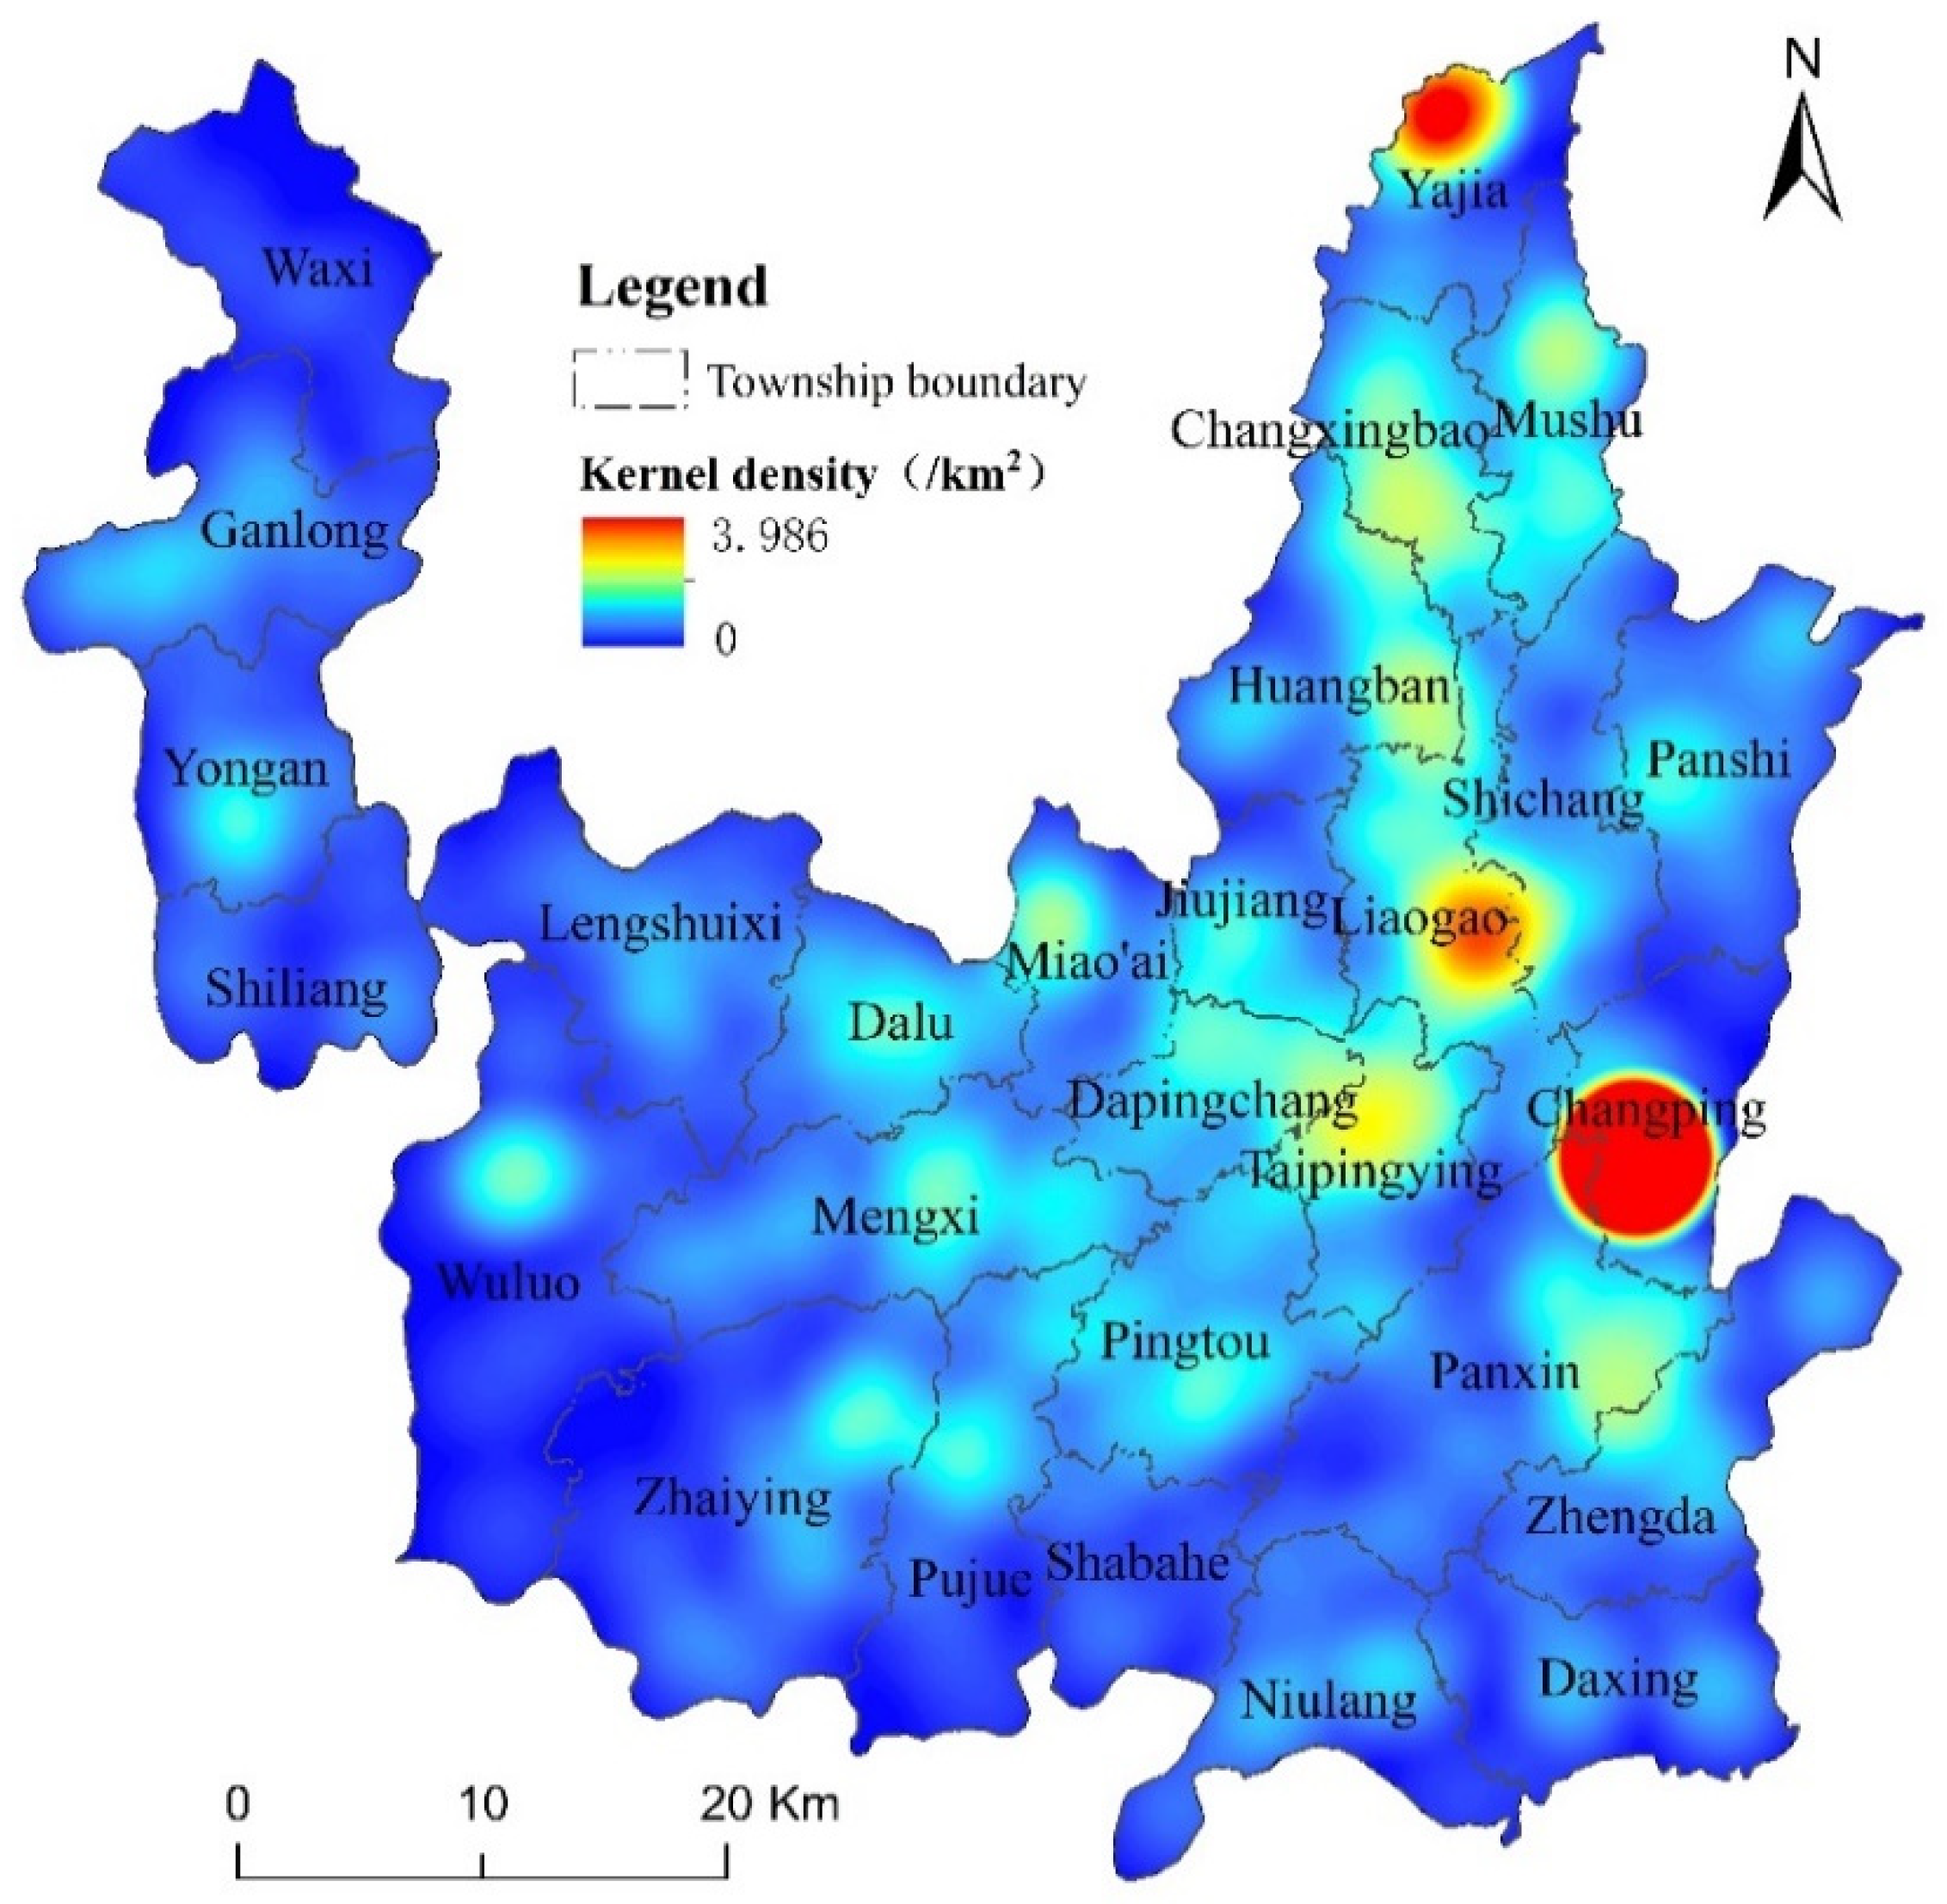
3.3.2. Kernel Density

As a nonparametric estimation method, kernel density analysis can generally reflect the spatial distribution difference of rural residential areas in the study area by obtaining the smooth estimation value of each point of the density function that approximately represents the data distribution. The larger the kernel density value, the denser the distribution of rural settlements. Therefore, the kernel density analysis is often used for feature extraction. We used the kernel density module in ArcGIS software to visualize the current layout characteristics of rural settlements in Songtao Miao Autonomous County. The formula for estimating the kernel density of rural settlements in the study area is:
F n x = 1 n h i = 1 n k x x i h
where Fn(x) is the estimated nuclear density, K is the kernel function, H is the bandwidth (h > 0), and N is the number of points in the bandwidth. xxi is the distance between the estimated points x and xi.

3.3.3. Geodetector

The Geodetector is based on the spatial variance analysis of the influencing factors of the dependent variables. It is believed that if the influencing factors (independent variables) have a decisive effect on the dependent variables, the spatial distribution of the two variables should be similar [49]. It has no linear hypothesis, and the physical meaning is clear. The factor detector quantitatively evaluates the explanatory power of different environmental factors. The interaction detector judges the interaction intensity of environ-mental factors. In this study, the kernel density estimation data of rural settlements in Songtao Miao Autonomous County were used as the dependent variable, and the relevant data of each influencing factor affecting the distribution characteristics of rural settlements were selected. The distribution map layer of each influencing factor was obtained by ArcGIS software. These factors were divided into five categories according to the natural breakpoint method. The results were statistically analyzed by Geodetector, and the differentiation determination index q was introduced. The influence degree of each influencing factor was measured by the q value. The results were used to guide the AHP method to generate the weight value of each factor. The calculation model is as follows:
q X , Y = 1 1 N σ Y 2 h = 1 L N X , h σ X , h 2
where Y is the estimated kernel density, and q X , Y is the influence of environmental factor X on Y; the connotation of q is that independent variable X can explain 100 × q% of dependent variable Y, and the range of q is [0, 1]. The larger the value of q, the more obvious the spatial differentiation of Y is, and the stronger the explanatory power of environmental factor X on Y. L is the stratification number of Y or environmental factors in the study area. Nx,h and N are the number of units in the layer and the whole area, respectively. σ Y 2 and σ X , h 2 are the variances of layer h and study area Y, respectively.

3.3.4. Suitability Evaluation Model Based on Geodetector and AHP Methods

AHP is a multi-objective decision analysis method combining qualitative and quantitative analysis, widely used in suitability evaluation. This method establishes a pair of comparison matrices for a series of indicators. In the process of establishing the matrix, each factor is compared with other factors under the same standard, and a set of weight vectors reflecting the relative importance of each factor is obtained according to the comparison matrix. However, as mentioned above, the AHP method is affected by the size of the selected expert group and the differences in the academic background of the members of the expert group, making the evaluation data subjective and introducing the problem of subjective weight assignment. In addition, the interaction between the influencing factors is not considered. Therefore, we constructed a suitability evaluation model based on Geodetector and AHP to evaluate the suitability of rural settlements. Based on the natural location environmental factors, the suitability evaluation index system of rural settlements was constructed, and the influence factors were reclassified by ArcGIS. Simultaneously, the relative importance and intensity relationship of each index layer in the AHP method were determined based on the factor detection results of Geodetector, so as to replace the subjective scoring of experts. The results were divided and graded by threshold division, and the suitability evaluation results of rural settlements were obtained. The general framework of this study is shown in Figure 2. The calculation formula of the suitability evaluation model based on Geodetector and AHP is:
S c o r e = i = 1 n w i × p i
where Score is the comprehensive evaluation value of the suitability of rural settlements in the evaluation unit, wi is the weight value of factor i, pi is the ith single factor score corresponding to the evaluation unit, and n is the total number of factors.

4. Results

4.1. Spatial Distribution Characteristics of Rural Residential Areas Based on Point Model Spatial Analysis

Based on the data of rural residential areas in the study area, the Thiessen polygon (Figure 3a) was constructed, and the coefficient of variation of polygon area in the Voronoi diagram was calculated. According to the existing classification standard [34], the average coefficient of variation of rural residential areas in the study area is 0.4876, and the spatial distribution is mainly random. The highest coefficient of variation is 0.8633, in Huangban Town, and its spatial distribution type is aggregation type. The lowest coefficient of variation is 0.2629, in Pingtou Town, and its distribution type is random. From the perspective of villages and towns (Figure 3b), there are four villages and towns with coefficients of variation less than 0.33 (the distribution type is random) and two villages and towns with coefficients of variation greater than 0.64 (the distribution type is aggregated), accounting for 14.29% and 7.14% of the total number of villages and towns, respectively. The spatial distribution of coefficients of variation show that there are three types of spatial distribution of rural settlements in the study area, namely aggregation type, random type, and uniform type, and there is random type in the west.
After many experiments, it was established that when the search radius is 4 km, the results of kernel density analysis can better express the spatial distribution of rural residential areas in the study area (Figure 4). The spatial distribution difference of nuclear density in rural settlements in the study area is obvious. There are many nuclear centers, and the nuclear density decreases from the core to the outside, with a maximum value of 3.99/km2 in Changping Township. High-value areas are concentrated in the northeast of the study area, and the spatial distribution of rural settlements in the west and south is sparse, consistent with the geomorphological distribution characteristics of the study area. These characteristics are complex terrain, hilly middle and low mountains in the east, hilly valleys in the middle, low mountains and valleys in the north and south, and the mid-mountain gorge area in the west. From the perspective of villages and towns, rural settlements in Changping Township are relatively dense, with an average nuclear density of 0.84/km2, while rural settlements in Waxi Township are sparsely distributed, with an average kernel density of only 0.04/km2. Based on the proportion of the area under its jurisdiction, Zhaiying Town has the largest area, but the rural settlements are sparsely distributed, with an average kernel density of 0.10/km2, while Dapingchang Town, with a small area, has an average kernel density of 0.25/km2, indicating that the spatial distribution of rural settlements in the study area is different, and the spatial distribution has a significant relationship with topography.

4.2. Spatial Distribution Characteristics of Rural Residential Areas in the Study Area Based on Environmental Factors

Combined with the topography and geomorphology of the study area, the elevation and slope factors of the study area are reclassified based on ArcGIS. At the same time, considering the influence of environmental factors such as rivers, roads, and township government seats on the distribution of rural settlements, the neighborhood analysis method is used to perform buffer analysis on the above influencing factors (Table 1). On this basis, the results of reclassification and buffer analysis are converted into raster layers and superimposed with rural settlements layers to obtain the spatial distribution of rural settlements at different classification levels of environmental factors.
The distance from the river directly affects the production and life of rural residential areas. The buffer analysis of the river shows that the number of rural residential areas within 6 km of the river accounts for 91.98% of the total, among which those less than 2 km and 4–6 km from the river account for 43.32% and 35.69% of the total, respectively (Figure 5), while those 2–4 km from the river account for 12.98% of the total number of rural residential areas. This is mainly due to the mountainous and steep topography of the study area. The location of rural settlements should not only consider the demand for domestic water, but also meet the demand for cultivated land for production. Therefore, the distribution of rural residential areas is more affected by topographic factors such as elevation and slope. As Figure 5 shows, rural settlements are mainly distributed in areas less than 800 m above sea level, accounting for more than 88% of the total number of rural settlements, of which 50.95% are located at 500–800 m. The number of rural residential areas more than 800 m above sea level drops sharply, and this trend decreases with the increase in sea level. Only Liaomu Village in Yong’an Township in the west is more than 1200 m above sea level. Of the total number of rural settlements, 74.81% are distributed in areas with a slope below 15, and 40.27% of the total number are rural settlements with a slope of 6–15. The rural residential areas with a slope above 25 accounted for 13.74% of the total, and only Banpotai Village in Wuluo Town in the west of the study area had a slope above 35.
Considering the spatial distribution of rural residential areas in the study area in terms of natural environmental factors, Figure 5 shows that the proportion of rural residential areas distributed in areas with a slope below 15 and an altitude below 800 m is 66.22%, among which the proportion of rural residential areas with a slope below 6 and an altitude below 800 m reaches 31.31%. The number of areas with a slope of less than 15 and an altitude of less than 800 m and 4 km and 6 km away from the river accounted for 54.21% and 62.23%, respectively, among which the number of areas with a slope of less than 6 and an altitude of less than 800 m and 4 km and 6 km away from the river accounted for 27.11% and 29.59%, respectively. Distance from the river, slope, and altitude directly restrict the quality of agricultural production and living space, and affect the spatial distribution of rural residential areas in the study area.
The accessibility of transportation and the distance from villages and towns will affect residents’ choice of various livelihood methods, such as agricultural production, product trading, and transportation, which are related to the location of rural settlements. The distribution of rural settlements in the study area decreases with the increase in distance from roads, and the rural settlements within 2 km and 4 km from roads account for 79.58% and 92.56% of the total number, respectively (Figure 6). This is related to the significant improvement of traffic infrastructure in Songtao Miao Autonomous County in recent years, and to developments such as the Hangrui Expressway, Songtong Expressway, Laida Secondary Highway, Songtao-Yinjiang Secondary Highway, and S201 Line. The distribution of rural residential areas is mainly concentrated in the areas within 5 km of the town center, accounting for 75.76% of the total, and the proportion within 2 km from the road is 34.73%. Areas that are 5–7 km and 7–9 km from the town center account for 5.73% and 17.37%, respectively. The former is smaller than the latter, mainly because the distribution is affected by the topography of the study area.
As Figure 6 shows, the spatial distribution of rural residential areas in terms of location environmental factors is mainly concentrated in areas within 4 km from roads and within 7 km from town centers, accounting for 87.22%, among which those within 2 km from roads and within 5 km from towns account for 74.05%, indicating that the accessibility of traffic and the radiation function of towns can provide convenience for residents’ production and life, and the distance from roads and town centers has an important influence on the distribution of rural residential areas.

4.3. Analysis of Influencing Factors of Spatial Distribution of Rural Residential Areas Based on Geographic Detectors

The spatial distribution of rural residential areas in the study area is the result of the combined influence of many factors. In this paper, the spatial correlation between the spatial distribution of rural residential areas and driving factors is detected by Geodetector, and the calculated nuclear density value is selected to represent the spatial distribution of rural residential areas in the study area and used as the analysis variable (Y) of Geodetector. At the same time, as Table 1 shows, the driving factors such as elevation (X1), slope (X2), distance from rivers (X3), roads (X4), and villages and towns (X5) are divided into zones, and then imported into the Geodetector for calculation.
The influence of the change in the driving force of the above five factors on the nuclear density of rural residential areas was detected by Geodetector, and the factors were divided into two categories according to the explanatory power q of each influencing factor: the dominant driving force (q ≥ 0.2) and the important driving force (q < 0.2). The single factor detection results show that the Q values of all driving factors are significant, and the explanatory power is as follows: slope > distance from river > distance from town > elevation > distance from road. The Q values of slope and distance from the river are 0.87 and 0.024, respectively, making them the leading driving forces for the spatial differentiation of rural residential areas in the study area (Figure 7), while other factors are important driving forces. The distance from the road has the weakest explanatory power, which also reflects the achievements of Songtao Miao Autonomous County in recent years in increasing the construction of the transportation network, addressing shortfalls of transportation facilities, building an external connection and an internal connection, connecting villages and townships, and fast-tracking the provision of buses to village groups to consolidate poverty alleviation.
The two-factor interaction detection can detect whether the explanatory strength of nuclear density value increases or decreases under the interaction of different factors. Figure 7 shows that the explanatory power of the interaction of any two driving factors on the kernel density value is significantly stronger than that of a single driving factor, that is, the explanatory power of the two-factor linear or nonlinear enhancement trend. The explanatory power of the interaction between slope and distance from rivers is the strongest (q = 0.9348), followed by that of the interaction between slope and distance from towns, slope and distance from roads, and elevation and slope. However, the explanatory power is over 0.9, indicating that slope plays an important role in the spatial differentiation of rural settlements, and the explanatory power of the interaction between elevation and distance from road is the lowest. However, it also reaches 0.2233, indicating that the distribution of rural residential areas in the study area is the result of the joint action of natural factors and location factors.

4.4. Evaluation of Suitability of Rural Residential Areas Based on AHP

Based on the natural environmental factors and location environmental factors, this paper analyzes the suitability of rural residential areas, and takes these two aspects as the criterion layer. Each criterion index corresponds to the above-mentioned related different driving factors to construct the AHP framework. According to the suitability grading standard, the framework is divided into five categories: highly suitable, suitable, relatively suitable, basically suitable, and unsuitable(Table 2). According to the above analysis results, the existing different environmental factors are reclassified and the buffer level (Table 1) is reclassified to realize the quantification of the suitability evaluation factors of rural residential areas. ArcGIS is used to reclassify the evaluation factors based on the single-factor detection results of Geodetector rather than the subjective scores of experts. On this basis, the weight and ranking of each factor index to the suitability of rural residential areas are calculated(Table 3).
Based on the calculated factor index weights and the regrading results of different environmental factors, the suitability evaluation results of rural residential areas in the study area were obtained by ArcGIS spatial superposition analysis and grid calculation. Figure 8 shows that in recent years, Songtao Miao Autonomous County has focused on investment in transportation infrastructure and made efforts to improve the production and living conditions of rural residents, greatly improving the suitability of rural settlements, with 87.40% of rural residential areas deemed suitable and relatively suitable for living(Table 4). Among them, the rural residential areas classified as suitable for living account for 64.5%, mainly concentrated in the hilly areas, valleys, and dam areas in the middle and east of the study area, distributed in two strips from north to south. Among them, the rural residential areas suitable for living in Dalu Town, Lujia Town, Dapingchang Town, and Mushu Town all account for more than 95% of the total number of rural settlements in each town, further indicating that slope and altitude have a significant influence on the location of rural residential areas in the study area. Relatively suitable rural residential areas account for 23%, mainly scattered around the livable rural residential areas, with Panshi Town, Wuluo Town, and Changxingbao Town accounting for a relatively high proportion. Basically suitable rural residential areas account for 12.40%, and the distribution in the study area is more scattered, with Shabahe Township, Niulang Town, Wuluo Town, and other towns accounting for a relatively high proportion. Among the 15 km rural settlements, one rural settlement that is not suitable for living is Banpotai Village, Wuluo Town, in the western part of the study area. This settlement is located deep in the mountains, with poor natural conditions and inconvenient transportation. In 2014, it was identified as a deep poverty-stricken village. By the end of 2019, half of the population in the village had moved out of the mountains through the ex situ poverty alleviation and relocation policy.

5. Discussion

In the existing research on rural settlements’ suitability evaluation, AHP or TOPSIS are the most common methods used to determine index weights. For example, Liu et al. [50], E. and J. [51], and H. et al. [52] used TOPSIS methods to evaluate the suitability of rural settlements. Based on the ecological security pattern, Yin et al. [53], Cui et al. [54], and Yu et al. [55] selected resistance factors such as vegetation coverage and water area, calculated the weight of each resistance factor by the AHP method, and optimized the layout of rural settlements. Liu et al. [56] established an evaluation index system of rural settlements’ suitability based on the accessibility of production and requirements for everyday life, and Tian et al. [57] used AHP to determine the weights of accessibility indexes of production and life. However, the influence of environmental factors on the spatial distribution of rural settlements is nonlinear and interactive. The TOPSIS and AHP methods are both based on linearity, and the interaction between factors is not considered. Geodetector has no linear hypothesis, and its physical meaning is clear. It can not only quantitatively evaluate the explanatory power of different environmental factors but also judge the interaction strength of environmental factors. Based on the Geodetector used to detect the spatial distribution characteristics of rural settlements and the relationship between them and various environmental factors, this paper considers the interaction and synergy among various factors. Compared with the traditional linear research method, the results are more reliable. In addition, the AHP method requires the experience of researchers or experts to determine the index weight assignment, potentially causing the deviation of rural settlements’ suitability evaluation results [58]. In this paper, GIS is used to reclassify the results of different environmental factors and buffer levels, and to replace the subjective scoring of experts in AHP based on the detection results of Geodetector. Qualitative and quantitative methods are combined to determine the index weight into a quantitative index weight, which makes up for the deficiency of the AHP evaluation model, makes the suitability evaluation results more scientific, and provides a new perspective for rural settlement suitability research.
Building beautiful livable villages and creating a high-quality living environment is an important part of rural revitalization and an important basis for and guarantee of im-proving the quality of life of rural residents. Chomać-Pierzecka et al. [59] considered that one of the government’s tasks is to focus on ecological sustainability and effectively man-age local resources. Grzegorz and Paweł [60] pointed out that ecological sustainability is a belief that governments must use resources wisely and effectively to influence the current quality of life and healthy environment, providing residents with a sense of stability. The suitability of rural settlements is the proper meaning of beautiful livable village construction. The state of sustainable development of rural settlements is that the natural environment and resource system on which the sustainable development of rural settlements depends are not threatened, the conditions for the development of agricultural production are improved, and the transport facilities and public infrastructure are optimized. The relative balance is affected by the resources and conditions for the sustainable development of agricultural production in the rural settlements, the population size on which the public infrastructure of the rural residential area is optimized, and the traffic and location of rural settlements’ external connection degree. Grzegorz and Paweł [60] found that the evaluation results may change when different datasets are used, and the selection of feature indicators is important, as it largely determines the accuracy of evaluation and analysis and the accuracy of decisions based on the results. The results of this study can provide some reference for the planning and reconstruction of rural settlements in karst mountainous areas, but there are many factors involved in the suitability evaluation of rural settlements in mountainous areas, and there is still room for further improvement and expansion in this study. For example, the selection of influencing factors is not sufficiently comprehensive. Only a few representative natural factors and social factors are selected, which are subjective to some extent, and the influence of natural factors, such as the threat of geological disasters, and social factors, such as economy, population, and policy, on the distribution of rural settlements in the study area is not considered. In future, the refinement and dynamics of indicators should be improved to ensure the scientificity, rationality, and operability of the optimal layout scheme of rural settlements. A future research direction could be an investigation of how to construct a more comprehensive system of influencing factors to reveal the evolution and formation mechanism of rural settlements in the study area.
The implementation of the layout of rural residential areas calls for a scientific approach. First, we should make detailed and scientific planning adjustments for suitable rural settlements, develop an appropriate centralized merger for more suitable rural settlements, keep and improve the layout for basically suitable rural settlements, and relocate and merge unsuitable rural settlements. Second, we should carry out a pilot project, devise the layout for the unsuitable areas, and advance gradually. We should scientifically and rationally plan the spatial layout and construction of facilities for rural production and life, promoting the integration of urban and rural public services, gradually narrowing the gap between urban and rural areas, and realizing the integrated development of urban and rural areas. Combined with the results of suitability evaluation, in the process of new urbanization development in the future, we should focus on the central, northeastern, and southeastern areas, prioritizing the southeastern hilly areas as a key area of new urbanization. When considering a series of problems, such as small dynamic changes on a rural residential area scale and low road accessibility in the western trough valley area, the government should take into account the fragile ecological environment of the region while scientifically planning the infrastructure. It should combine the spatial difference characteristics of population distribution to improve the construction and development of rural settlements in the study area according to local conditions, actively promoting the implementation of rural tourism poverty alleviation policy.

6. Conclusions

Taking Songtao Miao Autonomous County as the research area, the distribution of rural residential areas in karst mountainous areas was studied by using point model spatial analysis and spatial neighborhood analysis. The natural and location environmental factors affecting the spatial distribution of rural settlements were detected by using geographic detectors. The suitability of rural residential areas was evaluated by Geodetector and AHP methods. From the results, we can draw the following conclusions:
(1)
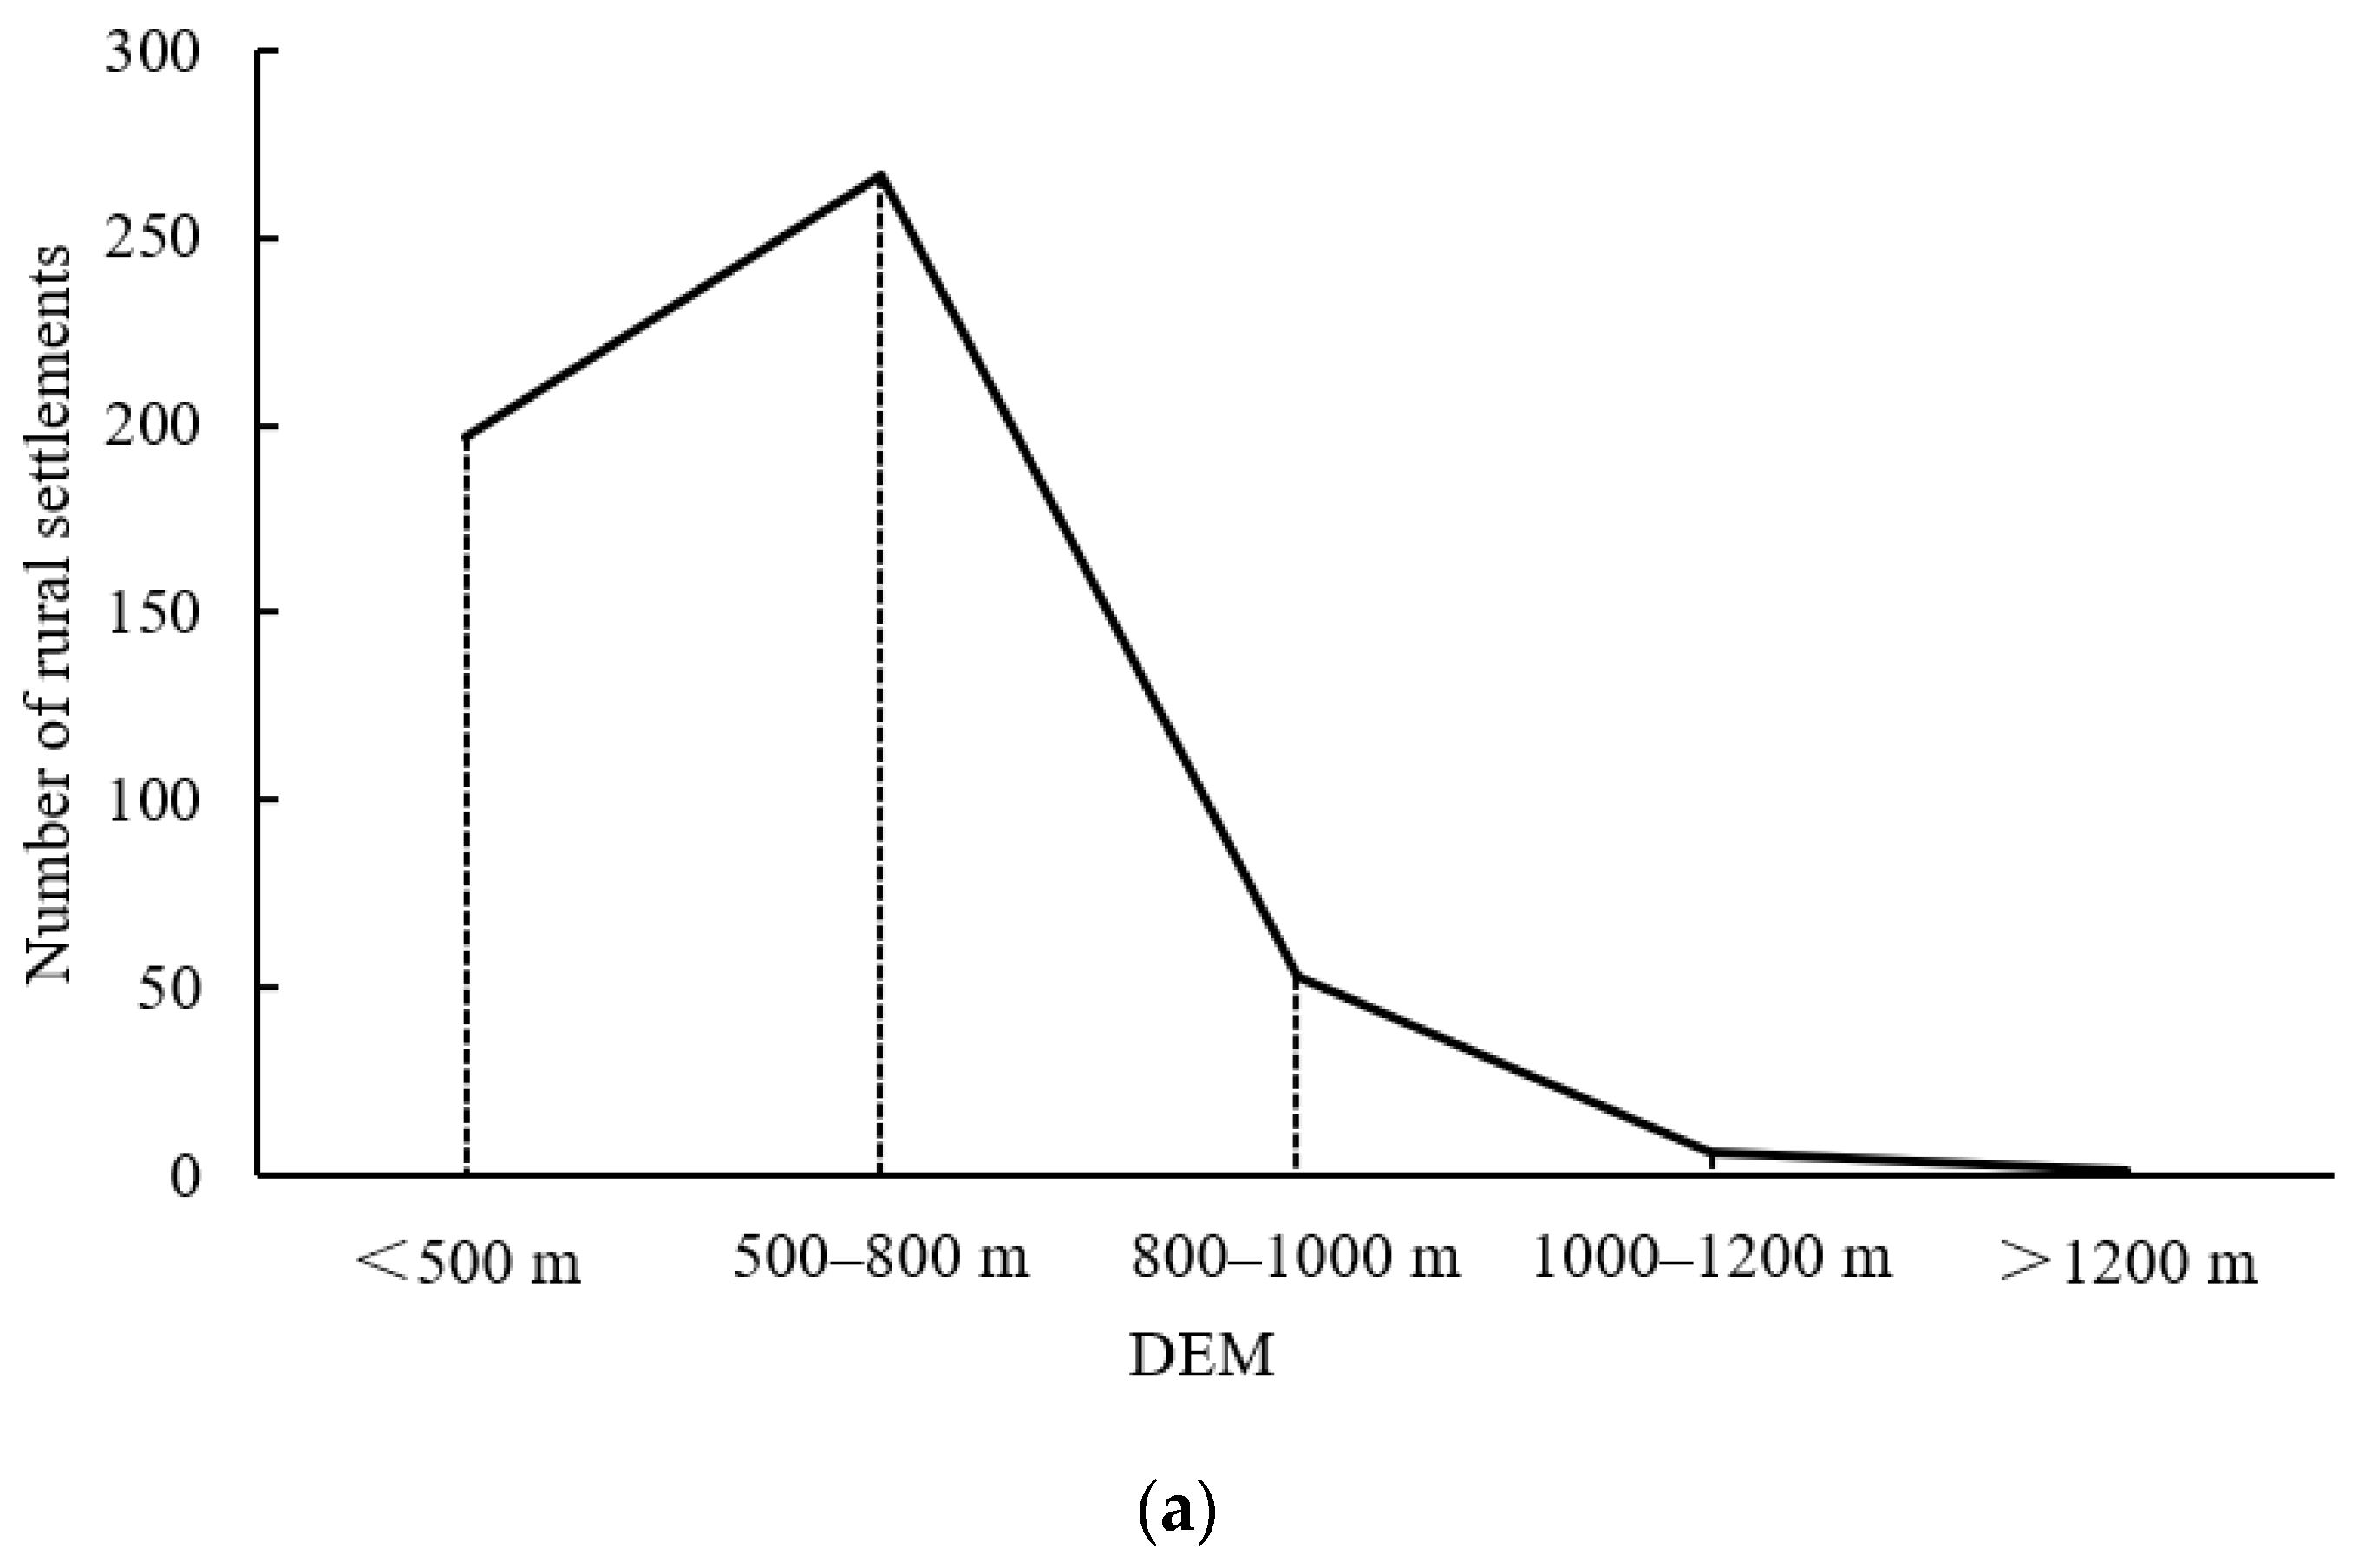
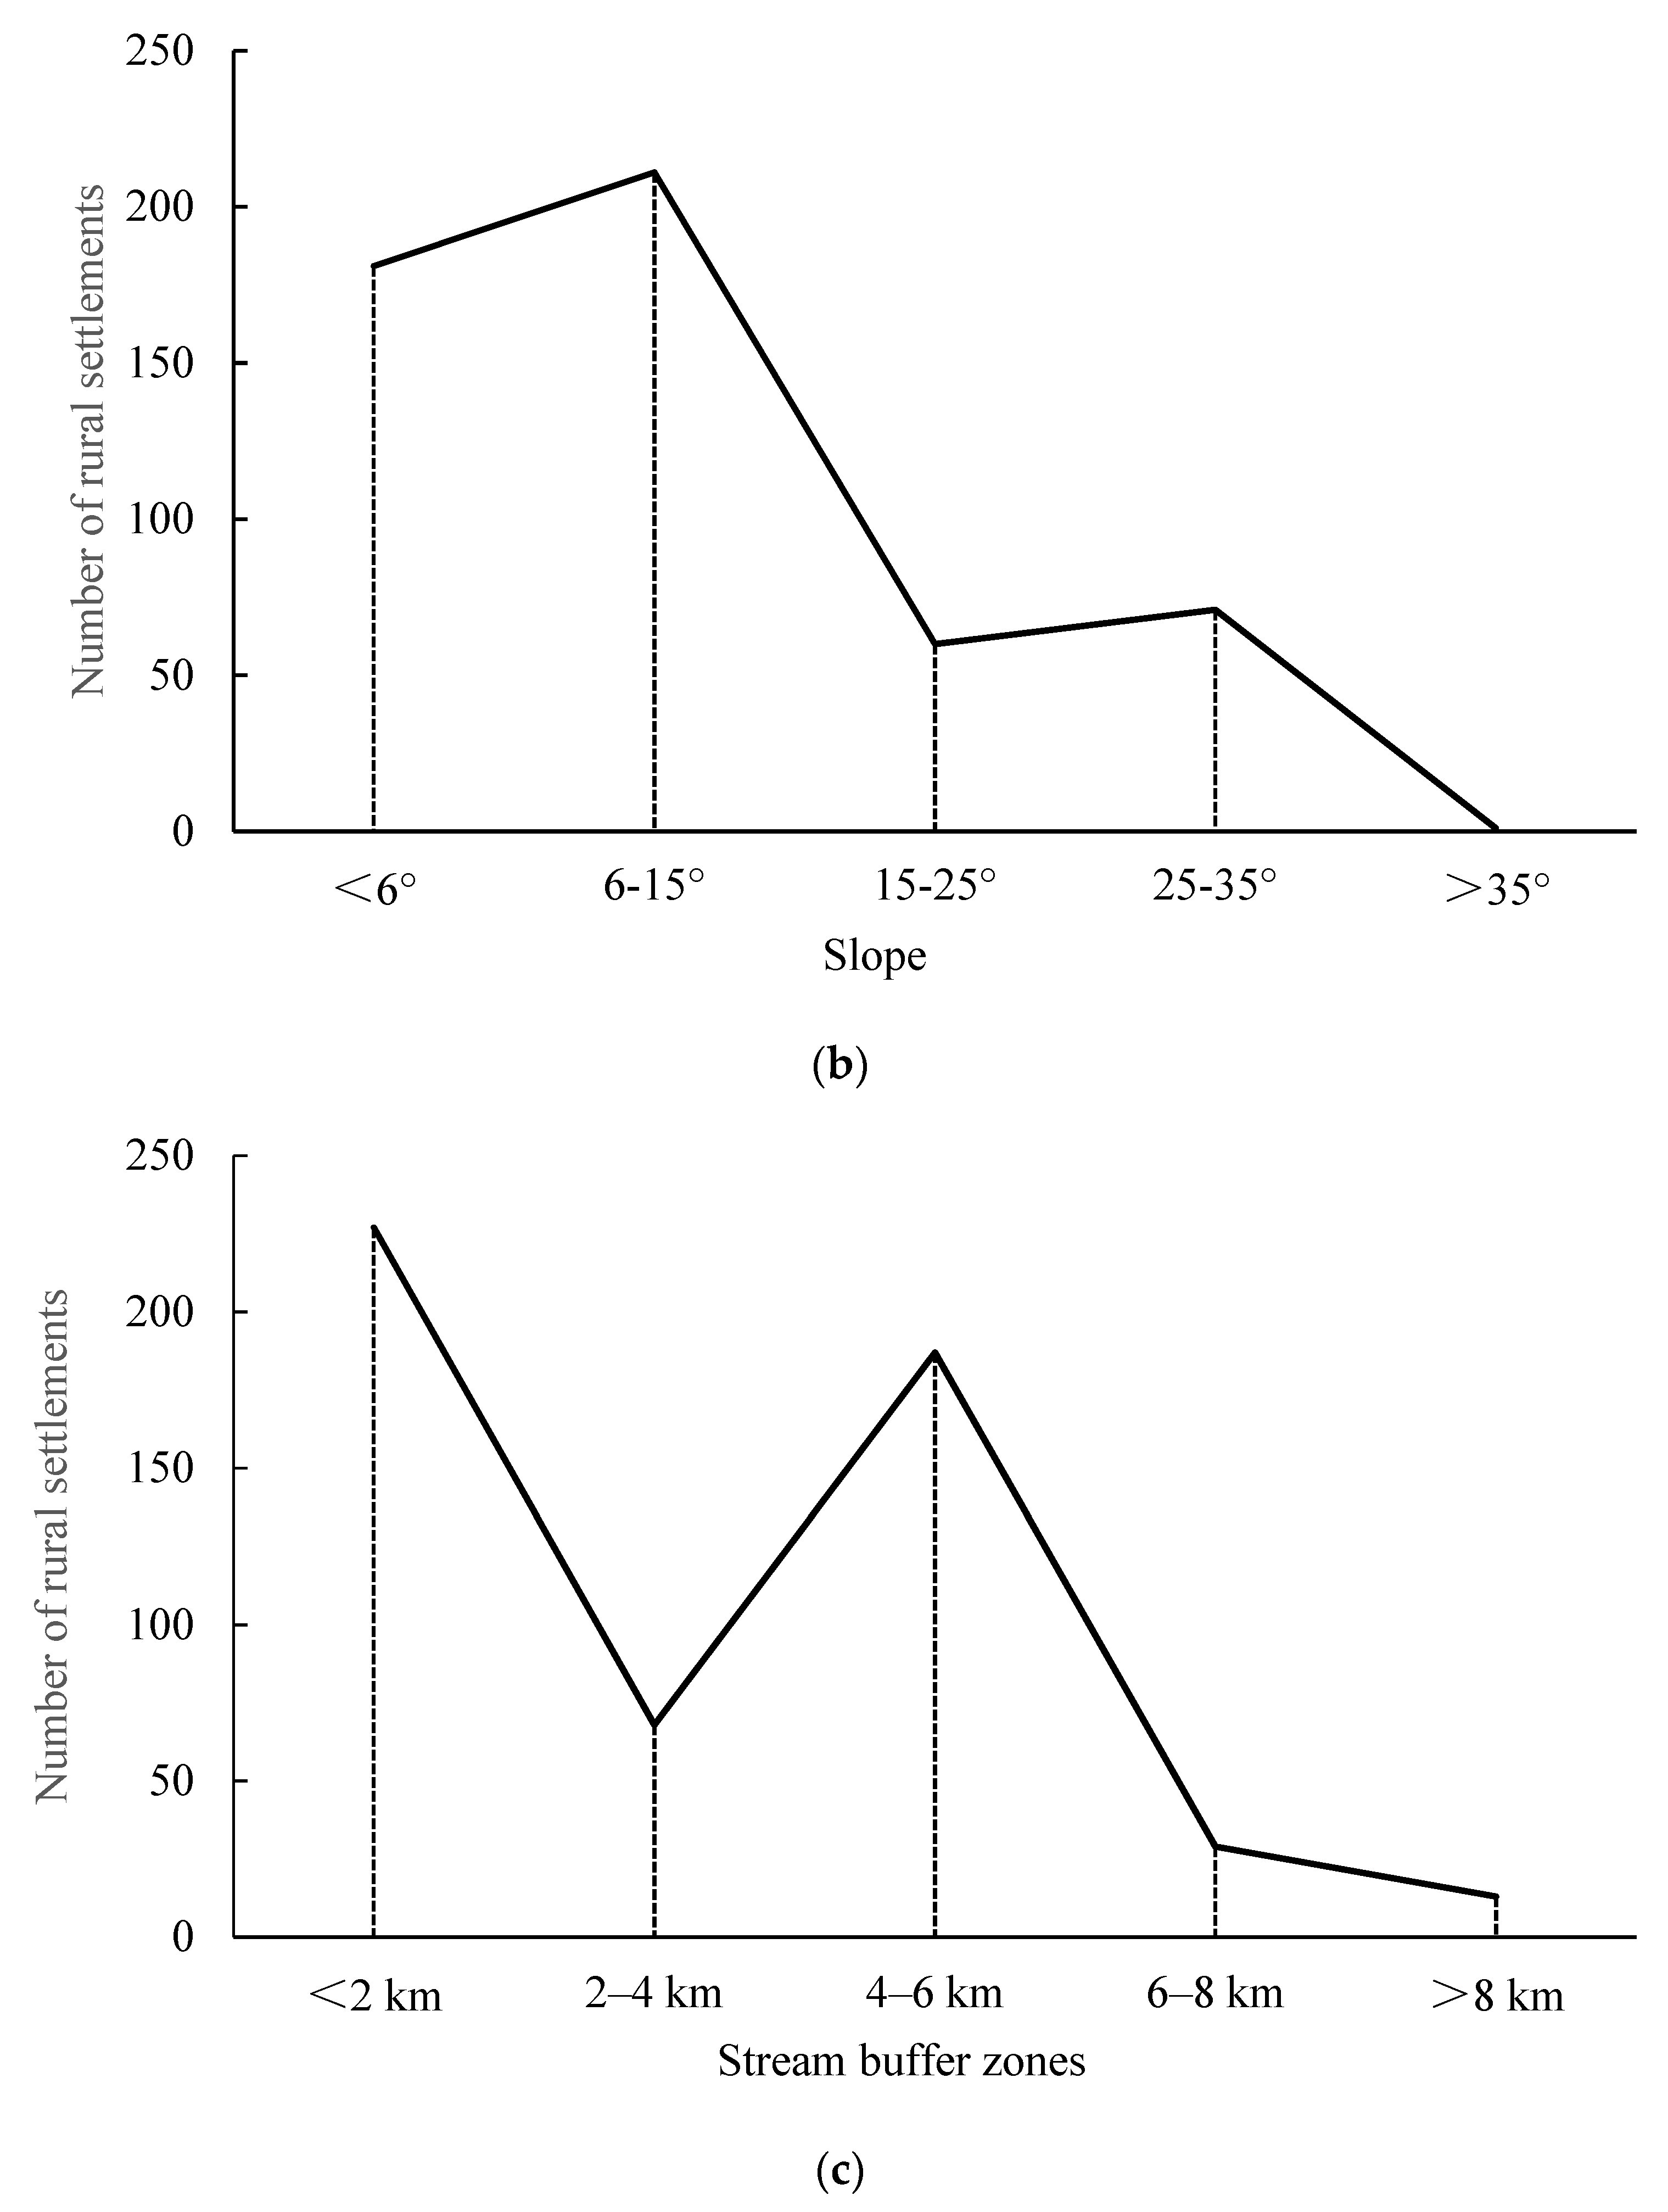
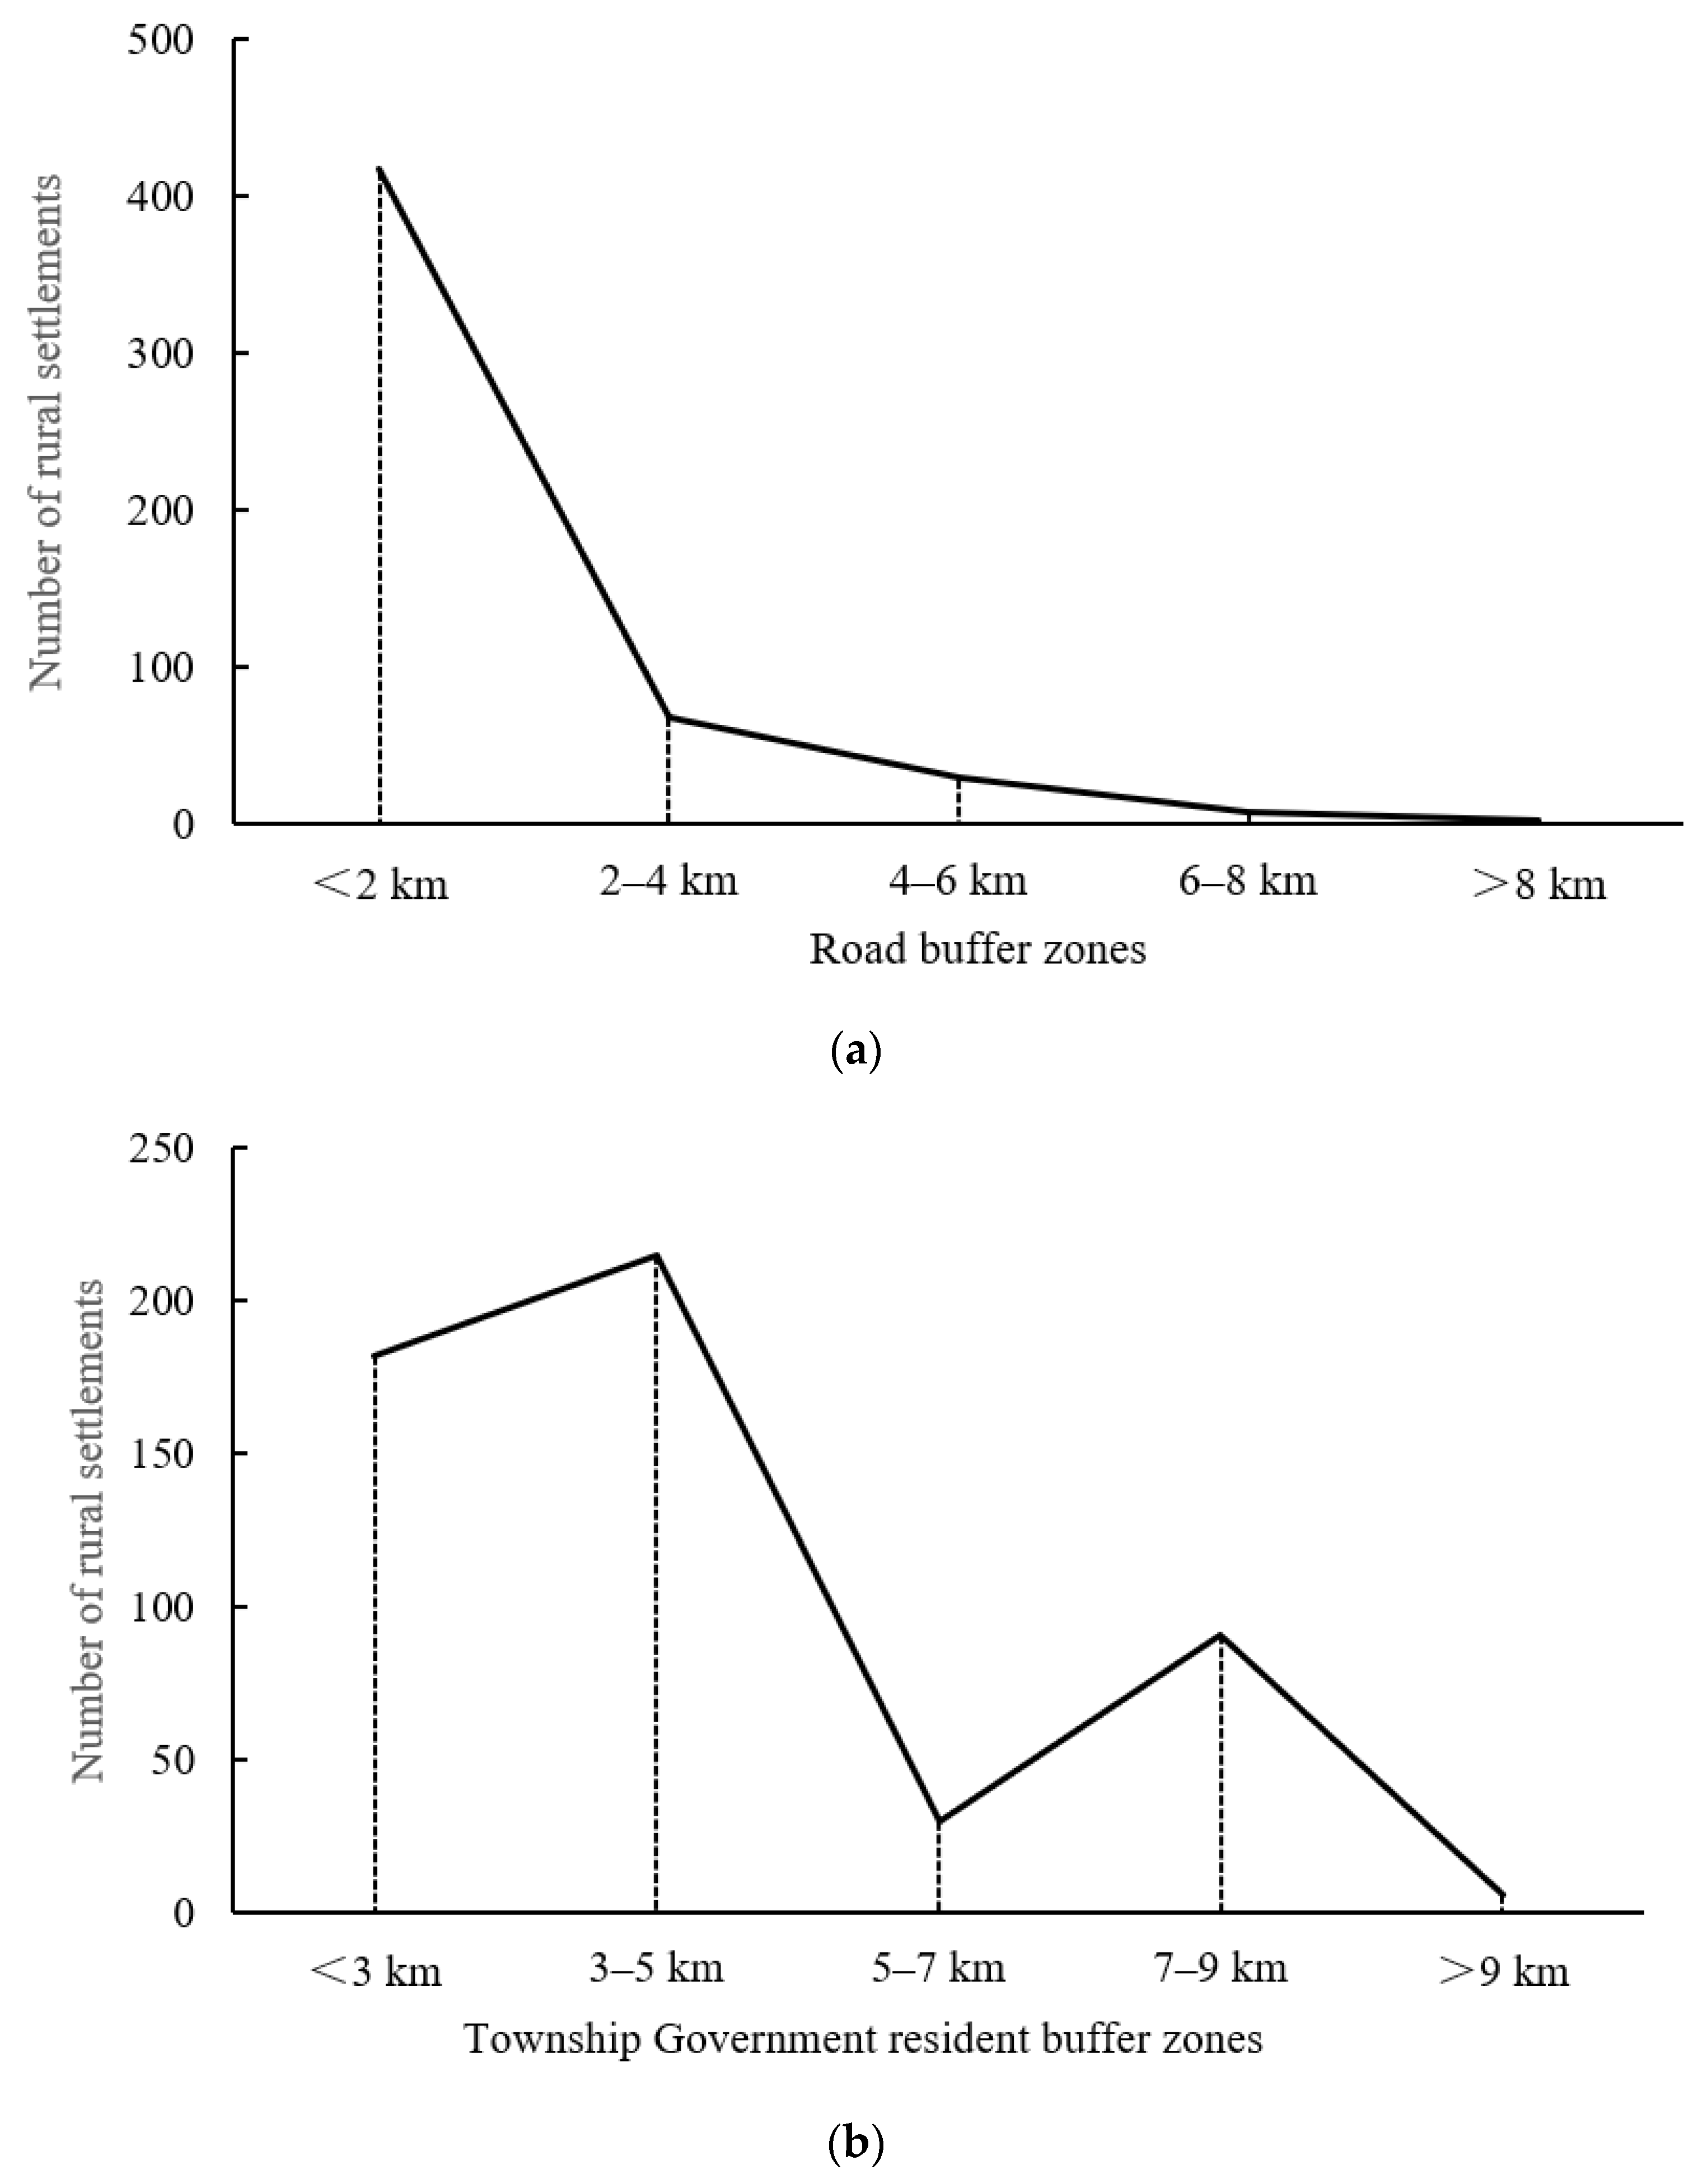
The spatial distribution of rural settlements in the study area is mainly random, and there are three distribution patterns in the central and eastern regions, namely aggregation, random, and uniform, while the western region is mainly random. The spatial distribution of rural settlement density shows a trend of multiple core centers, decreasing from the core to the outside. There are obvious differences in the spatial distribution of rural settlements. The high-value areas are concentrated in the middle and northeast parts, and the spatial distribution of rural settlements in the west and south is sparse. Changping Township is the most dense, and Waxi Township is the most sparse. Zhaiying Town, with the largest area, is sparse; Dapingchang Town, with a smaller area, is relatively dense.
(2)
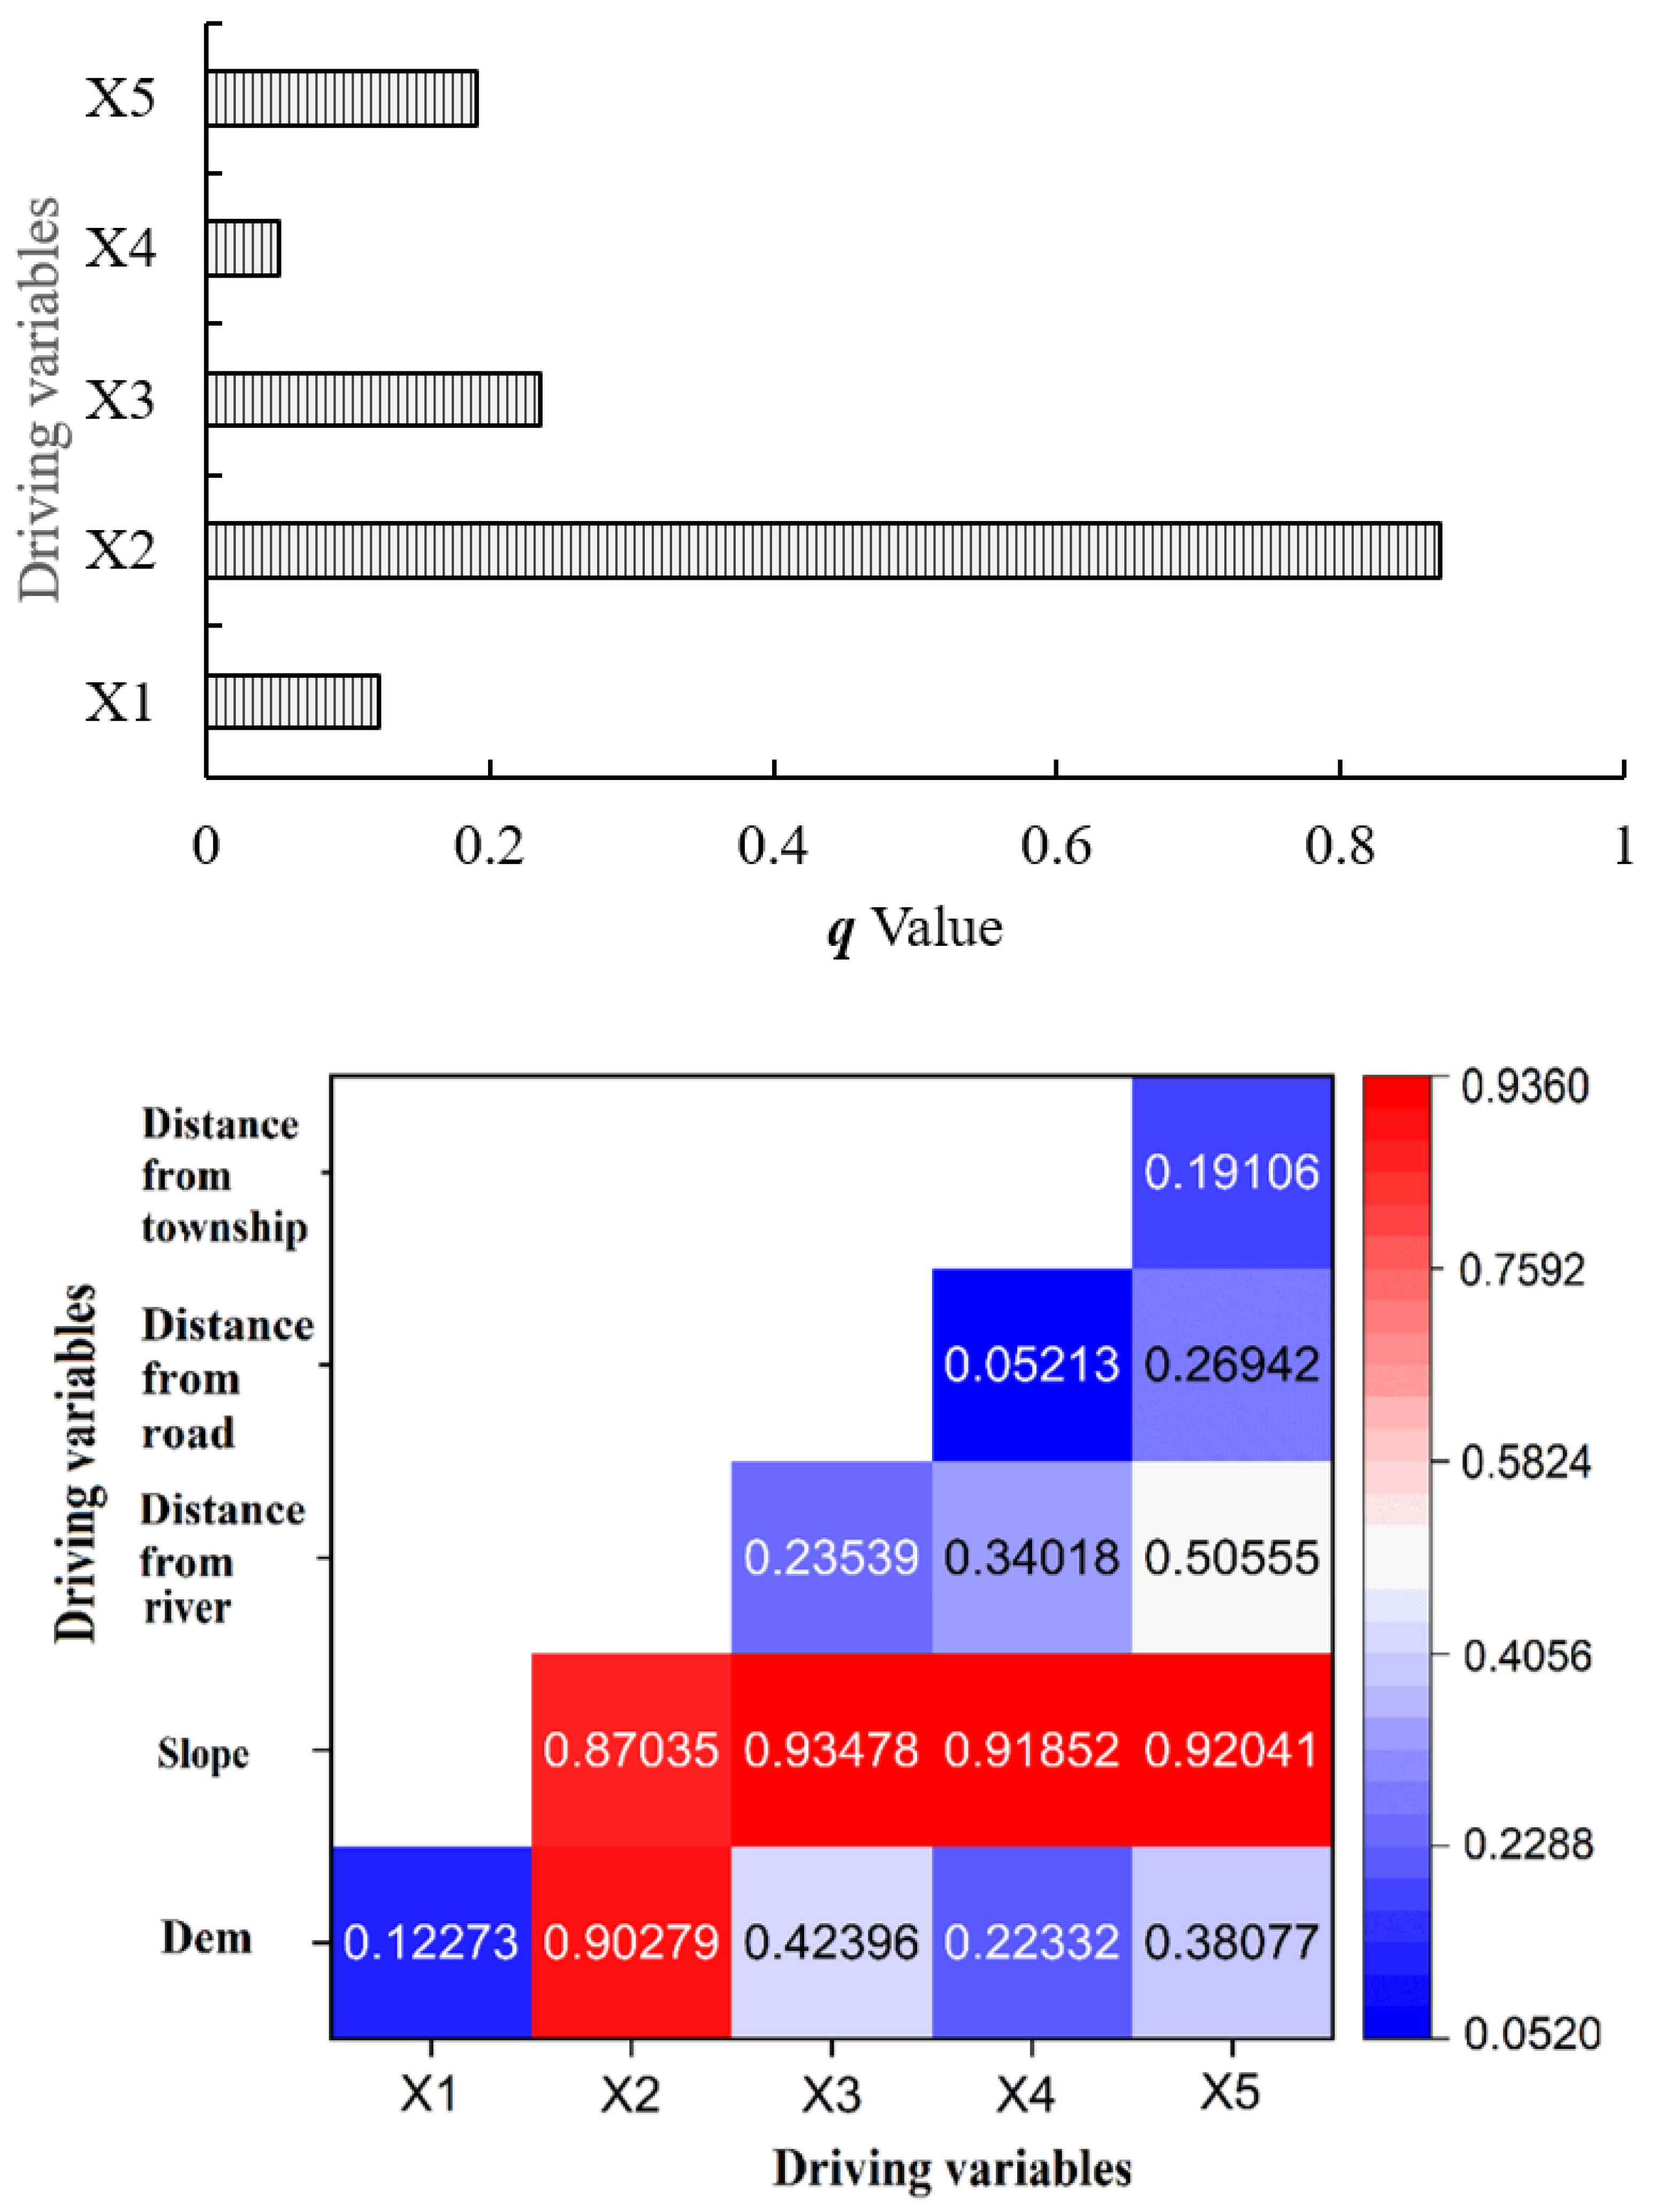
The distribution of rural settlements in the study area is mainly concentrated in areas with a slope below 15, an altitude below 800 m, and within 6 km from rivers, as well as areas within 4 km from roads and 7 km from township centers. Slope and distance from the river are the main driving forces for the spatial differentiation of rural residential areas. The spatial distribution of rural residential areas is affected by the comprehensive effects of natural and location environmental factors, and the interaction of any two driving factors is stronger than that of a single factor. The interaction of slope and distance from the river is the strongest explanatory power, followed by the interaction of slope and distance from towns, slope and road, and elevation and slope.
(3)
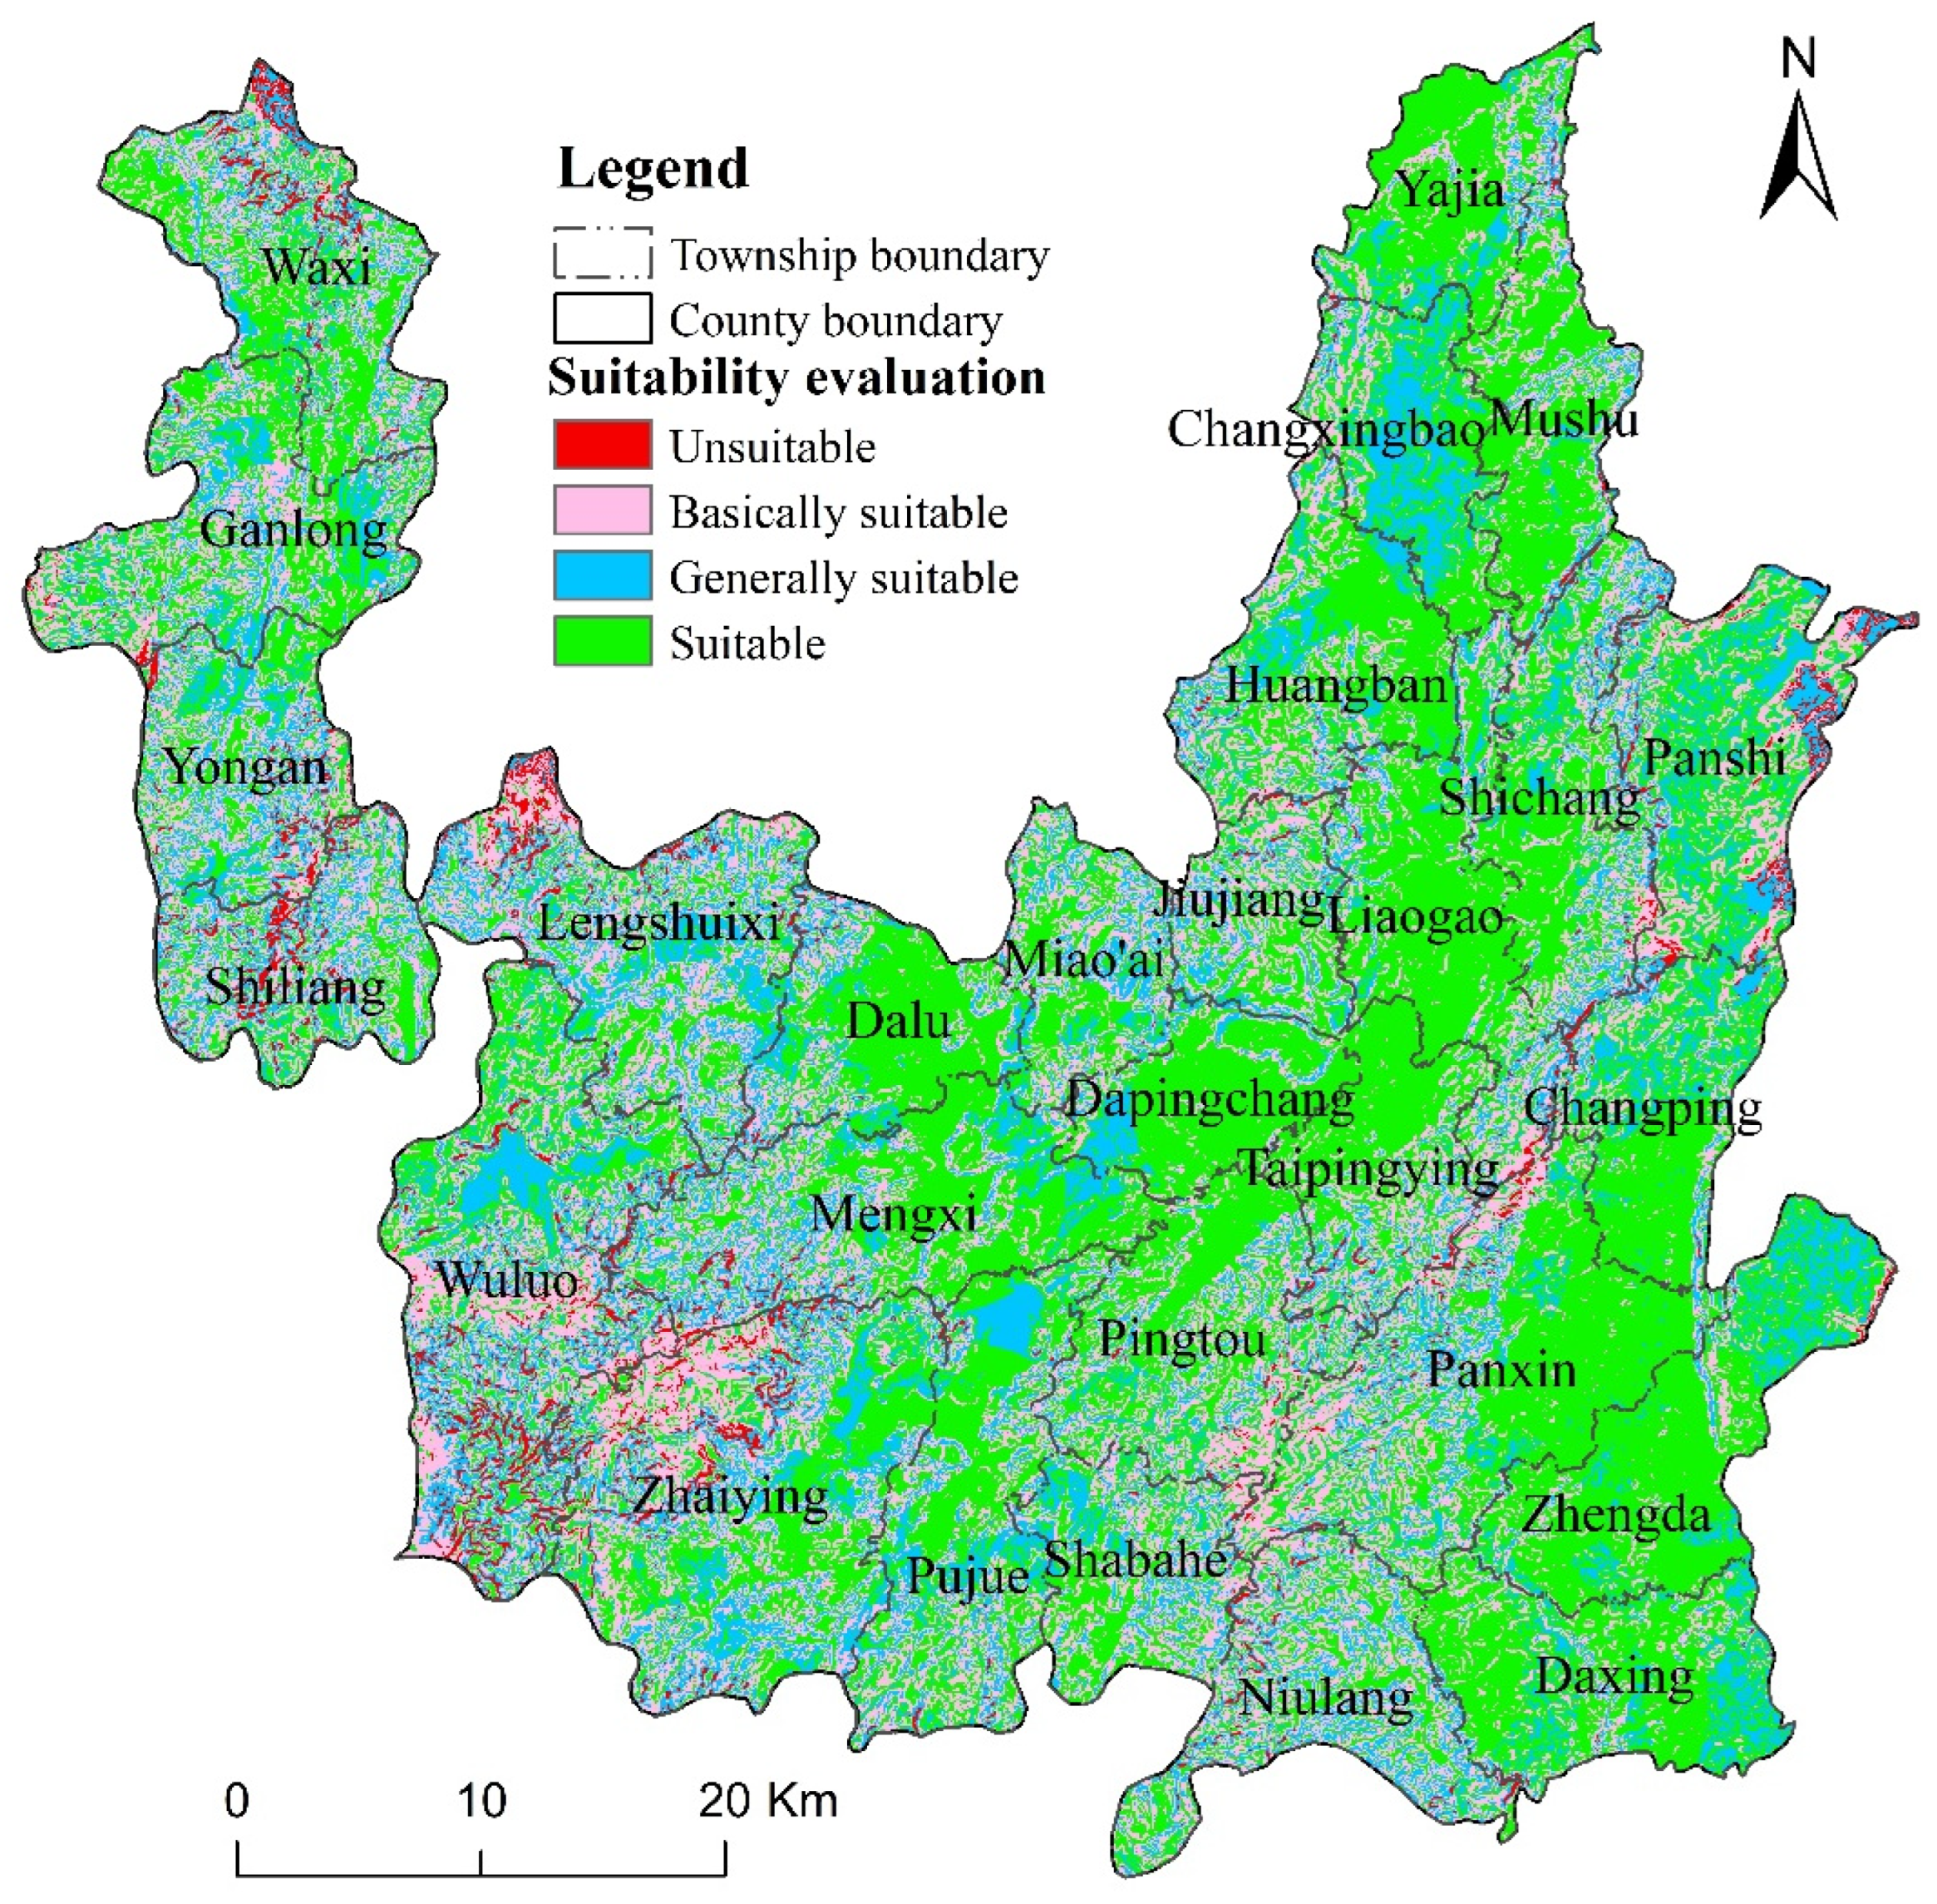
The results of suitability evaluation of rural settlements based on Geodetector and AHP show that the rural settlements in Songtao Miao Autonomous County are categorized as “suitable” and “relatively suitable” for living up to 87.40%. The “suitable” rural settlement areas are mainly concentrated in the hilly and low mountains and river valleys, with relatively gentle terrain in the middle and east, distributed in two north–south trending strips. The “relatively suitable” rural settlements are mainly scattered in the surrounding livable areas. The distribution of “basically suitable” rural settlements is more scattered. There is one “unsuitable” rural residential area.
(4)
The suitability evaluation model based on Geodetector and AHP methods has a wide range of universality, not only providing scientific research methods and evaluation models for karst areas, but also for related evaluation studies in other regions.

Author Contributions

Conceptualization, Z.Y.; methodology, Z.Y.; software, D.Y.; validation, J.G.; formal analysis, J.G.; investigation, J.G. and F.T.; resources, F.T.; data curation, Z.Y.; writing—original draft preparation, Z.Y. and J.G.; writing—review and editing, Z.Y.; visualization, D.Y. and F.T.; supervision J.G.; project administration, Z.Y. and J.G. All authors have read and agreed to the published version of the manuscript.

Funding

This work was supported by the National Natural Science Foundation of China (no. 41861019), the Research Project of Humanities and Social Sciences of Guizhou Education Department (no. 2022ZC039, KY [2020] 164), the master’ degree and discipline construction research sub-project of Tongren University (Trxyxwdxm-104,046).

Data Availability Statement

Not applicable.

Conflicts of Interest

The authors declare no conflict of interest. The funders had no role in the design of the study; in the collection, analyses, or interpretation of data; in the writing of the manuscript; or in the decision to publish the results.

References

  1. Liu, Y.; Li, Y. Revitalize the world’s countryside. Nature 2017, 548, 275–277. [Google Scholar] [CrossRef] [PubMed] [Green Version]
  2. Barbosa-Brandão, V.; Santé Riveira, I.; Crecente Maseda, R. Evolution of legal criteria for the identification and zoning of rural settlements in Galicia, NW Spain. Eur. Plan. Stud. 2015, 23, 398–429. [Google Scholar] [CrossRef]
  3. Gobattoni, F.; Pelorosso, R.; Leone, A.; Ripa, M.N. Sustainable rural development: The role of traditional activities in Central Italy. Land Use Policy 2015, 48, 412–427. [Google Scholar] [CrossRef]
  4. Yansui, L. Research on the urban-rural integration and rural revitalization in the new era in China. Acta Geogr. Sin. 2018, 73, 637–650. [Google Scholar]
  5. Song, W.; Li, H. Spatial pattern evolution of rural settlements from 1961 to 2030 in Tongzhou District, China. Land Use Policy 2020, 99, 105044. [Google Scholar] [CrossRef]
  6. Govindan, K.; Loisi, R.V.; Roma, R. Greenways for rural sustainable development: An integration between geographic information systems and group analytic hierarchy process. Land Use Policy 2016, 50, 429–440. [Google Scholar]
  7. Wang, M.; Yu, B.; Zhuo, R.; Li, Z. A Geographic Analysis on Rural Reconstruction-Transformation-Revitalization: A Case Study of Jianghan Plain in China. Land 2022, 11, 616. [Google Scholar] [CrossRef]
  8. Kong, X.; Liu, D.; Tian, Y.; Liu, Y. Multi-objective spatial reconstruction of rural settlements considering intervillage social connections. J. Rural. Stud. 2021, 84, 254–264. [Google Scholar] [CrossRef]
  9. Long, H.; Zhang, Y.; Tu, S. Rural vitalization in China: A perspective of land consolidation. J. Geogr. Sci. 2019, 29, 517–530. [Google Scholar] [CrossRef] [Green Version]
  10. Sun, F.; Li, J. Research on the Development Mechanism of Rural E-Commerce Based on Rooted Theory: A Co-Benefit-Oriented Perspective. Sustainability 2022, 14, 13242. [Google Scholar] [CrossRef]
  11. Hosseini, S.B.; Faizi, M.; Norouzian-Maleki, S.; Azeri, A.R.K. Impact evaluation of rural development plans for renovating and retrofitting of rural settlements. Environ. Earth Sci. 2015, 73, 3033–3042. [Google Scholar] [CrossRef]
  12. Gao, S.; Yang, L.; Jiao, H. Changes in and Patterns of the Tradeoffs and Synergies of Production-Living-Ecological Space: A Case Study of Longli County, Guizhou Province, China. Sustainability 2022, 14, 8910. [Google Scholar] [CrossRef]
  13. Sun, M.; Li, X.; Yang, R.; Zhang, Y.; Zhang, L.; Song, Z.; Liu, Q.; Zhao, D. Comprehensive partitions and different strategies based on ecological security and economic development in Guizhou Province, China. J. Clean. Prod. 2020, 274, 122794. [Google Scholar] [CrossRef]
  14. Jiang, S.; Xiong, K.; Xiao, J. Structure and Stability of Agroforestry Ecosystems: Insights into the Improvement of Service Supply Capacity of Agroforestry Ecosystems under the Karst Rocky Desertification Control. Forests 2022, 13, 878. [Google Scholar] [CrossRef]
  15. Stanny, M.; Komorowski, Ł.; Rosner, A. The socio-economic heterogeneity of rural areas: Towards a rural typology of Poland. Energies 2021, 14, 5030. [Google Scholar] [CrossRef]
  16. Liu, Y.; Ke, X.; Wu, W.; Zhang, M.; Fu, X.; Li, J.; Jiang, J.; He, Y.; Zhou, C.; Li, W. Geospatial characterization of rural settlements and potential targets for revitalization by geoinformation technology. Sci. Rep. 2022, 12, 1–16. [Google Scholar] [CrossRef]
  17. Conrad, C.; Rudloff, M.; Abdullaev, I.; Thiel, M.; Löw, F.; Lamers, J.P.A. Measuring rural settlement expansion in Uzbekistan using remote sensing to support spatial planning. Appl. Geogr. 2015, 62, 29–43. [Google Scholar] [CrossRef]
  18. Tao, Z.; Guanghui, J.; Wenqiu, M.; Guangyong, L.; Yanbo, Q.; Yingying, T.; Qinglei, Z.; Yaya, T. Dying villages to prosperous villages: A perspective from revitalization of idle rural residential land (IRRL). J. Rural. Stud. 2021, 84, 45–54. [Google Scholar] [CrossRef]
  19. Vogel, S.; Märker, M.; Esposito, D.; Seiler, F. The ancient rural settlement structure in the hinterland of Pompeii inferred from spatial analysis and predictive modeling of Villae rusticae. Geoarchaeology 2016, 31, 121–139. [Google Scholar] [CrossRef]
  20. Wen, Y.; Zhang, Z.; Liang, D.; Xu, Z. Rural residential land transition in the Beijing-Tianjin-Hebei region: Spatial-temporal patterns and policy implications. Land Use Policy 2020, 96, 104700. [Google Scholar] [CrossRef]
  21. De Vries, W.T. Trends in the adoption of new geospatial technologies for spatial planning and land management in 2021. Geoplanning J. Geomat. Plan. 2021, 8, 85–98. [Google Scholar] [CrossRef]
  22. Barbosa, V.; Riveira, I.S.; Maseda, R.C.; Redondo, C.D.; Trinidad, J.P.; López, J.P.; Biempica, R.D.; Neto, J.A.F. A New Spatial Criteria Method to Delimit Rural Settlements towards Boundaries Equity: Land Use Optimization for Decision Making in Galicia, NW Spain. Land 2022, 11, 800. [Google Scholar] [CrossRef]
  23. Gong, Y.; Cai, B.; Sun, Y. Perceived fiscal subsidy predicts rural residential acceptance of clean heating: Evidence from an indoor-survey in a pilot city in China. Energy Policy 2020, 144, 111687. [Google Scholar] [CrossRef]
  24. Qu, Y.; Dong, X.; Zhan, L.; Si, H.; Ping, Z.; Zhu, W. Scale Transition and Structure–Function Synergy Differentiation of Rural Residential Land: A Dimensionality Reduction Transmission Process from Macro to Micro Scale. Land 2021, 10, 647. [Google Scholar] [CrossRef]
  25. Thompson, A.E.; Walden, J.P.; Chase, A.S.Z.; Hutson, S.R.; Marken, D.B.; Cap, B.; Fries, E.C.; Piedrasanta, M.R.G.; Hare, T.S.; Horn, S.W., III; et al. Ancient Lowland Maya neighborhoods: Average Nearest Neighbor analysis and kernel density models, environments, and urban scale. PLoS ONE 2022, 17, e0275916. [Google Scholar] [CrossRef] [PubMed]
  26. Yanbo, Q.; Guanghui, J.; Yuting, Y.; Qiuyue, Z.; Yuling, L.; Wenqiu, M. Multi-scale analysis on spatial morphology differentiation and formation mechanism of rural residential land: A case study in Shandong Province, China. Habitat Int. 2018, 71, 135–146. [Google Scholar] [CrossRef]
  27. Jia Chen, S.; Mehmood, M.S.; Liu, S.; Gao, Y. Spatial Pattern and Influencing Factors of Rural Settlements in Qinba Mountains, Shaanxi Province, China. Sustainability 2022, 14, 10095. [Google Scholar] [CrossRef]
  28. Jia, K.; Qiao, W.; Chai, Y.; Feng, T.; Wang, Y.; Ge, D. Spatial distribution characteristics of rural settlements under diversified rural production functions: A case of Taizhou, China. Habitat Int. 2020, 102, 102201. [Google Scholar] [CrossRef]
  29. Huang, Q.; Song, W.; Song, C. Consolidating the layout of rural settlements using system dynamics and the multi-agent system. J. Clean. Prod. 2020, 274, 123150. [Google Scholar] [CrossRef]
  30. Nguyen, T.T.; Hoffmann, E.; Buerkert, A. Spatial patterns of urbanising landscapes in the North Indian Punjab show features predicted by fractal theory. Sci. Rep. 2022, 12, 1–14. [Google Scholar] [CrossRef]
  31. Yu, H.; Luo, Y.; Li, P.; Dong, W.; Yu, S.; Gao, X. Water-facing distribution and suitability space for rural mountain settlements based on fractal theory, south-western China. Land 2021, 10, 96. [Google Scholar] [CrossRef]
  32. Liang, Z.F.; Yuan, Y.; Chen, W.B.; HaiOu, Y. A study on suitability evaluation of rural settlements and its consolidation division based on weighted Voronoi diagram. Acta Agric. Univ. Jiangxiensis 2017, 39, 1244–1255. [Google Scholar]
  33. Bajić, L.; Vasiljević, N.; Čavlović, D.; Radić, B.; Gavrilović, S. A Green Infrastructure Planning Approach: Improving Territorial Cohesion through Urban-Rural Landscape in Vojvodina, Serbia. Land 2022, 11, 1550. [Google Scholar] [CrossRef]
  34. Alphan, H.; Karamanli, E.; Derse, M.A.; Uslu, C. Analyzing pattern features of urban/rural residential land use change: The case of the southern coast of Turkey. Land Use Policy 2022, 122, 106348. [Google Scholar] [CrossRef]
  35. Yurui, L.; Yi, L.; Pengcan, F.; Hualou, L. Impacts of land consolidation on rural human–environment system in typical watershed of the Loess Plateau and implications for rural development policy. Land Use Policy 2019, 86, 339–350. [Google Scholar] [CrossRef]
  36. Reisig, D.; Mullan, K.; Hansen, A.; Powell, S.; Theobald, D.; Ulrich, R. Natural amenities and low-density residential development: Magnitude and spatial scale of influences. Land Use Policy 2021, 102, 105285. [Google Scholar] [CrossRef]
  37. Qing, C.; Guo, S.; Deng, X.; Xu, D. Farmers’ awareness of environmental protection and rural residential environment improvement: A case study of Sichuan province, China. Environ. Dev. Sustain. 2022, 24, 11301–11319. [Google Scholar] [CrossRef]
  38. Zhang, X.; He, J.; Deng, Z.; Ma, J.; Chen, G.; Zhang, M.; Li, D. Comparative changes of influence factors of rural residential area based on spatial econometric regression model: A case study of Lishan Township, Hubei Province, China. Sustainability 2018, 10, 3403. [Google Scholar] [CrossRef] [Green Version]
  39. Wang, Y.; Chen, L.; Long, K. Farmers’ identity, property rights cognition and perception of rural residential land distributive justice in China: Findings from Nanjing, Jiangsu Province. Habitat Int. 2018, 79, 99–108. [Google Scholar] [CrossRef]
  40. Liebhold, A.M.; McCullough, D.G.; Blackburn, L.M.; Frankel, S.J.; Von Holle, B.; Aukema, J.E. A highly aggregated geographical distribution of forest pest invasions in the USA. Divers. Distrib. 2013, 19, 1208–1216. [Google Scholar] [CrossRef]
  41. Huang, Y.; Zhao, C.; Song, X.; Chena, J.; Li, Z. A semi-parametric geographically weighted (S-GWR) approach for modeling spatial distribution of population. Ecol. Indic. 2018, 85, 1022–1029. [Google Scholar] [CrossRef]
  42. Yang, B.; Li, S. Design with Nature: Ian McHarg’s ecological wisdom as actionable and practical knowledge. Landsc. Urban Plan. 2016, 155, 21–32. [Google Scholar] [CrossRef]
  43. Sahani, N. Application of analytical hierarchy process and GIS for ecotourism potentiality mapping in Kullu District, Himachal Pradesh, India. Environ. Dev. Sustain. 2020, 22, 6187–6211. [Google Scholar] [CrossRef]
  44. Ding, X.; Ma, R.; Shan, M.; Wang, X.; Yang, X. Occupants’ on-demand control of individual heating devices in rural residential buildings: An experimental scheme and on-site study. Energy Build. 2022, 259, 111862. [Google Scholar] [CrossRef]
  45. Hou, Q.; Yang, S.; Fang, Y.; Zhang, L. Research on the application of AVC theory in data analysis of urban affairs and planning method. Clust. Comput. 2019, 22, 5279–5292. [Google Scholar] [CrossRef]
  46. Guo, P.; Zhang, F.; Wang, H.; Qin, F. Suitability evaluation and layout optimization of the spatial distribution of rural settlements. Sustainability 2020, 12, 2409. [Google Scholar] [CrossRef] [Green Version]
  47. Cui, X.; Liu, C.; Shan, L.; Lin, J.; Zhang, J.; Jiang, Y.; Zhang, G. Spatial-Temporal responses of ecosystem services to land use transformation driven by rapid urbanization: A case study of Hubei Province, China. Int. J. Environ. Res. Public Health 2021, 19, 178. [Google Scholar] [CrossRef]
  48. Duyckaerts, C.; Godefroy, G. Voronoi tessellation to study the numerical density and the spatial distribution of neu-rones. J. Chem. Neuroanat. 2000, 20, 83–92. [Google Scholar] [CrossRef]
  49. Jinfeng, W.; Chengdong, X. Geodetector: Principle and prospective. J. Geogr. Soc. China 2017, 72, 116–134. [Google Scholar]
  50. Liu, Y.; Cui, J.; Kong, X.; Zeng, C. Assessing suitability of rural settlements using an improved technique for order preference by similarity to ideal solution. Chin. Geogr. Sci. 2016, 26, 638–655. [Google Scholar] [CrossRef]
  51. Eftakhari, E.; Ganjali, J. Classification of Physical Development of Rural Settlements City of Isfahan Province Using AHP and TOPSIS Model. J. Geogr. Environ. Stud. 2021, 10, 27–40. [Google Scholar]
  52. Jalalian, H.; Hojjat Shamami, S. Spatial Analysis of Livelihood Foundations of Mountainous Rural Settlements (Case Study: Dashtvil District). Geogr. Eng. Territ. 2021, 5, 355–366. [Google Scholar]
  53. Jingbo, Y.; Hong, L.; Dongyan, W.; Shuhan, L. Optimization of Rural Settlement Distributions Based on the Ecological Security Pattern: A Case Study of Da’an City in Jilin Province of China. Chin. Geogr. Sci. 2020, 30, 824–838. [Google Scholar]
  54. Cui, X.; Deng, W.; Yang, J.; Huanga, W.; de Vries, W.T. Construction and optimization of ecological security patterns based on social equity perspective: A case study in Wuhan, China. Ecol. Indic. 2022, 136, 108714. [Google Scholar] [CrossRef]
  55. Zhaowu, Y.U.; Xiao, L.; Chen, X.; He, Z.; Guo, Q.; Vejre, H. Spatial restructuring and land consolidation of urban-rural settlement in mountainous areas based on ecological niche perspective. J. Geogr. Sci. 2018, 28, 131–151. [Google Scholar]
  56. Liu, Y.; Ye, Q.; Li, J.; Kong, X.; Jiao, L. Suitability evaluation of rural settlements based on accessibility of production and living: A case study of Tingzu Town in Hubei Province of China. Chin. Geogr. Sci. 2016, 26, 550–565. [Google Scholar] [CrossRef] [Green Version]
  57. Tian, Y.; Kong, X.; Liu, Y. Combining weighted daily life circles and land suitability for rural settlement reconstruction. Habitat Int. 2018, 76, 1–9. [Google Scholar] [CrossRef]
  58. Xu, X.; Genovese, P.V. Assessment on the Spatial Distribution Suitability of Ethnic Minority Villages in Fujian Province Based on GeoDetector and AHP Method. Land 2022, 11, 1486. [Google Scholar] [CrossRef]
  59. Chomać-Pierzecka, E.; Sobczak, A.; Soboń, D. Wind Energy Market in Poland in the Background of the Baltic Sea Bordering Countries in the Era of the COVID-19 Pandemic. Energies 2022, 15, 2470. [Google Scholar] [CrossRef]
  60. Drozdowski, G.; Dziekański, P. Local Disproportions of Quality of Life and Their Influence on the Process of Green Economy Development in Polish Voivodships in 2010–2020. Int. J. Environ. Res. Public Health 2022, 19, 9185. [Google Scholar] [CrossRef]
Figure 1. Location and topography of study area.
Land 11 02101 g001
Figure 2. The overall flowchart of the method.
Land 11 02101 g002
Figure 3. Thiessen polygon and its area variation coefficient of rural settlements in study area. (a) The Thiessen polygon of rural settlements in the study area; (b) The coefficient of variation of rural settlements.
Land 11 02101 g003
Figure 4. Rural settlements kernel density in the study area.
Land 11 02101 g004
Figure 5. Distribution of rural settlements in the study area based on natural environmental factors. (a) Number of rural settlements at different altitudes; (b) Number of rural settlements on different slopes; (c) Number of rural settlements in different stream buffer zones.
Land 11 02101 g005aLand 11 02101 g005b
Figure 6. Distribution of rural settlements in the study area based on location environmental factors. (a) Number of rural settlements on different road buffer zones; (b) Number of rural residential areas in different township government resident.
Land 11 02101 g006
Figure 7. Results of single-factor detection and double-factor interaction detection of Geodetector.
Land 11 02101 g007
Figure 8. Suitability evaluation results of rural settlements in study area.
Land 11 02101 g008
Table 1. Different environmental factor reclassifications and buffer levels.
Environmental FactorAnalysis MethodReclassification and Buffer Level
DEMreclassification<500 m, 500–800 m, 800–1000 m, 1000–1200 m, >1200 m
Slopereclassification<6°, 6–15°, 15–25°, 25–35°, >35°
Riverbuffer<2 km, 2–4 km, 4–6 km, 6–8 km, >8 km
Roadbuffer<2 km, 2–4 km, 4–6 km, 6–8 km, >8 km
Residence of township governmentsbuffer<3 km, 3–5 km, 5–7 km, 7–9 km, >9 km
Table 2. Suitability grade of rural settlements.
Suitability GradeDescription as a Site Selection AreaScore
highly suitablePriority4
suitableAs a site selection area3
relatively suitableCan be2
basically suitableReluctantly1
unsuitableHardly0
Table 3. Factors’ index weight.
Criterion LayerWeight of Criterion LayerElement LayerWeight of Element Layer and Buffer Level
Natural factors0.875Dem0.0747
Slope0.6616
Distance from the river0.1387
Location factors0.125Distance from the river0.0313
Distance from the township0.0938
Table 4. The suitability grade and proportion of rural settlements in each township (%).
TownshipDa
Lu
DaPing
Chang
Da
Xing
Gan
Long
HuangBanJiu
Jiang
Leng
ShuiXi
Miu
Gao
MengXiMiao’ai’
Number of settlements14191021291317332518
Suitable10094.743061.9075.8638.4676.4784.857266.67
Relatively suitable--5.26309.523.457.69012.1240
Basically suitable----4028.5720.6953.8523.533.032433.33
Unsuitable--------------------
TownshipMu
Shu
Niu
Lang
Pan
Shi
Pan
Xin
Shi
Chang
TaiPingYingPing
You
Pu
Jue
Sha
BaHe
Shi
Liang
Number of settlements2216212919171922109
Suitable95.455038.1075.8678.9588.2452.6354.553055.56
Relatively suitable4.556.2542.8610.3410.535.8815.79--1011.11
Basically suitable--43.7519.0513.7910.535.8831.5845.456033.33
Unsuitable--------------------
TownshipWaXiWu
Luo
Ya
Jia
Yong
An
Zhai
Ying
Chang
Ping
Chang
XingBao
Zheng
Da
Number of settlements918171126142621
Suitable88.8911.1110045.4538.4635.7153.8557.14
Relatively suitable--38.89--18.1823.0828.5738.469.52
Basically suitable11.1144.44--36.3638.4635.717.6933.33
Unsuitable--5.56------------
Publisher’s Note: MDPI stays neutral with regard to jurisdictional claims in published maps and institutional affiliations.

