Article

Multi-Scenario Prediction of Landscape Ecological Risk in the Sichuan-Yunnan Ecological Barrier Based on Terrain Gradients

1
Faculty of Geography, Yunnan Normal University, Kunming 650500, China
2
Yunnan Academy of Social Sciences, Kunming 650000, China
3
Center for Turkmenistan Studies, China University of Geosciences, Wuhan 430074, China
4
University of Chinese Academy of Sciences, Beijing 860000, China
*
Author to whom correspondence should be addressed.
Land 2022, 11(11), 2079; https://doi.org/10.3390/land11112079
Submission received: 8 November 2022 / Revised: 14 November 2022 / Accepted: 17 November 2022 / Published: 18 November 2022
(This article belongs to the Special Issue Smart Land Use Planning: New Theories, New Tools and New Practice)

Abstract

:
Land use changes induced by human activities change landscape patterns and ecological processes, threatening regional and global ecosystems. Terrain gradient and anthropogenic multi-policy regulation can have a pronounced effect on landscape components. Forecasting the changing trend of landscape ecological risk (LER) is important for national ecological security and regional sustainability. The present study assessed changes in LER in the Sichuan-Yunnan Ecological Barrier over a 20-year period using land use data from 2000, 2010, and 2020. The enhanced Markov-PLUS (patch-generating land use simulation) model was used to predict and analyze the spatial distribution pattern of LER under the following three scenarios. These were business-as-usual (BAU), urban development and construction (UDC), and ecological development priority (EDP) in 2030. The influence of terrain conditions on LER was also explored. The results showed that over the past 20 years, the LER index increased and then decreased and was dominated by medium and low risk, accounting for more than 70% of the total risk-rated area. The highest and higher risk areas for the three future scenarios have increased in spatial extent. The UDC scenario showed the largest increase of 3341.13 km2 and 2684.85 km2, respectively. The highest-risk level has a strong selectivity for low gradients, with high-level risks more likely to occur at low gradients. The response of ecological risk to gradient changes shows a positive correlation distribution for high-gradient areas and a negative correlation distribution for low-gradient areas. The influence of future topographic gradient changes on LER remains significant. The value of multiscale geographically weighted regression (MGWR) for identifying the spatial heterogeneity of terrain gradient and LER is highlighted. It can play an important role in the formulation of scientific solutions for LER prevention and of an ecological conservation policy for mountainous areas with complex terrain.

1. Introduction

The expansion of human activities and large-scale aggregation have transformed terrestrial ecosystems, intensified climate change, and degraded ecosystem functions. This has resulted in a loss of biodiversity, profoundly impacting community structure and landscape patterns [1,2]. Landscape-level ecological risk assessment can be used to integrate the effects of human disturbance with natural environmental changes and landscape composition, structure, function, and processes [3,4,5]. It emphasizes the integrated representation of multiple ecological risks and spatial visualization. This can help to assess the potential risks of land use structures and cover changes in the ecological environment according to spatial patterns [6]. It also provides a basis for decision-making on integrated risk prevention [7,8,9]. While supporting the functioning of regional ecological systems, the national ecological barrier areas are designed to enhance and protect degraded and degrading ecosystems. This is undertaken through a series of restoration and reorganization measures. These can reduce the threats to maintaining regional ecological security to varying degrees [10]. After implementing the UN Convention on Biological Diversity in 2010, countries have made efforts to proclaim marine, terrestrial and freshwater ecological conservation areas. This has been undertaken internationally to conserve threatened species and construct over 16,000 “Key Biodiversity Areas” worldwide [11]. China has established mature reserves, key ecological function areas, and biodiversity reserves to fulfill its global conservation commitments and reconcile human development in the context of natural resource conservation. This encompasses an area of 5,366,000 km2, occupying approximately 56% of the national territory [12,13]. Nature reserves and protected areas now account for 18% of the terrestrial national territory. This has marked the achievement of the Convention on Biological Diversity’s 2020 target for 17% of the land area being incorporated into protected areas ahead of schedule. Establishing the National Ecological Security Barrier is part of a major project to protect and restore ecosystems in China. The project also aims to integrate the restoration and protection of mountains, water, forests, fields, lakes, and grasses at the regional scale [14].
Human activities profoundly impact ecosystems, mainly through land use change [15], which is full of uncertainty and complexity. Landscape ecological risk (LER) assessment with land use change as a causal factor is becoming an important tool to examine correlations between human activities and the regional ecological environment [16,17]. After Tobler applied cellular automata (CA) to geographical modeling, research on land use simulation models emerged, and integrated numerical–non-numerical-based models are becoming the dominant approach to land-use simulation due to their ability to quantify complex processes of land use change [18]. Zeng et al. (2014) used the Gray-Markov model to predict the amount of future land use in the agricultural region of the eastern Qinghai Plateau. Then combined with the CLUE-S model (a spatial land allocation model based on a combination of logistic regression and elasticity coefficients) [19], simulated the land use cover status of the region in 2020 under three scenarios and calculated the landscape ecological risk index under different scenarios [20]. The LER index was also calculated. Li & Huang (2015) applied the CLUE-S model to simulate and explore land use change in 2030 [21]. The Luan River basin was used as a case study. The ecological risk response of the landscape to land use change was investigated. W. Li et al. (2020) applied the Future Land use Simulation (FLUS) model to simulate the spatial pattern of land use and the ecological risk response in 2025 [22]. This was undertaken according to LER spatial and temporal variation in Guangzhou.
The terrain is a vital limiting factor in forming land use patterns [23]. It affects the structure and composition of terrestrial ecosystems through changes in elevation and slope, reflecting landscape patterns and spatial heterogeneity. Prior studies have already explored the spatial distribution of landscape patterns based on terrain factors [24]. The correlation between future LER and terrain gradients using the terrain niche index has also been explored (TNI) [25]. The spatial autocorrelation analysis and topographic distribution index have also examined the dynamic correlation between the LER and terrain gradients [26]. These studies have predominantly bridged the gap in exploring the effects of terrain gradient on landscape stability. However, there is still a degree of limitation. (1) Emphasis is placed on the horizontal change process in natural landscapes affected by human activities. The exploration of LER assessment and gradient effects on vertical gradients is lacking. (2) Most prior studies have been based on global models, ignoring the regression variation in local spatial terrain gradients with LER in the study area. The current study analyzed the influence of terrain gradient on the spatial and temporal variability of LER using TNI. The response of local spatial ecological risk to terrain gradient was captured using MGWR to explore the relationship between local spatial ecological risk and terrain gradients. This effectively overcomes the limitations and spatial non-smoothness of global models such as OLS and spatial autocorrelation. This technique has thus more intuitively revealed the local influence of terrain gradients on LER.
The Sichuan-Yunnan ecological barrier is regarded as the intersection of the agricultural zone in eastern China and the pastoral zone on the Tibetan Plateau in the northwest [27]. It has important ecological functions in water conservation, soil conservation, climate conditions, and biodiversity [14]. Changes in land use structure and the ecological environment of the region influence economic and social development within the region. This is also associated with the stability of the national ecosystem and the maintenance of ecological integrity. However, significant differences in altitude, complex topography, diverse landscape types, and intensified climate change make the ecological environment more vulnerable to human activities. This manifests in the overuse of forest resources, which has led to a substantial decrease in the spatial area of primary forests, glacial retreat, severe land degradation, and water and soil erosion [28]. It is therefore important to investigate the spatial and temporal evolution of the LER for the Sichuan-Yunnan ecological barrier over the last two decades. It is also a priority to study the underlying ecological risks that the region may face. The present study aimed to simulate and forecast future LER patterns in the research area, investigate the spatial relationship between terrain gradient and LER, and present the change patterns of ecological risk associated with the terrain gradient in the local area. This was undertaken to optimize the landscape structure to enhance ecological functions and actively cope with the uncertainty regarding future ecological risks caused by complex topography and multi-policy regulation.

2. Materials and Methods
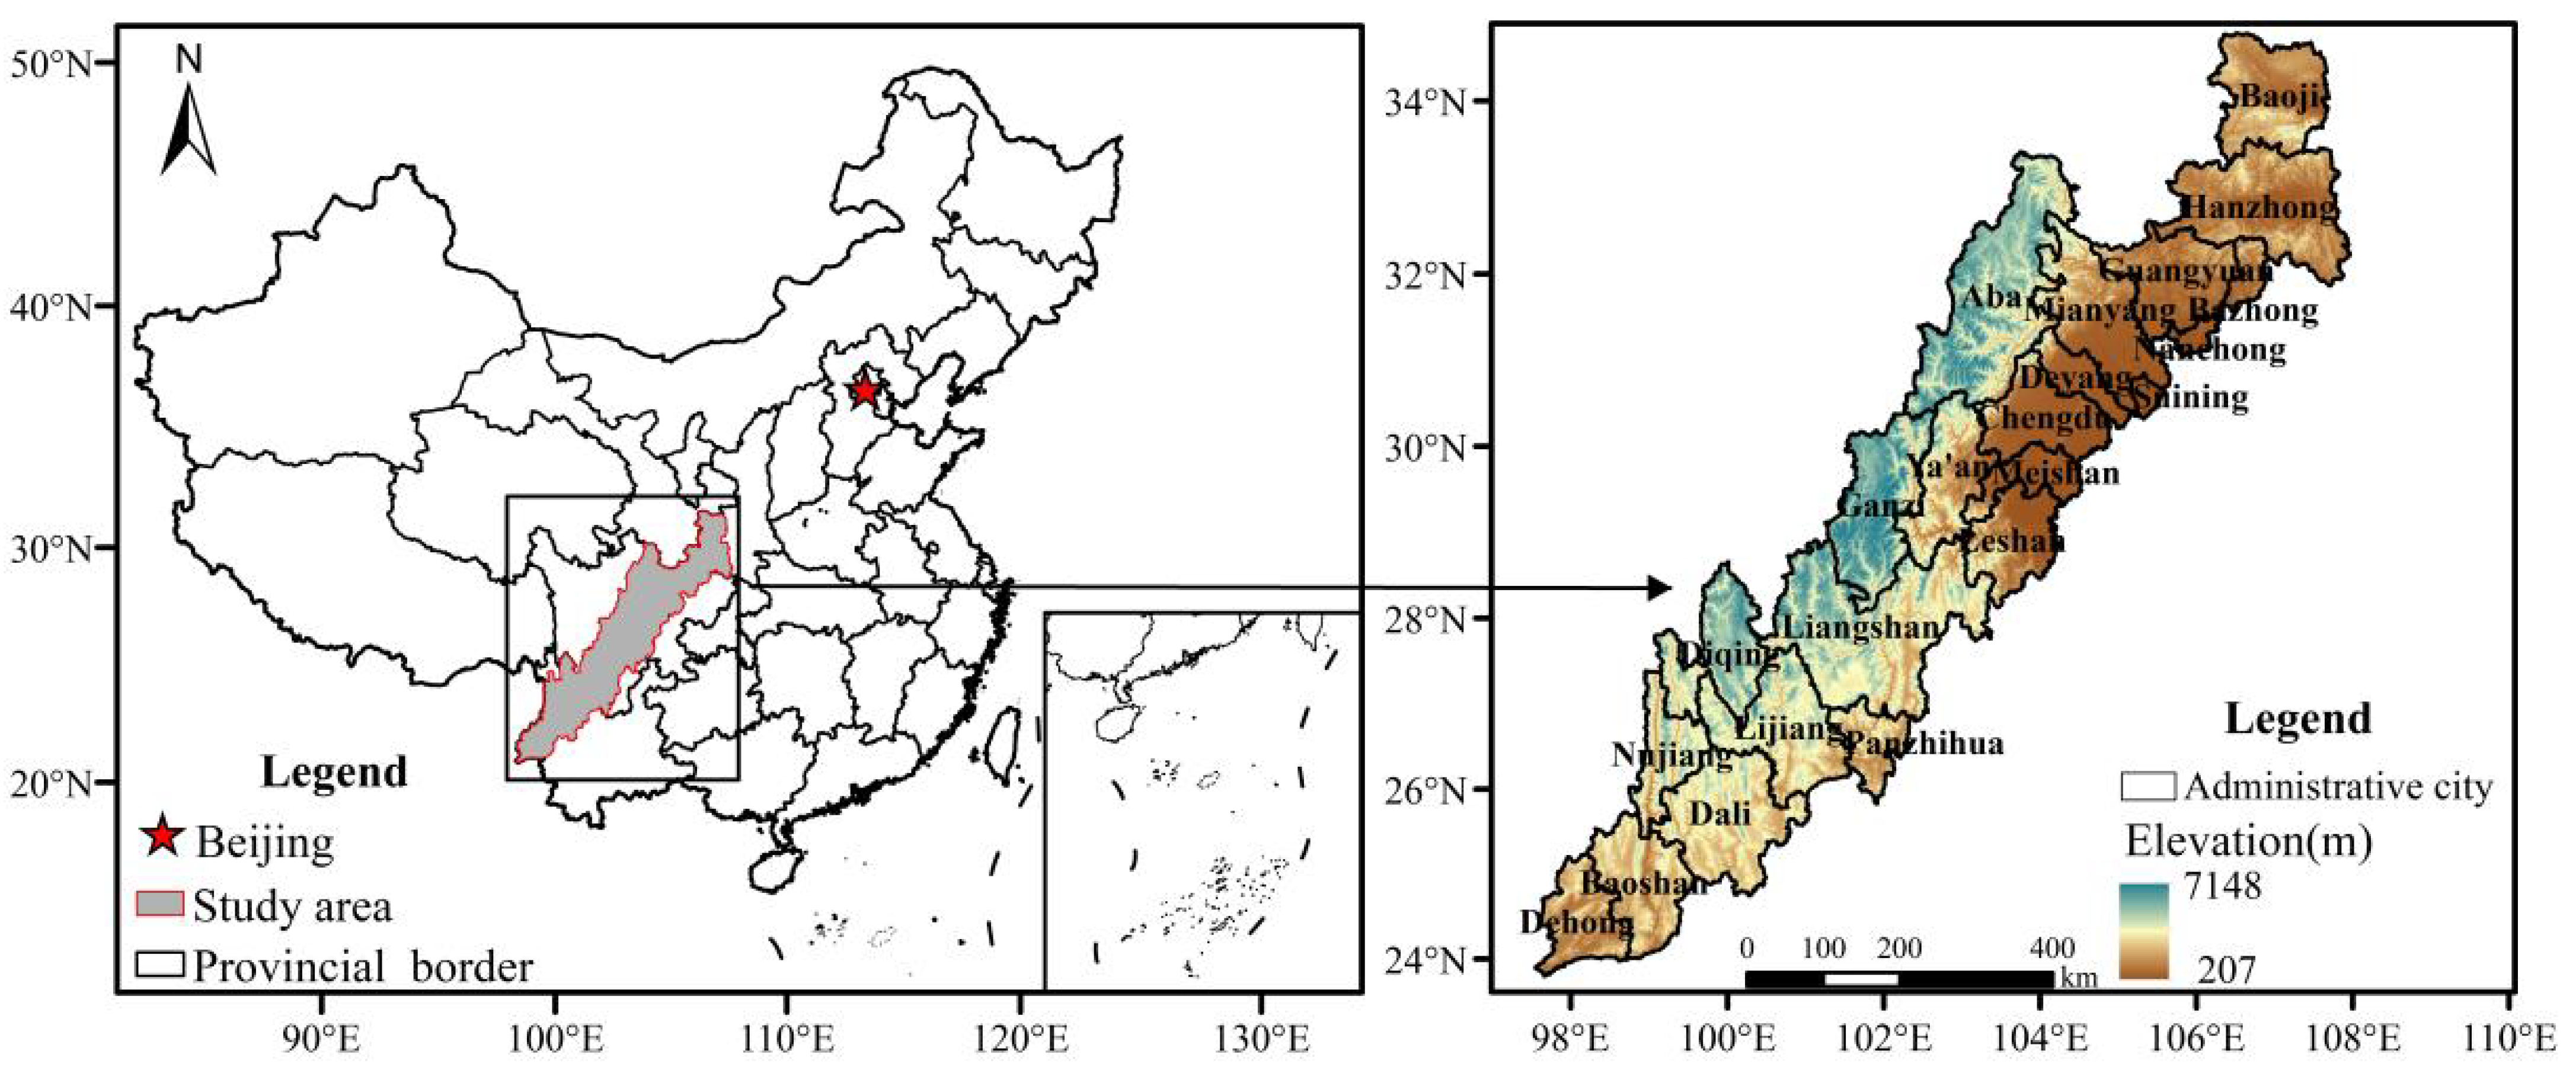
2.1. Study Area

The Sichuan-Yunnan Ecological Barrier Area is one of China’s mountainous, ecologically fragile areas. It is located at the southeastern edge of China’s Qinghai-Tibet Plateau (24°40′ N–34°55′ N, 98°40′ E–108°20′ E) [28] (Figure 1). The region is an important transitional belt for China in the context of natural ecology and socio-economics. It encompasses more than 140 counties (districts) in the Yunnan, Sichuan, and Shaanxi provinces, with an area of nearly 34.31 million km2. The Yunnan Province comprises 27.90% of the area, Sichuan Province comprises 58.93%, and the Shaanxi Province comprises 13.17% of the area. The territory has complex and diverse landforms rivers, and major hydrological systems. Examples include the Yunnan-Guizhou Plateau, Hengduan Mountains, Hanzhong Plain, Sichuan Basin, and the Jinsha, Yalong, Dadu, and Min rivers. It also includes a vital water conservation area in the middle and lower reaches of the Yangtze River, as well as the eastern agricultural ecological barrier area. Due to the influence of the topography, the vertical distribution of climate features in the territory is highly pronounced, with a temperate mountain plateau. The cold temperature monsoon climate dominates the area. The main agricultural areas are predominantly distributed in temperate valleys below 2000–3000 m. The pastoral areas in the high mountain plain areas are above 3000–3500 m above sea level. This region plays an important strategic role in China’s ecological security and economic development [27].

2.2. Data Sources

The land use data used in the current work was sourced from the Globeland30 global surface cover database (http://www.globallandcover.com/, accessed on 2 August 2021) [29] for 2000, 2010, and 2020. The data has a spatial resolution of 30 m. The land cover types in the area include cultivated land, forest, grassland, shrubland, wetland, water bodies, artificial surface, bare land, and permanent snow and ice. Elevation data were derived from the Geospatial Data Cloud (http://www.gscloud.cn, accessed on 2 August 2021) at a 90 m resolution. Data on annual precipitation, mean annual temperature, as well as GDP spatial distribution km grid data, were sourced from the Resource and Environmental Science and Data Centre in the Chinese Academy of Sciences (http://www.resdc.cn, accessed on 15 August 2021) [30,31]. Spatial population data were obtained from the World-pop national dataset (https://www.worldpop.org/, accessed on 15 August 2021) [32]. Nocturnal light data were derived from Chen et al. (2021) (Harvard Dataverse, https://doi.org/10.7910/DVN/YGIVCD, accessed on 15 August 2021) [33]. The road, lake, and river data were derived from the China National Geographic Information Resource Directory Service System (https://www.webmap.cn, accessed on 21 July 2021). To ensure a consistent analysis, all the data were resampled on a 100 m grid.

2.3. Methods

2.3.1. Landscape Ecological Risk Analysis

The division of risk evaluation cells is an important step in evaluating and spatial-visual representation of ecological risks in the landscape [34]. To analyze the spatial distribution of the LER, the grid size was set to 15 km × 15 km in accordance with the study area. The Sichuan-Yunnan ecological barrier area was divided into 1745 evaluation cells. Fragstats 4.2 software was used to calculate the LER index values for each evaluation unit. These were assigned to the centroids of each evaluation unit as attribute values. The landscape loss model was used to quantify the degree of ecological risk for the risk unit. The model was established under the core model for risk probability and hazard evaluation, based on the landscape disturbance index (Ei) and the landscape vulnerability index (Fi) [35]. The degree of landscape disturbance indicates that the risk occurrence probability and degree of vulnerability represent damage potentially caused by ecological risk [36].
(1)
Landscape disturbance index (Ei)
Based on human activities and landscape change in the study area, the landscape fragmentation index (Ci), landscape separation index (Si) as well as landscape dominance index (Di) can effectively characterize the relationship between human behavioral activities and landscape components. These were selected and superimposed with the aim of obtaining the Ei with the following equations [3,16].
C i = n i / A i
S i = 1 2 n i A × A A i
D i = Q i + M i 4 + L i 2
E i = a C i + b S i + c D i
where ni represents the patch number for the landscape i; Ai denotes the area of the landscape i; A stands for the total area; Qi indicates the ratio of the sampling number for the landscape i and the total sample number; Mi represents the ratio of the patch number for the landscape i and the total patch number; Li refers to the ratio of the patch number area for the landscape i and the sampling area for the landscape i; a, b, and c stand for the weight of the landscape metrics and a + b + c = 1. a, b, c were allocated the values of 0.5, 0.3, and 0.2, separately [37,38].
(2)
Landscape fragility index (Fi)
Landscape vulnerability highlights the fragility of the ecosystem structure within a variety of land cover types, namely the ecological value of any system loss and the ease of recovery from external disturbances [36]. Based on the results of current studies [38,39], the vulnerability values for nine land cover types were calculated from highest to lowest. The land cover types in the order of highest to lowest vulnerability values were glacier and permanent snow (9), bare ground (8), wetland (7), water body (6), cultivated land (5), grassland (4), shrubland (3), forest (2), and artificial surface (1). The normalized Fi values for each land cover type were 0.20, 0.18, 0.16, 0.13, 0.11, 0.09, 0.07, 0.04, and 0.02, respectively.
(3)
Landscape ecological loss degree index (Ri)
Disturbance of the ecological environment by land use change is denoted as the change in the structure and the role of the landscape pattern [25]. Ri can present the change in the landscape ecological environment generated by the potential ecological risk because of the change in structure and function. The formula of Ri is written as follows:
R i = E i × F i
where Ri is the ecological loss degree for landscape i and Ei denotes the landscape disturbance index for landscape i with Fi standing for the landscape fragility index for landscape i.
(4)
Landscape Ecological Risk Index (LERI)
Based on the landscape structure from a regional ecosystem perspective, the spatial structure of the land types is transformed into ecological risk variables, with the association between land use and regional ecological risk being integrated using the formula below:
L E R I k = i = 1 n A k i A k R i
where Aki is the area for landscape i in the k sample area, Ak refers to the total area in the k sample, and n stands for the number of landscape types.

2.3.2. Multi-Scenario Simulation

(1) Improved Markov-based land use scenario setting
Scenario analysis aims to describe and analyze multiple development possibilities [40]. However, the scale of future demand for land use has multiple scenarios. The scale of demand for each land use type requires forecasting with these different scenarios before the future distribution of land types in space is modeled [41]. In the current study, the scale of future demand for each land use type in the research region was predicted using a modified Markov model [18]. This uses the transition probability matrix Pij of land use change over two periods to forecast the scale of future land use change. The following formula was used:
P n = P n 1 P i j
where P is the transfer probability matrix of the land type; n indicates the number of land types; Pij is the probability of transferring land type i to land type j, 0 ≤ Pij ≤ 1, and P(n) is the arrival n times after (n − 1) transfers.
The scenario weight matrix was introduced with reference to the initial state shift probability model. This was to improve the Markov model applied to forecast the need for each site under diverse scenarios. The formula is expressed as follows:
P i j = P 11 P 12 P 1 j P 21 P 22 P 2 j P i 1 P i 2 P i j w 1 w 2 w n
P i j = 1 n = 1 j P 1 n 1 n = 1 j P 2 n 1 n = 1 j P i n P i j
where P i j is P i j after w n the matrix after changing the land class weights P i j . The probability of shifting the land class is not 1. Equation (3) is used to find P i j , depending on the situational weights w n . The improved Markov is P(n) = P(n − 1) P i j . Taking the 2010–2020 P i j and forecasting land use demand from 2020 to 2030, the sum of the absolute mean error of each category is less than 0.015 [18]. This indicates that the improved Markov model can be applied to land use demand forecasting in the research region.
In line with the different development objectives and possible future scenarios for the study area, three land use simulation scenarios were set up with the improved Markov model applied (Table 1). These were the business-as-usual (BUA) scenario; the urban development and construction (UDC) scenario, and the ecological development priority (EDP) scenario.
(2) PLUS model simulations
The PLUS model can integrate a land expansion analysis strategy and cellular automata (CA) in line with diverse kinds of random seeds [42]. Under the “top-down” constraint of land use quantity structure, the current study introduces random seed generation and a decreasing threshold mechanism. The CA model is combined with a “bottom-up” land use layout simulation. This can simulate the land use patch-level changes more accurately. The PLUS model can simulate the intrinsic nonlinear relationship of land use change more accurately at the patch level and improve the accuracy of land use simulation [43,44]. Four physical geographic factors (Digital Elevation Model, slope, temperature, and precipitation), three socioeconomic factors (GDP density, population density as well as night-time lighting), and three accessibility factors (distance to towns, roads, and rivers) were chosen based on the condition of the research region. The LULC transfer rules were based on the patterns in the nine land use types from 2010–2020 (Table 2). Historical scenarios [45,46] were used for setting neighborhood weights for cultivated land (0.1), forest (0.107), grassland (0.647), shrubland (0.412), wetland (0.426), water bodies (0.609), artificial surface (1), bare land (0.378), and permanent snow and ice (0.257). The simulation of the above parameters’ settings yielded a kappa coefficient of 0.72 and an overall accuracy of 0.83. This indicated that the land use change simulation could be improved [47].

2.3.3. Influence of Terrain Conditions

The terrain factors point to the possibility of enriching the LER probability representation [48]. The land use-based risk probability is closely associated with the terrain. Considering the significant vertical zonality of the study area, it is important to study the vertical spatial heterogeneity associated with ecological risk in the landscape. The terrain niche index refers to the combination of elevation and slope, reflecting the constraining effect of topographic conditions on landscape distribution [49]. The GIS spatial distribution model was used to construct the terrain niche index and for grading to feature the distribution of LER with diverse terrain position gradients in the study area using the following equation:
T = lg E E ¯ + 1 × S S ¯ + 1
where T refers to the terrain niche index; E indicates the elevation of the pixel; E is the average elevation in the research region; S refers to the slope of the pixel, and S represents the average slope in the research region.
To eliminate the different risk levels accounting for different proportions of the total area and spatial distribution characteristics that cannot be compared, the current study uses the distribution index (P). This is used to depict the distribution of LER on different terrain gradients. The concept of standard distribution is introduced to compare the ecological risk in different terrain areas. When P > 1, it indicates that terrain location e is the dominant terrain location of ecological risk i. A larger P value represents stronger dominance [25]. The distribution index formula is as follows:
P = S i e / S i / S e / S
where Sie represents the area of ecological risk i on the terrain niche e; Si refers to the area of ecological risk i; Se represents the area of the terrain niche e and S stands for the total area in the research region.

2.3.4. Spatial Regression Analysis

MGWR examines spatial multiscale effects and heterogeneity and reflects the association between the dependent and independent variables, varying spatially and at diverse scales [50,51]. Ecological risk is related to topographic gradients at different scales. The correlation between them is not constant in space. The present study used MGWR to reflect the degree of influence of different geographic gradient variables on ecological risk in the region [52], using the following expressions
y i = β 0 u i , v i + j = 1 k β b w j u i , v i x i j + ε i
where bwj is the specific optimal bandwidth adopted for calibrating the jth conditional relationship, ( u i , ; v i ) are the centroid coordinates at position i, β bwj is the coefficients of jth explanatory variable with bw bandwidth, and β 0 and εi are the intercepts [53].

2.3.5. Spatial Auto-Correlation Analysis

Spatial autocorrelation analysis can be used to measure the degree of aggregation for the attribute values of spatial units. This contributes to understanding a study object’s similarity to its neighboring regional objects (LERI in the study). To determine the spatial autocorrelation of ecological risks in the research region, the global Moran index (Moran’s I) was used to analyze whether there is a spatial correlation between risk attributes in adjacent areas for the LER. The value of Moran’s I index is from −1 to 1. A value greater than 0 suggests a positive correlation. A value of less than 0 proves a negative correlation, and a value equal to 0 denotes no correlation present [5].

3. Results

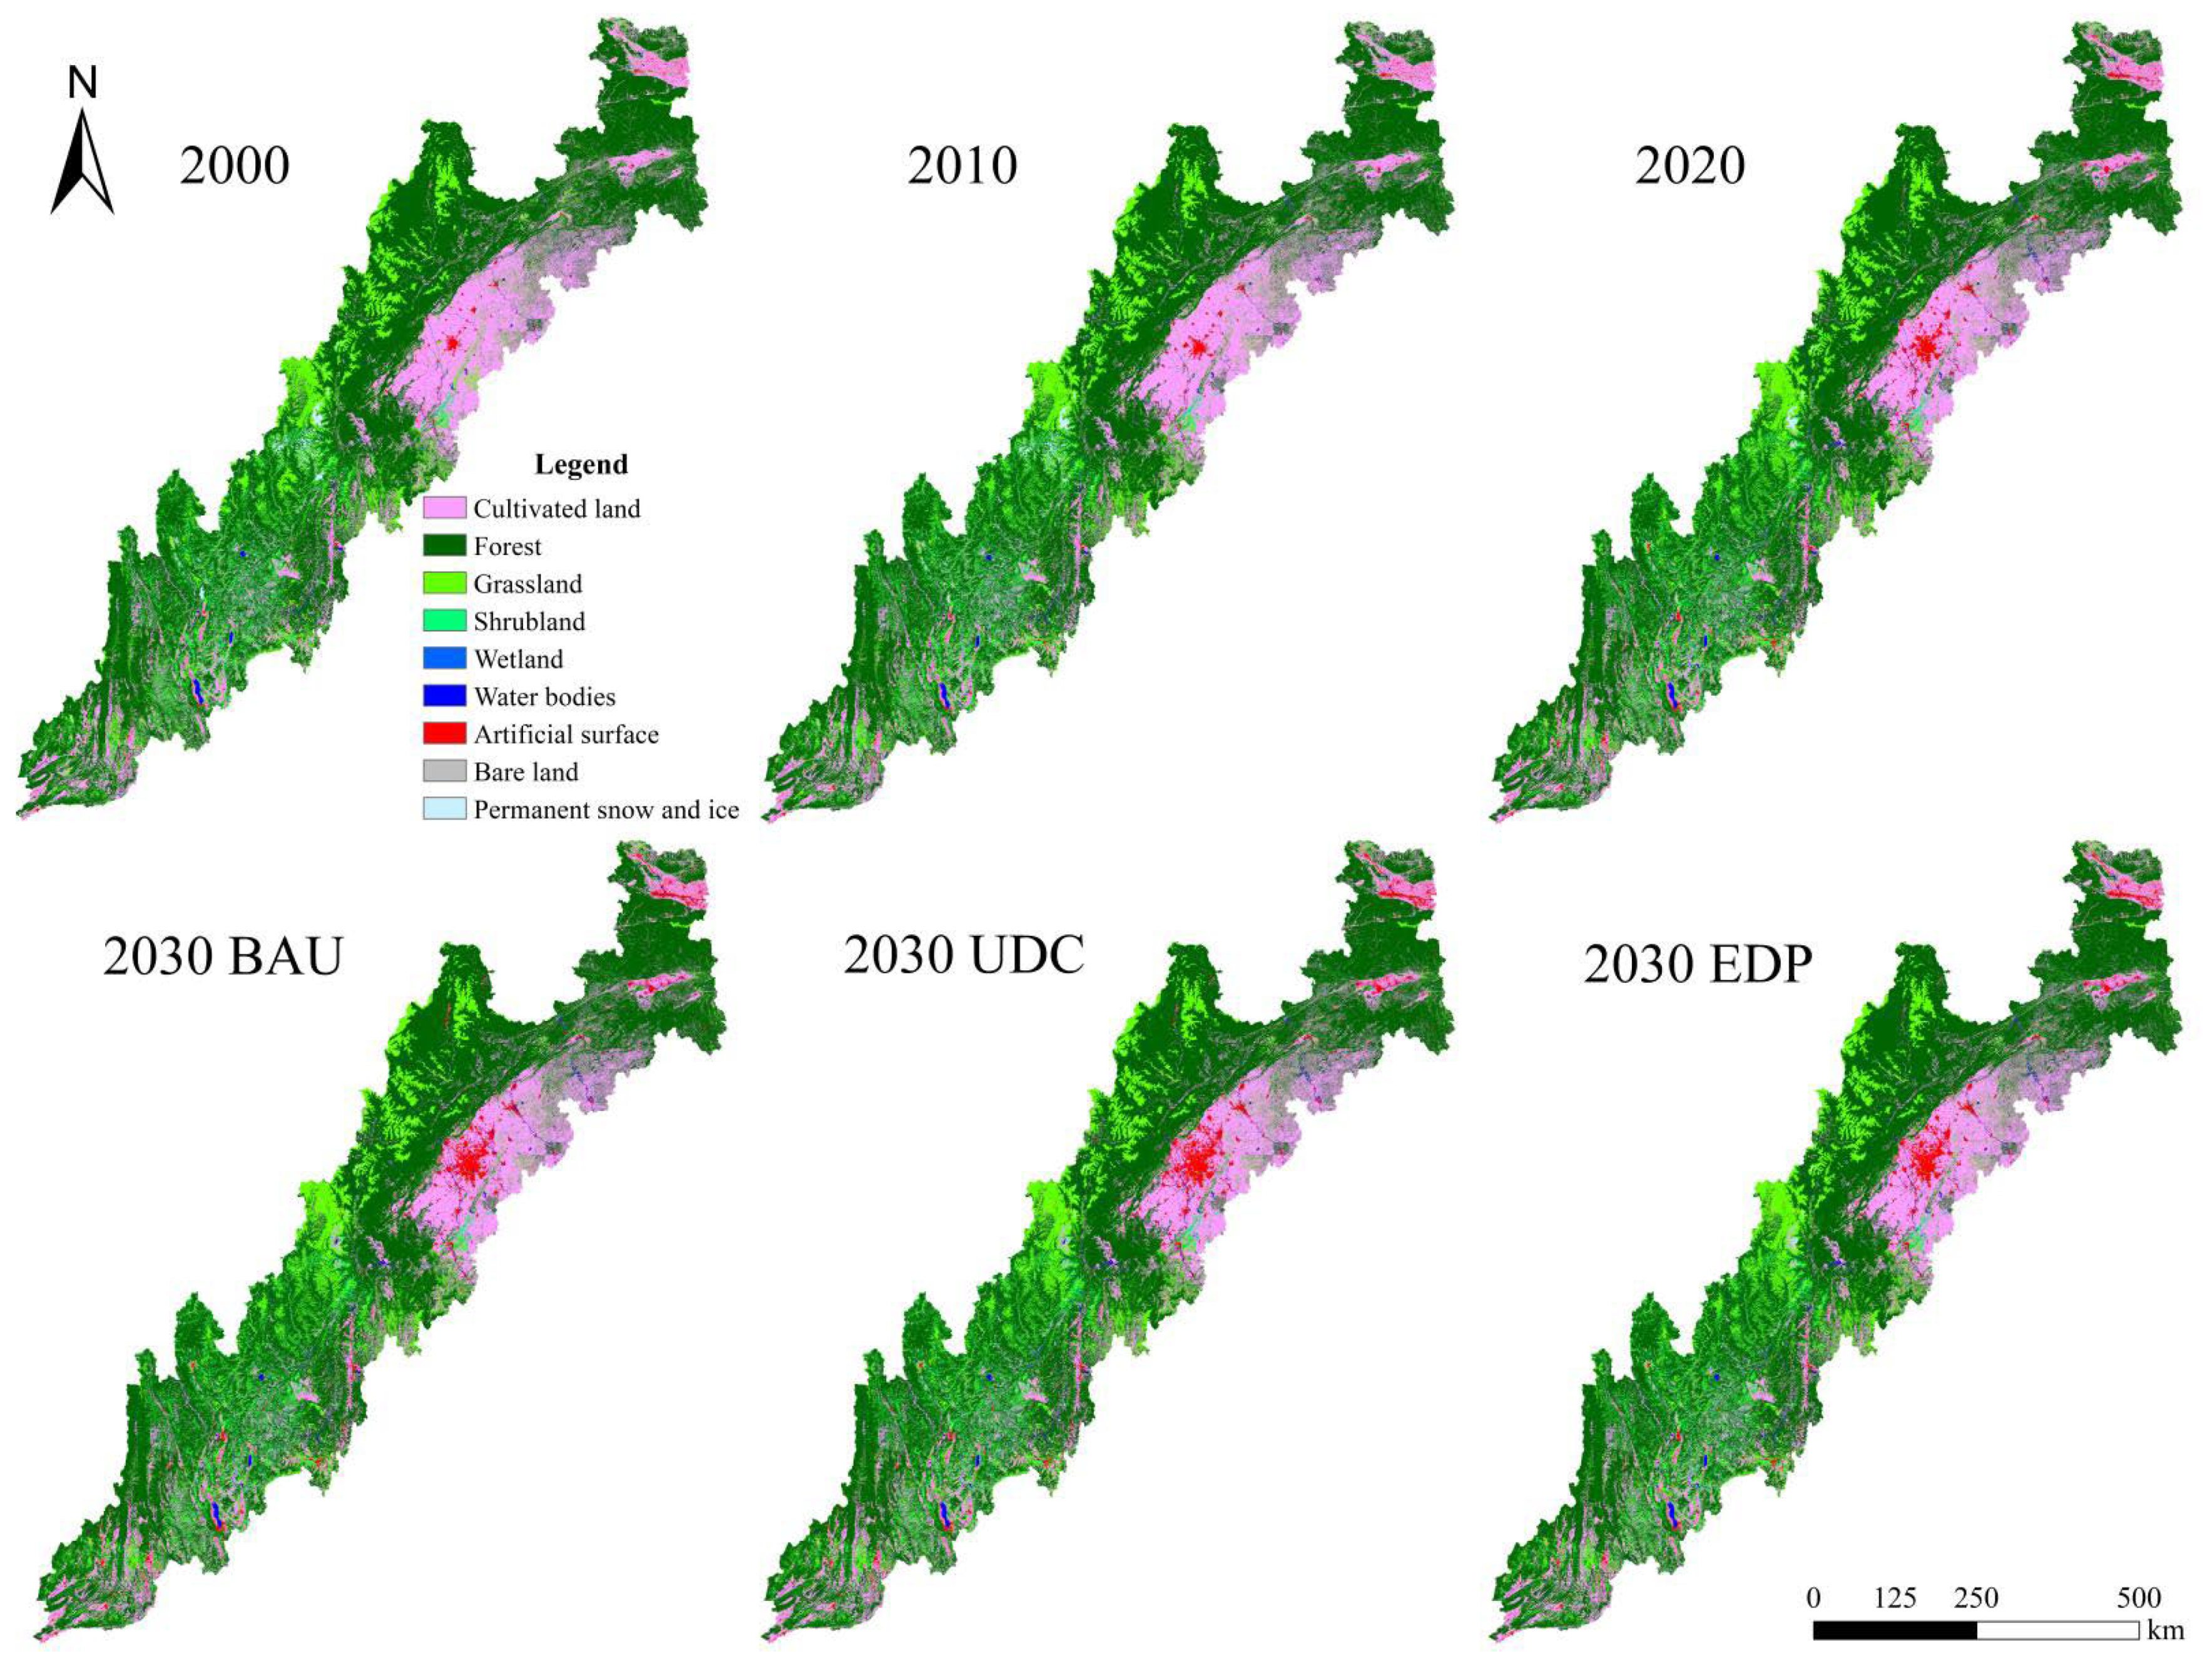
3.1. Land Use Change and Multi-Scenario Simulation

The land use change over the last 20 years has shown a reduction in forests, cultivated land, and grassland, at 1939.71 km2 and 1598.09 km2, respectively. This accounts for 16.54% and 13.63% of the total change, respectively. The artificial surface showed a substantial increase of 145.86% in comparison with 2654.71 km2 in 2000. The areas of wetland, bare land and permanent snow and ice on other land types continued to decrease, with a reduction of 1.17%, 0.7%, and 9.98%, respectively. The areas of shrubland and water bodies increased slightly (Figure 2, Table 3). Based on the simulation of the BAU scenario, the major national project plan for ecosystem protection and restoration and urban construction in the western region are integrated. The UDC scenario and the EDP scenario are set. The land use changes under diverse scenarios in 2030 can be simulated using the PLUS model (Figure 2, Table 4). In comparison with current land use in 2020, the area of forest and cultivated land under the BAU scenario reduced the most to 1393.18 km2 and 1653.56 km2. Wetlands permanent snow, and ice decreased the most, with 27.82% and 46.41%, compared to 2020, respectively. The areas of water bodies, artificial surfaces, bare land, and grassland all increased by 18.43%, 40.03%, 20.36%, and 0.22%, respectively. The cultivated land area under the UDC scenario decreased by 2262.34 km2, and the forest land by 570.57 km2. In comparison with the other two scenarios, the area of cultivated land, forest, glacier, and permanent snow and ice decreased the most under the UDC scenario. This has the most substantial expansion of artificial surface, with continuous encroachment on cultivated land and forest, with an increase of 3169.47 km2 compared to 2020. Under the EDP scenario, the forest area decreased, but the reduction was lower than for the BAU and the UDC scenarios. The increase in the artificial surface in the EDP is much lower than for the BAU and the UDC scenario. The pressure on ecological lands such as forests, grasslands, glaciers, and permanent snow is reduced in the EDP scenario.

3.2. Land Use Change and Multi-Scenario Simulation

In the present study, the spatial interpolation of the LER index, based on the ordinary kriging interpolation method, was used to generate a 6-period LER distribution map [3,54]. The natural breakpoint method was adopted for classifying the LER values in 2020 into five types [55,56], namely low-risk areas (ERI ≤ 0.089), lower-risk areas (0.089 < ERI ≤ 0.097), medium-risk areas (0.097 < ERI ≤ 0.106), high-risk areas (0.106 < ERI ≤ 0.117), and the highest risk areas (ERI > 0.117).
Figure 3 shows how the Sichuan-Yunnan ecological barrier is dominated by medium ecological risk, lower ecological risk as well as the lowest ecological risk during 2000–2020. The total area of the three represents over 70% of the total area for this risk level. The highest risk and lowest risk areas are in the northeastern and northwestern parts of the research region. The medium risk level is widely distributed and is predominantly in the southern part of the research region. The higher risk section is in the southeastern part of the research region, distributed around the highest risk area of the Chengdu Plain. The associated lower-risk area is distributed around the lowest-risk area. The dynamic transfer pattern of risk levels is manifested by the shift of lower risk to lowest risk, medium risk to lower risk, and higher risk to medium risk. This contributes to the reduction in the ecological risk level. In accordance with the three set scenarios, the spatial distribution patterns of LER levels from the simulations are mapped with the spatial distribution of LER levels being plotted (Figure 4). Compared to 2020, the highest risk area and higher risk area enhanced for all three scenarios. The UDC scenario had the highest growth, with 3341.13 km2 and 2684.85 km2, respectively. The lowest risk area and lower risk area in the BAU and EDP scenarios decreased compared with 2020. The EDP scenario had the highest reduction. Encompassing the three scenarios, the spatial distribution patterns for risk levels in the BAU and EDP scenarios are the most similar. The lowest ecological risk areas in Ya’an City and Aba Tibetan and Qiang Autonomous Prefecture in the northwest are more extensive than in the UDC scenario. The medium-risk areas in the central and southern parts become lower, higher, and highest-risk areas in the UDC scenario for smaller areas. In comparison with the EDP scenario in the BAU scenario, the highest risk level and higher risk level areas are in the Chengdu Plain. These are mainly artificial surfaces, which are reduced compared to the natural development scenario, with the lowest risk area in the north. This has expanded, accompanied by the reduction in the lower risk area.

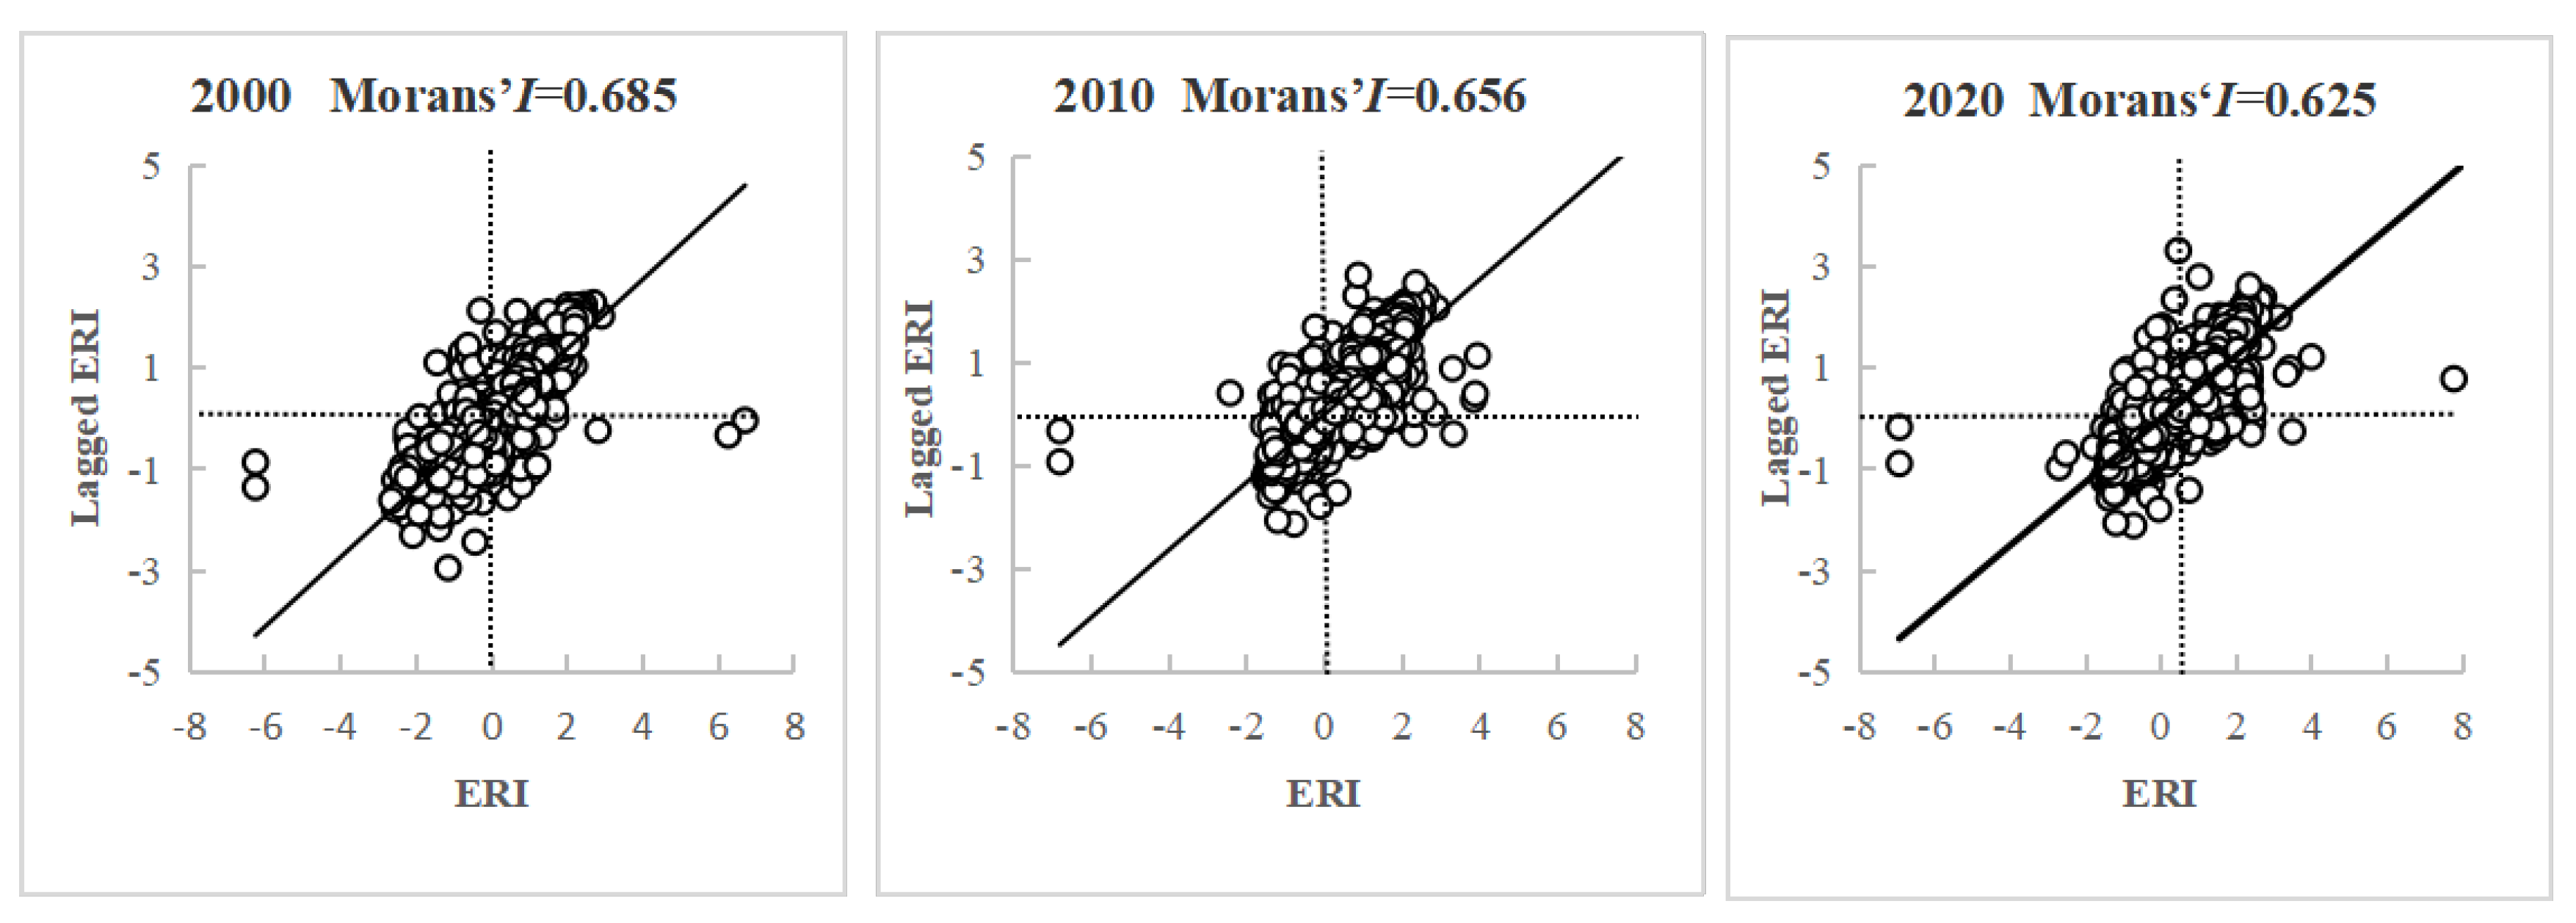
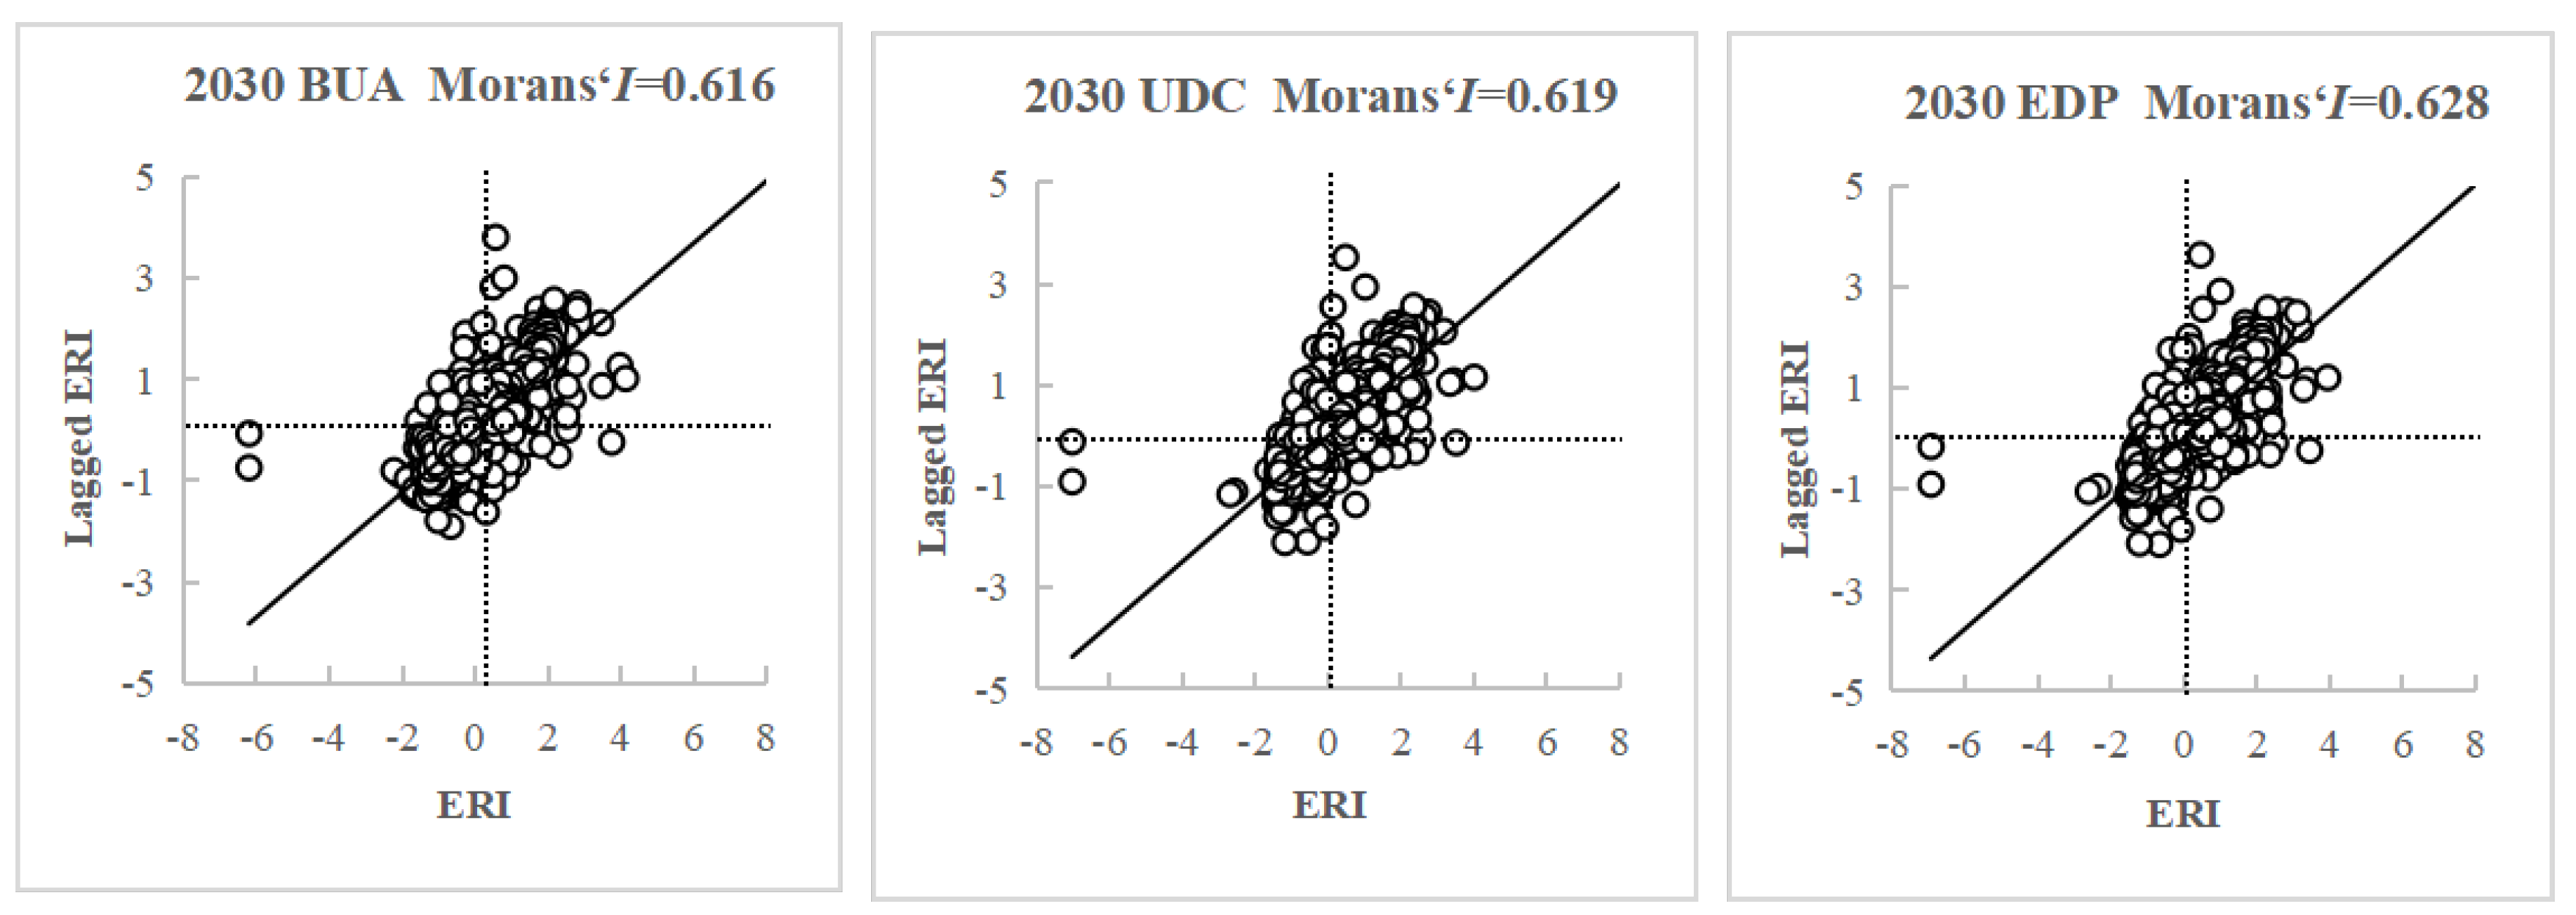
3.3. Spatial Auto-Correlation Analysis of Landscape Ecological Risk

The Moran’s I index of LER in 2000, 2010, 2020, and 2030 in the Sichuan-Yunnan ecological barrier area were 0.685, 0.656, 0.625, 0.616, 0.619, and 0.628, respectively. They were all greater than 0 (Figure 5 and Figure 6). This also indicates that the values of the LER attributes for the neighboring spatial units in the study area have a high degree of similarity and a strong positive correlation. There is a strong spatial clustering effect. The Moran’s I index showed a reducing trend over the last 20 years. This suggests that the degree of spatial aggregation for ecological risks and the degree of spatial similarity in the research region progressively reduced with changing land use. The Moran’s I value for all three scenarios in 2030 are lower than for the historical period. This suggests that the degree of ecological risk clustering in the research region landscape will be further reduced over the next ten years. The Moran’s I index of the EDP scenario has the highest correlation and the strongest spatial clustering of future ecological risks. The BAU scenario has the lowest and the least pronounced spatial clustering.

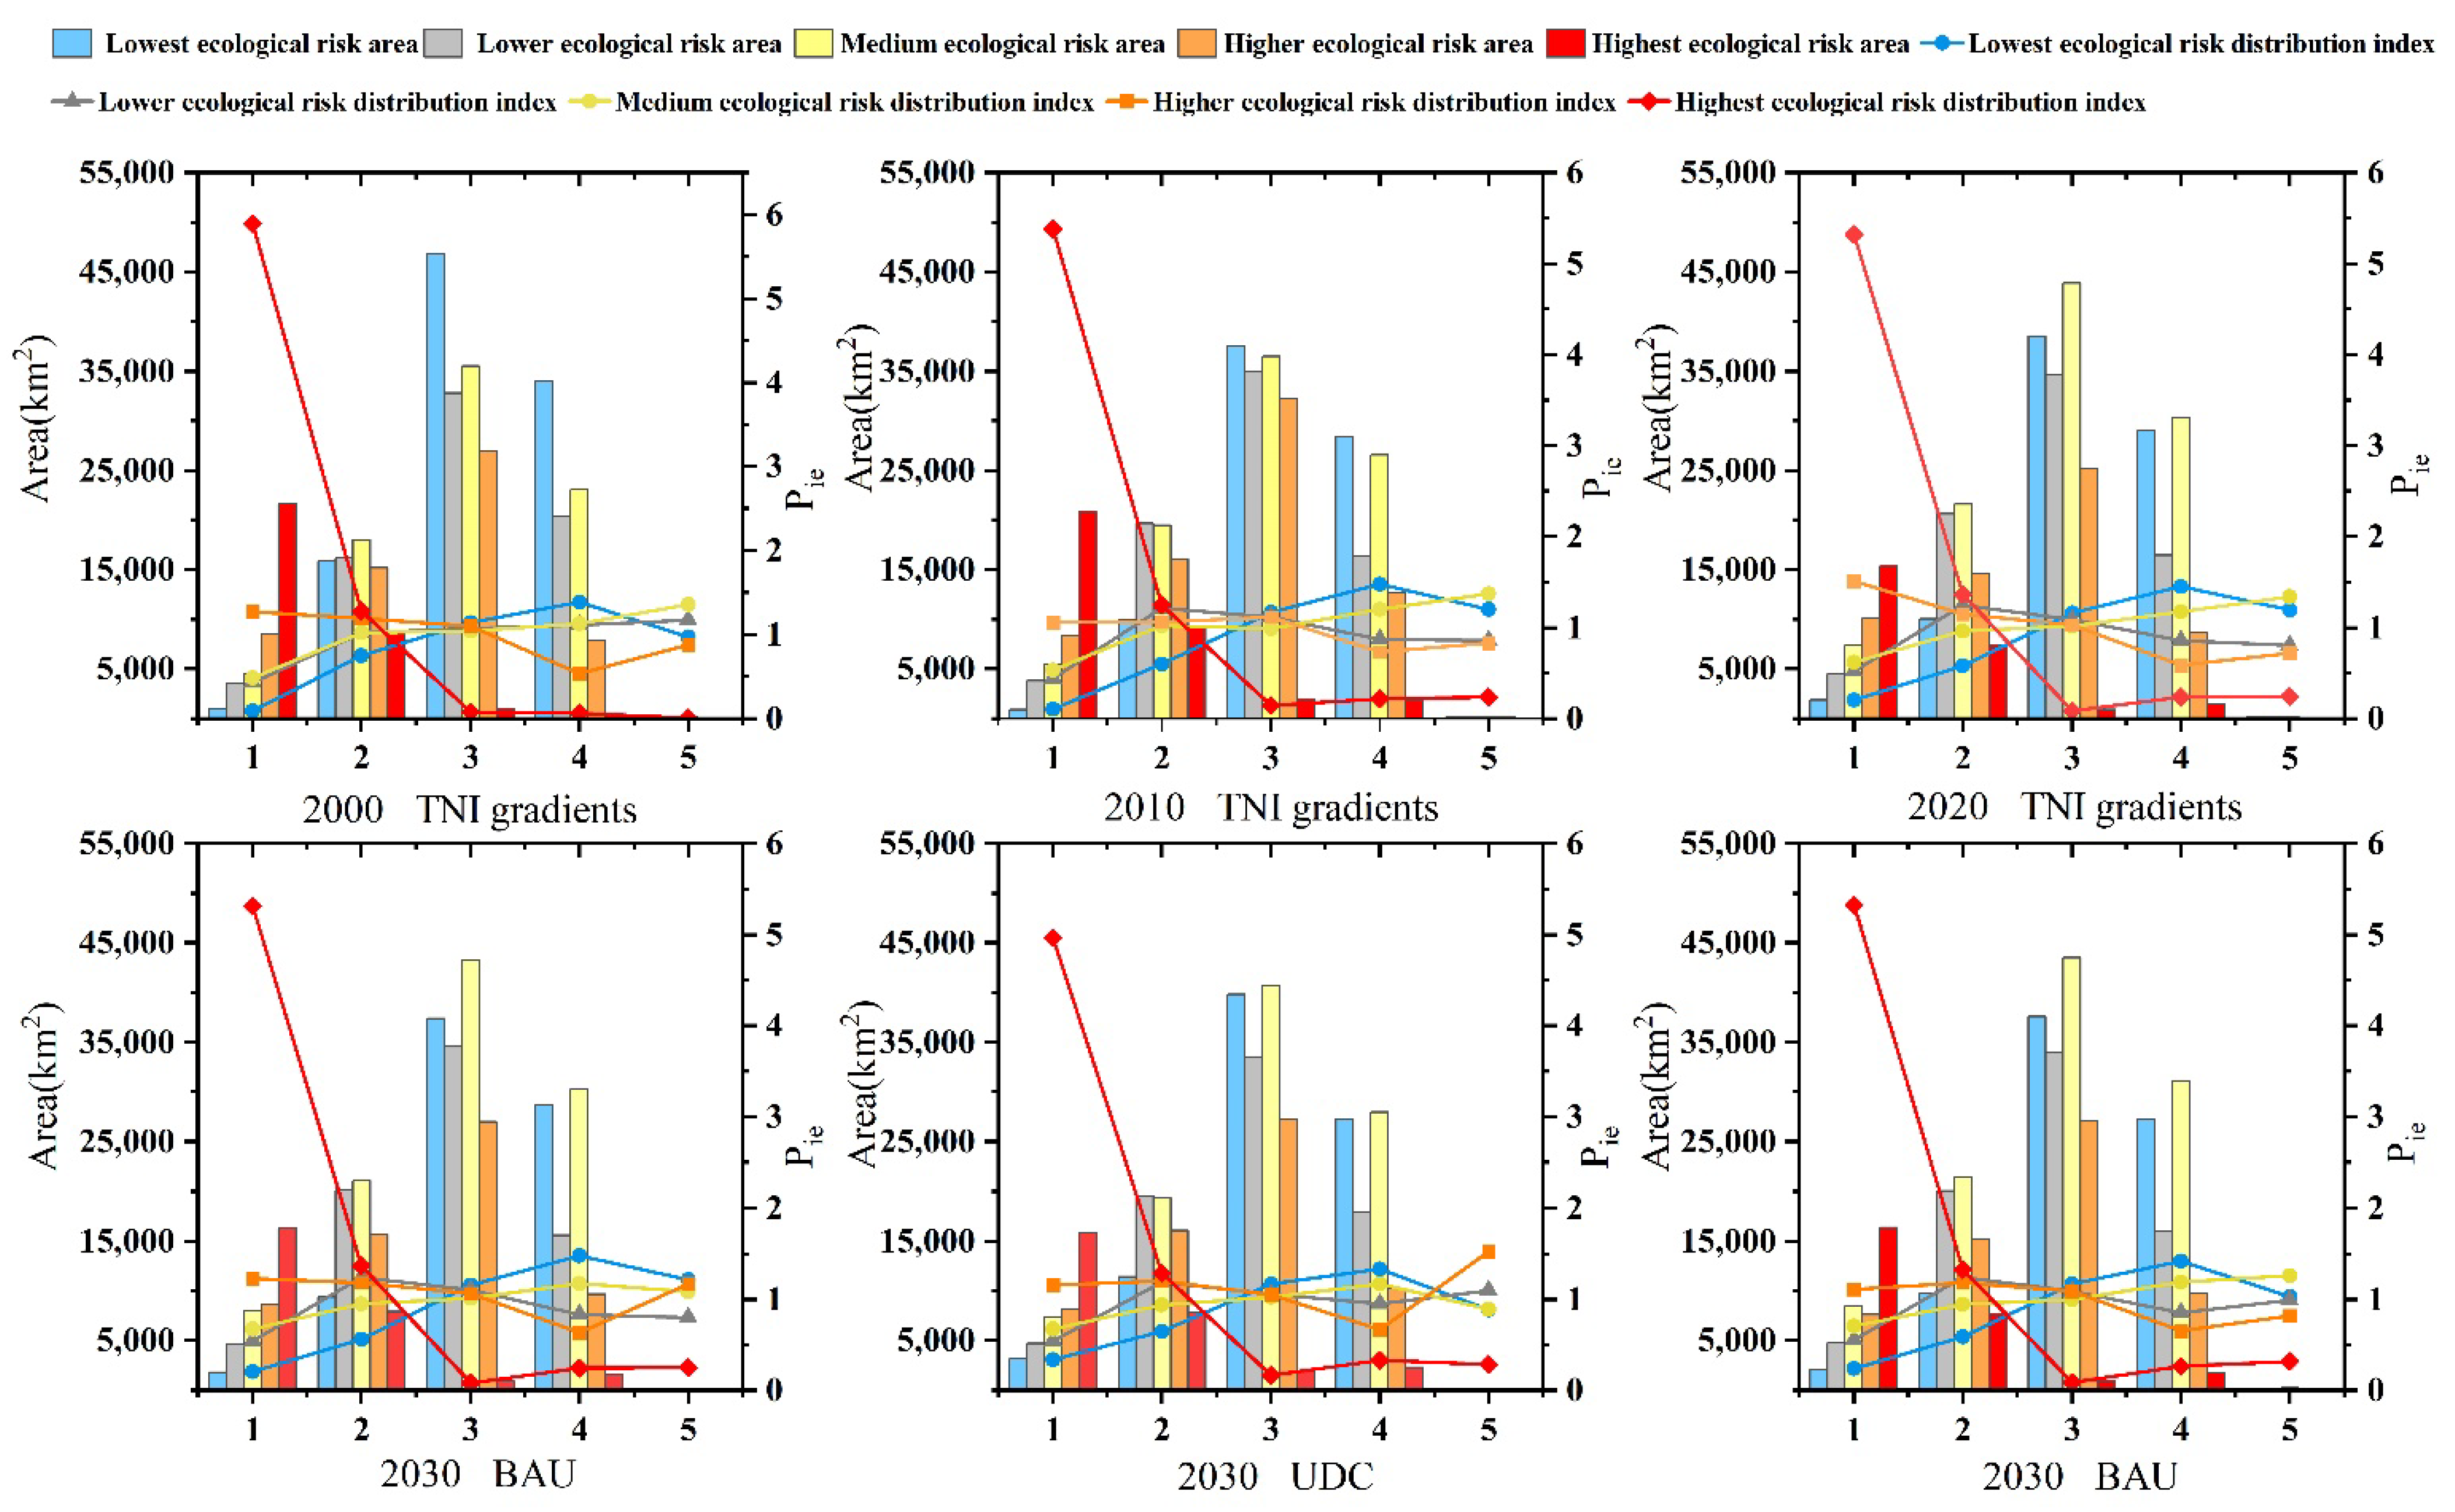
3.4. Effect of Terrain Gradient on Ecological Risk in the Landscape

To reveal the spatial heterogeneity of the LER under the influence of terrain gradient, the LER was superimposed with the terrain position. The area of LER classes was then counted for different terrain gradients and their distribution index. The equal spacing grading method (0.3) was used to classify the TNI values into five categories for analysis [57]. The results are shown in Figure 7. The highest risk classes for the three periods had a clear peak for the first gradient and were dominant. This also indicates that the higher-risk classes are more selective for the lowest terrain and are more likely to occur on the lowest gradients [49]. Lower-risk classes and medium-risk classes dominate for the fourth and fifth gradients. The lower-risk classes shift to low gradients over time, decreasing from the fifth to the second gradient. Higher risk classes dominate on the first gradient in 2000 and 2020. The higher-risk classes also dominated the third gradient in 2010. The higher-risk level dominated the level-three gradient in 2010. The trends in LER levels with the terrain gradients are similar for the three future scenarios. The lowest, lower, and highest risk levels dominate the 4th, 2nd, and 1st gradients, respectively. When compared with the BAU and UDC scenarios, the distribution index for the intermediate-risk level for the EDP scenario increased with the terrain gradient and became dominant on the fifth level. The intermediate risk for the BAU and the UDC scenario became dominant on the fourth level gradient but started to decrease at the fifth level gradient. The dominant distribution of the higher risk levels on the gradients of the three scenarios significantly differed. The UDC scenario dominated the fifth gradient. The BAU scenario dominated the first gradient, and the EDP scenario dominated the second gradient.

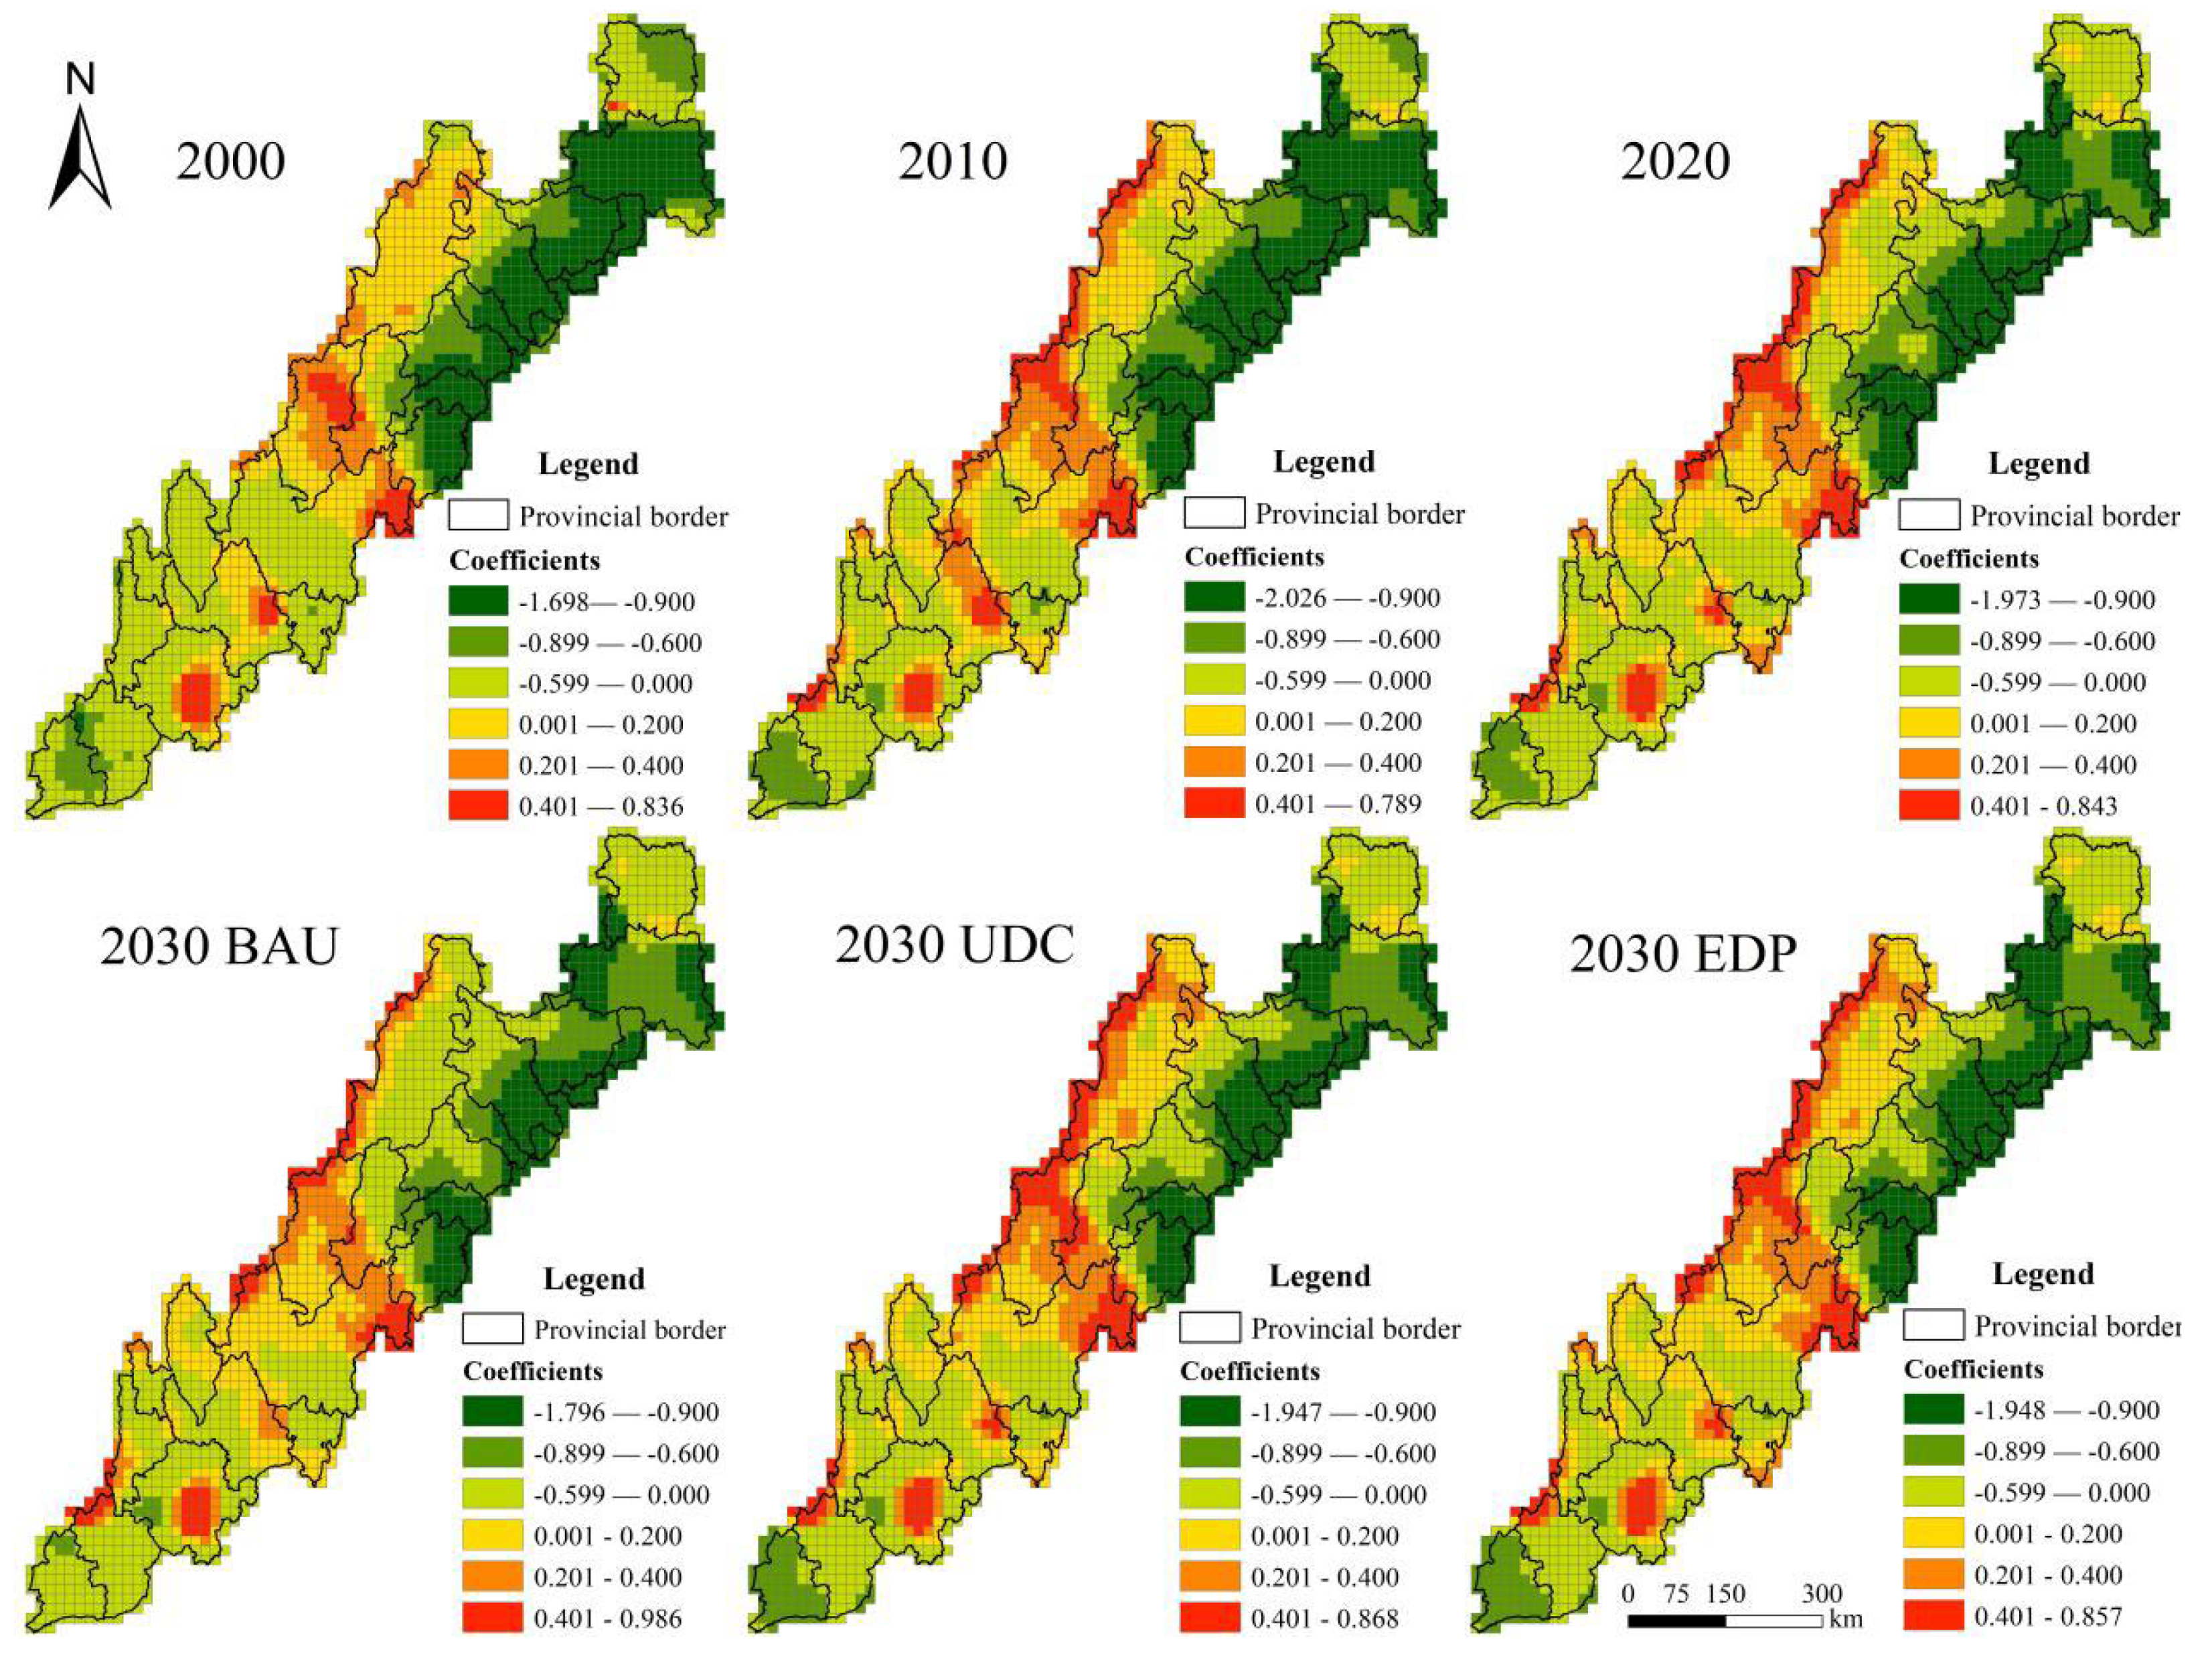
3.5. Response of Landscape Ecological Risk to Terrain Gradients

The MGWR model was used for analyzing the LER spatial response with the change in terrain gradient. Figure 8 shows that the response of LER to gradient changes in the Sichuan-Yunnan ecological barrier has apparent spatial variability and shows both positive and negative correlations in space. Regions with high positive correlations are concentrated in the high-gradient areas of Ganzi, Aba, and northeastern Liangshan. Regions with high negative correlations are concentrated in the low-gradient areas of Hanzhong, Dehong, and the Chengdu Plain. The degree of correlation between the two changed with time in the local areas. The positive correlation coefficient increased from 0 ~ 0.2 to 0.2 ~ 0.4 in the western region of Aba from 2000 to 2010. The positive correlation coefficient in northern Ganzi was enhanced by one interval. The correlation in northern Lijiang, at the junction with Liangshan and Diqing, changed from negative to positive and low to high. The correlation in northwestern Baoshan at the junction with Nujiang changed from negative to significantly positive. The regions with the highest positive and negative correlations from 2010 to 2020 both decreased. Regions with the highest reduction in positive correlations are concentrated in northeastern Lijiang and the junction with Diqing in Liangshan in the higher gradient terrain. The regions with the highest reduction in negative correlations are concentrated in Hanzhong and Chengdu Plain in the lower gradient terrain t. Compared with the three scenarios for 2030, the spatial patterns of ecological risk response to gradients were similar for the UDC and EDP scenarios. The differences were mostly in the central and northern parts of the research region. Under the EDP scenario, there is a small expansion in the negatively correlated area at the periphery. There is also a small contraction in the positively correlated area. There are significant spatial differences between the BAU and the other two scenarios, with a significant expansion of the negative correlation area under the BAU scenario in the Aba region. The positive correlation area shrinks, and the correlation weakens in the Ganzi region.

4. Discussion

4.1. Reasons for Changes in Landscape Ecological Risk

In the research region, the level of ecological risk for the Sichuan-Yunnan ecological barrier showed little change. The ecological risk for the Sichuan-Yunnan ecological barrier is in line with the following two stages: From 2000 to 2010, the overall risk index for the study area has been enhanced. The highest risk index was observed in 2010, with the high-risk areas concentrated in the Chengdu plain area (Figure 3). This is due to large-scale urban sprawl from high-intensity human activities. The expansion of urban land is mostly based on the encroachment of cultivated and forest land [58,59,60]. This has led to the fragmentation of the landscape. The construction of high-density transportation networks, low-density urban development, and agricultural production activities will lead to the fragmentation of urban space [61]. The excessive expansion of built-up areas will severely damage the urban fringe farmland, forests, and protected areas. This reduces the natural ecosystem stability of the urban periphery and increases the LER [62,63]. The LER caused by transforming ecological land, such as cultivated land, forest, and grassland, to artificial surface during urban development cannot be avoided and eliminated [64]. With the further promotion of national ecological civilization construction, the average risk for the study area from 2010 to 2020 has decreased. The project of Natural Forest Protection (NFP) (launched in 1988) and the Returning Farmland to Forest Program (RFFP) (launched in 2000), the comprehensive management of soil erosion and stone desertification, and a series of other projects have been implemented effectively [65,66]. The ecological stability of the Sichuan-Yunnan ecological barrier, with a landscape structure of forest, grassland, and cultivated land, has improved. The rapid increase in the urbanization level and intensive urban developments have made urban land denser. Urban planning gradually improves sustainable development landscape, reducing the ecological risk index.
For future LER prediction, the land conversion probability is higher under the UDC scenario. Further changes in land use patterns enhance the risk level for multiple categories under this scenario. This increases the areas that are categorized as highest risk and higher risk. The volatility of ecological risk from urban development is of substantial concern. The potential for ecological risk may obtain the lowest values after urban development has reached a mature stage. Ecological connectivity and ecological resilience are progressively enhanced, with the impact of ecological risk from changes in ecosystem function needing to be further investigated [67]. The BAU scenario should mitigate the loss of soil nutrients and water due to the high erosion potential of the complex mountain environment. This should further mitigate the destruction of biodiversity, and the uneven distribution of water and heat resources, due to vertical zonality [68]. The development of cultivated land resources in ecologically fragile areas is conducted by adjusting the agricultural production methods to alleviate the pressure of ecological risks in the landscape. The structure and function of the ecosystem are therefore optimized. With the EDP scenario, the area of lowest risk and lower risk areas is reduced the most. The expansion of land in built-up areas slows down significantly, reducing the pressure on all types of land. Effective protection of cultivated land and ecological roles are important issues to be addressed under the EDP scenario. The ecological development model under this scenario is consistent with the functional positioning of the Sichuan-Yunnan ecological barrier.

4.2. Effects of Terrain Gradient on Landscape Ecological Risk

Different terrain features determine land use patterns and vegetation community distribution, as highlighted in the heterogeneous characteristics of landscape spatial patterns [69]. The Sichuan-Yunnan ecological barrier has high terrain undulation, rich vegetation resources, and clear vertical zonation [28]. This makes the LER present a more complex distribution, characteristic of the terrain change. The highest risk and higher risk class distribution indices dominate on the first terrain gradient (Figure 7). This reflects the human activities in the Sichuan-Yunnan ecological barrier area, which function as the main external factor for the change in LER with the terrain. To satisfy the demands of production, the land use pattern and landscape pattern for the research region have been substantially altered. The most prominent is the large increase in the artificial surface area in 2020 (Table 3). This has substantially reduced grassland and cultivation landscapes on the most human-inhabitable low terrain gradient. There has been a substantial transformation in the native landscape type and a deterioration in the landscape structure and stability. This has resulted in an abnormal increase in the ecological risk index for the first terrain gradient. The lowest risk level dominated the fourth gradient, and the distribution index was greater than one. Since the area has a relatively high elevation and is not easily disturbed by human activities, the transformation between landscape types is infrequent. It is also dominated by forest and grassland, making the landscape structure more stable. The strong investment in ecological engineering for the national ecological barrier area has effectively restored the vegetation cover in the high-altitude region. The study area belongs to a typical agropastoral interlacing zone and has had long-term deforestation, steep slope reclamation, overgrazing, and other unsustainable land development methods, combined with the fragility of the ecological mountain environment [70]. The cumulative hazardous effects on the ecological components gradually emerge over time, making the medium ecological risk distribution index rise with the gradient and dominate the 5th gradient. There are possible dramatic changes for this gradient for ecological risk at high elevations due to global warming and the reduction in glaciers with different degrees of surface runoff [71]. The medium-risk area has the largest proportion (Figure 3 and Figure 4) and is less ecologically stable. This can have a pronounced effect on the overall ecological risk. The ecological risk for the landscape in the future for the research region is progressively lowered by human activities. The abandonment of cultivated land, the reduction in biodiversity, and the restoration and management of vegetation after the return of farmland to forest become the key factors affecting ecological risk. Under the UDC scenario, attention should be focused on the adjustment and optimization of the vegetation structure on the fourth gradient, where forest and grassland are concentrated. In the EDP scenario, the focus should be on the elevated risk of a glacier and permanent snow recession for the fifth gradient.
The response of ecological risk for the different terrain gradients was spatially variable (Figure 8). In highland areas such as Ganzi and Aba, with a more concentrated distribution of forests and grasslands, there are significant gradient changes in vegetation due to large vertical height differences. This indicates a significant positive correlation between ecological risk with the increasing gradient. The occurrence of ecological risk is closely related to human activities in Hanzhong, Dehong, and the Chengdu plain areas, which experience extensive economic activities owing to a larger population compared with that prevailing in rugged terrain with large vertical height differences. Since 2000, development has attracted a large amount of capital, several experts, and much technology in the western region. This has made urban expansion in the western region faster than that observed in the eastern region thus, speeding up the expansion of construction land [72]. The sensitivity of the ecological risk is influenced by terrain gradient increases during 2000–2010. In this period, which represents the early stages of the RFFP [73], the forested landscape was developed without sufficient natural renewal [74]. This influenced the ecological risk more significantly due to the terrain. During 2010–2020, the ecological risk was reduced by the terrain gradient, as well as in the northeast of Lijiang and the junction of Diqing in Liangshan, where the positive correlation is weakened. Likely due to the RFFP project, the natural landscape has reached a stable state and is weakened by the influence of complex terrain. Ecosystem function has improved and gradually weakened by the influence of the complex terrain. In the Hanzhong and Chengdu plains, where the negative correlation has become less pronounced, the land use structure has further improved due to the stable development of urbanization and the urban development pattern focusing more on green development [75], making the ecological risks in the plains weakened by terrain. The influence of terrain gradient on LER in the future Sichuan-Yunnan barrier remains important. The shift in the association of ecological risk for diverse scenarios in local areas reflects the importance of adjusting the land use structure in mountainous areas in accordance with the local conditions, as well as optimizing the allocation of land resources.

4.3. Policy Impact of Regional Development

In the past 20 years, the Chinese government has established a national ecological space control system focusing on nature reserves and ecological protection red lines, supplemented by key ecological function areas, and important ecological spaces have been strictly protected, during which the national ecological security barrier zone has been constructed to effectively maintain and safeguard ecological security [76]. However, it is found that, as an important area for national ecological security maintenance, the expansion of urban built-up areas in the Chuan-Yunnan ecological barrier zone poses a certain threat to the stability of the natural ecosystem in the surrounding areas, which makes the landscape ecological risk rise subsequently, and both high risk and higher risk levels are dominated in the low terrain gradient most suitable for human habitation, and human activities become the main disturbing factor for the change of landscape ecological risk with topography. Therefore, it becomes imperative to adhere to the principle of ecological priority, optimize the landscape structure, and promote the coordinated development of the economy and ecology [77]. In the “Outline of planning for national key ecological function reserves”, it is proposed that strengthening the construction of ecological function reserves is an effective way to promote the coordinated economic, social, and environmental development of important ecological function areas in China. The “National main functional area planning” also further clarifies that development must be based on protecting good natural ecology, and development must be based on environmental capacity to achieve harmonious coexistence between humans and nature.
In future research area development and policy formulation, the complexity of natural geographic units and the comprehensive characteristics of ecological and economic elements should be combined, and based on safeguarding the ecological functions of ecological barrier areas, effective monitoring should be implemented for high-risk areas subject to obvious human activities, ecosystem management, and restoration should be continuously promoted, and ecosystem management strategies should be proposed according to local conditions. In maintaining the synchronization of environmental protection and economic development, we focus on optimizing the regional development pattern, reasonably allocating ecological, living, and production spaces, and reducing the negative effects of human development on the ecological environment [78]. On the other hand, the landscape ecological risk assessment with land use change as the causal factor is incorporated into the land use planning process, the unique natural conditions and landscape pattern characteristics of mountainous areas are recognized, land macro-control is strengthened, land use optimization and improvement are systematically carried out, the level of land protection and intensive use is improved [79], and different ecological restoration measures and intensities are applied to different vegetation areas to achieve ecosystem function Maximization [80], to attenuate the sensitivity of topographic gradients to ecological risk impacts.

4.4. Limitations and Future Research

In line with the specificity of the terrain in the research region, the effect of terrain gradient on ecological risk evolution is explored [81]. The response of LER to the terrain gradient is further examined in risk evolution and future prediction. This is more likely to portray the spatial heterogeneity of ecological risk in the research region landscape in a multidimensional way [82]. However, there are still some limitations. The ecological risk can be analyzed according to land use change. This emphasizes the influence of human factors using the “landscape loss and risk probability” assessment paradigm. It constructs a comprehensive index of LER based on landscape disturbance and vulnerability. The ecological risk construction takes into account the area ratio of landscape types, ignoring the tolerance of ecological loss and the possibility of future ecological risk [7,48]. In future studies, it is necessary to introduce a more extensive characterization of the anthropogenic disturbance factors, such as pesticide use, fertilizer input, water pollution, and soil quality, for evaluation [83]. It is essential to integrate the value of ecosystem services into the quantitative characterization of risk loss and determine the risk threshold in combination with ecological models. This is necessary to achieve the goal of LER prevention and mitigation, integrating human activities as well as natural processes. The study combined multi-contextual simulations aimed to provide support for the accuracy of LER probability prediction under different governmental decisions. However, there is a possibility of uncertainty in the evaluation results due to the potential variation in governmental decision-making.

5. Conclusions

The research assessed and explored the spatial and temporal patterns of LER for the Sichuan-Yunnan ecological barrier from 2000 to 2020, based on a landscape ecological assessment model. Using a combination of the improved Markov and PLUS model, the dynamic evolution of LER were predicted under three scenarios in 2030. Spatial autocorrelation was used for identifying the spatial agglomeration state of ecological risks. The effects of the topographic gradient on LER were explored by further considering the constraining effect of topographic conditions on landscape distribution. The findings of the study are shown below:
(1)
The characteristics of land use change in the study area are the reduction in cultivated land, forests, and grasslands and the continuous increase in the artificial land surface. The future landscape types of forest, grassland, and cultivated land are relatively stable. The continued increase in artificial land surface under the UDC scenario comes from the encroachment of cultivated land and forest.
(2)
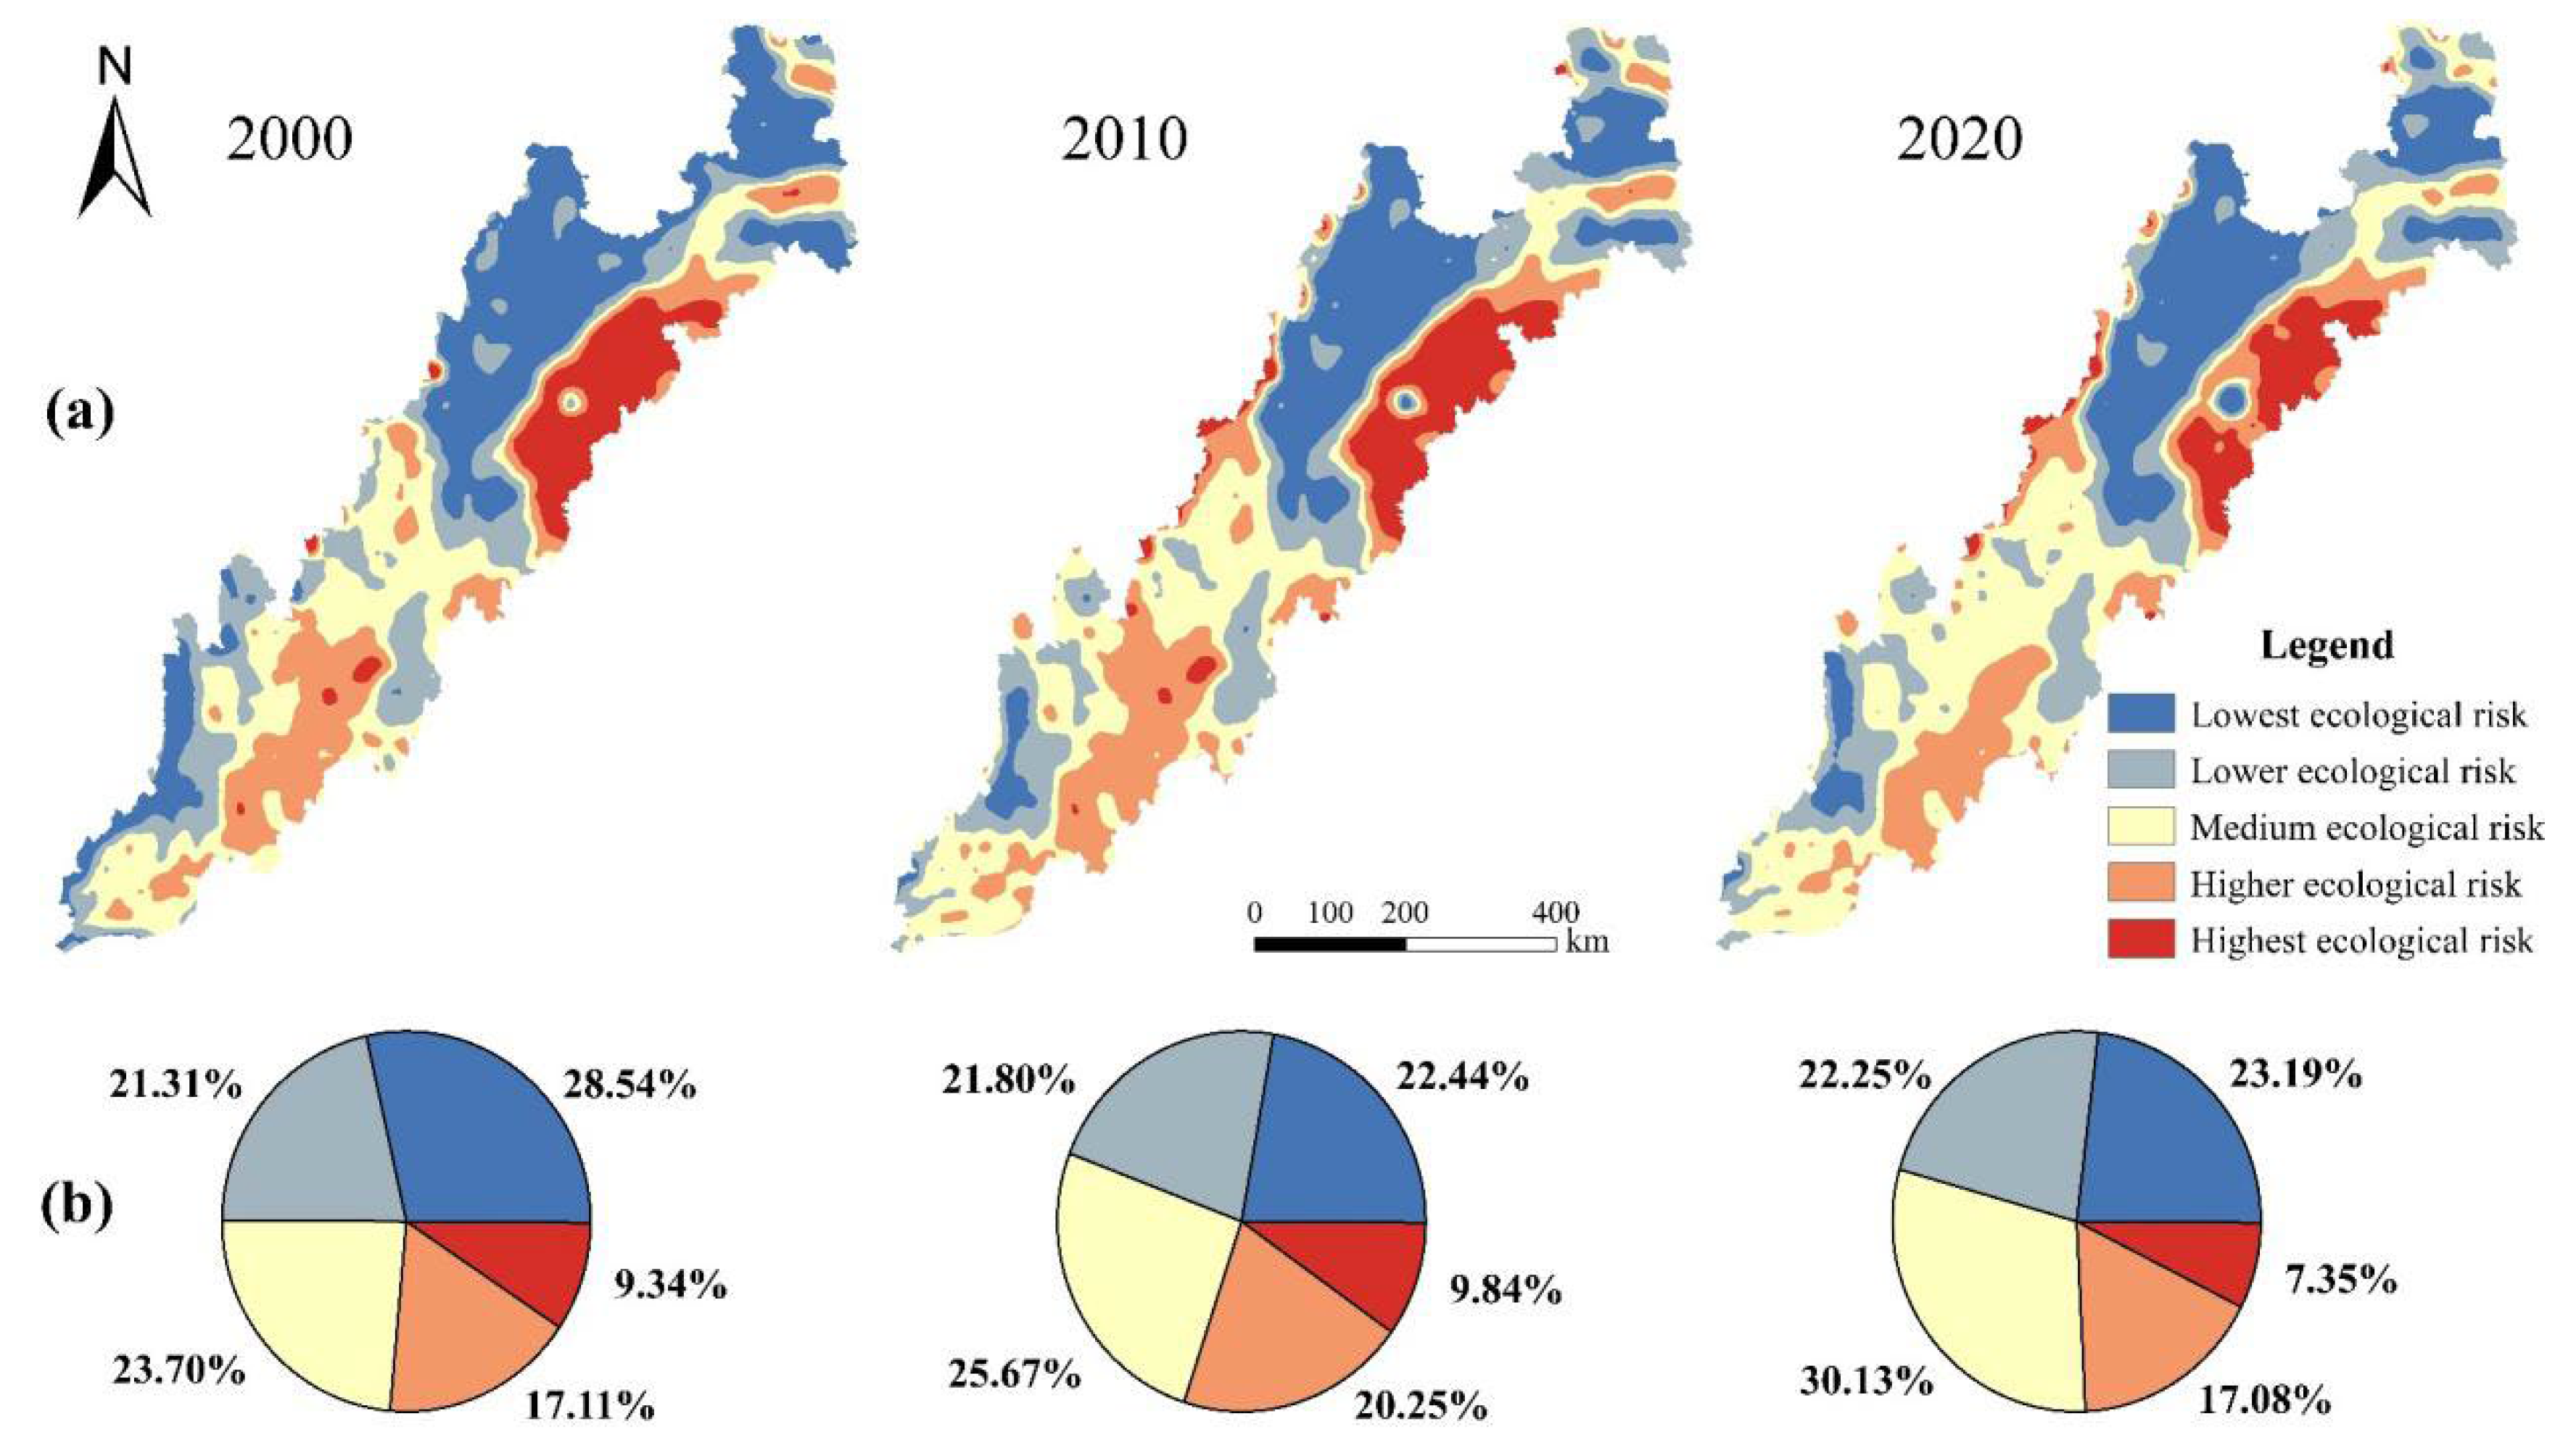
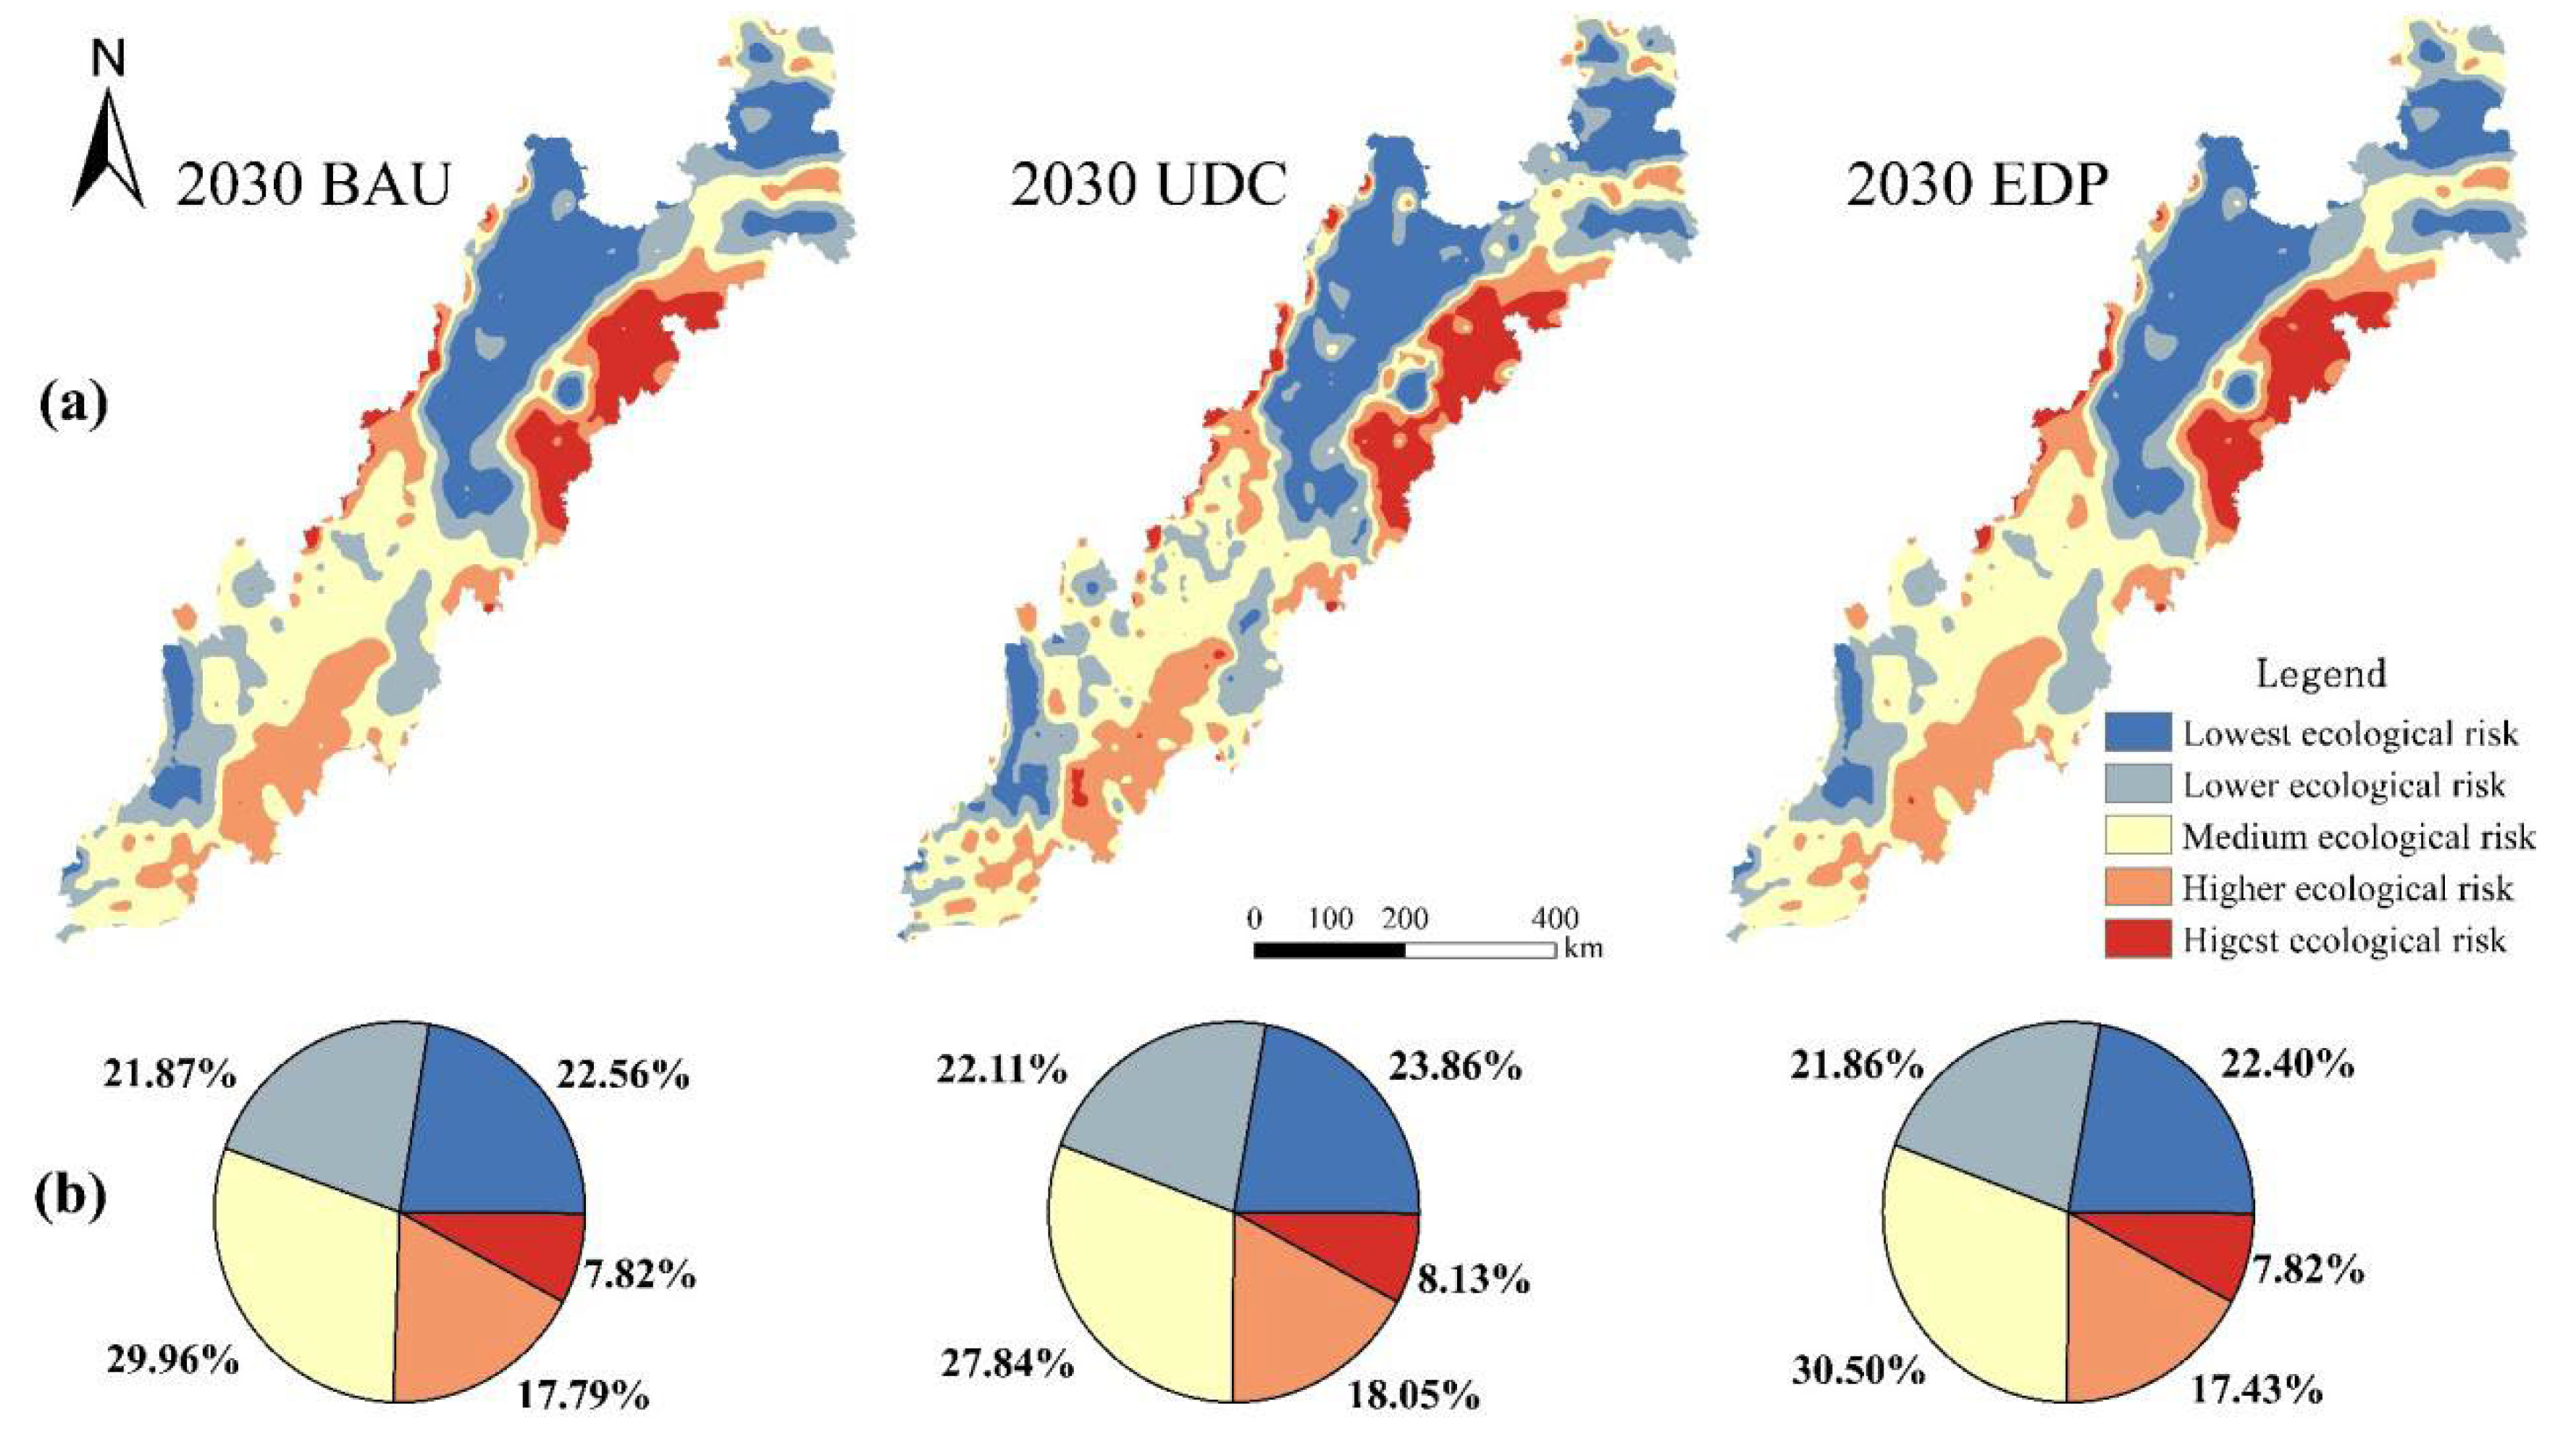
The overall risk index increased from 2000 to 2010. The highest-risk areas were concentrated in the Chengdu Plain, where human activities are concentrated on a large scale. The period between 2010–2020 saw a gradual improvement in ecological stability. The increasing highest risk and higher risk areas under the UDC scenario, and the resulting fluctuations in ecological risk, require urgent attention. The EDP scenario development pattern is more in line with the functional positioning of the ecological barrier of Sichuan and Yunnan.
(3)
The distribution index of high-risk classes on low-terrain gradients is greater than 4.9. The high-risk level has a strong selectivity for low terrain gradients, and human activity interference becomes the main external factor. The response of the LER to gradient changes is shown as follows: Areas with high positive correlation are concentrated in high-gradient areas, and areas with a high negative association are focused in low-gradient areas. The influence of terrain gradient change on the LER remains significant for the future. In addition, the response of the LER to terrain gradient change is stronger under the UDC scenario and EDP scenarios.
This study not only helps to actively address the uncertainty caused by complex topography and multi-policy regulation on the occurrence of future ecological risks but also provides important support for ecological restoration and sustainable development of important ecological functions, especially the conservation and management of ecosystems and effective prevention of ecological risks in other similar regions of the world.

Author Contributions

Conceptualization, B.G.; Data curation, B.G.; Formal analysis, B.G. and C.L.; Funding acquisition, Y.W. (Yingmei Wu); Investigation, K.Z. and Y.W. (Yan Wu); Supervision, Y.W. (Yingmei Wu); Validation, C.L. and X.F.; Writing—original draft, B.G. and Y.W. (Yingmei Wu); Writing—review and editing, C.L., K.Z. and Y.W. (Yan Wu); Data curation, B.G., M.W. and S.O. All authors have read and agreed to the published version of the manuscript.

Funding

This research was supported by the National Natural Science Foundation of China: 42101278; 41761037. Yunnan Normal University Graduate Research Innovation Fund Project: YJSJJ22-A20; YJSJJ22-B106.

Institutional Review Board Statement

Not applicable.

Informed Consent Statement

Not applicable.

Data Availability Statement

The data that support the findings of this study are available from the corresponding author upon reasonable request.

Conflicts of Interest

The authors declare no conflict of interest.

Abbreviations

LER, landscape ecological risk; PLUS, patch-generating land-use simulation; UDC, urban development and construction; BAU, business-as usual; EDP, ecological development priority; MGWR, multiscale geographically weighted regression; OLS, ordinary least squares; CA, cellular automata; FLUS, Future Land-use Simulation; TNI, terrain niche index.

References

  1. Manuel-Navarrete, D.; Gómez, J.J.; Gallopín, G. Syndromes of Sustainability of Development for Assessing the Vulnerability of Coupled Human-Environmental Systems. The Case of Hydrometeorological Disasters in Central America and the Caribbean. Glob. Environ. Chang. 2007, 17, 207–217. [Google Scholar] [CrossRef]
  2. Kidane, Y.; Stahlmann, R.; Beierkuhnlein, C. Vegetation Dynamics, and Land Use and Land Cover Change in the Bale Mountains, Ethiopia. Environ. Monit. Assess. 2012, 184, 7473–7489. [Google Scholar] [CrossRef] [PubMed]
  3. Xie, H.; Wang, P.; Huang, H. Ecological Risk Assessment of Land Use Change in the Poyang Lake Eco-Economic Zone, China. Int. J. Environ. Res. Public Health 2013, 10, 328–346. [Google Scholar] [CrossRef] [PubMed] [Green Version]
  4. Hou, M.; Ge, J.; Gao, J.; Meng, B.; Li, Y.; Yin, J.; Liu, J.; Feng, Q.; Liang, T. Ecological Risk Assessment and Impact Factor Analysis of Alpine Wetland Ecosystem Based on LUCC and Boosted Regression Tree on the Zoige Plateau, China. Remote Sens. 2020, 12, 368. [Google Scholar] [CrossRef] [Green Version]
  5. Wang, H.; Liu, X.; Zhao, C.; Chang, Y.; Liu, Y.; Zang, F. Spatial-Temporal Pattern Analysis of Landscape Ecological Risk Assessment Based on Land Use/Land Cover Change in Baishuijiang National Nature Reserve in Gansu Province, China. Ecol. Indic. 2021, 124, 107454. [Google Scholar] [CrossRef]
  6. Jin, X.; Jin, Y.; Mao, X. Ecological Risk Assessment of Cities on the Tibetan Plateau Based on Land Use/Land Cover Changes—Case Study of Delingha City. Ecol. Indic. 2019, 101, 185–191. [Google Scholar] [CrossRef]
  7. Cao, Q.; Zhang, X.; Lei, D.; Guo, L.; Sun, X.; Kong, F.; Wu, J. Multi-Scenario Simulation of Landscape Ecological Risk Probability to Facilitate Different Decision-Making Preferences. J. Clean. Prod. 2019, 227, 325–335. [Google Scholar] [CrossRef]
  8. Peng, J.; Dang, W.; Liu, Y.; Zong, M.; Hu, X. Review on Landscape Ecological Risk Assessment. Acta Geogr. Sin. 2015, 70, 664–677. [Google Scholar] [CrossRef]
  9. Cui, X.; Deng, W.; Yang, J.; Huang, W.; de Vries, W.T. Construction and Optimization of Ecological Security Patterns Based on Social Equity Perspective: A Case Study in Wuhan, China. Ecol. Indic. 2022, 136, 108714. [Google Scholar] [CrossRef]
  10. Zhang, Y.; Yang, Y.; Chen, Z.; Zhang, S. Multi-Criteria Assessment of the Resilience of Ecological Function Areas in China with a Focus on Ecological Restoration. Ecol. Indic. 2020, 119, 106862. [Google Scholar] [CrossRef]
  11. Watson, J.E.M.; Keith, D.A.; Strassburg, B.B.N.; Venter, O.; Williams, B.; Nicholson, E. Set a Global Target for Ecosystems. Nature 2020, 578, 360–362. [Google Scholar] [CrossRef] [Green Version]
  12. Hou, P.; Zhai, J.; Cao, W.; Yang, M.; Cai, M.; Li, J. Evaluation on Ecosystem Changes and Protection of the National Key Ecological Function Zones in Mountainous Areas of Central Hainan Island. Acta Geogr. Sin. 2018, 73, 429–441. [Google Scholar] [CrossRef]
  13. Li, S.; Liu, Y.; Yang, H.; Yu, X.; Zhang, Y.; Wang, C. Integrating Ecosystem Services Modeling into Effectiveness Assessment of National Protected Areas in a Typical Arid Region in China. J. Environ. Manag. 2021, 297, 113408. [Google Scholar] [CrossRef]
  14. Li, C.; Wu, Y.; Gao, B.; Zheng, K.; Wu, Y.; Li, C. Multi-Scenario Simulation of Ecosystem Service Value for Optimization of Land Use in the Sichuan-Yunnan Ecological Barrier, China. Ecol. Indic. 2021, 132, 108328. [Google Scholar] [CrossRef]
  15. Fan, J.; Wang, Y.; Zhou, Z.; You, N.; Meng, J. Dynamic Ecological Risk Assessment and Management of Land Use in the Middle Reaches of the Heihe River Based on Landscape Patterns and Spatial Statistics. Sustainability 2016, 8, 536. [Google Scholar] [CrossRef] [Green Version]
  16. Gong, J.; Yang, J.; Tang, W. Spatially Explicit Landscape-Level Ecological Risks Induced by Land Use and Land Cover Change in a National Ecologically Representative Region in China. Int. J. Environ. Res. Public Health 2015, 12, 14192–14215. [Google Scholar] [CrossRef] [Green Version]
  17. Zhang, F.; Yushanjiang, A.; Wang, D. Ecological Risk Assessment Due to Land Use/Cover Changes (LUCC) in Jinghe County, Xinjiang, China from 1990 to 2014 Based on Landscape Patterns and Spatial Statistics. Environ. Earth Sci. 2018, 77, 1–16. [Google Scholar] [CrossRef]
  18. Sun, D.; Youjia, L. Multi-Scenario Simulation of Land Use Dynamic in the Loess Plateau Using an Improved Markov-CA Model. J. Geogr. Inf. Sci. 2021, 23, 825–836. [Google Scholar] [CrossRef]
  19. Verburg, P.H.; Soepboer, W.; Veldkamp, A.; Limpiada, R.; Espaldon, V.; Mastura, S.S.A. Modeling the Spatial Dynamics of Regional Land Use: The CLUE-S Model. Environ. Manag. 2002, 30, 391–405. [Google Scholar] [CrossRef]
  20. Zeng, Y.; Wenping, J.; Wang, H.; Zhang, H. Simulation of Land-Use Changes and Landscape Ecological Assessment in Eastern Part of Qinghai Plateau. Trans. Chin. Soc. Agric. Eng. 2014, 30, 185–194. [Google Scholar] [CrossRef]
  21. Li, Y.; Huang, S. Landscape Ecological Risk Responses to Land Use Change in the Luanhe River Basin, China. Sustainability 2015, 7, 16631–16652. [Google Scholar] [CrossRef] [Green Version]
  22. Li, W.; Lan, Z.; Chen, D.; Zhijan, Z. Multi-Scenario Simulation of Land Use and Its Spatial-Temporal Response to Ecological Risk in Guangzhou City. Bull. Soil Water Conserv. 2020, 40, 204–210. [Google Scholar] [CrossRef]
  23. Zhang, J.; Ren, Z. Spatiotemporal Pattern and Terrain Gradient Effect of Land Use Change in Qinling-Bashan Mountains. Trans. Chin. Soc. Agric. Eng. 2016, 32, 250–257. [Google Scholar] [CrossRef]
  24. Andraski, B.J.; Jackson, W.A.; Welborn, T.L.; Böhlke, J.K.; Sevanthi, R.; Stonestrom, D.A. Soil, Plant, and Terrain Effects on Natural Perchlorate Distribution in a Desert Landscape. J. Environ. Qual. 2014, 43, 980–994. [Google Scholar] [CrossRef] [PubMed] [Green Version]
  25. Xue, L.; Zhu, B.; Wu, Y.; Wei, G.; Liao, S.; Yang, C.; Wang, J.; Zhang, H.; Ren, L.; Han, Q. Dynamic Projection of Ecological Risk in the Manas River Basin Based on Terrain Gradients. Sci. Total Environ. 2019, 653, 283–293. [Google Scholar] [CrossRef]
  26. Yan, J.; Li, G.; Qi, G.; Qiao, H.; Nie, Z.; Huang, C.; Kang, Y.; Sun, D.; Zhang, M.; Kang, X.; et al. Landscape Ecological Risk Assessment of Farming-Pastoral Ecotone in China Based on Terrain Gradients. Hum. Ecol. Risk Assess. 2021, 27, 2124–2141. [Google Scholar] [CrossRef]
  27. Ma, S.; Qiao, Y.P.; Wang, L.J.; Zhang, J.C. Terrain Gradient Variations in Ecosystem Services of Different Vegetation Types in Mountainous Regions: Vegetation Resource Conservation and Sustainable Development. For. Ecol. Manag. 2021, 482, 118856. [Google Scholar] [CrossRef]
  28. Fu, B.; Wang, X.; Feng, X. National Barrise Zone Ecosystem Services Assessment; Science Press: Beijing, China, 2017; ISBN 978-7-03-051704-3. [Google Scholar]
  29. Chen, J.; Ban, Y.; Li, S. Open Access to Earth Land-Cover Map. Nature 2014, 514, 434. [Google Scholar] [CrossRef] [Green Version]
  30. Xu, X. Spatial Interpolation Dataset of the Average Condition of Meteorological Elements in China. Resour. Environ. Sci. Data Regist. Publ. Syst. 2017. [Google Scholar] [CrossRef]
  31. Xu, X. Spatial Distribution of GDP in China with Kilometer Grid Dataset. Resour. Environ. Sci. Data Regist. Publ. Syst. 2017. [Google Scholar] [CrossRef]
  32. Stevens, F.R.; Gaughan, A.E.; Linard, C.; Tatem, A.J. Disaggregating Census Data for Population Mapping Using Random Forests with Remotely-Sensed and Ancillary Data. PLoS ONE 2015, 10, e0107042. [Google Scholar] [CrossRef] [Green Version]
  33. Chen, Z.; Yu, B.; Yang, C.; Zhou, Y.; Yao, S.; Qian, X.; Wang, C.; Wu, B.; Wu, J. An Extended Time-Series (2000–2018) of Global NPP-VIIRS-like Nighttime Light Data. Earth Syst. Sci. Data 2021, 13, 889–906. [Google Scholar] [CrossRef]
  34. Wang, J.; Bai, W.; Tian, G. Spatiotemporal Characteristics of Landscape Ecological Risks on the Tibetan Plateau. Resour. Sci. 2020, 42, 1739–1749. [Google Scholar] [CrossRef]
  35. Dale, V.H.; Kline, K.L. Issues in Using Landscape Indicators to Assess Land Changes. Ecol. Indic. 2013, 28, 91–99. [Google Scholar] [CrossRef]
  36. Ju, H.; Niu, C.; Zhang, S.; Jiang, W.; Zhang, Z.; Zhang, X.; Yang, Z.; Cui, Y. Spatiotemporal Patterns and Modifiable Areal Unit Problems of the Landscape Ecological Risk in Coastal Areas: A Case Study of the Shandong Peninsula, China. J. Clean. Prod. 2021, 310, 127522. [Google Scholar] [CrossRef]
  37. Mo, W.; Wang, Y.; Zhang, Y.; Zhuang, D. Impacts of Road Network Expansion on Landscape Ecological Risk in a Megacity, China: A Case Study of Beijing. Sci. Total Environ. 2017, 574, 1000–1011. [Google Scholar] [CrossRef] [Green Version]
  38. Xie, X.; Chen, Z.; Wang, F.; Bai, M.; Xu, W. Ecological Risk Assessment of Taihu Lake Basin Based on Landscape Pattern. Chinese J. Appl. Ecol. 2017, 28, 3369–3377. [Google Scholar] [CrossRef]
  39. Wang, B.; Ding, M.; Li, S.; Liu, L.; Ai, J. Assessment of Landscape Ecological Risk for a Cross-Border Basin: A Case Study of the Koshi River Basin, Central Himalayas. Ecol. Indic. 2020, 117, 106621. [Google Scholar] [CrossRef]
  40. Gao, X.; Yang, L.; Li, C.; Song, Z.; Wang, J. Land Use Change and Ecosystem Service Value Measurement in Baiyangdian Basin under the Simulated Multiple Scenarios. Acta Ecol. Sin. 2021, 41, 1–15. [Google Scholar] [CrossRef]
  41. Wang, X.; Ma, B.; Li, D.; Chen, K.; Yao, H. Multi-Scenario Simulation and Prediction of Ecological Space in Hubei Province Based on FLUS Model. J. Nat. Resour. 2020, 35, 230–242. [Google Scholar] [CrossRef]
  42. Liu, X.; Liang, X.; Li, X.; Xu, X.; Ou, J.; Chen, Y.; Li, S.; Wang, S.; Pei, F. A Future Land Use Simulation Model (FLUS) for Simulating Multiple Land Use Scenarios by Coupling Human and Natural Effects. Landsc. Urban Plan. 2017, 168, 94–116. [Google Scholar] [CrossRef]
  43. Liang, X.; Guan, Q.; Clarke, K.C.; Liu, S.; Wang, B.; Yao, Y. Understanding the Drivers of Sustainable Land Expansion Using a Patch-Generating Land Use Simulation (PLUS) Model: A Case Study in Wuhan, China. Comput. Environ. Urban Syst. 2021, 85, 101569. [Google Scholar] [CrossRef]
  44. Shi, M.; Wu, H.; Fan, X.; Jia, H.; Dong, T.; He, P.; Baqa, M.F.; Jiang, P. Trade-Offs and Synergies of Multiple Ecosystem Services for Different Land Use Scenarios in the Yili River Valley, China. Sustainability 2021, 13, 1577. [Google Scholar] [CrossRef]
  45. Wang, B.; Liao, J.; Zhu, W.; Qiu, Q.; Wagn, L.; Tang, L. The Weight of Neighborhood Setting of the FLUS Model Based on a Historical Scenario: A Case Study of Land Use Simulation of Urban Agglomeration of the Golden Triangle of Southern Fujian in 2030. Shengtai Xuebao Acta Ecol. Sin. 2019, 39, 4284–4298. [Google Scholar] [CrossRef]
  46. Ouyang, X.; He, Q.; Zhu, X. Simulation of Impacts of Urban Agglomeration Land Use Change on Ecosystem Services Value under Multi-Scenarios: Case Study in Changsha-Zhuzhou-Xiangtan Urban Agglomeration. Econ. Geogr. 2020, 40, 93–102. [Google Scholar] [CrossRef]
  47. Wu, C.; Chen, B.; Huang, X.; Dennis Wei, Y.H. Effect of Land-Use Change and Optimization on the Ecosystem Service Values of Jiangsu Province, China. Ecol. Indic. 2020, 117, 106507. [Google Scholar] [CrossRef]
  48. Cao, Q.; Zhang, X.; Ma, H.; Wu, J. Review of Landscape Ecological Risk and an Assessment Framework Based on Ecological Services: ESRISK. Acta Geogr. Sin. 2018, 73, 843–855. [Google Scholar] [CrossRef]
  49. YU, H.; Zeng, H.; Jiang, Z. Study on Distribution Characteristics of Landscape Elements along the Terrain Gradient. Sci. Geogr. Sin. 2001, 21, 64–69. [Google Scholar] [CrossRef]
  50. Mansour, S.; Al Kindi, A.; Al-Said, A.; Al-Said, A.; Atkinson, P. Sociodemographic Determinants of COVID-19 Incidence Rates in Oman: Geospatial Modelling Using Multiscale Geographically Weighted Regression (MGWR). Sustain. Cities Soc. 2021, 65, 102627. [Google Scholar] [CrossRef]
  51. Mollalo, A.; Vahedi, B.; Rivera, K.M. GIS-Based Spatial Modeling of COVID-19 Incidence Rate in the Continental United States. Sci. Total Environ. 2020, 728, 138884. [Google Scholar] [CrossRef]
  52. Zhou, T.; Chen, W.; Li, J.; Liang, J. Spatial Relationship between Human Activities and Habitat Quality in Shennongjia Forest Region from 1995 to 2015. Acta Ecol. Sin. 2021, 41, 6134–6145. [Google Scholar] [CrossRef]
  53. Oshan, T.M.; Li, Z.; Kang, W.; Wolf, L.J.; Stewart Fotheringham, A. MGWR: A Python Implementation of Multiscale Geographically Weighted Regression for Investigating Process Spatial Heterogeneity and Scale. ISPRS Int. J. Geo-Inf. 2019, 8, 269. [Google Scholar] [CrossRef] [Green Version]
  54. Zhou, S.; Chang, J.; Hu, T.; Luo, P.; Zhou, H. Spatiotemporal Variations of Land Use and Landscape Ecological Risk in a Resource-Based City, from Rapid Development to Recession. Polish J. Environ. Stud. 2020, 29, 475–490. [Google Scholar] [CrossRef]
  55. Gao, B.; Li, C.; Wu, Y.; Zheng, K.; Wu, Y. Landscape Ecological Risk Assessment and Influencing Factors in Ecological Conservation Area in Sichuan-Yunnan Provinces, China. Chin. J. Appl. Ecol. 2021, 32, 1603–1613. [Google Scholar] [CrossRef]
  56. Liu, S.; Bai, M.; Yao, M. Integrating Ecosystem Function and Structure to Assess Landscape Ecological Risk in Traditional Village Clustering Areas. Sustainability 2021, 13, 4860. [Google Scholar] [CrossRef]
  57. Xue, L.; Wang, J.; Zhang, L.; Wei, G.; Zhu, B. Spatiotemporal Analysis of Ecological Vulnerability and Management in the Tarim River Basin, China. Sci. Total Environ. 2019, 649, 876–888. [Google Scholar] [CrossRef]
  58. Guan, D.J.; Li, H.F.; Inohae, T.; Su, W.; Nagaie, T.; Hokao, K. Modeling Urban Land Use Change by the Integration of Cellular Automaton and Markov Model. Ecol. Modell. 2011, 222, 3761–3772. [Google Scholar] [CrossRef]
  59. Liu, J.; Kuang, W.; Zhang, Z.; Xu, X.; Qin, Y.; Ning, J.; Zhou, W.; Zhang, S.; Li, R.; Yan, C.; et al. Spatiotemporal Characteristics, Patterns, and Causes of Land-Use Changes in China since the Late 1980s. J. Geogr. Sci. 2014, 24, 195–210. [Google Scholar] [CrossRef]
  60. Liu, Y.; Long, H. Land Use Transitions and Their Dynamic Mechanism: The Case of the Huang-Huai-Hai Plain. J. Geogr. Sci. 2016, 26, 515–530. [Google Scholar] [CrossRef] [Green Version]
  61. Sabr, A.; Moeinaddini, M.; Azarnivand, H.; Guinot, B. Assessment of Land Use and Land Cover Change Using Spatiotemporal Analysis of Landscape: Case Study in South of Tehran. Environ. Monit. Assess. 2016, 188, 691. [Google Scholar] [CrossRef]
  62. Koroso, N.H.; Lengoiboni, M.; Zevenbergen, J.A. Urbanization and Urban Land Use Efficiency: Evidence from Regional and Addis Ababa Satellite Cities, Ethiopia. Habitat Int. 2021, 117, 102437. [Google Scholar] [CrossRef]
  63. Cui, X.; Liu, C.; Shan, L.; Lin, J.; Zhang, J.; Jiang, Y.; Zhang, G. Spatial-Temporal Responses of Ecosystem Services to Land Use Transformation Driven by Rapid Urbanization: A Case Study of Hubei Province, China. Int. J. Environ. Res. Public Health 2022, 19, 178. [Google Scholar] [CrossRef] [PubMed]
  64. Davoudi, S.; Shaw, K.; Haider, L.J.; Quinlan, A.E.; Peterson, G.D.; Wilkinson, C.; Fünfgeld, H.; McEvoy, D.; Porter, L.; Davoudi, S. Resilience: A Bridging Concept or a Dead End? Planning. Plan. Theory Pract. 2012, 13, 299–307. [Google Scholar] [CrossRef] [Green Version]
  65. Ouyang, Z.; Zheng, H.; Xiao, Y.; Polasky, S.; Liu, J.; Xu, W.; Wang, Q.; Zhang, L.; Xiao, Y.; Rao, E.; et al. Improvements in Ecosystem Services from Investments in Natural Capital. Science 2016, 352, 1455–1459. [Google Scholar] [CrossRef] [PubMed]
  66. Peng, L.; Wang, X. xi What Is the Relationship between Ecosystem Services and Urbanization? A Case Study of the Mountainous Areas in Southwest China. J. Mt. Sci. 2019, 16, 2867–2881. [Google Scholar] [CrossRef]
  67. Luo, F.; Liu, Y.; Peng, J.; Wu, J. Assessing Urban Landscape Ecological Risk through an Adaptive Cycle Framework. Landsc. Urban Plan. 2018, 180, 125–134. [Google Scholar] [CrossRef]
  68. Zhang, H.; Yang, Y.; Li, Y. Discussion on Ecosystem Degradation and Restoration in Karst Rock Desertification Areas of Southwest China. Ecol. Sci. 2015, 34, 169–174. [Google Scholar] [CrossRef]
  69. Yan, Y.; Yang, L.; Wang, W.; Fang, H.; Zhuang, Q. Analysis of Spatial-Temporal Variation of Landscape Ecological Risk and Its Terrain Gradient in Ili Valley. Ecol. Sci. 2020, 39, 125–136. [Google Scholar] [CrossRef]
  70. Yin, L.; Dai, E.; Xie, G.; Zhang, B. Effects of Land-Use Intensity and Land Management Policies on Evolution of Regional Land System: A Case Study in the Hengduan Mountain Region. Land 2021, 10, 528. [Google Scholar] [CrossRef]
  71. Zhang, Z.; Li, Z.; He, X.; Liu, L.; Wang, P. Progress in the Research on Glacial Change and Water Resources in the Manas River Basin. Res. Soil Water Conserv. 2014, 21, 332–337. [Google Scholar] [CrossRef]
  72. Liu, W.; Henneberry, S.R.; Ni, J.; Radmehr, R.; Wei, C. Socio-Cultural Roots of Rural Settlement Dispersion in Sichuan Basin: The Perspective of Chinese Lineage. Land Use Policy 2019, 88, 104162. [Google Scholar] [CrossRef]
  73. Zinda, J.A.; Trac, C.J.; Zhai, D.; Harrell, S. Dual-Function Forests in the Returning Farmland to Forest Program and the Flexibility of Environmental Policy in China. Geoforum 2017, 78, 119–132. [Google Scholar] [CrossRef] [Green Version]
  74. Dorren, L.K.A.; Berger, F.; Imeson, A.C.; Maier, B.; Rey, F. Integrity, Stability and Management of Protection Forests in the European Alps. For. Ecol. Manag. 2004, 195, 165–176. [Google Scholar] [CrossRef] [Green Version]
  75. Yao, S.; Lu, D.; Wang, C.; Duan, J.; Wu, Q. Urbanization in China Needs Comprehensive Scientific Thinking: Exploration of the Urbanization Mode Adapted to the Special Situation of China. Geogr. Res. 2011, 30, 1947–1955. [Google Scholar]
  76. Hou, P.; Gao, J.; Chen, Y.; Zhai, J.; Xiao, R.; Zhang, W.; Sun, C.; Wang, Y.; Hou, J. Development Process and Characteristics of China’s Ecological Protection Policy. Shengtai Xuebao 2021, 41, 1656–1667. [Google Scholar] [CrossRef]
  77. Ma, S.; Wang, H.Y.; Wang, L.J.; Jiang, J.; Gong, J.W.; Wu, S.; Luo, G.Y. Evaluation and Simulation of Landscape Evolution and Its Ecological Effects under Vegetation Restoration in the Northern Sand Prevention Belt, China. Catena 2022, 218, 106555. [Google Scholar] [CrossRef]
  78. Wang, S.; Tan, X.; Fan, F. Landscape Ecological Risk Assessment and Impact Factor Analysis of the Qinghai–Tibetan Plateau. Remote Sens. 2022, 14, 4726. [Google Scholar] [CrossRef]
  79. Gao, B.; Wu, Y.; Li, C.; Zheng, K.; Wu, Y. Ecosystem Health Responses of Urban Agglomerations in Central Yunnan Based on Land Use Change. Int. J. Environ. Res. Public Health 2022, 19, 12399. [Google Scholar] [CrossRef]
  80. Ma, S.; Wang, L.J.; Jiang, J.; Chu, L.; Zhang, J.C. Threshold Effect of Ecosystem Services in Response to Climate Change and Vegetation Coverage Change in the Qinghai-Tibet Plateau Ecological Shelter. J. Clean. Prod. 2021, 318, 128592. [Google Scholar] [CrossRef]
  81. Zang, Y.; Liu, Y.; Yang, Y. Land Use Pattern Change and Its Topographic Gradient Effect in the Mountainous Areas: A Case Study of Jinggangshan City. J. Nat. Resour. 2019, 34, 1391–1404. [Google Scholar] [CrossRef]
  82. Yang, W.; Li, S.; Peng, S.; Li, Y.; Zhao, S.; Qiu, L. Identification of Important Biodiversity Areas by InVEST Model Considering Topographic Relief: A Case Study of Yunnan Province, China. Chin. J. Appl. Ecol. 2021, 32, 4339–4348. [Google Scholar] [CrossRef]
  83. Ji, Y.; Bai, Z.; Hui, J. Landscape Ecological Risk Assessment Based on LUCC—A Case Study of Chaoyang County, China. Forests 2021, 12, 1157. [Google Scholar] [CrossRef]
Figure 1. Location of Sichuan-Yunnan Ecological Barrier in China.
Land 11 02079 g001
Figure 2. Land use and land cover in the Sichuan-Yunnan Ecological Barrier in 2000, 2010, and 2020 and three scenarios (BAU/UDC/EDP).
Land 11 02079 g002
Figure 3. Spatial distribution (a) and proportion (b) of ecological risk in the Sichuan-Yunnan Ecological Barrier from 2000 to 2020.
Land 11 02079 g003
Figure 4. Spatial distribution (a) and proportion (b) of ecological risk under three different scenarios in 2030.
Land 11 02079 g004
Figure 5. Global Moran’s I scatter figures of land use ERI in the Sichuan-Yunnan Ecological Barrier in 2000, 2010 and 2020.
Land 11 02079 g005
Figure 6. Global Moran’s I scatter figures of land use ERI in the Sichuan-Yunnan Ecological Barrier in three scenarios (BAU/UDC/EDP).
Land 11 02079 g006
Figure 7. Area and gradient distribution index of each level of ecological risk.
Land 11 02079 g007
Figure 8. Spatial pattern of the MGWR regression coefficients for landscape ecological risk and terrain gradient changes.
Land 11 02079 g008
Table 1. Values of the weight matrix Wn for different scenarios.
ScenarioDescriptionScenario Weighting Matrix Wn
Business-as-usualFollowing current development patterns and existing land use transfer rates is a scenario setting that does not place restrictions on any land type conversions in the conversion rules.--
Urban development and constructionThis scenario allows for the expansion of urban land, consequent encroachment on surrounding arable land and a slowdown in the growth of forest and grassland, making the trade-off between development and ecological conservation a central issue.Cultivated land (0.85) Forest (0.9) Grassland (0.9) Shrubland (0.9) Wetland (0.9) Water bodies (1) Artificial Surface (1.2) Bare Land (1) Permanent snow and ice (1)
Ecological development priorityRestrict the conversion of forest grassland and Water bodies related to ecological land to an artificial surface, simulate the consequences of ecological measures such as vegetation restoration and return of farmland to forest, and moderately increase the expansion of ecological land under the premise of slowing down the degradation of cultivated land.Cultivated land (1.1) Forest (1.2) Grassland (1.2) Shrubland (1.1) Wetland (1) Water bodies (1) Artificial Surface (0.85) Bare Land (1) Permanent snow and ice (1)
Table 2. Parameters of the conversion matrix under the three scenarios (BAU/UDC/EDP) in the Sichuan-Yunnan Ecological Barrier.
Type of Land UseCultivated LandForestGrasslandShrublandWetlandWater BodiesArtificial SurfaceBare LandPermanent Snow and Ice
Cultivated land111111100
Forest111110100
Grassland111111100
Shrubland111111100
Wetland111111000
Water bodies000001000
Artificial surface111011100
Bare land111111110
Permanent snow and ice111111111
Table 3. Land use changes in the study area from 2000–2020 (km2/%).
Land Area and ShareChange and the Percentage of Change
2000201020202000–20102010–20202000–20202000–2020 Percentage of Change
Cultivated land78,743.92 79,265.81 76,804.21 521.89 −2461.60 −1939.71 0.17
Forest 203,607.33 203,853.20 202,009.24 245.87 −1843.96 −1598.09 0.14
Grassland41,328.85 39,117.55 40,394.01 −2211.30 1276.46 −934.84 0.08
Shrubland12,089.15 13,126.16 13,042.91 1037.01 −83.25 953.76 0.08
Wetland241.30 104.97 104.48 −136.33 −0.49 −136.82 0.01
Water bodies 2120.12 2100.91 3156.79 −19.21 1055.88 1036.67 0.09
Artificial surface2654.71 3214.91 6526.80 560.20 3311.89 3872.09 0.33
Bare land 586.40 781.41 503.77 195.01 −277.64 −82.63 0.01
Permanent snow and ice1754.56 1561.42 584.13 −193.14 −977.29 −1170.43 0.10
Table 4. Projected land area in 2030 for the three scenarios and the area of change compared to 2020 (km2).
Type of Land Use2020BAUUDCEDP2020-BAU2020-UDC2020-EDP
Cultivated land76,804.2175,411.0374,541.8775,380.93−1393.18−2262.34−1423.28
Forest202,009.24200,355.68199,438.67201,560.1−1653.56−2570.57−449.14
Grassland40,394.0140,483.1141,460.2341,022.289.11066.22628.19
Shrubland13,042.9113,003.8413,597.0612,919.32−39.07554.15−123.59
Wetland104.4875.41111.1487.72−29.076.66−16.76
Water bodies3156.793738.673379.963262.05581.88223.17105.26
Artificial surface6526.89139.259696.277881.412612.453169.471354.61
Bare land503.77606.34599.19665.79102.5795.42162.02
Permanent snow and ice584.13313.01301.95346.82−271.12−282.18−237.31
BAU: business-as-usual; UDC: urban development and construction; EDP: ecological development priority.
Publisher’s Note: MDPI stays neutral with regard to jurisdictional claims in published maps and institutional affiliations.

