Article

Estimation of Heat Released from Fire Based on Combustible Load in Inner Mongolian Grasslands

1
Department of Geographical Sciences, Beijing Normal University, Beijing 100875, China
2
Institute of Grasslands Research, Chinese Academy of Agricultural Sciences, Hohhot 010010, China
3
School of Geographical Sciences, Inner Mongolia Normal University, Hohhot 010022, China
*
Author to whom correspondence should be addressed.
Land 2022, 11(11), 2099; https://doi.org/10.3390/land11112099
Submission received: 24 September 2022 / Revised: 11 November 2022 / Accepted: 18 November 2022 / Published: 21 November 2022

Abstract

:
The grasslands of Inner Mongolia are prone to wildfires, which can endanger the grassland ecosystem, as well as people’s lives and property. The amount of heat released by grassland fires must be determined for the quantitative evaluation of grassland fires. On the basis of a field survey of combustible load and an indoor heat release experiment, together with the acquisition of NDVI and fire area data, this study evaluated the amount of combustible load, plant heat release, potential heat release, and fire-caused heat release in Inner Mongolia grasslands. The following results were obtained: (1) The models for determining Inner Mongolia’s combustible load (Y) per unit area throughout the growing and nongrowing seasons were Yi = 412.74NDVIi1.5917 and Yj = −7.21tj + Y10 (i represents May–October of the growing season; j represents November–April of the following year). In the northern temperate zones, grasslands and meadows showed a decline in combustible load per unit area. The interannual combustible load variance increased between 2001 and 2016; (2) the per square meter average heat release of Stipa capillata, Cleistogenes squarrosa, Carex doniana, Leymus chinensis, and other plants was 0.51, 0.18, 0.17, 0.3, and 1.42 MJ/g, respectively. Unit weights were released at 2.13, 1.77, 2.06, 1.9, and 3.99 MJ/m2; (3) from 2001 to 2016, Inner Mongolia’s grassland fires predominantly occurred in northern temperate grasslands and meadows. Over the 16 year period, the total heat emission was 1.01 × 10¹² MJ, with variable decreasing trends noted in spring and fall. The main practical objectives of this paper were to provide basic data for fire spread modeling and suggest more scientific and effective fire management methods for the future.

1. Introduction

Human activities and climate change can have a significant impact on the grassland ecosystem, which supports human life. In the context of global warming, ecologically fragile grassland areas have become highly fire-prone areas. Although the area of burned grasslands has declined globally over the past two decades [1], grassland fires operate as catalysts in the context of ongoing climate warming, eventually leading to higher burned areas [2], decreased land productivity [3], and increasing carbon emissions [4]. Increasing temperatures [5], reductions in the moisture of flammable materials [6], and changing seasons all directly enhance the likelihood of grassland fires. Grassland fires occur in certain regions and during specific times of the year due to natural climate change and human activity [7]. Approximately one-sixth of the area in the northern Inner Mongolia Autonomous Region burns annually [8]. Grassland fires are common in Mongolia, and they frequently spread to the China–Mongolia border through wind. Consequently, accurate calculation of combustible load and heat release provides additional data in support for studying grassland fires, and these data are essential for preventing and managing the occurrence of grassland fires and creating acceptable and effective control plans.
The material basis for the occurrence of grassland fires is combustible materials [9,10]. Three approaches for evaluating flammable material loads are commonly used: the comparison survey method of sample location [11], mathematical simulation models [12,13], and remote sensing inversion of empirical models. Photosynthesis is a crucial process in the production of vegetation productivity, and a relational equation may be built between this ecological element influencing vegetation productivity and remote sensing data to predict the combustible load [14,15,16]. Non-photosynthetic vegetation plays a significant role in terrestrial surface ecosystems such as temperate grasslands, savannas, and forests, and it is a significant indicator of changes in surface ecology [17,18,19]. The addition of non-photosynthetic vegetation is a more realistic and reasonable inversion of surface vegetation growing conditions. The puff rising formula allows the estimation of the heat released from fire [20]. In the test environment, the heat flux measurement near the item is used to invert the heat-time discharge of the burning item [21]. The combustion characteristics of different types of combustible materials can be studied using cone calorimeters [22,23] and thermogravimetric analyzers [24], and the effects of the water content of different types of combustible materials on plant combustibility and fire occurrence risk are also different [25]. These experimental results can provide fundamental data support for grassland fire studies.
Research primarily focuses on the effects of grassland fire burning on surface temperature [26] and aboveground production [27]. Grassland fires play an important role in controlling biodiversity and preserving ecological stability. Satellite data can effectively monitor grassland fires that have a significant impact on the natural environment and human society [28,29], including aspects such as grassland fire information extraction [30], description of the spatial and temporal distribution of burning areas [31,32,33,34], monitoring and early warning [35,36], and fire burning indices [37,38].
There are many research findings on combustible load, combustion properties, and the spatial and temporal distribution of grassland fires across the literature, but there are few publications on their thorough analyses. On the basis of field plant and combustible load surveys, as well as various plant combustion heat release experiments, combined with NDVI and fire data, we investigated the combustible load, potential heat release, and fire-induced heat release in this paper. We are unable to stop climate anomalies such as global warming and extreme weather, but we can identify and foresee the risks associated with grassland fires in the context of climate change, allowing us to stop grassland fires in Inner Mongolia before they start and shift the management of grassland fires from crisis management to risk management.

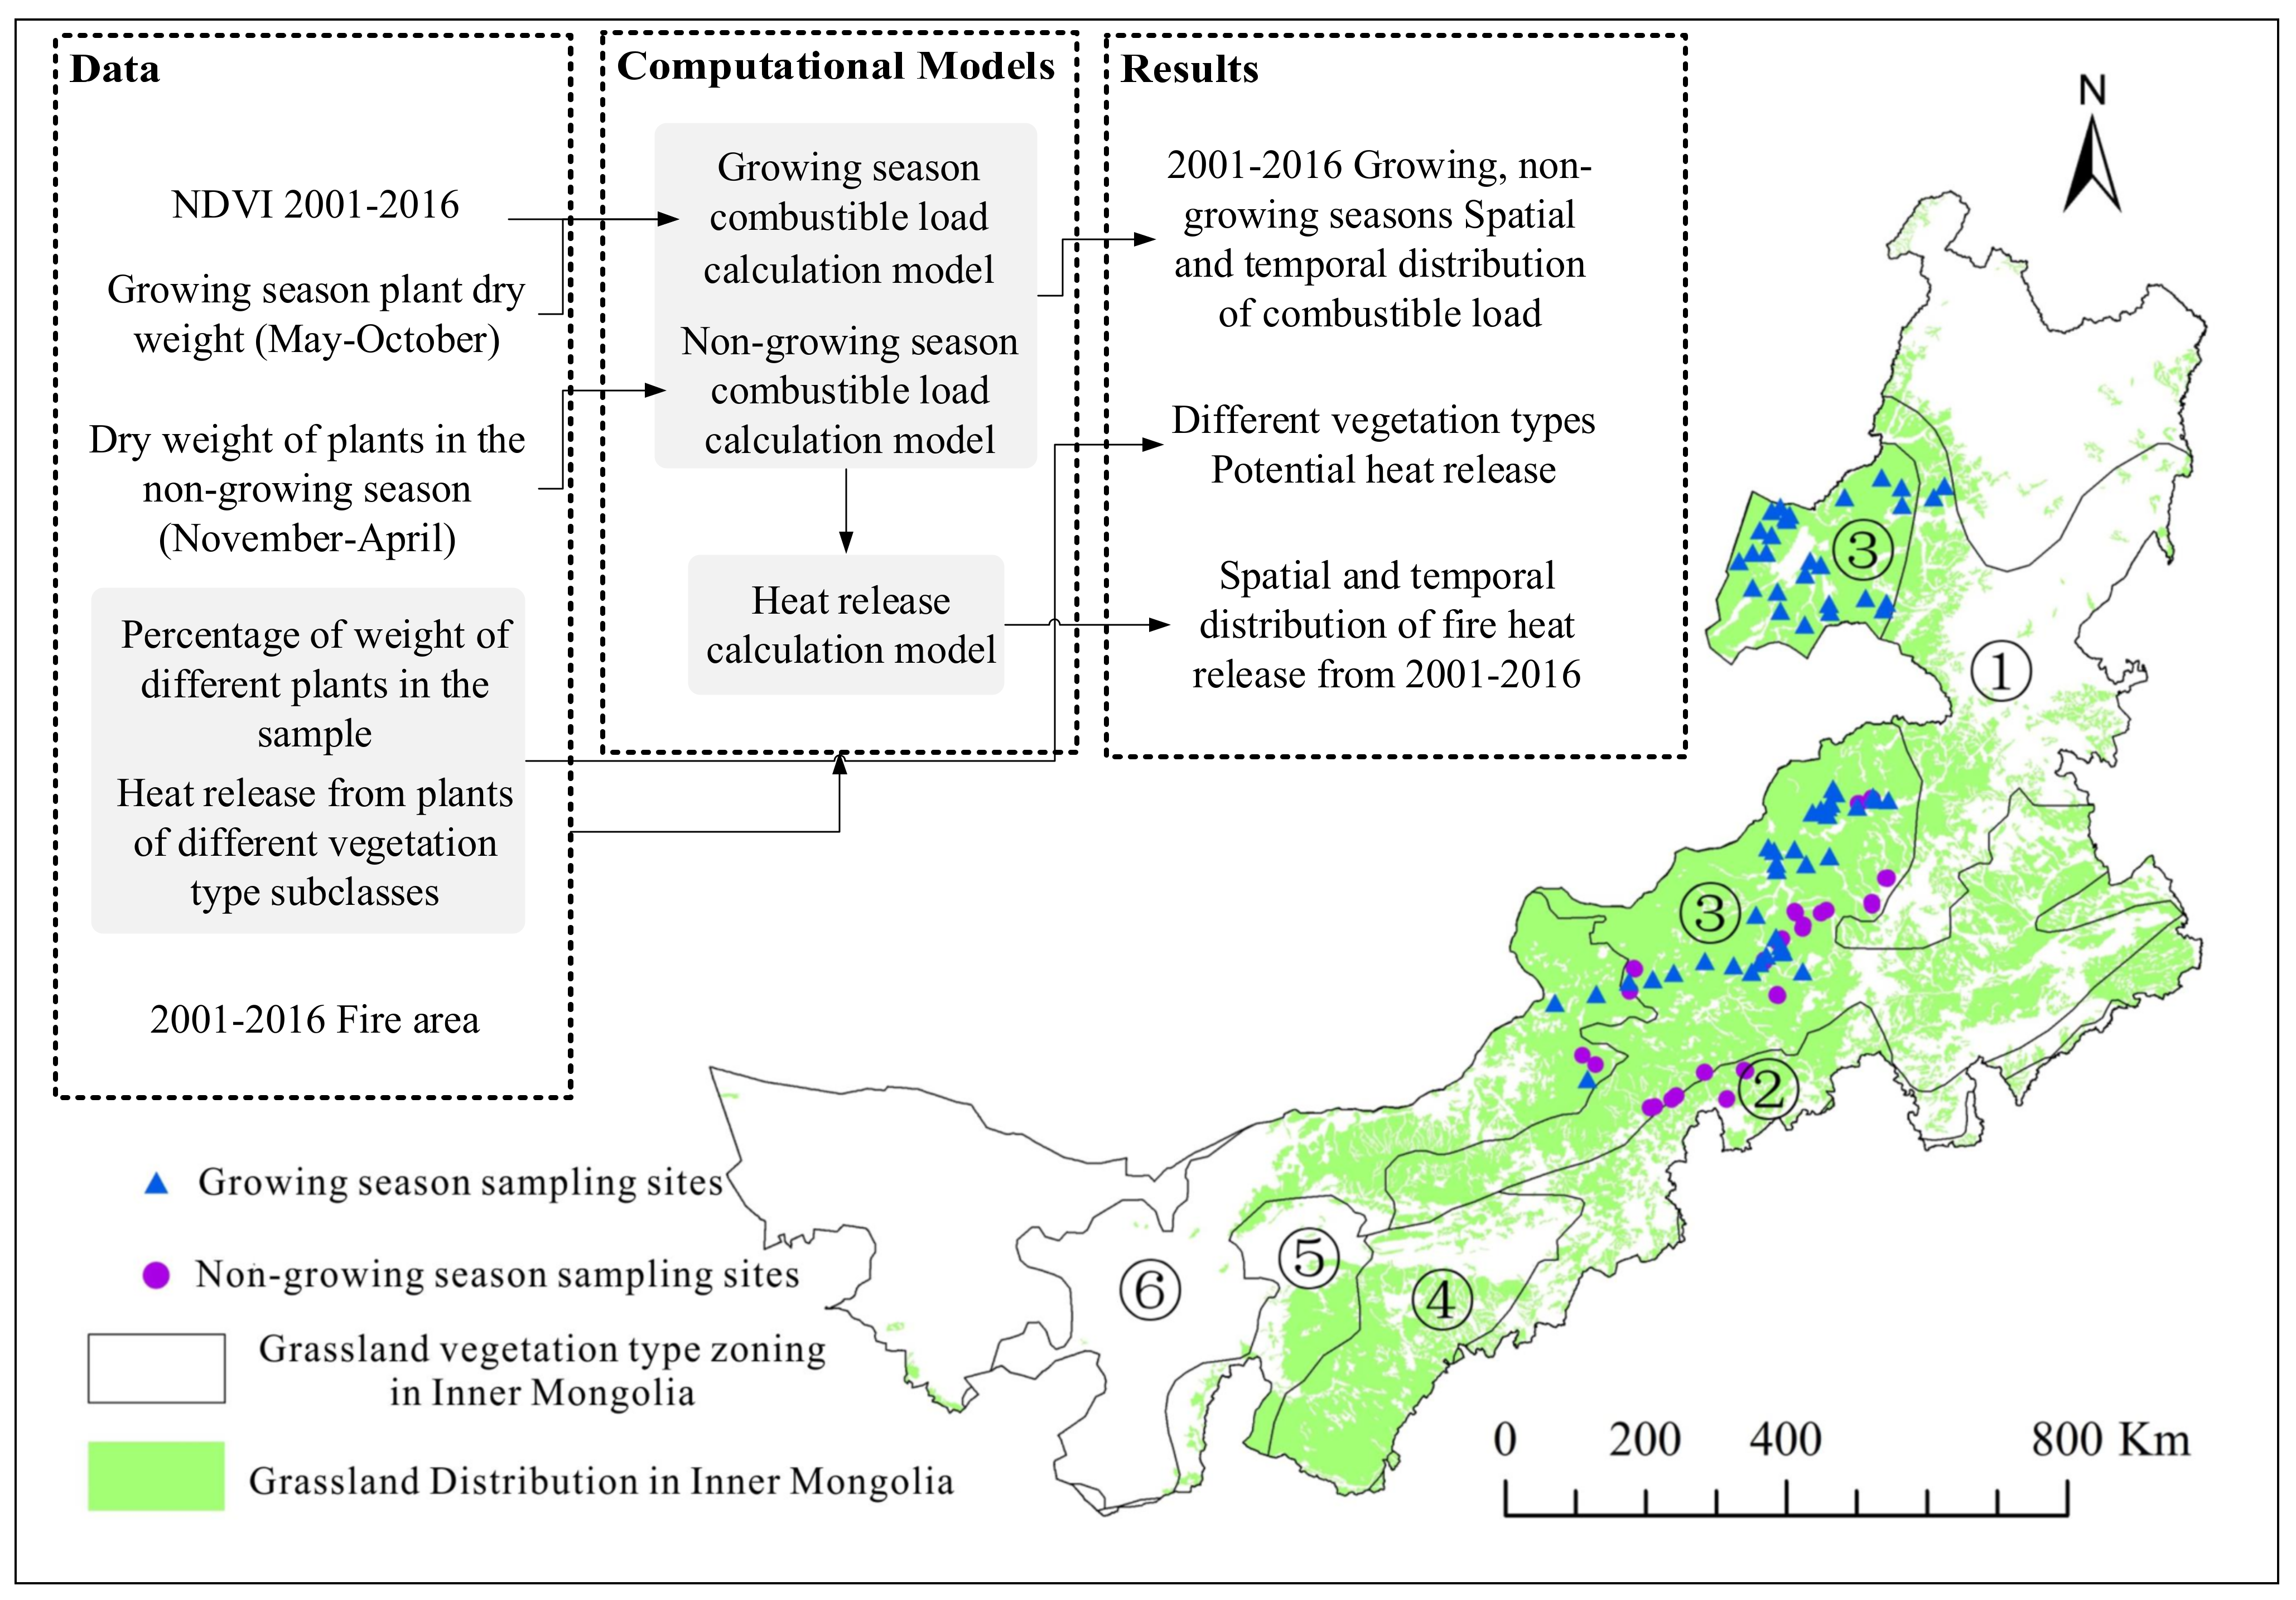
2. Materials and Methods

The grasslands of Inner Mongolia have a temperate continental monsoon climate with distinct seasonal characteristics. The average temperature ranges from −30 to −10 °C in January and 19 to 24 °C in July. The average annual precipitation is 50 to 450 mm, and the soils in the region are characterized as black soil, dark brown soil, black calcium soil, chestnut soil, brown loam, gray calcium soil, sandy soil, and gray-brown desert soil from southeast to northwest. In Inner Mongolia, there are mainly coniferous forests, deciduous broad-leaved forests, grasslands, and desert vegetation, among which grassland vegetation is the main vegetation type. The study area is divided into meadow grasslands, typical grasslands, and desert grasslands from east to west [39]. According to statistical data, 1177 grassland fires occurred in the Inner Mongolia Autonomous Region during 1981–2015 over an area of 8.14 million hectares with an average of 33.6 fires and 233,000 hectares per year [40].
Sample of a surface combustible load: Field samples in fire-prone areas with little human effect and surveys of combustible load were undertaken during the growing and nongrowing seasons while taking into consideration grassland information and growing circumstances. There were 56 survey sites in the nongrowing season, which was surveyed from November to April 2014, and 79 survey sites during the growing season, which were studied from June to August in 2013, 2014, and 2016 (Figure 1). In a 1 m × 1 m sample centered on each survey site, plant species, vegetation cover, mean height, and precise measurements of biomass were examined. Three concurrent sets of experiments were performed for each survey site to reduce the chance of mistakes. To determine the measured combustible load within the sample square, all vegetation samples taken in the field were dried at a constant temperature (70 °C) in an oven before being weighed.
Surface combustible load of grasslands in Inner Mongolia: Growing season and nongrowing season are two components of the surface combustible load; the former is calculated using the aboveground biomass estimating model and field survey data, and the latter is calculated using field survey data and months at various times. The inversion of MODIS remote sensing images is the foundation for the NDVI.
Heat release per unit mass of different plants: This paper divided the plant types of 79 growing season collection sites into 28 vegetation type subclasses based on the 1:1 million atlantes of the Data Center for Resource and Environmental Sciences, Chinese Academy of Sciences, and used a cone calorimeter to measure the heat release of various plants in different subcategories. This categorization was performed in consideration of the differences in heat release per unit mass of different vegetation types. Before the heat release test, every plant sample was dried and crushed (passed through a 100 mesh sieve). Then, 2 g of the crushed samples were placed on the conical calorimeter experimental bench, and the heat release was measured at a radiation distance of 25 cm, a heat radiation flux of 25 kW/m2, a temperature of 488.9 °C, and an exhaust flow rate of 0.024 ± 0.002 m3/s.
Potential heat release from grasslands in Inner Mongolia: On the basis of the field sample survey, the collected samples were separated into 28 vegetation type subclasses to determine the proportion of plant samples, and the plants in the sample were categorized as follows: Leymus chinensis, Stipa capillata, Cleistogenes squarrosa, Carex doniana, and the mean value of other grasses. Using the weighted average method, the heat release of Leymus chinensis, Stipa capillata, Cleistogenes squarrosa, Carex doniana, and the mean value of other grasses at the sample scale was calculated. This information was used to generate a plant type map that indicated the potential heat emission into space.
Heat release after the fire in Inner Mongolia grasslands: On the basis of the spatial distribution of combustible load and fire area, combined with the proportion (%) of different vegetation type subclasses in the 1 m × 1 m sample square and the heat release per unit mass of different vegetation type subclasses (MJ/m2/g), the heat release was calculated using the heat release formula K = B × C × j = 1 5 Μ j × Ν j . Lastly, the spatial and temporal distribution of heat release (MJ) in the Inner Mongolia grasslands area from 2001 to 2016 was obtained. Here, K is the heat release from combustible material burning (MJ), B is the combustible material loading (g/m2), C is the fire area (m2), Μ represents the weight share (%) of five plant covers, such as j1, 2, 3, 4, and 5 representing Leymus chinensis, Stipa capillata, Cleistogenes squarrosa, Carex doniana, and the mean value of others grass, respectively, and Ν represents the heat release per unit weight (g) of five plant covers (JM/m2). The calculation process is shown in Figure 1.
Statistical methods: Regression analysis is a computational method and theory that studies the specific dependence of one variable (explanatory variable) on another (explanatory variable) [41]. This method was applied to the biomass and NDVI data of this paper to obtain the biomass in the growing season in the grasslands area of Inner Mongolia. The MK test is a nonparametric trend test, which is not disturbed by certain probability distributions and outliers, and which can effectively overcome the problem of analyzing sequences with outliers and nonidentical distributions. In this study, the MK algorithm was used to test the overall trend of the time series data in the growing/nongrowing seasons of Inner Mongolia grasslands, and the trend was divided into no significant trend (stable), upward trend, and downward trend [42].

3. Results and Discussion

3.1. Spatial and Temporal Distribution of Combustible Load in Inner Mongolia Grasslands

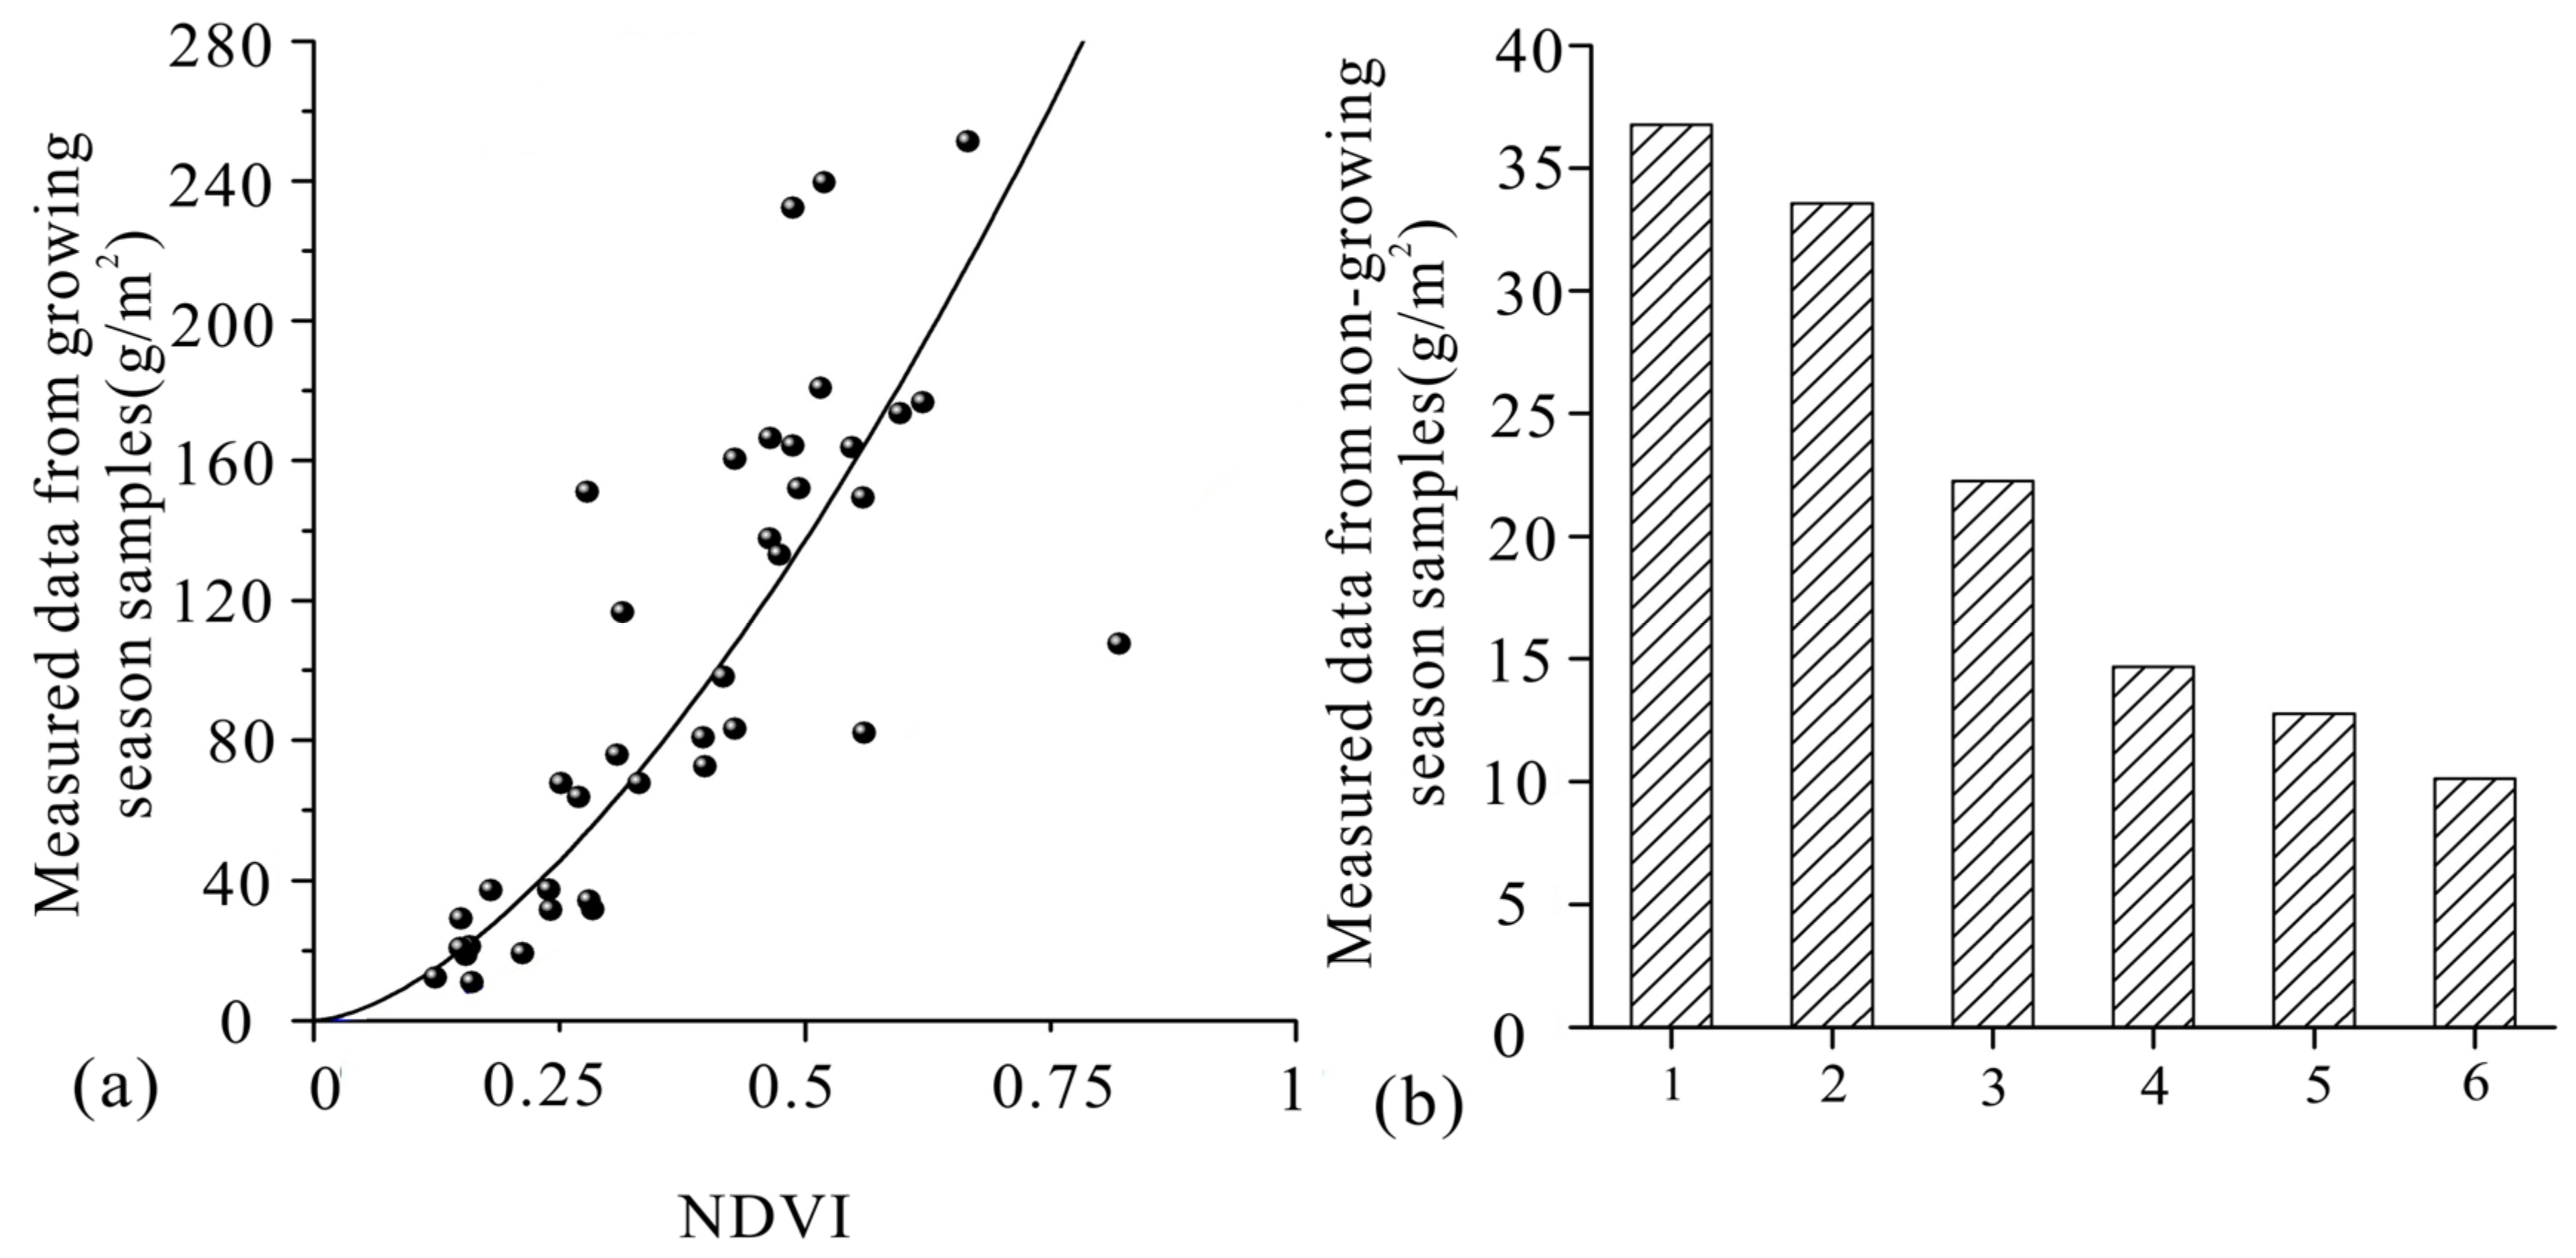
3.1.1. A Model for Estimating Combustible Load Based on Field Surveys

The combustible load (Y) of Inner Mongolian grasslands rose with rising NDVI throughout the growing season, which is consistent with earlier research [43,44,45]. Using field measurements of combustible load in Inner Mongolia grasslands throughout the growing season and NDVI data during the same period, we determined that the two satisfy the power function relationship of Yi = 412.74NDVIi1.5917 (R2 = 0.79) where i = 5, 6, …, 10 (Figure 2a). During the growing season in Inner Mongolia, both the current models and the model presented here exhibit a power function increase in combustible load with increasing NDVI, although the coefficients in the model presented here increase more strongly. The field observation scales of the two models are different, and the field sample locations in this study primarily focuses on typical grasslands areas in the northern temperate zone with high combustible loads, which also results in substantial discrepancies in model coefficients. The NDVI approach cannot be used to assess the combustible load in the nongrowing season of Inner Mongolian grasslands because there is virtually no photosynthetic plant [46]. The nongrowing season is also a high-fire season in Inner Mongolian grasslands; hence, estimating the combustible load of Inner Mongolian grasslands during the nongrowing season is of major practical value. Considering that the nongrowing season combustible load is not regenerative and is influenced by plant metabolism, natural plant decomposition, human activities, and wind action, a gradual decrease of the nongrowing season combustible load (Y) is noted with time (t) (Figure 2b), and its change trend satisfies Yj = −7.21tj + Y10 (R2 = 0.93), where j = 1, 2, …, 6, representing November to April, respectively; Y10 is the aboveground combustible load in October.

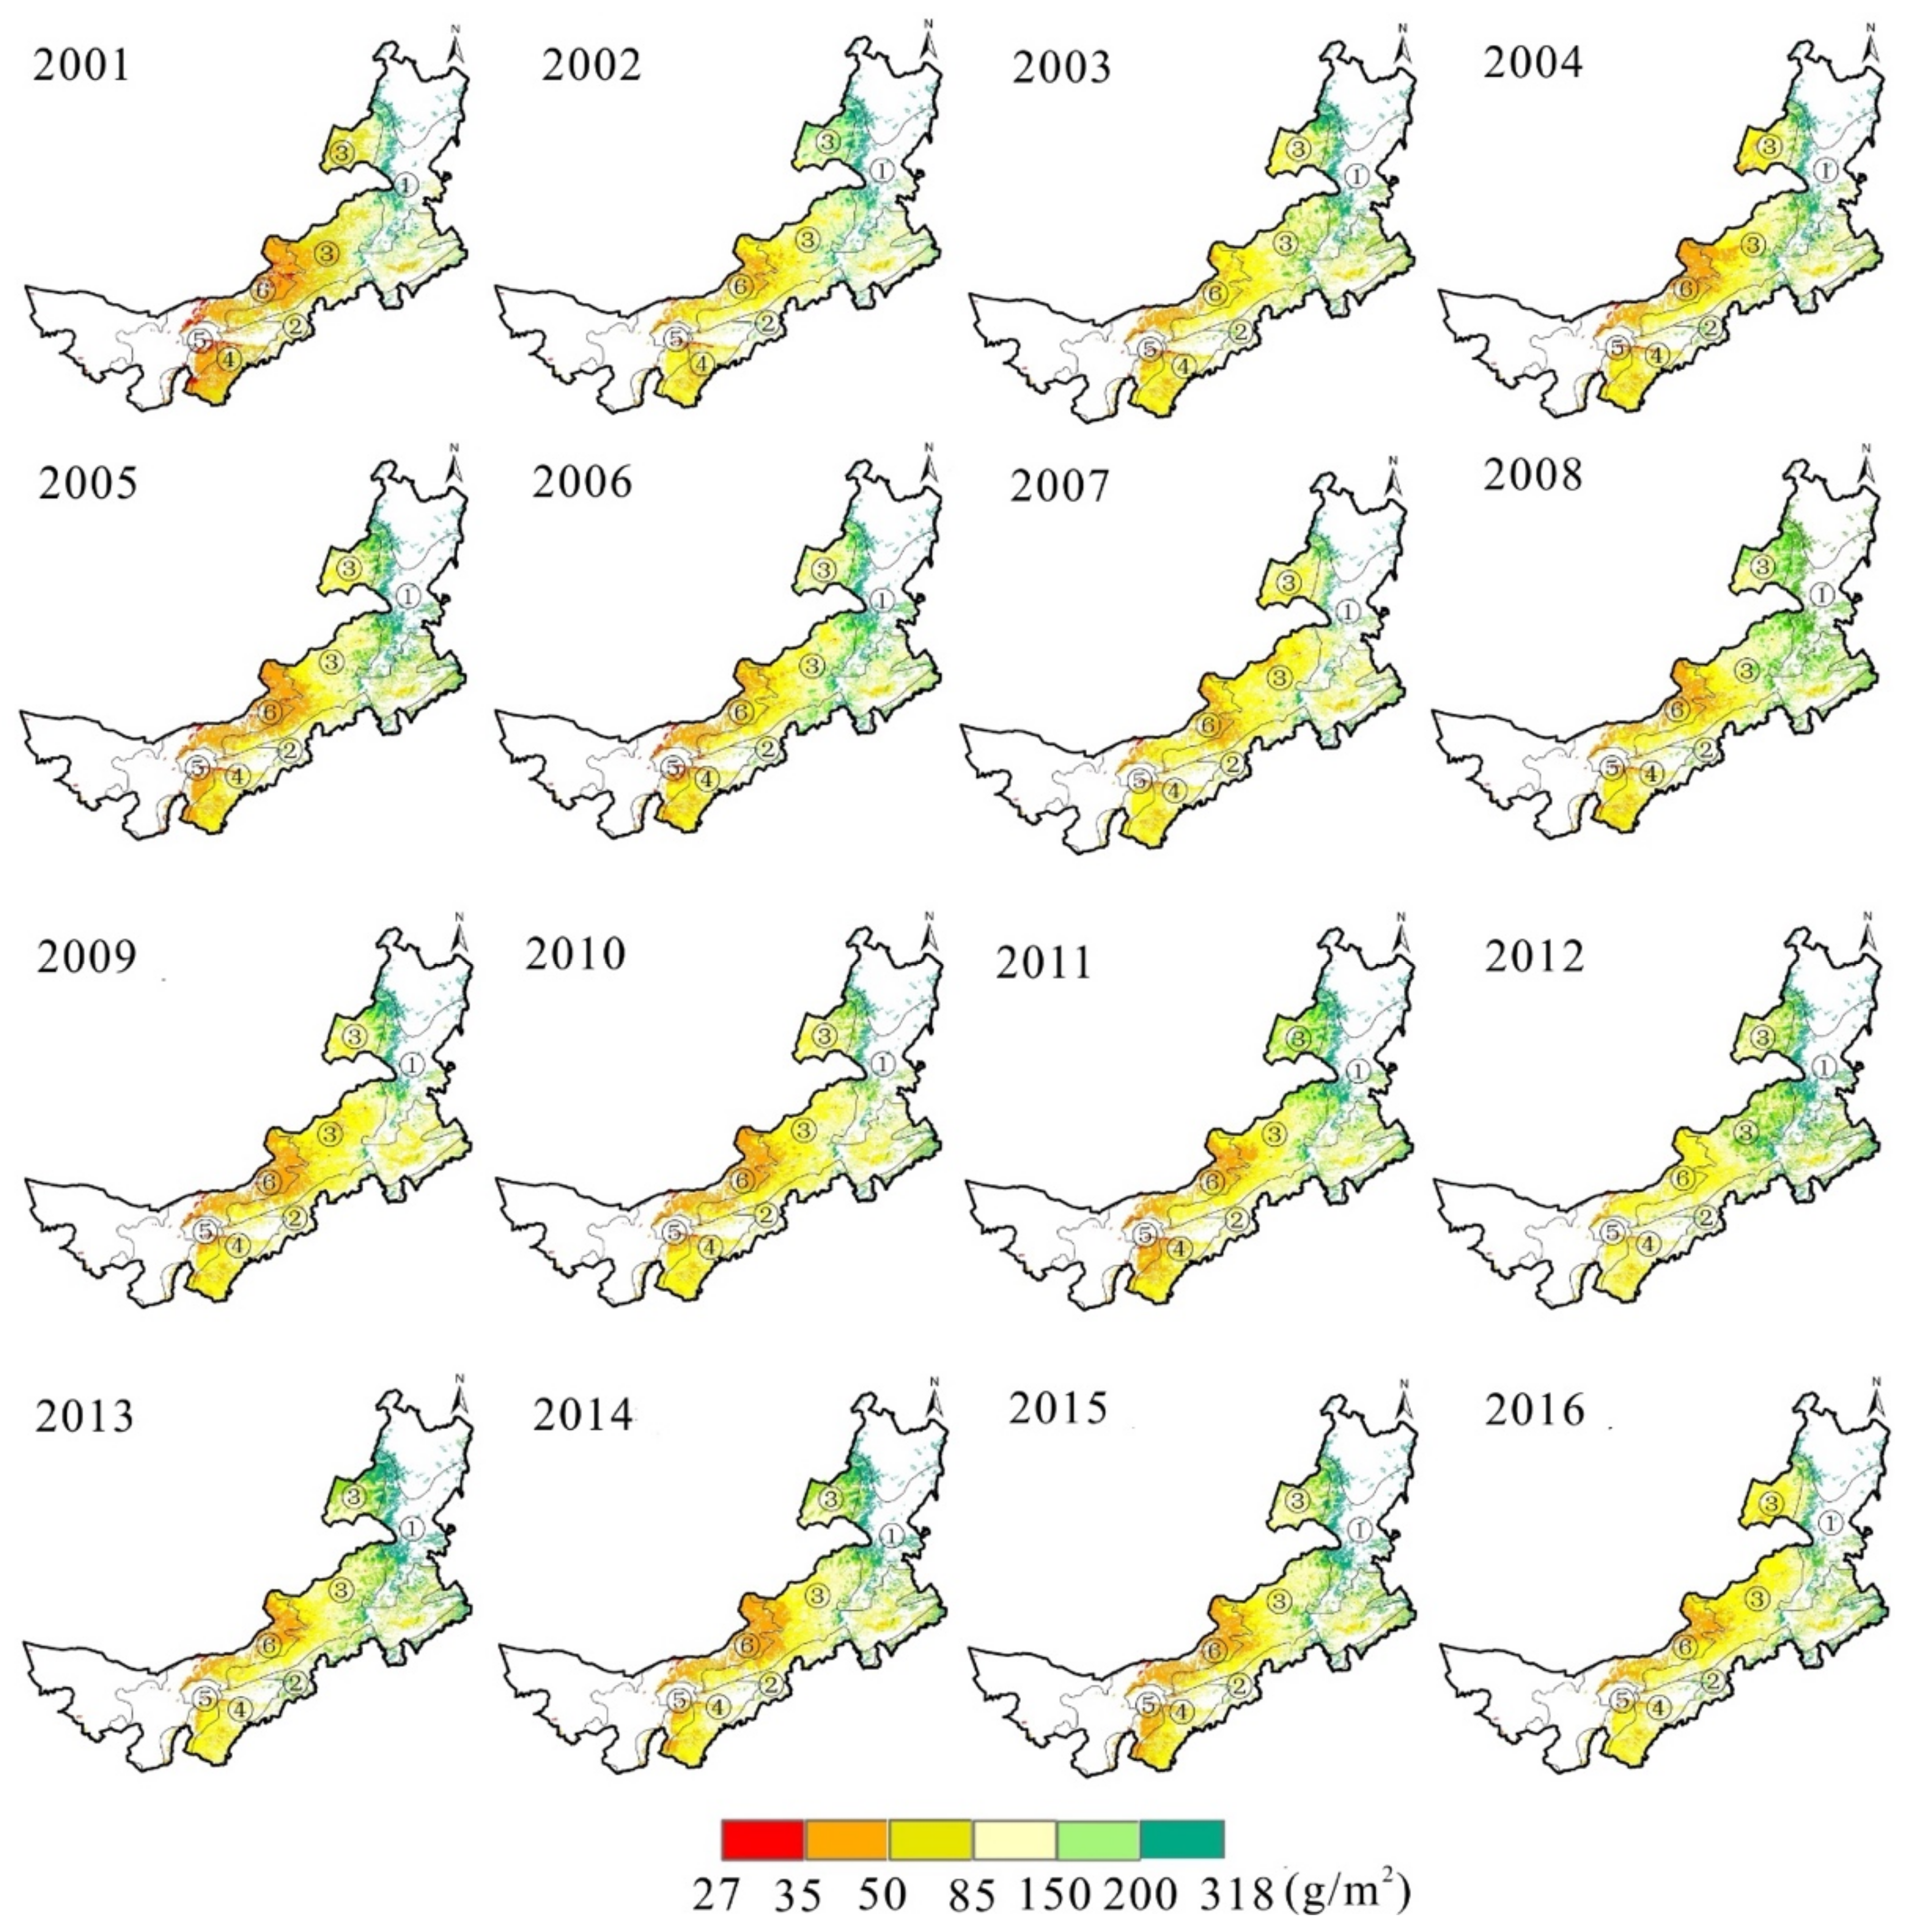
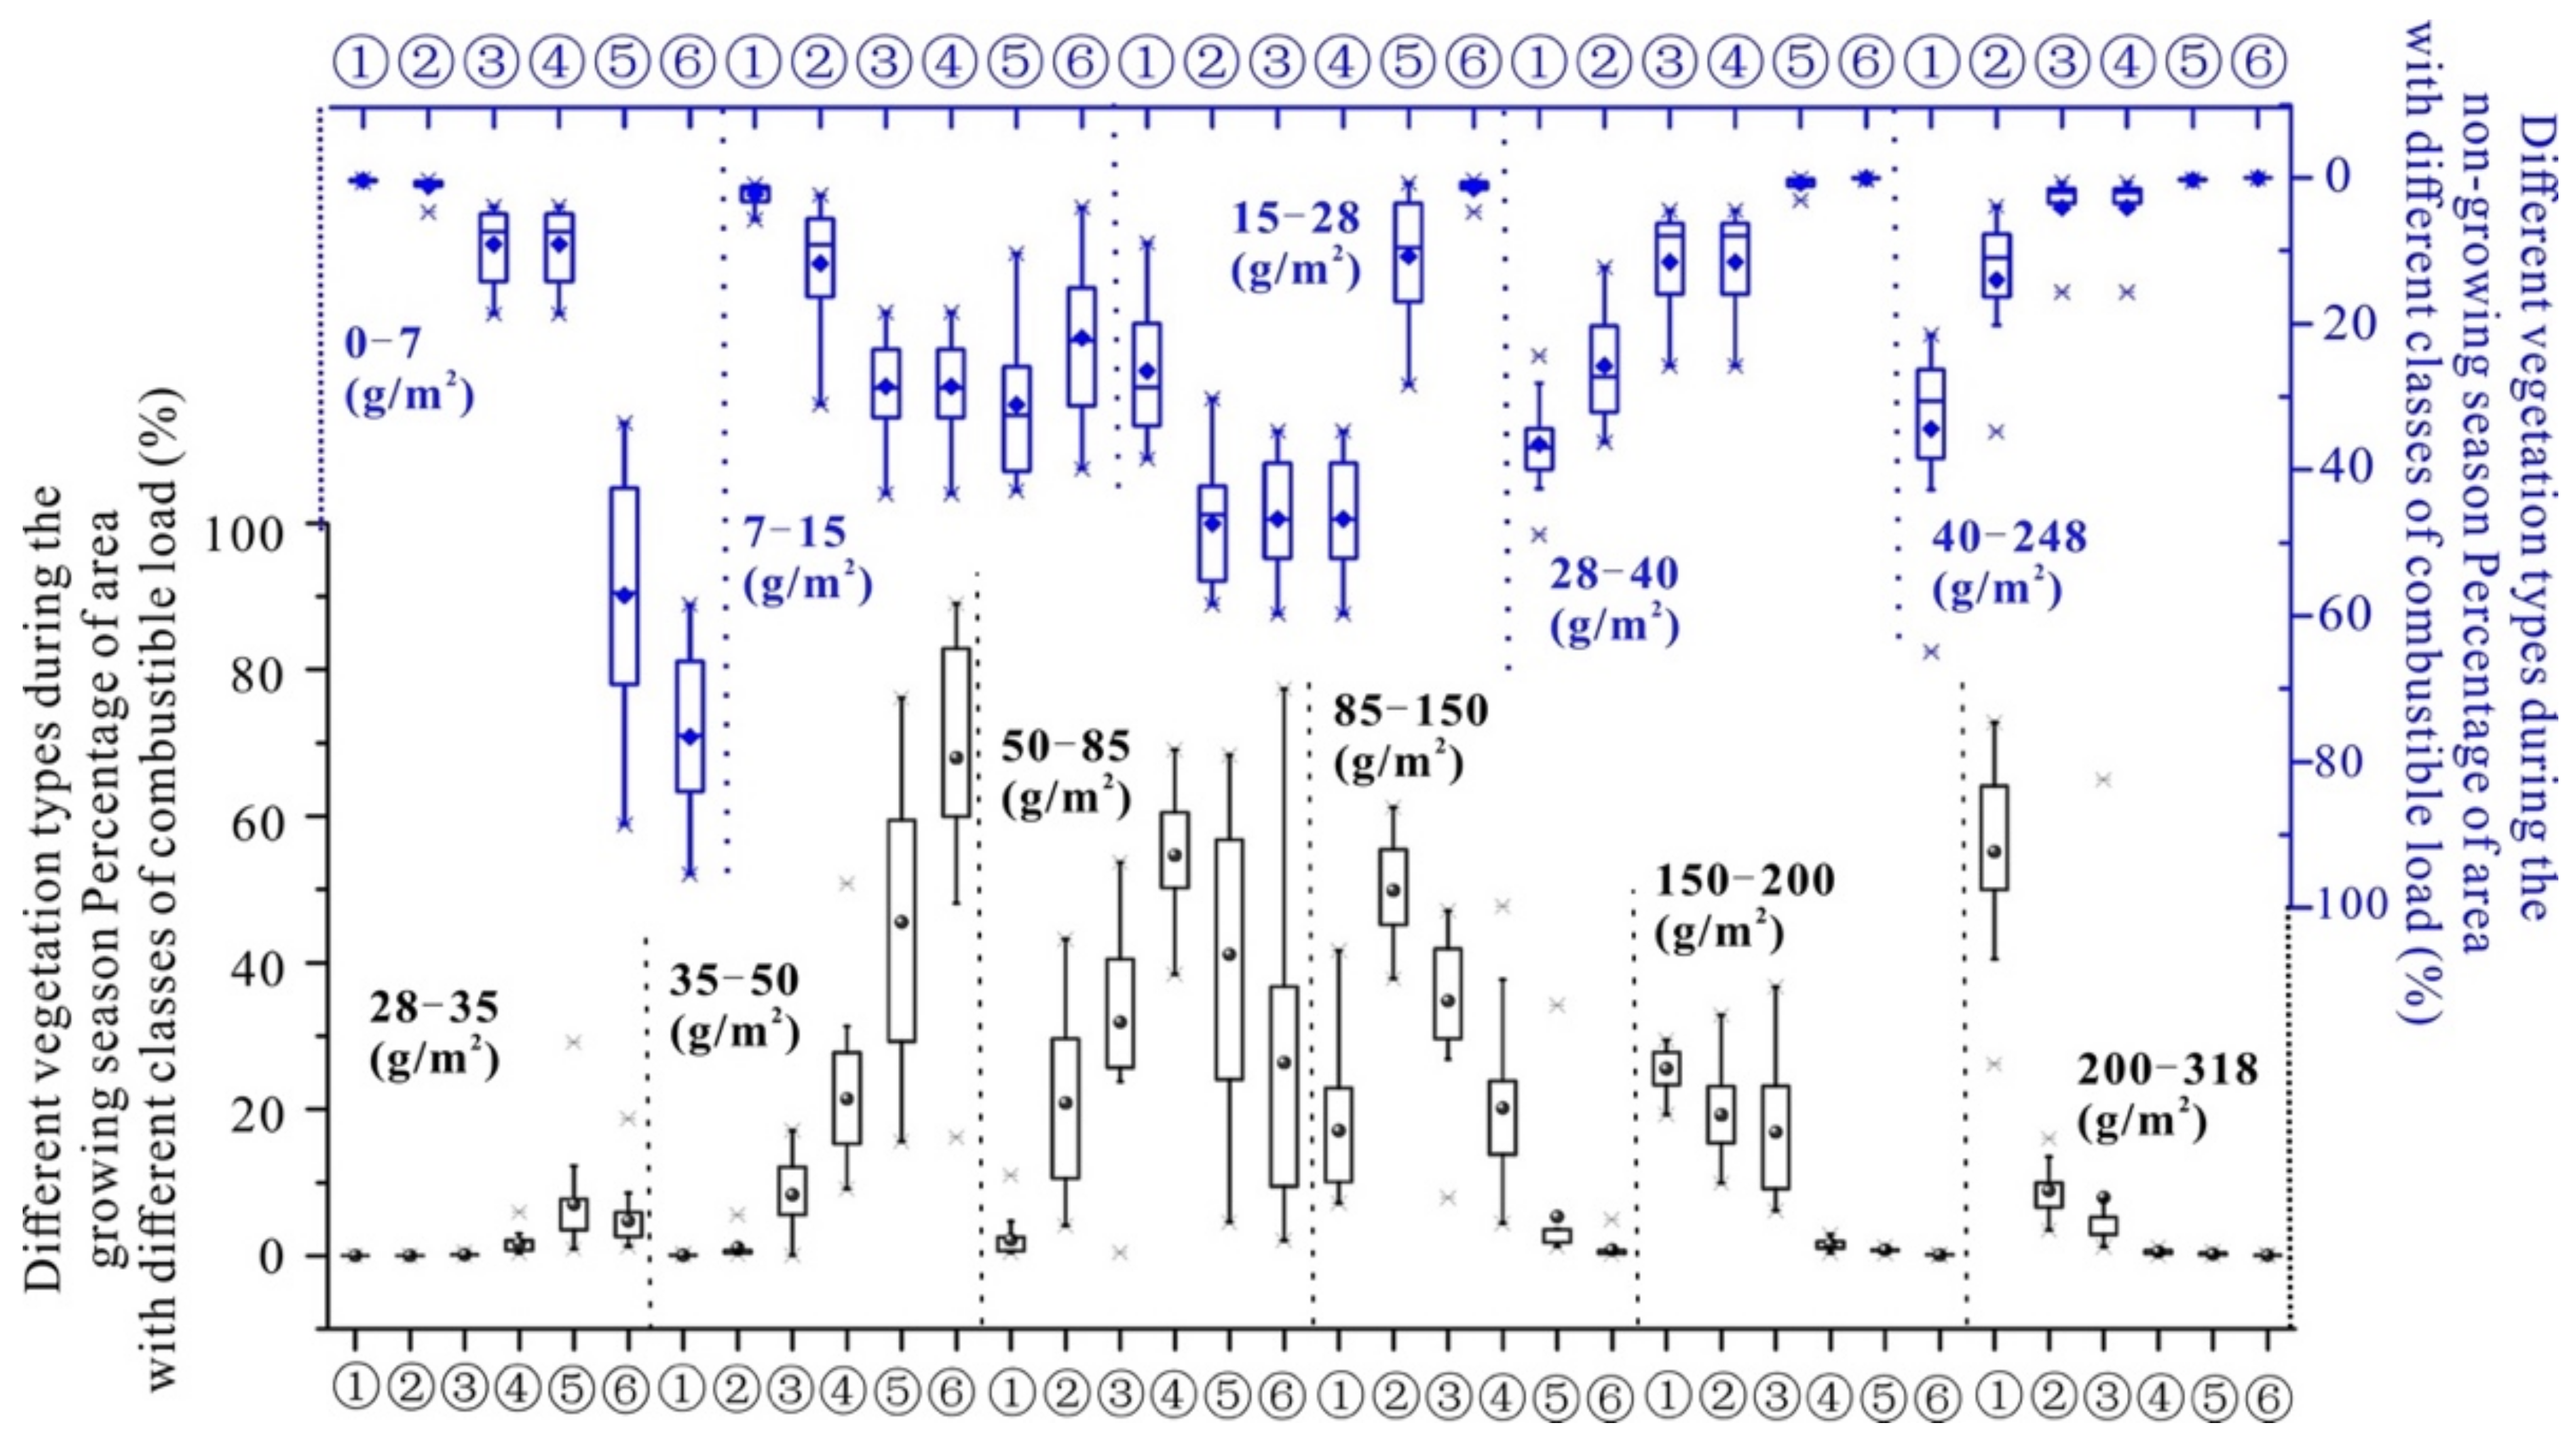
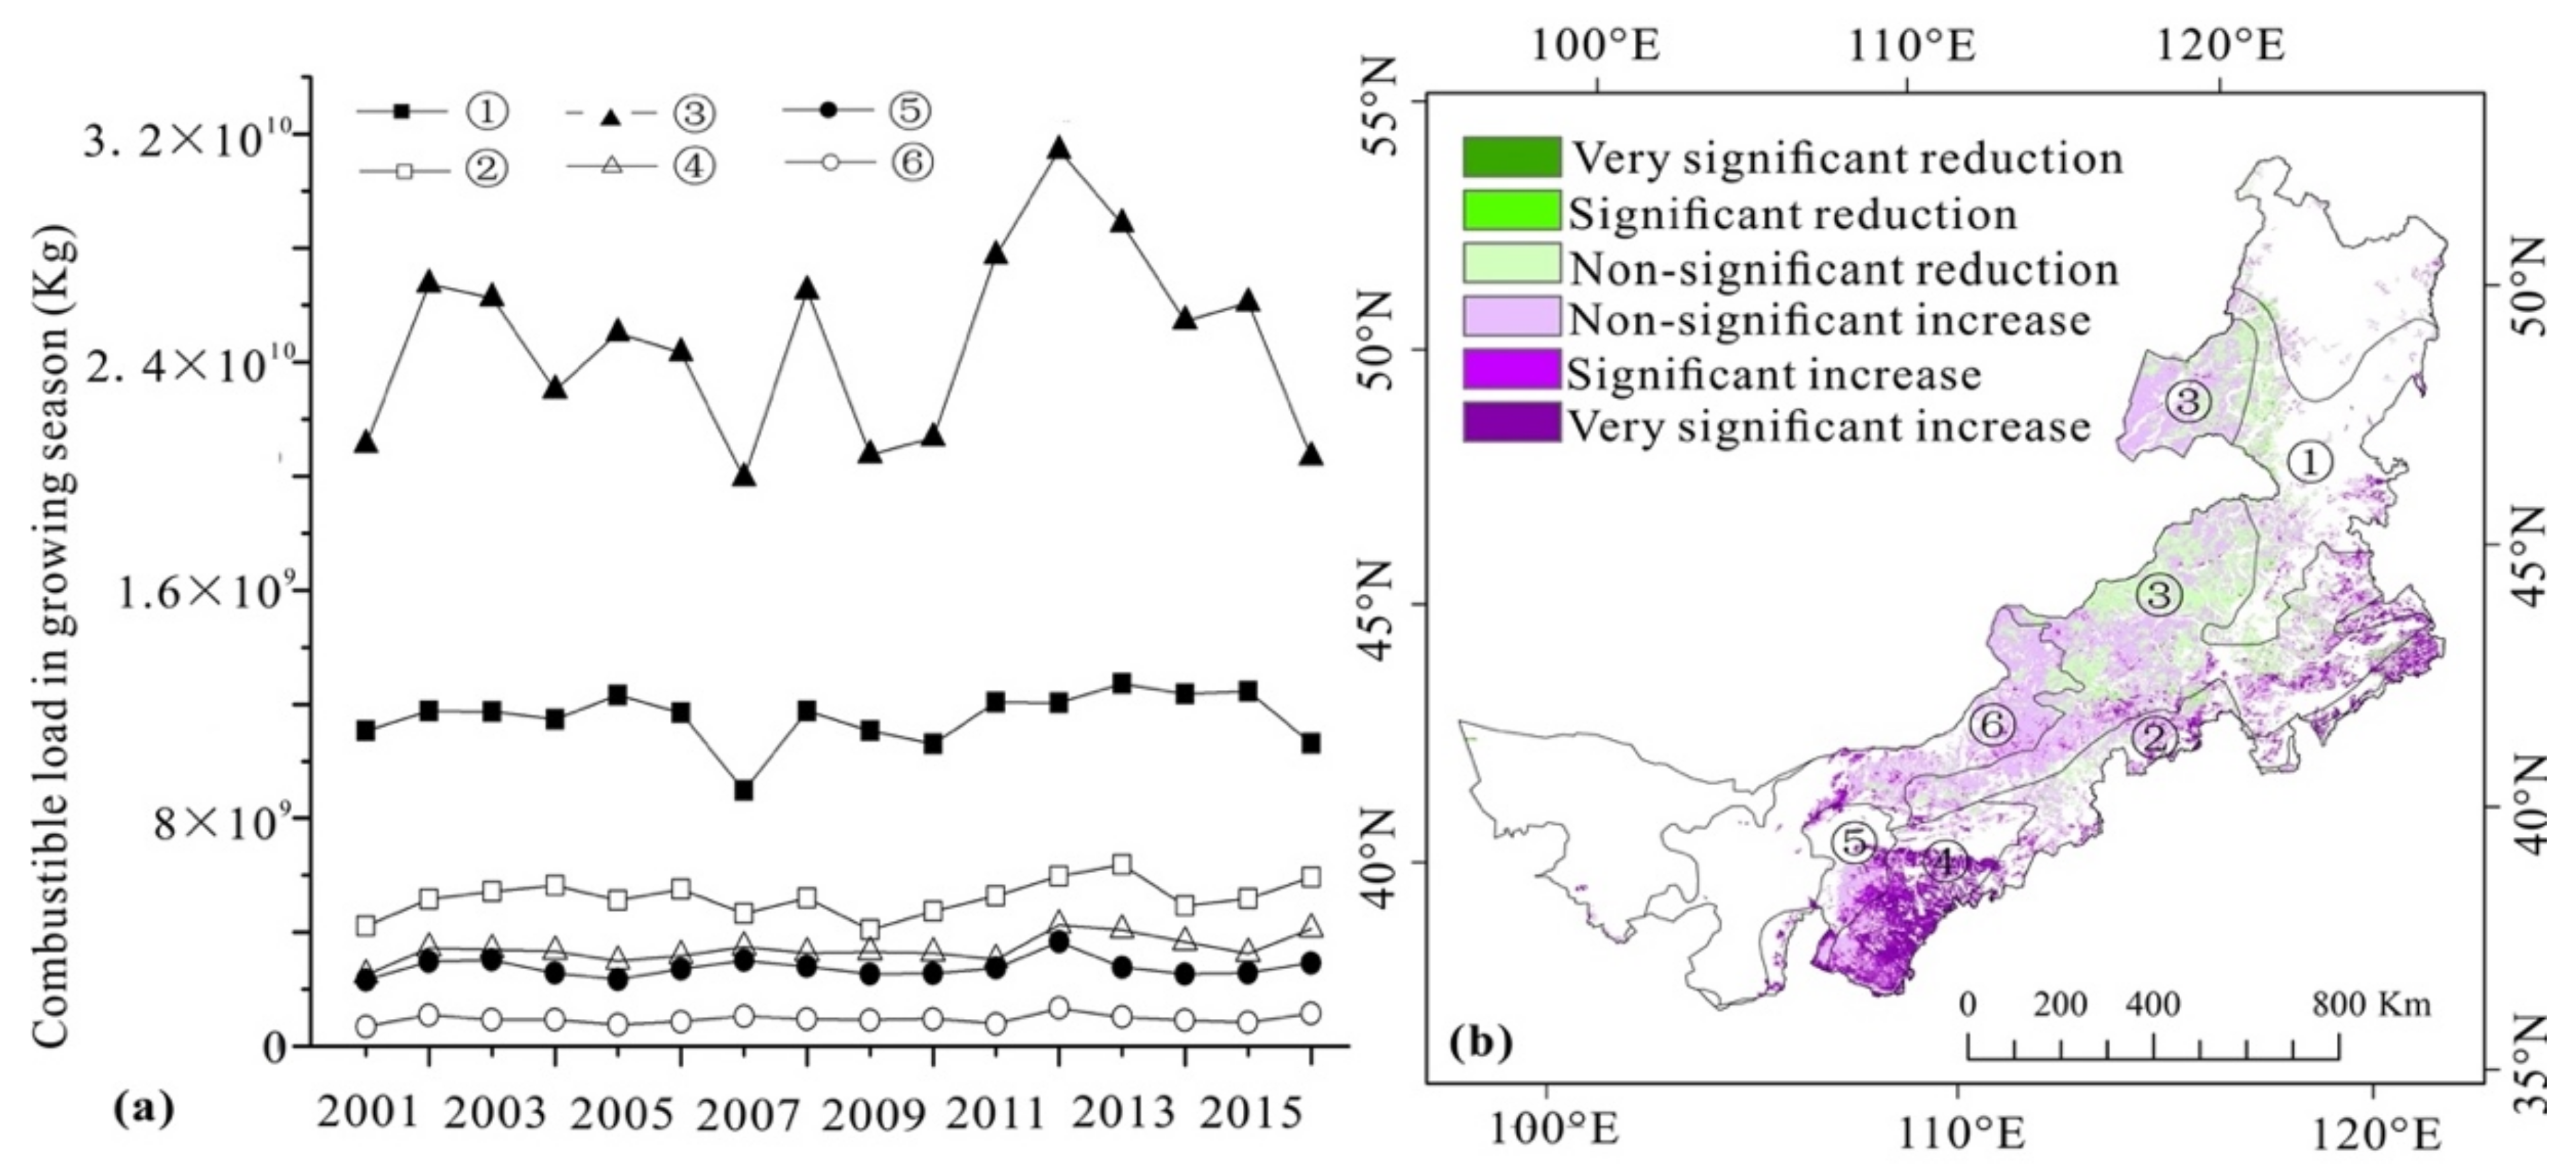
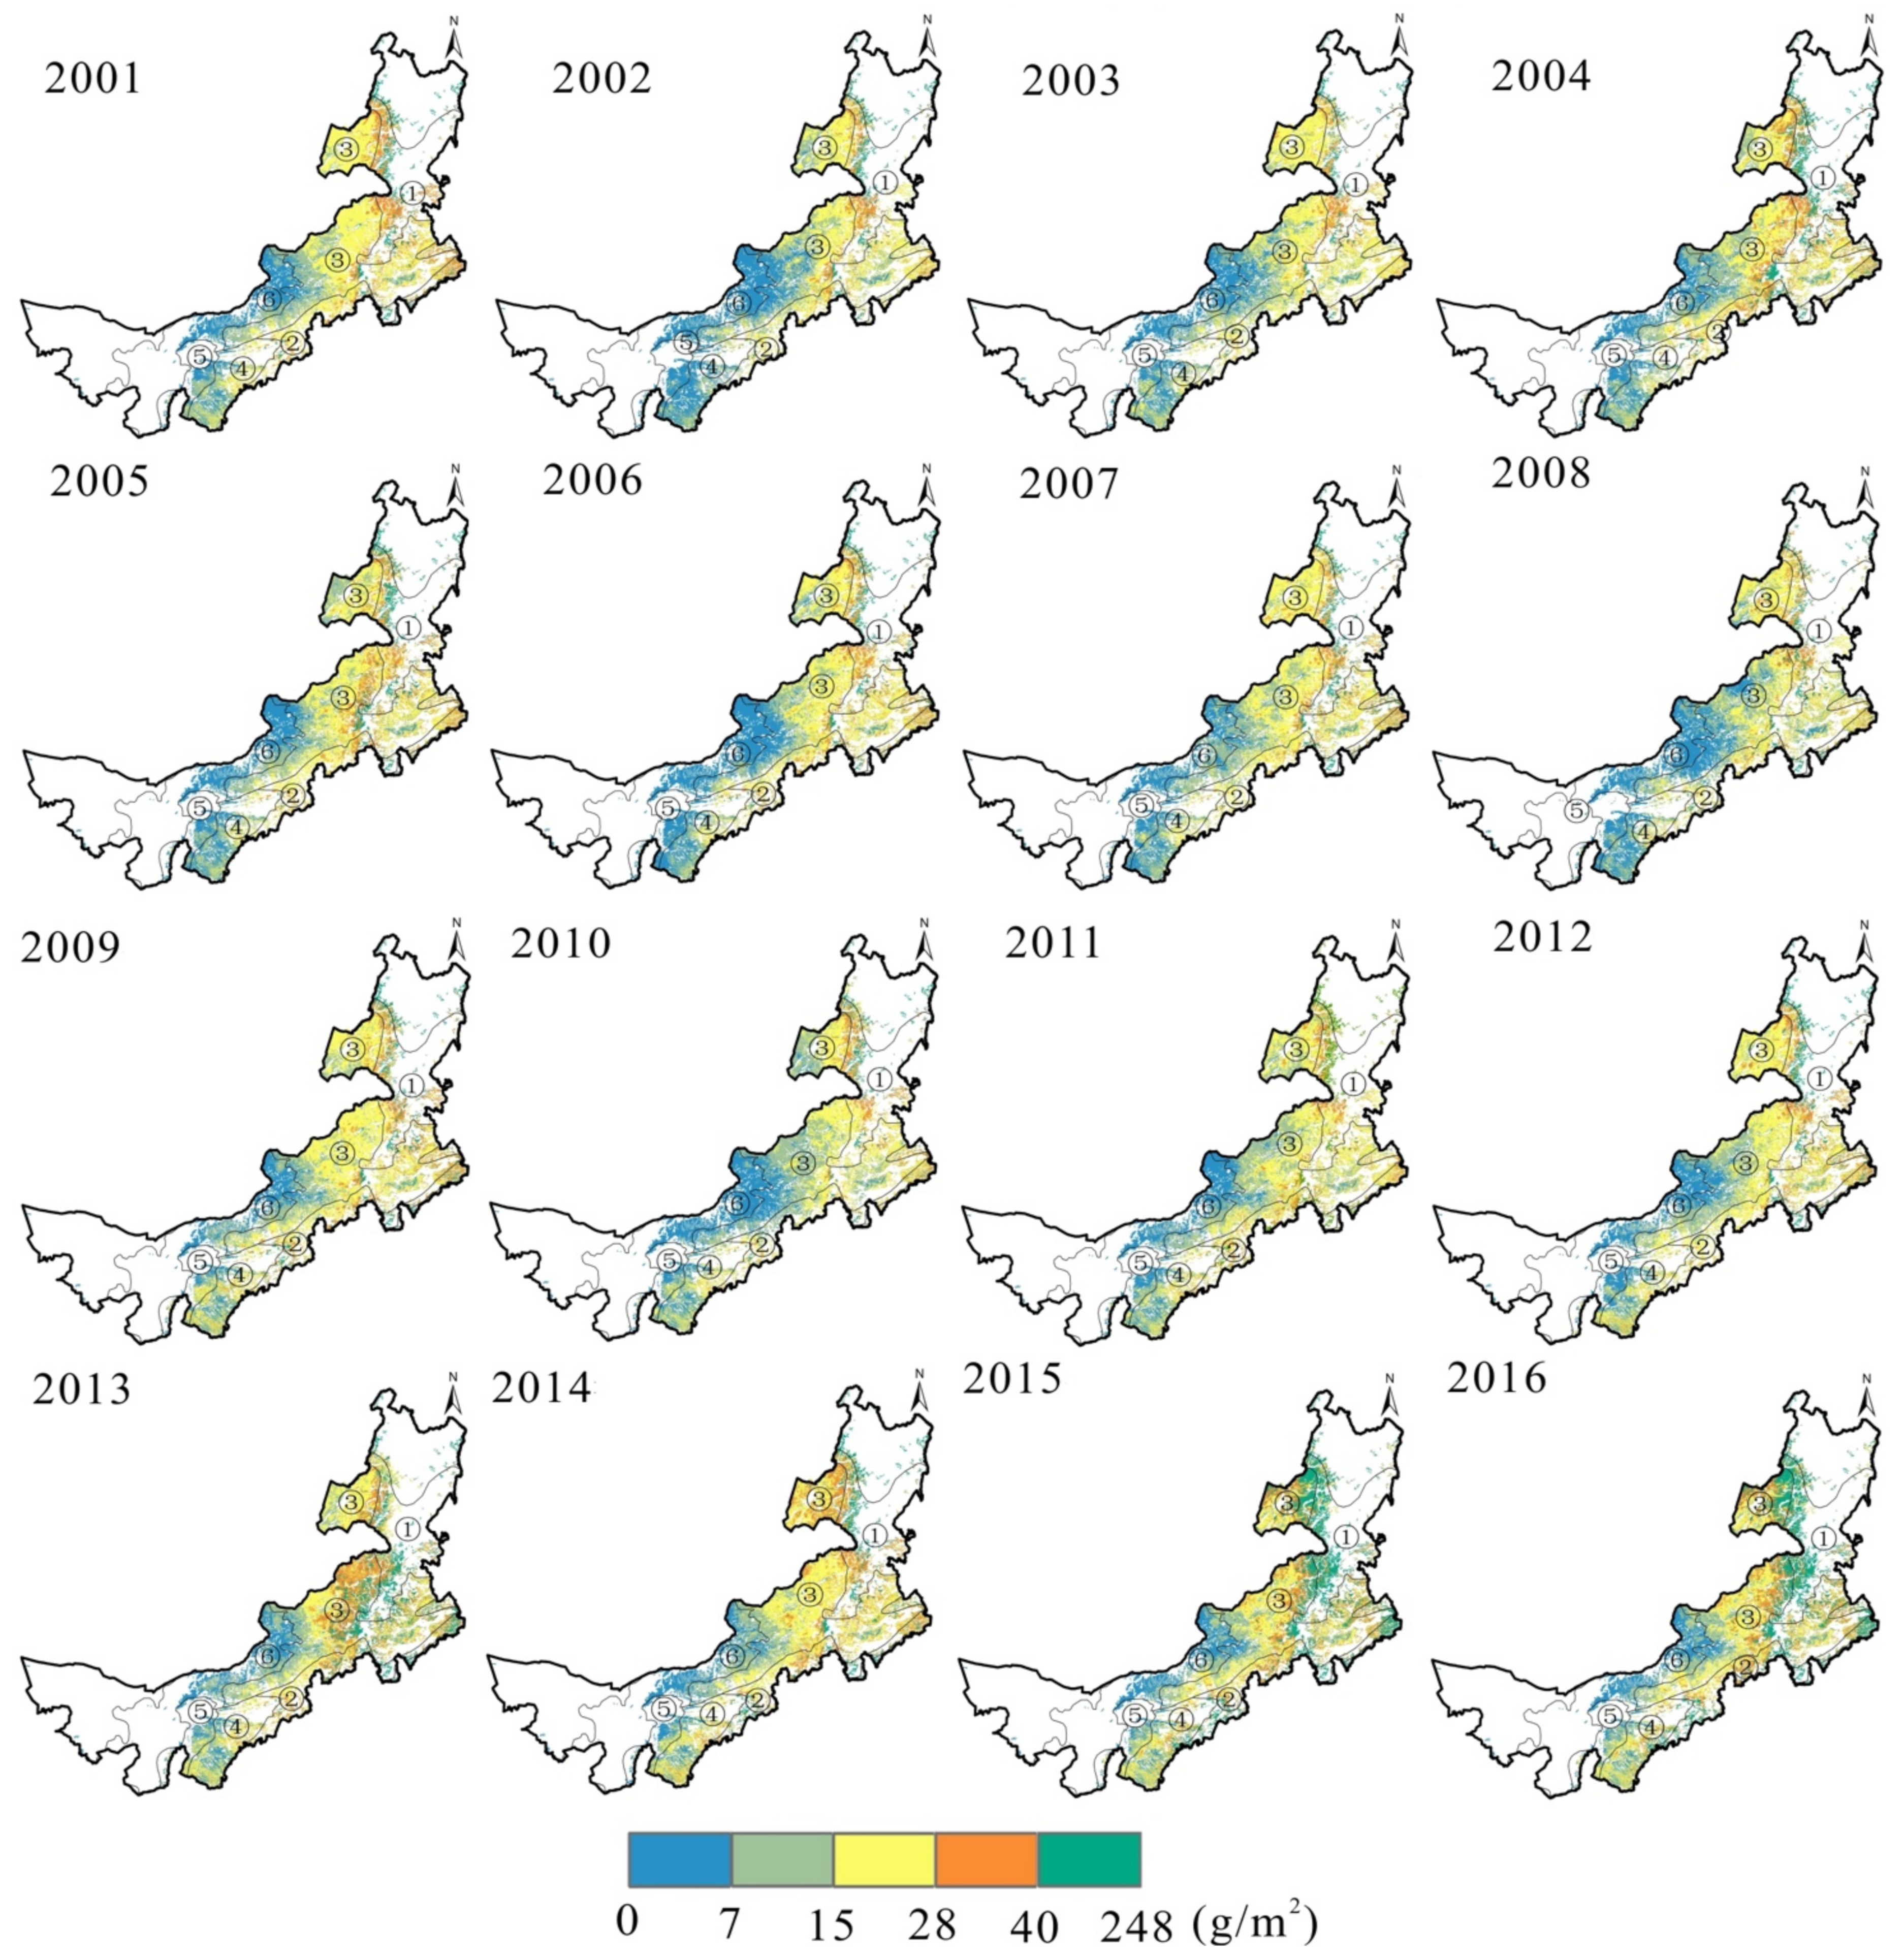
3.1.2. Spatial and Temporal Distribution of Combustible Load during the Growing Season

In the growing season, the combustible load of Inner Mongolian grasslands gradually decreased from the northeast to the southwest between 2001 and 2016, exhibiting clear regional features. Northern temperate meadow grasslands exhibited the highest combustible material load per unit area, followed by southern temperate meadow grasslands, northern temperate typical grasslands, southern temperate desert grasslands, and temperate shrub and desert grasslands (Figure 3). The combustible load per unit area of the northern temperate meadow grasslands mainly ranged from 150 to 318 g/m2, with an average area share of 80.7% in the region from 2001 to 2016, and the minimum and maximum values occurred in 2007 and 2013, corresponding to 47.1% and 92.1%, respectively. The combustible load per unit area of typical grasslands in the northern temperate zone mainly ranged from 50 to 200 g/m2, with an average area share of 83.6% in this zone from 2001 to 2016, and the minimum and maximum values occurred in 2012 and 2006, corresponding to 34.9% and 93.1%, respectively. Among them, the area of grasslands with combustible load between 50 and 85, and between 85 and 150 g/m2 had an average share of 66.7% in the region for 16 years. The interannual fluctuations were minimal. In contrast, the area between 150 and 200 g/m2 varied greatly from year to year, and a 30% difference in the share was noted between years. The combustible load per unit area of southern temperate meadow grasslands mainly ranged from 50 to 200 g/m2, and the average percentage of area in this region was 90% from 2001 to 2016. Among them, the area of grasslands with combustible material load between 85 and 150 g/m2 had an average share of 49.9% in this region in 16 years, and the minimum and maximum values occurred in 2009 and 2003, corresponding to values of 37.8% and 61.2%, respectively. The typical grasslands in the southern temperate zone had a combustible load per unit area mainly ranging from 35 to 150 g/m2, with an average area share of 96.2% in the region from 2001 to 2016. Among them, the area of grasslands with the minimum and maximum values occurred in 2001 and 2010, corresponding to 38.4% and 69%, respectively. The combustible load per unit area of southern temperate desert grasslands mainly ranged from 35 to 85 g/m2, with an average share of 86.6% of the area in the region from 2001 to 2016, and the minimum and maximum values occurred in 2012 and 2013, corresponding to 63% and 94.3%, respectively. The combustible load per unit area of temperate shrubs and grassy deserts mainly ranged from 35 to 85 g/m2, with an average area share of 94.3% in this zone from 2001 to 2016. Among them, the average percentage of grasslands area with combustible load between 27 and 50 g/m2 was 68% over 16 years, and the minimum and maximum values occurred in 2012 and 2005, corresponding to 16.2% and 89%, respectively.
The area share of various classes of combustible load per unit area in northern temperate meadow grasslands, southern temperate desert grasslands, and temperate shrub desert grasslands formed a sharp contrast, with the peak area shares of northern temperate meadow grasslands ranging from 200 to 318 g/m2. The peak areas of typical grasslands in the northern temperate zone varied from 85 to 150 g/m2, those in the southern temperate zone varied from 50 to 85 g/m2, and those in the southern temperate zone for desert grasslands and temperate shrub desert grasslands varied from 35 to 50 g/m2 (Figure 4).
The growing season combustible load (dry weight of plants) in Inner Mongolia from 2001 to 2016 was 7.7 × 10¹¹ kg, and the six grassland vegetation type subcategories in descending order were: typical northern temperate grasslands > northern temperate meadow grasslands > southern temperate meadow grasslands > typical southern temperate grasslands > temperate shrub desert grasslands > southern temperate desert grasslands (Figure 5a). A total of 70.4% of the Inner Mongolia grasslands area showed an increasing trend of combustible load from 2001 to 2016 (Figure 5b), of which the non-significantly increasing area accounted for 52.3% of the whole grassland area, the significantly increasing area accounted for 7.4% of the whole grassland area, and the very significantly increasing area accounted for 10.7% of the whole grassland area. Inner Mongolia’s grasslands are located in the southeast and southwest. The area with a declining trend in combustible material load represented 29.6% of the overall grasslands area, and 28.6% of the area exhibited a very substantial decline, especially in parts of the typical grasslands and meadow grasslands in the northern temperate zone. The average annual combustible load of northern temperate meadow grasslands was 1.15 × 10¹⁰ kg (Figure 5a), fluctuating between 8.98 × 10⁹ and 1.27 × 10¹⁰ kg in 16 years, with a considerable reduction in 2007 and an increase in 2012. Among these, 61.2% exhibited a growing trend, 54.5% exhibited a nonsignificant increase, and 37.9% exhibited a nonsignificant decrease. The average annual combustible load of northern temperate grasslands was 2.47 × 10¹⁰ kg, fluctuating between 1.99 × 10¹⁰ and 3.14 × 10¹⁰ kg over 16 years with a minor upward trend. Among these, 61.2% exhibited a growing trend, 54.5% exhibited a nonsignificant increase, and 37.9% exhibited a nonsignificant decrease. The areas of typical southern temperate grasslands, southern temperate desert grasslands, and temperate shrub desert grasslands increased somewhat over 16 years, with 51% of typical southern temperate grasslands showing a significant growing tendency.

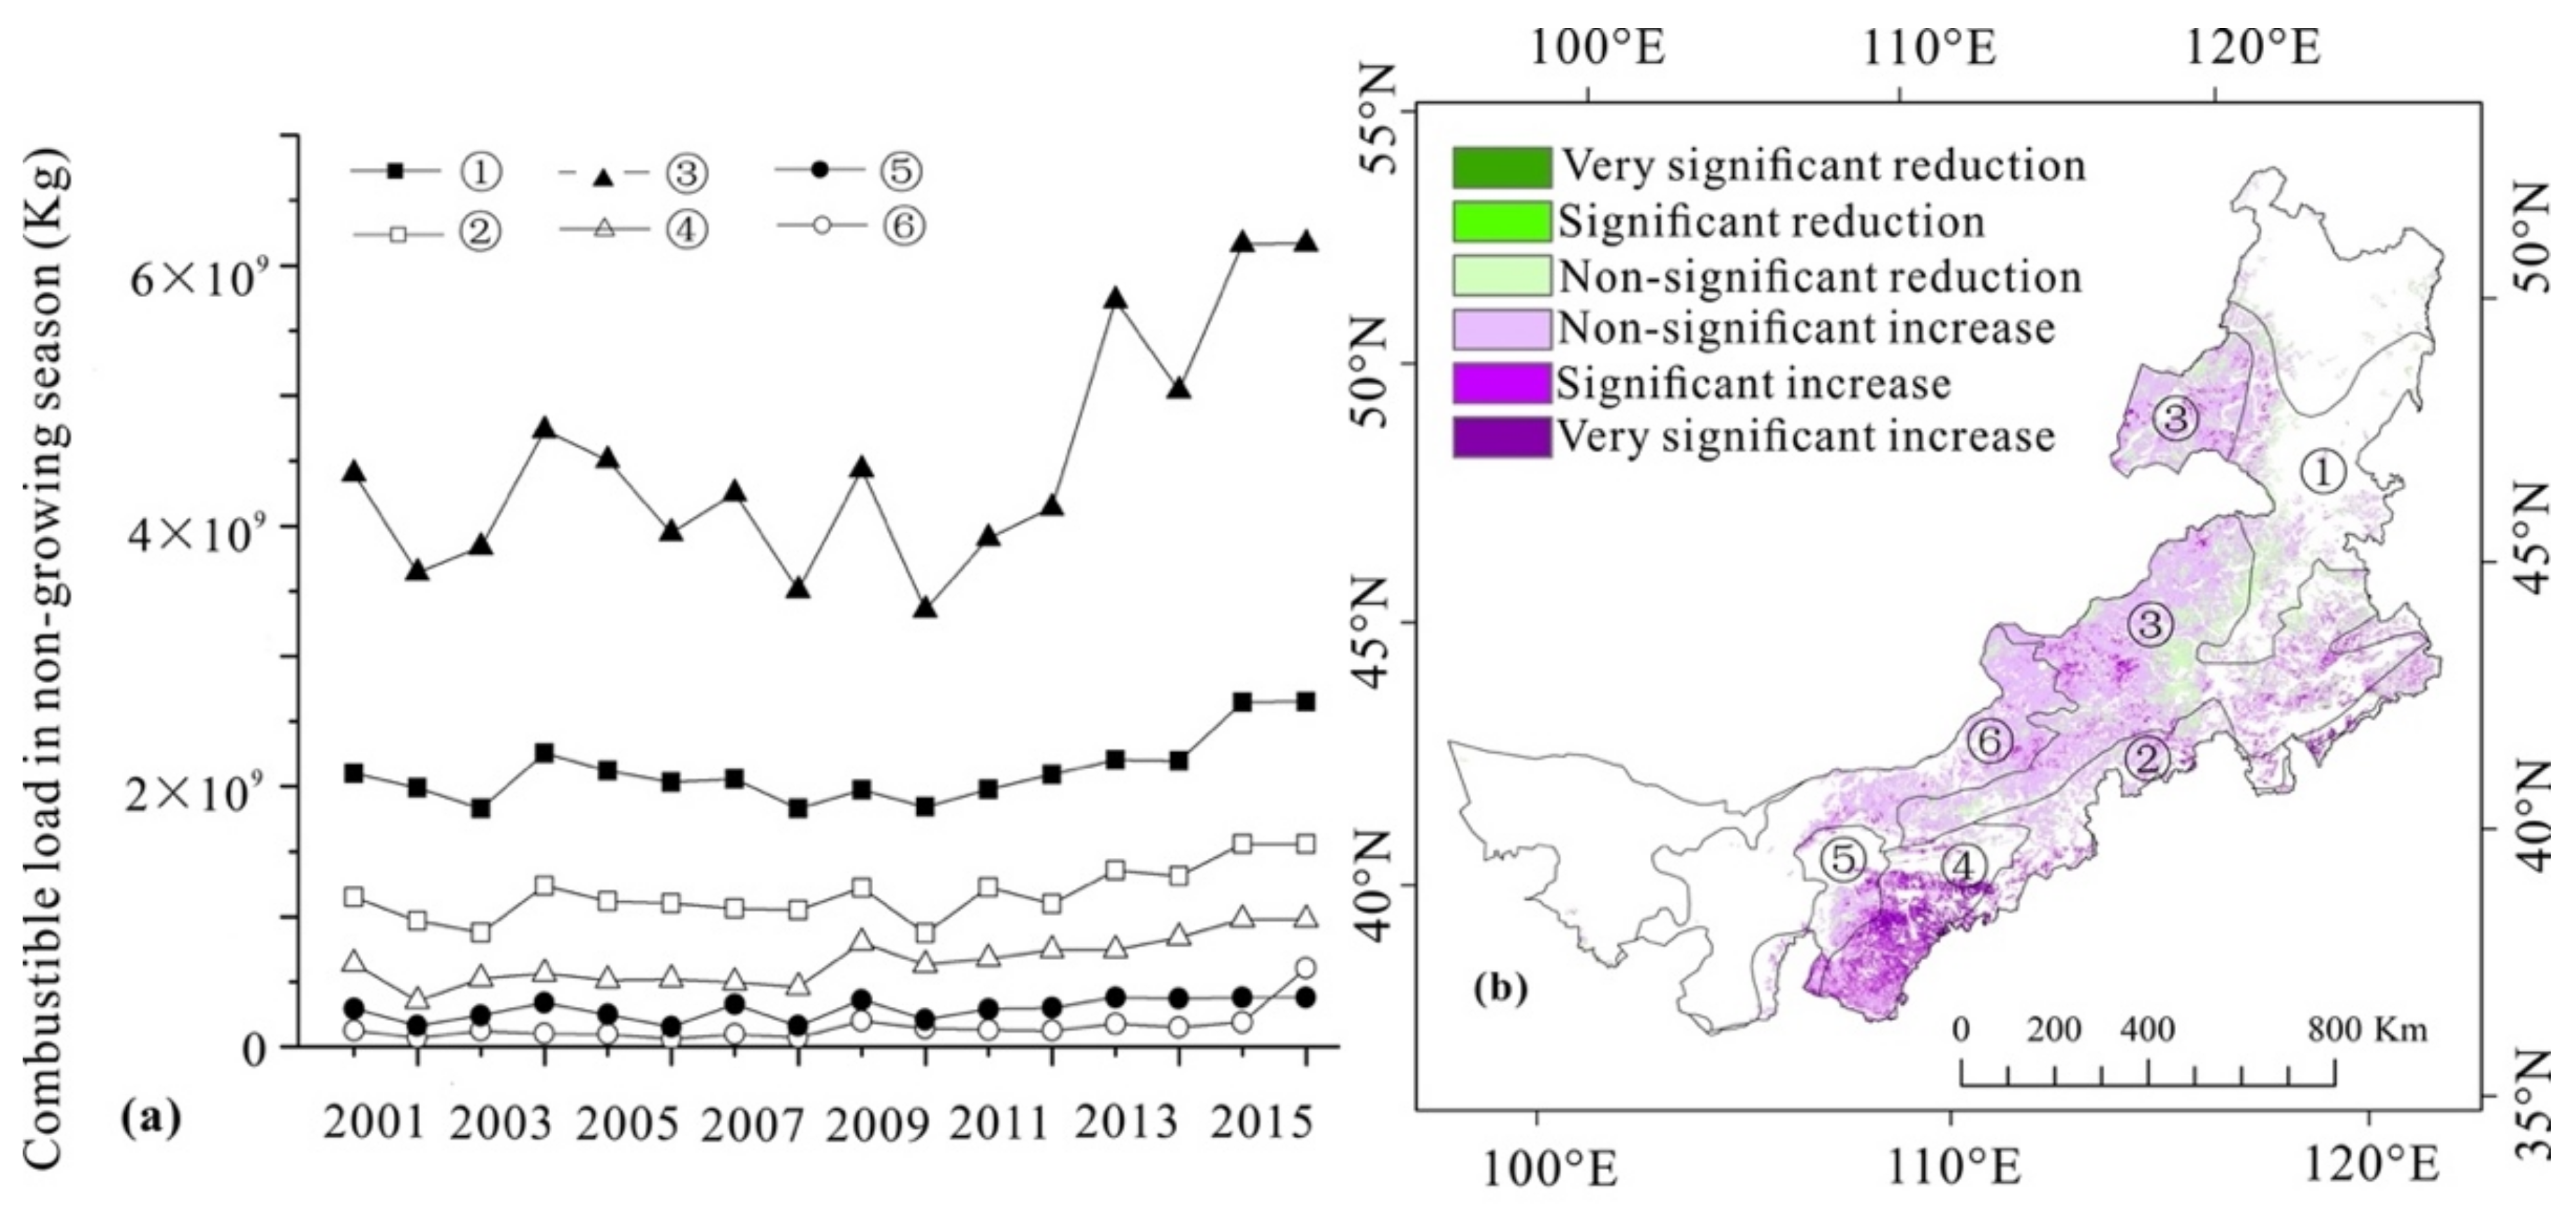
3.1.3. Spatial and Temporal Distribution of Combustible Loads during the Nongrowing Season

The combustible load in Inner Mongolian grasslands during the dormant season gradually decreased spatially from northeast to southwest between 2001 and 2016, exhibiting clear regional characteristics. Southern temperate desert grasslands had the highest combustible load per unit area, followed by northern temperate meadow grasslands, northern temperate typical grasslands, southern temperate desert grasslands, and temperate shrub desert grasslands (Figure 6). In the nongrowing season, the southern temperate desert grasslands and the temperate shrub and graminoid desert had the highest area share of combustible material load per unit area, whereas the northern temperate typical grasslands, the southern temperate meadow grasslands, and the southern temperate desert grasslands had the highest area share of combustible material load per unit area during the growing season (Figure 4). The combustible load per unit area of the northern temperate meadow grasslands primarily ranged between 15 and 248 g/m2 (Figure 6), accounting for an average of 97.4% of the region’s area from 2001 to 2016, with the minimum and maximum values occurring in 2003 and 2001, corresponding to 93.6% and 99%, respectively. The average share of grasslands with combustible loads between 40 and 248 g/m2 in the region over the past 16 years was 34.4%. The area of southern temperate meadow grasslands with combustible material load per unit area ranged mostly between 7 and 40 g/m2, and the average percentage of area in this region from 2001 to 2016 was 84.9%. The area of grasslands with combustible loads between 15 and 28 g/m2 comprised an average of 47.4% of this zone throughout a 16 year period, with the lowest and highest values occurring in 2015 and 2005, with values of 30.2% and 58.8%, respectively. The typical grasslands in the northern temperate zone had a combustible load per unit area ranging from 7 to 40 g/m2, accounting for an average of 86.8%, with minimum and maximum values of 79.4% and 93.4%, occurring in 2015 and 2009, respectively.
The area with a combustible load between 7 and 28 g/m2 comprised an average of 37.6% of this zone throughout a 16 year period. From 2001 to 2016, the combustible load per unit area of typical grasses in the southern temperate zone fluctuated predominantly between 0 and 28 g/m2, with an average area share of 92.1% in the region. The area with combustible loads between 7 and 15 g/m2 had an average share of 33.9% in this region throughout a 16 year period, with the lowest and highest values occurring in 2015 and 2003, corresponding to values of 27.4% and 40%, respectively. From 2001 to 2016, the combustible load per unit area of southern temperate desert grasslands varied mostly between 0 and 28 g/m2, with an average area share of 99.9% in the region. The combustible load per unit area of temperate shrub and grasslands deserts generally ranged from 0 to 15 g/m2. From 2001 to 2016, grasslands comprised 98.5% of the area in Inner Mongolia. The area with combustible loads between 0 and 7 g/m2 had a 16 year average share of 76.6% in the region, with minimum and maximum values in 2014 and 2006, equal to 58.5% and 95.4%, respectively.
The average annual combustible load (dry weight of plants) during the nongrowing season in Inner Mongolia from 2001 to 2016 was 1.4 × 10¹¹ kg. The combustible load during the nongrowing season for six grassland vegetation types exhibited the following trend: typical northern temperate grasslands > northern temperate meadow grasslands > southern temperate meadow grasslands > typical southern temperate grasslands > temperate shrub desert grasslands > southern temperate desert grasslands (Figure 7a).
In 2016, the nongrowing season trend of combustible load increased overall (Figure 7b), with 80.1% of the Inner Mongolia grassland region exhibiting an increasing trend of combustible load. The non-significantly increasing areas comprised 69.4% of the total grassland area, whereas the extremely considerably increasing areas comprised 2.9% of the total grassland area, primarily on the southwest side of the Inner Mongolia grasslands area. The area with a decreasing trend of combustible load accounted for 19.9% of the total grassland area, and the area with a decreasing trend that was not statistically significant accounted for 19.6% of the total grassland area, primarily distributed in the south side area of the northern temperate meadow grasslands. The average annual combustible load of typical northern temperate grasslands was 4.49 × 10⁹ kg (Figure 7a), which fluctuated within the range of 3.36 × 10⁹–6.17 × 10⁹ kg over the course of 16 years, and the combustible load increased dramatically during the nongrowing season since 2010. A total of 82.8% of the area showed an increasing trend, of which 77.8% was non-significantly increasing and 17.2% was non-significantly decreasing. Over a period of 16 years, the average annual combustible load of northern temperate meadows increased slightly from 1.83 × 10⁹ to 2.65 × 10⁹ kg. Specifically, 62.5% of the area had an increasing trend, with 59% increasing non-significantly and 37% declining non-significantly. Over the course of 16 years, the combustible load of typical southern temperate grasslands, southern temperate meadow grasslands, southern temperate desert grasslands, and temperate shrub desert grasslands grew in the range of 6 × 10⁷ to 1.6 × 10⁹ kg and exhibited an upward trend.

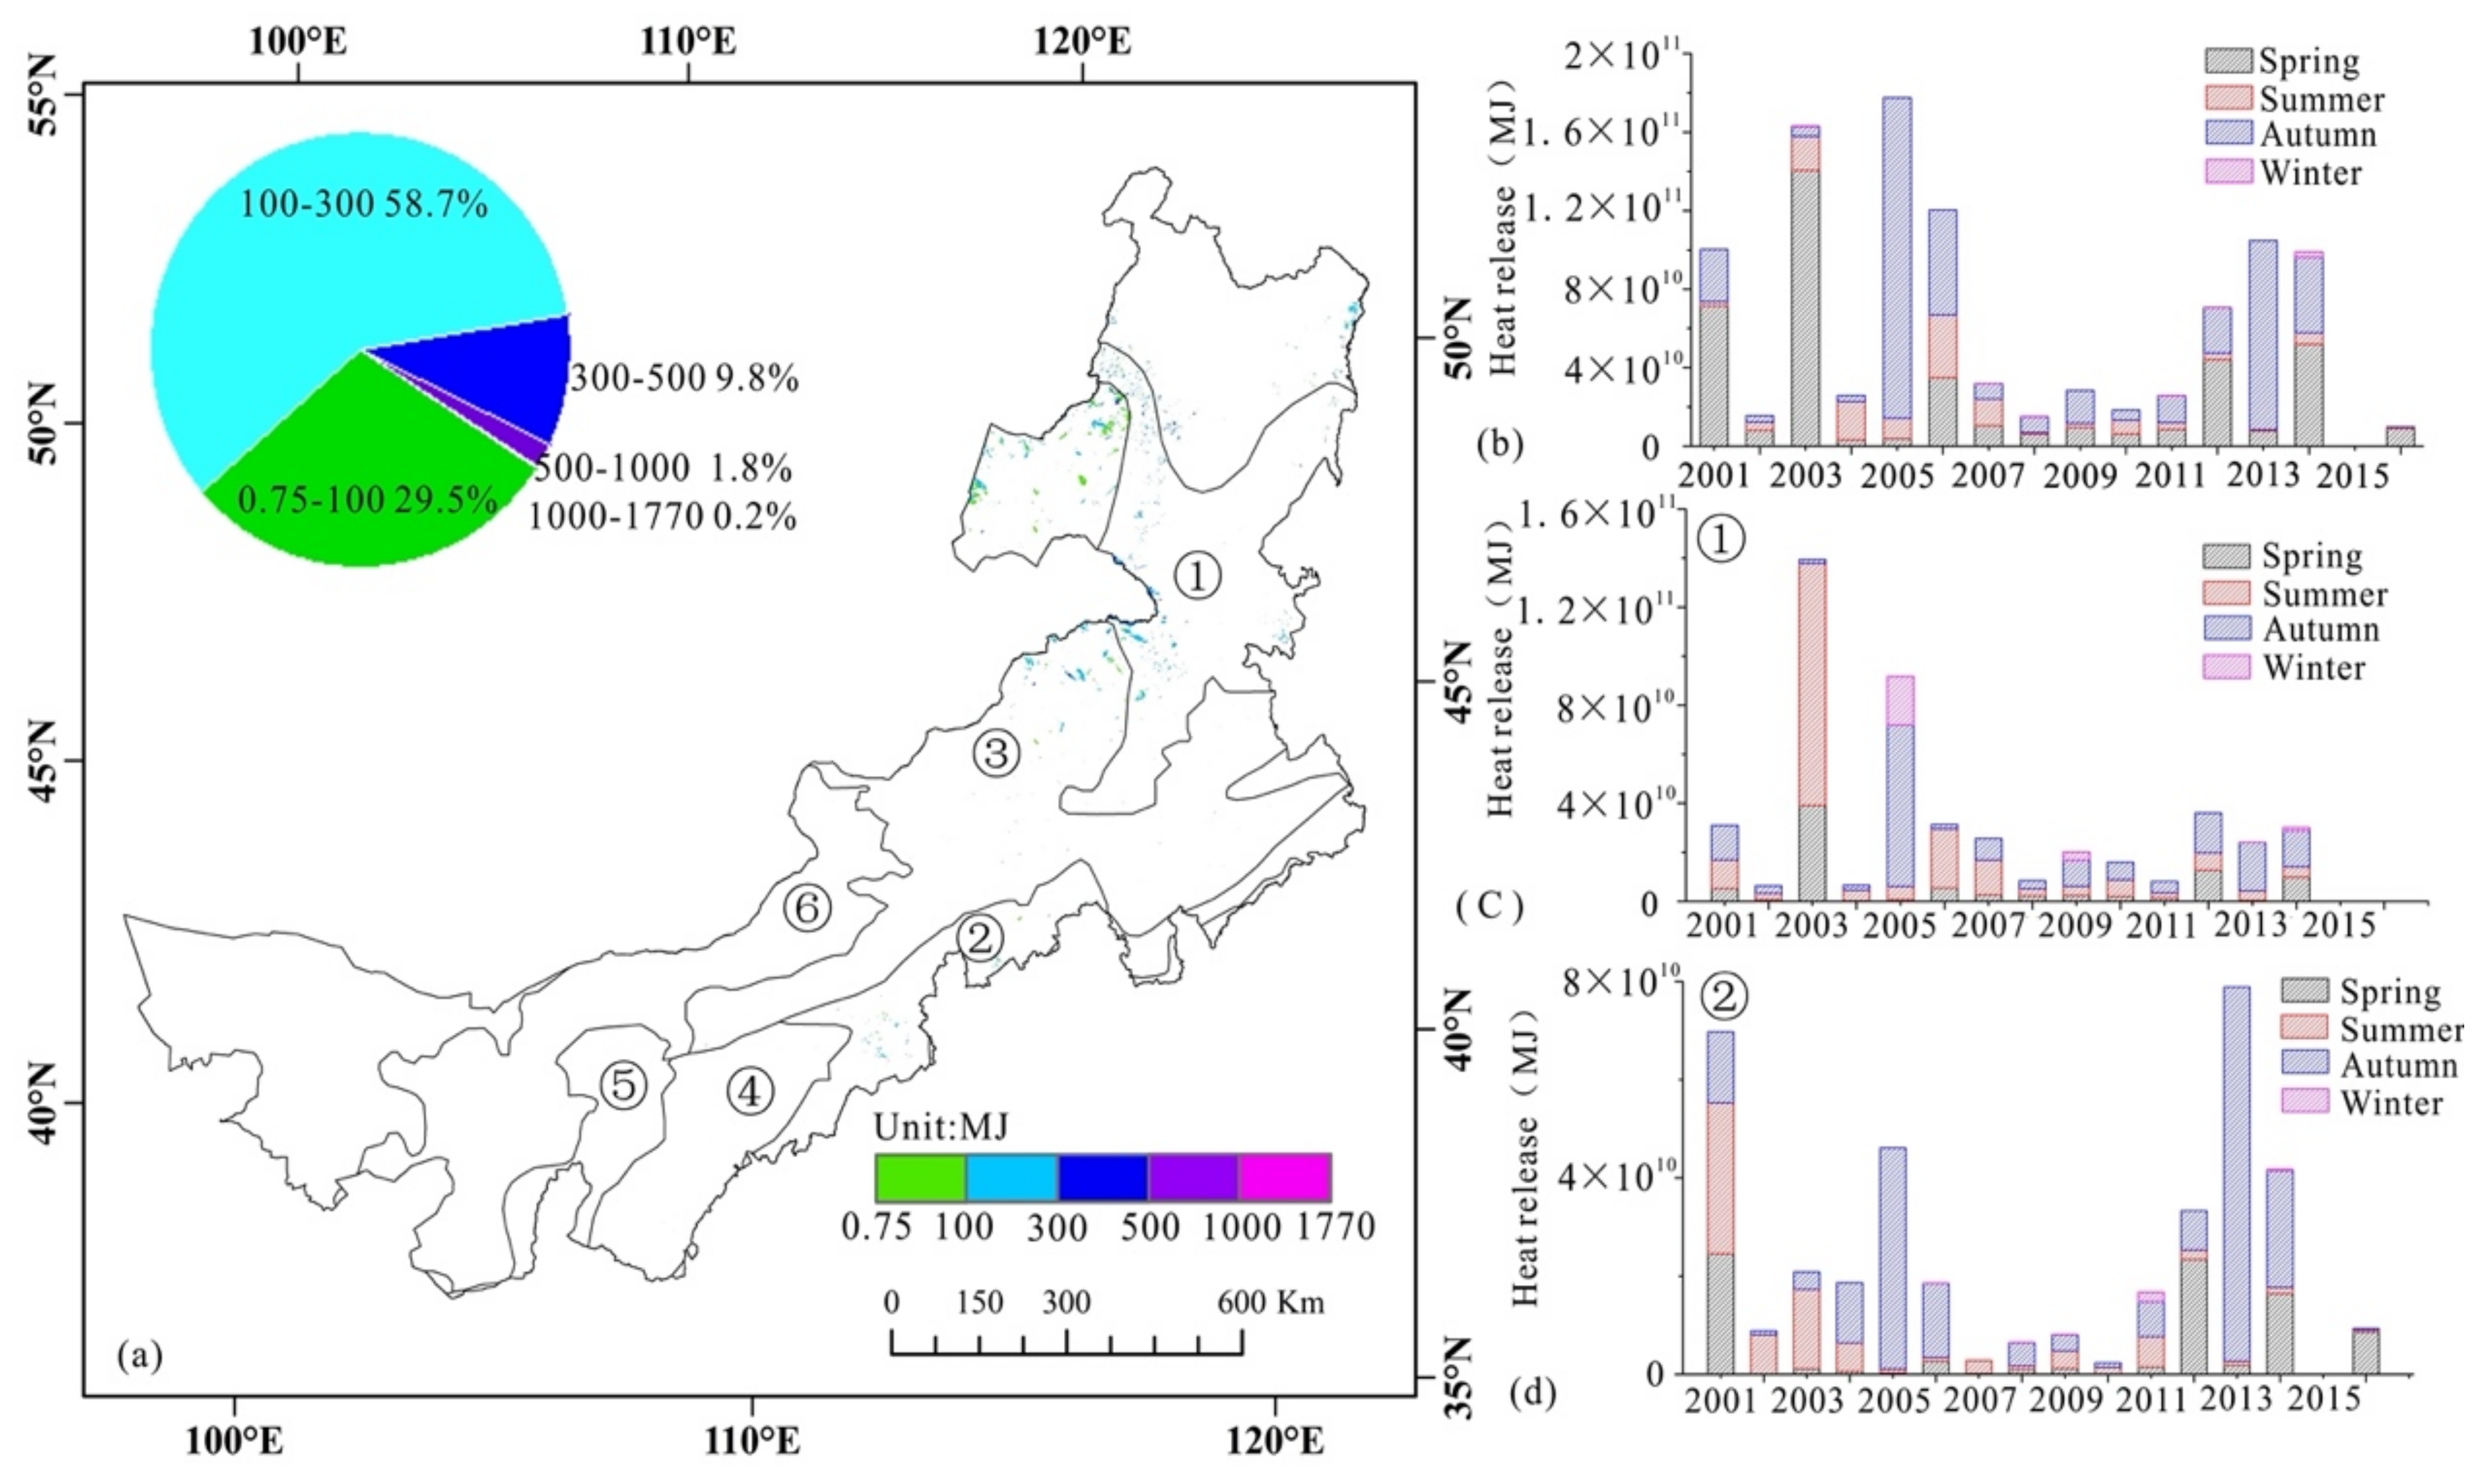
3.2. Spatial and Temporal Distribution of Total Surface Heat Release from Grassland Fires in Inner Mongolia

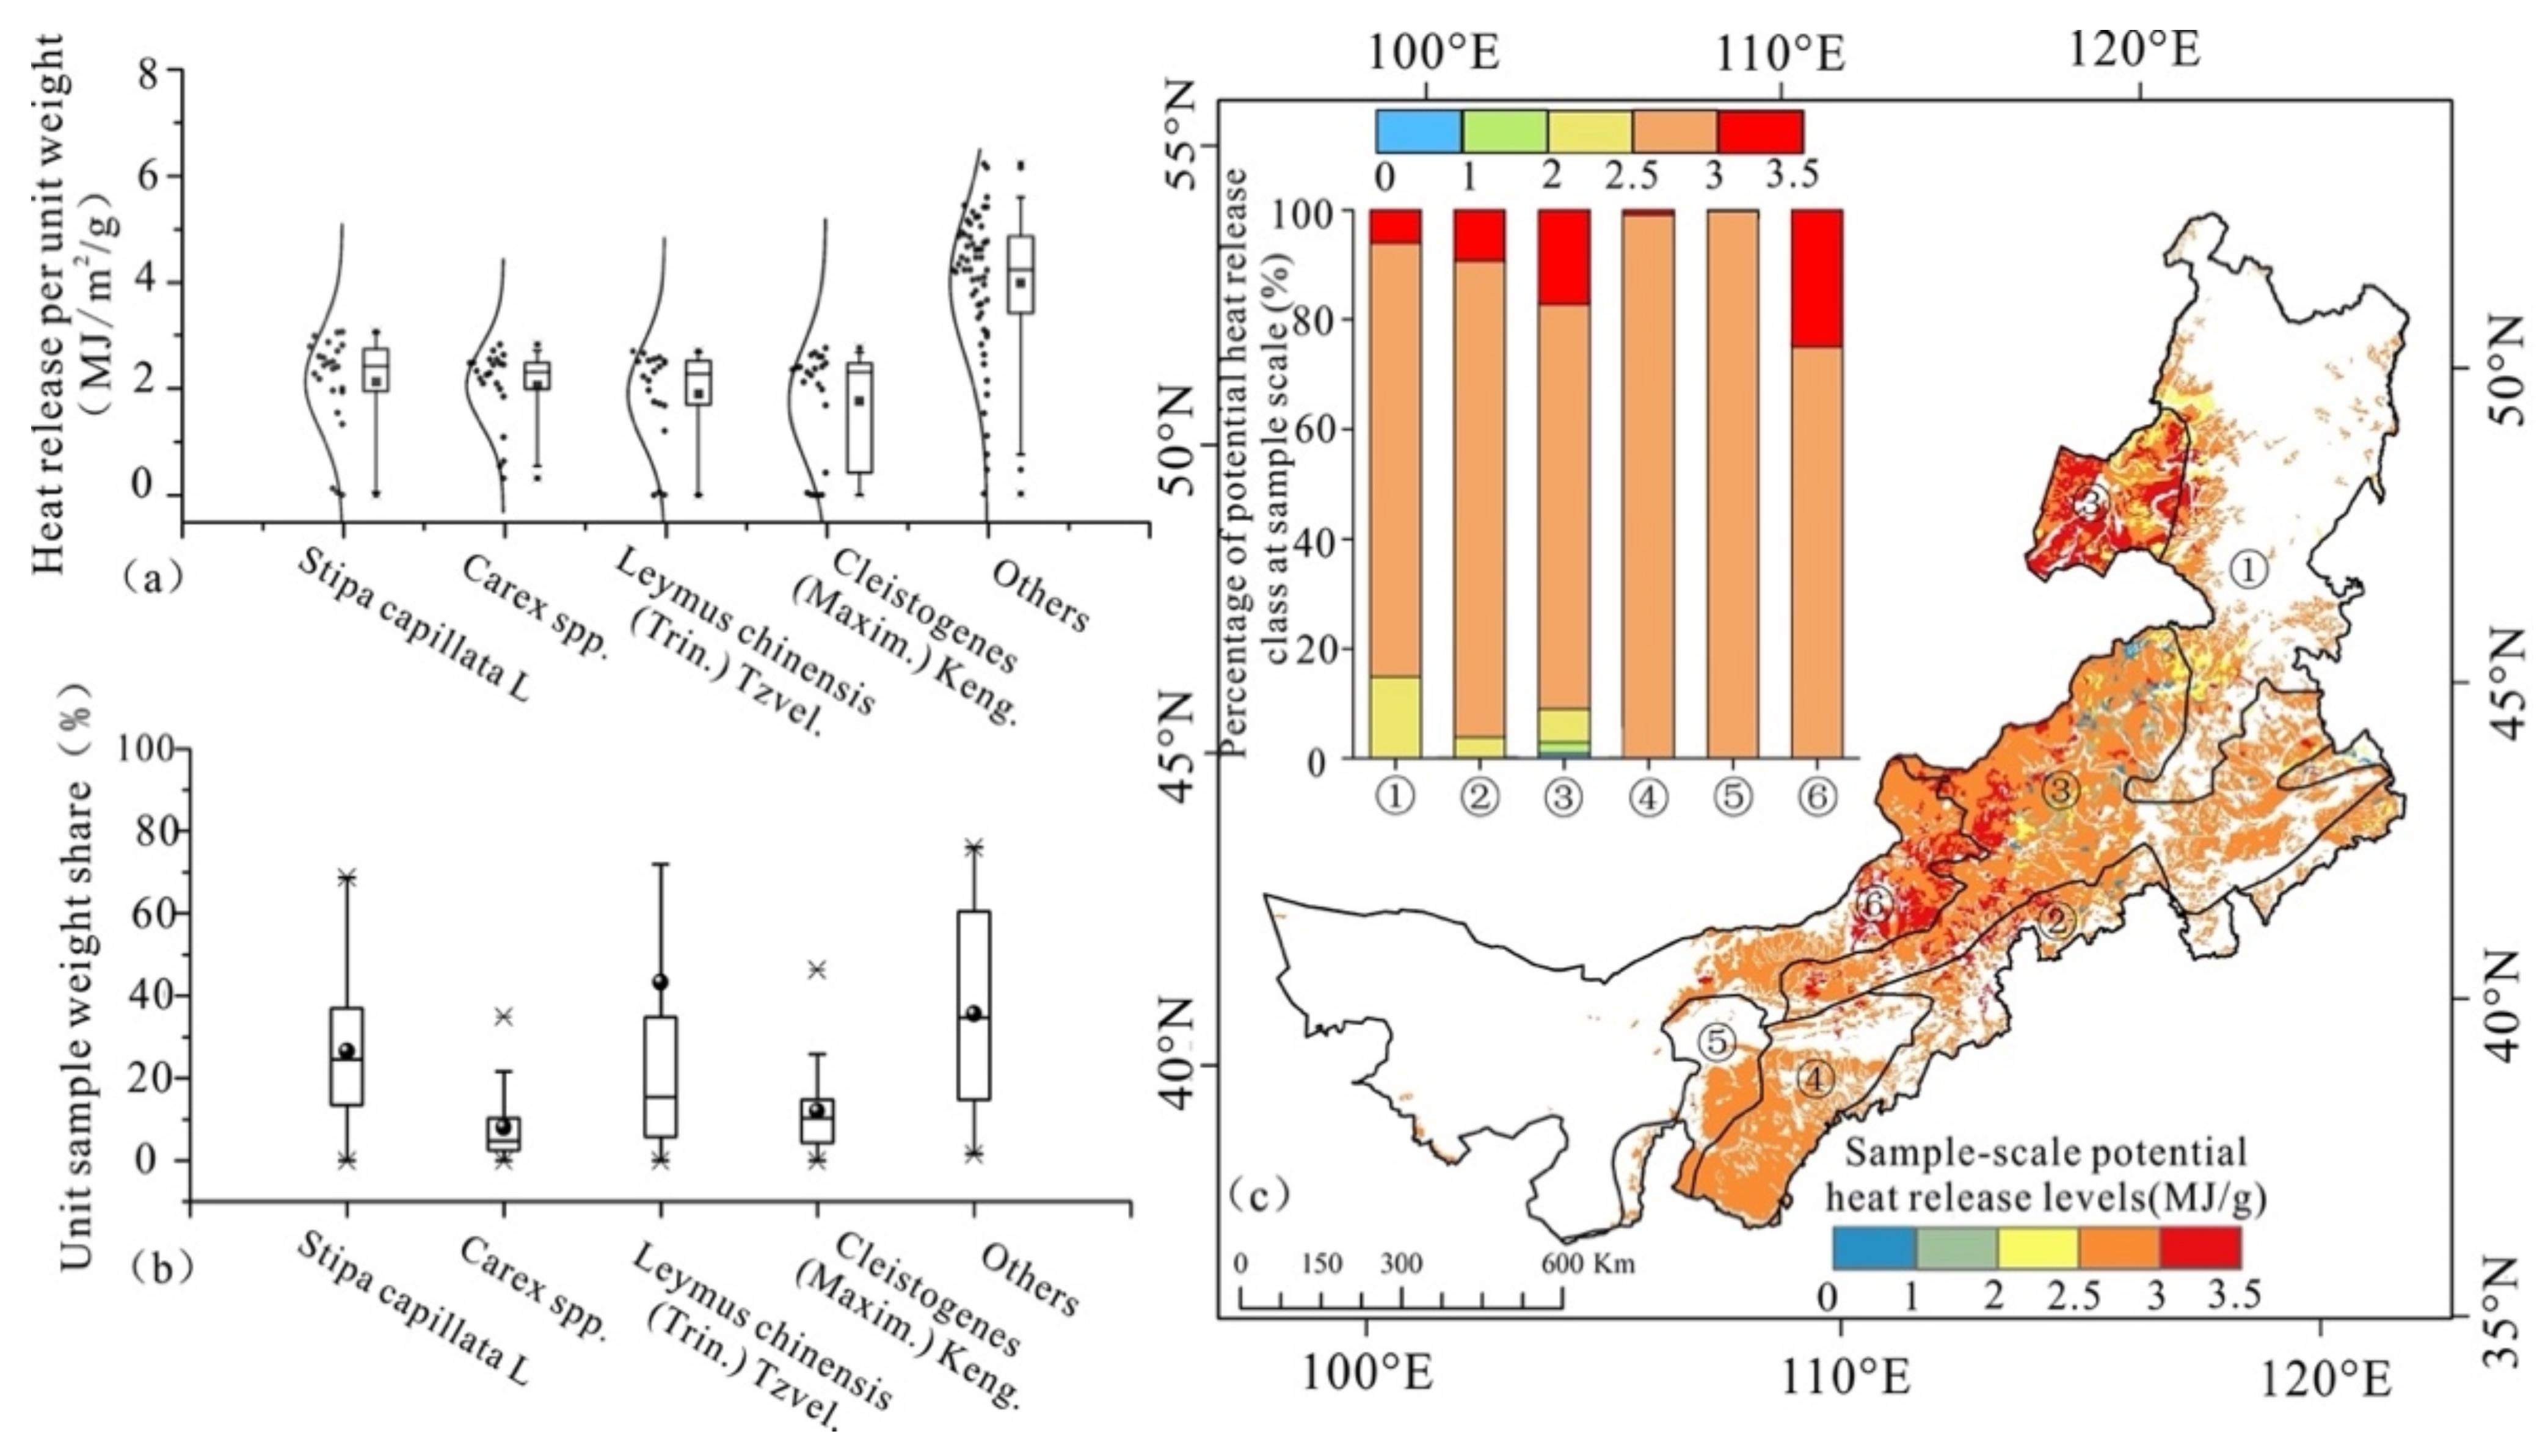
3.2.1. Heat Release Per Unit Area

The heat release per unit weight of 28 vegetation type subclasses of Leymus chinensis, Stipa capillata, Cleistogenes squarrosa, and Carex doniana was evaluated. The results were consistent with a normal distribution, with the majority of the data falling within the 95% confidence interval. Except for Cryptomeria, the top and lower quartiles, as well as the mean and median values, were all quite close. Stipa capillata, Cleistogenes squarrosa, Carex doniana, and Leymus chinensis had mean heat release values per unit weight of 2.13, 1.77, 2.06, and 1.9 MJ/m2, respectively, whereas the values for the other plants (including 50 plants) ranged from 0.03 to 6.23 MJ/m2 with a mean value of 3.99 MJ/m2 (Figure 8a). There were 28 vegetation type subclasses of Stipa capillata, Cleistogenes squarrosa, Carex doniana, Leymus chinensis, and other plants. The median plant sample weight share was 28%, 14%, 9%, 21%, and 29% for Stipa capillata, Cleistogenes squarrosa, Carex doniana, Leymus chinensis, and other plants, respectively; however, the mean of Leymus chinensis was greater than that of the top quartile (Figure 8b). The mean heat release of sample-scale Stipa capillata, Cleistogenes squarrosa, Carex doniana, Leymus chinensis, and other plants was calculated using the weighted average approach with values of 0.51, 0.18, 0.17, 0.3, and 1.42 MJ/g, respectively.
The sampling sites in this study were concentrated in the typical northern temperate grassland area and covered more plant types, and the sample-scale potential heat release was more spatially distinct in the region (Figure 8c) with 3–3.5 MJ/g values dominating at the northern side of the typical northern temperate grasslands and the junction of the typical northern temperate grasslands with temperate shrubs and grassy deserts. The area not covered by sample sites was substituted by the average value of 28 plant type subclasses (2.58 MJ/g), accounting for 67% of the total area. The potential heat release at the Inner Mongolia grasslands sample scale represented 6.1%, 78.9%, and 13.6%, whereas the potential heat release at the northern temperate meadow grasslands sample scale corresponded to 14.9%, 79%, and 6.1%, respectively. At the sample scale of southern temperate meadow grasslands, the potential heat release ranged from 2 to 2.5, 2.5 to 3, and 3 to 3.5 MJ/g, representing 3.7%, 86.8%, and 9.3%, respectively, of the total area. At the scale of typical grasslands in the northern temperate zone, the potential heat release ranged from 2 to 2.5, 2.5 to 3, and 3 to 3.5 MJ/g, accounting for 6.1%, 73.3%, and 17.3%, respectively, of the total area. The plants in the sample were mostly needlegrass, Cryptomeria, iceberg grass, grasslands, thread-leaved daisy, Artemisia, and other plants. The potential heat release at the scale of the typical southern temperate grasslands sample ranged from 2.5 to 3 and 3 to 3.5 MJ/g with values of 99.1% and 0.9%, respectively. The potential heat release at the scale of the southern temperate desert grassland sample was 2.5 to 3 and 3 to 3.5 MJ/g with values of 99.8% and 0.2%. At the desert sample scale of shrub grasslands, the potential heat release varied from 2.5 to 3 and from 3 to 3.5 MJ/g, with 74.9% and 25.1%, respectively. Coneflower, Cryptomeria, and Artemisia were the main species, accounting for 60% of the area in each grassland zone. This is the source of the region’s high potential heat release. The heat release per unit mass of grass, Artemisia, and iceberg grass was 4.23, 4.47, and 4.41 MJ/m2, respectively. All of the plants exhibited greater heat release than the dominating species and accounted for a greater proportion, resulting in a higher potential spatial heat release.

3.2.2. Amount of Heat Release Due to Fire

From 2001 to 2016, the total area of grassland fires in Inner Mongolia was 7447 km2. According to statistics by vegetation type subcategory (Table 1), the fire areas of typical grasslands in the northern temperate zone and meadow grasslands in the northern temperate zone were 3278.8 km2 and 3683 km2, respectively, accounting for 93% of the total fire area in the Inner Mongolia grasslands; the fire area of meadow grasslands in the southern temperate zone was 3.7 km2, the area of desert grasslands was 0.96 km2, and the area of temperate shrub desert grassland was 10.1 km2, accounting for 1% of the grassland area in Inner Mongolia. Places with three fires accounted for 8% of the overall fire area, while areas with four, five, and six fires accounted for 1.6%, 0.8%, and 0.1% of the total fire area, respectively. The areas of typical grasslands and desert grasslands in the southern temperate zone were 3.7 km2 and 0.96 km2, respectively, while the area for desert grasslands in the temperate zone was 10.1 km2, accounting for 1% of the grassland area in Inner Mongolia.
From 2001 to 2016, the areas of Inner Mongolia grasslands that were most responsible for the emission of heat were primarily in the typical grassland area of the northern temperate zone and the meadow grassland area of the northern temperate zone (Figure 9a). The heat release that occurred between 0.75 and 100 MJ accounted for 29% of the total heat release that occurred over the course of 16 years at the sample scale, the heat release that occurred between 100 and 300 MJ accounted for 59%, the heat release that occurred between 300 and 500 MJ accounted for 10%, and the heat release that occurred between 500–1770 MJ accounted for 2%.
From 2001 to 2016, the grassland region of Inner Mongolia had a total heat release of 1.01 × 10¹² MJ (Figure 9b), with an overall fluctuating downward trend in the interannual variance of total heat release. The years 2001, 2003, 2005, 2006, 2013, and 2014 were the years with the highest heat release, with 1 × 10¹¹ MJ, 1.63 × 10¹¹ MJ, 1.77 × 10¹¹ MJ, 1.2 × 10¹¹ MJ, 1.05 × 10¹¹ MJ, and 9.9 × 10¹⁰ MJ, respectively. The discharge of heat from grasslands throughout the year in Inner Mongolia was primarily concentrated during the months of spring and fall. Grassland fires in Mongolia and Russia can be easily influenced by the prevailing northern west winds and, thus, spread to the area. This results in high frequency, long duration, and large coverage area of grassland fires in the border area, showing a spatial and temporal concentration of heat release. The low rainfall in spring and autumn in the grassland area of Inner Mongolia is also a contributing factor. The amount of heat that was released in the area of the northern temperate meadow grasslands from the year 2001 to 2016 was 4.75 × 10¹¹ MJ (Figure 9c), and the amount of heat that was released changed relatively little from year to year with the exception of 2003 and 2005. In 2003 and 2005, there was a greater release of heat (1.39 × 10¹¹ MJ and 9.17 × 10¹⁰ MJ, respectively); however, in 2015 and 2016, there was no emission at all. The majority of the heat that was released in the region between the years 2001 and 2016 was concentrated during the months of summer and autumn, with the heat that was released during the summer of 2003 accounting for 70.8% of the entire year. The total amount of heat that was released in the typical northern temperate grasslands zone during the years 2001 to 2016 was 3.82 × 10¹¹ MJ, and the interannual variation of heat release essentially displayed a U-shaped pattern. This data can be found in Figure 9d. The heat release was greater in the years 2001, 2005, 2013, and 2014, with 6.97 × 10¹⁰ MJ, 4.61 × 10¹⁰ MJ, 7.89 × 10¹⁰ MJ, and 4.17 × 10¹⁰ MJ, respectively, in contrast to the value of zero in 2015. Between 2001 and 2016, intra-annual heat release was primarily concentrated in the spring, summer, and autumn seasons, with the heat release in 2005 and 2013 accounting for 97% and 96% of the annual heat release in autumn, in summer of 2001 and 2003 accounting for 77.6% and 44.1%, and in spring of 2001, 2012, and 2014, accounting for 35%, 70%, and 39.3%, respectively.

4. Discussion

4.1. Estimation of Combustible Load

Due to the different sources of the calculated parameters, there may be some doubt about how accurate the calculations are. The grassland combustible load is used to calculate the heat release; thus, estimating the grassland combustible load requires choosing a good model for the grassland combustible quantity. The differences in the results of different studies may be related to the source and quality of the ground sample data used, the spatial and temporal resolution of the remote sensing data and the spatial and temporal match with the ground data, the classification criteria of grassland types, the estimation methods, the spatial and temporal magnitude of the study, etc. Other scholars obtained the aboveground biomass results for different regions using different survey and estimation methods. The results of the growing season combustible load estimation in this paper were roughly the same as those of the above scholars, as shown in Table 2. The conclusions drawn by Ma [47] and Wang [48] were all actual measurements from field sampling; the results of Piao [44] were calculated using national grassland census data combined with remote sensing images; the results of Jhon [49] were estimated using field sampling in Mongolia, China, and Inner Mongolia Autonomous Region in June, July, and August 2006–2016, combined with remote sensing images from the same period; the results of Le [50] were estimated by constructing a random forest model based on remote sensing measurements of above-round biomass of different grassland types in Inner Mongolia.
The hydrothermal conditions during the nongrowing season are no longer conducive to plant growing, and the existing combustible load is decreasingly influenced by biotic (animals, microbes, and plants), abiotic (precipitation, temperature, and wind), and management factors (grazing and mowing) [51]. Other researchers achieved the results of aboveground biomass and plant cover in various places during the nongrowing season by utilizing various survey and estimating techniques. Cui [52] used field survey data to estimate the preservation rate of Inner Mongolia grasslands in the nongrowing season relative to the last month of the growing season (October). Ren [53] used ground hyperspectral observations of Inner Mongolia desert grasslands in the growing season from 2009 to 2010 and the corresponding nongrowing season to estimate the preservation rate of Inner Mongolia desert grasslands in the nongrowing season. Sunit Zuoqi’s non-green biomass was estimated to range between 3.4 and 123.4 g/m2. Yu [54] conducted field sampling of the nongrowing season of Inner Mongolia grasslands, combined with remote sensing data to establish a model for estimating the amount of combustible material in the dry season, resulting in the amount of combustible material in the nongrowing season of meadow grasslands, typical grasslands, and desert grasslands as 0–10 g/m2. Using the NDVID image element trimodal method, Wang [55] estimated the photosynthetic and non-photosynthetic vegetation cover of a typical grasslands experimental area in Inner Mongolia for the entire year of 2017. The non-photosynthetic vegetation cover ranged from 18.4% to 50.4%, with the lowest value occurring on day 225 and the highest value occurring on day 305. After day 225, photosynthetic and non-photosynthetic vegetation cover exhibited radically different tendencies, with non-photosynthetic vegetation cover increasing and photosynthetic vegetation cover decreasing until day 305.
The estimated fuel loads in the current study during the growing and nongrowing seasons were similar to those obtained by the researchers for six different vegetation types. Despite the fact that the biomass collection sites in this study were primarily concentrated in the typical grassland area, the vegetation combination model in Inner Mongolia’s grasslands area was relatively simple and primarily composed of herbaceous plants, thus corresponding to previous studies. Due to the diversity of grassland vegetation types, it was challenging to sample all vegetation type subclasses for the computation of growing season combustible load in this study. In the field experiment sample locations, 28 vegetation type subclasses were included, and these 28 vegetation types were utilized to classify the growing season combustible load estimation for the entire Inner Mongolia grassland area. Because the sampling locations for nongrowing season dead leaves only represented 21 vegetation type subclasses, the nongrowing season dead leaves were less representative than those used in the computation of growing season flammable load. Future studies can make up for this limitation by extending the number of sampling locations to encompass a wider variety of vegetation types.

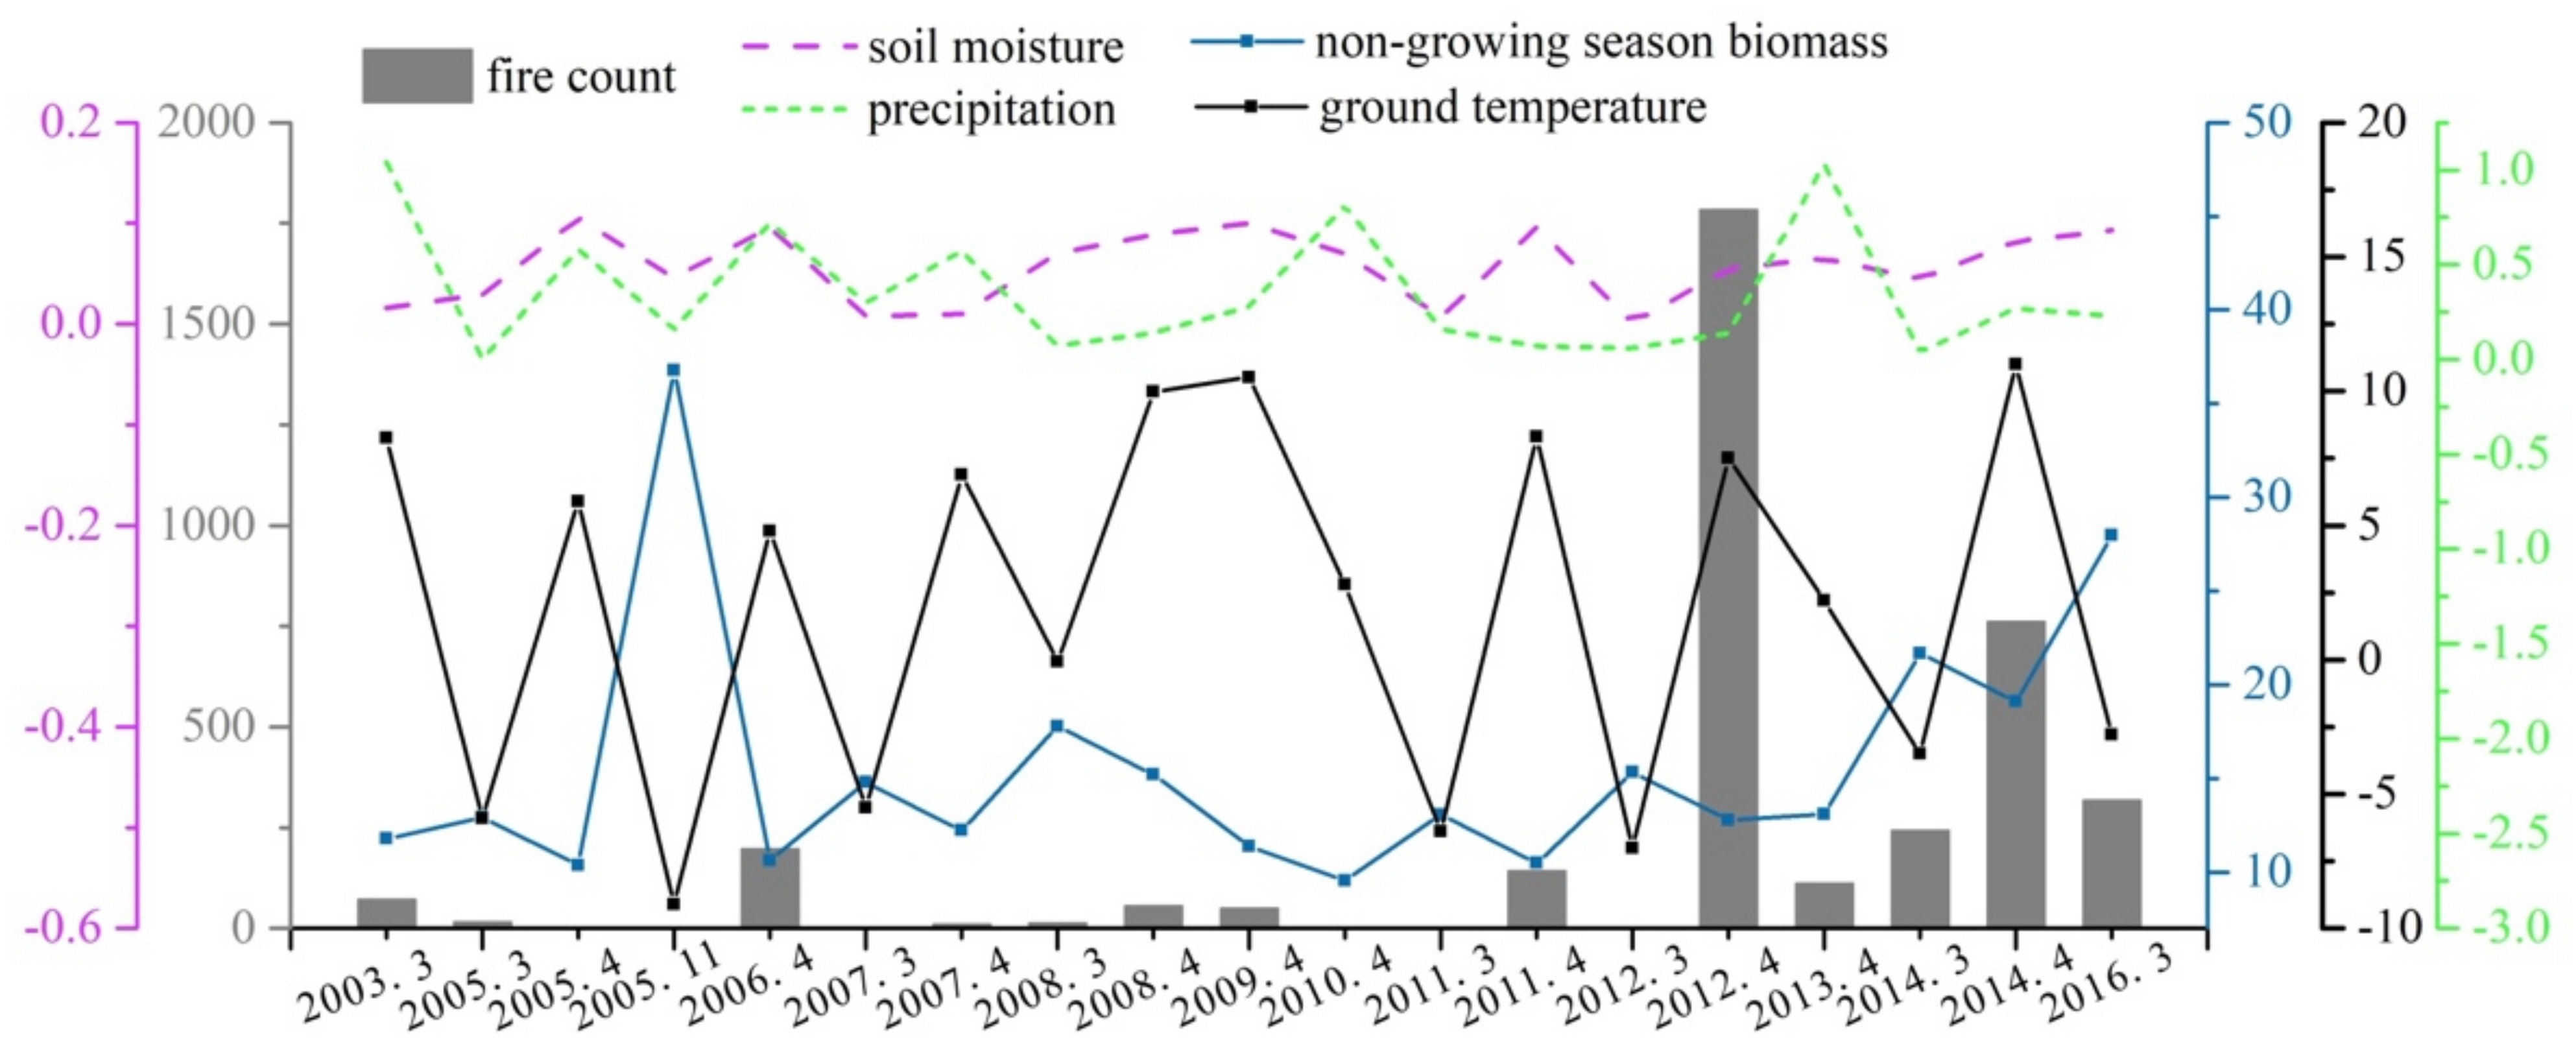
4.2. Analysis of the Causes of Fire Heat-Time Release

The steppe region of Inner Mongolia has a typical temperate continental monsoon climate, with northwesterly winds dominating in spring and autumn, and extreme temperature changes between summer and winter. Rainfall in the region is erratic, with the majority of the annual precipitation falling during the summer months. Forest grassland fires in Mongolia and Russia can easily spread to the region, resulting in grassland fires in border areas that are usually frequent and long-lasting, while covering a large area. Fires in grasslands, which are among the most important ecosystems on the planet, can impact local ecology and socioeconomics. Grassland fires are common in the Inner Mongolia northeastern grassland region. The occurrence of grassland fires is a complex problem that involves multiple factors, including natural factors, human activities, and land use [8,56]. As a result, we chose the typical grassland area of Hulunbuir, a grassland area with a high fire occurrence, for further investigation. Because the percentage of fire area in spring and autumn is relatively high throughout the year [57], the statistics were based on the number of overfire areas, soil moisture, precipitation, surface temperature, and biomass in the nongrowing season (Figure 10). During the high-fire season, both rainfall and soil moisture content were relatively low, ranging between 0.003 and 1.04 mm, and between 0.001 and 0.15 cm3, respectively, and these values did not vary significantly between March and April of each year. These two variables also did not affect grassland fires. On the other hand, Hanes discovered that the water content of the combustible load had a very strong influence on spring fire occurrence [6], and that drought was a key factor influencing spring fire occurrence.

5. Conclusions

The combustible load, potential heat release, and fire-induced heat release in Inner Mongolian grasslands during the growing and nongrowing seasons were examined, and the following conclusions could be drawn on the basis of field combustible load surveys and plant combustion heat release experiments together with NDVI and fire data:
(1) Here, Yi = 412.74NDVIi1.5917 and Yj = −7.21tj + Y10 (i = 5, 6, …, 10; j indicates November–April) represent the prediction models of combustible load per unit area in the growing and nongrowing seasons of Inner Mongolia grasslands (Y). The combustible load per unit area in the growing season and nongrowing season in Inner Mongolia grasslands varied from 27 to 318 g/m2 and from 0 to 248 g/m2, respectively, from 2001 to 2016. The values decreased spatially from northeast to southwest, clearly displaying regional characteristics. Of the six subclasses of grassland vegetation, the combustible load per unit area in the growing and nongrowing seasons exhibited the following trend in descending order: northern temperate meadow grasslands > southern temperate meadow grasslands > typical. In the growing and nongrowing seasons, the average annual combustible load of Inner Mongolian grasslands was 7.7 × 10¹¹ and 1.4 × 10¹¹ kg, respectively, from 2001 to 2016, and the interannual fluctuation of combustible load revealed a changing increasing trend. The six varieties of grasslands vegetation exhibited the following trend in average annual combustible loads (presented in decreasing order): typical northern temperate grasslands, northern temperate meadow grasslands, typical southern temperate grasslands, temperate shrub desert grasslands, and southern temperate desert grasslands.
(2) The release of typical species in the plains of Inner Mongolia clearly differed from other releases. According to the research, the average heat release per unit weight of Stipa capillata, Cleistogenes squarrosa, Carex doniana, Leymus chinensis, and other plants was 2.13, 1.77, 2.06, 1.9, and 3.99 MJ/m2, respectively, and the average sample weights were 28%, 14%, 9%, 21%, and 29%, respectively. At the sample scale of Inner Mongolian grasslands, the potential heat release generally varied between 2 and 2.5, between 2.5 and 3, and between 3 and 3.5 MJ/g, with area shares of 6.1%, 78.9%, and 13.6%, respectively. On the northern side of the typical northern temperate grasslands and the intersection of the typical northern temperate grasslands and temperate shrub and grassy desert, a higher potential heat release at the sample scale of 3–3.5 MJ/g was observed. The heat release per unit mass of the sample scale was 4.34, 4.23, 4.47, and 4.41 MJ/m2 for the more dominant three-leaved daisy, grass, Artemisia, and ice grass, respectively.
(3) From 2001 to 2016, the cumulative heat output from grassland fires in Inner Mongolia was 1.01 × 10¹² MJ with a decreasing trend that was primarily concentrated in the spring and fall. The northern temperate zone’s typical grassland and meadow grassland regions accounted for the majority of the heat release with heat release amounts of 3.82 × 10¹¹ and 4.75 × 10¹¹ MJ, respectively. The typical grassland region’s heat release was primarily concentrated in the summer, whereas the meadow grassland region’s heat release was primarily concentrated in the summer and autumn.

Author Contributions

Conceptualization, L.J. and S.Y.; methodology, L.J. and S.Y.; software, L.J.; validation, L.J., S.Y., and W.D.; writing—original draft preparation, L.J.; writing— review and editing, L.J., S.Y., and W.D.; project administration, S.Y. and W.D. All authors read and agreed to the published version of the manuscript.

Funding

This research was funded by the “Research on Rapid Assessment Technology of Forest and Grassland fire Risk and Application Demonstration of Prevention and Control System” (2022YFSH0027) and “Research and Development and Integration Demonstration of Forest and Grassland fire Prevention and Warning System in Alshan City” (2020ZD0028), key special pro-jects of Inner Mongolia “Science and Technology”.

Institutional Review Board Statement

Not applicable.

Informed Consent Statement

Not applicable.

Data Availability Statement

The data are available on request from the corresponding author.

Acknowledgments

The structural details of the article and the language organization of the paper were guided by Hong Cheng from Beijing Normal University, for which we are deeply grateful. The field sample collection involved in this paper was supported by Qiaofeng Zhang from Inner Mongolia Normal University and Huijuan Liu from the Institute of Grasslands Research, Chinese Academy of Agricultural Sciences. The authors would also like to express their gratitude to the experts and interviewees in this study.

Conflicts of Interest

The authors declare no conflict of interest.

References

  1. Andel, A.N.; Morton, D.C.; Giglio, L.; Chen, Y.; Vander, W.G.; Kasibhatla, S.; Defries, S.; Collatz, G.; Hantson, S.; Kloster, S.; et al. A human-driven decline in global burned area. Science 2017, 356, 1356–1362. [Google Scholar] [CrossRef] [PubMed] [Green Version]
  2. Moritz, M.A.; Parisien, M.A.; Batllori, E.; Krawchuk, M.A.; Dorn, J.V.; Ganz, D.J.; Hayhoe, K. Climate change and disruptions to global fire activity. Ecosphere 2012, 3, 1–22. [Google Scholar] [CrossRef]
  3. Shabbir, A.H.; Zhang, J.Q.; Groninger, J.W.; Sarkodie, S.A.; Valencia, C. Seasonal weather and climate predictionover area burned in grasslands of northeast China. Sci. Rep. 2020, 10, 19961–19972. [Google Scholar] [CrossRef] [PubMed]
  4. Jones, M.W.; Santín, C.; Werf, G.; Doer, S.H. Global fire emissions buffered by the production of pyrogenic carbon. Nat. Geosci. 2019, 12, 742–747. [Google Scholar] [CrossRef] [Green Version]
  5. Westerling, A.L. Increasing western US forest wildfire activity: Sensitivity to changes in the timing of spring. Philosophical transactions of the Royal Society of London Series. Biol. Sci. 2016, 371, 1696–1704. [Google Scholar]
  6. Hanes, C.; Wotton, M.; Woolford, D.G.; Martell, d.L. Preceding Fall Drought Conditions and Overwinter Precipitation Effects on Spring Wildland Fire Activity in Canada. Fire 2020, 3, 24. [Google Scholar] [CrossRef]
  7. Fusco, E.J.; Abatzoglou, J.T.; Balch, J.K.; Finn, J.T.; Bradley, B.A. Quantifying the human influence on fire ignition across the western USA. Ecol. Appl. 2016, 26, 2390–2401. [Google Scholar] [CrossRef] [Green Version]
  8. Li, Y.P.; Zhao, J.J.; Guo, X.Y.; Zhang, Z.X. The Influence of Land Use on the Grassland Fire Occurrence in the Northeastern Inner Mongolia Autonomous Region, China. Sensors 2017, 17, 437. [Google Scholar] [CrossRef] [Green Version]
  9. Zhang, Z.X. A Study of Grassland Fire Status Based on GIS and Remote Sensing; Northeast Normal University: Changchun, China, 2010. [Google Scholar]
  10. Bao, Y.L.; Zhang, J.Q.; Liu, X.P.; Chen, P.; Liu, X.J.; Zhang, Q. Analysis on Grass Fire Traces Extracted and Pre-disaster Characteristics of Combustibles Based on HJ-1B Satellite Data. J. Catastr. 2013, 28, 32–45. [Google Scholar]
  11. Larson, J.R.; Duncan, D.A. Annual Grassland Response to Fire Retardant and Wildfire. J. Range Manag. 1982, 35, 700–703. [Google Scholar] [CrossRef] [Green Version]
  12. Raison, R.J.; Khanna, P.K.; Woods, P.V. Mechanisms of element transfer to the atmosphere during vegetation fires. Int. J. Middle East Stud. 1985, 18, 254–258. [Google Scholar] [CrossRef]
  13. Zhang, G.F.; Ou, W.L.; Chen, R.Y. Dynamic modeling of surface combustible loads in fir plantation forests. J. Fujian For. Coll. 2000, 2, 133–135. [Google Scholar]
  14. Dong, J. Remote sensing estimates of boreal and temperate forest woody biomass: Carbon pools, sources, and sinks. Remote Sens. Environ. 2003, 84, 393–410. [Google Scholar] [CrossRef]
  15. Kumar, S.; Khati, U.G.; Chandola, S.; Agrawal, S.; Kushwaha, S.P. Polarimetric SAR Interferometry based modeling for tree height and aboveground biomass retrieval in a tropical deciduous forest. Adv. Space Res. 2017, 6, 571–586. [Google Scholar] [CrossRef]
  16. Steiner, J.L.; Wetter, J.; Robertson, S.; Teet, S. Grassland Wildfires in the Southern Great Plains: Monitoring Ecological Impacts and Recovery. Remote Sens. 2020, 12, 619. [Google Scholar] [CrossRef] [Green Version]
  17. Guerschman, J.P.; Hill, M.J.; Renzullo, L.J.; Barrett, D.J.; Marks, A.S.; Botha, E.J. Estimating fractional cover of photosynthetic vegetation, non-photosynthetic vegetation and bare soil in the Australian tropical savanna region upscaling the EO-1 Hyperion and MODIS sensors. Remote Sens. Environ. 2009, 113, 928–945. [Google Scholar] [CrossRef]
  18. Li, T.; Li, X.; Li, F. Estimating fractional cover of photosynthetic vegetation and non-photosynthetic vegetation in the Xilingol steppe region with EO-1 hyperion data. Acta Ecol. Sin. 2015, 35, 3643–3652. [Google Scholar]
  19. Wang, G.Z.; Wang, J.; Han, L. Estimating Fractional Cover of Non-photosynthetic Vegetation Using Field Spectral to Simulate Landsat-8 OLI. Int. J. Geogr. Inf. Sci. 2018, 20, 1667–1678. [Google Scholar]
  20. Xu, D.H. The diffusion parameter and heat releast rate of plumes caused by the 1987 forest fire in northeast China. J. Meteorol. 1990, 4, 484–493. [Google Scholar]
  21. Kurzawski, A.J.; Ezekoye, O.A. Inversion for Fire Heat-Release Rate Using Heat Flux Measurements. J. Heat Transf. Trans. ASME 2020, 23, 142–156. [Google Scholar] [CrossRef]
  22. Lu, F.Z.; Yu, Y.M.; Hang, B.H.; Jin, Y.M.; Ma, L.F. Study on the flame retardant properties of bamboo by the CONE method. J. Bamboo Res. 2005, 1, 45–49. [Google Scholar]
  23. Encinas, L.H.; White, S.H.; Rey, A.M.; Sanchez, G.R. Modelling forest fire spread using hexagonal cellular automata. Appl. Math. Model. 2007, 31, 1213–1227. [Google Scholar] [CrossRef]
  24. Zhang, H.; He, C.; Wang, R. Study on the Pyrolysis Kinetics of Combustibles in the Typical Grassland on the Border Between China and Mongolia. J. Catastrophology 2021, 36, 88–93. [Google Scholar]
  25. Arganaraz, J.; Landi, M.A.; Scavuzzo, C.M.; Bellis, L.M. Determining fuel moisture thresholds to assess wildfire hazard: A contribution to an operational early warning system. PLoS ONE 2018, 13, e0204889–e0204908. [Google Scholar] [CrossRef] [Green Version]
  26. Tian, H.Y.; Zhou, D.W.; Sun, G. Changes of ground temperature after grassland fire. J. Northeast. Norm. Univ. (Nat. Sci. Ed.) 1999, 1, 108–111. [Google Scholar]
  27. Zhou, D.W.; Zhang, B.T.; Li, J.D. Changes of aboveground productivity after burning of Songnen Leymus chinensis grassland. Chin. J. Grass Ind. 1995, 4, 23–28. [Google Scholar]
  28. Roy, D.P.; Boschetti, L. Southern Africa Validation of the MODIS, L3JRC, and GlobCarbon Burned-Area Products. IEEE Trans. Geosci. Remote 2009, 47, 1032–1044. [Google Scholar] [CrossRef]
  29. Ying, L.X.; Shen, Z.H.; Yang, M.Z.; Piao, S.L. Wildfire Detection Probability of MODIS Fire Products under the Constraint of Environmental Factors: A Study Based on Confirmed Ground Wildfire Records. Remote Sens. 2019, 11, 3031. [Google Scholar] [CrossRef] [Green Version]
  30. Dong, Y.; Su, H. Information Extraction forGrassland Fire using NOAA/AVHRR Image Channel 1,2,4 and 5. Acta Agrestia Sin. 2002, 10, 298–301. [Google Scholar]
  31. Knapp, P.A. Spatio-temporal patterns of large grassland fires in the Intermountain West, USA. Glob. Ecol. Biogeogr. 1998, 7, 259–272. [Google Scholar] [CrossRef] [Green Version]
  32. Schroeder, W.; Oliva, P.; Giglio, L.; Quayle, B.; Lorenz, E.; Morelli, F. Active fire detection using Landsat-8/OLI data. Remote Sens. Environ. 2016, 185, 210–220. [Google Scholar] [CrossRef]
  33. Zhang, Z.X.; Feng, Z.Q.; Zhang, H.Y.; Zhao, J.J.; Yu, S.; Du, W.L. Spatial distribution of grassland fires at the regional scale based on the MODIS active fire products. Int. J. Wildland Fire 2017, 26, 209–218. [Google Scholar] [CrossRef] [Green Version]
  34. Giglio, l.; Boschetti, L.; Roy, D.P.; Humber, M.L.; Justicea, C.O. The Collection 6 MODIS burned area mapping algorithm and product. Remote Sens. Environ. 2018, 217, 72–85. [Google Scholar] [CrossRef] [PubMed]
  35. Qu, Z.P.; Zheng, S.X.; Bai, Y.F. Spatiotemporal patterns and driving factors of grassland fire on Mongolian Plateau. J. Appl. Ecol. 2010, 21, 807–813. [Google Scholar]
  36. Du, W. A Study of Grassland Fire Monitoring and Early Warning and Assessment Inner Mongolia; Chinese Academy of Agricultural Sciences: Beijing, China, 2012. [Google Scholar]
  37. Kong, B.; Zhang, S.Q.; Zhang, B.; Na, X.D. Analysis of Burn Severity of Wetlands in Zhalong Nature Reserve and Impact of Fire on Red Crowned Crane Habitat. Wetl. Sci. 2007, 5, 348–355. [Google Scholar]
  38. Gong, D.P.; Li, B.Y.; Liu, X.D. Comparative analysis of burn index adaptability when evaluating grassland fire severity. Acta Ecol. Sin. 2018, 38, 2434–2441. [Google Scholar]
  39. Man, D.H.; Zhao, J.T. Geography of Inner Mongolia; Beijing Normal University Press: Beijing, China, 2016. [Google Scholar]
  40. Sa, R.L.; Zhang, X.; Han, X.; Yu, H.Z.; Daisy, H.Y.; Zhang, Q.L.; Zhang, H. A study on the spatial and temporal dynamics of grassland fires in Inner Mongolia Autonomous Region from 1981–2015. Fire Sci. Technol. 2019, 38, 421–425. [Google Scholar]
  41. CAS. Regression Analysis Methods [M]; Science Press: Beijing, China, 1974. [Google Scholar]
  42. Wang, L.; Liu, D.; Li, T.Y.; Wang, J.S.; Li, L.Y. Analysis of precipitation trends in the Beijiang River basin based on multivariate M-K test. Hydrology 2015, 35, 85–90. [Google Scholar]
  43. Jin, Y.X.; Xu, B.; Yang, X.C. Remote sensing estimation of grassland yield dynamics in Xilinguole League Inner Mongolia. China Sci. Life Sci. 2011, 41, 1185–1195. [Google Scholar]
  44. Piao, S.L.; Fang, J.Y.; He, J.S. Biomass of grassland vegetation in China and its spatial relationship with climate factors Vegetation biomass and its spatial distribution pattern in Chinese grasslands. J. Plant Ecol. 2004, 4, 491–498. [Google Scholar]
  45. Liu, S.; Cheng, F.; Dong, S.; Zhao, H.; Hou, X.; Wu, X. Spatiotemporal dynamics of grassland aboveground biomass on the Qinghai-Tibet Plateau based on validated MODIS NDVI. Sci. Rep. 2017, 7, 4182–4192. [Google Scholar] [CrossRef] [PubMed] [Green Version]
  46. Xie, B.D.; Fang, S.Z.; Li, H.Y.; Mi, S.D. Natural decomposition and nutrient release dynamics of four species of biological mulch plants. J. Nanjing For. Univ. (Nat. Sci. Ed.) 2009, 33, 12–16. [Google Scholar]
  47. Ma, W.H.; Yang, Y.H.; He, J.S. Above- and belowground biomass in relation to environmental factors in temperate grasslands. Chin. Sci. Ser. C 2008, 1, 84–92. [Google Scholar]
  48. Wang, G.C.; Luo, Z.K.; Huang, Y.; Sum, W.J. Simulating the spatiotemporal variations in aboveground biomass in Inner Mongolian grasslands under environmental changes. Atmos. Chem. Phys. 2021, 21, 3059–3071. [Google Scholar] [CrossRef]
  49. John, R.; Chen, J.Q.; Giannico, V.; Park, H.; Xiao, J.F.; Shirkey, G.; Ouyang, Z.; Shao, C.L.; Lafortezza, R.; Qi, J. Grassland canopy cover and aboveground biomass in Mongolia and Inner Mongolia: Spatiotemporal estimates and controlling factors. Remote Sens. Environ. 2018, 213, 34–48. [Google Scholar] [CrossRef]
  50. Yue, R.W.; Zhang, N.; Wang, J.J.; Li, Z.Y.; Yan, Z.H.; Feng, Y.M. Spatiotemporal variation of grassland aboveground biomass in Inner Mongolia from 2000 to 2019. J. Univ. Chin. Acad. Sci. 2022, 39, 21–33. [Google Scholar]
  51. Wang, M.; Hou, F. Influence of main factors on grass litter decomposition. Pratacult. Sci. 2012, 29, 1631–1637. [Google Scholar]
  52. Cui, Q.D.; Liu, G.X.; Zhuo, Y. Study on the dynamics of cold season forage preservation rate in Xilingole grassland. Chin. J. Grassl. 2009, 31, 102–108. [Google Scholar]
  53. Ren, H.R.; Zhou, G.S.; Zhang, F. Estimation of non-green biomass in Inner Mongolia desert grasslands based on cellulose uptake index (CAI). Chin. Sci. Bull. 2012, 57, 839–845. [Google Scholar] [CrossRef] [Green Version]
  54. Yu, S.; Du, W.; Liu, G. Remote sensing estimation model for the withered season fuel weight in Inner Mongolia grassland. J. Arid. Land Resour. Environ. 2014, 28, 145–151. [Google Scholar]
  55. Wang, G.Z. Remote Sensing Estimation of Photosynthetic/Non-Photosynthetic Vegetation Cover in Typical Grasslands of Xilingole; Ludong University: Yantai, China, 2018. [Google Scholar]
  56. Parente, J.; Pereira, M.G.; Amraoui, M.; Tedim, F. Negligent and intentional fires in Portugal: Spatial distribution characterization. Sci. Total Environ. 2018, 624, 424–437. [Google Scholar] [CrossRef] [PubMed] [Green Version]
  57. Wei, X.; Wang, G.; Chen, T.; Hagan, D.F.; Ullah, W. A Spatio-Temporal Analysis of Active Fires over China during 2003–2016. Remote Sens. 2020, 12, 1787. [Google Scholar] [CrossRef]
Figure 1. Field sampling sites and technical roadmap (Note: ① northern temperate meadow grasslands; ② southern temperate meadow grasslands; ③ northern temperate typical grasslands; ④ southern temperate typical grasslands; ⑤ southern temperate desert grasslands; ⑥ temperate shrub desert grasslands).
Land 11 02099 g001
Figure 2. Simulated and measured aboveground biomass in the growing season model at the sample scale (a), and monthly decreasing trend of dead leaves in the nongrowing season at the sample scale (b) (j represents November–April of the following year).
Land 11 02099 g002
Figure 3. Spatial distribution of combustible load in the grasslands area of Inner Mongolia during the growing season from 2001 to 2016 (Note: ①–⑥ see Figure 1).
Land 11 02099 g003
Figure 4. Percentage of combustible load classes for different vegetation types from 2001 to 2016 (Note: ①–⑥ see Figure 1).
Land 11 02099 g004
Figure 5. Combustible load statistics of different vegetation subclasses from 2001 to 2016 growing seasons (a) and MK test (b) (Note: ①–⑥ see Figure 1).
Land 11 02099 g005
Figure 6. Annual average spatial distribution of combustible load in the grasslands area of Inner Mongolia during the nongrowing season from 2001 to 2016 (Note: ①–⑥ see Figure 1).
Land 11 02099 g006
Figure 7. Statistical plots (a) and MK test (b) of combustible production of different vegetation subclasses in the nongrowing season from 2001 to 2016 (Note: ①–⑥ see Figure 1).
Land 11 02099 g007
Figure 8. Statistical maps of experimental heat release (a), plant share (b), and spatial distribution of potential heat release (c) (Note: ①–⑥ see Figure 1).
Land 11 02099 g008
Figure 9. Spatial distribution of total heat release from 2001 to 2016 (a); statistical maps of heat release from Inner Mongolia grasslands, northern temperate meadow grasslands, and typical grasslands (bd) (Note: ①–③ shown in Figure 1).
Land 11 02099 g009
Figure 10. Statistical chart of factors influencing the occurrence of grassland fires during the nongrowing season.
Land 11 02099 g010
Table 1. Statistics of total fire area and number of fires from 2001 to 2016.
Vegetation TypePercentage (%)Fire Area (km2)Number of FiresPercentage (%)
Northern temperate meadow grassland14.053683155.6
Southern temperate meadow grasslands9.73470.7233.9
Northern temperate typical grasslands48.943278.838
Southern temperate typical grasslands9.733.741.6
Southern temperate desert grasslands4.590.9650.8
Temperate shrub desert grasslands12.9510.160.1
Table 2. Estimated biomass in growing season of grasslands in Inner Mongolia.
Temperate Desert Grassland Combustible Loads (g/m2)Temperate Meadow Grassland Combustible Loads (g/m2)Temperate Meadow Grassland Combustible Loads (g/m2)Ref.
56.6133.4196.7[47]
83.5149.6256.1[48]
43.6 ± 25.991.5 ± 43.1144.9 ± 59.5[44]
64.0 ± 37.4173.0 ± 71.0270.4 ± 79.7[49]
22.85 ± 6.91103.34 ± 23.89170.40 ± 24.87[50]
65 ± 29117.5 ± 82.5184 ± 134This paper
Publisher’s Note: MDPI stays neutral with regard to jurisdictional claims in published maps and institutional affiliations.

