Article

The Influence of Environment on the Distribution Characteristics of Historical Buildings in the Songshan Region

1
Department of Landscape Architecture, College of Landscape Architecture and Art, Henan Agricultural University, Zhengzhou 450002, China
2
Henan Provincial Joint International Research Laboratory of Landscape Architecture, Henan Provincial Department of Science and Technology, Zhengzhou 450002, China
*
Author to whom correspondence should be addressed.
These authors contributed equally to this work.
Land 2022, 11(11), 2094; https://doi.org/10.3390/land11112094
Submission received: 11 October 2022 / Revised: 14 November 2022 / Accepted: 17 November 2022 / Published: 20 November 2022

Abstract

:
The Songshan region is the core area of Huaxia culture. As an important part of urban characteristics, the Songshan region’s historical architectural heritage is of great significance in sustainable development aspects such as the natural environment, social culture, and so on. The purpose of this study is to clarify the influencing factors of the spatial and temporal distribution of historical buildings in the Songshan region, explore more reasonable conservation and renewal strategies of historical building spaces, and consequently form an effective design method to protect and inherit the historical cultural landscape. Based on the ArcGIS10.6 spatial analysis method, this study simulated the spatial and temporal distribution characteristics of historical buildings in the Songshan region, and analyzed the spatial and temporal distribution characteristics by geographic information system and mathematical statistics. On this basis, the integration of natural elements and social elements has been realized to explore the key factors affecting the distribution of historical buildings in this region. The main results are as follows: (1) the distribution of historical buildings in the Songshan region is not balanced as a whole and has the characteristics of cluster distribution, forming two extremely high-density areas in Luoyang City and Dengfeng City; (2) the overall distribution direction of historical buildings is northwest to southeast, and the distribution center is near Mount Song; (3) natural environmental factors such as topography, landforms, and water systems to which historical buildings belong, as well as the historical layers of the ancient city and the concept of “the Center of Heaven and Earth”, are the main factors affecting the spatial and temporal distribution of historical buildings in the Songshan region.

1. The Introduction

Historical buildings are ancient buildings and early modern buildings with historical and cultural value, which can reflect local urban and rural features and have a certain influence in a specific period [1]. Historical buildings are carriers of human culture in different historical periods, serving as “symbols of historical memory” and “chains of cultural development in urban and rural areas” in specific spaces. The protection of historical buildings is not only related to the display of their authenticity, but also the cultural inheritance of traditional construction concepts. However, with the rapid development of urbanization, the gradual development of historical buildings has been disrupted by large-scale urban and rural construction, and historical buildings have been greatly impacted at different degrees of spatial levels. Current urban and rural construction lack the overall consideration of the spatial distribution characteristics and influencing factors of historical buildings. Therefore, in this study, the spatial analysis method and the mathematical statistics method were used to analyze the distribution characteristics and influencing factors, respectively, of historical buildings in the Songshan region, which provides a theoretical basis for the protection of historical buildings in the Songshan region and the development of urban and rural construction.
In recent years, research on historical buildings as sites of cultural heritage has mainly focused on their layout and site selection, construction and technology, protection and repair, cultural connotation and artistic value, etc. [2,3,4,5,6,7,8,9,10,11], ignoring the impact of environments on their spatial distribution characteristics. The Dengfeng “Middle of Heaven and Earth” Historic Complex has been inscribed onto the list of World Heritage Sites (Figure 1). Additionally, with the increasing attention paid by the state to the protection and utilization of cultural heritage, the value of historical buildings in the Songshan region has been re-recognized, and the depth and breadth of research have been gradually enhanced. Although a few scholars have studied the static distribution of historical buildings, the change of cities, and the distribution of prehistoric settlements in the narrow sense of Mount Song from the micro scale [12,13,14], there is a lack of an overall grasp on and systematic analysis of the spatial distribution and influencing factors of historical buildings in the Songshan region from the macro scale.
At present, domestic and foreign scholars focus on the study of the spatial and temporal distribution characteristics of cultural heritage and then analyze their influencing factors. For example, Wang, X. et al. took world architectural heritage as an object to analyze its spatial distribution characteristics and influencing factors at global and regional levels [15,16]. Jones, E.E. et al. discussed the influencing factors of settlement locations in Haudenosaunee [17]. Vojteková, J. et al. discussed the factors affecting the distribution of historical objects with historical defensive function in Slovakia through spatial analysis [18]. Khine, M.M. et al. investigated the spatial distribution pattern of religious buildings in the Taungyoedan area within Mawlamyine City, and also explored the main factors supporting the spatial distribution of religious buildings in the area [19]. Blanco, A. et al. reviewed the spatial distribution of hydraulic heritage in the Community of Madrid and identified the main factors that affected the spatial distribution of such heritage [20]. An, C. et al. expounded on multiple factors affecting the distribution of early city sites from the Hexi Corridor to Central Asia through comparative analysis [21]. Bian, J. and Kang J. et al. used geographic information systems, spatial analysis, and mathematical statistics to analyze the distribution characteristics of traditional Chinese villages [22,23,24,25,26,27]. Cui, W. and Zhang, J. elaborated on the factors affecting the spatio-temporal distribution of world industrial heritage and China’s industrial heritage by using relevant geospatial operation models [28,29,30]. Dai, X. et al. established a database of China’s mining heritage and studied its spatio-temporal distribution characteristics and influencing factors [31]. Liang, Y. et al. took global vineyard cultural heritage as an object and analyzed its geographical distribution and formation reasons [32]. Liu, G. et al. adopted the spatial analysis method to analyze the spatial distribution and variation in China’s agricultural heritage system [33]. Although the research objects and research scopes are different, by sorting out the factors which influence the distribution characteristics of heritage, we can find that these factors include altitude, landforms, water systems, as well as the important node in the process of historical development. Factors can be divided into the natural geographical environment and the cultural historical environment, which are both closely related to the spatial distribution of historical architecture [34,35,36].
In view of this, from the perspective of spatial and temporal distribution, Arcgis10.6 was used to explore the spatial distribution characteristics and evolution rules of historical buildings in the Songshan region, in order to reveal the natural and human factors affecting their spatial and temporal distribution and to provide a scientific basis for the protection and continuation of cultural landscape patterns in this region.
This study has three main objectives: (1) to analyze the spatial and temporal distribution characteristics of historical buildings in the Songshan region by using the spatial data; (2) to choose some representative influencing factors and analyze their influences on the spatio-temporal distributed characteristics of historical buildings in the Songshan region, with the combination of local characteristics of the Songshan region; and (3) to provide a scientific basis for the coordination of historical buildings’ protection and regional construction in the Songshan region.

2. Research Scope and Data Sources

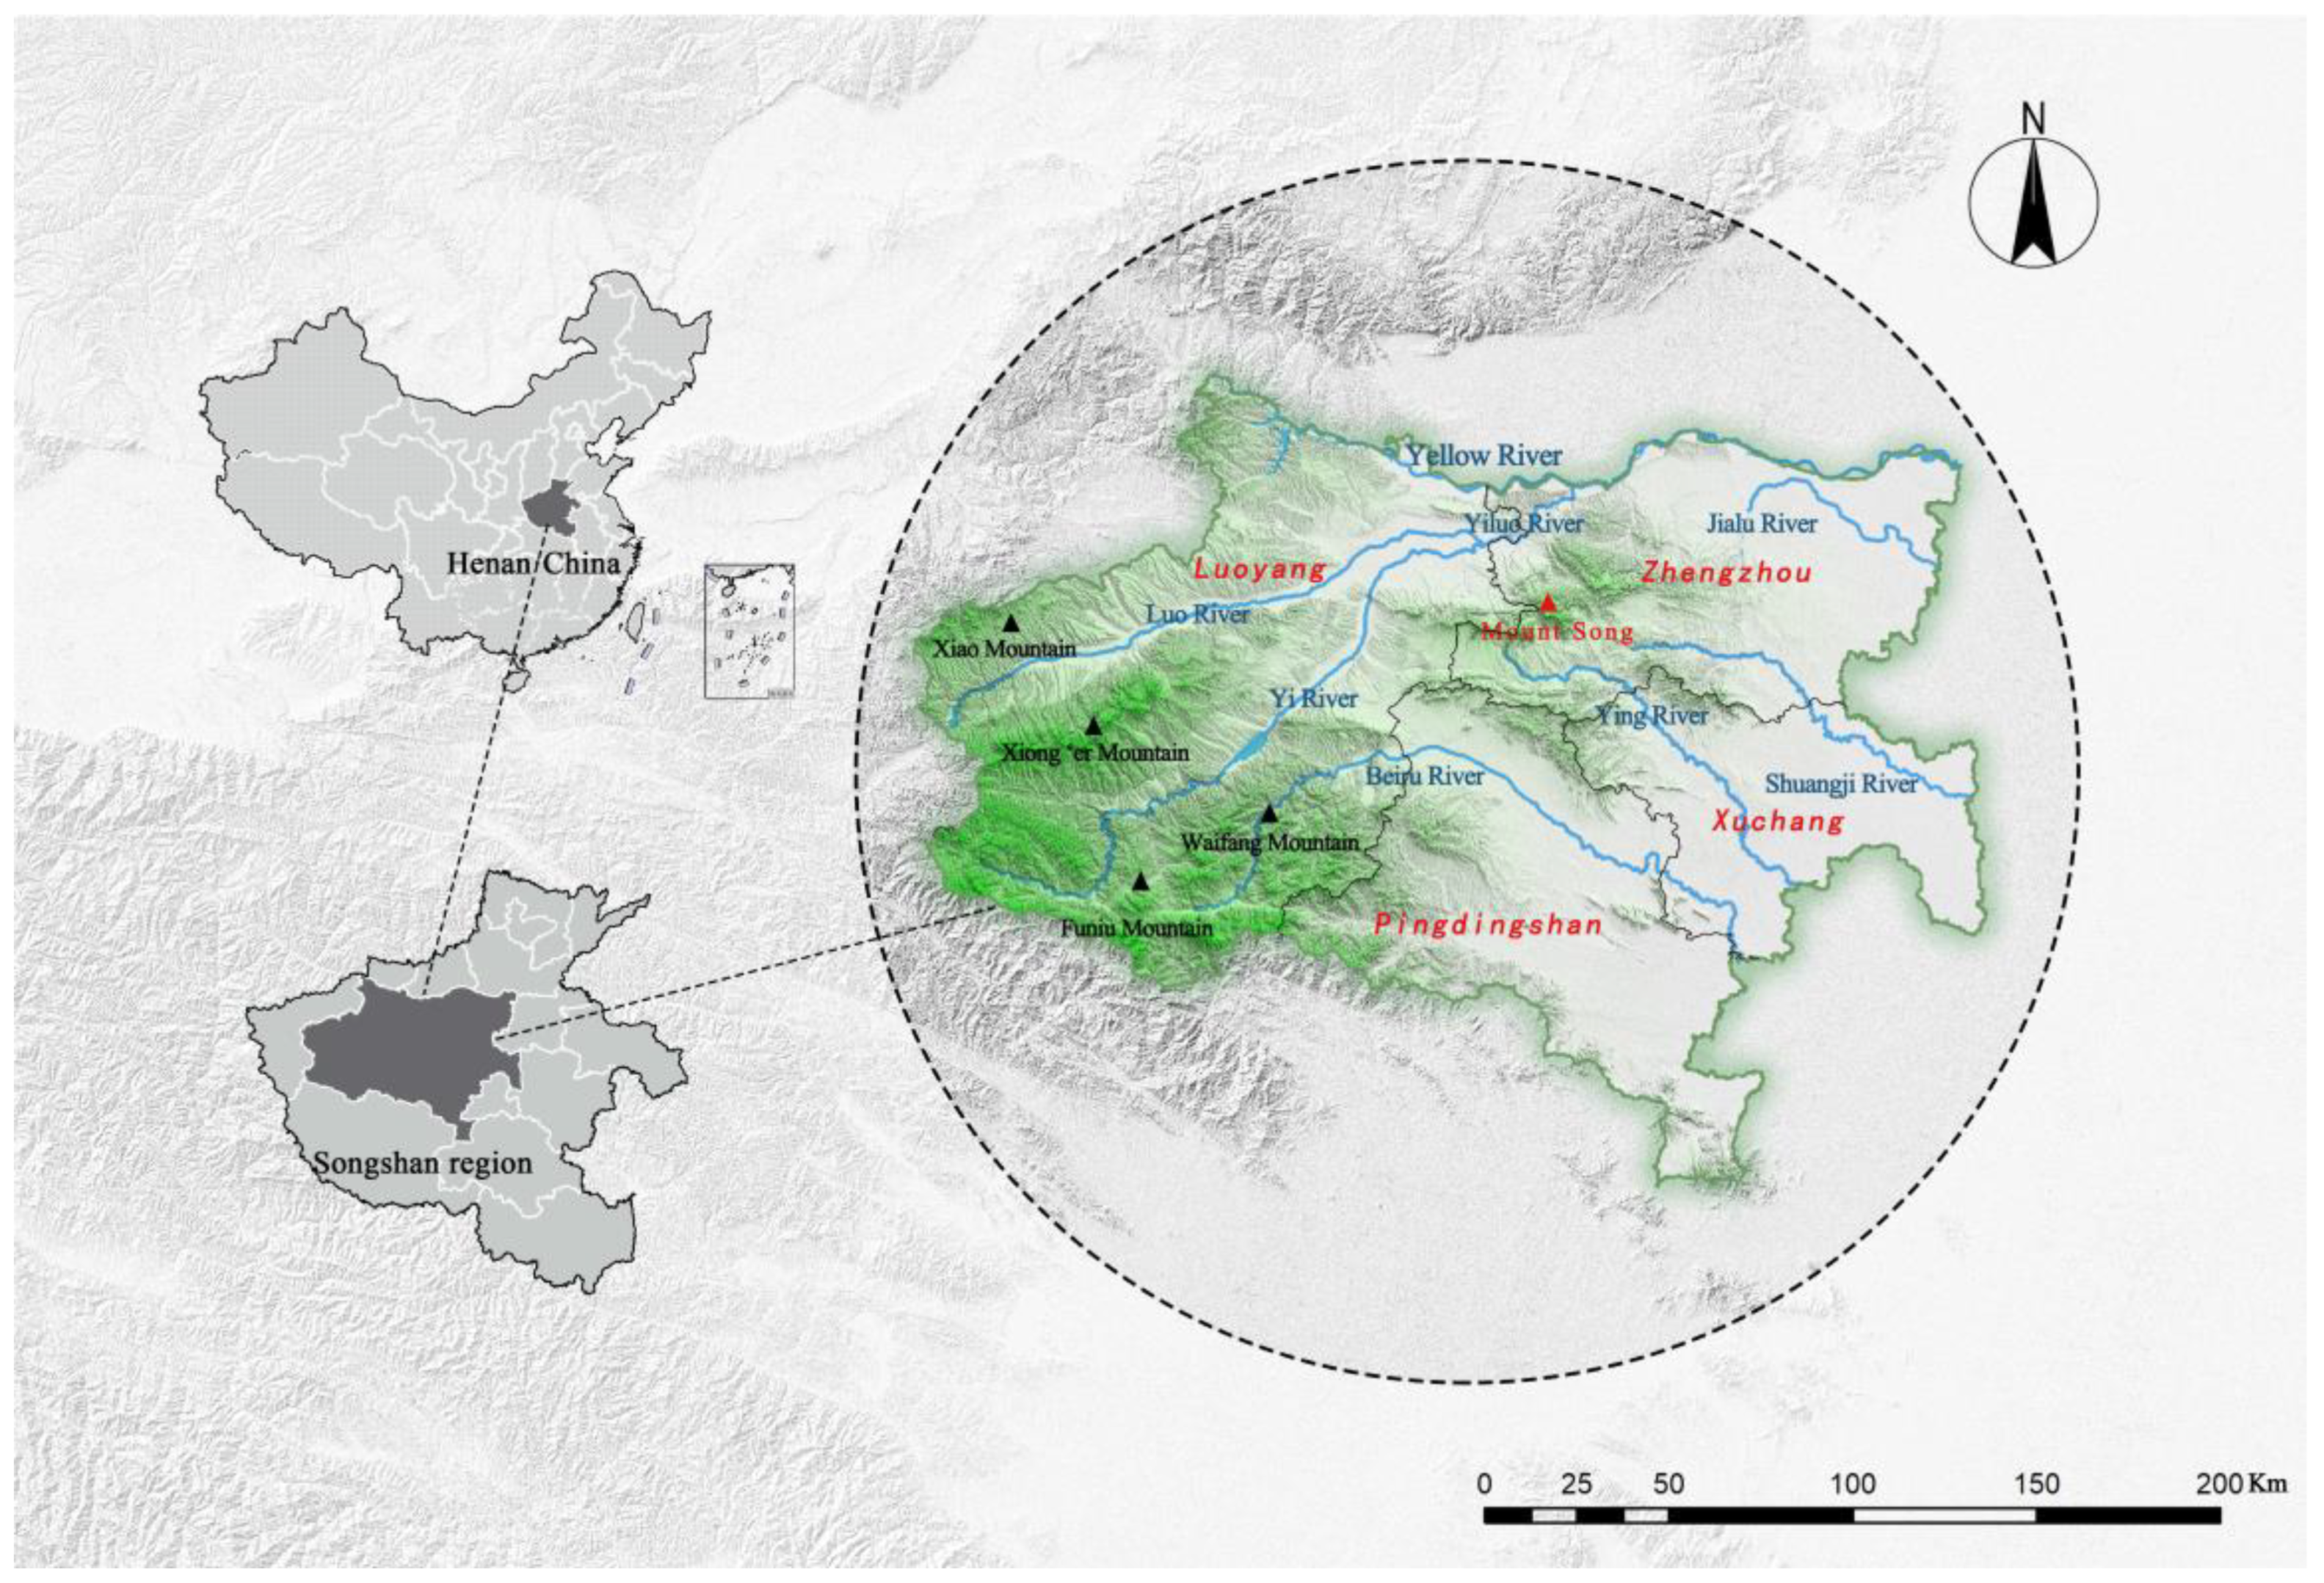
2.1. Scope of Research

The Songshan region is centered in Taishi Mountain, and consists of Zhengzhou, Luoyang, Xuchang, Pingdingshan, and their surrounding areas [37], covering the Yiluo River, Beiru River, Ying River, Shuangji River, and Jialu River watershed surrounding Mount Song in central Henan Province [38], with a total area of 35,796.93 square kilometers. Its location in Henan Province is shown in Figure 2. The Songshan region is located at the junction of the first and second steps of the Eurasian continent. The terrain undulates greatly. In the west, there are mountains such as Funiu Mountain, Xiong’er Mountain, Xiao Mountain, and Waifang Mountain, with rich and diverse natural landforms, including mountains, hills, plains, basins, and so on. The overall terrain pattern is high in the west and low in the east, with mountains in the west and plains in the east. There are many rivers, dense water networks, and fluctuant landforms here, which constitute the unique natural landscape skeleton. The core of Chinese civilization is here, recording the continuous process of ancient civilization and preserving the rich and numerous types of historical and cultural heritage.

2.2. Data Sources

The historical buildings listed in this study were mainly chosen based on the standards of high historical and cultural value, artistic value, and scientific and technological value, from the Henan provincial- and national level-cultural relic protection units by 2022 on the official website of the Administration of Cultural Heritage of Henan Province (https://wwj.henan.gov.cn/ (accessed on 6 February 2022)). After screening, 293 construction units were obtained as historical buildings of the Songshan region. According to the time development characteristics of historical buildings in the Songshan region, combined with local records and other documents and ancient books, the historical buildings were divided into Qin and Han dynasties (221 BCE–CE 220), Wei and Jin dynasties (CE 220–581), Sui and Tang dynasties (CE 581–960), Song and Yuan dynasties (CE 960–1368), Ming and Qing dynasties (CE 1368–1912), and the Republic of China (CE 1912–1949) (Figure 3). According to the functions of historical buildings, they are divided into six types: religious buildings, regime buildings, municipal buildings, ritual buildings, cultural buildings, and residential buildings (Table 1). With the help of the Baidu Map Coordinate Picker Tool, the geographic coordinates of historical buildings in the Songshan region were obtained. DEM data were derived from the cloud website of Geospatial Data (https://www.gscloud.cn/ (accessed on 8 April 2022)), geomorphic data were from the website of the Chinese Academy of Sciences (http://www.igsnrr.ac.cn/ (accessed on 10 May 2022)), and water system data were drawn from the website of the Data Center for Resources and Environmental Sciences, Chinese Academy of Sciences (http://www.resdc.cn/ (accessed on 23 May 2022)).

2.3. Research Methods

2.3.1. Lorentz Curve Method

In this study, the Lorentz curve was used to evaluate the equilibrium of historical buildings distributed in different administrative areas of the Songshan region. The quantity of historical buildings distributed in different administrative areas is arranged in the order from less to more, and the Lorentz curve is drawn by the cumulative percentage of historical buildings in each administrative area. If the curve is closer to the average line, it indicates that the distribution of historical buildings in the study area is more balanced; otherwise, the gap is larger [39].

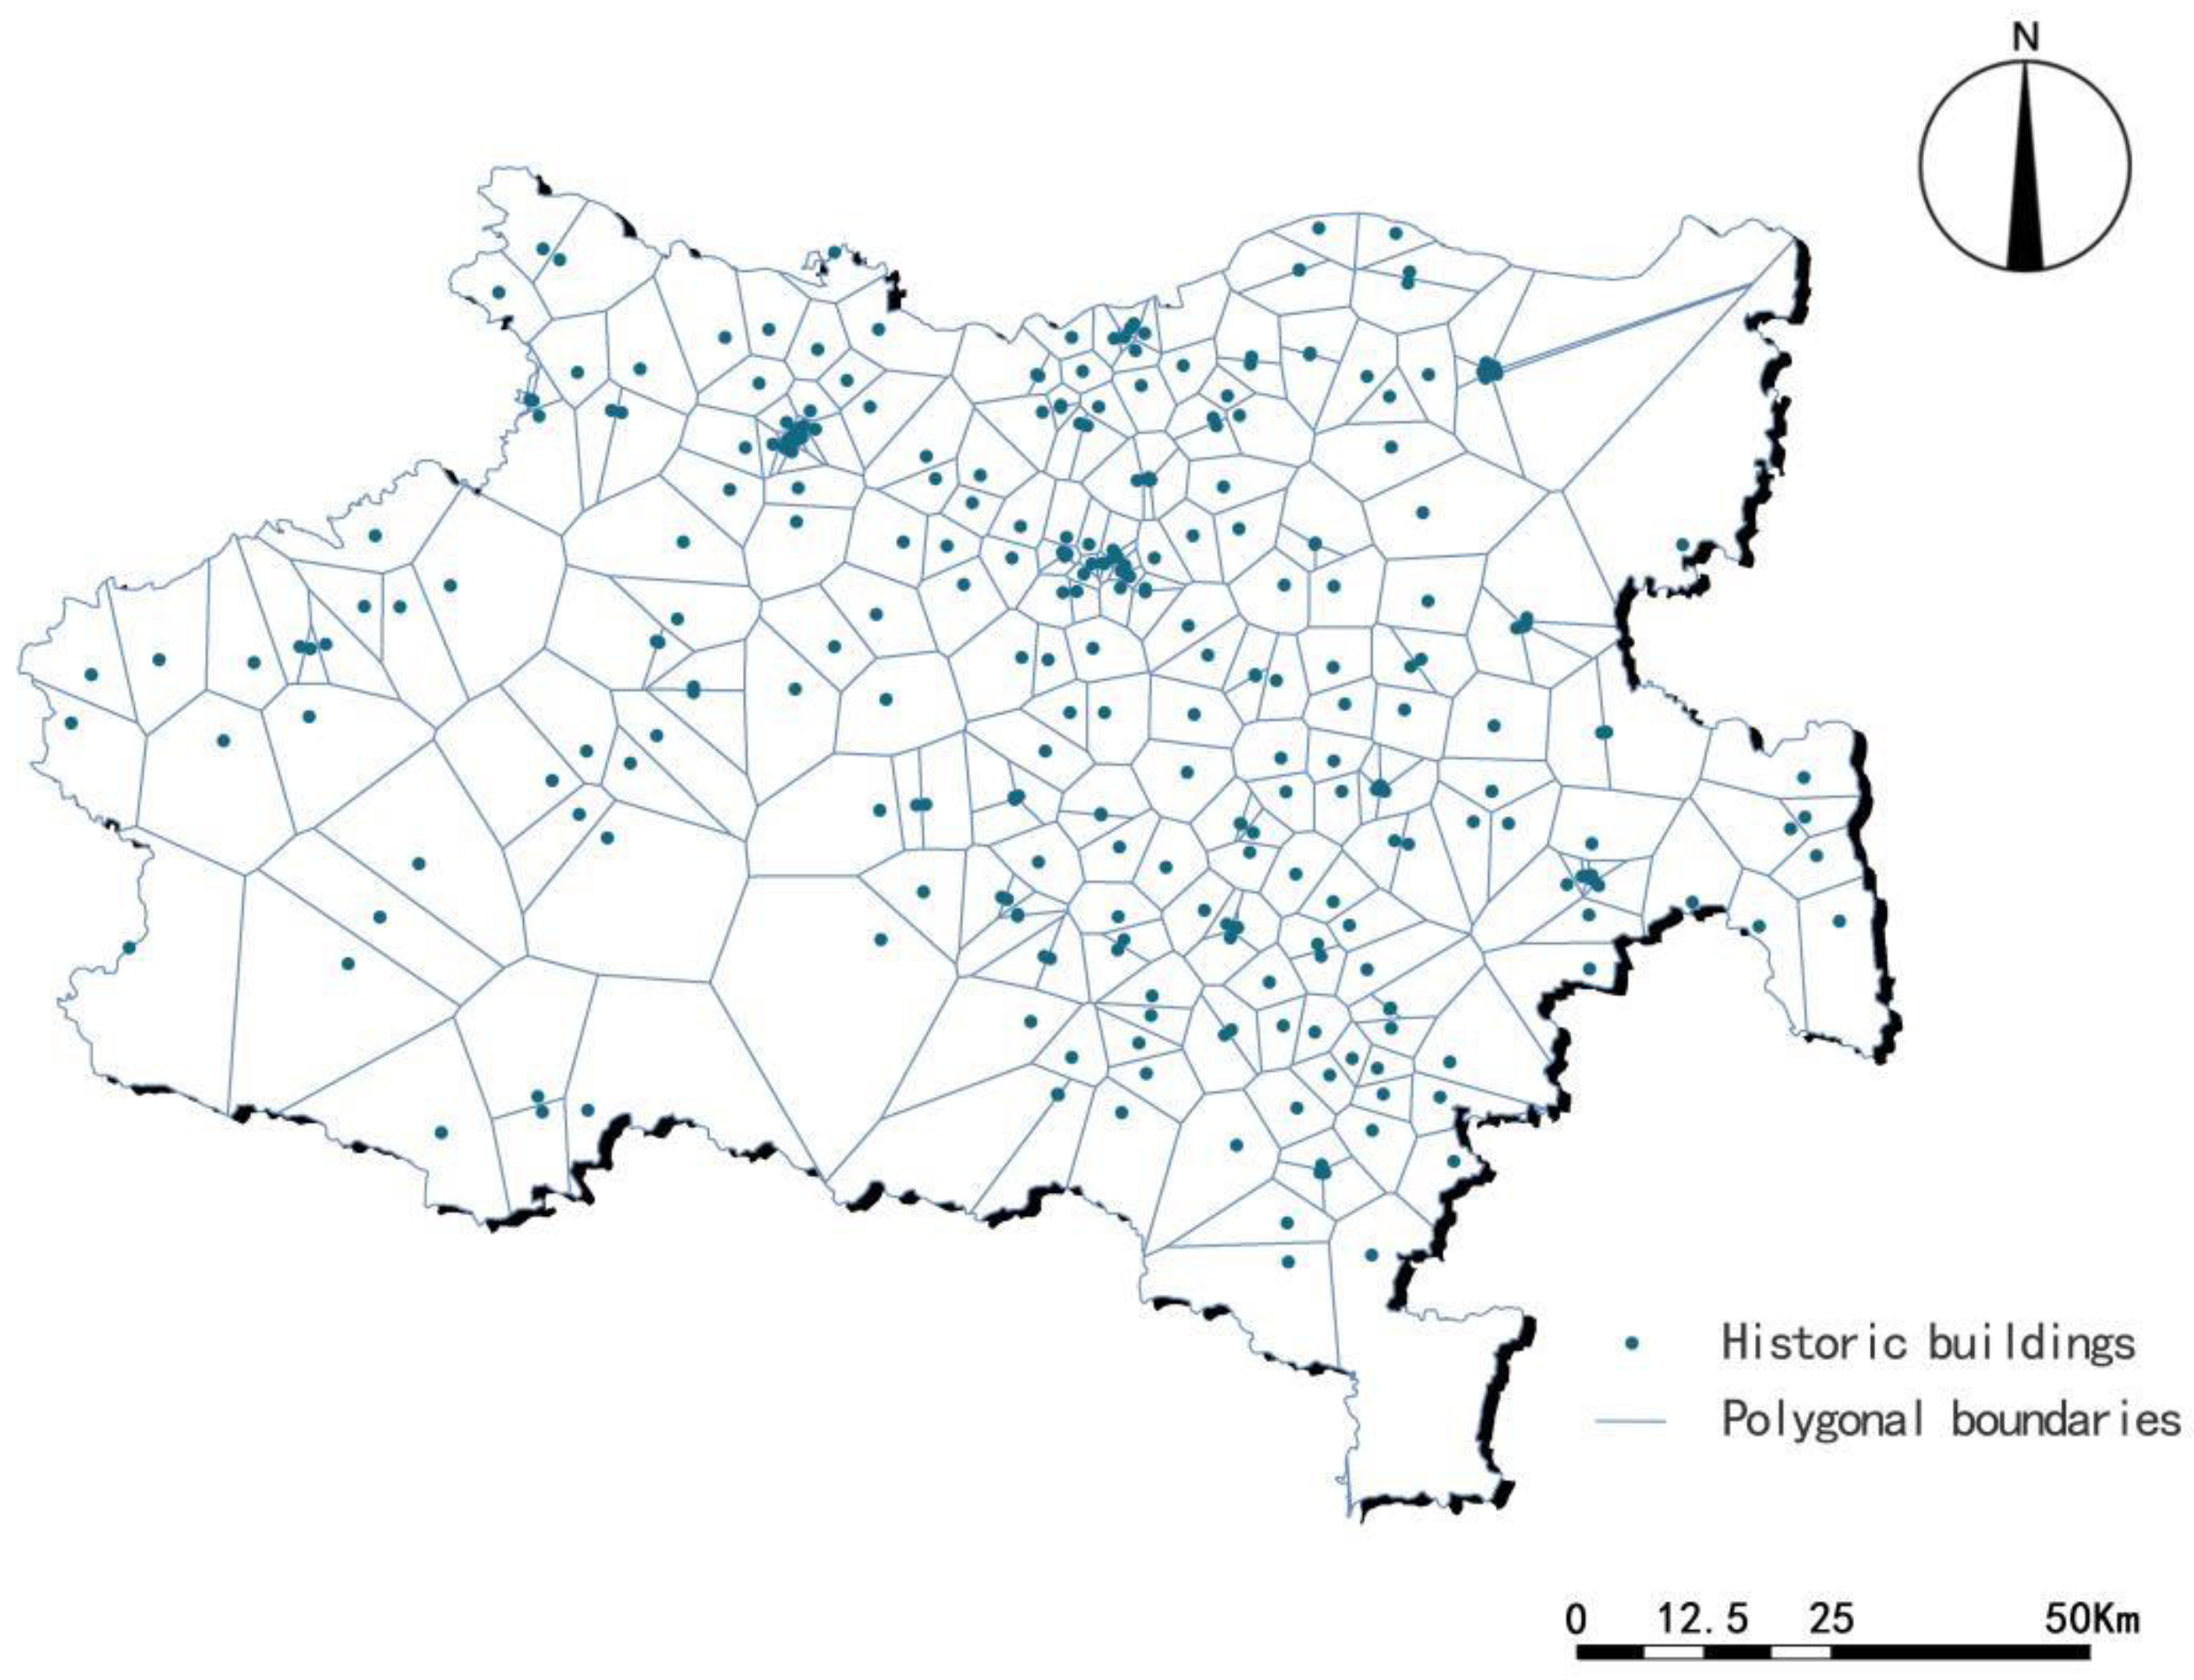
2.3.2. Voronoi Diagram Method

A Voronoi diagram is a continuous polygon consisting of a set of vertical bisectors connecting two adjacent line segments. The area of the Voronoi diagram varies with the distribution of historical buildings. The CV value of the coefficient of variation can be used to measure the relative variation degree of the polygon area to further explore the distribution type [40]. According to the CV value of the Voronoi diagram area, the distribution type of the spatial pattern of historical buildings can be calculated. The CV value formula is shown in Equations (1) and (2):
R = S i S 2 n i = 1 , 2 , n
C V = R S
In Formula (1), Si is the area of the ith (i = 1, 2, ..., n) polygon, S is the average of the polygon areas, n is the number of polygon areas, and R is the standard deviation [41]. When CV value = 57% (including 33%–64%), the historical buildings are randomly distributed. When CV value = 92% (including >64%), the historical buildings show cluster distribution. When CV value = 29% (including <33%), the historical buildings indicate uniform distribution.

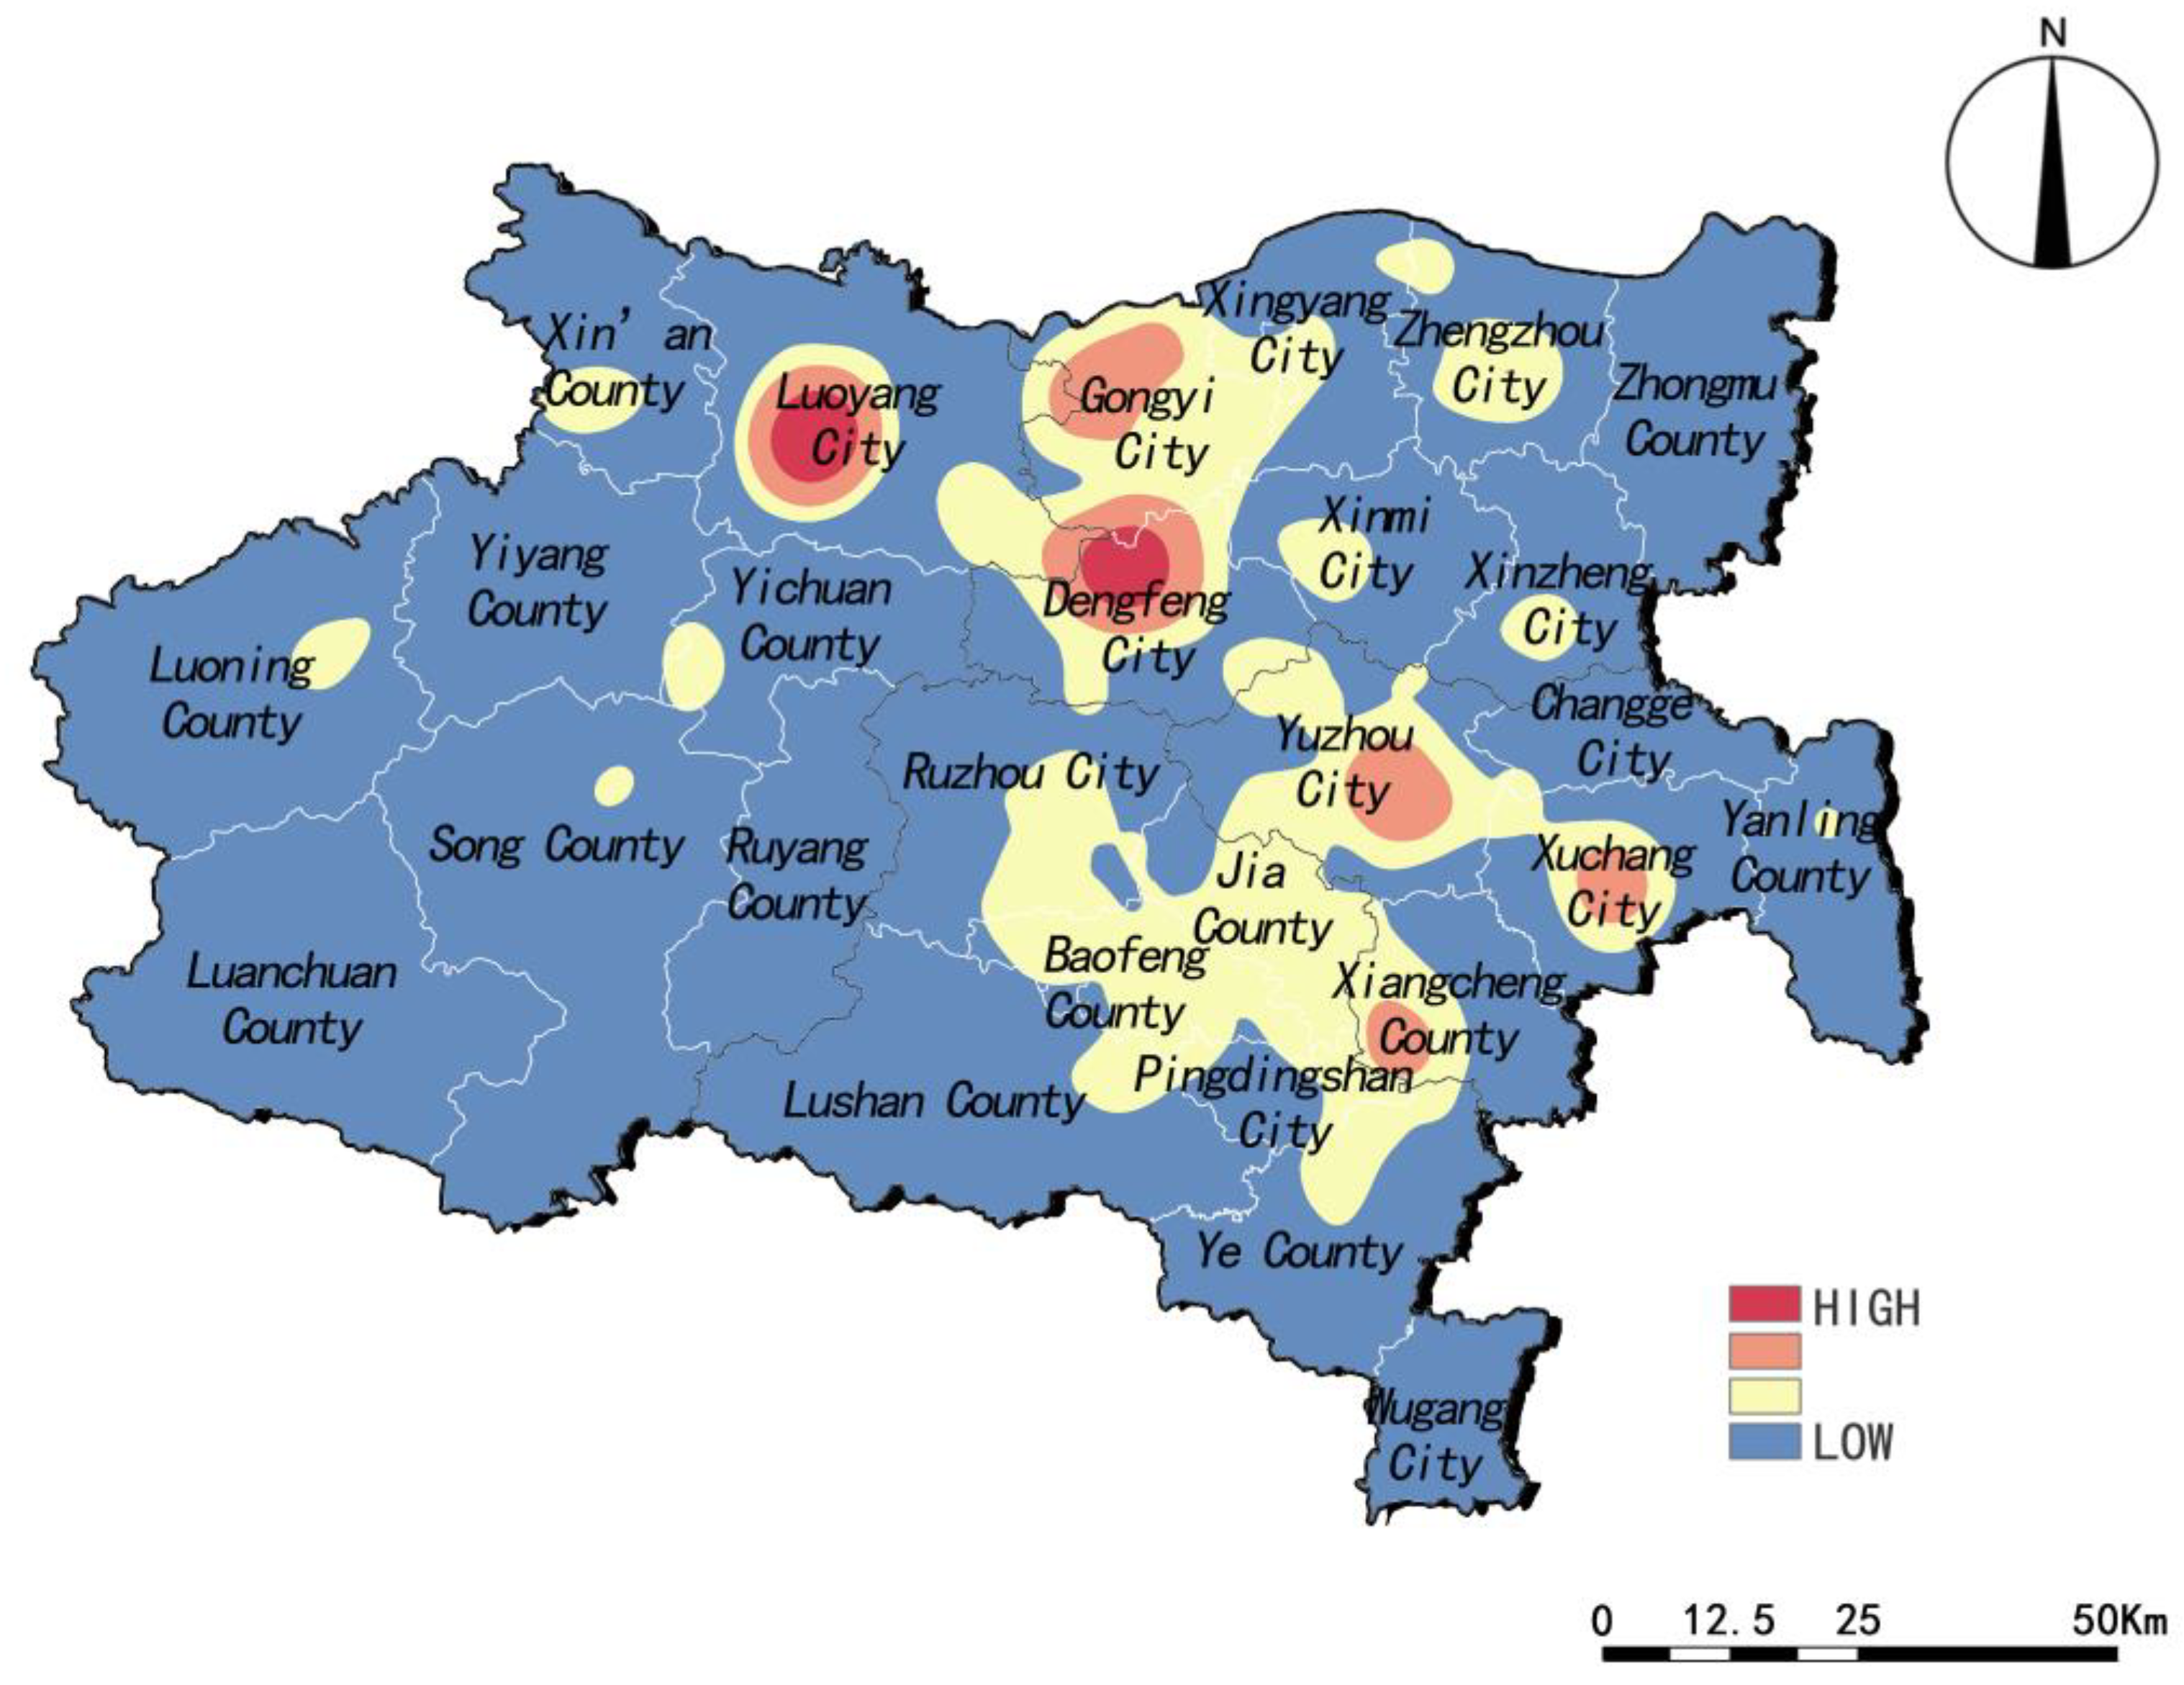
2.3.3. Kernel Density Estimation Method

Kernel density analysis is a method to show the spatial distribution of historical buildings based on their coordinates. By means of kernel density analysis, the distribution of historical buildings can be transformed into a smooth planar density change map, and the spatial aggregation state of historical buildings can be visually displayed. The darker the color of the kernel density map, the higher the concentration of historical buildings. A lighter color on a kernel density map indicates a lower concentration [42]. The calculation formula is Equation (3):
fn x = 1 nh i = 1 n k ( x X i h )
where x is the position of the element to be measured. xi with radius h is the position of the ith estimation element in the category of the center of the circle; the value of h will affect the smoothness level of the spatial distribution of estimation factors.

2.3.4. Standard Deviation Ellipse Method

Standard deviation ellipse analysis uses the average center of a set of points or regions as the starting point and calculates standard distances in the x and y directions, respectively, to form a standard deviation ellipse containing all elements. The major semi-axis of the ellipse represents the direction of data distribution, and the minor semi-axis represents the range of data distribution. The shorter the minor axis, the more obvious the degree of agglomeration of historical buildings. The longer the minor axis, the greater the degree of dispersion of historical buildings. The greater the difference between the values of the major and minor semi-axes (the greater the flatness), the greater the directionality of the historical buildings. The center point indicates the central position of the distribution of historical buildings in this period. By analyzing the ellipse, we can obtain the distribution direction of historical buildings, confirm whether it is a shrinking trend or a spreading trend, and determine the spatial evolution of the distribution center of historical buildings in different periods [43].

3. Spatial Distribution Characteristics of Historical Buildings

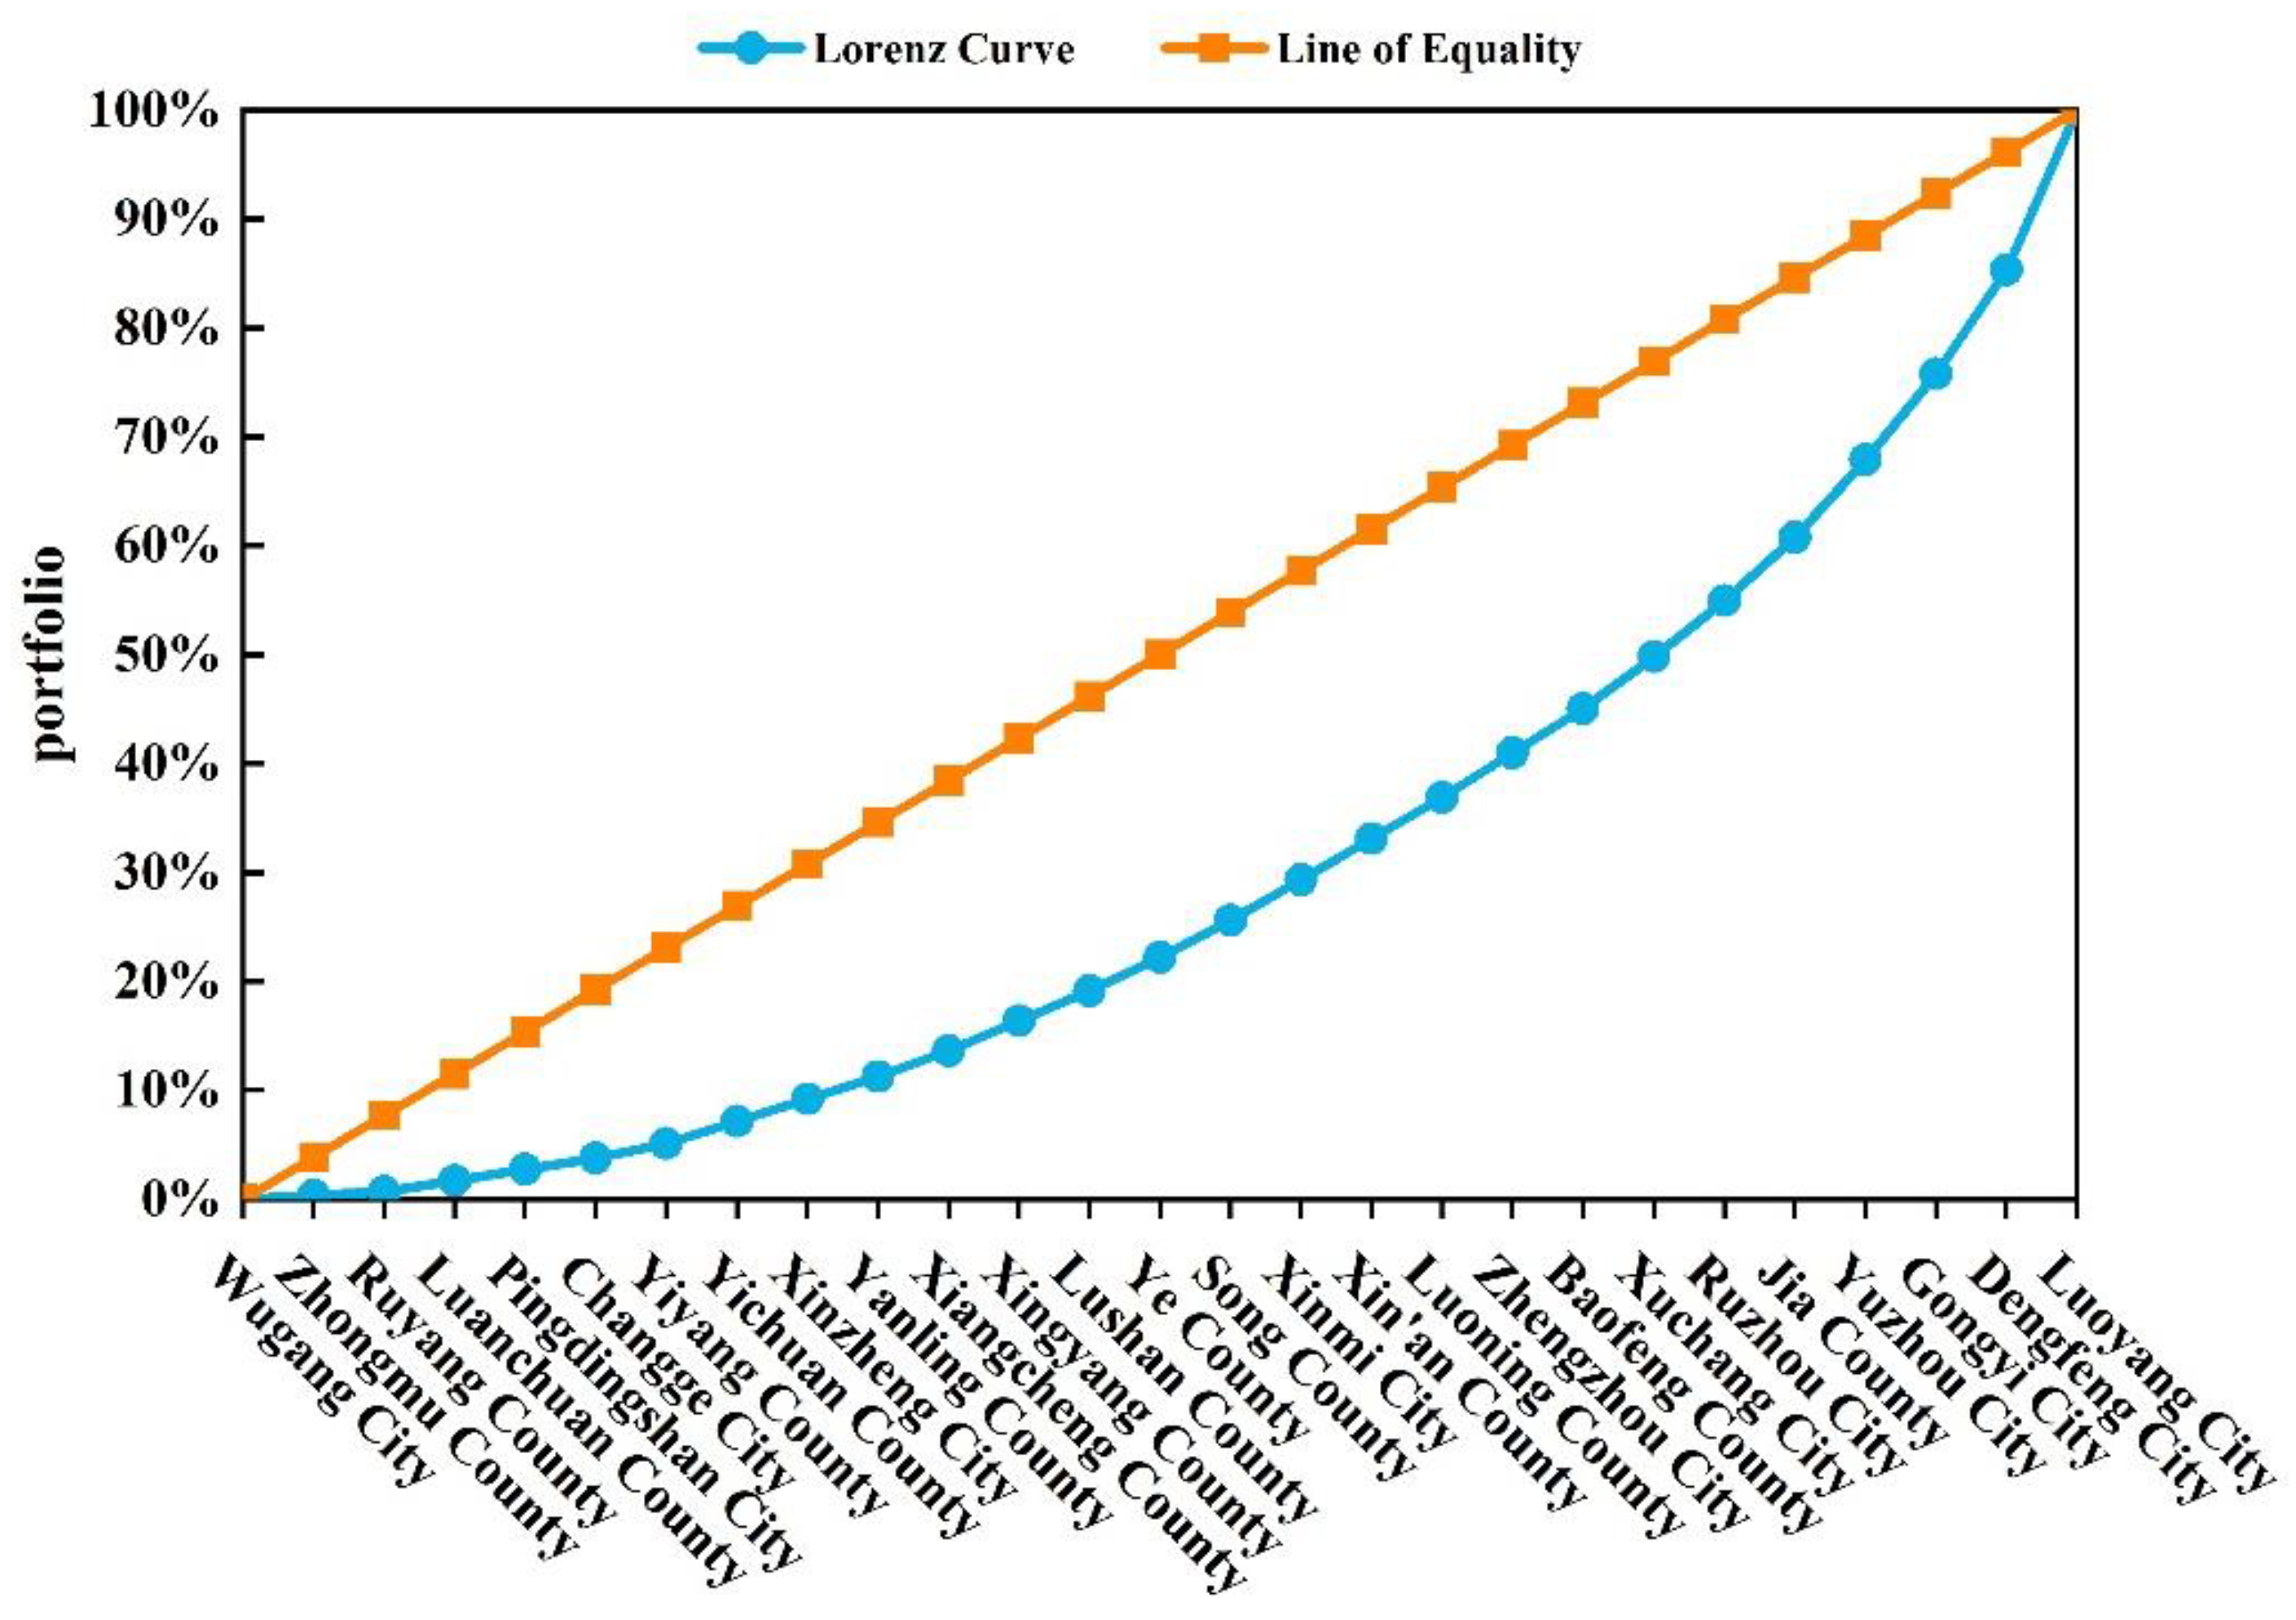
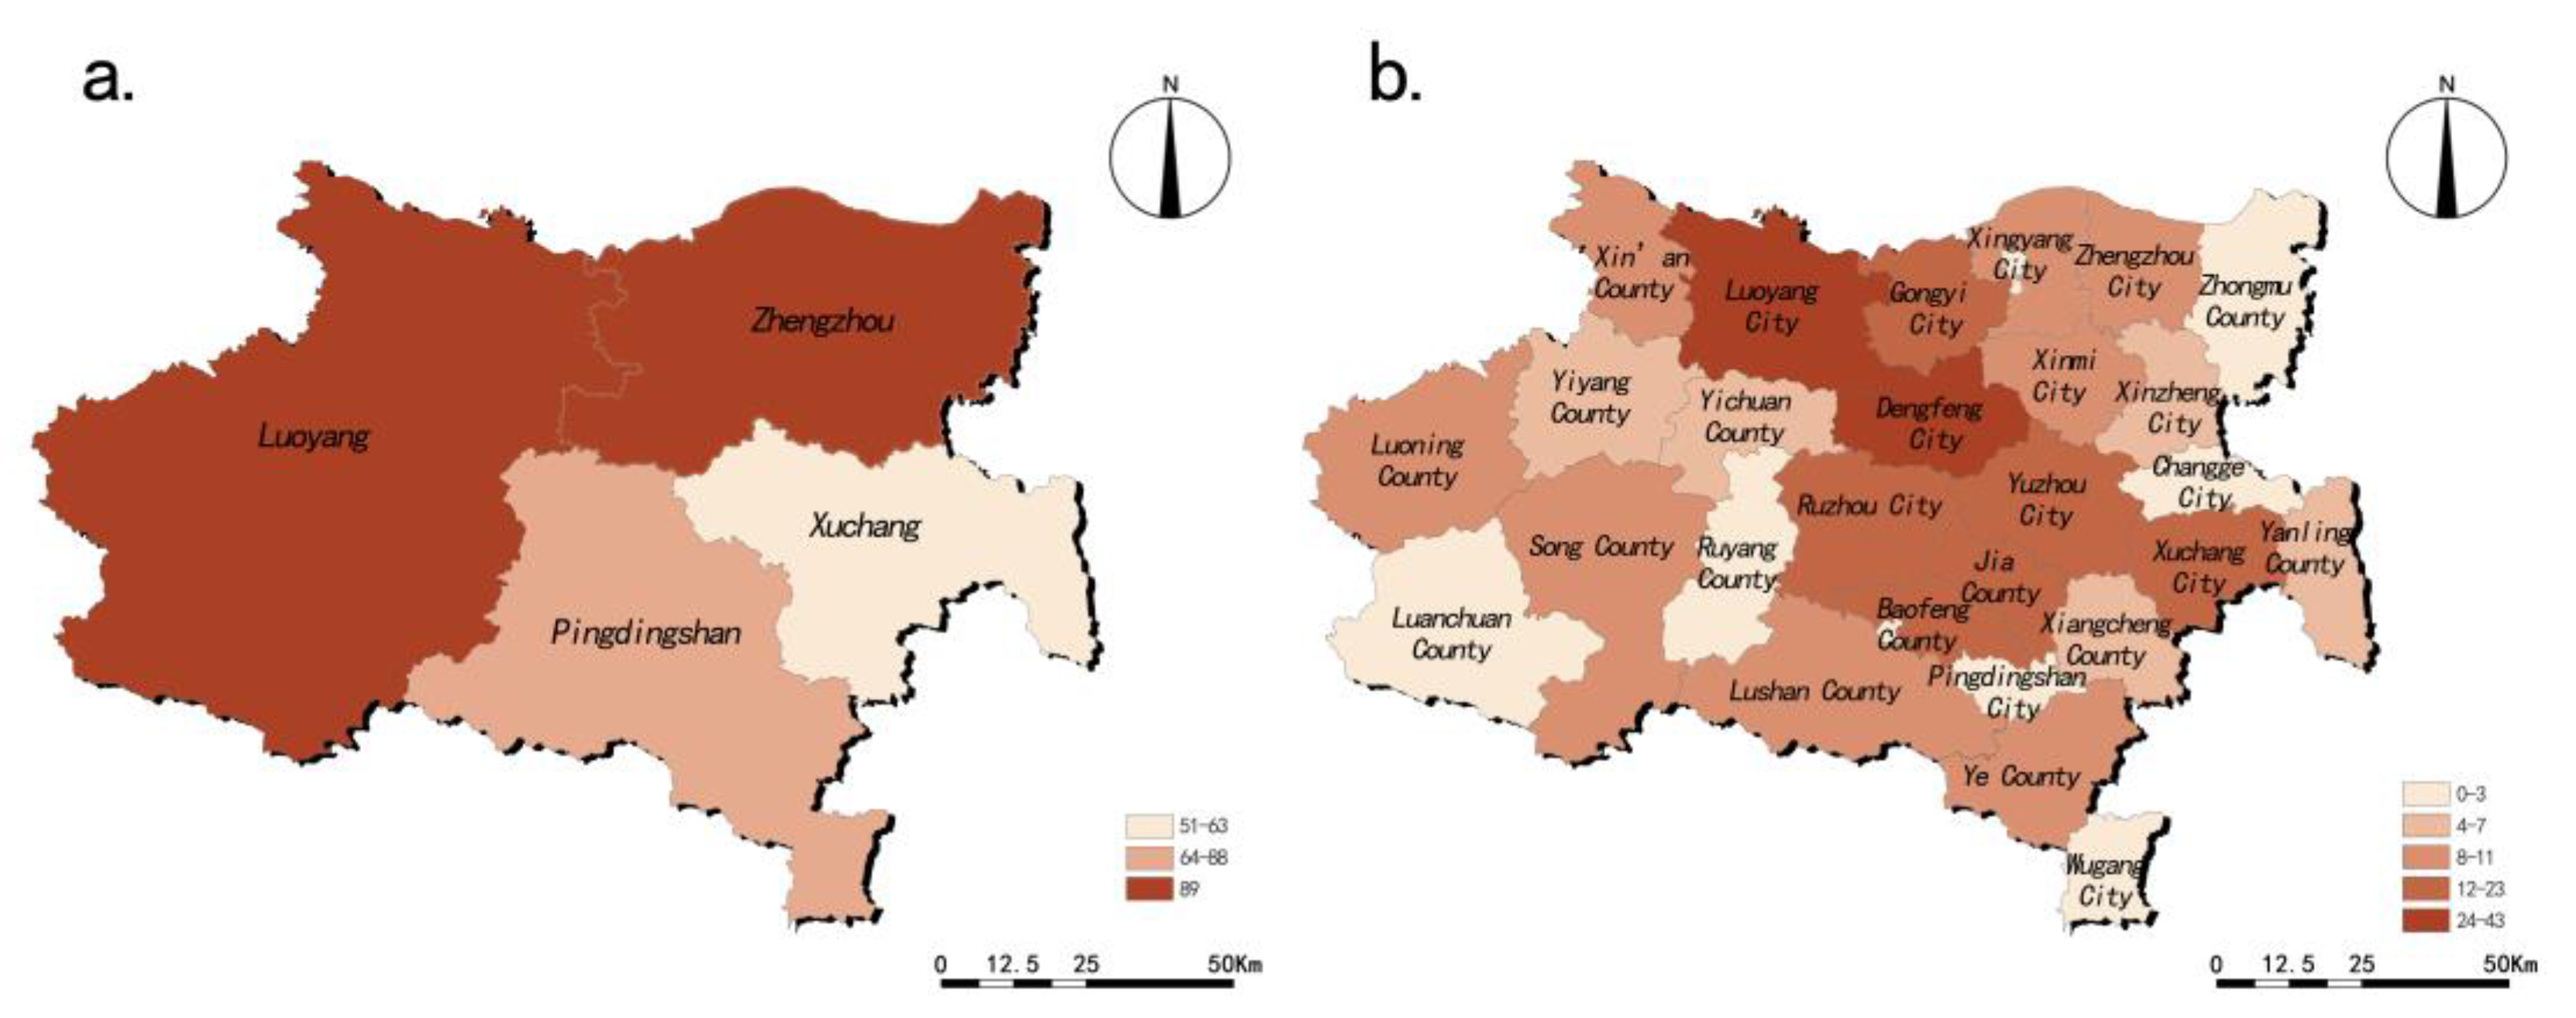
3.1. Balance of Spatial Distribution

There are great differences in the quantity of historical buildings in different districts of the Songshan region. It is essential to analyze their spatial distribution equilibrium quantitatively. The Lorentz curve was drawn with the city district and county as the abscissa, and the cumulative percentage of the quantity of historical buildings in each jurisdiction as the ordinate (Figure 4). According to Figure 4, the results show an obvious downward concave form, which indicates that the historical buildings in the Songshan region have the characteristics of imbalanced distribution. Among the 27 municipal districts and counties in the Songshan region, the quantity of historical buildings owned by six municipal districts and counties, namely Luoyang City, Dengfeng City, Gongyi City, Yuzhou City, Jia County, and Ruzhou City, exceeds 50% of the total quantity of historical buildings in the whole study area.
According to the natural discontinuity point classification method, the distribution number of historical buildings is visualized at different scales, and the distribution map of historical buildings is generated (Figure 5). The greater the number of distributions, the darker the color of the range. According to Figure, the number of historical buildings in Luoyang and Zhengzhou is the greatest, while the number of historical buildings in Xuchang is the least, showing an uneven distribution from south to north in space. The distribution number of historical buildings is visualized by taking the municipal district and county as the basic unit (Figure 5b), which further intuitively shows the imbalance of the distribution of historical buildings in each unit. It can be seen from Figure 5b that historical buildings are more distributed in Luoyang City and Dengfeng City. While Zhongmou County and Changge City are in the northeast, Ruyang County in the middle, Luanchuan County in the southwest, and Pingdingshan City and Wugang City in the south are less distributed. The overall distribution of historical buildings is out-of-balance between the middle and both sides, with more buildings in the middle region and fewer in the east and west sides. The administrative units with same color in Figure 5b are adjacent and connect in space, and they form a balanced composition unit of spatial distribution: (1) the larger schistose components appear in Yuzhou City, Pingdingshan City jurisdiction, Jia County, Baofeng County, and five neighboring units in the Xuchang City jurisdiction; (2) taking Luoning County, Song County, Lushan County, and Ye County as the four linked units, they show a long extension of chain combination units.

3.2. Spatial Distribution Types

Firstly, the geometric analysis of the drawn Voronoi diagram map of the overall historical buildings in the Songshan region needs to be carried out to obtain the area of each Voronoi diagram in the region (Figure 6). According to Equation (1), the standard deviation R and average value S of the Voronoi diagram of the overall historical buildings in the Songshan region are obtained. According to Equation (2), the CV value of the overall variation coefficient of the Songshan region is shown in Table 2, and the CV index is 1.271865, greater than 0.64, which means that the historical buildings in the Songshan region are generally clustered.
We analyzed historical buildings’ distribution in the Songshan region by different building types and different periods, and realized the corresponding Voronoi diagram. Then, we performed Voronoi diagram geometric analysis. As indicated in the diagram, we can conclude that the distribution of historical buildings in the Songshan region is clustered in different types and different periods.

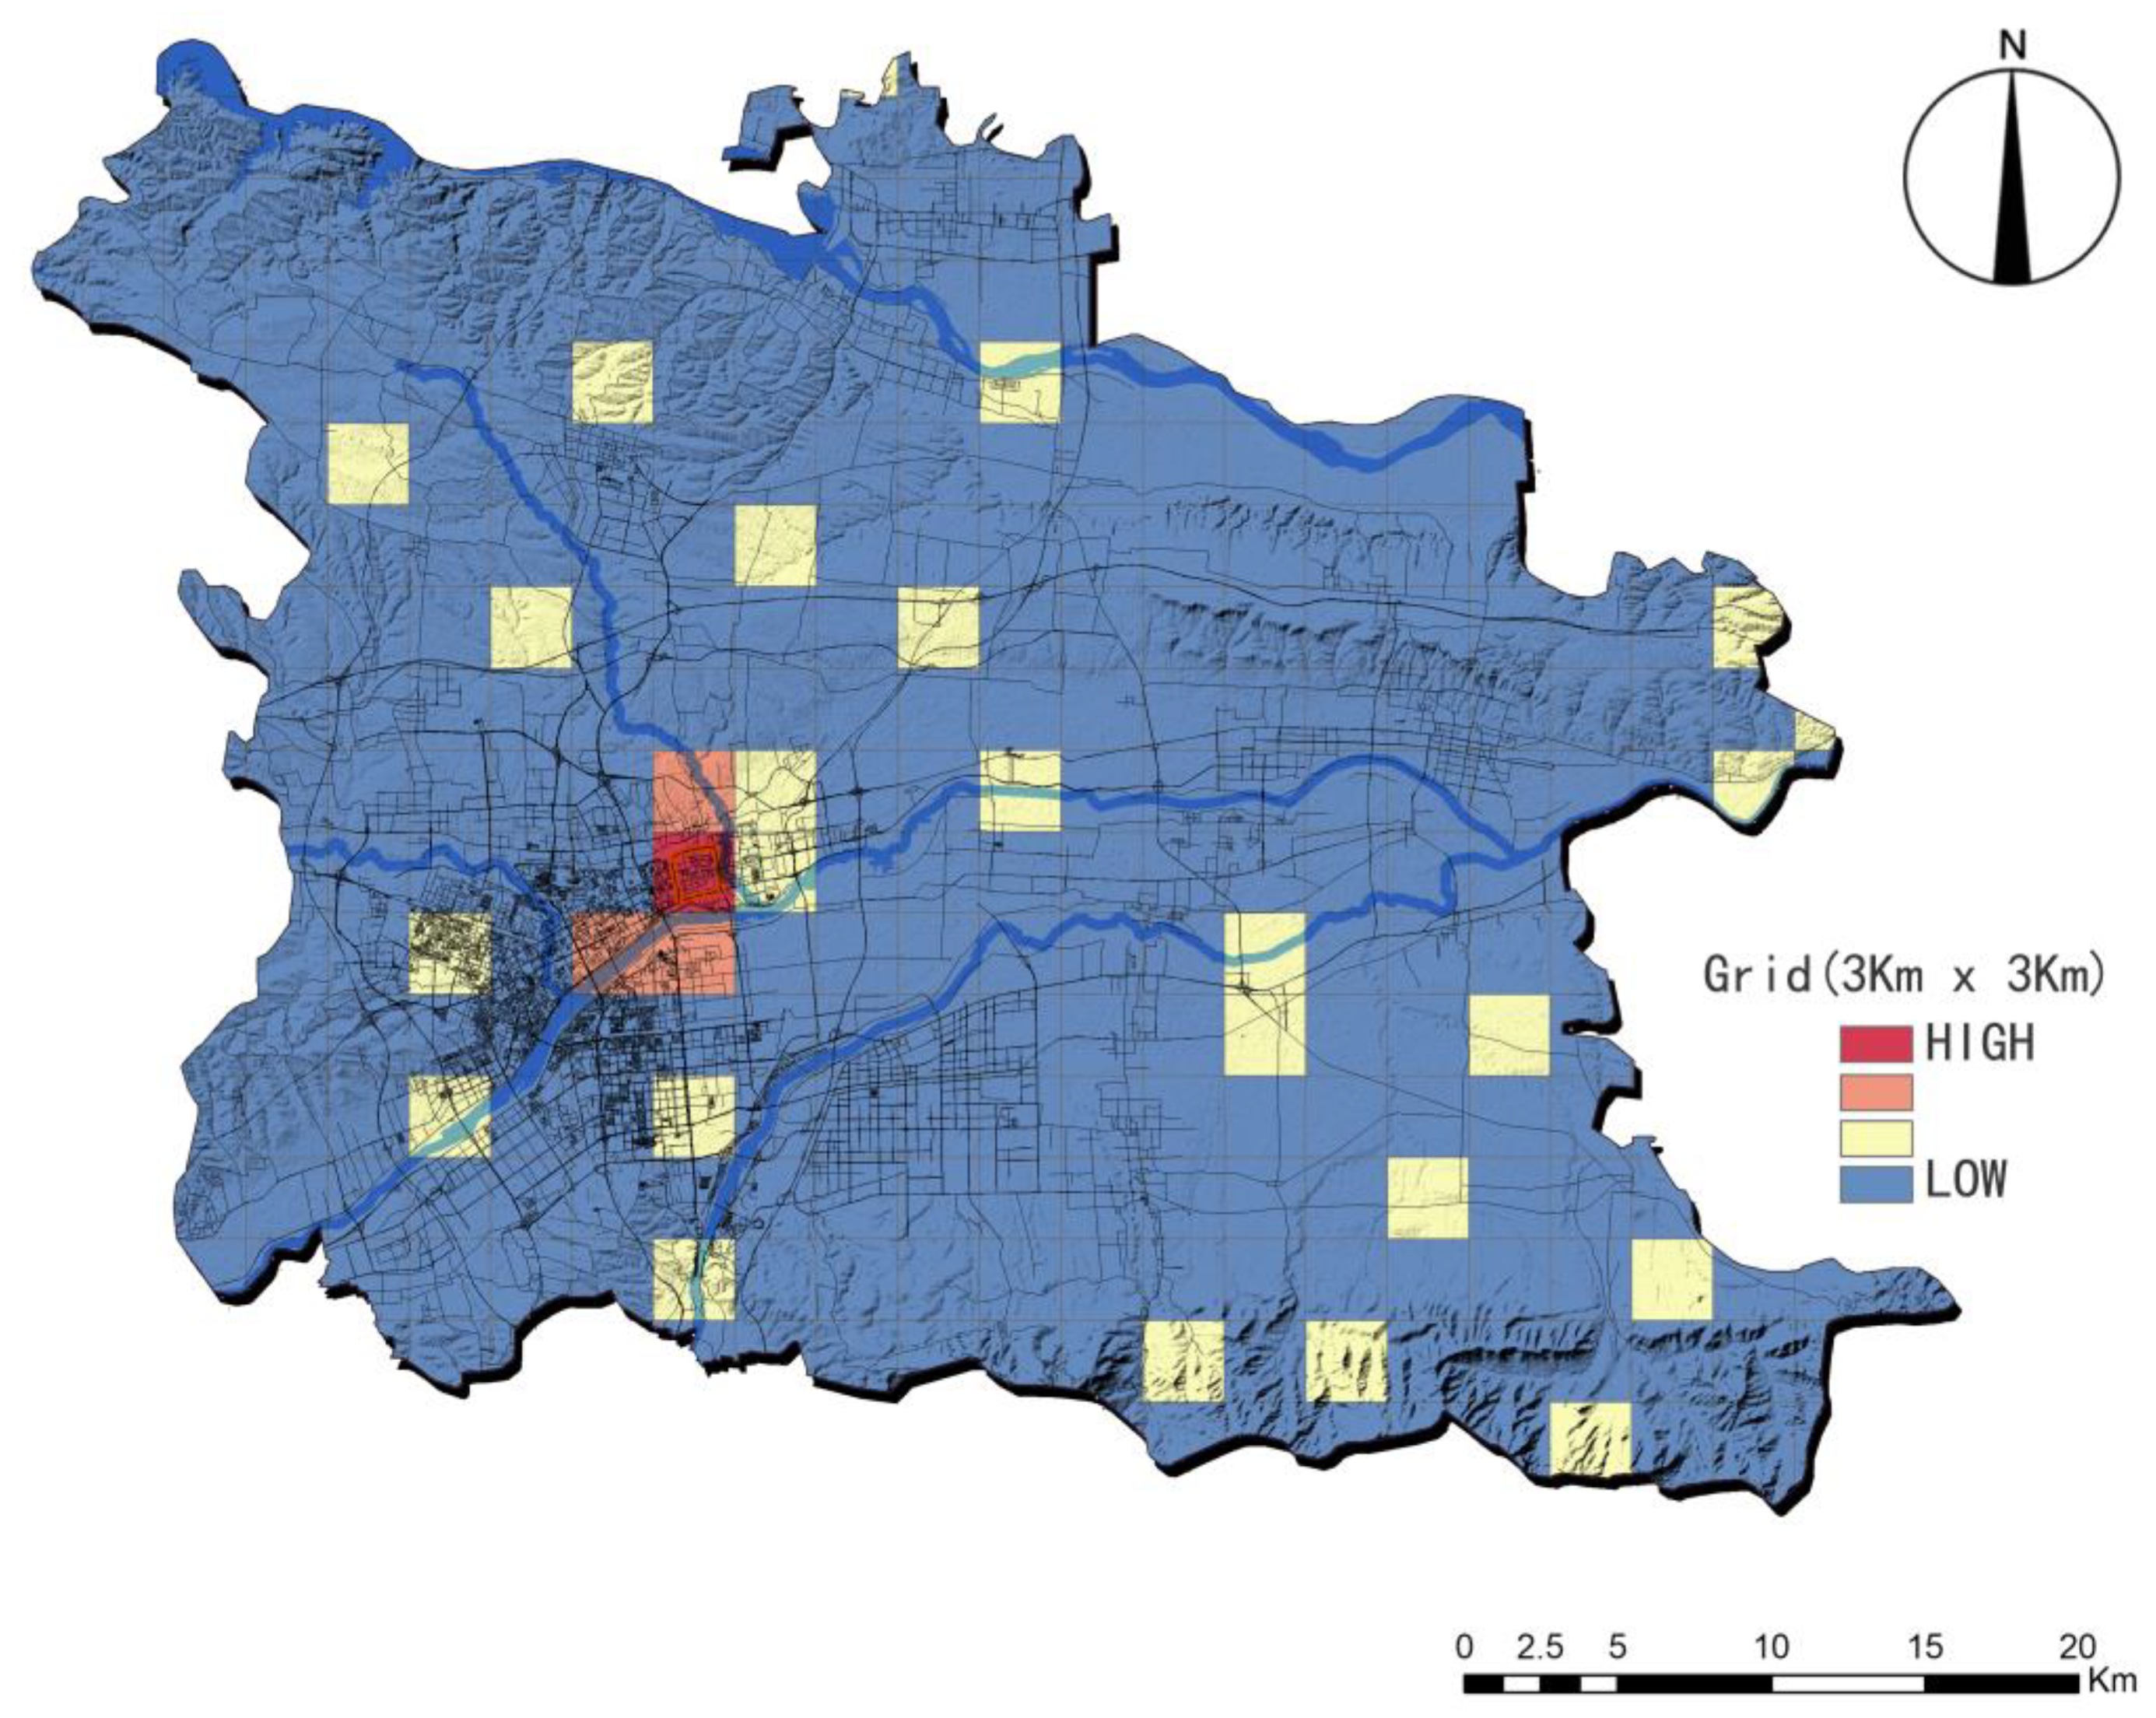
3.3. Overall Spatial Distribution Pattern

The kernel density tool in the ArcGIS10.6 toolbox was applied to analyze the kernel density of historical buildings in the Songshan region. According to the density value of historical buildings, the distribution pattern of historical buildings in the study area was divided into four grades, namely extremely high-density, high-density, medium-density, and low-density. Consequently, the kernel density distribution map of historical buildings in the Songshan region was generated (Figure 7).
The average spatial distribution density of historical buildings in the Songshan region was 0.8429 units/km2, which can be seen in Figure 7. In the Songshan region, two extremely high-density areas were formed in the southwest of Luoyang City and the north of Dengfeng City, as well as four high-density areas in the northwest of Gongyi City, the east of Yuzhou City, the middle of Xuchang City, and the southwest of Xiangcheng County. The spatial pattern shows the characteristics of clusters. The high-density distribution area of historical buildings presents one large patch and two large areas in the north and south. One large patch is located in the southwestern part of Luoyang City. The large northern area includes the northern part of Dengfeng City and most of Gongyi City, while the large southern area contains Ruzhou City, Baofeng County, Jia County, Lushan County, Ye County, Yuzhou City, Xiangcheng County, Xuchang City, and other most areas. The results show that the clustering degree of historical buildings in this region is higher than in other regions.

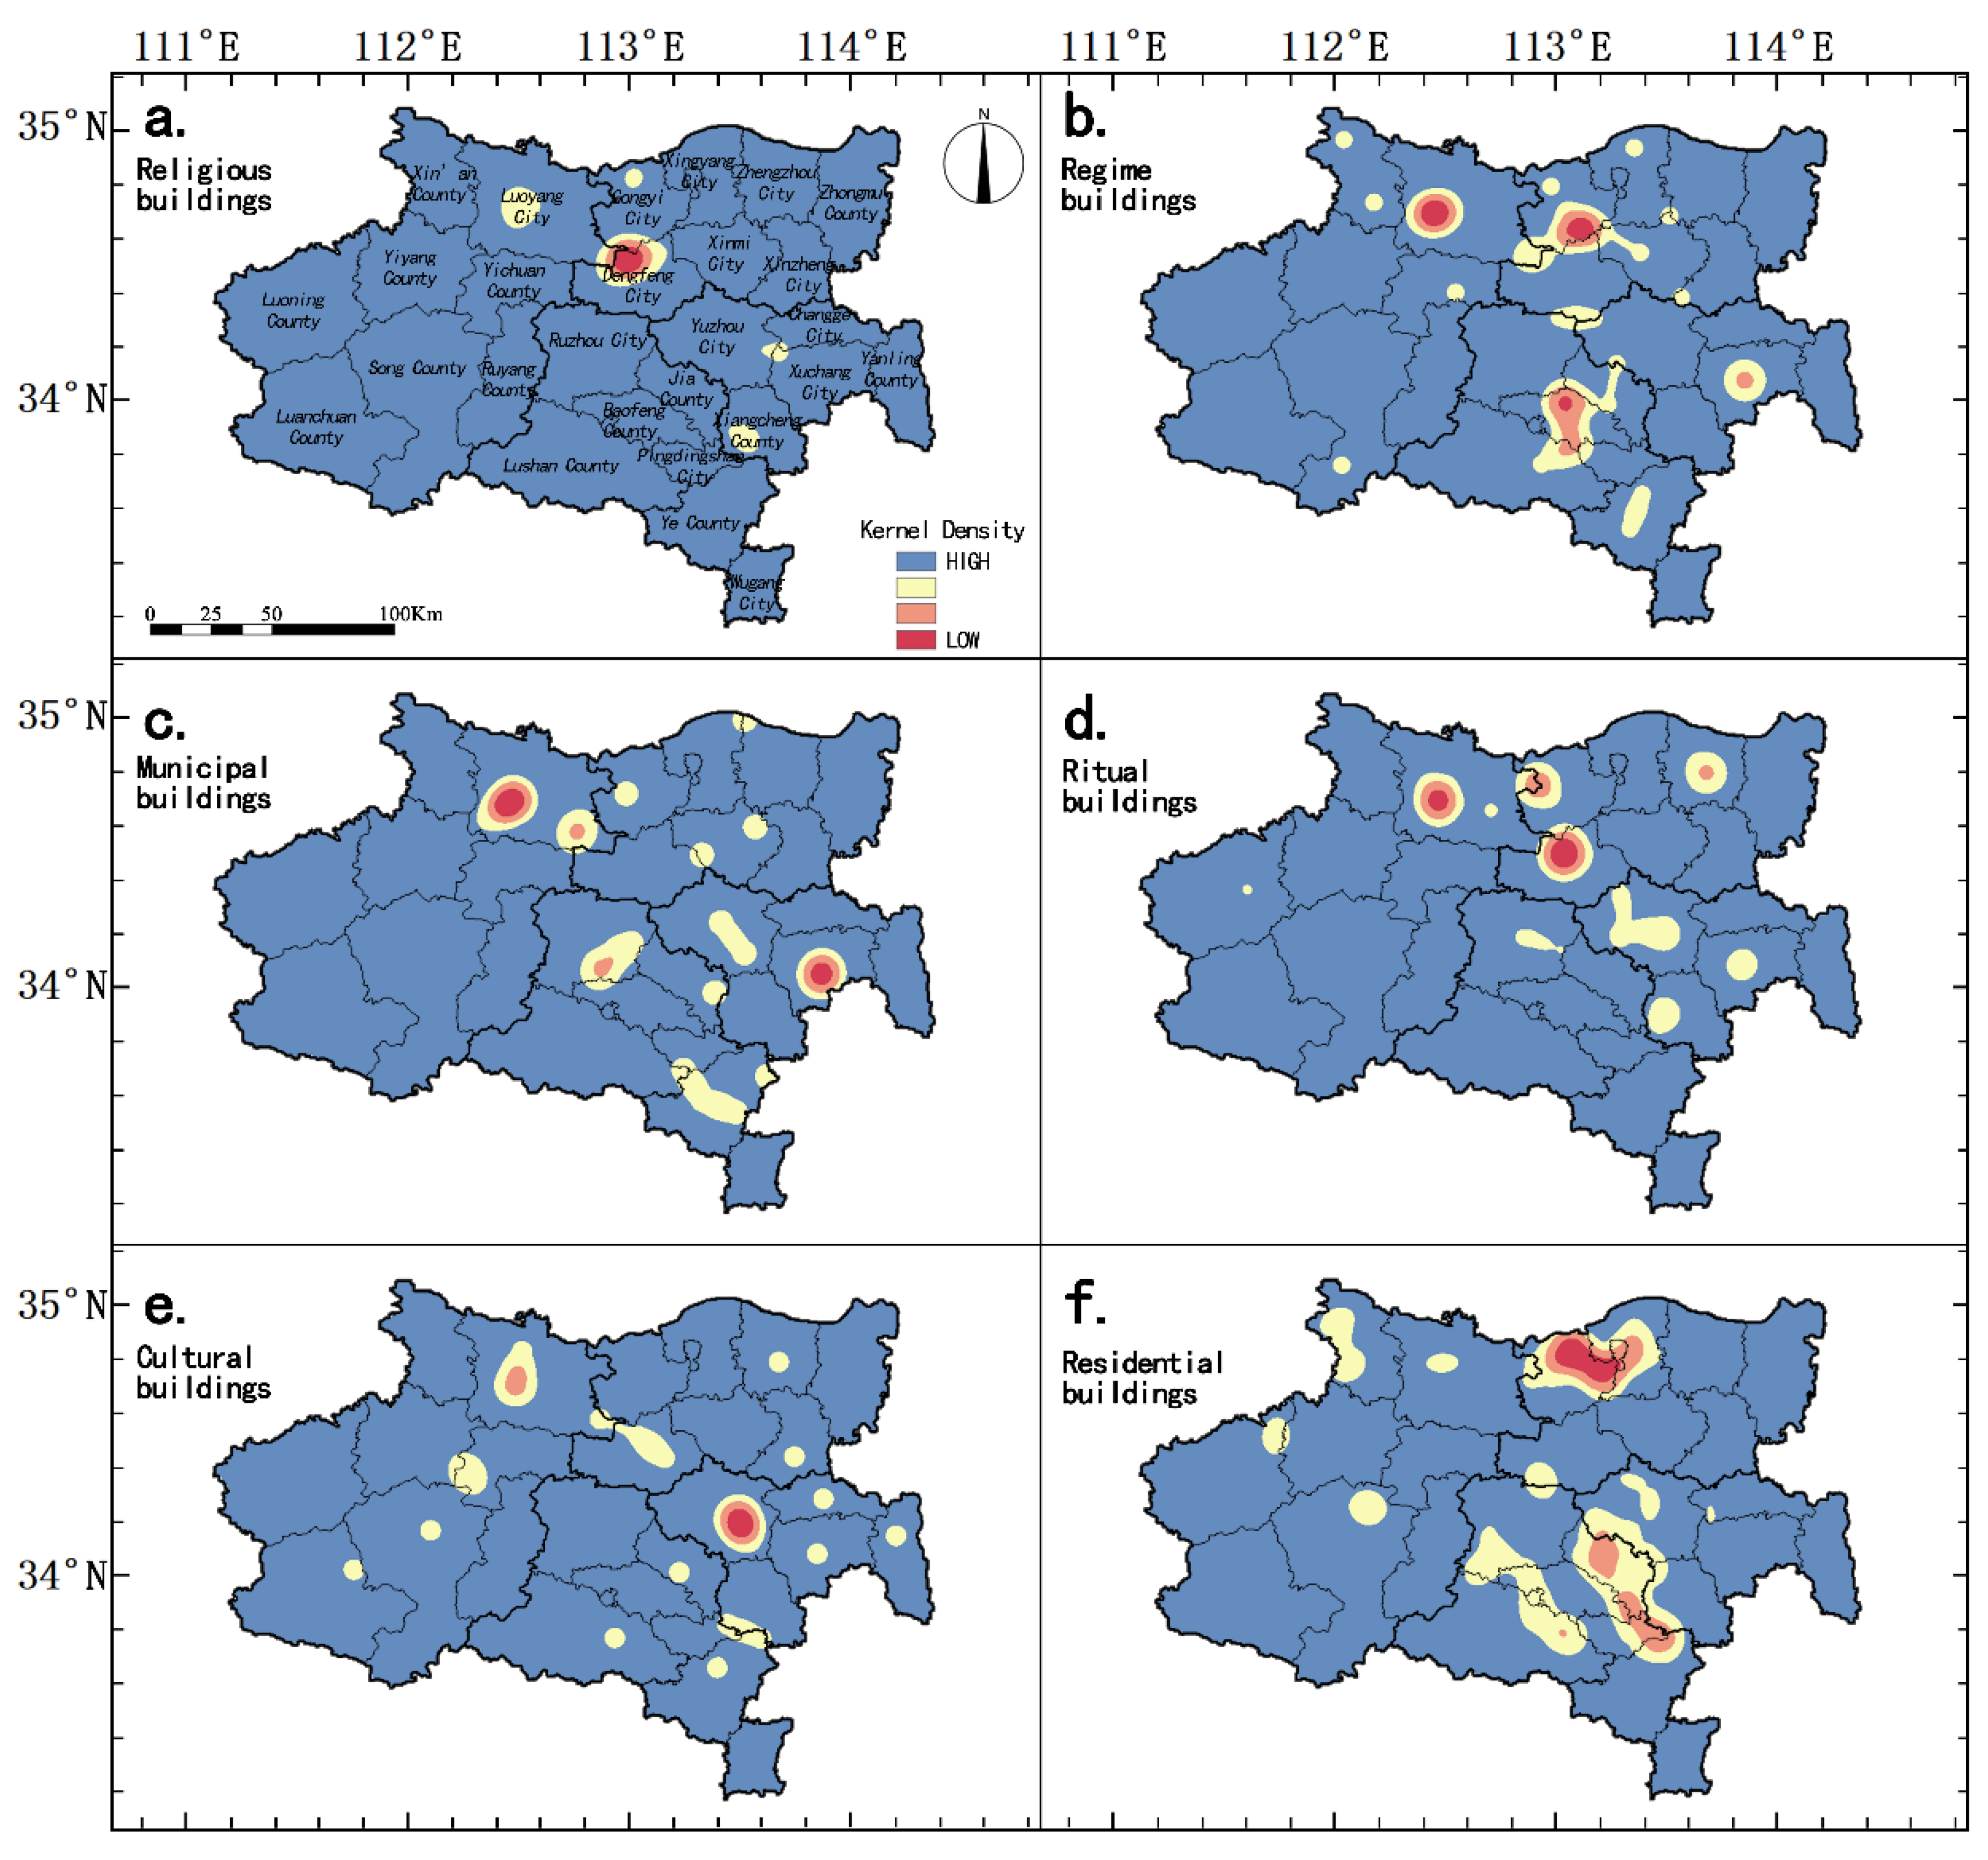
3.4. Spatial Distribution of Different Building Types

To visually express the density changes of different types of historical buildings in the Songshan region, the kernel density analysis results of different types of historical buildings are presented. Figure 8 visually expresses the distribution density of different types of historical buildings in the Songshan region. There is only one high-density area of religious buildings in the north of Dengfeng City, and a relatively low-density area in the southwest of Luoyang City. The high-density areas of regime buildings are located in the southwest of Luoyang City, the south of Gongyi City, and the north of Baofeng County. The high-density distribution of municipal buildings is located in the southwest of Luoyang City and the middle of Xuchang City. Ritual architecture has two high-density distribution areas in the southwest of Luoyang City and the north of Dengfeng City. The high-density distribution areas of cultural buildings are located in the southeast of Yuzhou City, while the sub-high-density distribution area appears in the southwest of Luoyang City. The distribution density of residential buildings is the highest in the northeast of Gongyi City, and there are sub-high-density areas in Jia County and the local areas bordering Pingdingshan City and Xiangcheng County. It can be seen that the high-density distribution areas of different types of historical buildings appeared many times in the southwest of Luoyang City and the north of Dengfeng City, and the locations of these two places approximately coincide with the overall high-density distribution areas of historical buildings in the Songshan region.

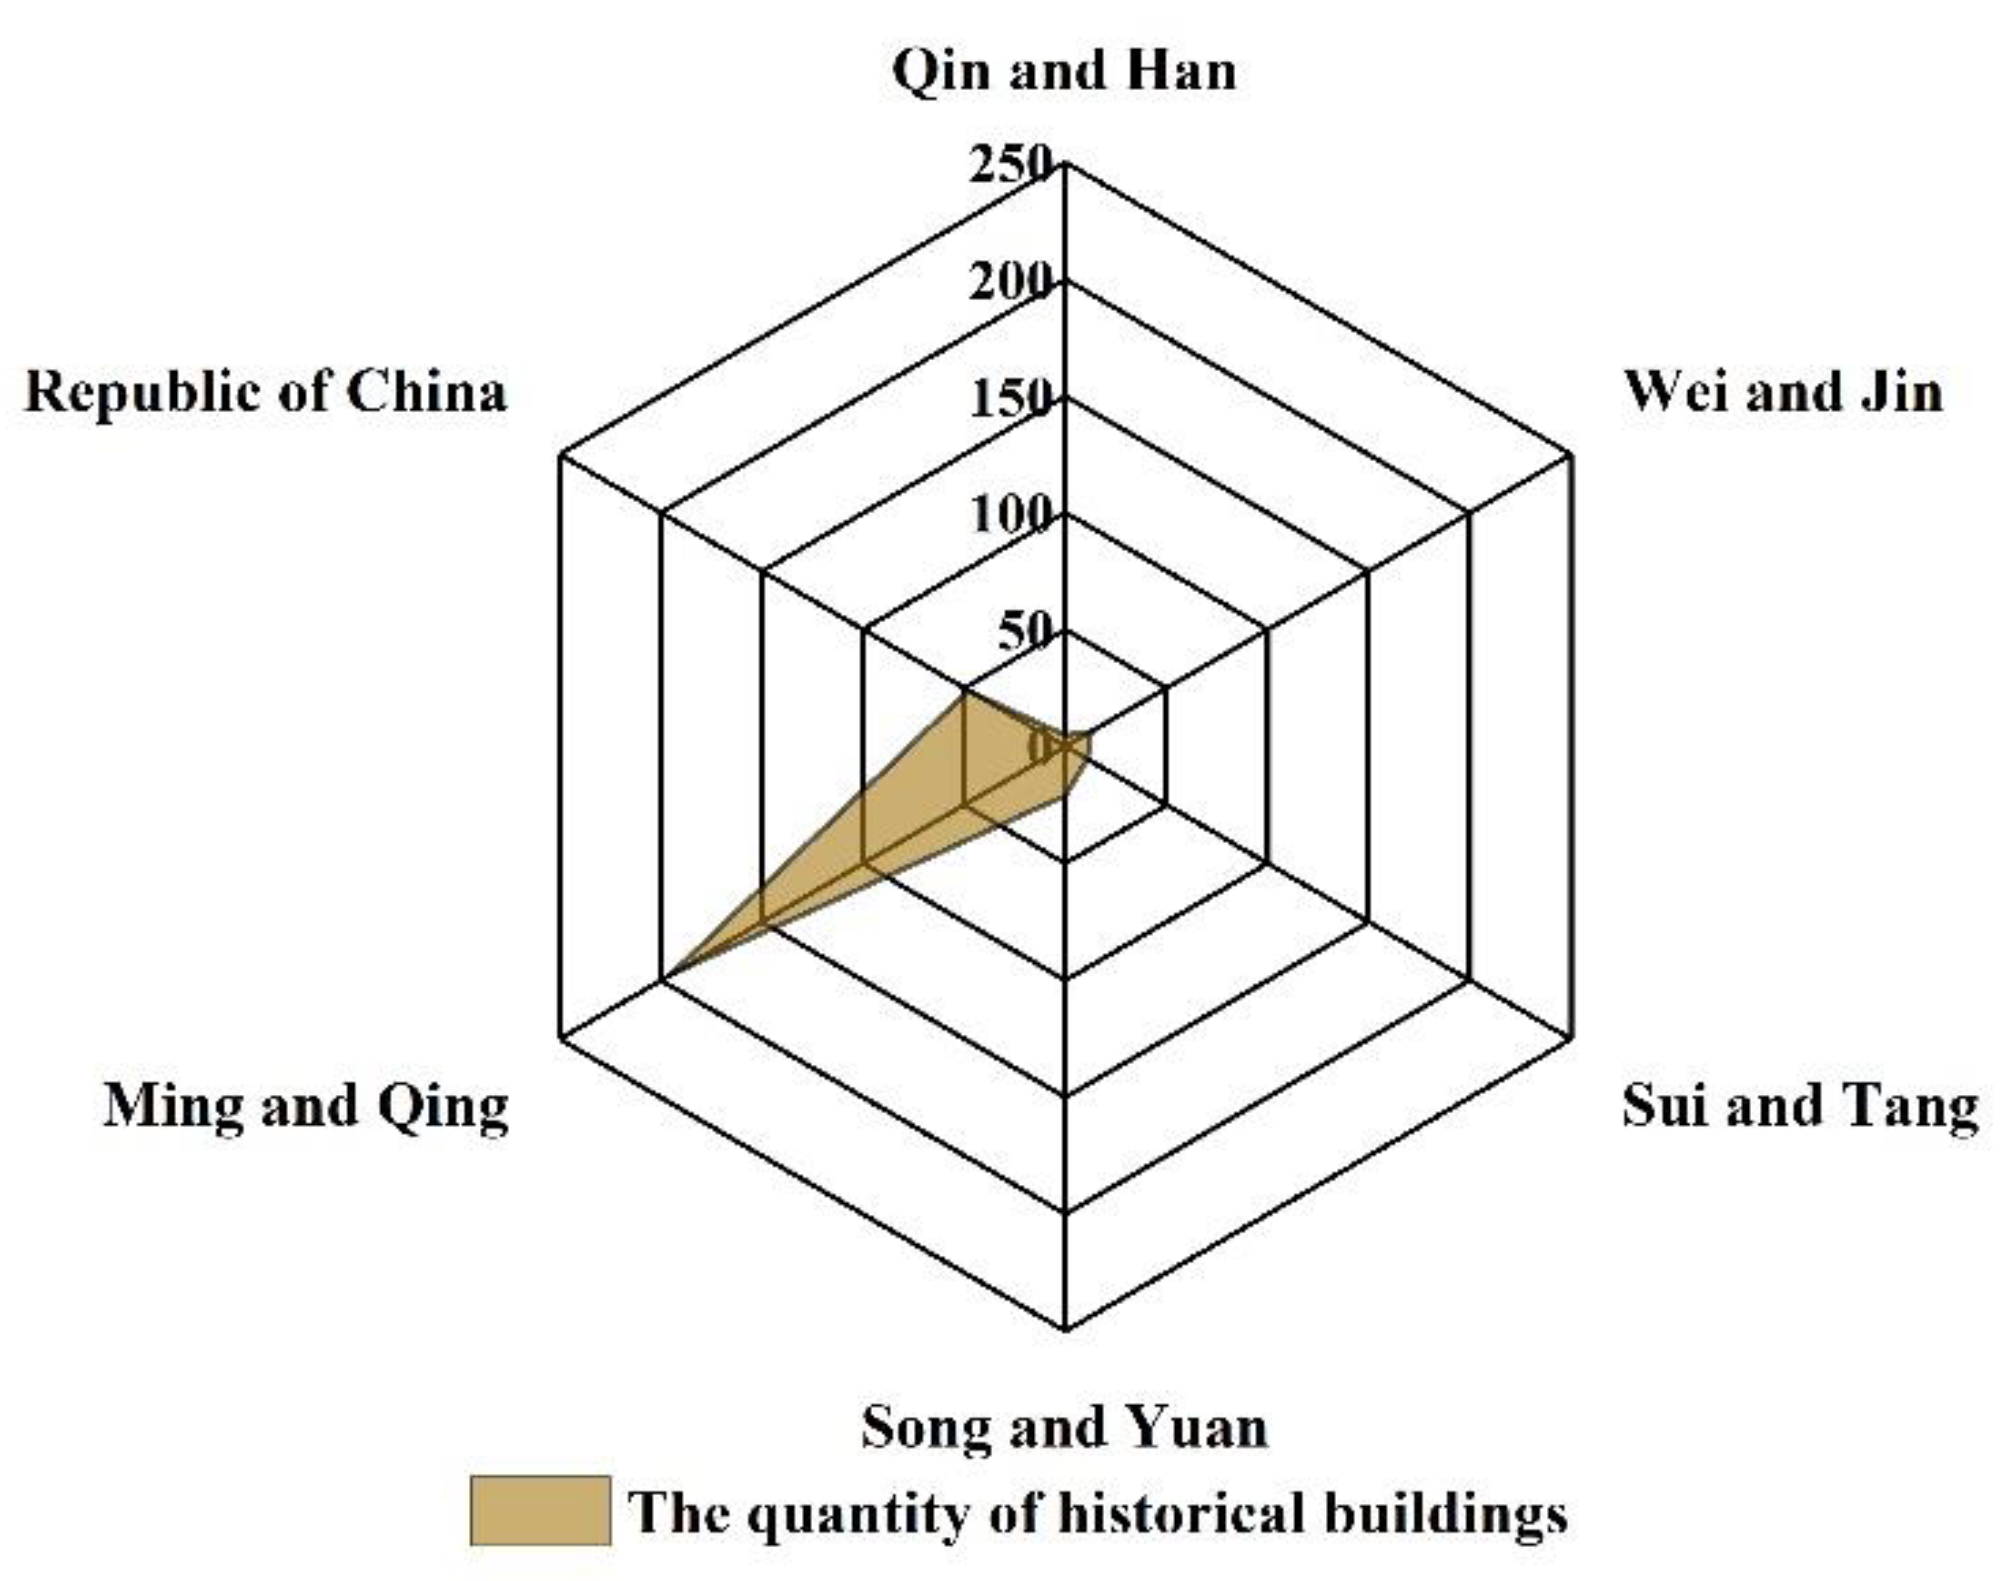
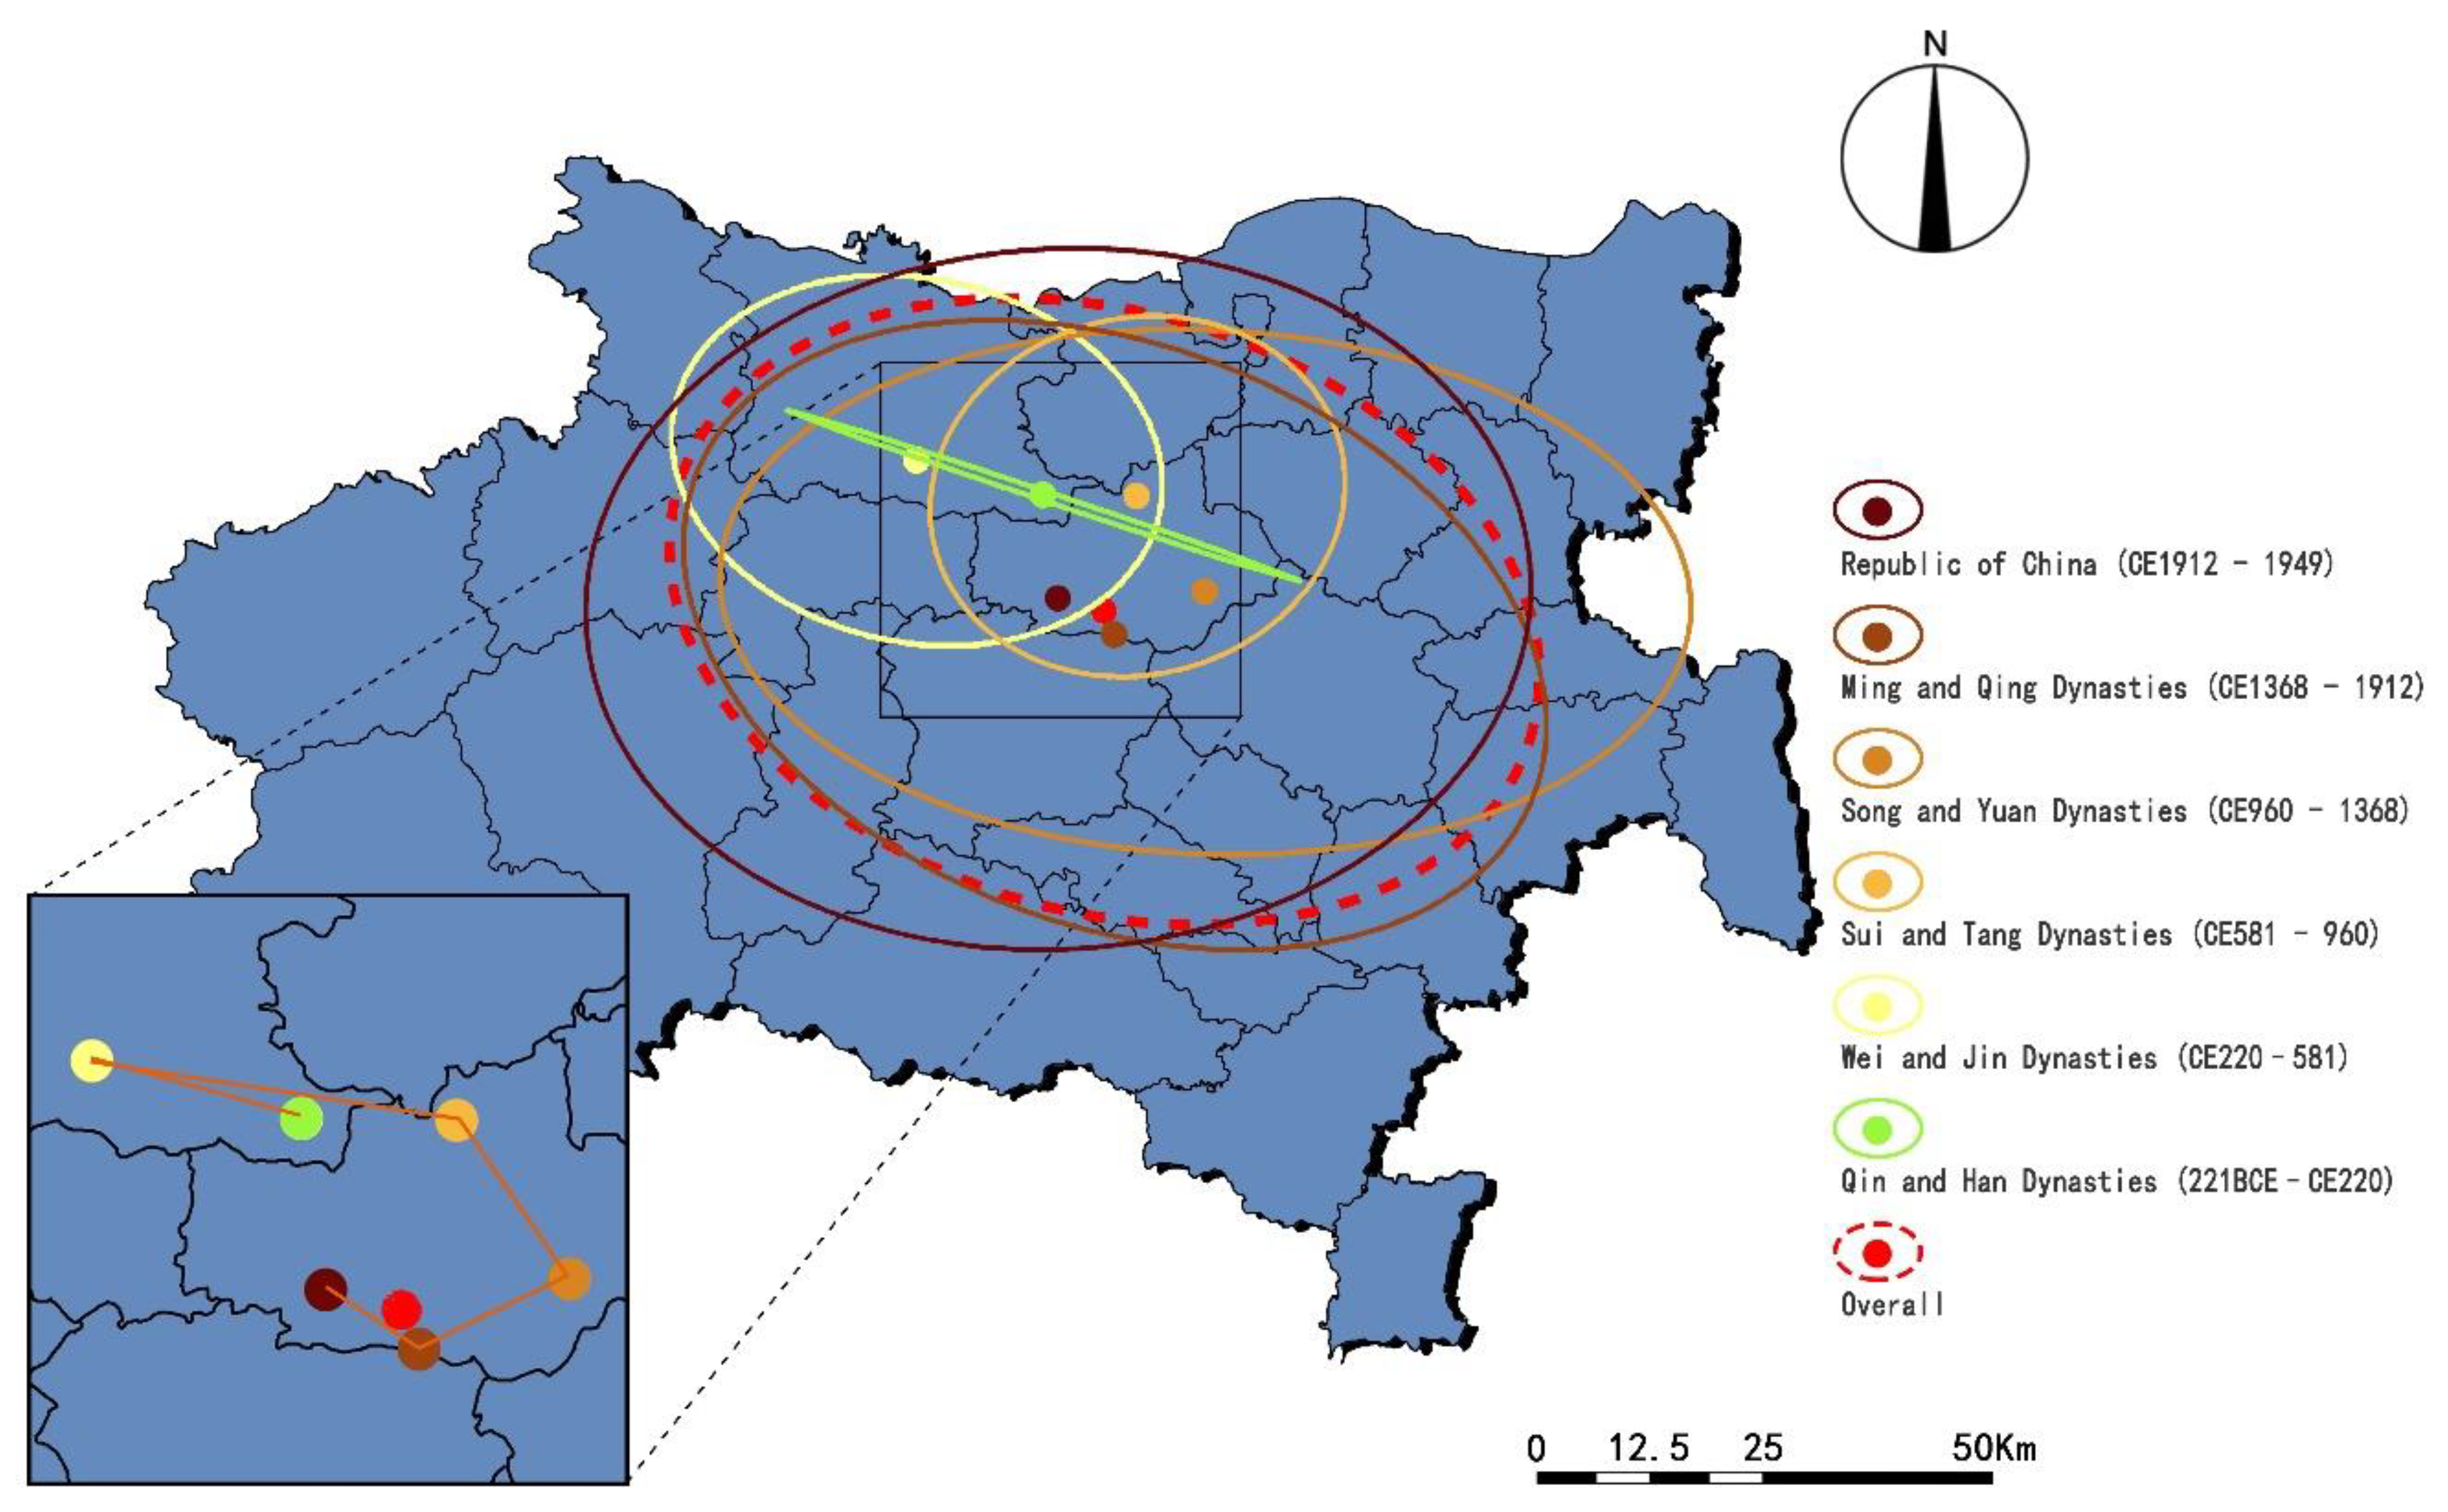
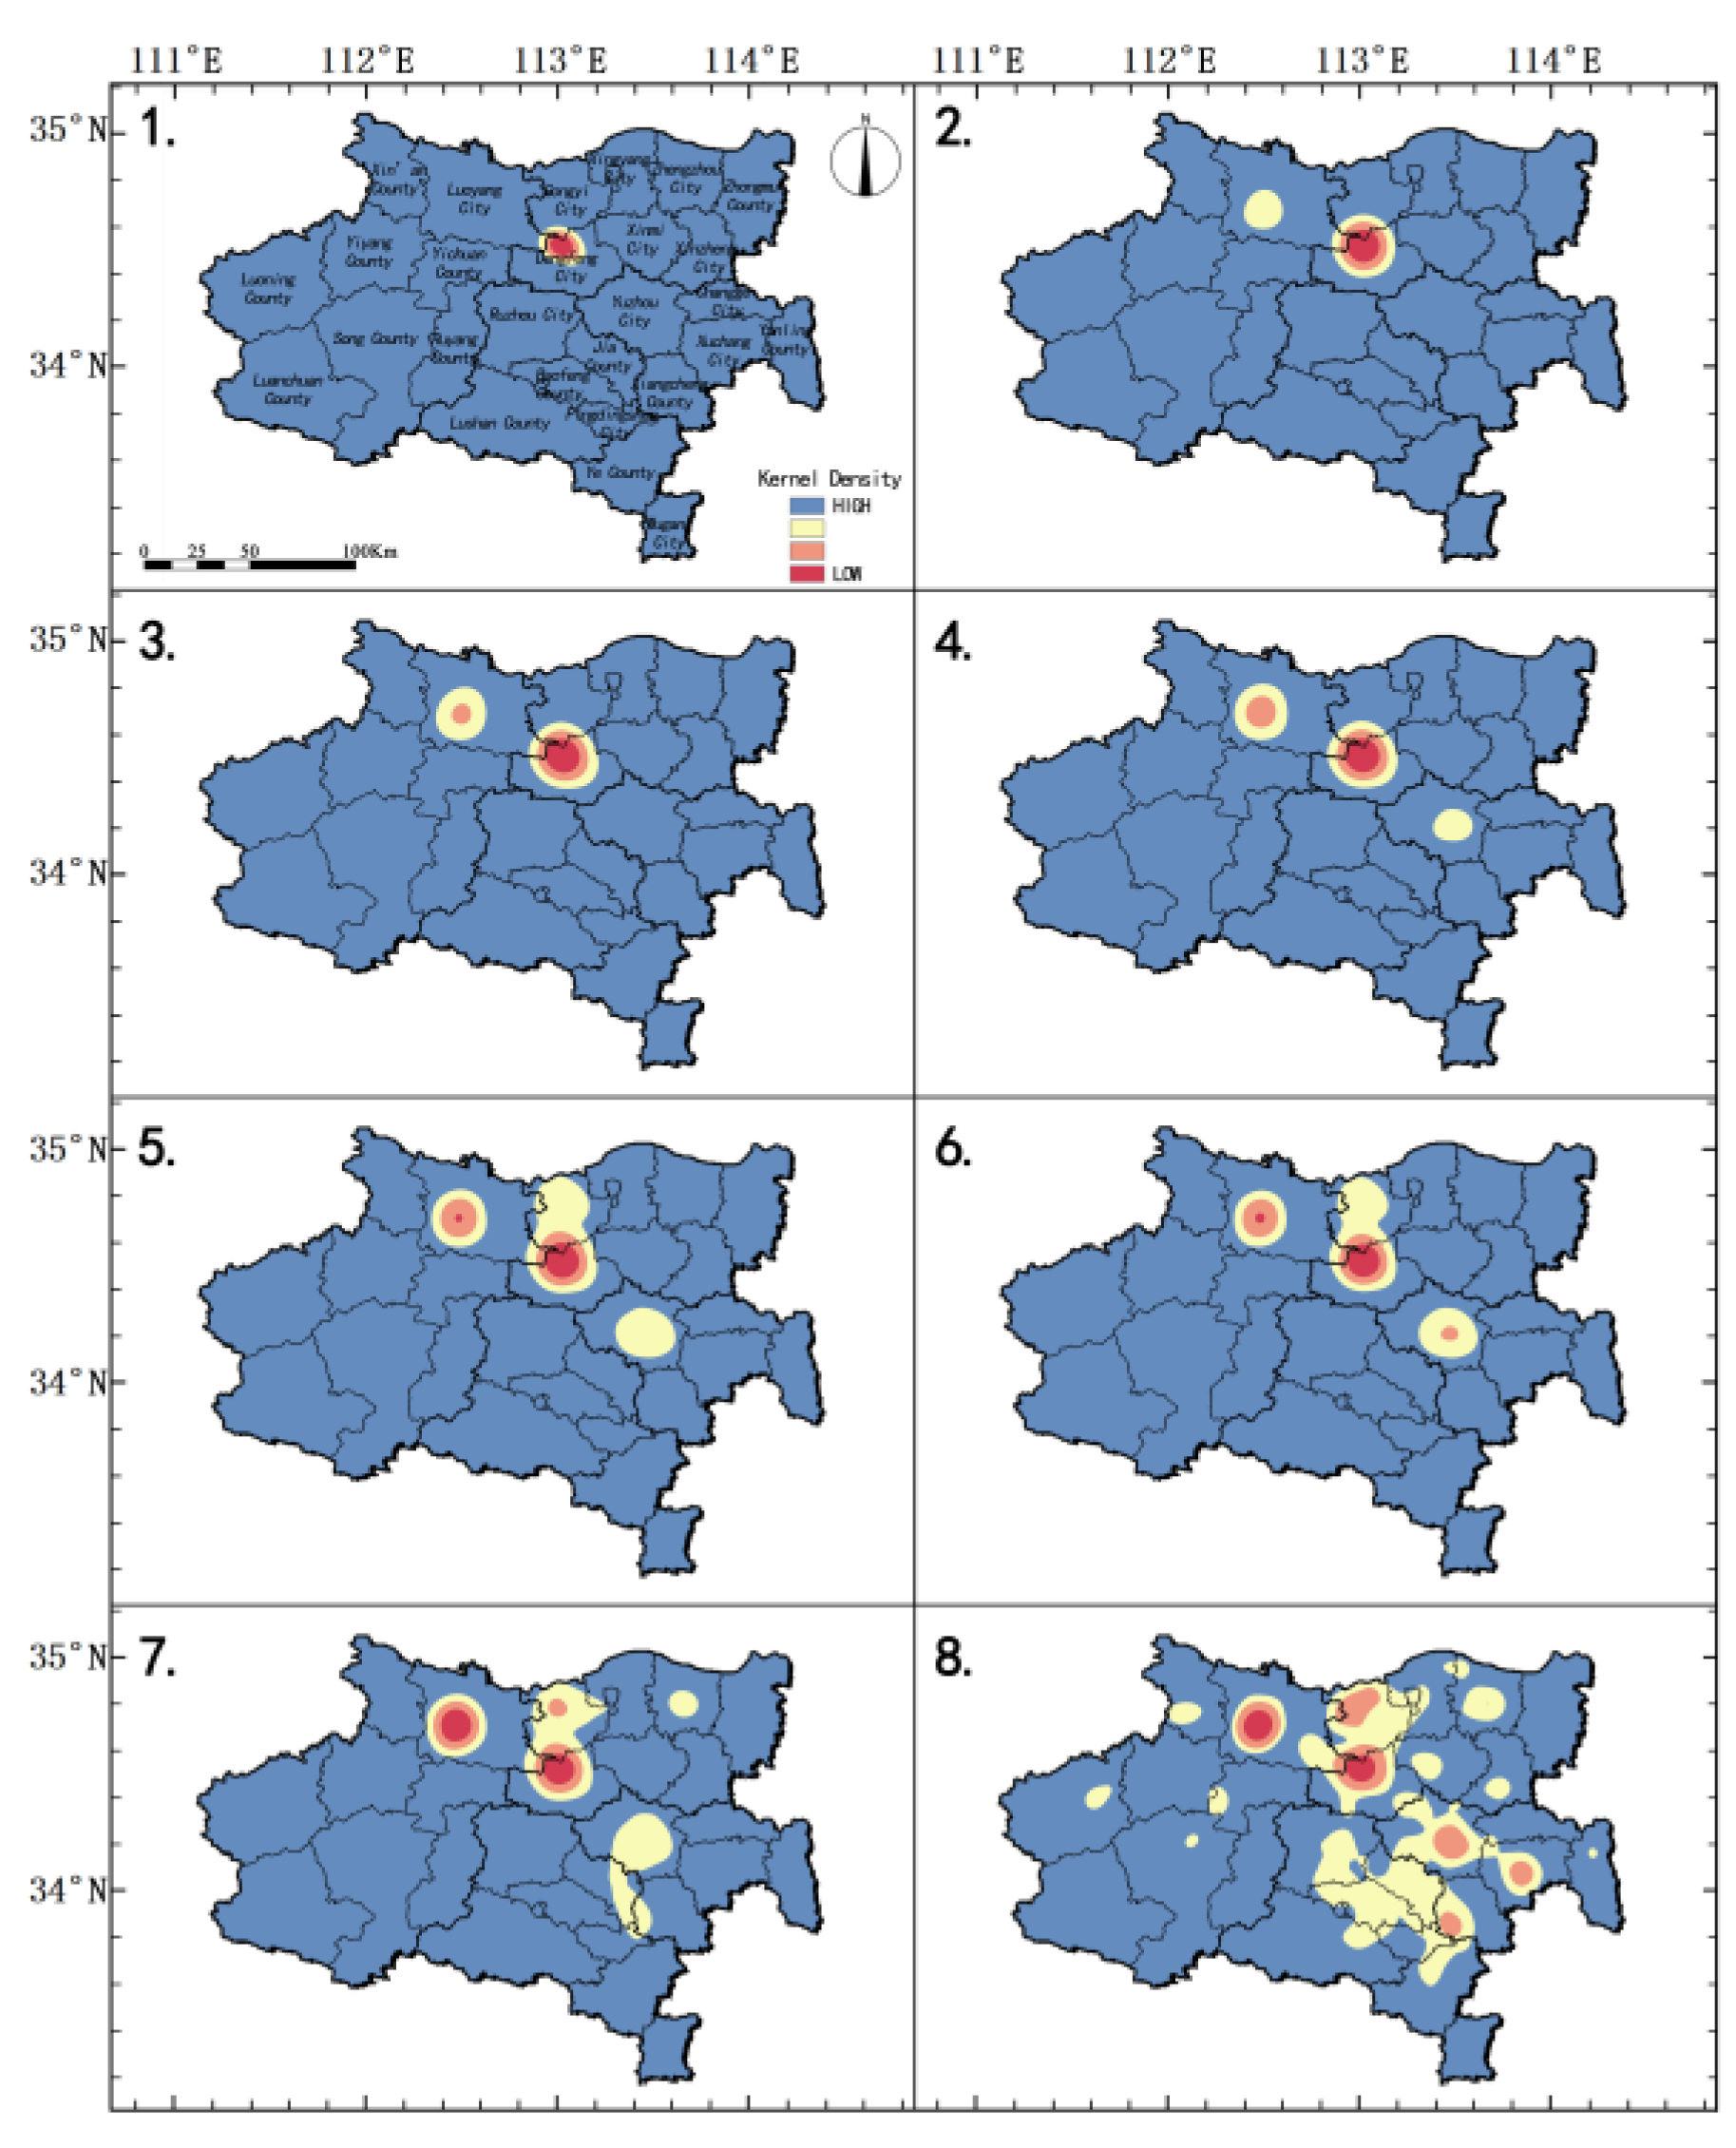
3.5. Evolution of Spatial Distribution in Different Periods

By using the standard deviation ellipse tool in the spatial statistical tools of ArcGIS10.6, the distribution characteristics of historical buildings in the Songshan region in different periods were analyzed (Figure 9, Table 3). The results show that the major axis of the standard deviation ellipse of the overall distribution of historical buildings in the Songshan region is significantly longer than the minor axis, and the direction of the major axis is 106.05°. The overall distribution has strong directionality and a large degree of dispersion. The long axis direction of the standard deviation ellipse of Qin and Han, and Wei and Jin dynasties changed from 108° to 102°, and the distribution direction of historical buildings was generally unchanged during this period. The center point of the ellipse was within Luoyang City, but the center point shifted to the northwest direction. According to the increase in the length of the short axis, the distribution of historical buildings in this period had an obvious trend of diffusion. During the period of Wei and Jin dynasties to Sui and Tang dynasties, the administrative scope of the center point of the ellipse changed from Luoyang City to Dengfeng City. The oblate rate of the ellipse decreased, and the directionality of the ellipse changed from 102° to 75°. During the period of Song and Yuan dynasties and the Republic of China, the center point of the ellipse shifted in the clockwise direction in Dengfeng City, and the minor axis of the ellipse increased obviously, indicating that the distribution range of historical buildings increased during this period, and the distribution direction of historical buildings changed from 86° to 110°. The shape, position, and direction of the ellipse in Ming and Qing dynasties were more coincident with the overall distribution of historical buildings, and the center position of the two ellipses was close to each other. The distribution range of historical buildings during the Ming and Qing dynasties was in pace with that of the overall distribution.

4. Factors Influencing the Distribution of Historical Buildings in Songshan Region

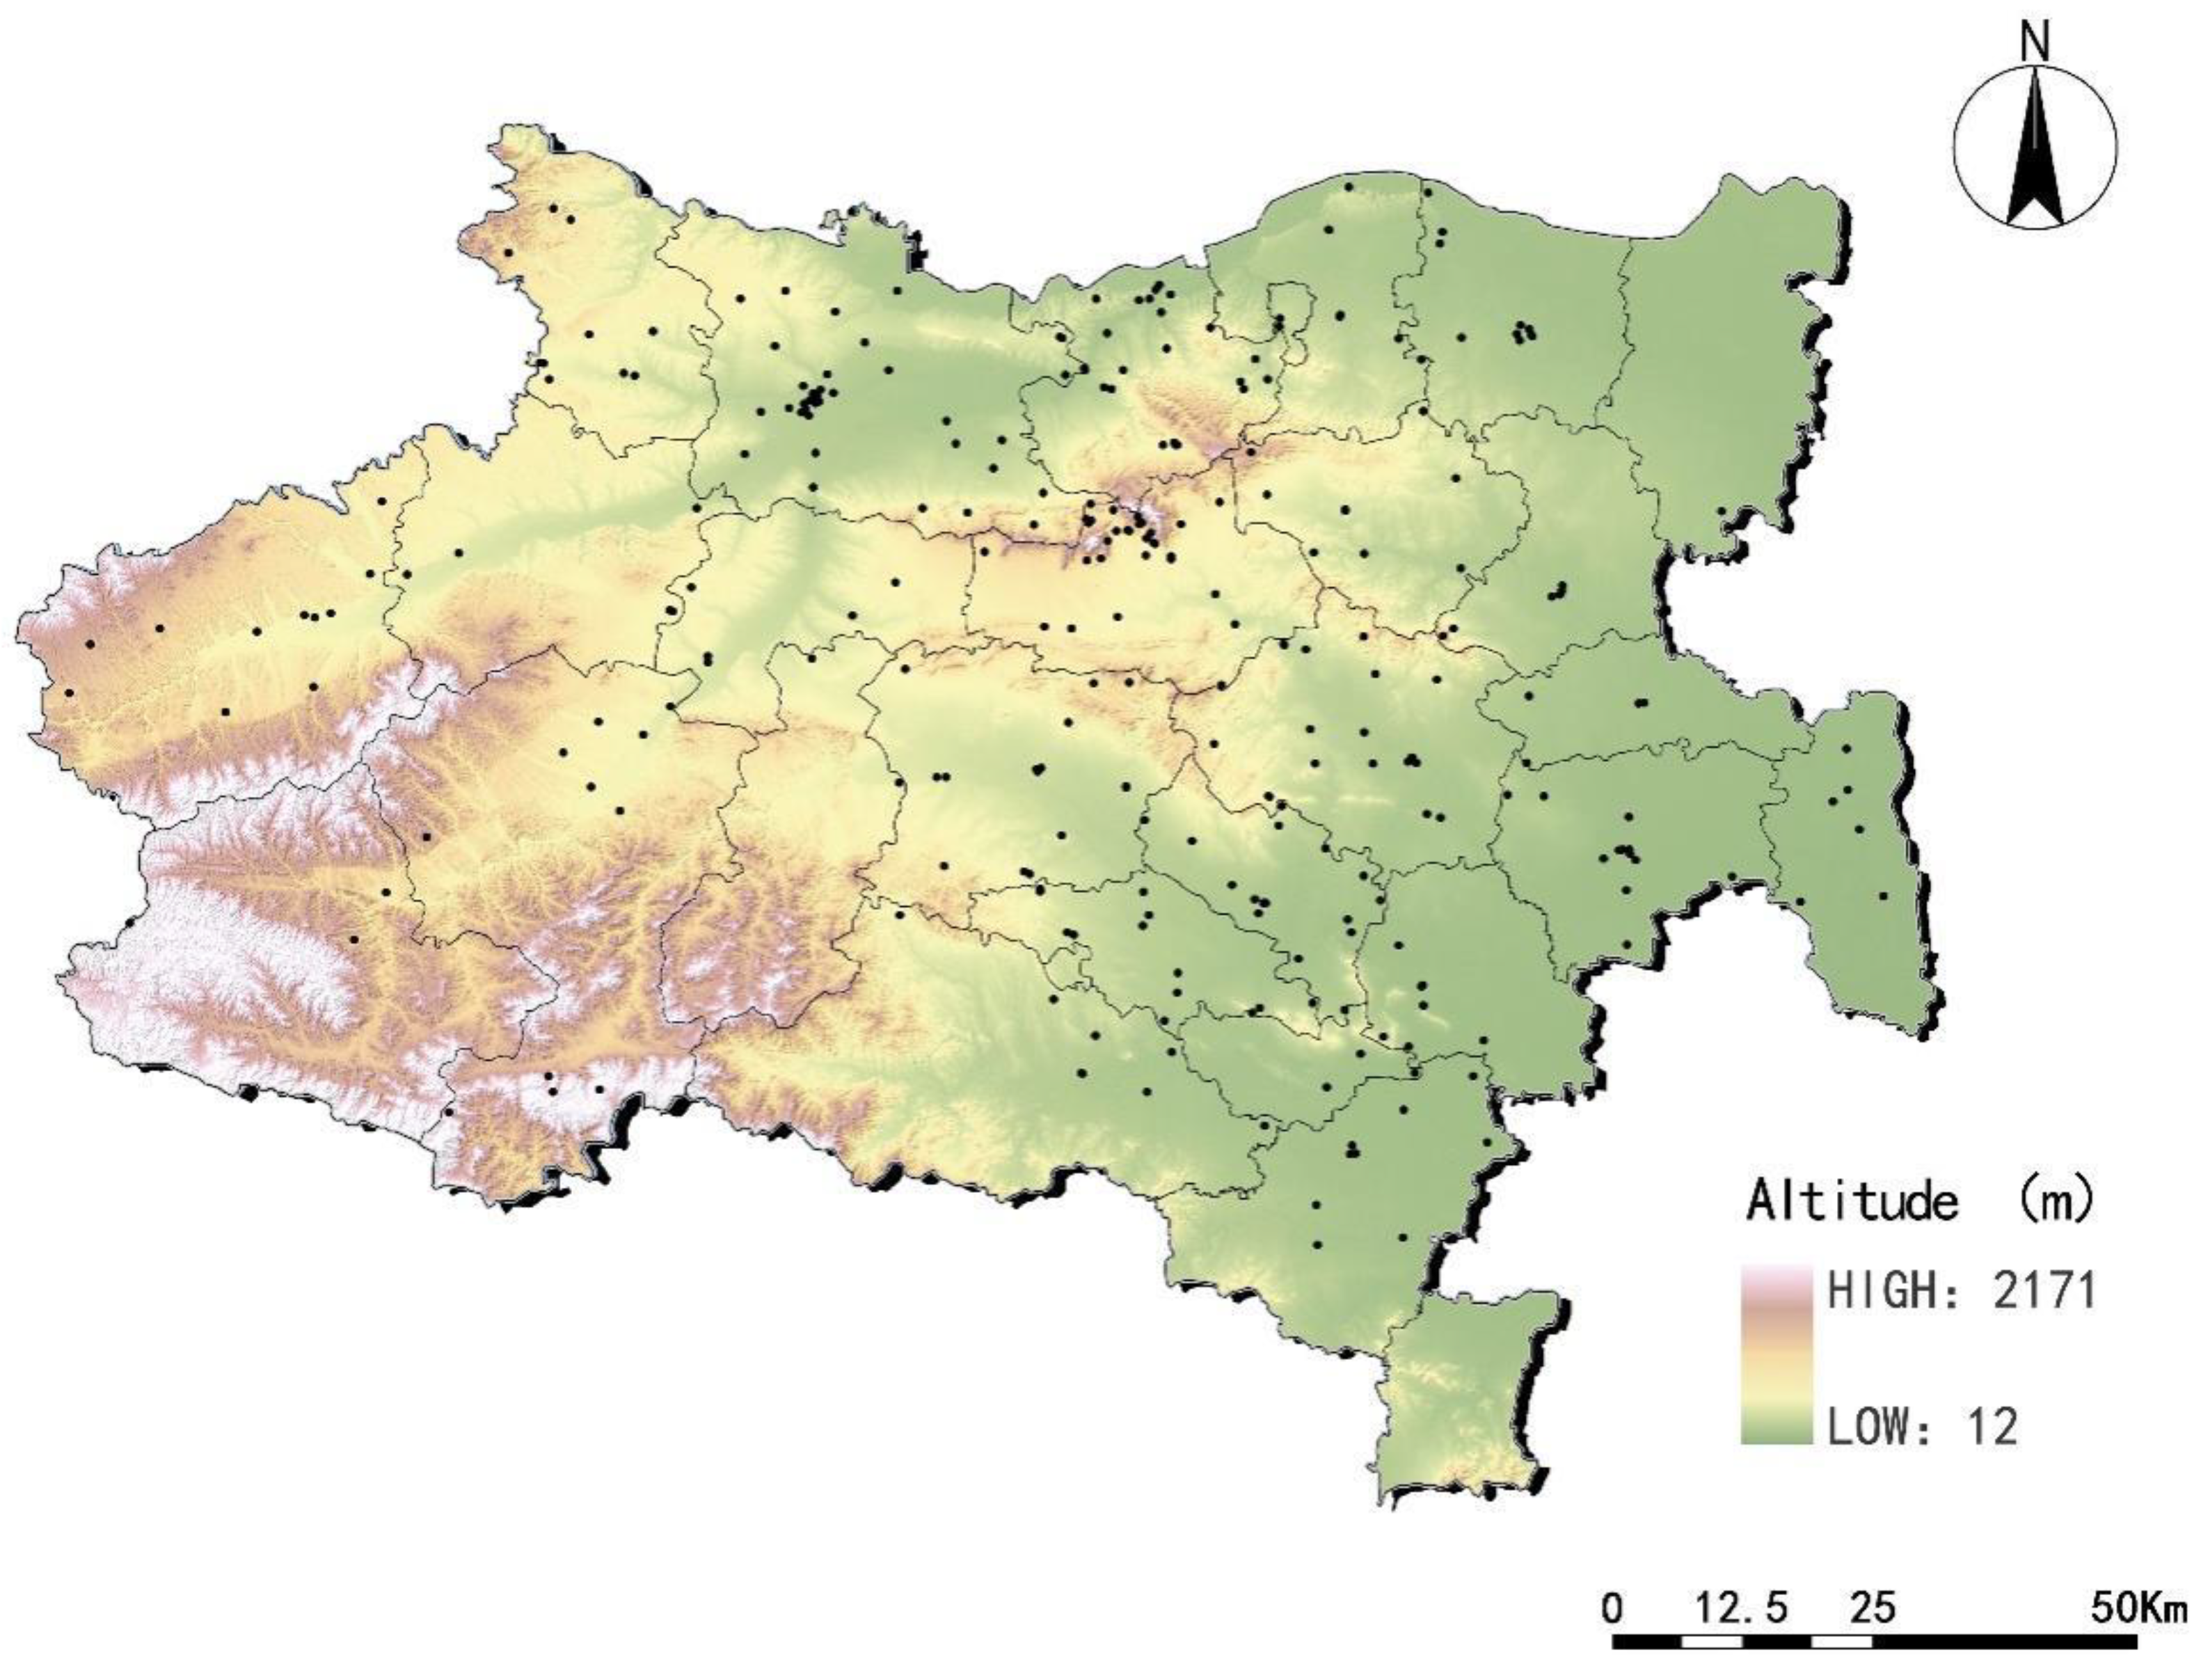
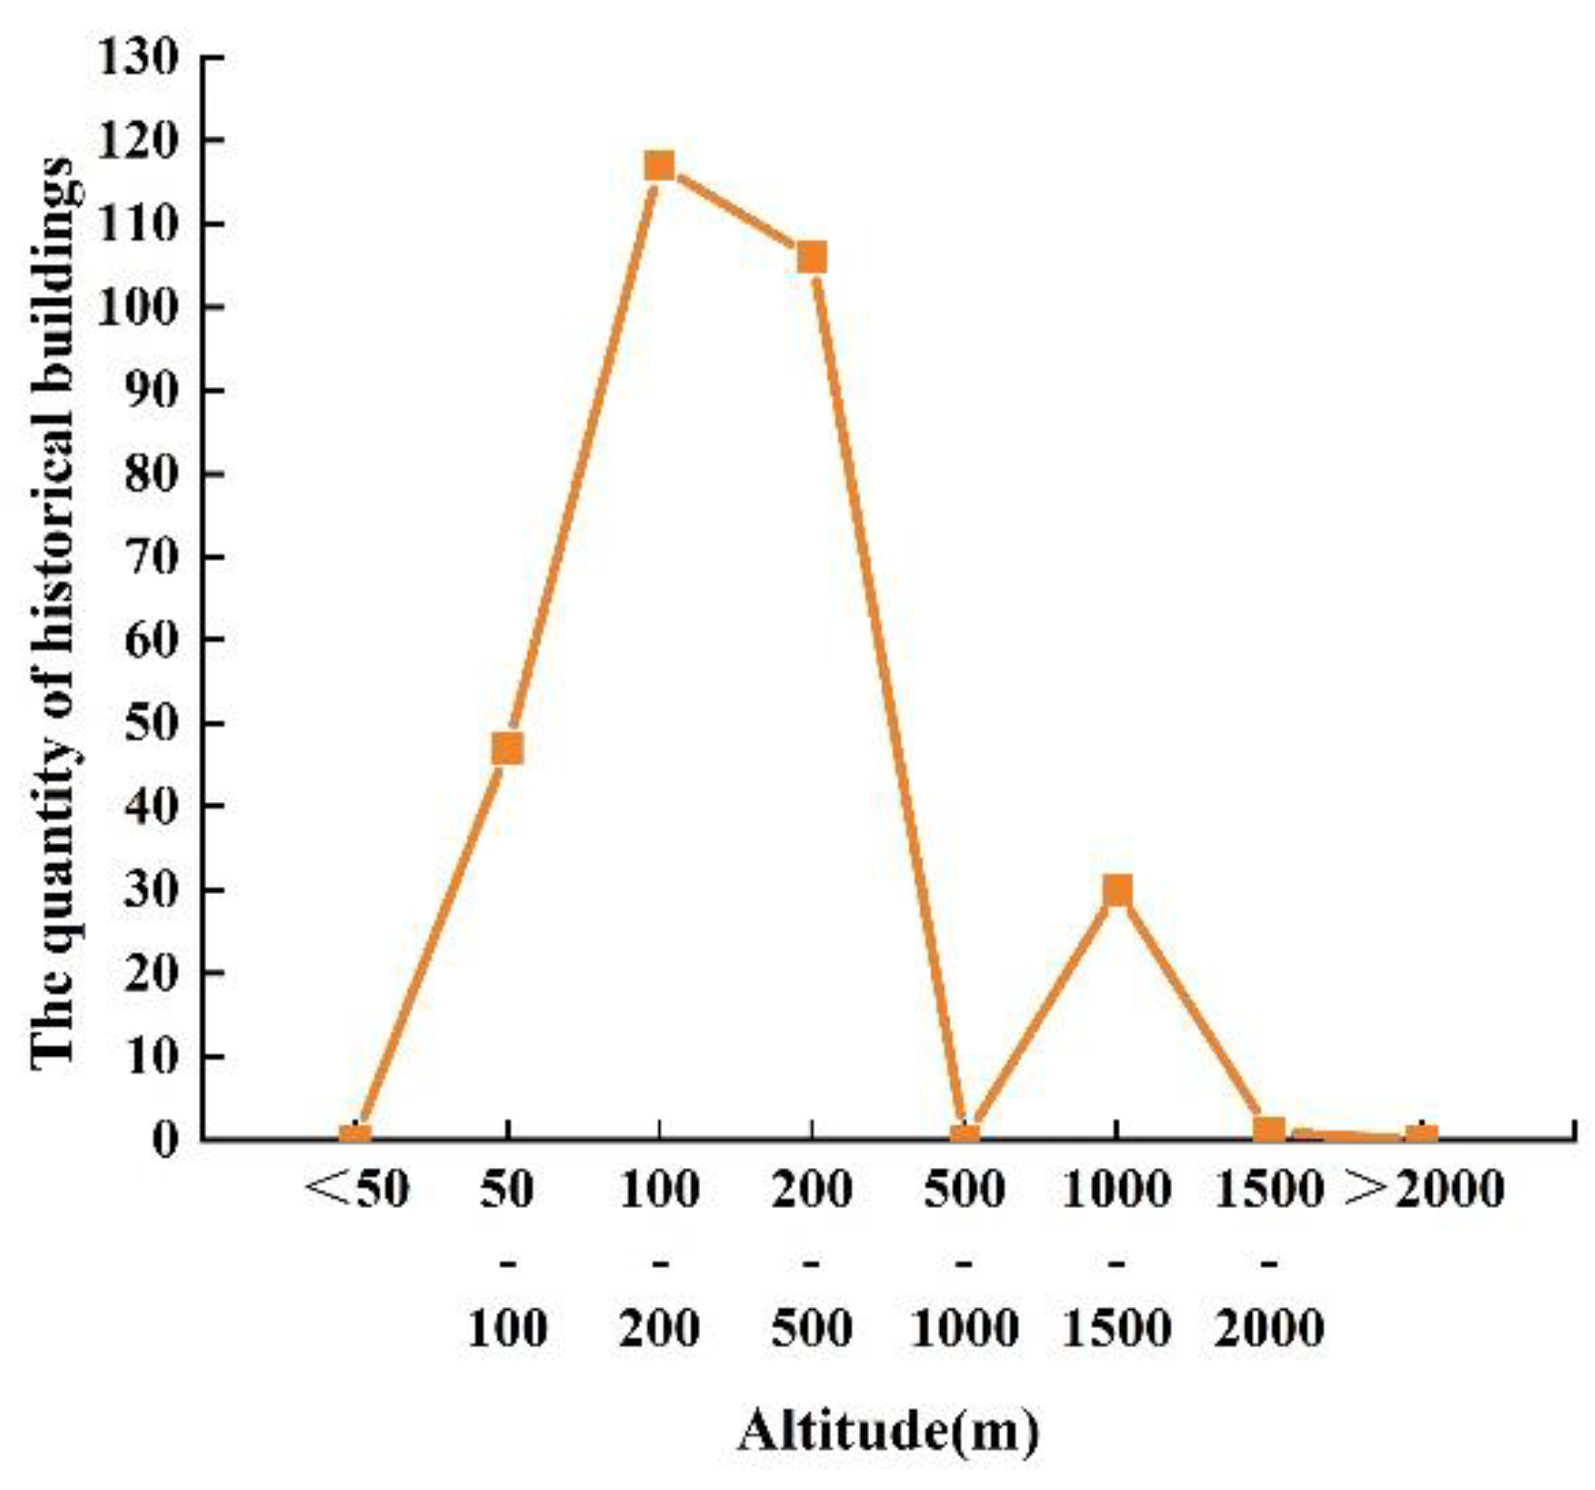
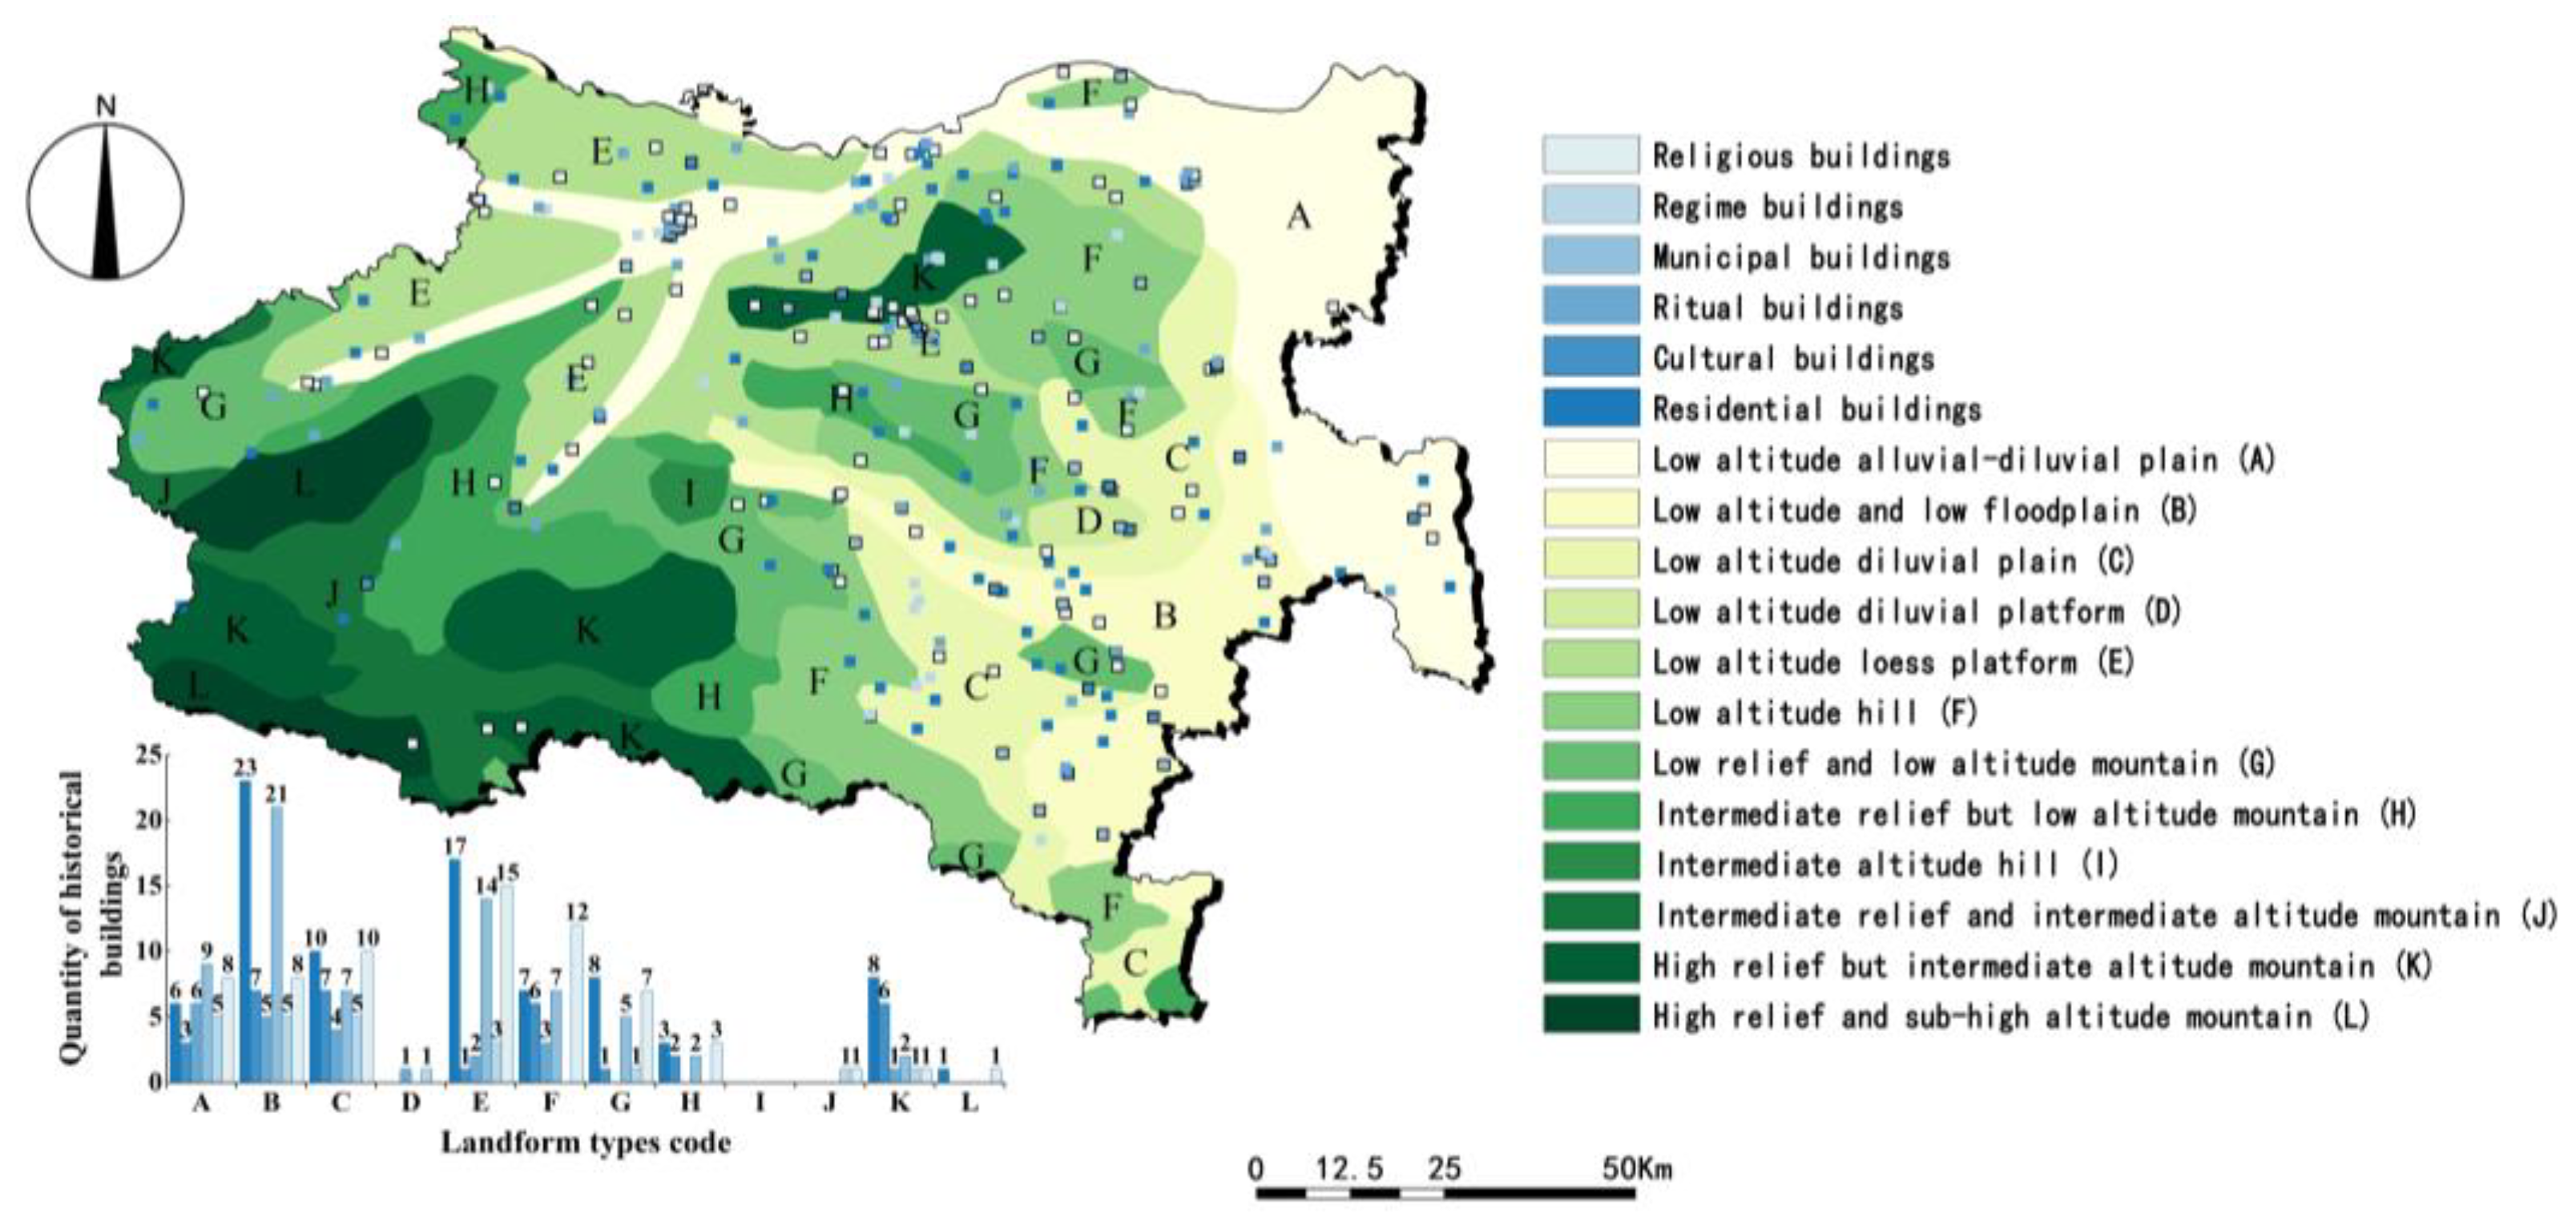
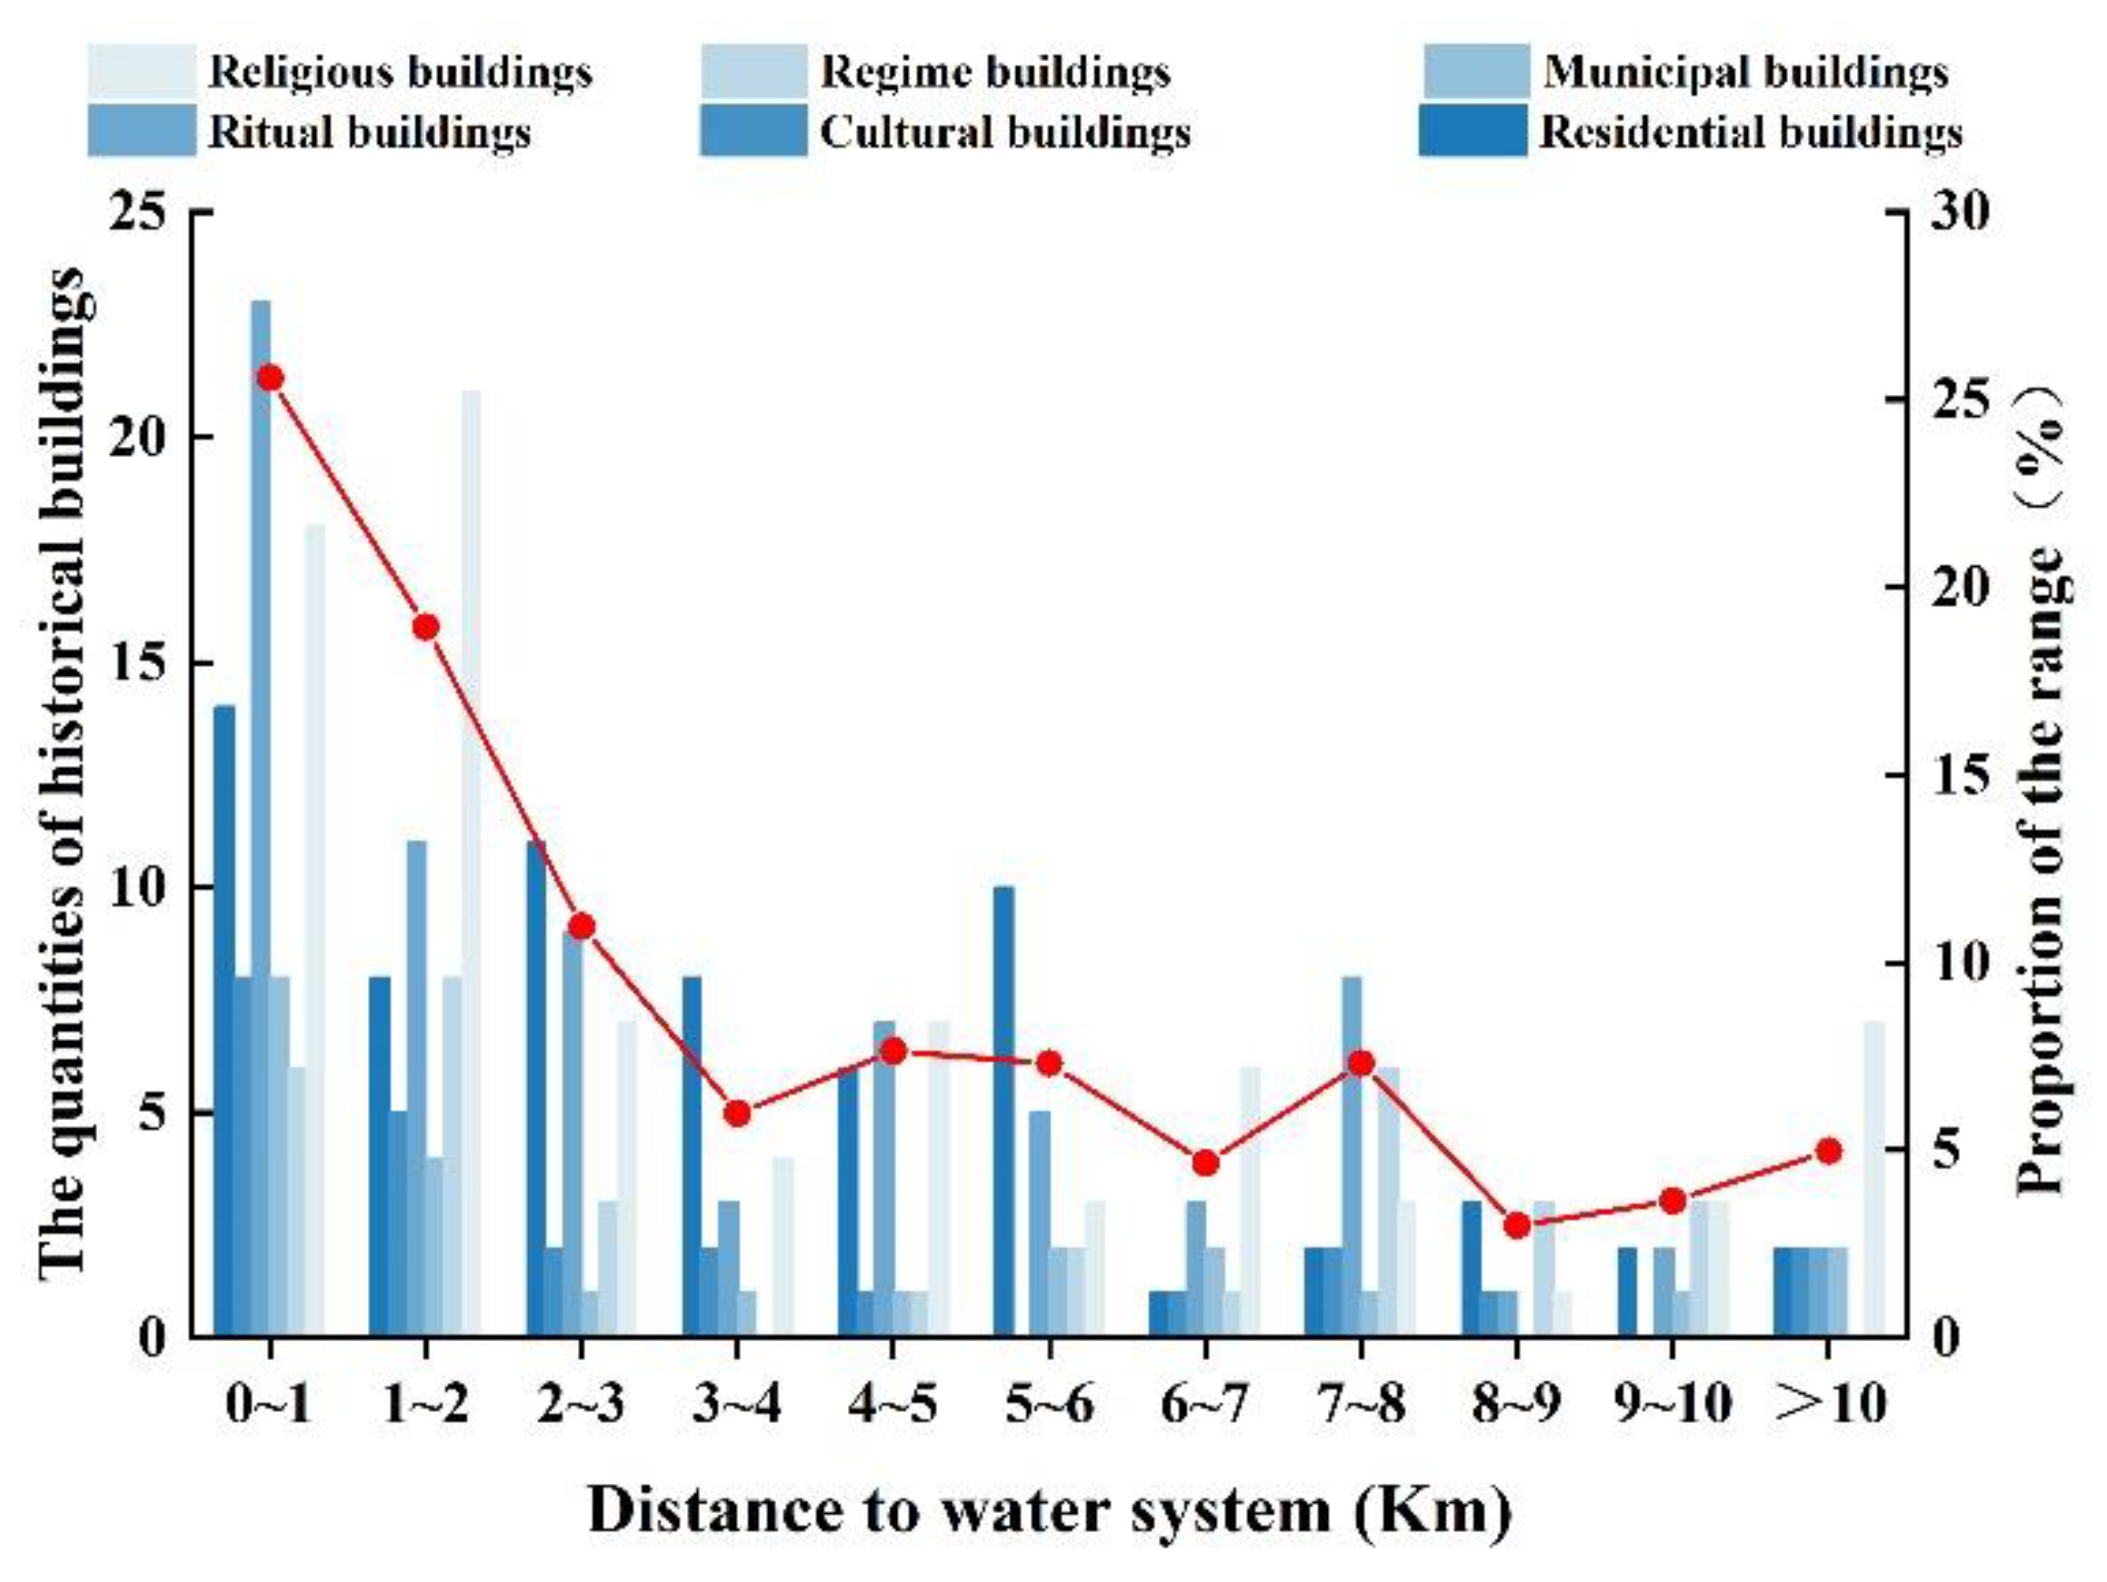
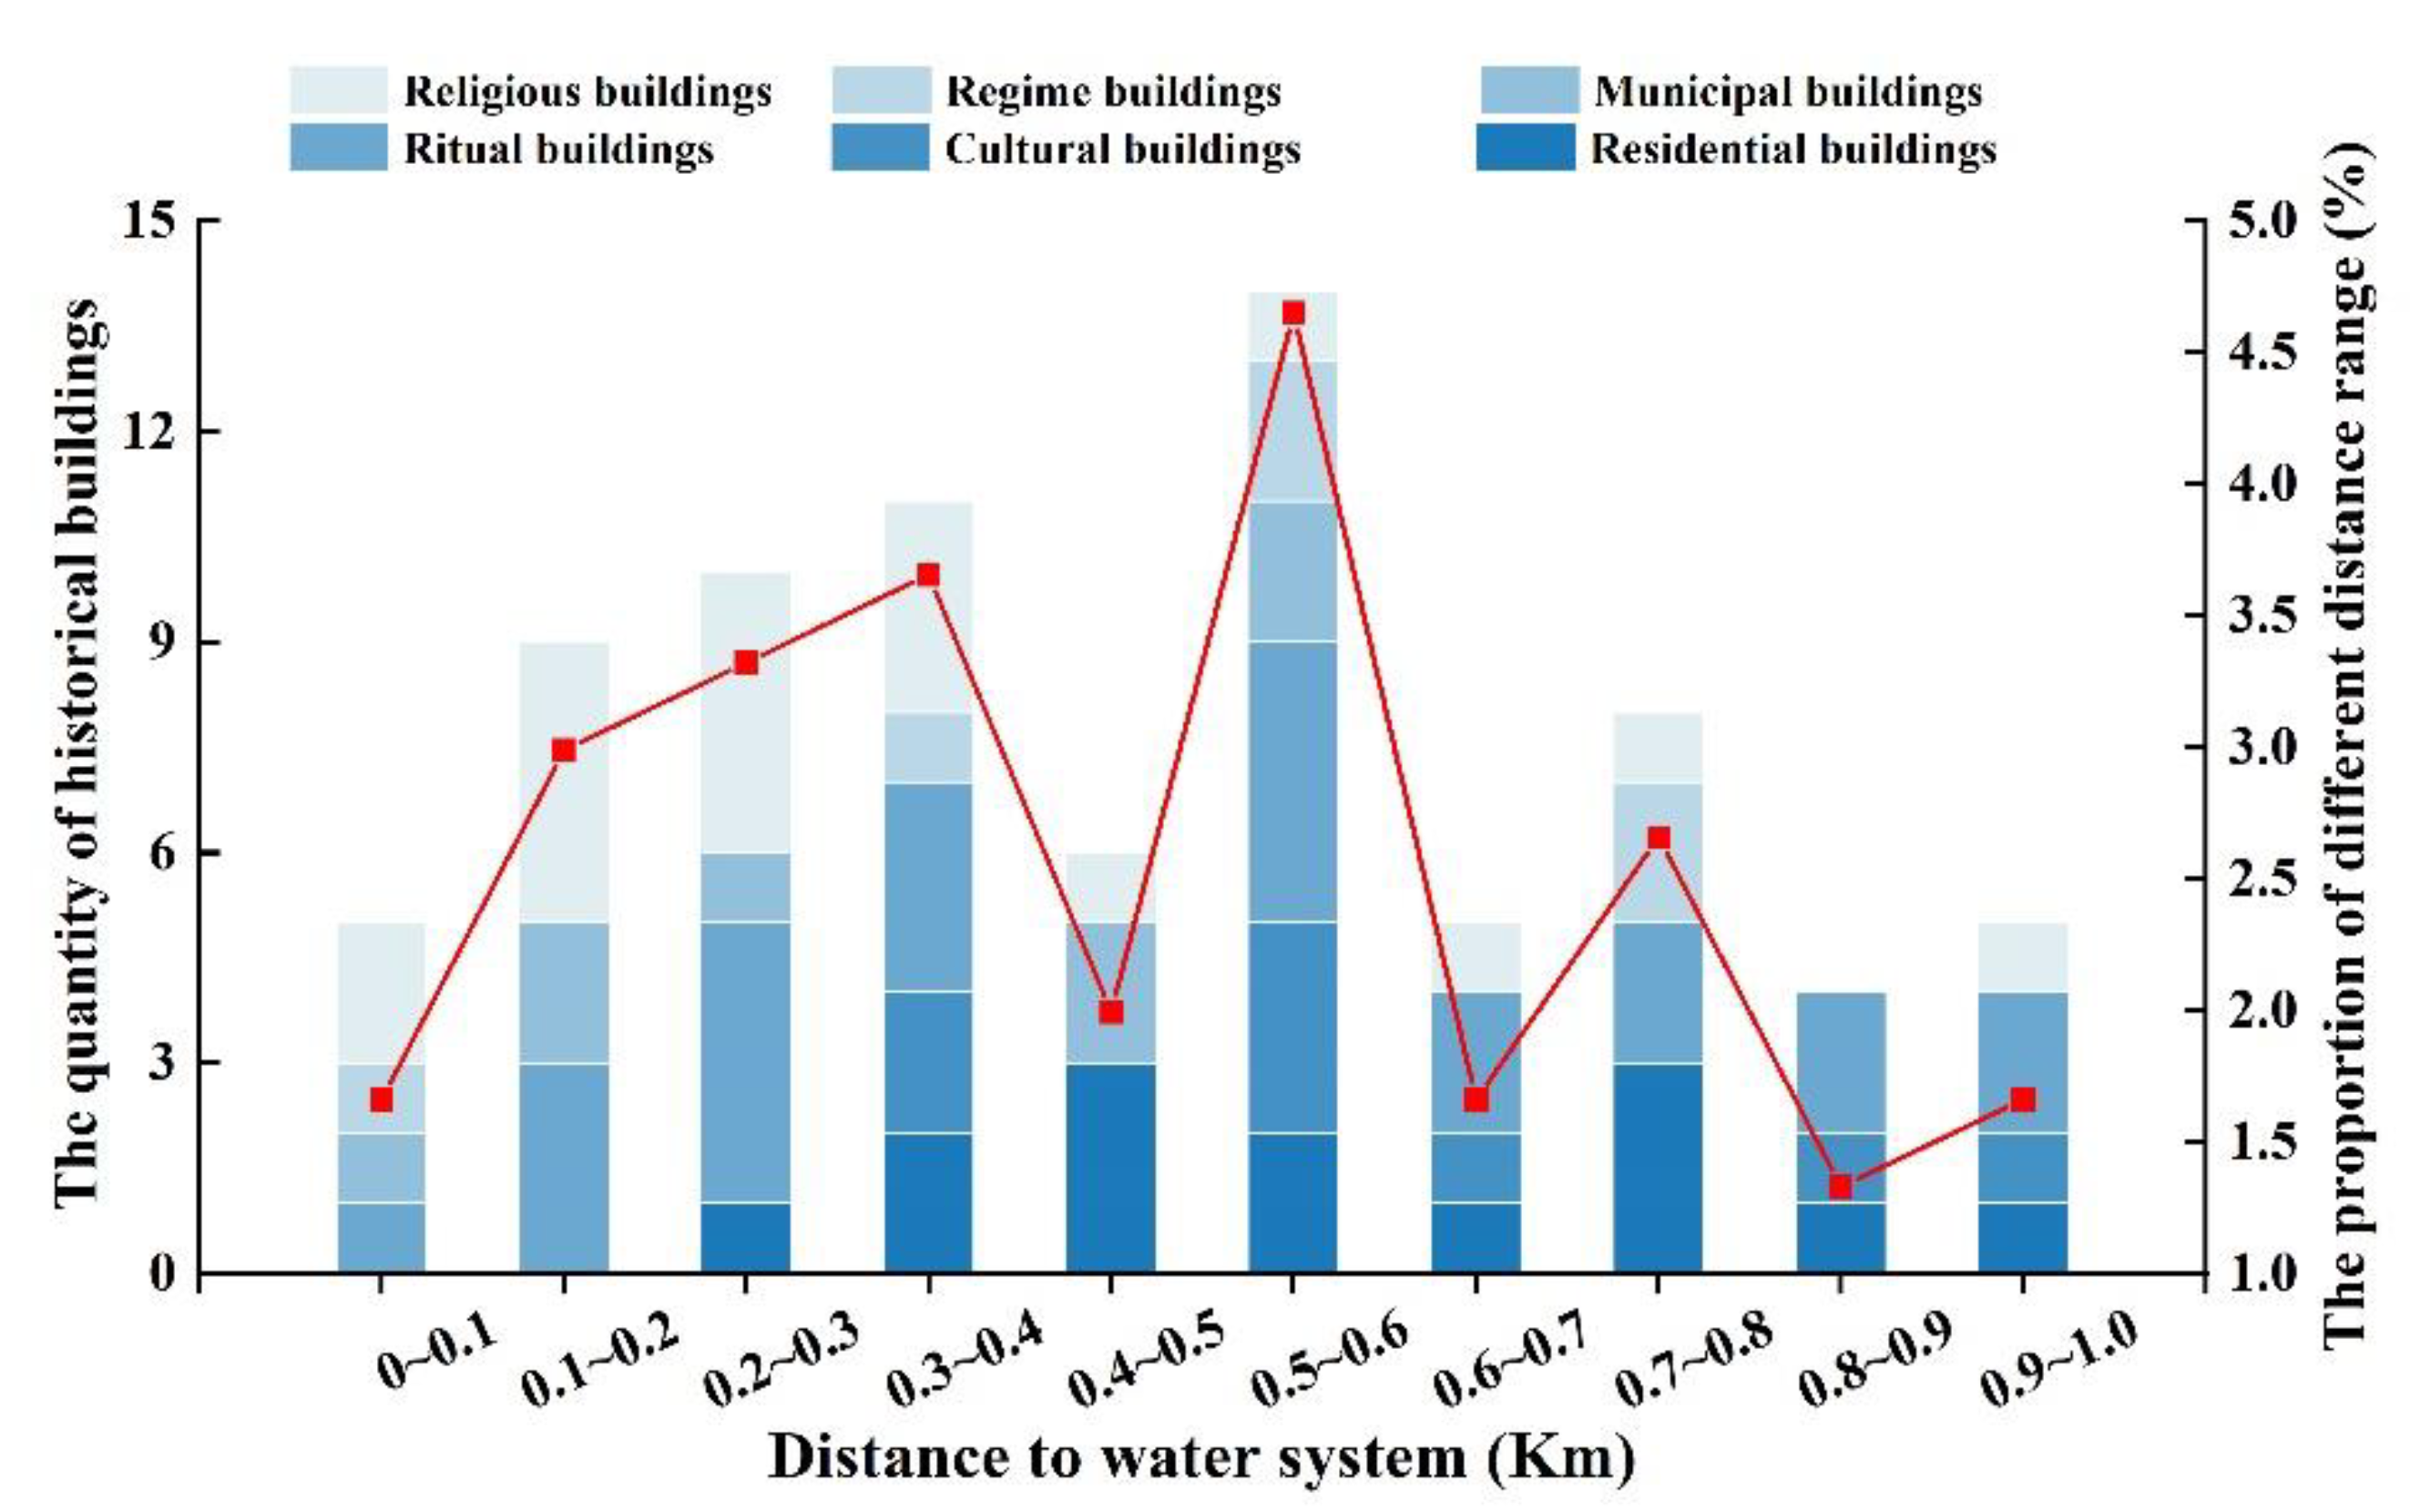
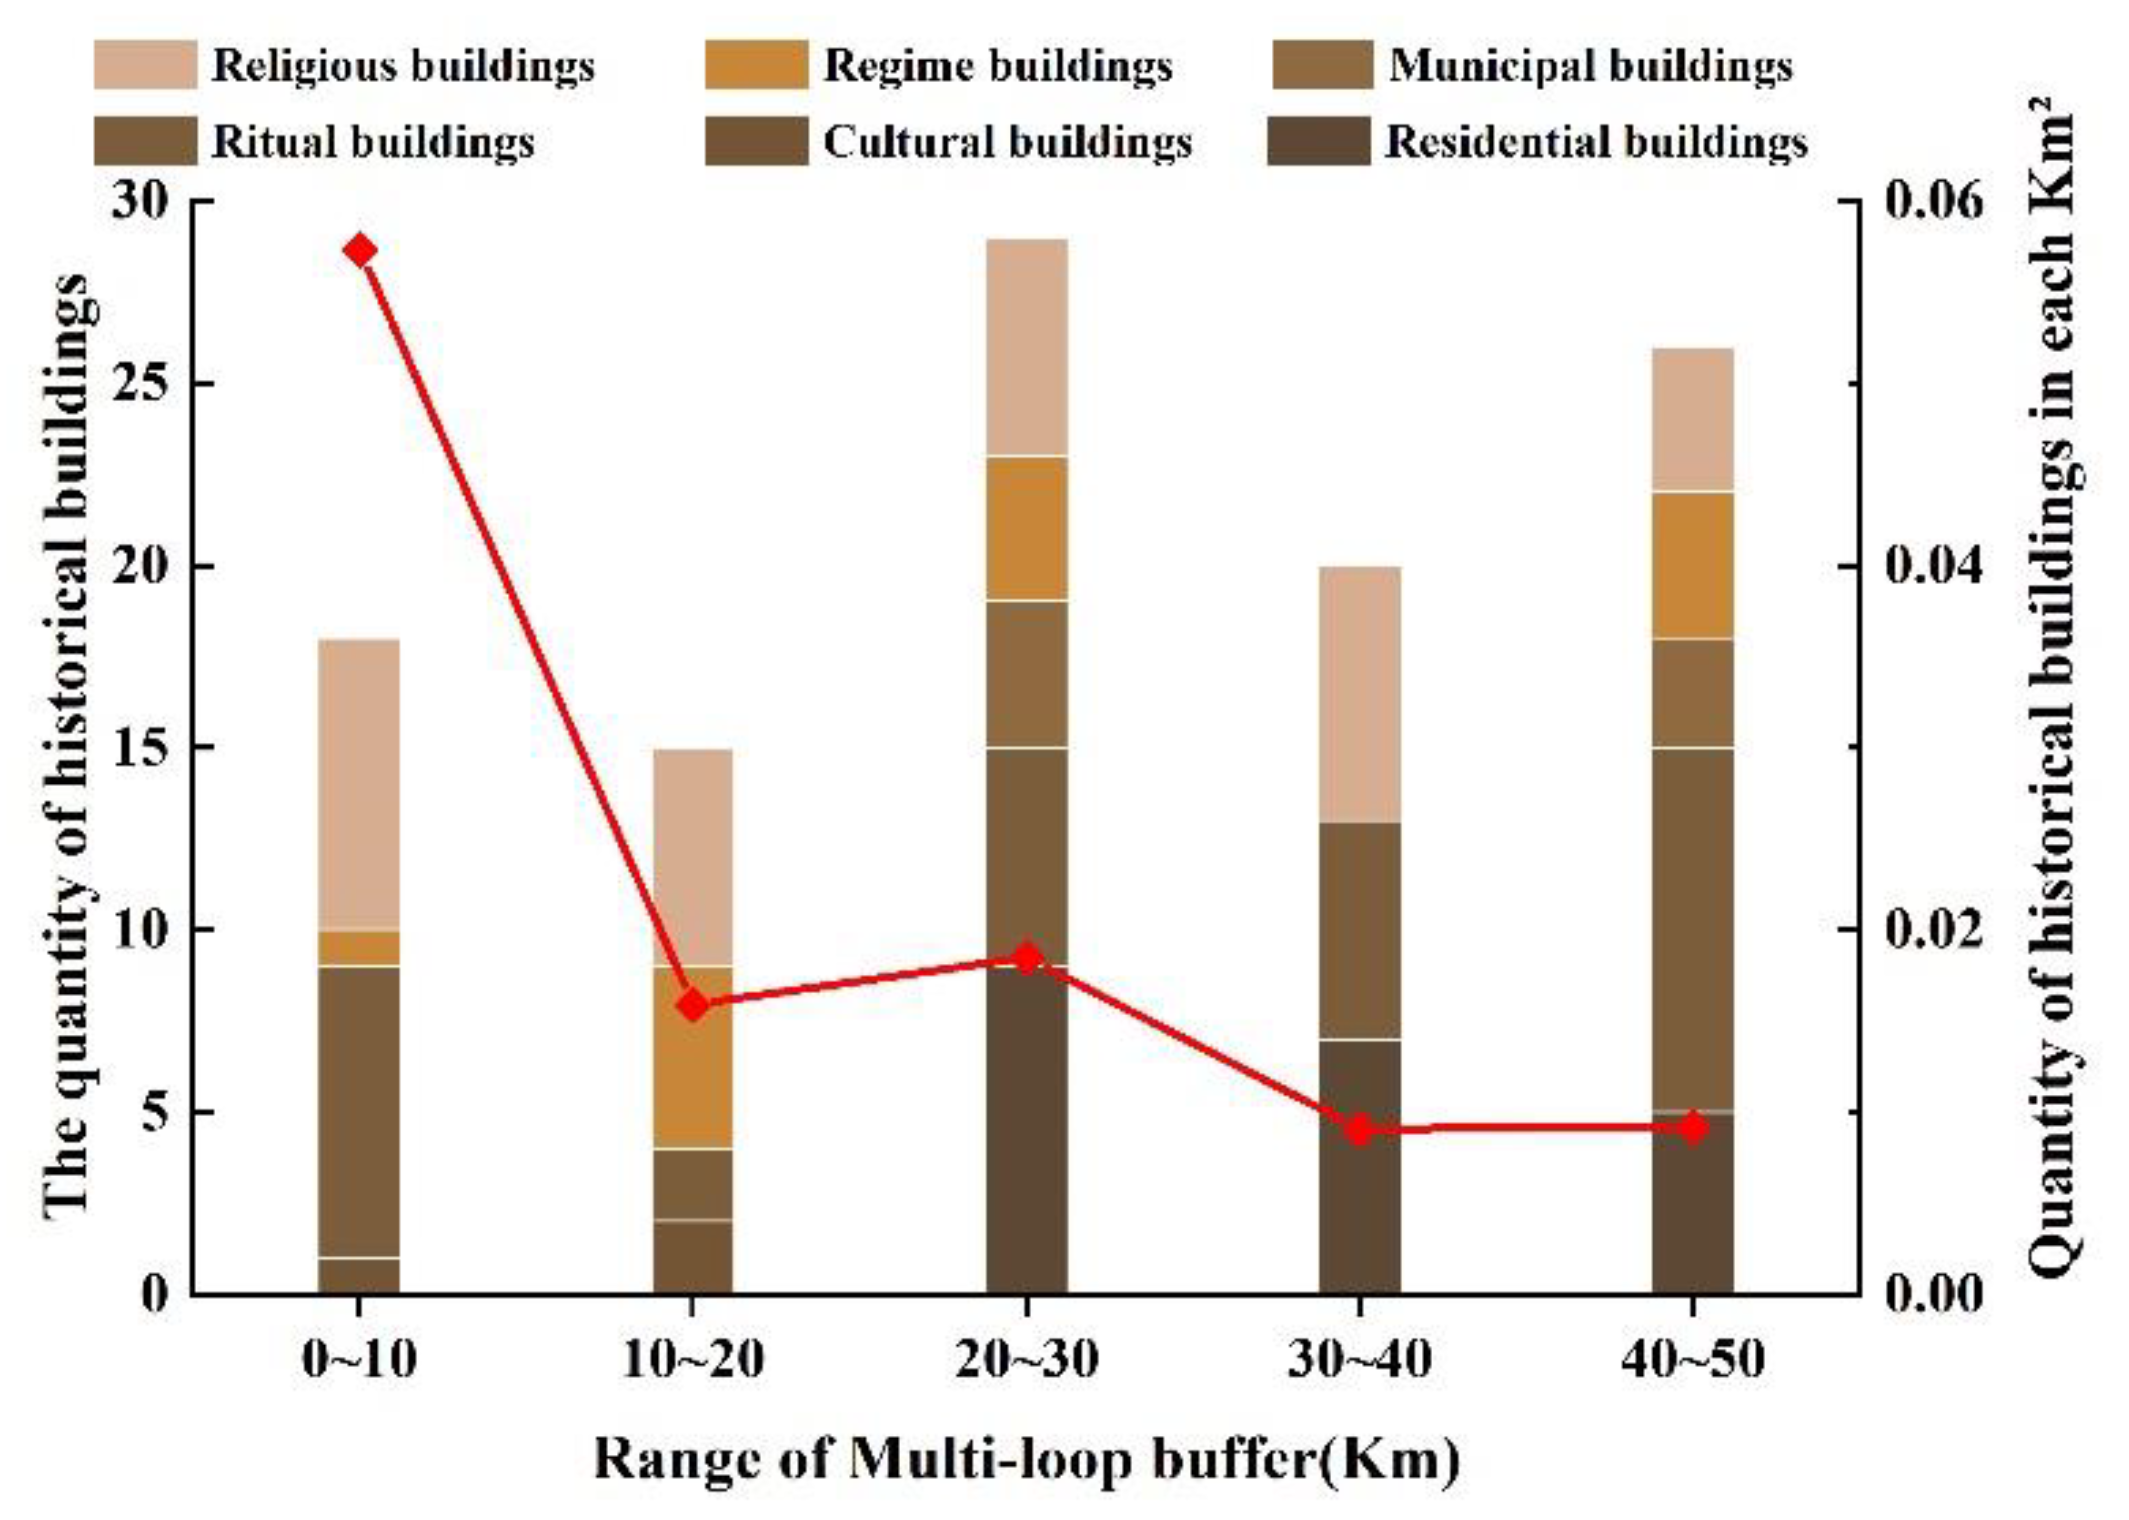
4.1. Natural Landscape Environment

(1) Topography and Landform
According to the DEM data of the Songshan region, the lowest elevation is 12 m and the highest elevation is 2171 m. ArcGIS10.6 was used to extract the elevation data of each historical building. Among 293 historical buildings in the Songshan region, the historical building with the lowest elevation is Zhao Dwelling House in Yanling County, with an elevation of only 57 m. Baoduzhai is located in Luanchuan County, and has an altitude of 1679 m. In order to analyze the relationship between the altitude and the distribution of historical buildings, the altitude of the study area was classified according to an integration of the elevation classification standards of Henan Province and the actual situation of the research area [44] (Figure 10). In general, most of the historical buildings in the Songshan region are located at altitudes below 500 m. The quantity of historical buildings at altitudes below 500 m reaches 269, which accounts for 89.37% of the total number of historical buildings in the Songshan region, while only one building’s elevation is above 1500 m. The results indicate that the historical buildings in the Songshan region are mainly distributed at low altitudes, and the higher the altitude is, the lower the number of historical buildings (Figure 11). There is a negative correlation between the number of historical buildings and altitude.
The spatial distribution data of landform types in China was overlaid with the distribution points of historical buildings in the Songshan region by ArcGIS10.6 in order to analyze the relationship between different landform types and the distribution of historical buildings (Figure 12). The distribution of historical buildings is mainly dominated by plain landforms such as low-altitude alluvial–diluvial plains, low altitude and low floodplains, low-altitude loess platforms, and low-altitude diluvial floodplains. Among the above historical buildings, low altitude and low floodplains occupy the largest proportion in the distribution of historical buildings.
The number of ritual buildings and religious buildings is the most significant in low altitude and low floodplains; this landform is flat, convenient for transportation, and has a wide range of space for human activities. As low-altitude loess platforms have a relatively high altitude without a great height difference, it is suitable for developing some large-scale family living components. Simultaneously, on flat terrain and loess platforms, it is easy to carry out agriculture, and such landforms are not prone to being eroded by flash torrents and flooding. As a result, residential buildings distributed on low-altitude loess platforms account for the greatest proportion. Such location theory embodies the ancient ancestors’ wisdom of maximizing what is good and minimizing what is bad. Regime constructions are mainly original revolutionary base areas of the Communist troops during the period of the Republic of China. They are distributed in high relief but intermediate-altitude mountain environments with a high elevation and undulating hills, inconvenient for life and transportation; thus, such environments provide concealment and security guarantee for tasks behind enemy lines, and are important reasons for the location of the revolutionary base here [45].
In conclusion, the elevation and landform of the Songshan region are important factors influencing the distribution of historical buildings. The eastern part of the Songshan region is of low altitude and flat topography. The suitable topographic conditions of the plain areas can serve a large number of human activities, and more historical buildings are left there than in the other areas of the Songshan region. The western area is mainly constituted by mountains and the elevation is higher and the fluctuation is larger. Construction in the high-altitude area is more difficult due to the technical limitations in ancient times. In the meantime, the harsh environment in the higher elevation areas is not conducive to the long-term preservation of historical buildings, so few relics are left. Although Luoyang City lies in the west, possessing Taihang Mountain in the northwest and Qinling Mountain in the west and south, it belongs to the basin landform surrounded by mountains from three sides. Favorable geographical environments provide ideal conditions for the construction of historical buildings; therefore, more historical buildings have been preserved there.
(2) Rivers and Water Systems
ArcGIS10.6 was used to vectorize the river system in the Songshan region and extract the center lines of the main rivers and their tributaries, then overlay the center lines with the historical building data in the Songshan region at an interval of 1000 m, and consequently analyze the horizontal distance relationship between the historical buildings in the Songshan region and the river system.
According to Figure 13, historical buildings are generally distributed within 1000 m from the water system, with the proportion of 25.58%. As a general trend, farther away from the water system, fewer historical buildings are distributed. Therefore, on the gradient of 1000 m, the number of historical buildings is negatively correlated with the distance from the water system.
The number of regime buildings and religious buildings is the largest within 2000 m from the water system. The other four types of historical buildings have the greatest distribution within 1000 m from the water system. Although the number of different types of historical buildings in different regions varies, the proportion is consistent.
Within 1000 m from the water system, the relationship between the number of historical buildings and the distance from the water system was analyzed at 100 m intervals. Figure 14 shows the characteristics of the distribution of historical buildings near water. The number of historical buildings increased from 0 to 600 m, reached the maximum value from 501 to 600 m, and decreased from 600 to 1000 m. This indicates that historical buildings in the Songshan region are primarily located in areas 500~600 m away from the water system. To gain access to water for life and production, ancient people would choose the location close to the water system to carry out construction activities. Therefore, the majority of historical buildings are distributed in the area not far from the water; in other words, there are many historical buildings within 1000 m from the water. The water system, as an unmeasurable disturbance factor on the Earth’s surface, will affect the stability of the ground building environment. The site selection of historical buildings should not only consider sufficient water sources close to the river but also avoid the adverse effects of the water system instead of being too close to the water system.
The historical buildings built because of water in the Songshan region display that they have a great dependence on the water system. Residential buildings demand lots of water. To obtain water for life, they choose to locate the base site near the water, and make use of the water system to irrigate farmland, promote agricultural production, and maintain population development. The distance between residential buildings and the water system is related to the living and production mode of the ancient working people. The distribution of cave temples reflects the dependence of the cultural landscape on the water system. The site selection of cave temples is based on the comprehensive consideration of geomancy and the texture of the cliff walls, and cave temples are often dug along the important nodes of the river system and are basically distributed in river valleys or mountain cliffs [46,47]. Six cave temples, such as Longmen Grottoes, Gongxian Grottoes, and so on, are distributed in the Yiluo River watershed. The cliff walls where the water system flows through provide favorable natural conditions for the excavation of the cave temples. These grottoes are connected with each other, forming a cultural chain connected by the river system. In ancient China, the working people considered water as an object of worship, creating ritual architectures related to water. For example, the Heluo Temple, located at the confluence of the Yiluo River and the Yellow River, which was once an important transportation hub on the water with sailing boats gathering, was a relic of the cultural landscape where boatmen worshipped the river god to pray for peace. The dependence of municipal buildings on the river system is embodied in the urban bridges distributed in the Songshan region. There are also historical buildings located near water sources and named for water in the Songshan region, such as Yuxi Temple, Longtan Temple, Longquan Temple, etc.

4.2. Historic Layering of the Ancient City

There is a high-density distribution patch of historical buildings in the southwest of the district of Luoyang City. In order to analyze the influencing factors of the high-density distribution of historical buildings in this small area, it is necessary to deal with the vector data of the Luoyang Municipality and obtain the grids consisting of rectangular image elements, so as to implement a microscopic analysis of this area at the scale of blocks.
The ArcGIS 10.6 ‘Create Fishnet’ tool was used to create a fishing net covering the district of Luoyang City according to the 3000 m × 3000 m grid, and then its position was adjusted to make a complete grid covering the street area unit to the maximum extent. The fishing net was connected with the spatial data of historical buildings within the district of Luoyang, and the number of historical buildings in each pixel was counted, followed by overlaying the above results with road system data. Different colors in the nets can distinguish the distribution density of historical buildings in different grids. According to Figure 15, the street area that corresponded to the red grids covering the largest number was Luoyang City during the Ming and Qing dynasties. Compared with the grids on the edge, a greater quantity of historical buildings is distributed in the grids adjacent to the red grids. Together with the grids of Luoyang City during the Ming and Qing dynasties, they form extremely high-density distribution concentrated areas of the historical buildings in the Luoyang City core area during the Ming and Qing dynasties. Concentrated in the Luoyang core area and dispersed in the surroundings, these phenomena prove to be the distribution characteristics of historical buildings in Luoyang City. Therefore, the distribution of historical buildings in this area has a direct relationship with the Ming and Qing era Luoyang City.
In the core area of Luoyang City, the distribution of historical buildings is relatively concentrated, and the majority of historical buildings belong to the Ming and Qing dynasties. Buildings of Luoyang City from the Ming and Qing dynasties remain for sacrificial worship ritual and religious pilgrimage, with a quantity of up to 11. They contain higher grade historical buildings such as the altar temple, the ancestral temple, the Buddhist temple, Taoist temples, mosques, the Duke Dan of Zhou temple, and the Henan Province Confucian temple. These temples reflect people’s strong faith and the city specifications of the ancient Luoyang City during the Ming and Qing dynasties. Thus, the religious position of Luoyang City during the Ming and Qing dynasties has been established in the Songshan region. During the Ming and Qing dynasties, Luoyang City was the only channel for the trade route from the Shanxi and Shaanxi areas to the east of Henan Province, and had the shipping advantage of Luo River. As an important hub and commercial center, merchants from Shanxi and Shaanxi gathered here for business. The preserved Shanxi-Shaanxi Guild Hall and Luze Guild Hall embody the commercial prosperity of Luoyang City during the Ming and Qing dynasties [48,49]. At the end of the Republic of China, Luoyang City was the anti-Japanese base in western Henan, the former office of the Eighth Route Army in Luoyang, and the former headquarters of the anti-Japanese independent detachment of the Eighth Route Army in Yanshi. All these regime constructions reflect the journey of the Communist Party of China.
The ancient city was the gathering area where people lived, but also the concentrated area of construction activities. Luoyang City during the Ming and Qing dynasties was not the capital city of China, and its historical position and urban scale were much lower than those during the Han and Wei, and Sui and Tang dynasties. However, as the capital of the Henan government with transportation and commercial advantages, Luoyang City had a high degree of urban development, and its urban construction specifications were higher than those of other cities in the Songshan region during the same periods [50]. Luoyang was the ancient capital of 13 dynasties. Relying on the physical geographical pattern of Luoyang, the capital Luoyang was built in accordance with the natural mountains and river system. With the change in dynasties, the city site changed many times. The location of Luoyang continued in four dynasties, namely Jin, Yuan, Ming, and Qing dynasties. The distribution characteristics of historical buildings in the Luoyang City area during the Ming and Qing dynasties are the result of the stratification of a relatively stable geographical environment and cultural environment in each time period.

4.3. The Concept of “The Center of Heaven and Earth”

There is another high-density distribution patch of historical buildings in the north of Dengfeng City, which intersects the core area of the Songshan region. In order to explore the relationship between historical buildings in the extremely high-density area of the Songshan region and Mount Song, we further analyzed the Songshan region with the help of ArcGIS10.6.
The Songshan core region contains the range of 50 km from Mount Song in Songshan’s highest peak—Junji peak—as the center, to create a multi-ring buffer area for a 50 km radius with an interval of 10 km, analyze the relationship between the distribution density of historical buildings in the Songshan core area and the distance from Mount Song (Figure 16), and further explain the relationship between Mount Song and historical buildings in the core area of the Songshan region. On the whole, the distribution density of historical buildings is centered around Mount Song. The highest density is in the innermost layer, and then it gradually decreases from inside to outside, reflecting the centripetal aggregation of historical buildings in the core of the Songshan region. It should be noted that when discussing the relationship between Mount Song and the distribution of historical buildings, the number of changes in each circle of the multi-ring buffer zone cannot be used to assist in explaining the situation. The reason is that when buffering the Songshan region, the buffer area of each circle gradually increases with the increase in buffer distance, and the number of historical buildings covered also increases.
Ritual architecture and religious architecture are important components of historical architecture in the core area of the Songshan region. There are 108 historical buildings in the core area of the Songshan region, among which 32 are ritual buildings and 31 are religious buildings, accounting for 58.33% of the historical buildings in the core area of the Songshan region. Concurrently, these two types of historical buildings accounted for 43.24% and 38.75% of the total historical buildings, respectively, with high proportions in quantity and spatial distribution characteristics of aggregation.
As the ancient emperors regarded the mountain as a mysterious object of worship, and Mount Song is located in the center of ancient China, Mount Song has been a sacred mountain to communicate with the gods since the Spring and Autumn Periods. Ritual activities were held here continuously, so buildings to meet the needs of worship activities were built here [51]. At the foot of Mount Song, the three stony Ques of the Han dynasty are Taishi Que, Shaoshi Que, and Qimu Que. They symbolize the gates on the way to Taishi Temple, Shaoshi Temple, and Qimu Temple, respectively. In addition to adapting to the terrain, these three groups of buildings also regard the mountain as an aesthetic object. They all form a sequence of Que, temple, and mountain peaks in space, developing an echo relationship between the buildings and the mountain. These historical buildings are cultural relics of the ritual activities and mountain worship in ancient China [52,53]. Influenced by the concept of “the Center of Heaven and Earth”, ancient Chinese capitals have been located 400 km from Mount Song for a long time, which is in line with the ruling idea that the capital is built in the center and controls the national territory. Religious activities are closely related to the Chinese feudal monarchy. Mount Song, as a famous mountain near the capital, is the site of religious activities even today. The existing Buddhist buildings include Shaolin Temple, Chuzu Nunnery, Pagoda Forest at Shaolin Temple, and more than ten Buddhist temples and stupas, which indicate the origin and the development of Buddhism in Mount Song. Songyang Academy, a Confucian academy with high regulation, was also located in Mount Song due to its proximity to the capital of ancient China. Taoism treats Taishi Temple as the practice place to hold religious activities in Mount Song near the capital, and has evolved Taoist buildings such as Zhongyue Temple as well as continued its sacrificial culture simultaneously. It is because of the cultural identity of various religions and schools in ancient China in “the Center of Heaven and Earth” that the historical and cultural status of Mount Song as a “Sacred Mountain” has been established, and the construction of ritual buildings, Buddhist temples, and Taoist temples around Mount Song and Confucian academies are promoted [54]. Likewise, due to the ancient people’s view of the universe and “the Center of Heaven and Earth”, as early as the Zhou dynasty, astronomical observations started in a place named Yangcheng near Mount Song. The stargazing platform established during the Yuan dynasty is a rare scientific and technological building in ancient China, reflecting the ancient people’s interest in exploring the universe.
Mount Song as “the Center of Heaven and Earth” contains the middle of geography, the middle of humanity, and the middle of politics of ancient China, which constitute the basis of Chinese cultural identity. Influenced by the cultural concept of “the Center of Heaven and Earth” of Mount Song, different types of historical buildings have formed a high-density distribution phenomenon around the core of Mount Song, which promotes Mount Song as a multi-cultural gathering place.

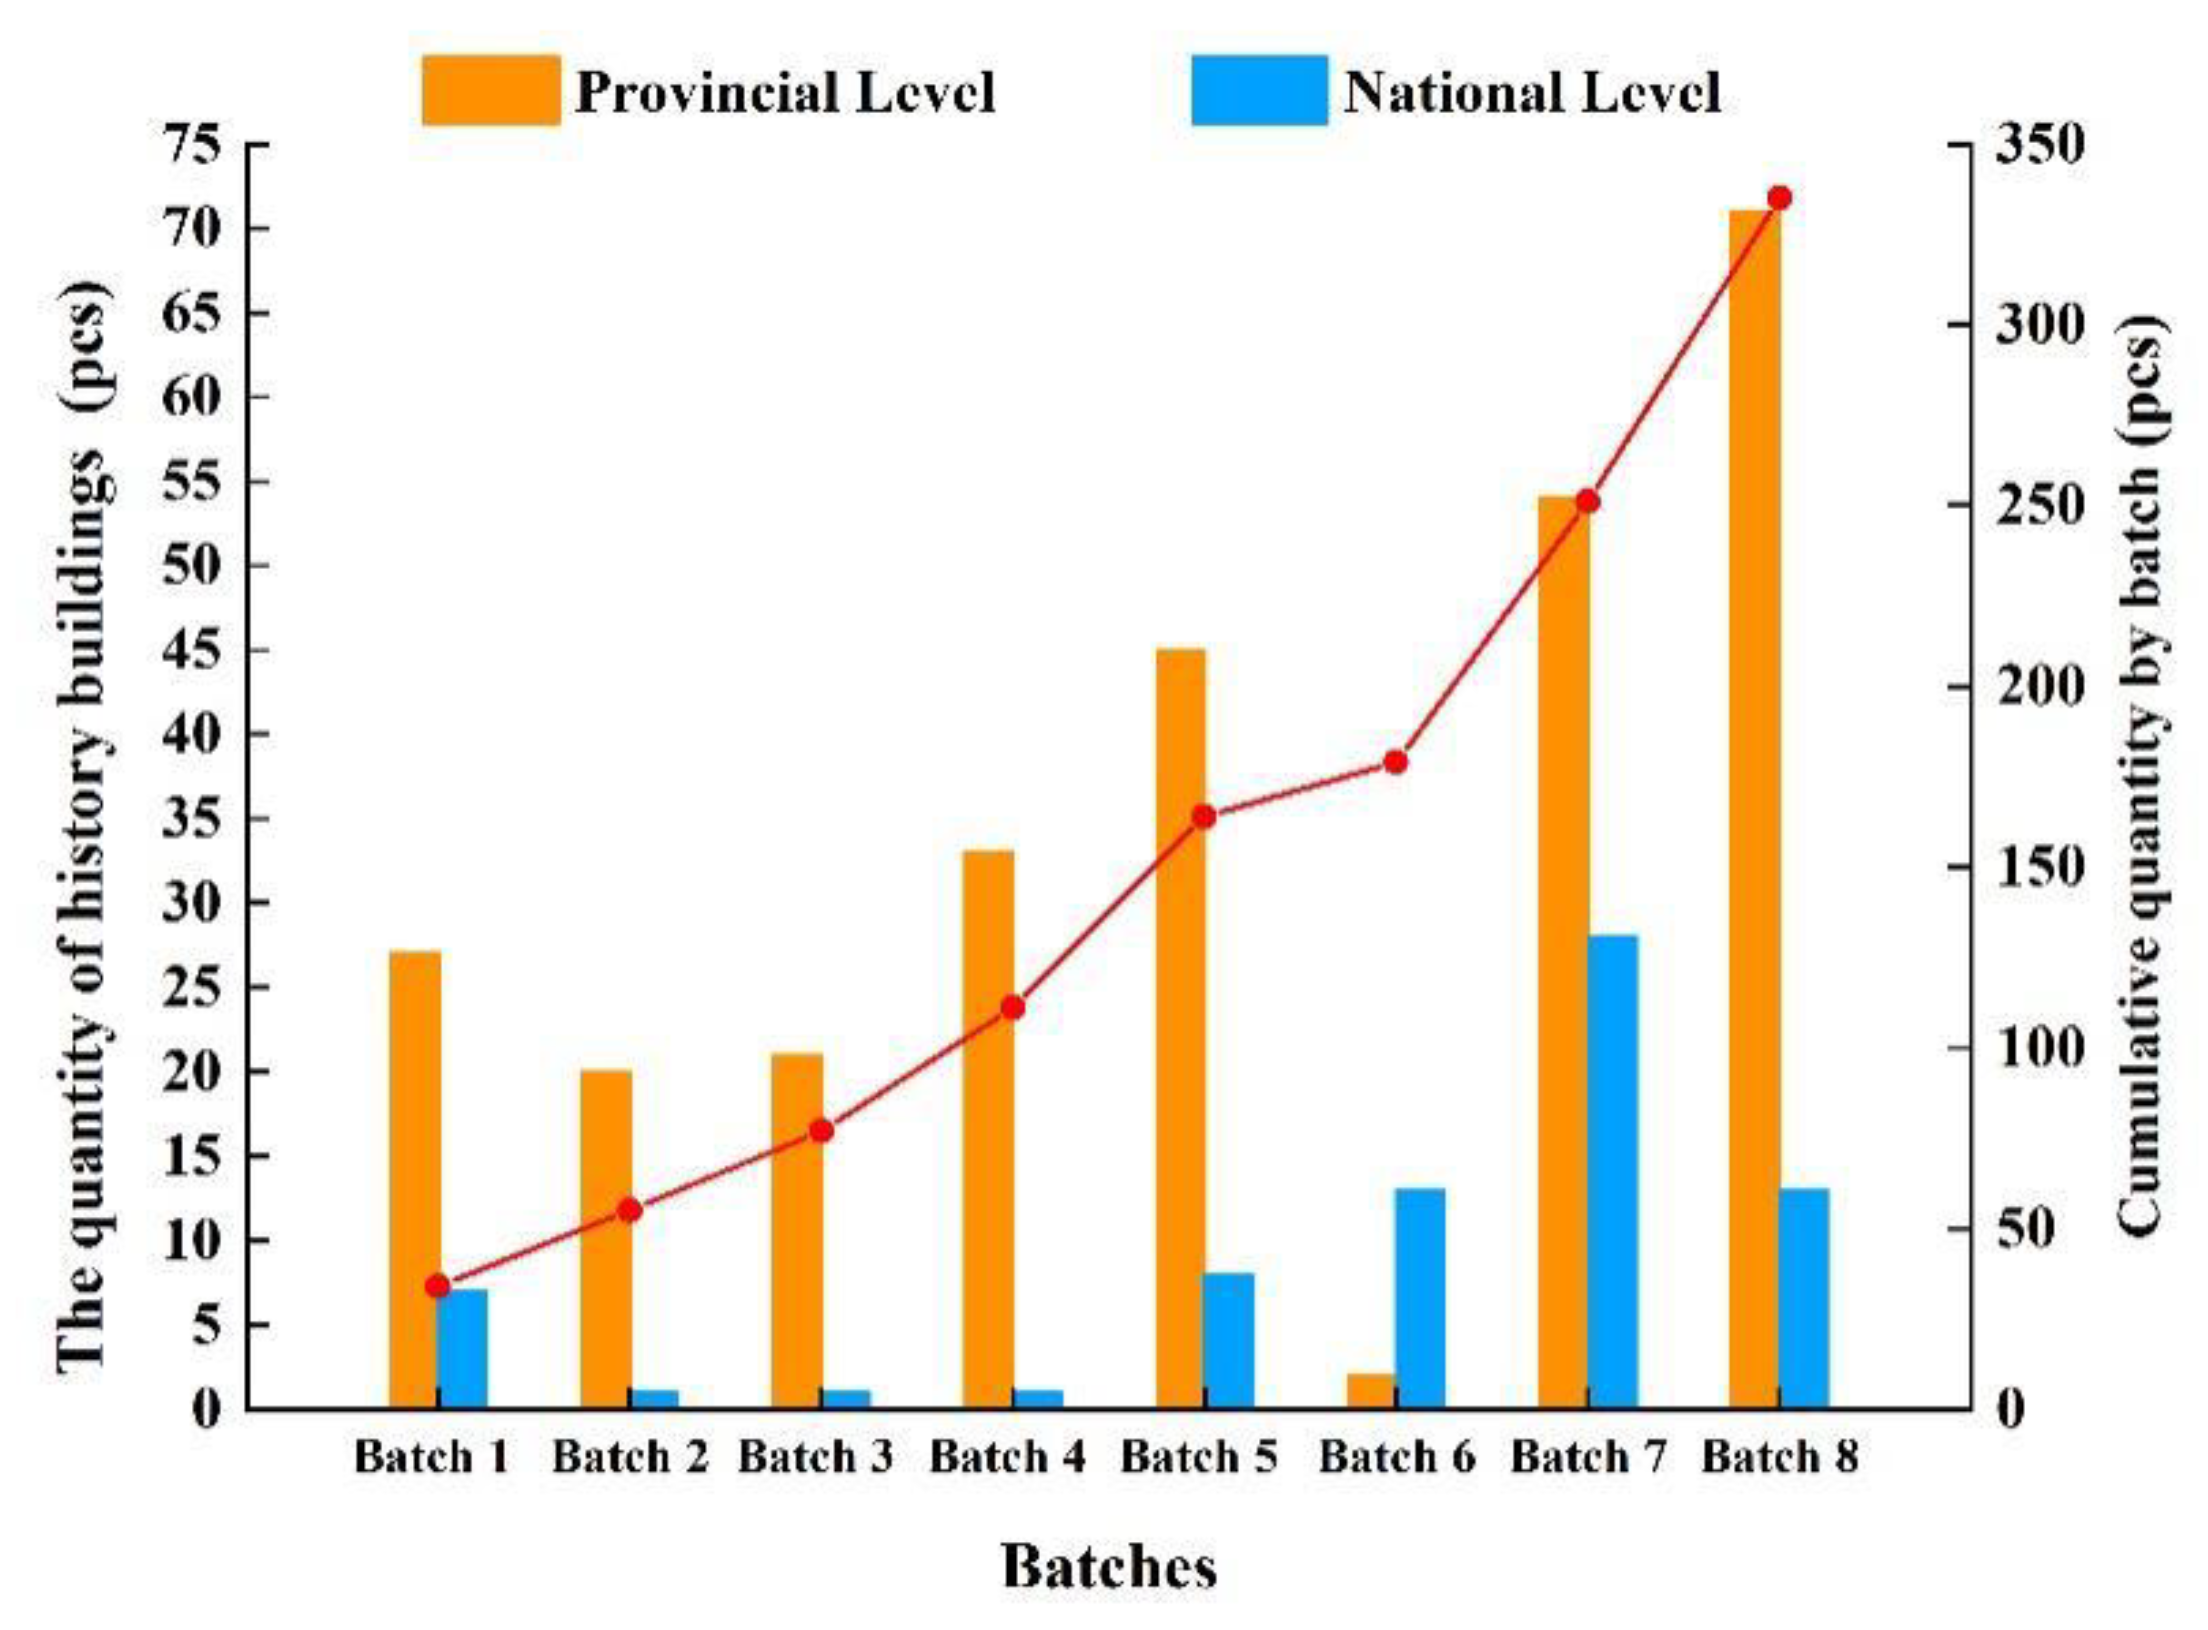
4.4. Changes in the Number of Heritage Sites

Since 1961, the administrative department of cultural relics under the State Council has regularly issued guidelines to clarify the scope and emphasis of heritage accreditation work, and the administrative departments of cultural relics at all levels have carried out eight extensive surveys of heritage. By January 2022, 72 national-level historical buildings and 273 Henan provincial-level historical buildings had been announced in the Songshan region cumulatively. Consequently, the spatial distribution characteristics of historical buildings have changed continuously.
According to the changes in the quantity of historical buildings in each batch in the Songshan region (Figure 17), the cumulative data increase and suggest that the growth of historical buildings was divided into three stages: from the first batch to the fifth batch, the number of historical buildings showed a steady growth; from the fifth batch to the sixth batch, the number of historical buildings presented a slow growth; and from the sixth batch to the eighth batch, the number of historical buildings was on a rapid increase. Figure 18 visualizes this dynamic change.
Comparing different levels of historical buildings, the quantity of Henan provincial-level historical buildings announced in most batches is much higher than that of national-level historical buildings, which is because the assessment standard of national historical buildings is higher than that of provincial ones. According to “the Regulations on the application and selection of National Key Cultural Relics Protection Units”, first of all, they should have significant historical and cultural value to become national-level historical buildings; secondly, these buildings should have symbolic and representative significance in the historical process of human and Chinese culture; thirdly, they should be related to major historical events and important historical figures. Furthermore, buildings that have been recognized as provincial-level, municipal-level, or county-level historical buildings should have priorities as candidates. As for provincial-level historical buildings, the assessment standard is relatively lower to some extent. Therefore, the number of provincial-level historical buildings registered in the same period is generally higher than that of national-level historical buildings.
With the refinement of the assessment standards of historical buildings in different years and the prominent protection effect of historical buildings, some grades of Henan provincial historical buildings were reconfirmed and upgraded to national historical buildings. With the application of local cultural relic protection institutions and a deeper survey of historical buildings, the historical value of some ancient buildings has been discovered and presented in the form of cultural relic protection units, which enriches the number and types of historical buildings in the Songshan region and also changes the spatial and temporal distribution characteristics of historical buildings.

5. Conclusions

Existing studies suggest that urban expansion will affect the distribution characteristics of cultural heritage [55]. In the past several decades, China has experienced the phenomenon of high-intensity, high-density, and high-speed urbanization, which has influenced the distribution of heritage to different degrees. Compared with the area far away from the city, the land near the city area has a greater rate of change. This means that more buildings of potential historical value have been destroyed in areas closer to urban places, whereas more historical buildings are more likely to remain in areas farther away from cities. Because of the lack of accurate dynamic change data on the buildings with potential historical value destroyed in the process of urbanization, this study only takes the historical buildings preserved in the Songshan region as the research object, and the influencing factor of urbanization is not reflected in this study.
Based on the ArcGIS platform, we analyzed the spatial and temporal distribution characteristics of the eight batches of historical buildings in the Songshan region published by January 2022, and found that the historical buildings in the Songshan region showed uneven distribution characteristics in space. Although there are a large number of historical buildings distributed in Luoyang and Dengfeng, which form a clustering distribution phenomenon, all types of historical buildings also are clustered in space. Throughout history, the historical buildings followed trends of diffusion and development, but their spatial centers were always kept near Mount Song. In view of influencing factors, the spatial and temporal distribution of historical buildings in the Songshan region was influenced by geographical patterns and historical and cultural lineage to different degrees. The distribution characteristics of historical buildings in the Songshan region are under the influence of the historical and cultural system of the region, and the surface spatial form is formed and evolved to adapt to the natural environment of the Songshan region. In other words, the spatial and temporal distribution characteristics of historical buildings in the Songshan region are the result of the long-term effect of the natural environment and social environment ecology of the region. At the same time, it is of great significance to establish a multi-dimensional cognition of the internal structural change in historical buildings’ space, which provides technical support for the establishment of the spatial model of historical and cultural heritage, and to realize the inheritance and sustainable development of Chinese civilization in the Songshan region.
Mount Song is located at “the Center of Heaven and Earth”. Songshan region is the holy land where emperors of all dynasties established their capitals and states, which are the typical representative of capital construction in ancient China. Combined with the typical ancient landscape characteristics and development background, on the basis of the concept of natural landscape, the “harmony of human and nature” philosophy, the research route follows the sequence of “cognitive interpretation–spatial analytic–value research–inheritance strategy” from the angle of historical buildings’ spatial and temporal distribution. On this basis, it is essential to explore the cognitive process of natural landscapes and historical architecture space and unearth the regulation of landscape and culture connotation. In this way, it helps to expand the spatial order of historical and cultural heritage. This study is committed to establishing a sign model of historical and cultural heritage spatial distribution by using the historical building space index model, then regarding the spatial adaptive diagnosed model and continuous diagnosed model as the basic diagnosed model of historical and cultural heritage space, finally establishing a model implementation of historical and cultural heritage space, taking the “point axis system, stratification analysis” theory as guidance. Such measures provide a scientific basis to devote further attention to the correlation and systemization between the natural and human space of historical buildings in the Songshan region, realize multi-level and integrated protection, take maximum advantage of the leading role of culture, and explore the management and control system of the integration of cultural heritage and various territorial spaces.

Author Contributions

Conceptualization, X.Y.; methodology, Z.X.; software, Y.H.; validation, S.Z.; formal analysis, Y.H.; investigation, X.Y.; resources, G.T. and S.Z.; data curation, Z.X. and K.W.; writing—original draft preparation, Z.X.; writing—review and editing, Z.X. and G.T.; visualization, Y.M.; supervision, G.T. and X.Y.; project administration, X.Y.; funding acquisition, G.T. and X.Y. All authors have read and agreed to the published version of the manuscript.

Funding

This research was funded by the Landscape Architecture in Middle China Disciplinary Innovation and Talents Introduction Centre Program (grant number: CXJD2021004), the Cultural Ecosystem Services in the Campuses of Henan Agricultural University (30501193), Postdoctoral Research Initiation Project in Henan Province (10400107 and 30501193) and General Research Project of Humanities and Social Sciences in Universities of Henan Province in 2023 (2023-ZZJH-083).

Data Availability Statement

Not applicable.

Conflicts of Interest

The authors declare no conflict of interest.

References

  1. Ru, J. A Research on Guindlines and Technics for the Historic Buildings Conservation. Ph.D. Thesis, Tianjin University, Tianjin, China, 2007. [Google Scholar]
  2. Xu, Z.; Yang, C.; Wang, J. “Organic Renewal” and “Dynamic Protection”: Research on the Concept of Protection and Restoration of Modern History Architecture. Archit. J. 2015, S1, 242–244. [Google Scholar]
  3. Chen, D.; Dai, B. On Geomantic Building Site-chosen of Antique WuYuan Architecture. Hundred Sch. Arts 2007, 202–203, 207. [Google Scholar]
  4. Chen, W.; Luo, L. The Experience and Enlightenment on Conservation and Revitalization of Contemporary Historical Buildings in Hong Kong. J. Hum. Settl. West China 2015, 30, 38–43. [Google Scholar] [CrossRef]
  5. Yang, H.; Li, N. Aesthetics embodiment in historical architectural design. Constr. Econ. 2020, 41, 139–140. [Google Scholar]
  6. Yu, H.; Liu, S. Research and engineering practice on structural reinforcement of historical buildings. Earthq. Resist. Eng. Retrofit. 2022, 44, 169, 170–174. [Google Scholar] [CrossRef]
  7. Zhu, W.; Wang, X. The Space Layout Research of The Historic Building Along the Yellow River in Shanxi and Shaanxi. Huazhong Archit. 2008, 26, 156–160. [Google Scholar]
  8. Li, Y.; Liu, S.; Tang, J. The Influence of Chinese Ideology and Culture on Chinese Traditional Architectural Spatial Form—Based on the structure of cultural mentality. J. Xi’an Univ. Archit. Technol. (Soc. Sci. Ed.) 2016, 35, 70–77. [Google Scholar] [CrossRef]
  9. Longzhu, D. A cultural exploration of the of Tibetan Temple buildings. China Tibetol. 2010, 3, 187–191. [Google Scholar]
  10. Wang, W.; Xu, Z. Ancient stage planning and site selection and building types in the ming and qing dynasties in Huizhou region. Ind. Constr. 2015, 45, 62–67. [Google Scholar]
  11. Zhou, J.; LI, T. A Literature Study on Tibetan Environmental Ideas and the Factors of Site Choice of Tibetan Buddhist Architecture. Archit. J. 2010, S1, 72–75. [Google Scholar]
  12. Hu, S.; Lin, C.; Li, X. Influence of Natural Systems on Spatial Distribution Characteristics of Architecture in Mount Song in the Qing Dynasty. Ind. Constr. 2022, 52, 42–51. [Google Scholar] [CrossRef]
  13. Lu, P.; Tian, Y.; Chen, P.; Mo, D. Spatial and temporal modes of prehistoric settlement distribution around Songshan Mountain. Acta Geogr. Sin. 2016, 71, 1629–1639. [Google Scholar]
  14. Zhang, Y. The Research of the Changes about Cities around Ring Songshan Area from Eastern Zhou Dynasty to Qin and Han Dynasties. Master’s Thesis, Zhengzhou University, Zhengzhou, China, 2019. [Google Scholar]
  15. Wang, X.; Zhang, J.; Cenci, J.; Becue, V. Spatial Distribution Characteristics and Influencing Factors of the World Architectural Heritage. Heritage 2021, 4, 2942–2959. [Google Scholar] [CrossRef]
  16. Pan, Y.; Yang, M. Spatial Distribution and Temporal Evolvement of World Heritages in Danger. Geogr. Geo-Inf. Sci. 2012, 28, 88–93, 110. [Google Scholar]
  17. Jones, E.E. An Analysis of Factors Influencing Sixteenth and Seventeenth Century Haudenosaunee (Iroquois) Settlement Locations. J. Anthropol. Archaeol. 2010, 29, 1–14. [Google Scholar] [CrossRef]
  18. Vojteková, J.; Tirpáková, A.; Petrovič, F.; Izakovičová, Z.; Vojtek, M. Spatial Analysis of Historical Objects with Defensive Function in Slovakia. Geocarto Int. 2021. [CrossRef]
  19. Khine, M.M.; Myo, W.P.P.; Oo, M. Spatial Distribution of Religious Buildings in Taungyoedan Area within Mawlamyine City. Yangon Univ. Distance Educ. Res. J. 2018, 9, 42–53. [Google Scholar]
  20. Blanco, A.; de Bustamante, I.; Pascual-Aguilar, J.A. Using Old Cartography for the Inventory of a Forgotten Heritage: The Hydraulic Heritage of the Community of Madrid. Sci. Total Environ. 2019, 665, 314–328. [Google Scholar] [CrossRef]
  21. An, C.; Zheng, L.; Liu, L.; Lu, C.; Zhang, D.; Zhang, Y.; Shang, Y.; Zhu, M.; Zhang, Y.; Zhang, W. Environmental archaeological perspective of early walled settlements along the Silk Road: From Hexi Corridor to Central Asia. Quat. Sci. 2022, 42, 302–310. [Google Scholar] [CrossRef]
  22. Bian, J.; Chen, W.; Zeng, J. Spatial Distribution Characteristics and Influencing Factors of Traditional Villages in China. Int. J. Environ. Res. Publica Health 2022, 19, 4627. [Google Scholar] [CrossRef]
  23. Li, G.; Liu, Y. Study on Spatiotemporal Distribution Pattern and Influencing Factors of Traditional Villages in Western Yunnan. J. Southwest For. Univ. (Soc. Sci.) 2020, 4, 1–10. [Google Scholar]
  24. Lu, S.; Zhang, X.; Zhang, Y. Temporal-Spatial Distribution Characteristics and Impact Factors of Traditional Villages in Huizhou Area. Econ. Geogr. 2018, 38, 1690–1698. [Google Scholar]
  25. Kang, J. Study on the Spatial Distribution Characteristics and Influencing Factors of Chinese Traditional Villages. Master’s Thesis, Nanjing University, Nanjing, China, 2017. [Google Scholar]
  26. Zhang, P.; Li, J.; Zhang, Z. Spatial-Temporal Distribution Characteristics and Influencing Factors of Traditional Villages in Qinling-Daba Mountains. J. Hum. Settl. West China 2020, 35, 116–124. [Google Scholar] [CrossRef]
  27. Xue, M.; Wang, C.; Dou, W.; Wang, Z. Spatial distribution characteristics of traditional villages in the Yellow River basin and influencing factors. J. Arid. Land Resour. Environ. 2020, 34, 94–99. [Google Scholar] [CrossRef]
  28. Fan, X.; Dai, S. Spatial-Temporal Distribution Characteristics of Industrial Heritage Protection and the Influencing Factors in a Chinese City: A Case Study of the Tiexi Old Industrial District in Shenyang. J. Herit. Tour. 2017, 12, 281–295. [Google Scholar] [CrossRef]
  29. Zhang, J.; Cenci, J.; Becue, V.; Koutra, S. Research of the Industrial Heritage Category and Spatial Density Distribution in the Walloon Region, Belgium, and Northeast China. In Structural Studies, Repairs and Maintenance of Heritage Architecture XVII & Earthquake Resistant Engineering Structures XIII; WIT Press: Southampton, UK, 2021; pp. 285–293. [Google Scholar]
  30. Cui, W.; Wang, Z.; Xu, B. Spatial Structure and Determinants of World Industrial Heritages. Econ. Geogr. 2017, 37, 198–205. [Google Scholar] [CrossRef]
  31. Dai, X.; Que, W. Temporal-spatial distribution of mining heritages in China: The perspective of officially protected site/entity. Geogr. Res. 2011, 30, 747–757. [Google Scholar]
  32. Liang, Y.; Min, Q.; Cheng, S. Geographical distribution of vineyard cultural heritage in the world and its causes of formation. Zhongguo Shengtai Nongye Xuebao/Chin. J. Eco-Agric. 2012, 20, 693–697. [Google Scholar] [CrossRef]
  33. Liu, G.; Doronzo, D.M. A Novel Approach to Bridging Physical, Cultural, and Socioeconomic Indicators with Spatial Distributions of Agricultural Heritage Systems (AHS) in China. Sustainability 2020, 12, 6921. [Google Scholar] [CrossRef]
  34. Yue, J.; Dai, X. Temporal and Spatial Pattern of Cultural Heritage in Beijing-Tianjin-Hebei Region and Its Influencing Factors: A Case Study of Cultural Relic Protection Unit. Econ. Geogr. 2020, 40, 221–230. [Google Scholar] [CrossRef]
  35. Zhu, A.; Zhou, Y.; Chen, J.; Hu, H. Spatial-Temporal Evolution Research of Hubei Cultural Heritages—Taking Cultural Relic Protection Unit as Example. Econ. Geogr. 2016, 36, 184–191. [Google Scholar] [CrossRef]
  36. Chen, J.; Zhou, Y.; Liu, D. Analysis of Spatio-temporal distribution characteristics of ancient architecture heritage in China. J. Arid. Land Resour. Environ. 2018, 32, 194–200. [Google Scholar] [CrossRef]
  37. Lu, P.; Chen, P.; Tian, Y.; He, Y.; Mo, D.; Yang, R.; Lasaponara, R.; Masini, N. Reconstructing settlement evolution from neolithic to Shang dynasty in Songshan mountain area of central China based on self-organizing feature map. J. Cult. Herit. 2019, 36, 23–31. [Google Scholar] [CrossRef]
  38. Zhou, K.; Zhang, S.; Zhang, Z.; Yang, R.; Cai, Q.; Song, G.; Song, Y.; Mo, D.; Wang, H.; Lu, P.; et al. On Mount Song Cultural Circle. Cult. Relics Cent. China 2005, 1, 12–20. [Google Scholar]
  39. Gastwirth, J.L. A General Definition of the Lorenz Curve. Econom. J. Econom. Soc. 1971, 39, 1037–1039. [Google Scholar] [CrossRef]
  40. Yan, H.; Weibel, R. An algorithm for point cluster generalization based on the Voronoi diagram. Comput. Geosci. 2008, 34, 939–954. [Google Scholar] [CrossRef]
  41. Chen, J.; Zhao, R.; Qiao, C. Voronoi Diagram-based GIS Spatial Analysis. Geomat. Inf. Sci. Wuhan Univ. 2003, 28, 32–37. [Google Scholar]
  42. Zhang, J.; Cenci, J.; Becue, V.; Koutra, S. Analysis of Spatial Structure and Influencing Factors of the Distribution of National Industrial Heritage Sites in China Based on Mathematical Calculations. Environ. Sci. Pollut. Res. 2022, 29, 27124–27139. [Google Scholar] [CrossRef]
  43. Ayhan, I.; Mert Cubukcu, K. Explaining Historical Urban Development Using the Locations of Mosques: A GIS/Spatial Statistics-Based Approach. Appl. Geogr. 2010, 30, 229–238. [Google Scholar] [CrossRef]
  44. Huang, Y.; Liao, S. Elevation Cluster Dataset Covering Henan Province, China. J. Glob. Change Data Discov. 2017, 3, 364–367. [Google Scholar]
  45. Zhang, F. Research on the Protection of Traditional Revolutionary Buildings in Jinzhai County. Master’s Thesis, Anhui Jianzhu University, Hefei, China, 2021. [Google Scholar] [CrossRef]
  46. Sun, M.; Chen, Y.; Shen, Y. Study on the Characteristics of Grottoes Excavation in Shangluo, Shaanxi. J. Northwest Univ. (Philos. Soc. Sci. Ed.) 2022, 52, 33–43. [Google Scholar]
  47. Guo, H. (Ed.) Atlas of Remote Sensing for World Heritage: China; Springer: Berlin/Heidelberg, Germany, 2013; pp. 184–187. ISBN 9783642328237. [Google Scholar] [CrossRef]
  48. Chu, C.; Ma, L. Merchant G, Guild Houses and the Propagation of Opera: The Case of Shanxi and Shanxi Merchants and their Guild Houses in Henan Province in the Ming and Qing Dynasties. Sichuan Drama 2021, 3, 18–21. [Google Scholar]
  49. Song, L.; Li, G. The Businessmen of Shannxi & Shanxi built the chamber of commerce in Henan in Ming & Qing Dynasty and its the commercial function. J. Northwest Univ. (Philos. Soc. Sci. Ed.) 2009, 39, 34–40. [Google Scholar]
  50. Xiong, V. Capital Cities and Urban Form in Pre-Modern China: Luoyang, 1038 BCE to 938 CE; Routledge: London, UK, 2016. [Google Scholar] [CrossRef]
  51. Guo, D. Songshan historical architectural complex between the heaven and earth. China Cult. Herit. 2009, 3, 10–18. [Google Scholar]
  52. Jing, Z. Han Sanque in Mount Song in Qing Dynasty. Hundred Sch. Arts 2012, 28, 305–307, 388. [Google Scholar]
  53. Zhang, J. Songshan Mountain Han Sanque. China Cult. Herit. 2009, 3, 19–25. [Google Scholar]
  54. Ma, B. A Study on the Historical and Cultural Value of Dengfeng Confucianism, Buddhism and Taoism and the Protection Strategy of Representative Architectural Remains. Chin. Overseas Archit. 2019, 5, 31–34. [Google Scholar]
  55. Xie, Y.; Yang, R.; Liang, Y.; Li, W.; Chen, F. The Spatial Relationship and Evolution of World Cultural Heritage Sites and Neighbouring Towns. Remote Sens. 2022, 14, 4724. [Google Scholar] [CrossRef]
Figure 1. Historic monuments of Dengfeng in “the Center of Heaven and Earth”.
Land 11 02094 g001
Figure 2. Location of the Songshan region.
Land 11 02094 g002
Figure 3. The quantity of historical buildings in the Songshan region in different periods.
Land 11 02094 g003
Figure 4. Lorentz curve of spatial distribution of historical buildings in the Songshan region.
Land 11 02094 g004
Figure 5. The quantity of historical buildings distributed in different administrative units in the Songshan region. (a) Macro-administrative units; (b) Micro-administration units.
Land 11 02094 g005
Figure 6. The Voronoi diagram of the distribution of historical buildings in the Songshan region.
Land 11 02094 g006
Figure 7. Kernel density of historical buildings in the Songshan region.
Land 11 02094 g007
Figure 8. Kernel density of different types of historical buildings’ distribution in the Songshan region.
Land 11 02094 g008
Figure 9. Standard deviation ellipse of the evolution of the distribution of historical buildings in different periods.
Land 11 02094 g009
Figure 10. Spatial distribution of historical buildings in different altitude ranges.
Land 11 02094 g010
Figure 11. Quantitative distribution of historical buildings in the different altitude ranges.
Land 11 02094 g011
Figure 12. Distribution of various types of historical buildings on different landforms in the Songshan region.
Land 11 02094 g012
Figure 13. Quantity of each type of historical building distributed at different distances from the water system.
Land 11 02094 g013
Figure 14. Quantity of each type of historical building distributed at different distances from the water system (≤1000 m).
Land 11 02094 g014
Figure 15. Statistical map of the distribution of historical buildings in Luoyang City by fishnet grid.
Land 11 02094 g015
Figure 16. Quantity of each type of historical building distributed at different distances from Mount Song (≤50 km).
Land 11 02094 g016
Figure 17. The quantity of national and Henan provincial historical buildings by batches in the Songshan region.
Land 11 02094 g017
Figure 18. Cumulative quantity changes in historical buildings in the Songshan region by each batch.
Land 11 02094 g018
Table 1. Types and definitions of historical buildings.
TypesDefinitionQuantity
Religious buildingsBuildings used to organize various religious activities83
Regime buildingsOffice buildings used by the ruling class to manage central and local affairs33
Municipal buildingsBuildings that serve the purpose of transportation, landmarks, etc., in their distribution areas22
Ritual buildingsBuildings used for offering sacrifices to the natural gods of Heaven and Earth, ancestors, and sages of the past dynasties67
Cultural buildingsBuildings used for scientific research, education, and cultural and recreational activities22
Residential buildingsBuildings distributed in cities and villages to meet the needs of residents66
Table 2. The Voronoi diagram calculations for the distribution of historical buildings in the Songshan region.
Type
Analysis
ClassificationRSCVSpatial Distribution Type
By building typeResidential buildings526.4663532.96940.987798clustered
Municipal buildings2060.0991623.1341.269211clustered
Religious buildings424.8109463.75260.916029clustered
Regime buildings1288.0861115.9051.154297clustered
Cultural buildings1197.3741552.5630.771224clustered
Ritual buildings547.4157495.95771.103755clustered
By historical periodQin and Han dynasties5403.7497141.7910.756638clustered
Wei and Jin dynasties3533.5022975.7461.187434clustered
Sui and Tang dynasties4136.1593246.2681.274127clustered
Song and Yuan dynasties1492.4441552.5630.961277clustered
Ming and Qing dynasties227.5964184.06681.236488clustered
Republic of China581.3968743.93650.781514clustered
Overall155.5376122.29091.271865clustered
Table 3. Standard deviation ellipse index of the evolution of the distribution of historical buildings in different periods.
EraCenter XCenter YXStdDistYStdDistRotation
Republic of China112.89053934.35389483,786.7574862,031.0464986.532069
Ming and Qing Dynasties112.99844434.29471779,443.2225651,374.16315110.933593
Song and Yuan Dynasties113.17381834.36017886,093.9022446,390.6051392.489118
Sui and Tang Dynasties113.04717834.51527237,056.9766231,562.4840875.725957
Wei and Jin Dynasties112.62283234.57884243,942.785132,164.64288102.301876
Qin and Han Dynasties112.86571434.519447,841.93118838.588513108.417256
Overall112.86571434.519478,709.9364653,128.4611106.052133
Publisher’s Note: MDPI stays neutral with regard to jurisdictional claims in published maps and institutional affiliations.

