Article

Fractal Features of Soil Particles as an Indicator of Land Degradation under Different Types of Land Use at the Watershed Scale in Southern Iran

by
Mohammad Tahmoures
1,*,
Afshin Honarbakhsh
2,
Sayed Fakhreddin Afzali
3,
Mostafa Abotaleb
4,
Ben Ingram
5 and
Yaser Ostovari
6,*
1
Department of Soil Conservation and Watershed Management, Zanjan Agricultural and Natural Resources Research Center, AREEO, Zanjan 19395-1113, Iran
2
Department of Natural Engineering, Faculty of Natural Resources and Earth Science, Shahrekord University, Shahrekord 64165-478, Iran
3
Department of Natural Resource and Environmental Engineering, School of Agriculture, Shiraz University, Shiraz 1585-71345, Iran
4
Department of System Programming, South Ural State University, Prospekt Lenina, 76, Chelyabinsk 454080, Russia
5
School of Water, Energy and Environment, Cranfield University, Cranfield MK43 0AL, UK
6
Chair of Soil Science, Research Department of Ecology and Ecosystem Management, Technical University of Munich, 85354 Freising, Germany
*
Authors to whom correspondence should be addressed.
Land 2022, 11(11), 2093; https://doi.org/10.3390/land11112093
Submission received: 25 October 2022 / Revised: 11 November 2022 / Accepted: 16 November 2022 / Published: 20 November 2022
(This article belongs to the Special Issue Soil Erosion Control and Land Degradation Neutrality)

Abstract

:
Soil particle-size distribution (PSD) is an important soil feature that is associated with soil erosion, soil fertility, and soil physical and chemical properties. However, very few studies have been carried out to investigate soil degradation using the fractal dimension (D) of the PSD of soils from different land-use types in the calcareous soil of Iran. For this study, 120 soil samples (0–20 cm) were collected from different land-use types in the Fars Province, and various basic soil properties such as soil organic matter (SOM), soil texture fractions, calcium carbonate (CaCO3), pH, and cation-exchange capacity (CEC) were measured. The PSD of the soil samples was determined using the international classification system for soil size fraction, and the D of the PSD was calculated for all soils. The results of this study show that D is significantly correlated with clay content (r = 0.93) followed by sand content (r = −0.54) and CEC (r = 0.51). The mean D values of the forest areas (D = 2.931), with a SOM content of 2.1%, are significantly higher than those of the agricultural land (D = 2.905 and SOM = 1.6%) and pastures (D = 2.910 and SOM = 1.6%), indicating that fine soil particles, particularly clay, have been preserved in forest soils but lost in agricultural and pasture soils. We conclude that agricultural land has experienced significantly higher levels of soil erosion than forest areas.

1. Introduction

Soil particle-size distribution (PSD) is considered an important physical property of soil that influences many other soil properties including soil fertility and productivity, hydraulic properties of the soil surface, and soil erosion [1,2]. In other words, the PSD is a key indicator for evaluating physical soil functions [3]. It can be used for modeling the water, heat, and solute in soil in order to predict the geographical distribution of soil characteristics [4,5]. Fractal geometry theory has been used to describe natural bodies and phenomena displaying complicated shapes and self-similar characteristics. This theory is a common method to illustrate systems with self-similarity and non-characteristic scales. Soil is a porous medium with a varied particle-size distribution and has irregular shapes and a self-similar structure, hence displaying fractal characteristics. In recent decades, the utilization of the fractal dimension (D) has been receiving increasing attention worldwide for describing soil PSD, soil dynamics, and soil physical processes, because it can help indicate the structure and size dimension of particles in a soil system [6]. Tyler and Wheatcraft [7] derived an accurate mass-based distribution model to predict the PSD fractal dimensions and explained the limitations of the fractal concept and its applications to soil PSD. The fractal dimension has been evaluated for identifying soil hydraulic properties, sometimes coupled with remote sensing and image processing, as well as conducting mathematical analyses of soil properties [5,8,9,10,11]. In addition, the D has been evaluated as an indicator of land degradation and soil sensitivity to erosion factors [12,13,14], soil salinity, soil alkalinity, and solute transport in soils [5,15,16,17]. D has also been widely used for identifying organic carbon storage and soil structure [13,18,19,20,21,22], indicating soil nutrient content [4,15,23] and evaluating spatial and temporal variation in soil moisture and soil evapotranspiration [22]. Despite extensive research on soil properties linked to D, few studies have been conducted on the influence of D on different types of land use. Peng et al. [2] report that D is greatly influenced by land-use types; the highest D value was for grass cover, which coincided with soils that had a high silt content in the Delta of the Yellow River located in China. Deng et al. [3] noted that a hilly mountainous region, located in southern China, showed that the D value was the highest in orchards when compared to other land uses. Qi et al. [24] reported that oak forestland had the highest D value followed by shrub-grass sloping land.
The Fars Province is an important agricultural area in Iran that provides strategic agricultural production, especially wheat, rice, maize, and sugar beets. However, in this part of Iran, desertification has been accelerating because of land-use change over the past three decades. To the best of our knowledge, there is no existing research that examines the influence of different land-use types on changes in the D in soil PSD, which can be considered an indication of soil degradation in the calcareous soils of Iran. Hence, the aims of this study are to (1) evaluate the fractal dimension of PSD in the calcareous soils located in Fars Province south of Iran, and (2) investigate the influence of different patterns of land use on the fractal dimension of PSD in calcareous soils.

2. Material and Methods
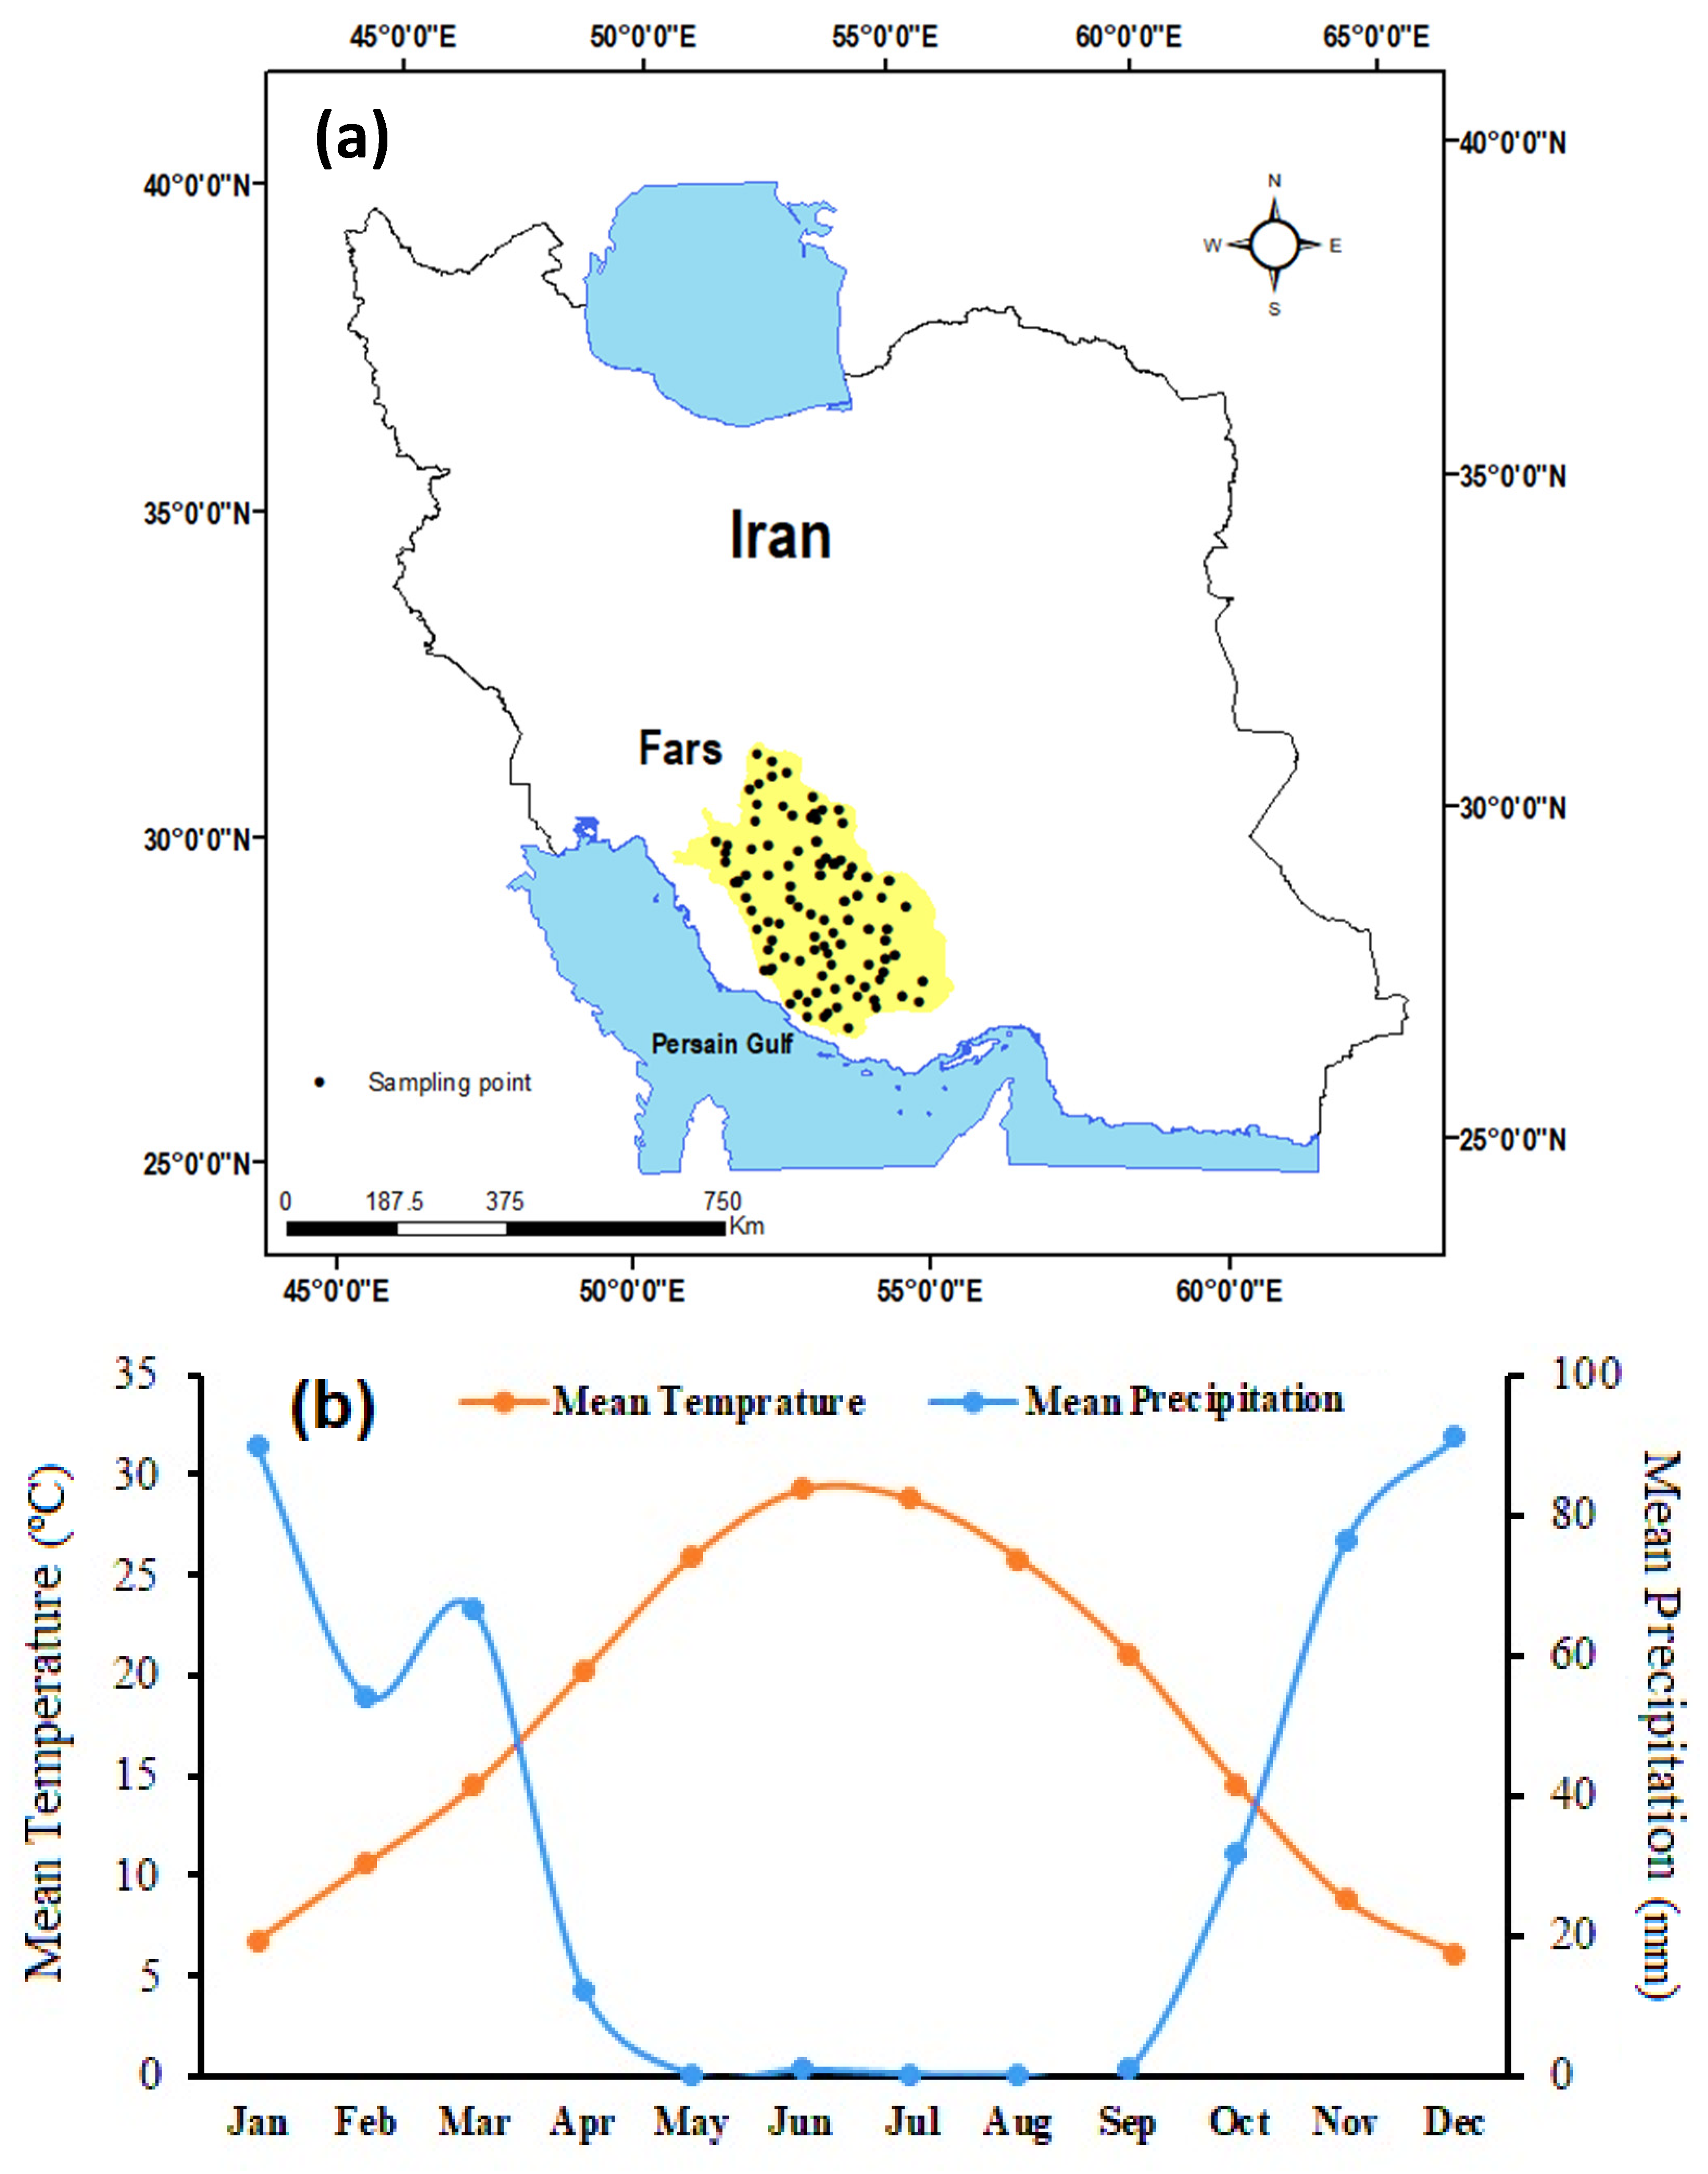
2.1. Study Area

Fars Province is located in southern Iran, between 27°2′ and 31°42′ latitude and 50°42′ and 55°36′ longitude, and covers an approximate area of 133,299 km2 (Figure 1a). About 5 million people reside in this province and work primarily in agriculture and livestock farming. It has been identified that there are thirty critical centers of water and wind erosion across the Fars Province, including some dried lakes acting as a potential source of dust, which contains both salt and chemical pollutants. These dusts are scattered by wind erosion. Due to the climatic conditions, wind and water erosion are experienced throughout most parts of this province. In addition, this province is one of the main agricultural regions for the production of strategic food products such as wheat, rice, and maize.
The climate in this province varies from arid to semi-arid according to the De Marten aridity index. Most rainfall occurs between December and March during the winter and spring seasons (Figure 1b). The central regions of the Fars Province receive relatively more precipitation, with an average annual rainfall of 443 mm; mild winters; and hot dry summers. Temperatures across the study site vary from 28 °C in June to 8 °C in January with a mean annual temperature of 14 °C. The higher temperatures were observed from June to July (the summer months) and the lower temperatures from December to February (the winter months). Common soil orders found in the studied area are Inceptisols, Entisols, and Aridisols, which are enriched by calcareous materials as defined by the USDA Soil Taxonomy (USDA, 2010). The maximum recorded wind speeds vary from 30 m s−1 (at 10 m height) in the north to 45 m s−1 (at 10 m height) in the center of the study site. The forest and pasture land uses have experienced some human activity. The principal tree species found in the Fars Province’s forests, which cover 18% of the area, are mountain spruce, pistachio, and oak. A large part of the Fars Province is under rangeland use, with astragalus, camel thorn, coma, and safflower grass being the main dominant rangeland species. Maize, rice, wheat, potato, and tomato are the primary crops grown in the Fars Province using conventional tillage practices.

2.2. Soil Sampling and Analysis

In the study area, 120 soil samples were collected from three different land uses, including agriculture (40 samples), pasture (40 samples), and woodland (40 samples).
The collected soil samples were air-dried in laboratory conditions. The air-dried soil was then sieved, and a physiochemical analysis was carried out. The soil organic matter (SOM), CaCO3, EC, and pH were determined using standard methods including the Walkley–Black method [25], titration with HCL 1 mol. [25], a portable EC meter, and a portable pH meter, respectively.
Soil particle-size distribution (PSD) was determined using the method described by Gee and Bauder [26]. With 50 g of sampled soil, organic carbon was removed by inserting a H2O2 solution (30%). The sodium hexametaphosphate solution (5%) and an electrical shaker were used to disperse the sampled soils both chemically and mechanically, respectively. The mass fractions of the particles smaller than 0.05 mm in diameter were determined using the sedimentation method (hydrometer in a model of ASTM 152H), and the suspension density was measured at 7 times: 2, 5, 10, 60, 180, 360, and 1440 min [26]. Finally, the measured temperatures and hydrometer readings were used to calculate the particle-size fractions, as follows:
R C = R r C + 0.36 ( T 20 )
P <   D = ( R C D m s ) × 100
where RC and Rr represent the corrected and uncorrected hydrometer readings, respectively. The C shows the hydrometer reading when using sodium hexametaphosphate solution (5.5 for this study). T represents the temperature in degrees (°C) at each hydrometer sample time. The mass of air-dried soils is indicated with ms. RC-D and P< D represent the corrected hydrometer reading for the falling time of particles with a smaller diameter than D and their percentage found within a sample, respectively. For each hydrometer reading, the falling height was determined following Gee and Bauder [26]:
x = 0.164   R r + 16.3
where x represents the height of falling (L). Next, Stock’s law Equations (4) and (5) were used to calculate the radius of the particles at the specific time of each hydrometer reading as follows:
V = 2   g   r 2 ( d P d F ) 9   η
V = x t
where V, r, g, dF, dP, η, t, and x are the velocity of particles falling in fluid (L T−1), the radius of particle (L), gravity acceleration (L T−2), the density of fluid (W L−3), the density of particles (W L−3), the viscosity of fluid (W L−1 T−1), the time needed for the particle to fall from a height of x, and height of falling (L), respectively. The fractions of sand measured using the sieve method with diameters of 1, 0.5, 0.15, and 0.05 mm were applied using the wet-sieving method.

2.3. Fractal Dimension

The fractal dimension was determined as shown by Equation (6) [7]:
M < x M T = ( x x max ) 3 D
where M<x represents the cumulative mass, which is <x, MT shows the total mass of soil, D refers to the fractal dimension of the soil PSD, and xmax indicates the maximum particle size. Regression methods, including both linear and non-linear methods, can be used to determine D. In this study, a linear regression was used. Applying an Ln (natural logarithm) to Equation (6) gives Equation (7):
L n ( M < x M T ) = ( 3 D ) L n ( x ) a
a = ( 3 D ) L n ( x max )
where a is a constant value for each soil. To calculate the D value, L n ( M < x M T ) was plotted against L n ( x ) . The STATISTICA 8 software (StatSoft, 2011) was used for all statistical analyses in this study.

3. Results and Discussion

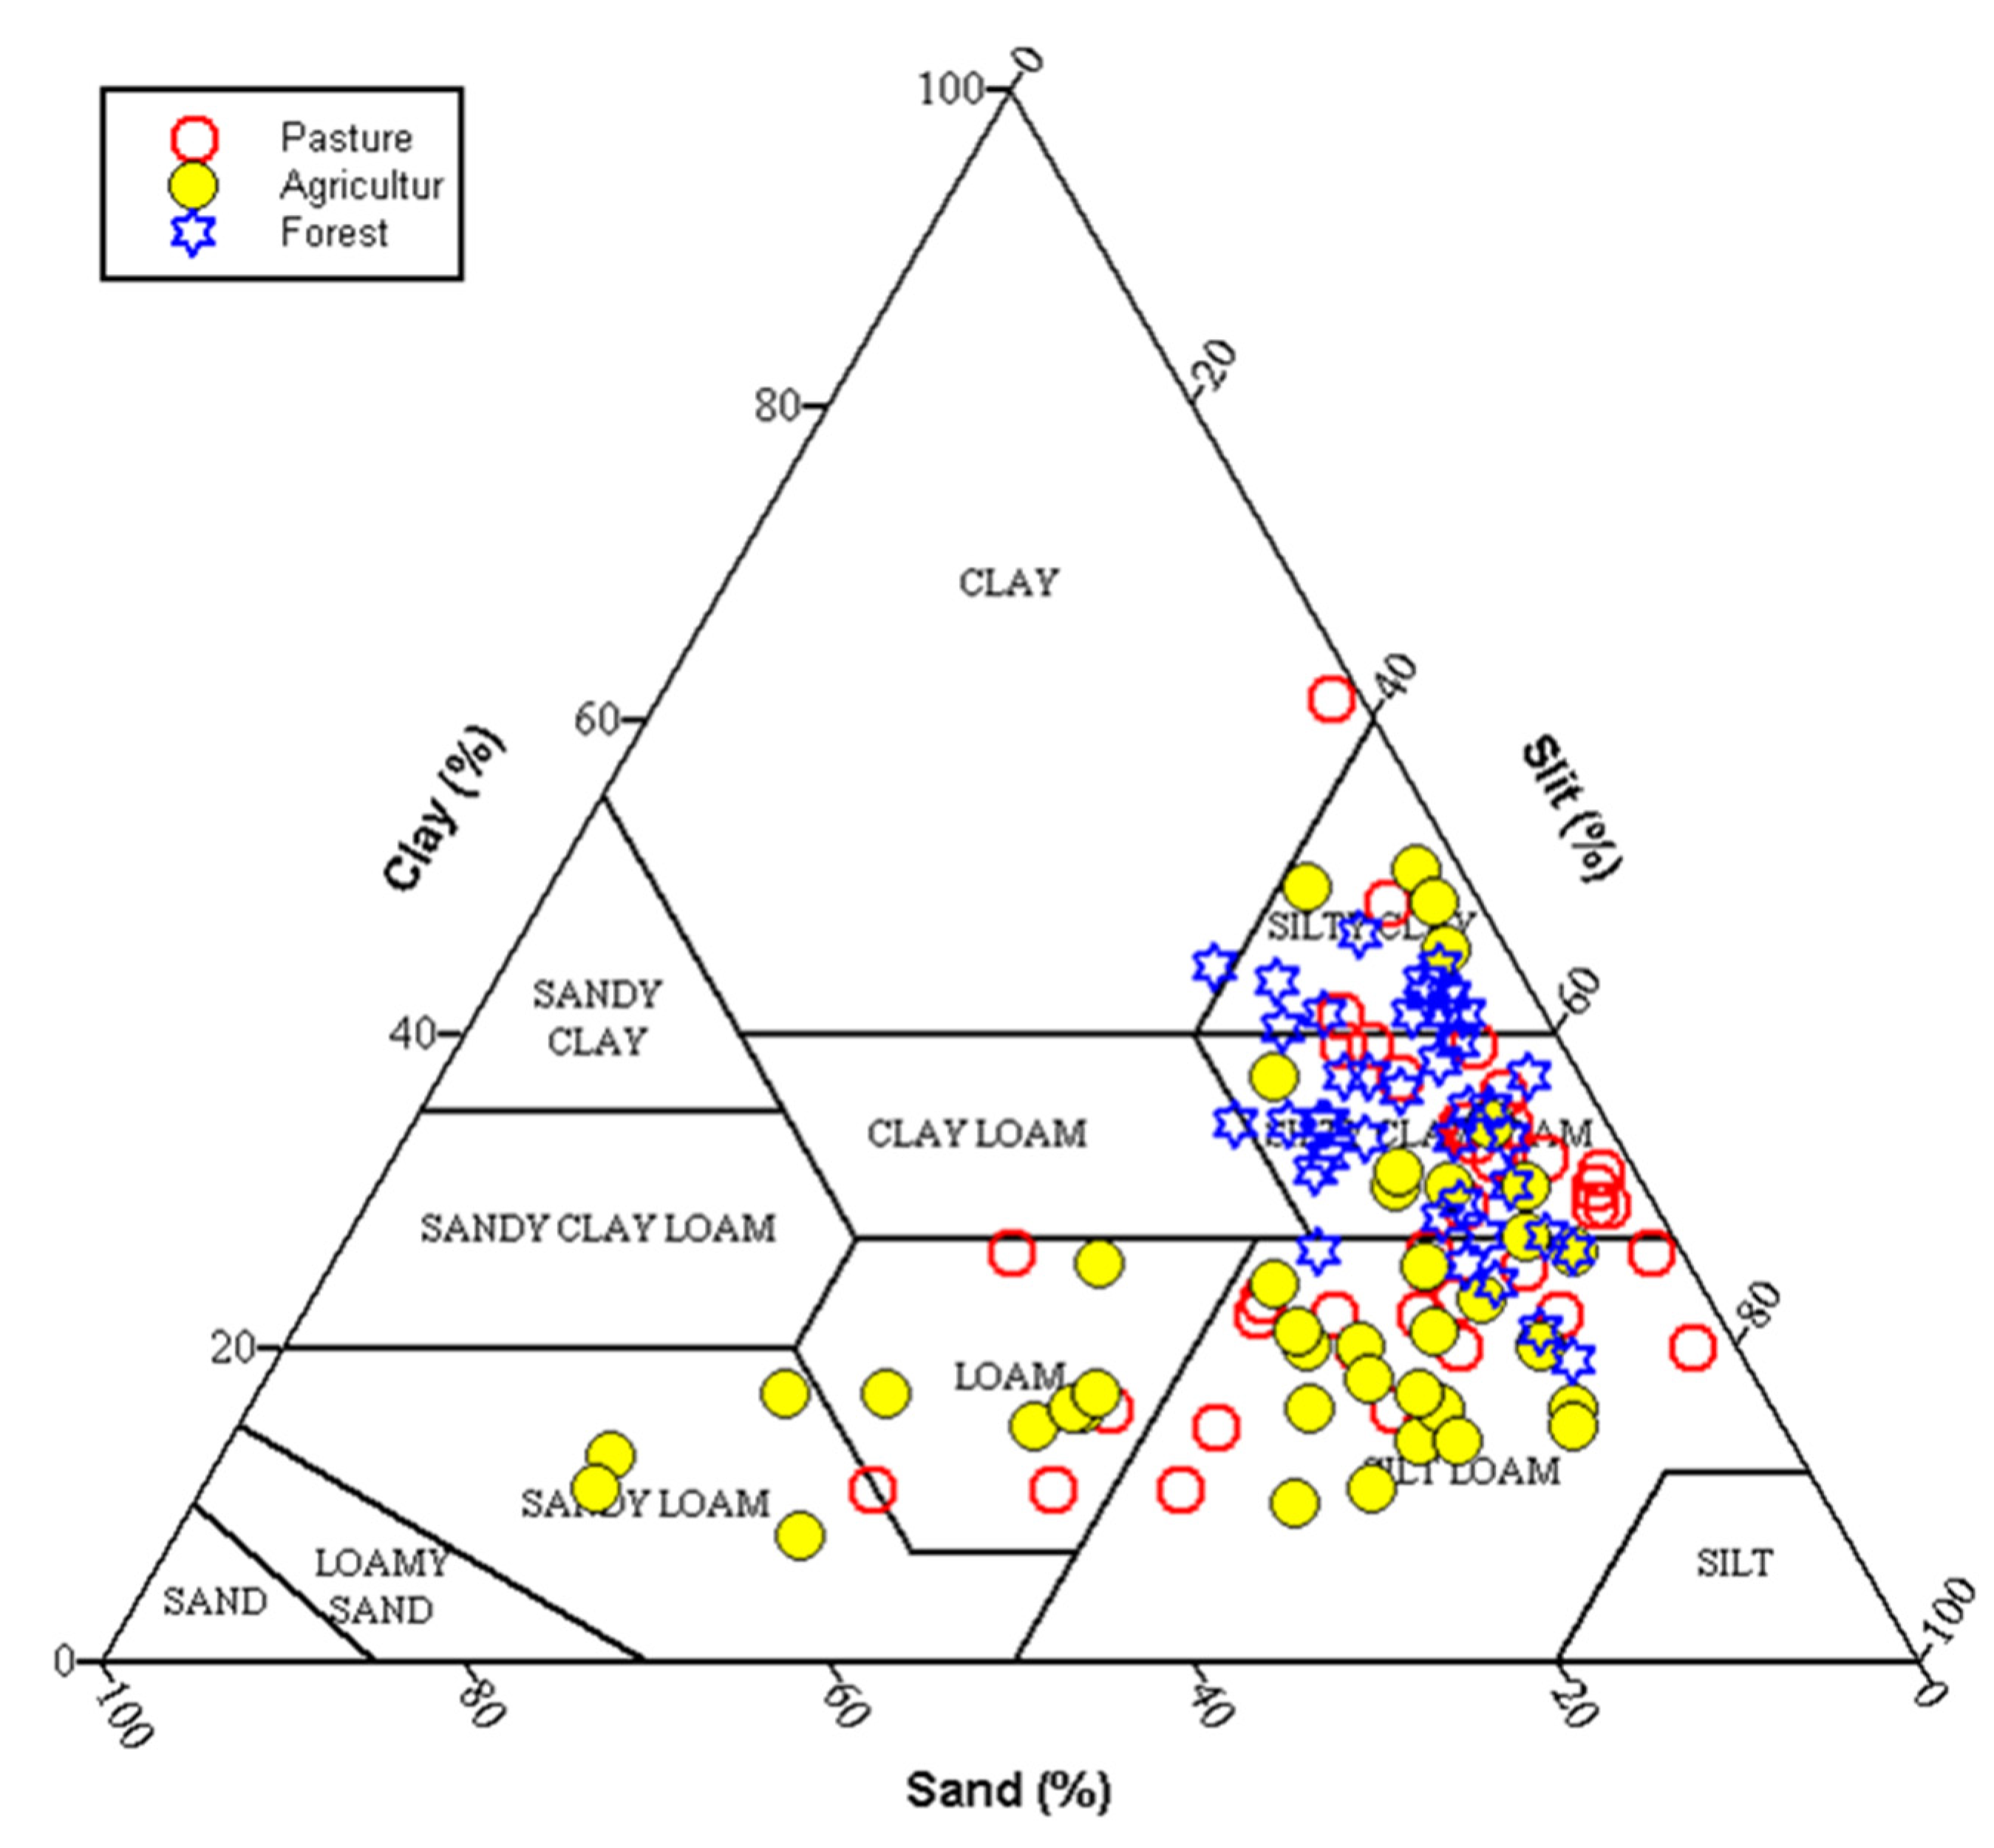
3.1. Description of Soil Properties

Table 1 shows the summary statistics for the measured soil properties. The mean pH > 7.5 indicates that most soils in this study were alkaline due to the high amount of CaCO3 in the sampled soils (mean of CaCO3 = 23.5 %, Table 1). The measured SOM values ranged from 0.3 to 5.4% with a mean of 1.7% (Table 1). The data shows a wide variation in the different soil particles sizes: clay (8.1–61.5 %), sand (1.7–67.3 %), and silt (21.4–77.3 %).
Figure 2 shows the soil texture classes for the different land uses. Soil texture classes are mainly silty clay, silty clay loam, and silt loam in forest land use; silty clay loam, silt loam, and loam in pasture land use; and silty clay, silty clay loam, silt loam, loam, and sandy loam in agricultural lands. The highest variability (CV = 83.6%) was calculated for sand, closely followed by CaCO3 content (CV = 61.4%), whereas pH had the lowest variability (CV = 3.6%), followed by silt with CV = 18.5% (Table 1). For this, Xu et al. [27] suggested a classification of soil properties with a low variability (CV < 10%) and high variability (CV > 90%). All soil properties showed a moderate variability except pH (Table 1). The D ranged from 2.851 to 2.690 with a mean of 2.916, which, for calcareous soils in Iran, is consistent with the results of Mahdi and Ghaleno [10], Omidvar [11], and Mohamadi et al. [1].
Pearson’s correlation coefficient (r) was calculated for D and the measured soil properties, which values are presented in Table 2. Soil pH is significantly positively correlated with CaCO3 content (r = 0.76, p < 0.01), which is linked to the main soil type in the study region being chalky with a high lime content [28]. Soil clay content is positively correlated with the measured SOM (r = 0.40, p < 0.05) and CEC (r = 0.52, p < 0.05), which is consistent with the findings of Ostovari et al. [29] and Ostovari et al. [30].
Clay particles and SOM have a high specific surface area that can absorb soil cations, resulting in an increase in soil CEC, fine root dynamics and biomass production, and nitrogen and carbon storage [31]. In addition, there is a significant positive correlation between the content of SOM and CaCO3 (r = 0.49, p < 0.05). Ostovari et al. [32] reported that a positive correlation (0.36) exists between the content of CaCO3 and SOM. CaCO3 plays an important role in soil, making more stable and bigger aggregates due to having large amounts of Ca2+ that act as a binding agent for the flocculation of soil minerals, resulting in an increase in clay content and the D of soil PSD. For all of the soil properties, the correlation between clay and the D of soil PSD (r = 0.93, p < 0.01) is the highest, followed by the CEC (r = 0.51, p < 0.05) and SOM (r = 0.43, p < 0.05), which accords with Fu et al. [13] who reported a significant correlation of 0.89 between clay and the D of soil PSD. However, the D of soil PSD has a significant negative relationship with sand (r = −0.54, p < 0.05) and silt (r = −0.26, p < 0.05) content, which is in the line with Fu et al. [13], who showed a significant negative correlation of −0.84 between sand and the D of soil PSD.

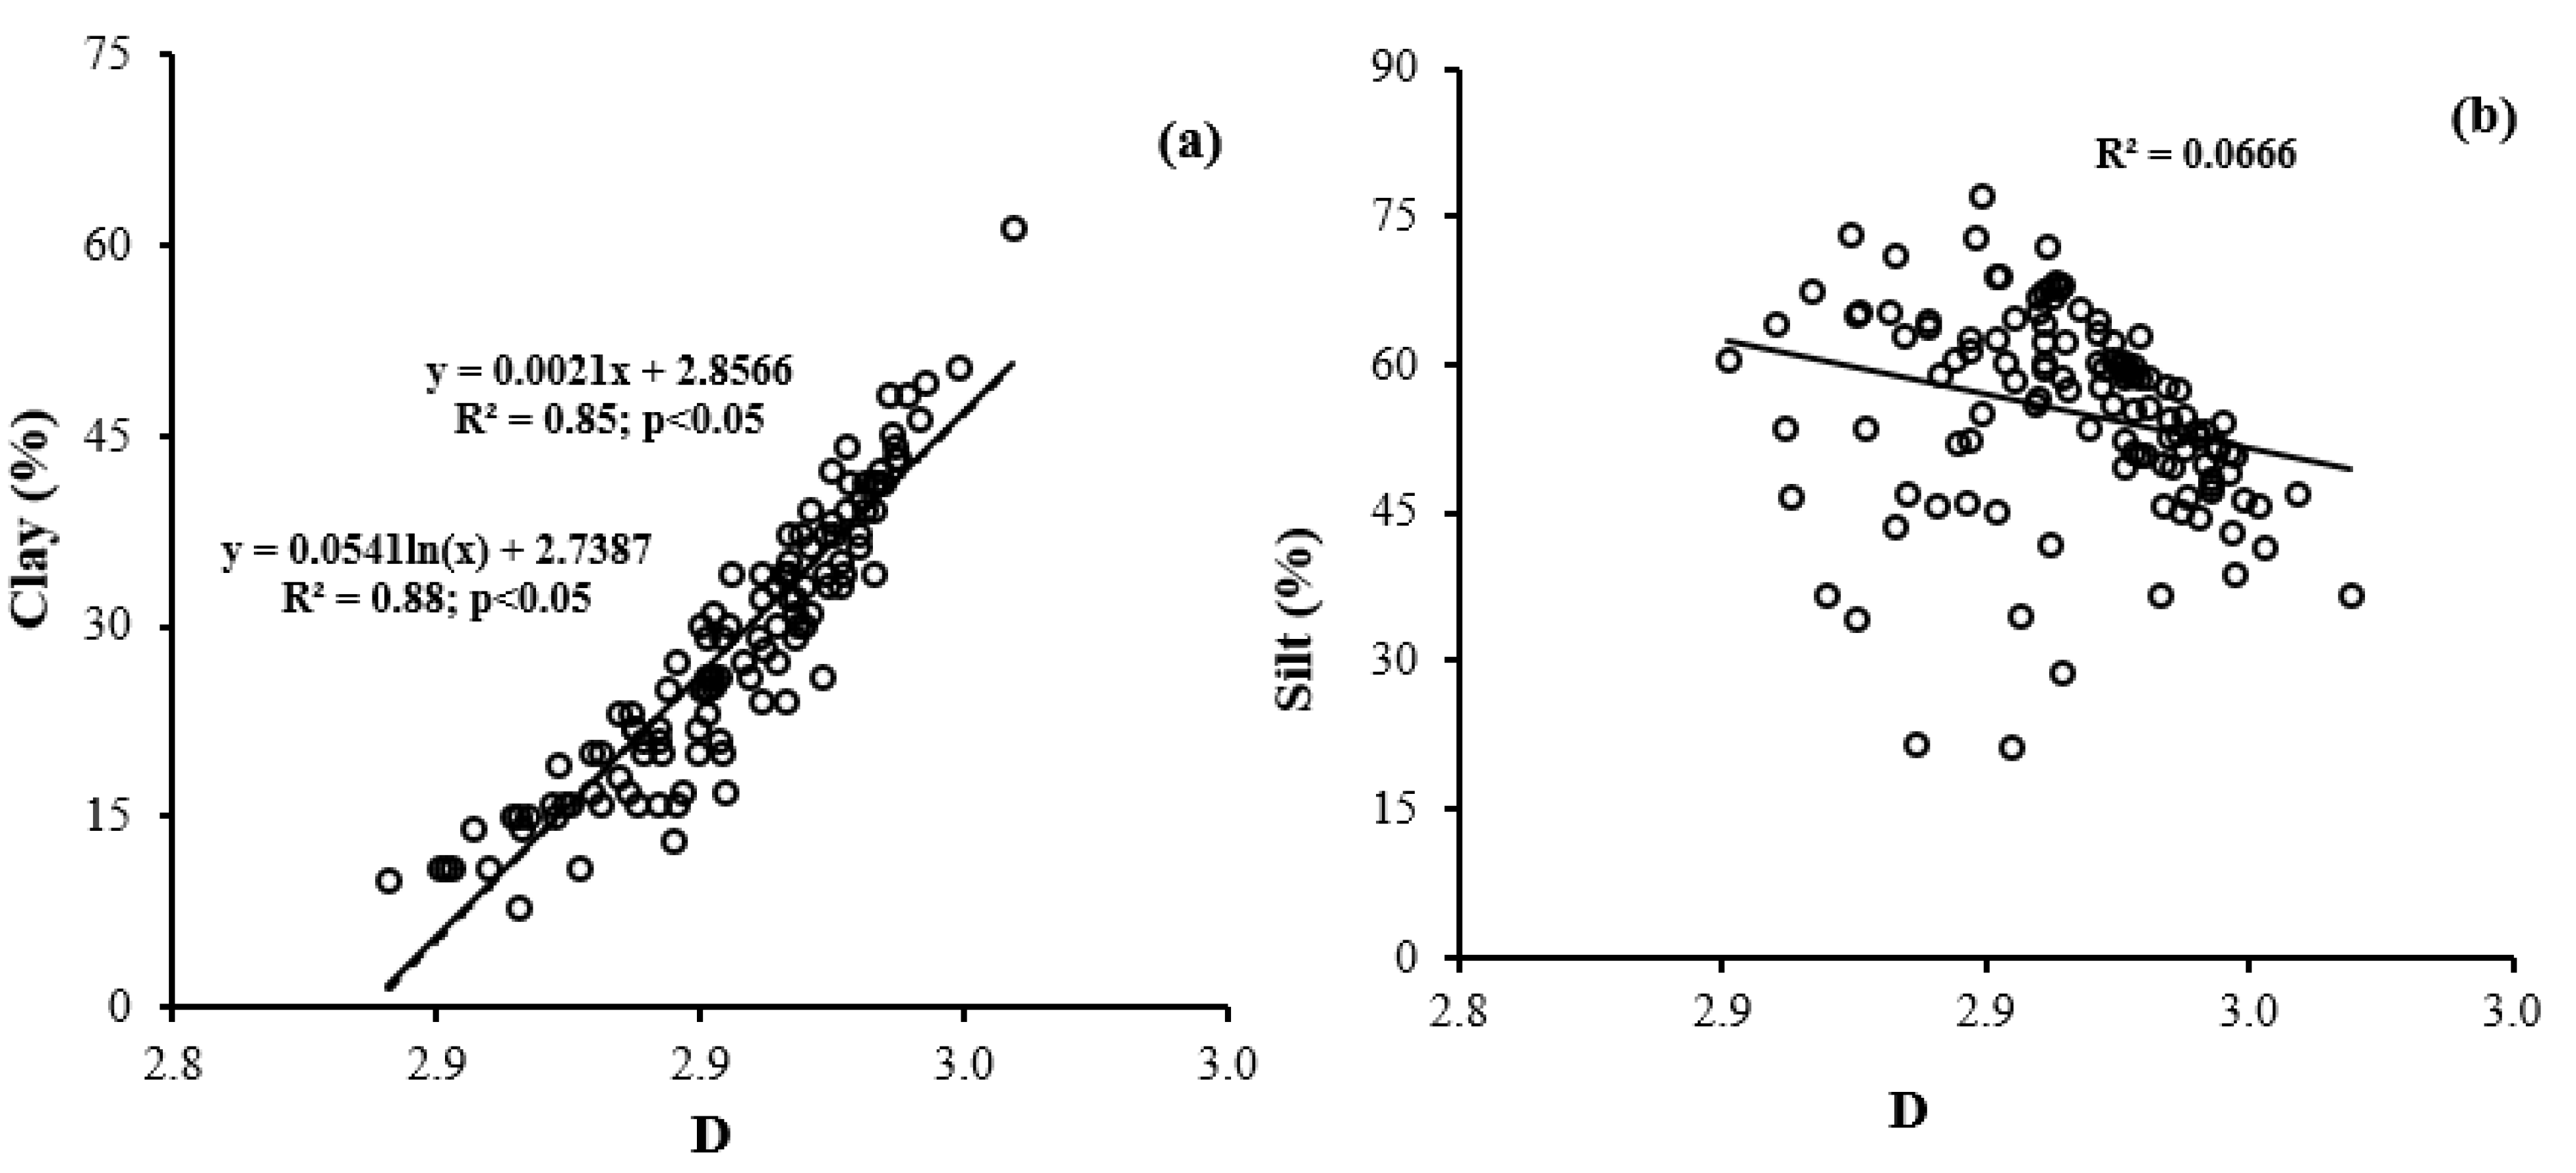
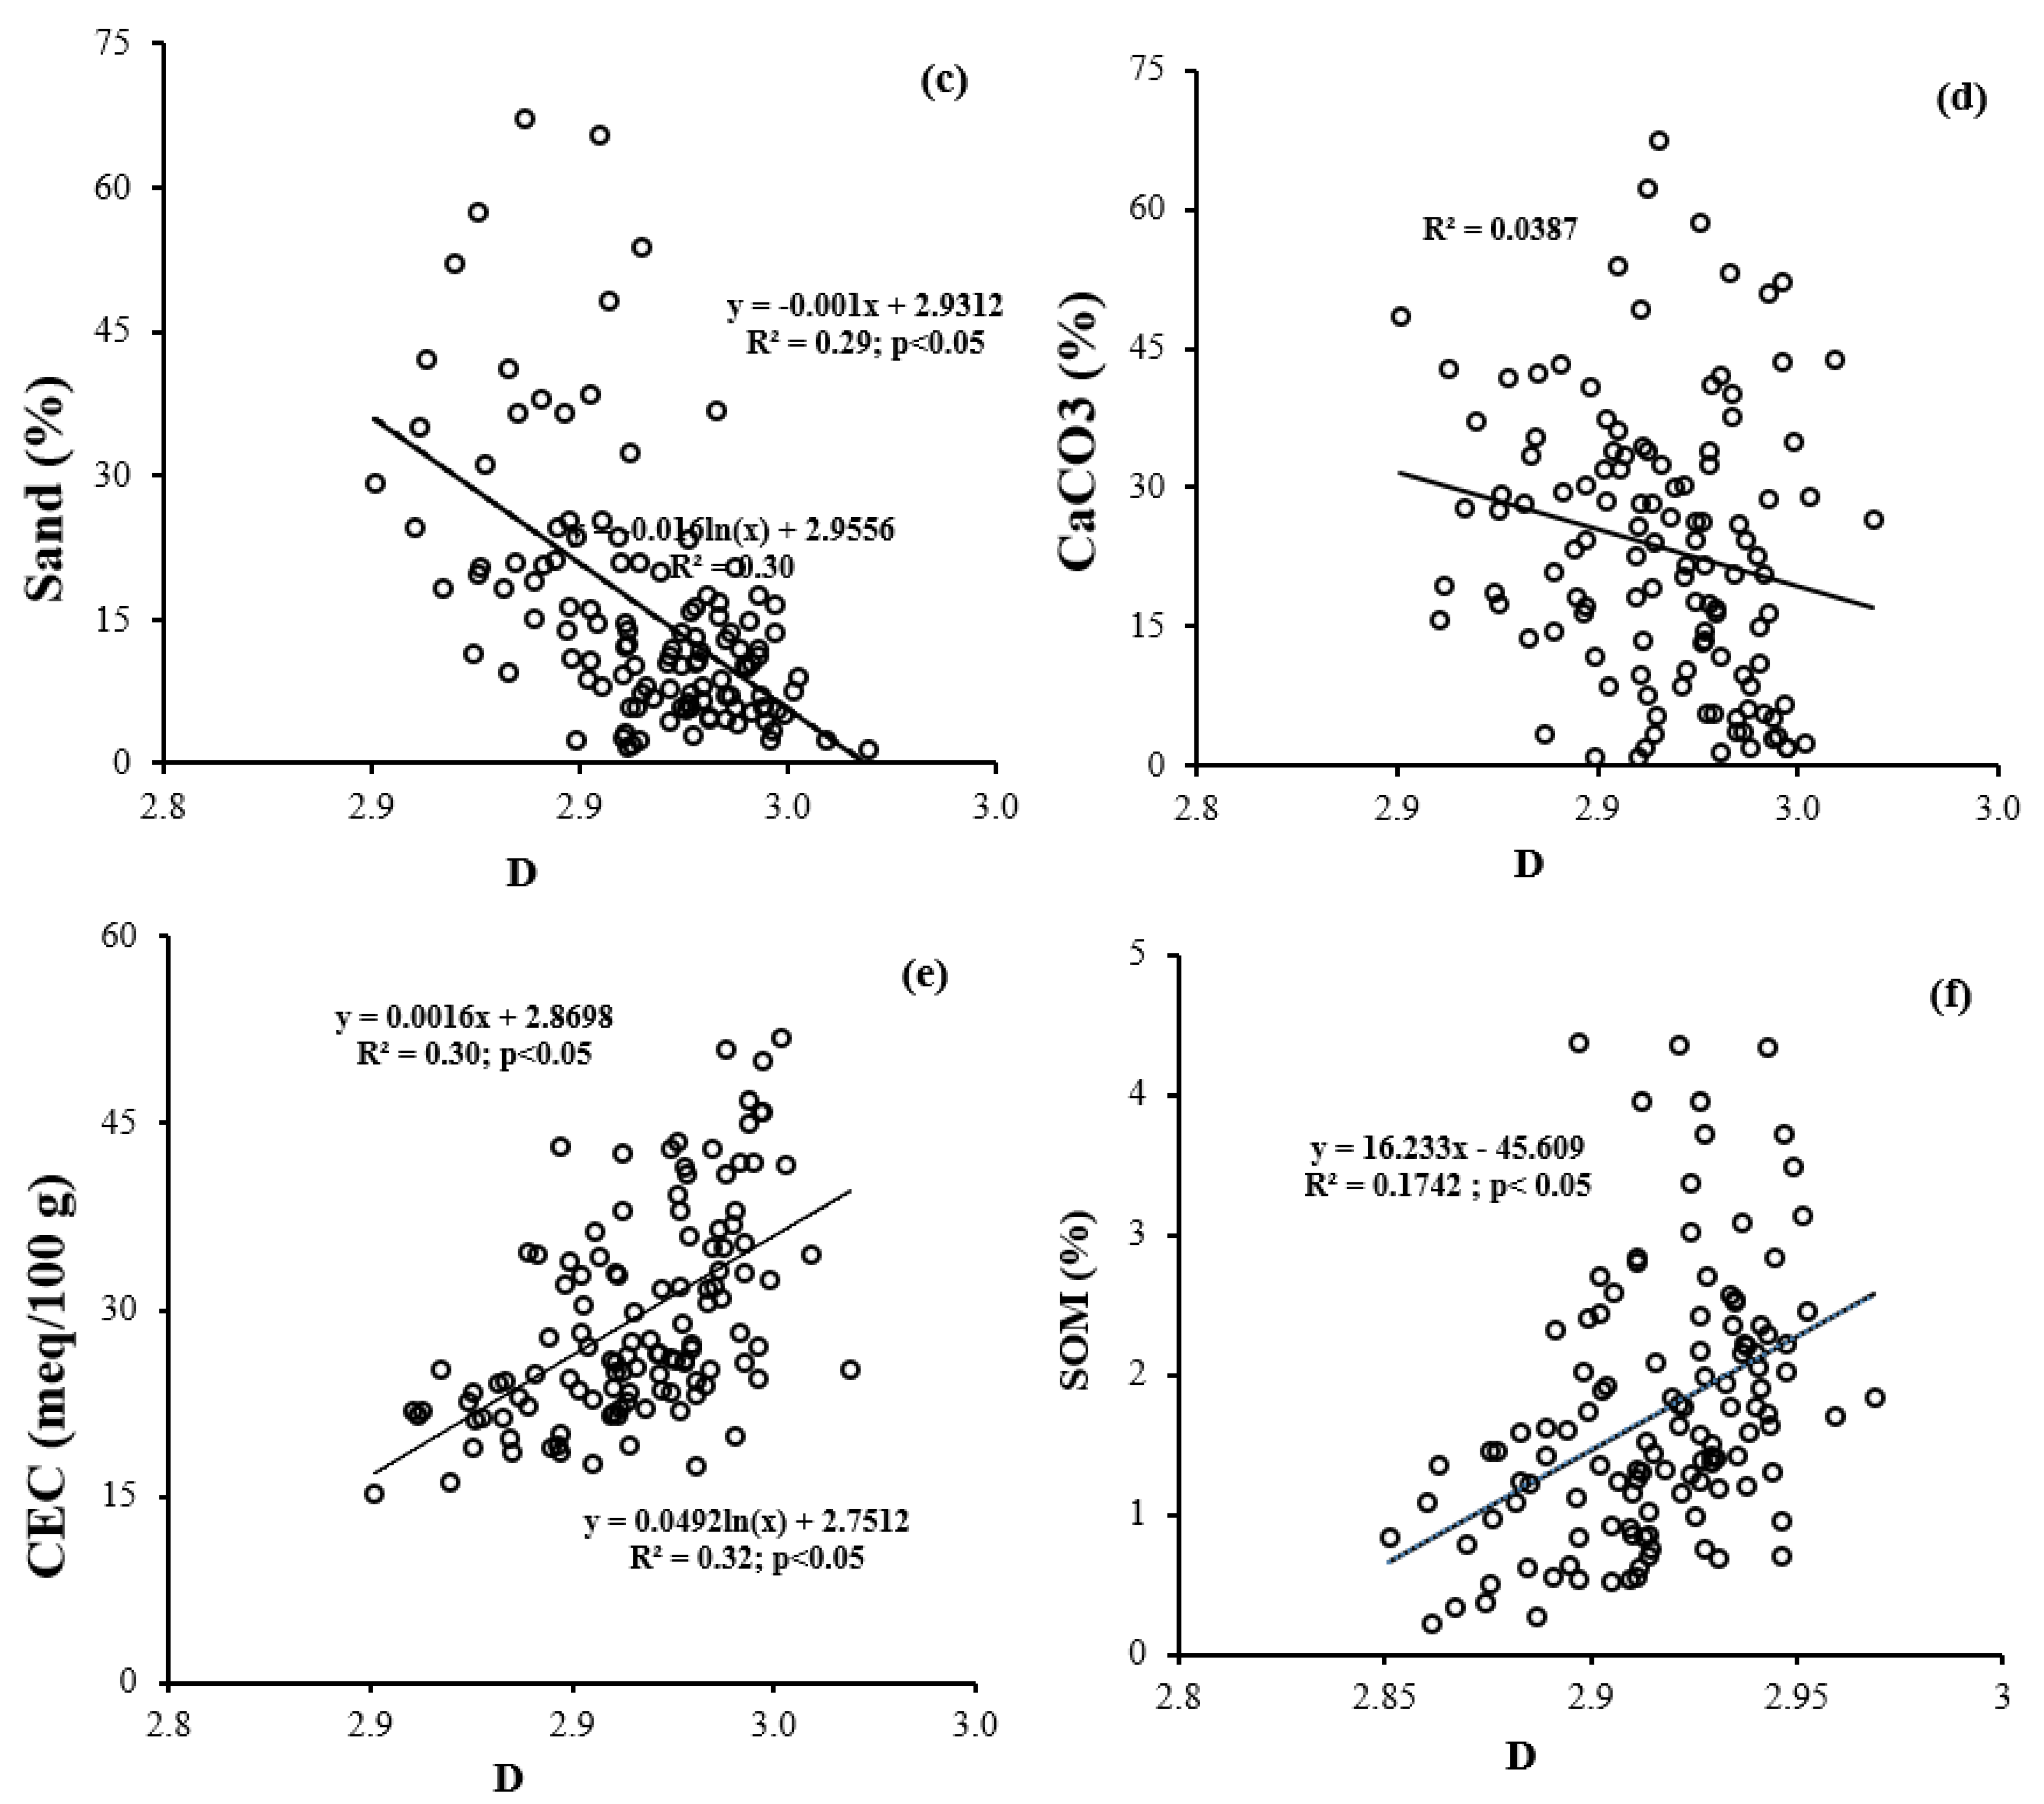
3.2. Fractal Dimension and Soil Properties

The calculated D factor is an appropriate and sensitive index to quantify changes in soil properties [33]. Several relationships, both linear and non-linear, between soil properties and D have been discovered [14]. The relationship between different soil properties and the D of soil PSD is plotted in Figure 3. Increasing the clay content increases the D of soil PSD (Figure 3a). The non-linear (logarithmic) regression model with R2 = 0.88 accurately explains the relationship between clay content and D. Many studies [1,3,11,14] have shown a strong positive relationship between clay and D. In contrast to clay content, both silt and sand content show a negative relationship with the fractal dimension of soil PSD (Figure 3b,c).
The clay particles constitute the reactive fractions of the soil, whereas the sand and silt are relatively inert [34]. However, the relationship of silt content with the D of soil PSD is not significant (R2 = 0.06), while sand content has a strong negative, but slightly non-linear, relationship with the D of soil PSD (R2 = 0.30) compared to the linear relationship (R2 = 0.29). Similarly, Su et al. [14], Zhao et al. [35], Zhao et al. [5], Deng et al. [3], Li et al. [20] and Omidvar [11] all demonstrated a negative relationship between D of soil PSD values and sand content. Unlike our results, Deng et al. [3] and Peng et al. [2] reported a positive relationship between silt content and the D of soil PSD. SOM content also shows a positive non-linear relationship with the D of soil PSD (R2 = 0.32) while there is no clear relationship between CaCO3 and the D of soil PSD (Figure 3d); however, as previously mentioned, CaCO3 was positively correlated with SOM (r = 0.26, Table 2). The D of soil PSD increased with increasing CEC and SOM, but in non-linear (R2 = 0.32) and linear relationships (R2 = 0.17), respectively.

3.3. Fractal Dimension and Land Use

Silty clay loam had the highest cumulative fraction among the six different textural classes followed by silt loam and silty clay loam (Figure 4a). The sandy loam soil class had the lowest cumulative soil fraction. It seems that classes with higher fine particles, including fine silt and clay, have a higher cumulative fraction. Moreover, according to Figure 4b, forest soils have the highest cumulative fraction when compared to agricultural land and pasture which may indicate a higher clay content in forest soils, resulting in an increased D. In addition, as shown in Figure 5, forest soils have higher clay and lower sand content when compared with the other two land uses, indicating lower land degradation in forestland. The findings of the results indicate that, in the forest soil, a higher clay and sand content leads to a lower and higher fractal dimension, respectively. The results are consistent with the results of previous studies by Song et al. [33] and Deng et al. [3].
In the rill and inter-rill erosion of agricultural land, clay mostly accounts for the largest part of the lost materials. Decreasing clay content can show the severity of soil erosion, which also decreases the D of soil PSD. Hence, D can be used as an indicator of the rate of soil erosion in the study area and can be applied as an index for measuring the rate of soil loss, particularly surface soil erosion. Furthermore, to support this idea, forest soils were found to be mainly fine textured classes such as silty clay and silty clay loam (Figure 2). These results show that the clay content influences D, but it also influences the maximum size of the soil particles. These findings are similar to results reported in China by Li et al. [20], Yu et al. [21], and Chen et al. [36]. Additionally, different fertilization methods and the residuals of vegetation contribute to the formation of humus in agricultural lands during the planting process and terrestrial heat flow, which decreases both the clay content and changes the soil PSD [3].
The fractal dimension (D) of the soil particle size for different land-use types is presented in Figure 6. In this study, the D of soil PSD ranges greatly across the three land-use types. The mean D value in the forest (D = 2.931) is significantly higher than that of agricultural land (D = 2.905) and the pasture (D = 2.910); however, there is no significant difference between agricultural land and pasture. When the D is higher, the clay content is found to be higher (a larger surface area), resulting in a stronger bond between particles and bigger soil aggregates, and more nutrients are observed [37]. As shown in Figure 5, forestland has the highest clay content compared with the two other land uses, indicating a lower land degradation potential (a higher D) in forest relative to agriculture and pasture land uses. Figure 6 shows that the soil organic matter in the forest soils is also significantly higher than that found in the agricultural land and pasture; however, there is no significant difference found between pasture and agricultural lands.
As previously mentioned, SOM has a specific surface area that can hold clay particles on the surface, resulting in a decrease in soil erosion, protecting the clay content and increasing the fractal dimension of soil PSD (D). The SOM can be an indicator of soil quality that reflects soil fertility and soil nutrients and is an important property for assessing different land-use patterns [2]. Furthermore, D can be used to show the potential value of soils in agricultural lands. The D increases as fine soil particles such as silt and clay increase in arable lands, whereas the D remains low in forests and pastures. It indicates that agricultural land is more sensitive to fine particles. Soil particle size may be an indicator of the ability of soil to maintain nutrient elements. The fine particles have many nutrients required for plant growth, which can be slowly released for plant consumption. A significant positive correlation between D and SOM implies that the finer soil particles can enhance the binding power of SOM, which is a principal indicator of soil quality [20].

4. Conclusions

This research was conducted to study the effect of different types of land use on the fractal dimension of soil particle size distribution (D) in the Fars Province, Iran. Our results show that clay content had the strongest correlation (r = 0.93) with the D of soil PSD followed by sand content with r = −0.54 and CEC with r = 0.51. In addition, it was found that soil organic matter content played a significant role in soil aggregate size and stability and had a major influence on soil PSD, and, subsequently, on the fractal dimension of the soil particle size. The results also reveal that forestlands with the largest amount of SOM content had the highest fractal dimension (D = 2.931) when compared with agricultural land (D = 2.905) and pastures (D = 2.910). We concluded that soil particles, particularly fine particles, are noticeably influenced by land use, as forests with the lowest disturbance and the highest soil organic matter had the highest D and the lowest land degradation compared with pastures and agricultural lands.

Author Contributions

Conceptualization, M.T., A.H., M.A., and S.F.A.; methodology, M.T., A.H., and S.F.A.; software, Y.O. and M.A.; validation, M.T., A.H., M.A., S.F.A., and Y.O.; formal analysis, M.T., A.H., and S.F.A.; investigation, M.T., A.H., Y.O., B.I., and S.F.A.; resources, M.T. and M.A.; data curation, M.T. and M.A.; writing—original draft preparation, M.T., A.H., and S.F.A.; writing—review and editing, Y.O., and B.I.; visualization, M.T., A.H., S.F.A., B.I., and Y.O.; supervision, Y.O. and S.F.A.; project administration, M.T. and M.A. All authors have read and agreed to the published version of the manuscript.

Funding

This research received no external funding.

Institutional Review Board Statement

Not applicable.

Informed Consent Statement

Not applicable.

Data Availability Statement

Not applicable.

Conflicts of Interest

The authors declare no conflict of interest.

References

  1. Mohammadi, M.; Shabanpour, M.; Mohammadi, M.H.; Davatgar, N. Characterizing Spatial Variability of Soil Textural Fractions and Fractal Parameters Derived from Particle Size Distributions. Pedosphere 2019, 29, 224–234. [Google Scholar] [CrossRef]
  2. Peng, G.; Xiang, N.; Lv, S.; Zhang, G. Fractal characterization of soil particle-size distribution under different land-use patterns in the Yellow River Delta Wetland in China. J. Soils Sediments 2014, 14, 1116–1122. [Google Scholar] [CrossRef]
  3. Deng, Y.; Cai, C.; Xia, D.; Ding, S.; Chen, J. Fractal features of soil particle size distribution under different land-use patterns in the alluvial fans of collapsing gullies in the hilly granitic region of southern China. PLoS ONE 2017, 12, e0173555. [Google Scholar] [CrossRef] [PubMed] [Green Version]
  4. Xu, G.; Li, Z.; Li, P. Fractal features of soil particle-size distribution and total soil nitrogen distribution in a typical watershed in the source area of the middle Dan River, China. Catena 2013, 101, 17–23. [Google Scholar] [CrossRef]
  5. Zhao, W.; Cui, Z.; Ma, H. Fractal features of soil particle-size distributions and their relationships with soil properties in gravel-mulched fields. Arab. J. Geosci. 2017, 10, 1–7. [Google Scholar] [CrossRef]
  6. Wang, X.; Li, M.-H.; Liu, S.; Liu, G. Fractal characteristics of soils under different land-use patterns in the arid and semiarid regions of the Tibetan Plateau, China. Geoderma 2006, 134, 56–61. [Google Scholar] [CrossRef]
  7. Tyler, S.W.; Wheatcraft, S.W. Fractal Scaling of Soil Particle-Size Distributions: Analysis and Limitations. Soil Sci. Soc. Am. J. 1992, 56, 362–369. [Google Scholar] [CrossRef]
  8. Huang, G.; Zhang, R. Evaluation of soil water retention curve with the pore–solid fractal model. Geoderma 2005, 127, 52–61. [Google Scholar] [CrossRef]
  9. Ghanbarian-Alavijeh, B.; Millán, H. The relationship between surface fractal dimension and soil water content at permanent wilting point. Geoderma 2009, 151, 224–232. [Google Scholar] [CrossRef]
  10. Mahdi, C.M.; Ghaleno, M.R.D. Evaluating fractal dimension of the soil particle size distributions and soil water retention curve obtained from soil texture components. Arch. Agron. Soil Sci. 2020, 66, 1668–1678. [Google Scholar] [CrossRef]
  11. Omidvar, E. Fractal analysis of the infiltration curve and soil particle size in a semi-humid watershed. Eur. J. Soil Sci. 2021, 72, 1373–1394. [Google Scholar] [CrossRef]
  12. Martínez-Mena, M.; Deeks, L.; Williams, A. An evaluation of a fragmentation fractal dimension technique to determine soil erodibility. Geoderma 1999, 90, 87–98. [Google Scholar] [CrossRef]
  13. Fu, H.; Pei, S.; Wan, C.; Sosebee, R.E. Fractal Dimension of Soil Particle Size Distribution Along an Altitudinal Gradient in the Alxa Rangeland, Western Inner Mongolia. Arid Land Res. Manag. 2009, 23, 137–151. [Google Scholar] [CrossRef]
  14. Su, Y.Z.; Zhao, H.L.; Zhao, W.Z.; Zhang, T.H. Fractal features of soil particle size distribution and the implication for indicating desertification. Geoderma 2004, 122, 43–49. [Google Scholar] [CrossRef]
  15. Bai, Y.; Qin, Y.; Lu, X.; Zhang, J.; Chen, G.; Li, X. Fractal dimension of particle-size distribution and their relationships with alkalinity properties of soils in the western Songnen Plain, China. Sci. Rep. 2020, 10, 20603. [Google Scholar] [CrossRef]
  16. Hu, H.; Tian, F.; Hu, H. Soil particle size distribution and its relationship with soil water and salt under mulched drip irrigation in Xinjiang of China. Sci. China Technol. Sci. 2011, 54, 1568–1574. [Google Scholar] [CrossRef]
  17. Li, Z.; Wang, Z. Experimental study on the relation between the fractal characteristics and solute transport parameters of sandy soil. J. Soils Sediments 2020, 20, 3181–3191. [Google Scholar] [CrossRef]
  18. Gao, G.-L.; Ding, G.-D.; Wu, B.; Zhang, Y.-Q.; Qin, S.-G.; Zhao, Y.-Y.; Bao, Y.-F.; Liu, Y.-D.; Wan, L.; Deng, J.-F. Fractal scaling of particle size distribution and relationships with topsoil properties affected by biological soil crusts. PLoS ONE 2014, 9, e88559. [Google Scholar] [CrossRef]
  19. Keller, T.; Håkansson, I. Estimation of reference bulk density from soil particle size distribution and soil organic matter content. Geoderma 2010, 154, 398–406. [Google Scholar] [CrossRef]
  20. Li, K.; Yang, H.; Han, X.; Xue, L.; Lv, Y.; Li, J.; Fu, Z.; Li, C.; Shen, W.; Guo, H.; et al. Fractal features of soil particle size distributions and their potential as an indicator of Robinia pseudoacacia invasion. Sci. Rep. 2018, 8, 7075. Available online: https://www.nature.com/articles/s41598-018-25543-0 (accessed on 15 May 2021). [CrossRef]
  21. Yu, J.; Lv, X.; Bin, M.; Wu, H.; Du, S.; Zhou, M.; Yang, Y.; Han, G. Fractal features of soil particle size distribution in newly formed wetlands in the Yellow River Delta. Sci. Rep. 2015, 5, 10540. [Google Scholar] [CrossRef] [PubMed] [Green Version]
  22. Zhang, H.; Xie, J.; Han, J.; Nan, H.; Guo, Z. Response of Fractal Analysis to Soil Quality Succession in Long-Term Compound Soil Improvement of Mu Us Sandy Land, China. Math. Probl. Eng. 2020, 2020, 1–7. [Google Scholar] [CrossRef]
  23. Doublet, J.; Francou, C.; Pétraud, J.P.; Dignac, M.F.; Poitrenaud, M.; Houot, S. Distribution of C and N mineralization of a sludge compost within particle-size fractions. Bioresour. Technol. 2010, 101, 1254–1262. [Google Scholar] [CrossRef] [PubMed]
  24. Qi, F.; Zhang, R.; Liu, X.; Niu, Y.; Zhang, H.; Li, H.; Li, J.; Wang, B.; Zhang, G. Soil particle size distribution characteristics of different land-use types in the Funiu mountainous region. Soil Tillage Res. 2018, 184, 45–51. [Google Scholar] [CrossRef]
  25. Nelson, D.W.; Sommers, L.E. Total Carbon, Organic Carbon, and Organic Matter. In Methods of Soil Analysis; John Wiley & Sons, Ltd.: Hoboken, NJ, USA, 2018; pp. 961–1010. [Google Scholar]
  26. Gee, G.W.; Bauder, J.W.; Klute, A. Methods of Soil Analysis, Part 1, Physical and Mineralogical Methods; Soil Science Society of America, American Society of Agronomy: Madison, WI, USA, 1986. [Google Scholar]
  27. Xu, G.; Li, Z.; Li, P.; Zhang, T.; Cheng, S. Spatial variability of soil available phosphorus in a typical watershed in the source area of the middle Dan River, China. Env. Earth Sci. 2014, 71, 3953–3962. [Google Scholar] [CrossRef]
  28. Ostovari, Y.; Ghorbani-Dashtaki, S.; Kumar, L.; Shabani, F. Soil erodibility and its prediction in semi-arid regions. Arch. Agron. Soil Sci. 2019, 65, 1688–1703. [Google Scholar] [CrossRef]
  29. Ostovari, Y.; Moosavi, A.A.; Pourghasemi, H.R. Soil loss tolerance in calcareous soils of a semiarid region: Evaluation, prediction, and influential parameters. Land Degrad. Dev. 2020, 31, 2156–2167. [Google Scholar] [CrossRef]
  30. Ostovari, Y.; Ghorbani-Dashtaki, S.; Bahrami, H.-A.; Naderi, M.; Dematte, J.A.M.; Kerry, R. Modification of the USLE K factor for soil erodibility assessment on calcareous soils in Iran. Geomorphology 2016, 273, 385–395. [Google Scholar] [CrossRef]
  31. Li, J.; Sang, C.; Yang, J.; Qu, L.; Xia, Z.; Sun, H.; Jiang, P.; Wang, X.; He, H.; Wang, C. Stoichiometric imbalance and microbial community regulate microbial elements use efficiencies under nitrogen addition. Soil Biol. Biochem. 2021, 156, 108207. [Google Scholar] [CrossRef]
  32. Ostovari, Y.; Ghorbani-Dashtaki, S.; Bahrami, H.A.; Abbasi, M.; Dematte, J.A.M.; Arthur, E.; Panagos, P. Towards prediction of soil erodibility, SOM and CaCO3 using laboratory Vis-NIR spectra: A case study in a semi-arid region of Iran. Geoderma 2018, 314, 102–112. [Google Scholar] [CrossRef]
  33. Song, Z.; Zhang, C.; Liu, G.; Qu, D.; Xue, S. Fractal Feature of Particle-Size Distribution in the Rhizospheres and Bulk Soils during Natural Recovery on the Loess Plateau, China. PLoS ONE 2015, 10, e0138057. [Google Scholar] [CrossRef] [PubMed]
  34. Paz-Ferreiro, J.; Vázquez, E.V.; Miranda, J. Assessing soil particle-size distribution on experimental plots with similar texture under different management systems using multifractal parameters. Geoderma 2010, 160, 47–56. [Google Scholar] [CrossRef]
  35. Zhao, S.; Su, J.; Yang, Y.; Liu, N.; Wu, J.; Shangguan, Z. A Fractal Method of Estimating Soil Structure Changes Under Different Vegetations on Ziwuling Mountains of the Loess Plateau, China. Agric. Sci. China 2006, 5, 530–538. [Google Scholar] [CrossRef]
  36. Chen, W.; Chang, H.; Liu, R. Fractal features of soil particle size distributions and their implications for indicating enclosure management in a semiarid grassland ecosystem. Pol. J. Ecol. 2020, 68, 132–144. [Google Scholar] [CrossRef]
  37. Liu, Y.; Gong, Y.; Wang, X.; Hu, Y. Volume fractal dimension of soil particles and relationships with soil physical-chemical properties and plant species diversity in an alpine grassland under different disturbance degrees. J. Arid Land 2013, 5, 480–487. [Google Scholar] [CrossRef]
Figure 1. Location of the Fars Province in Iran (a) and average monthly precipitation and temperature of the Fars Province (b).
Land 11 02093 g001
Figure 2. Soil textural classes of the soil samples under different land uses.
Land 11 02093 g002
Figure 3. Relationship between fractal dimension (D) and soil properties, (a) clay (%), (b) silt (%), (c) sand (%), (d) CaCO3 (%), (e) CEC (meq/100g) and (f) SOM (%).
Land 11 02093 g003aLand 11 02093 g003b
Figure 4. Log-long plots for PSD of sampled soils, (a) soil texture, (b) land type.
Land 11 02093 g004
Figure 5. Soil particles in different land uses.
Land 11 02093 g005
Figure 6. The fractal dimension of soil particle size (D) and soil organic matter (SOM) in different types of land use.
Land 11 02093 g006
Table 1. Soil property summary statistics (n = 120).
Land UsePropertyUnitMeanMinimumMaximumStd. Dev.Coef. Var.
AgriculturepH 7.358.487.790.293.71
SOM%0.283.961.631.0061.47
CECMeq/100 g15.3043.6930.487.6925.22
CaCO3%3.5162.2729.5613.9647.22
Sand%2.5067.3223.1216.7772.55
Clay%8.0650.3823.0110.8046.95
Silt%21.4073.4153.8812.9223.98
D 2.852.962.910.020.84
PasturepH 7.208.117.730.243.15
SOM%0.234.381.581.0365.28
CECMeq/100 g16.2443.3023.814.9320.72
CaCO3%1.0358.5922.7513.9161.14
Sand%1.6652.1814.7112.3083.60
Clay%11.0861.4627.8110.3937.35
Silt%36.7477.2957.489.2516.08
D 2.862.972.910.020.82
ForestpH 7.087.887.480.192.52
SOM%1.023.732.000.6231.13
CECMeq/100 g22.2252.0034.178.5825.12
CaCO3%2.0767.4318.3415.0081.79
Sand%2.9820.5210.424.6544.62
Clay%19.1446.3534.816.8019.53
Silt%38.9571.3254.777.2713.27
D 2.882.952.930.010.44
Table 2. Correlation coefficient matrix for soil properties in the study region.
pHSOMCECCaCO3SandClaySilt
SOM−0.111.00
CEC−0.26 *0.55 *1.00
CaCO30.76 *0.16−0.25 *1.00
Sand0.22 *−0.32 *−0.27 *0.22 *1.00
Clay−0.170.40 *0.52 *0.22 *−0.66 *1.00
Silt−0.11−0.00−0.18−0.06−0.62 *−0.181.00
D−0.160.43 *0.51 *−0.20 *−0.54 *0.93 *−0.26 *
* significant at 95% level.
Publisher’s Note: MDPI stays neutral with regard to jurisdictional claims in published maps and institutional affiliations.

