

Spatiotemporal Evolution Characteristics of Carbon Emissions from Industrial Land in Anhui Province, China


Abstract
:1. Introduction
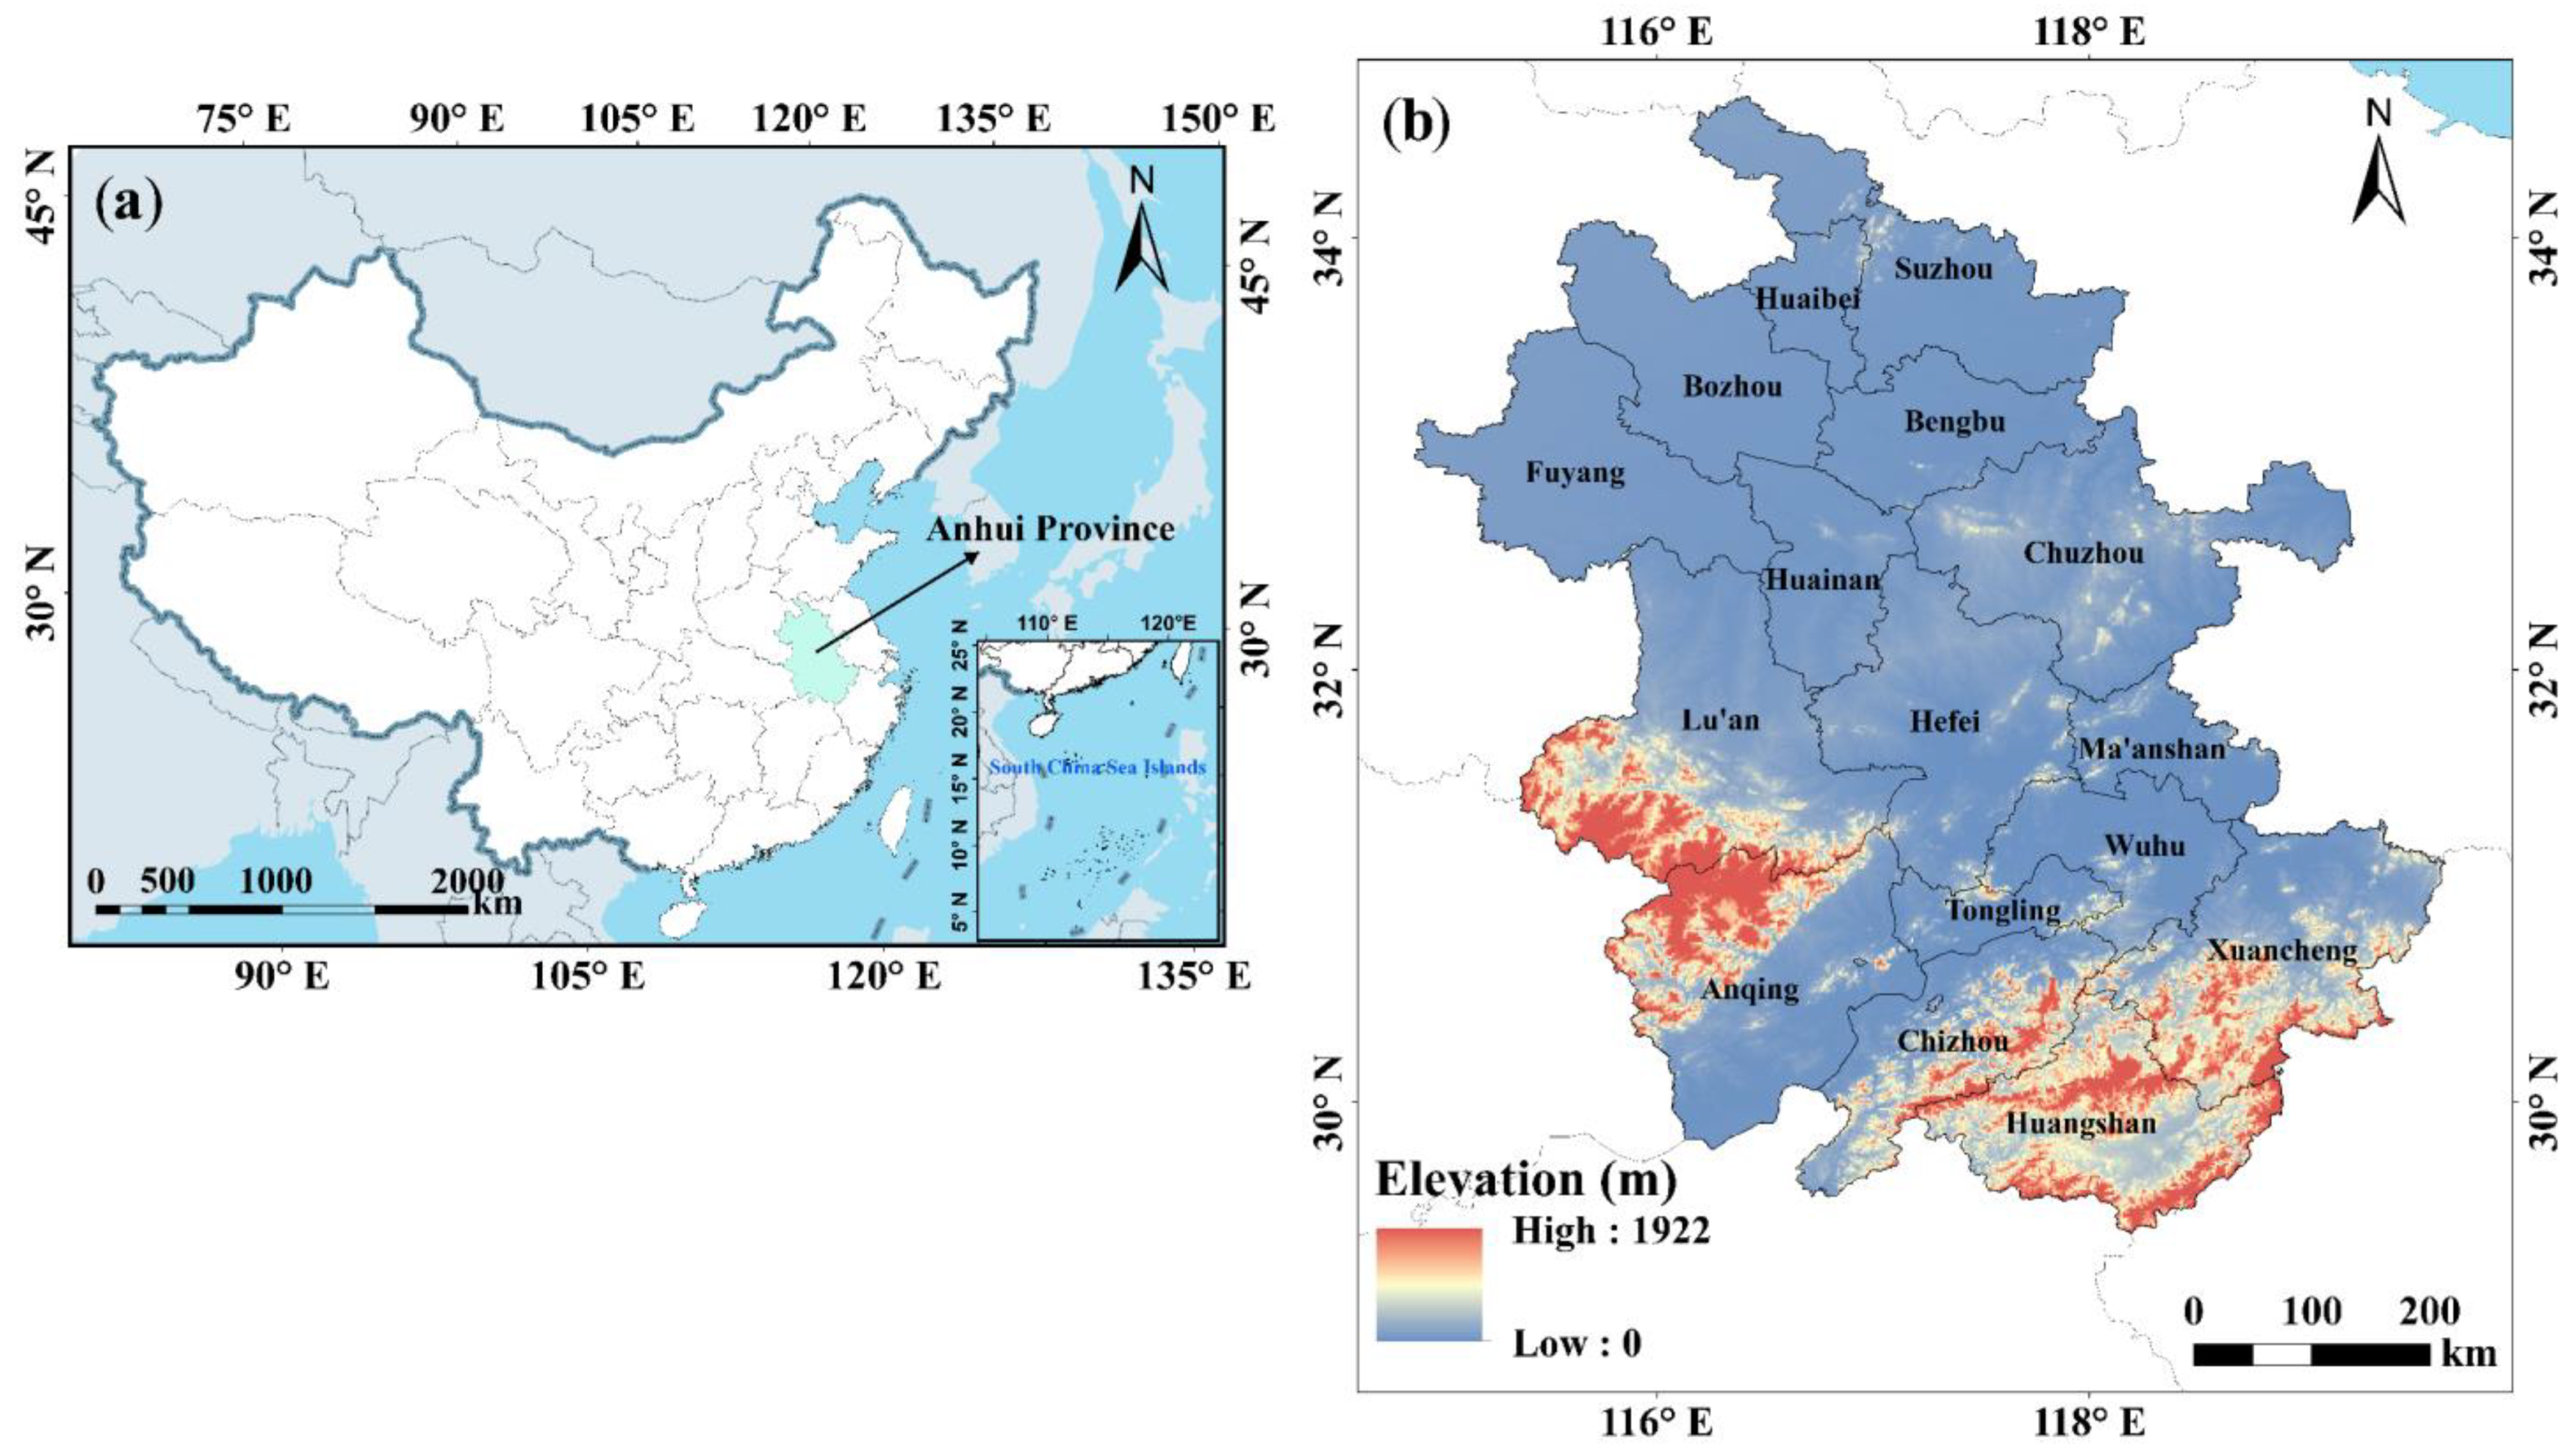
2. Study Area
3. Materials and Methods
3.1. Data Collection
3.2. Calculation Methods of Carbon Emissions
3.3. Standard Deviational Ellipse Method
4. Results and Discussion
4.1. Evolution Characteristics at the Provincial Level
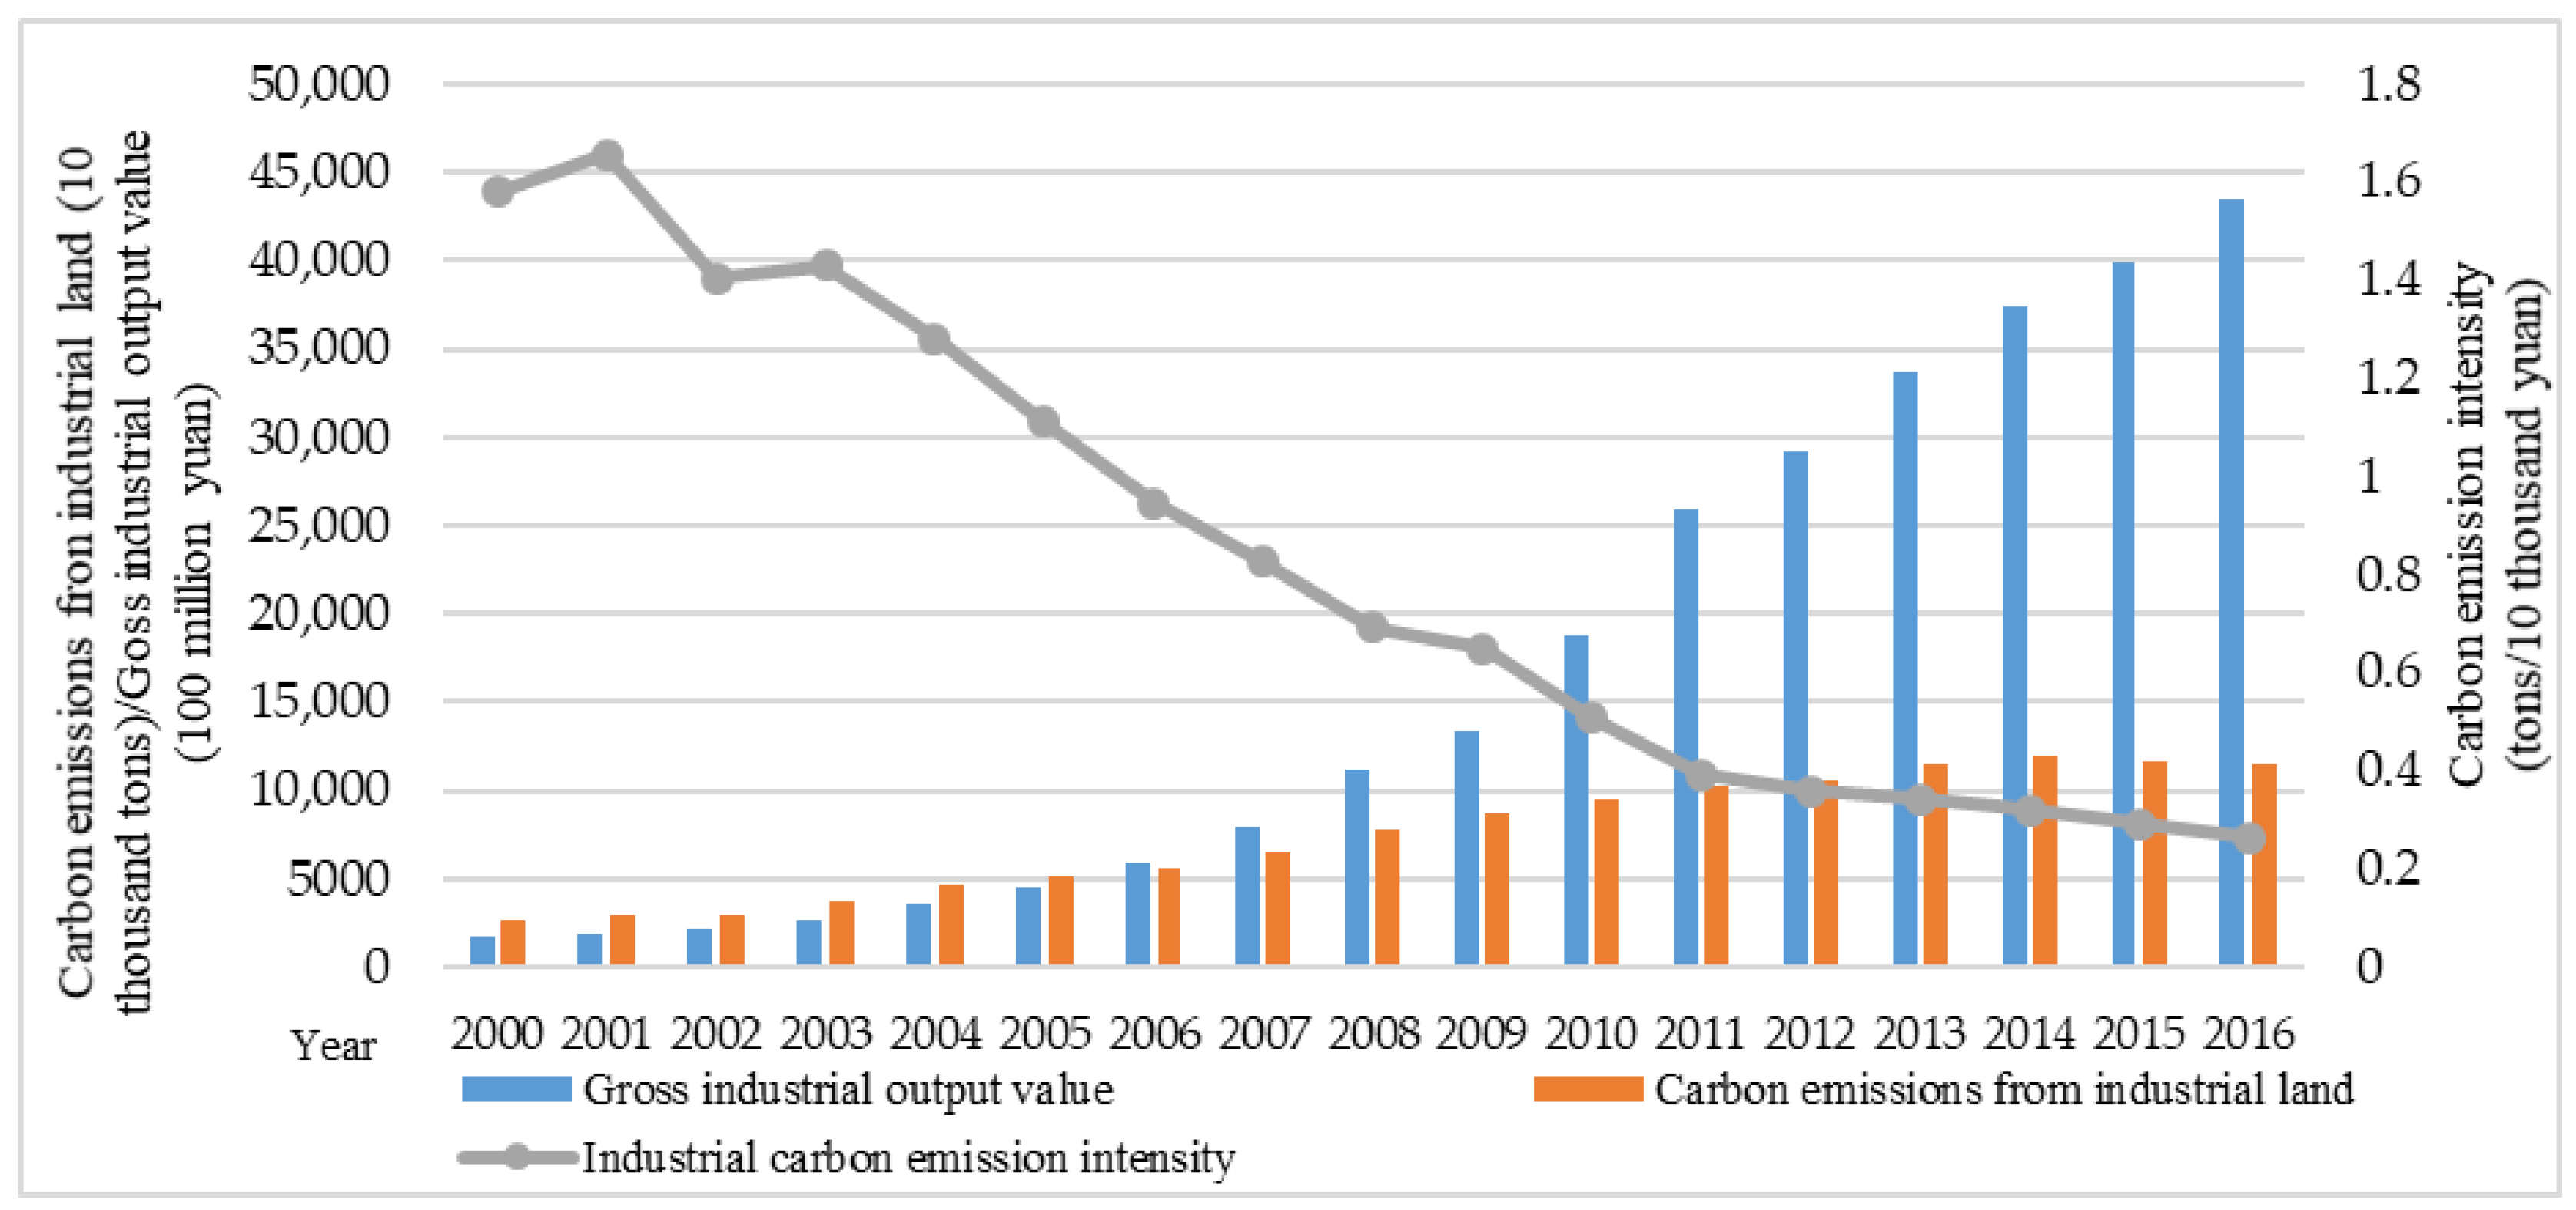
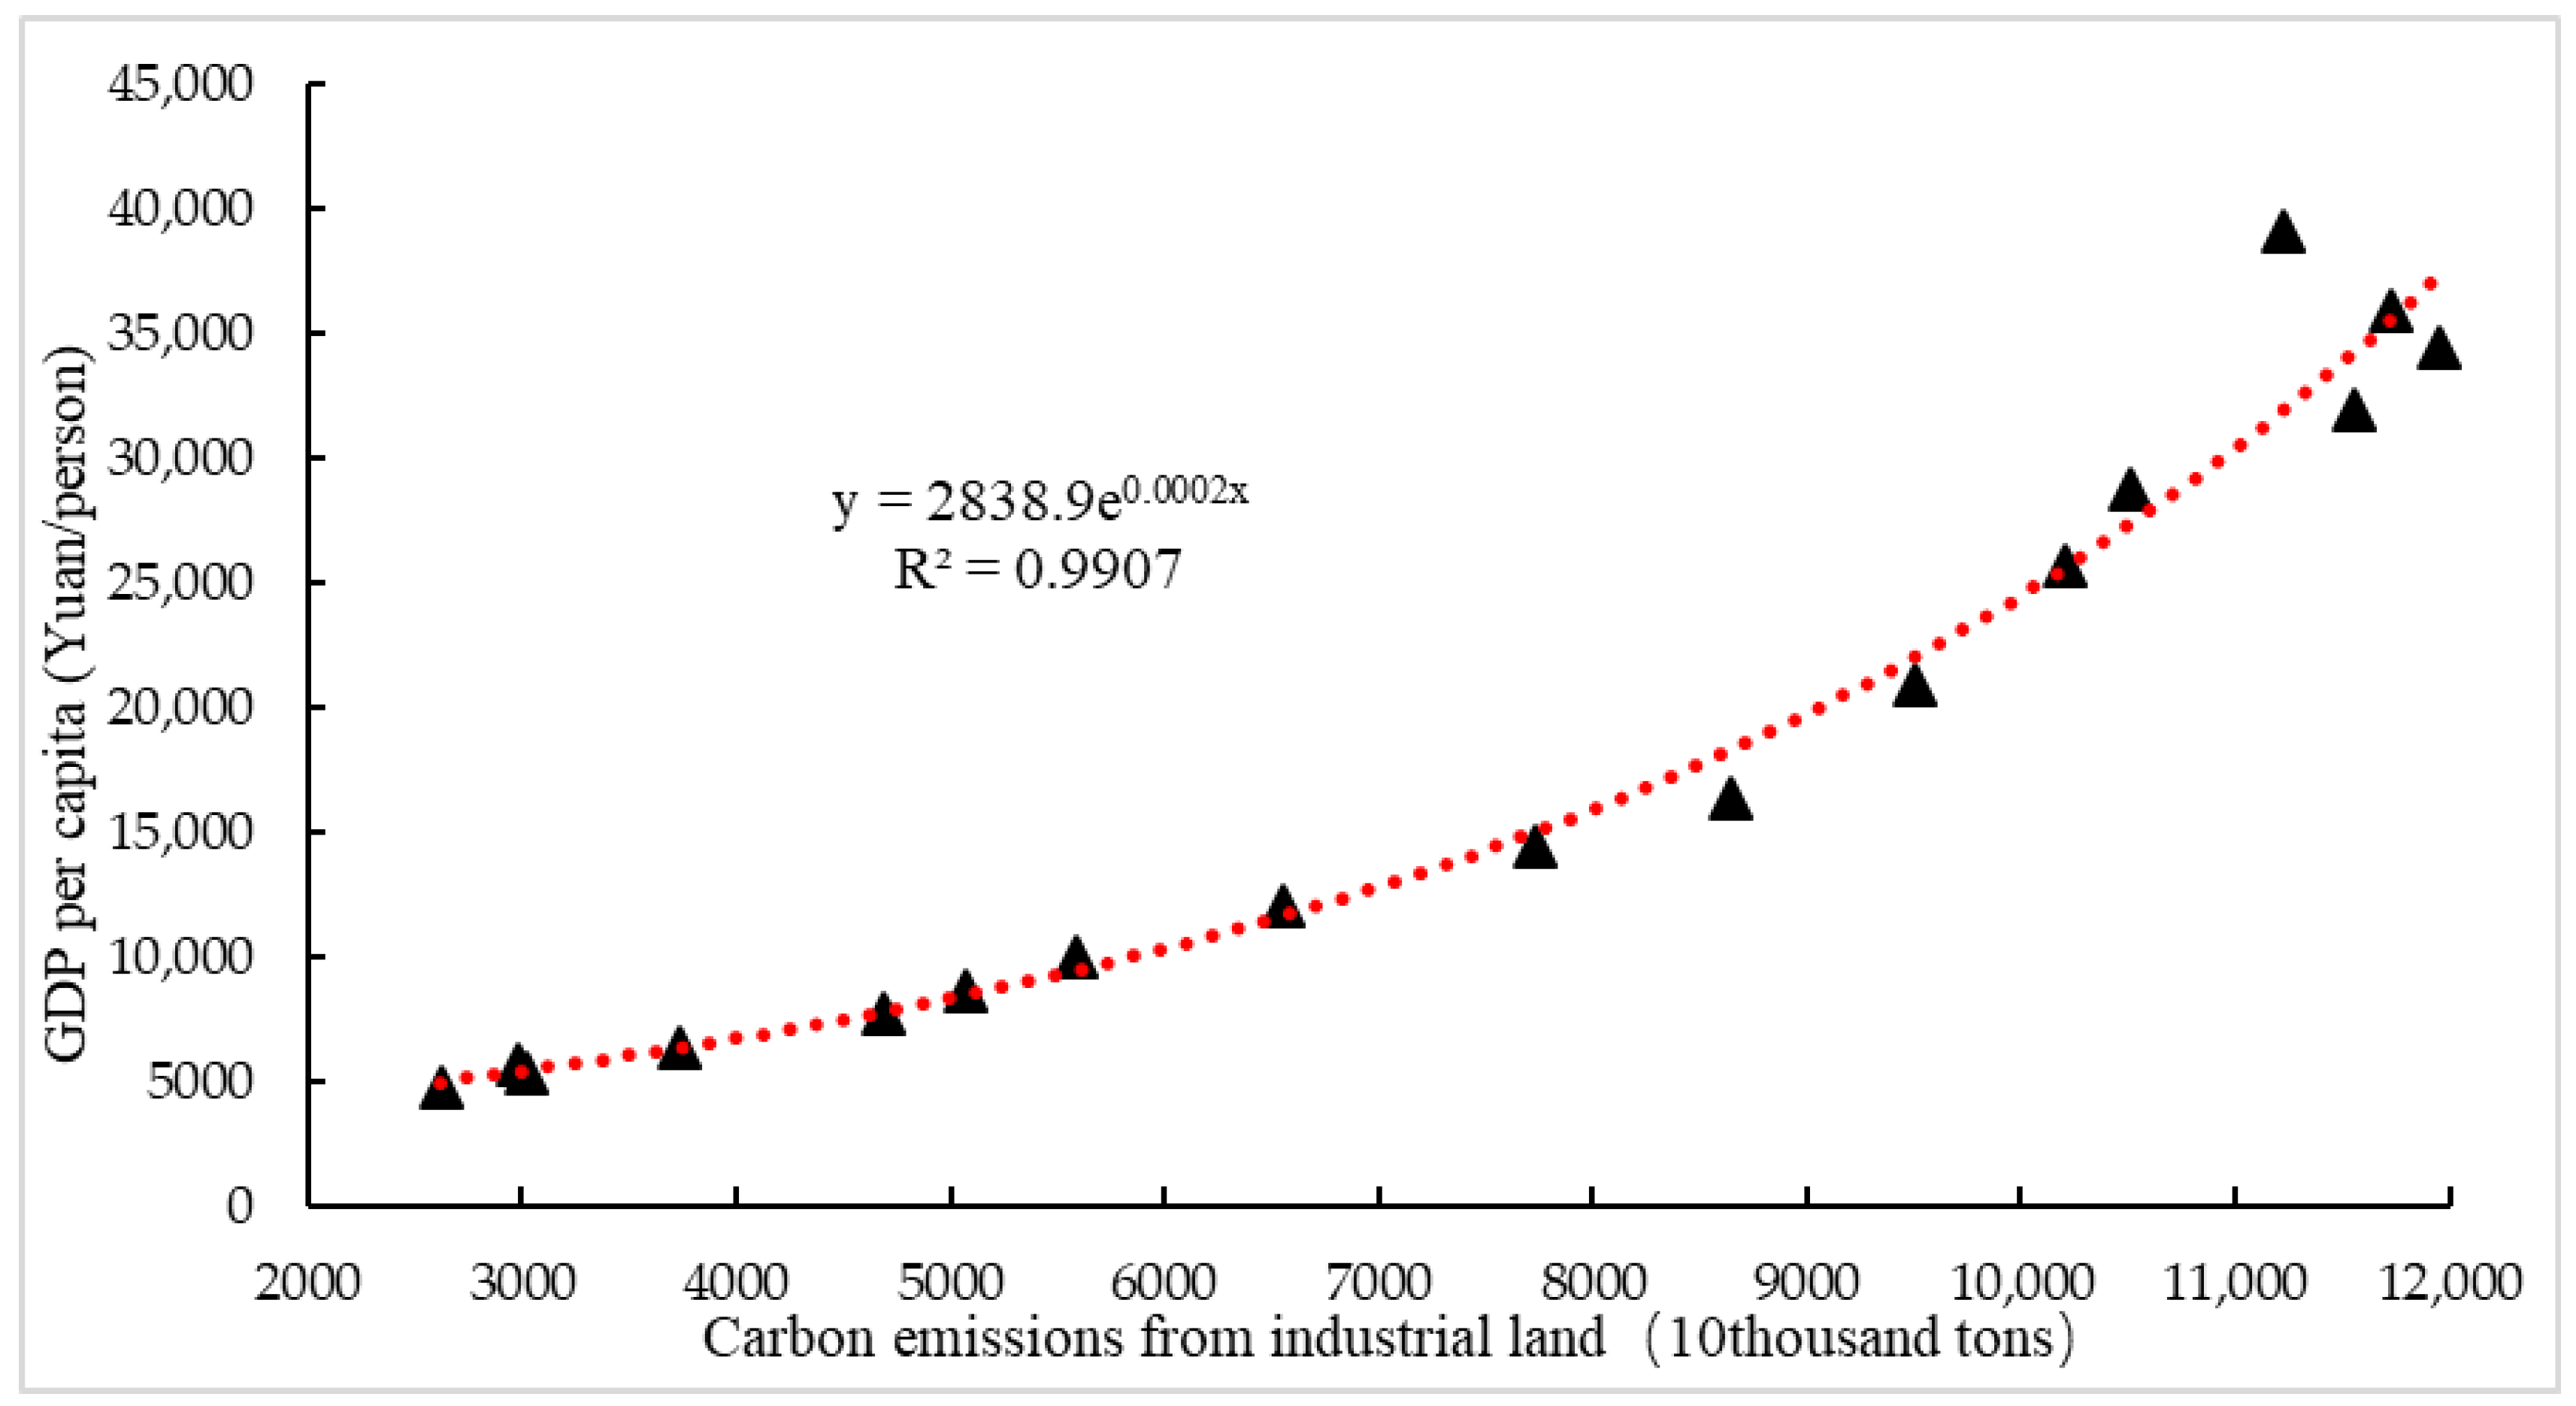
4.1.1. Relationship between CEIL and Economic Development
4.1.2. Time Series Relationship between CEIL and Structure of Energy Consumption
4.2. Evolution Characteristics at the City Level
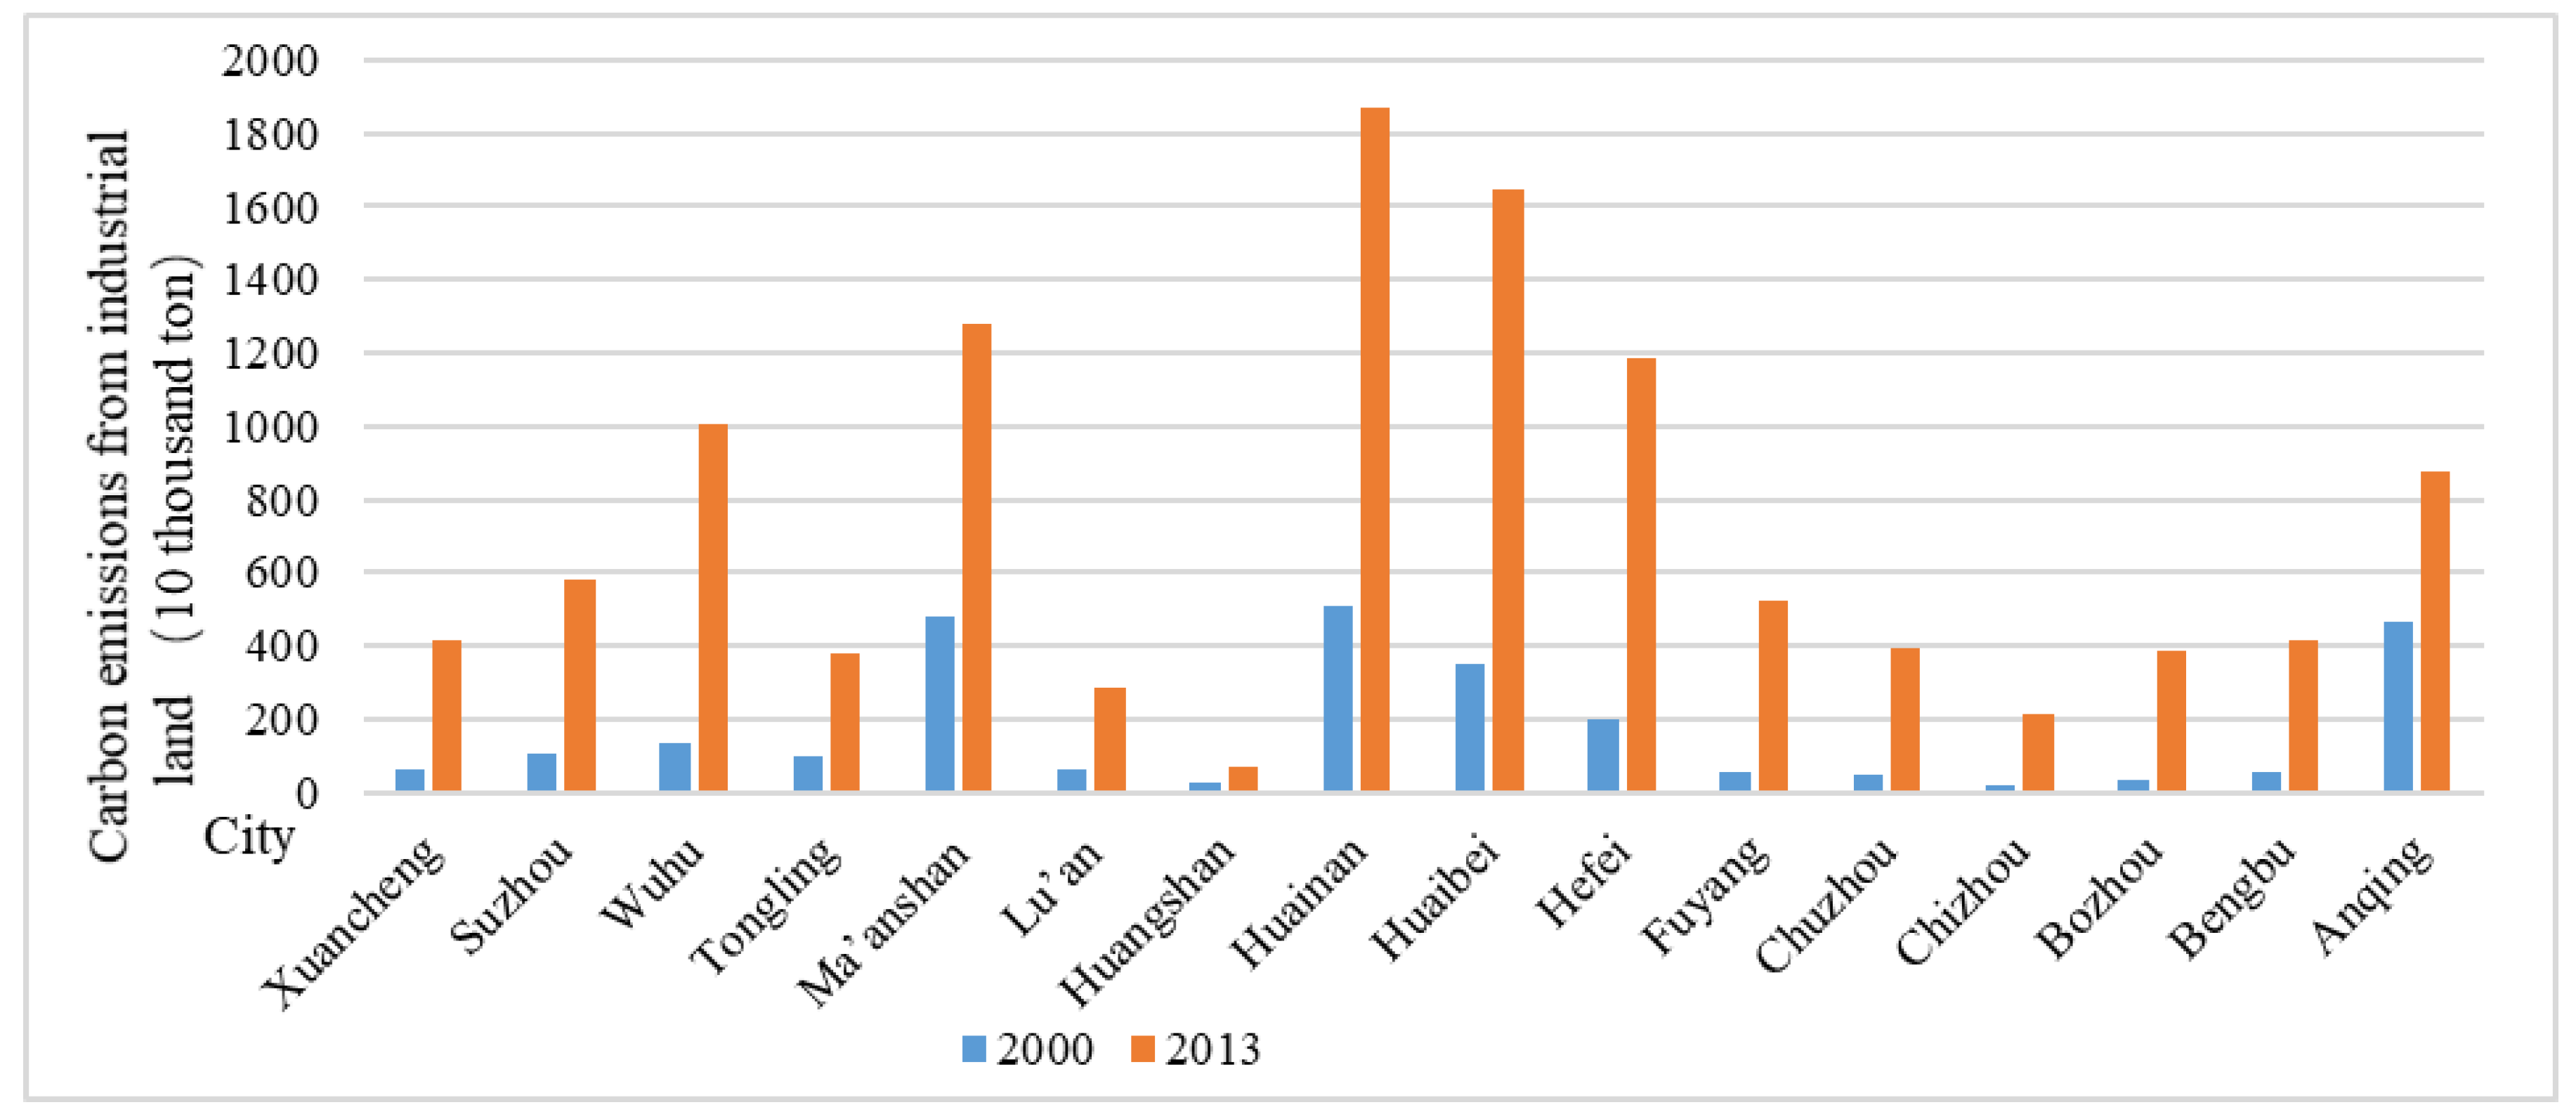
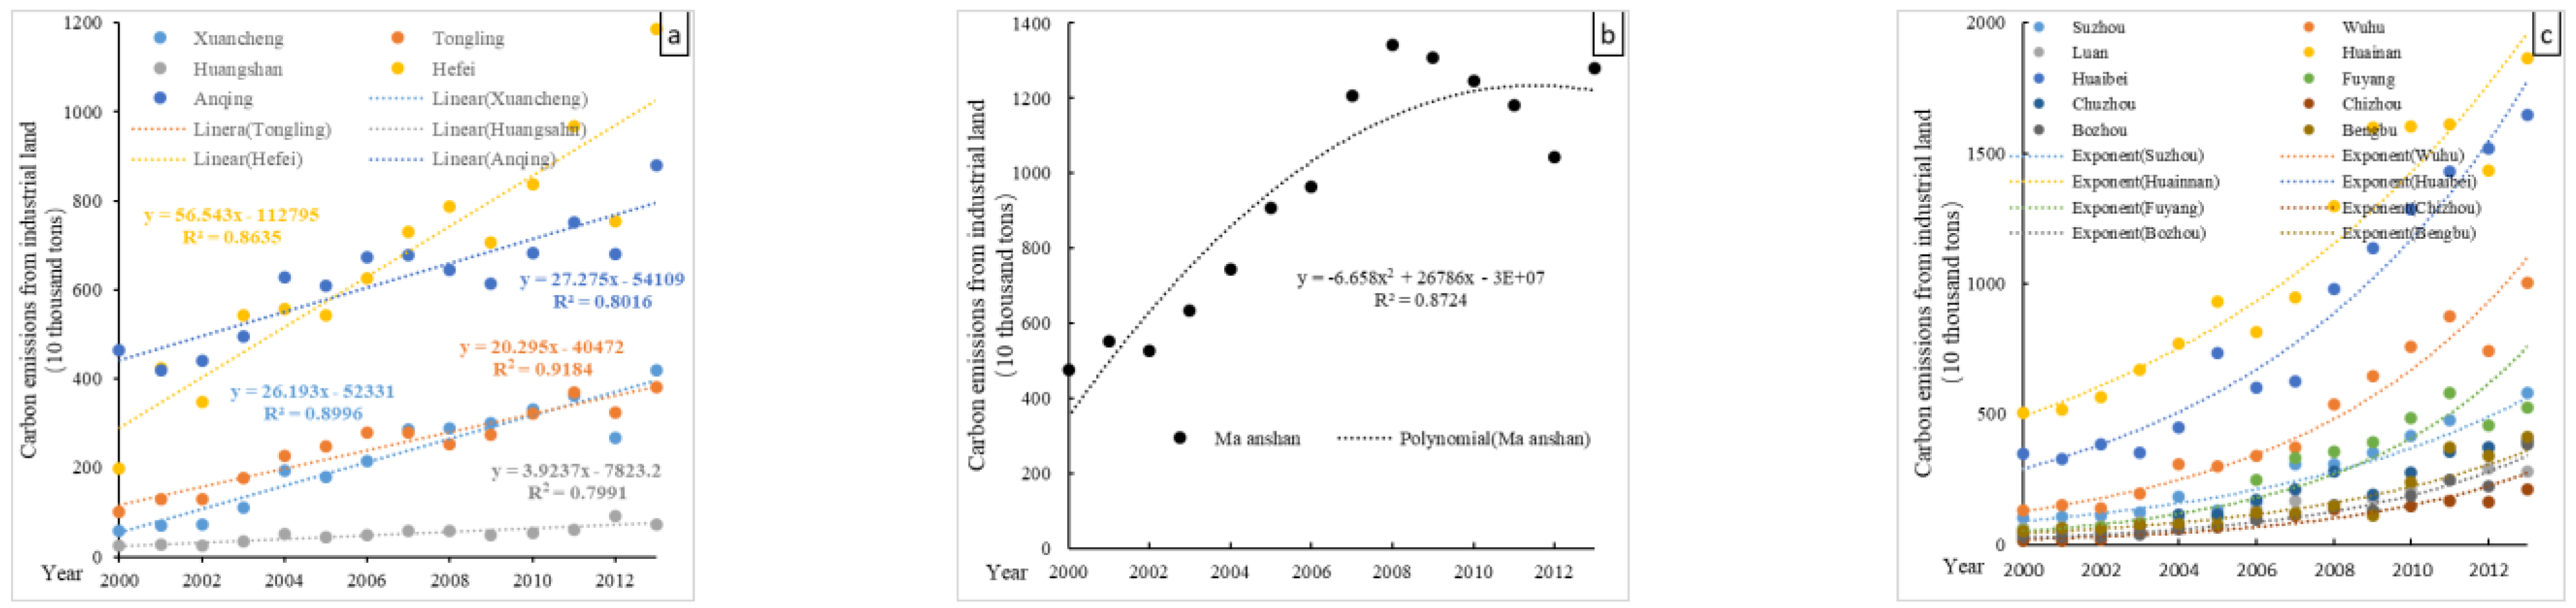
4.2.1. Spatiotemporal Characteristics of CEIL
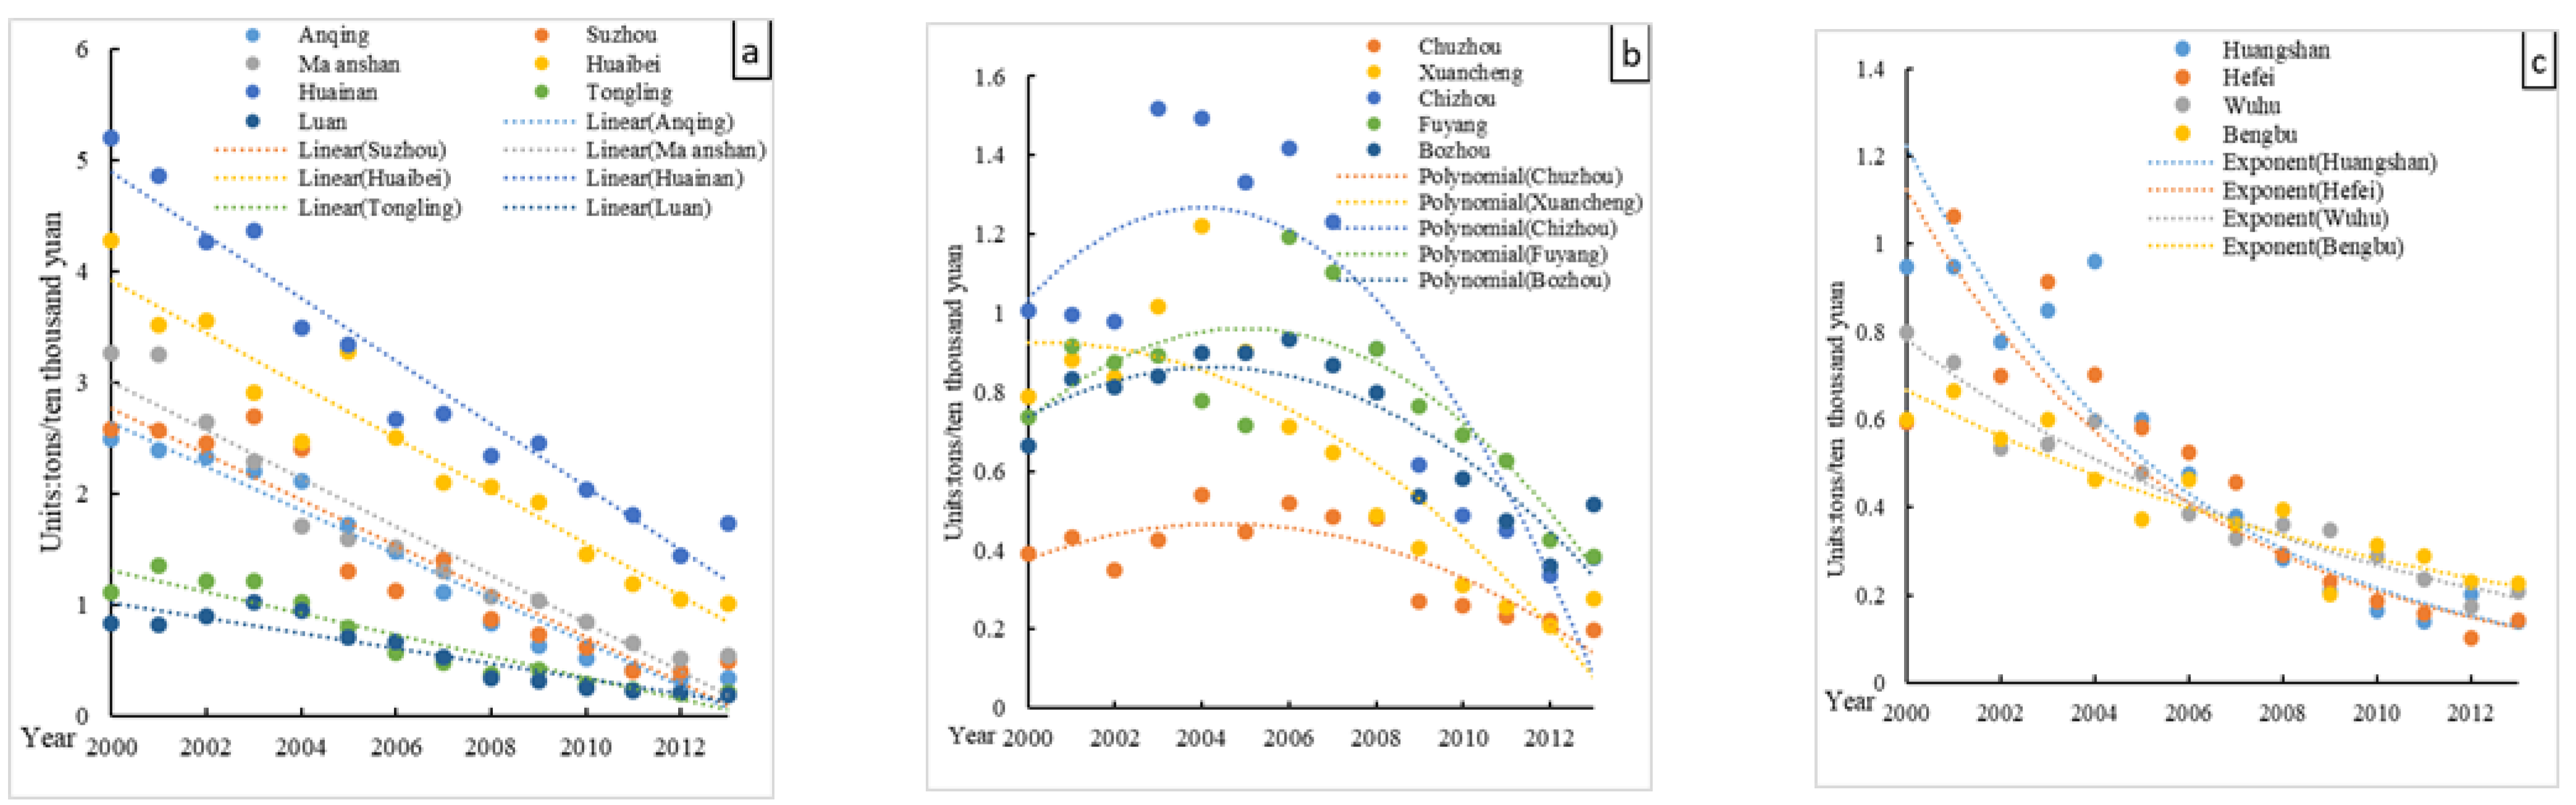
4.2.2. Spatiotemporal Characteristics of ICEI
- (1)
- Cities with a stable decrease
- (2)
- Cities with a first increase followed by a decrease
- (3)
- Cities with a “fast-slow” decrease (exponential convergence)
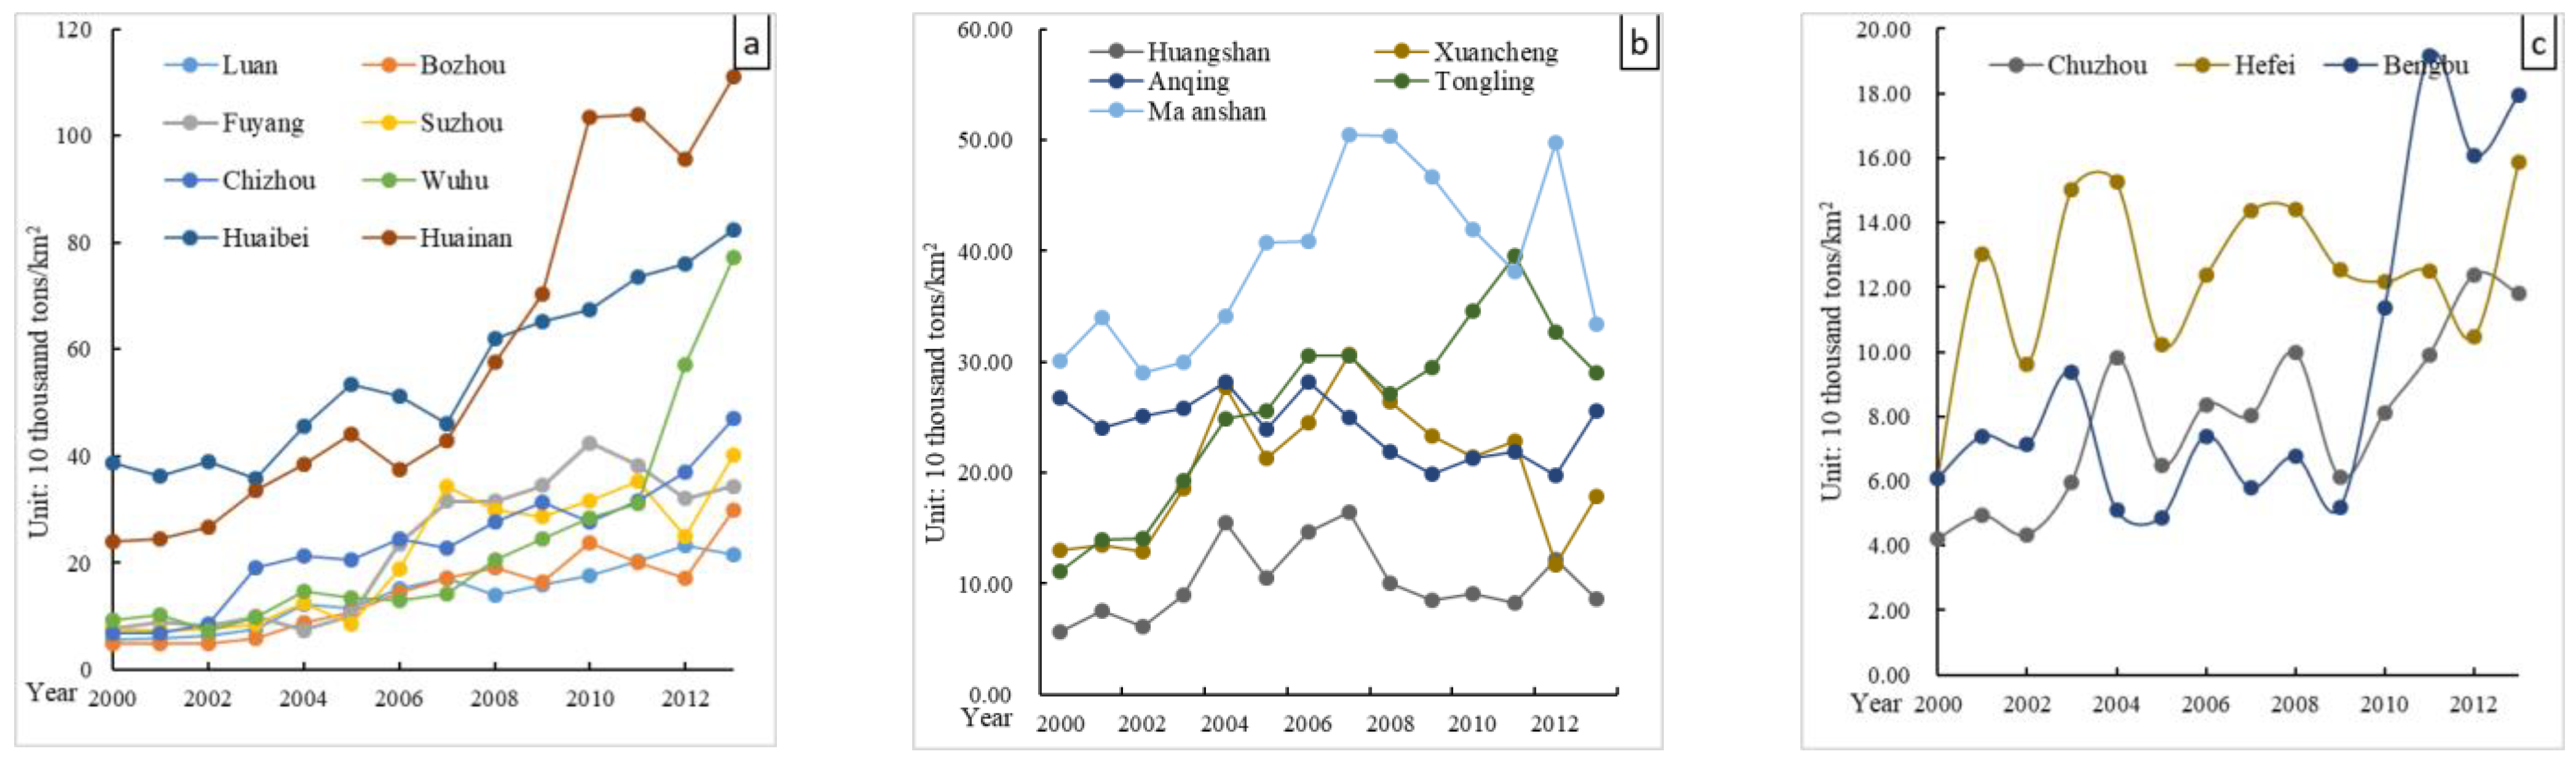
4.2.3. Spatial and Temporal Characteristics of CEIIL
- (1)
- Cities with a continuous increase
- (2)
- Cities with a first increase followed by a decrease
- (3)
- Cities with fluctuating increase
4.3. A Comprehensive Analysis of Evolution Characteristics
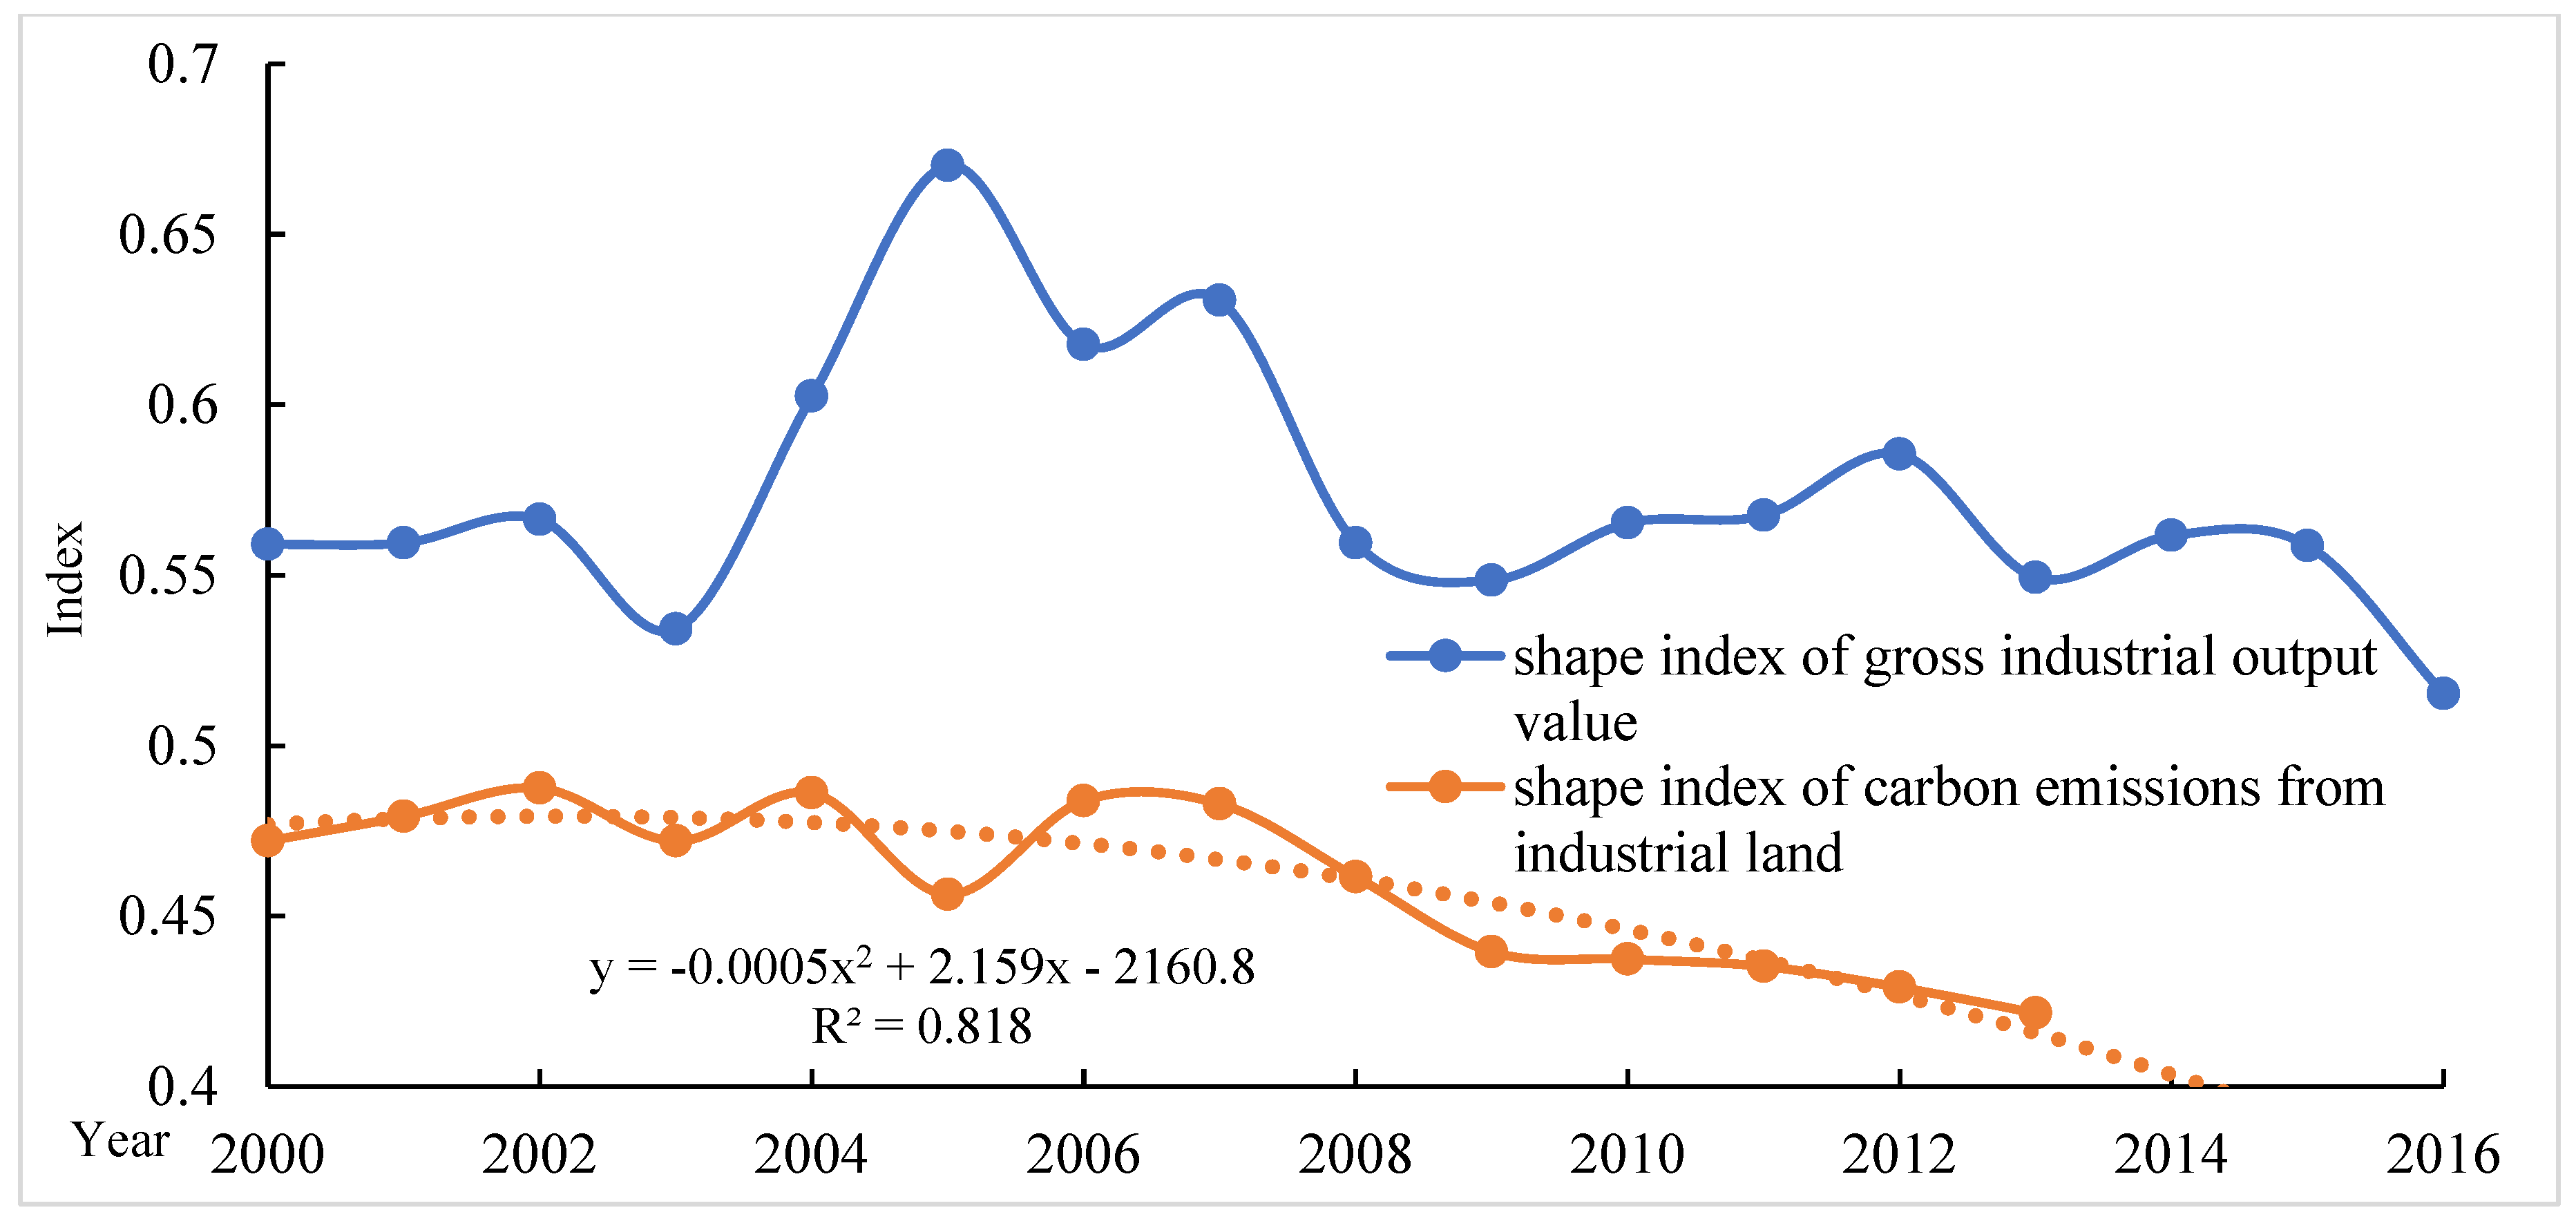
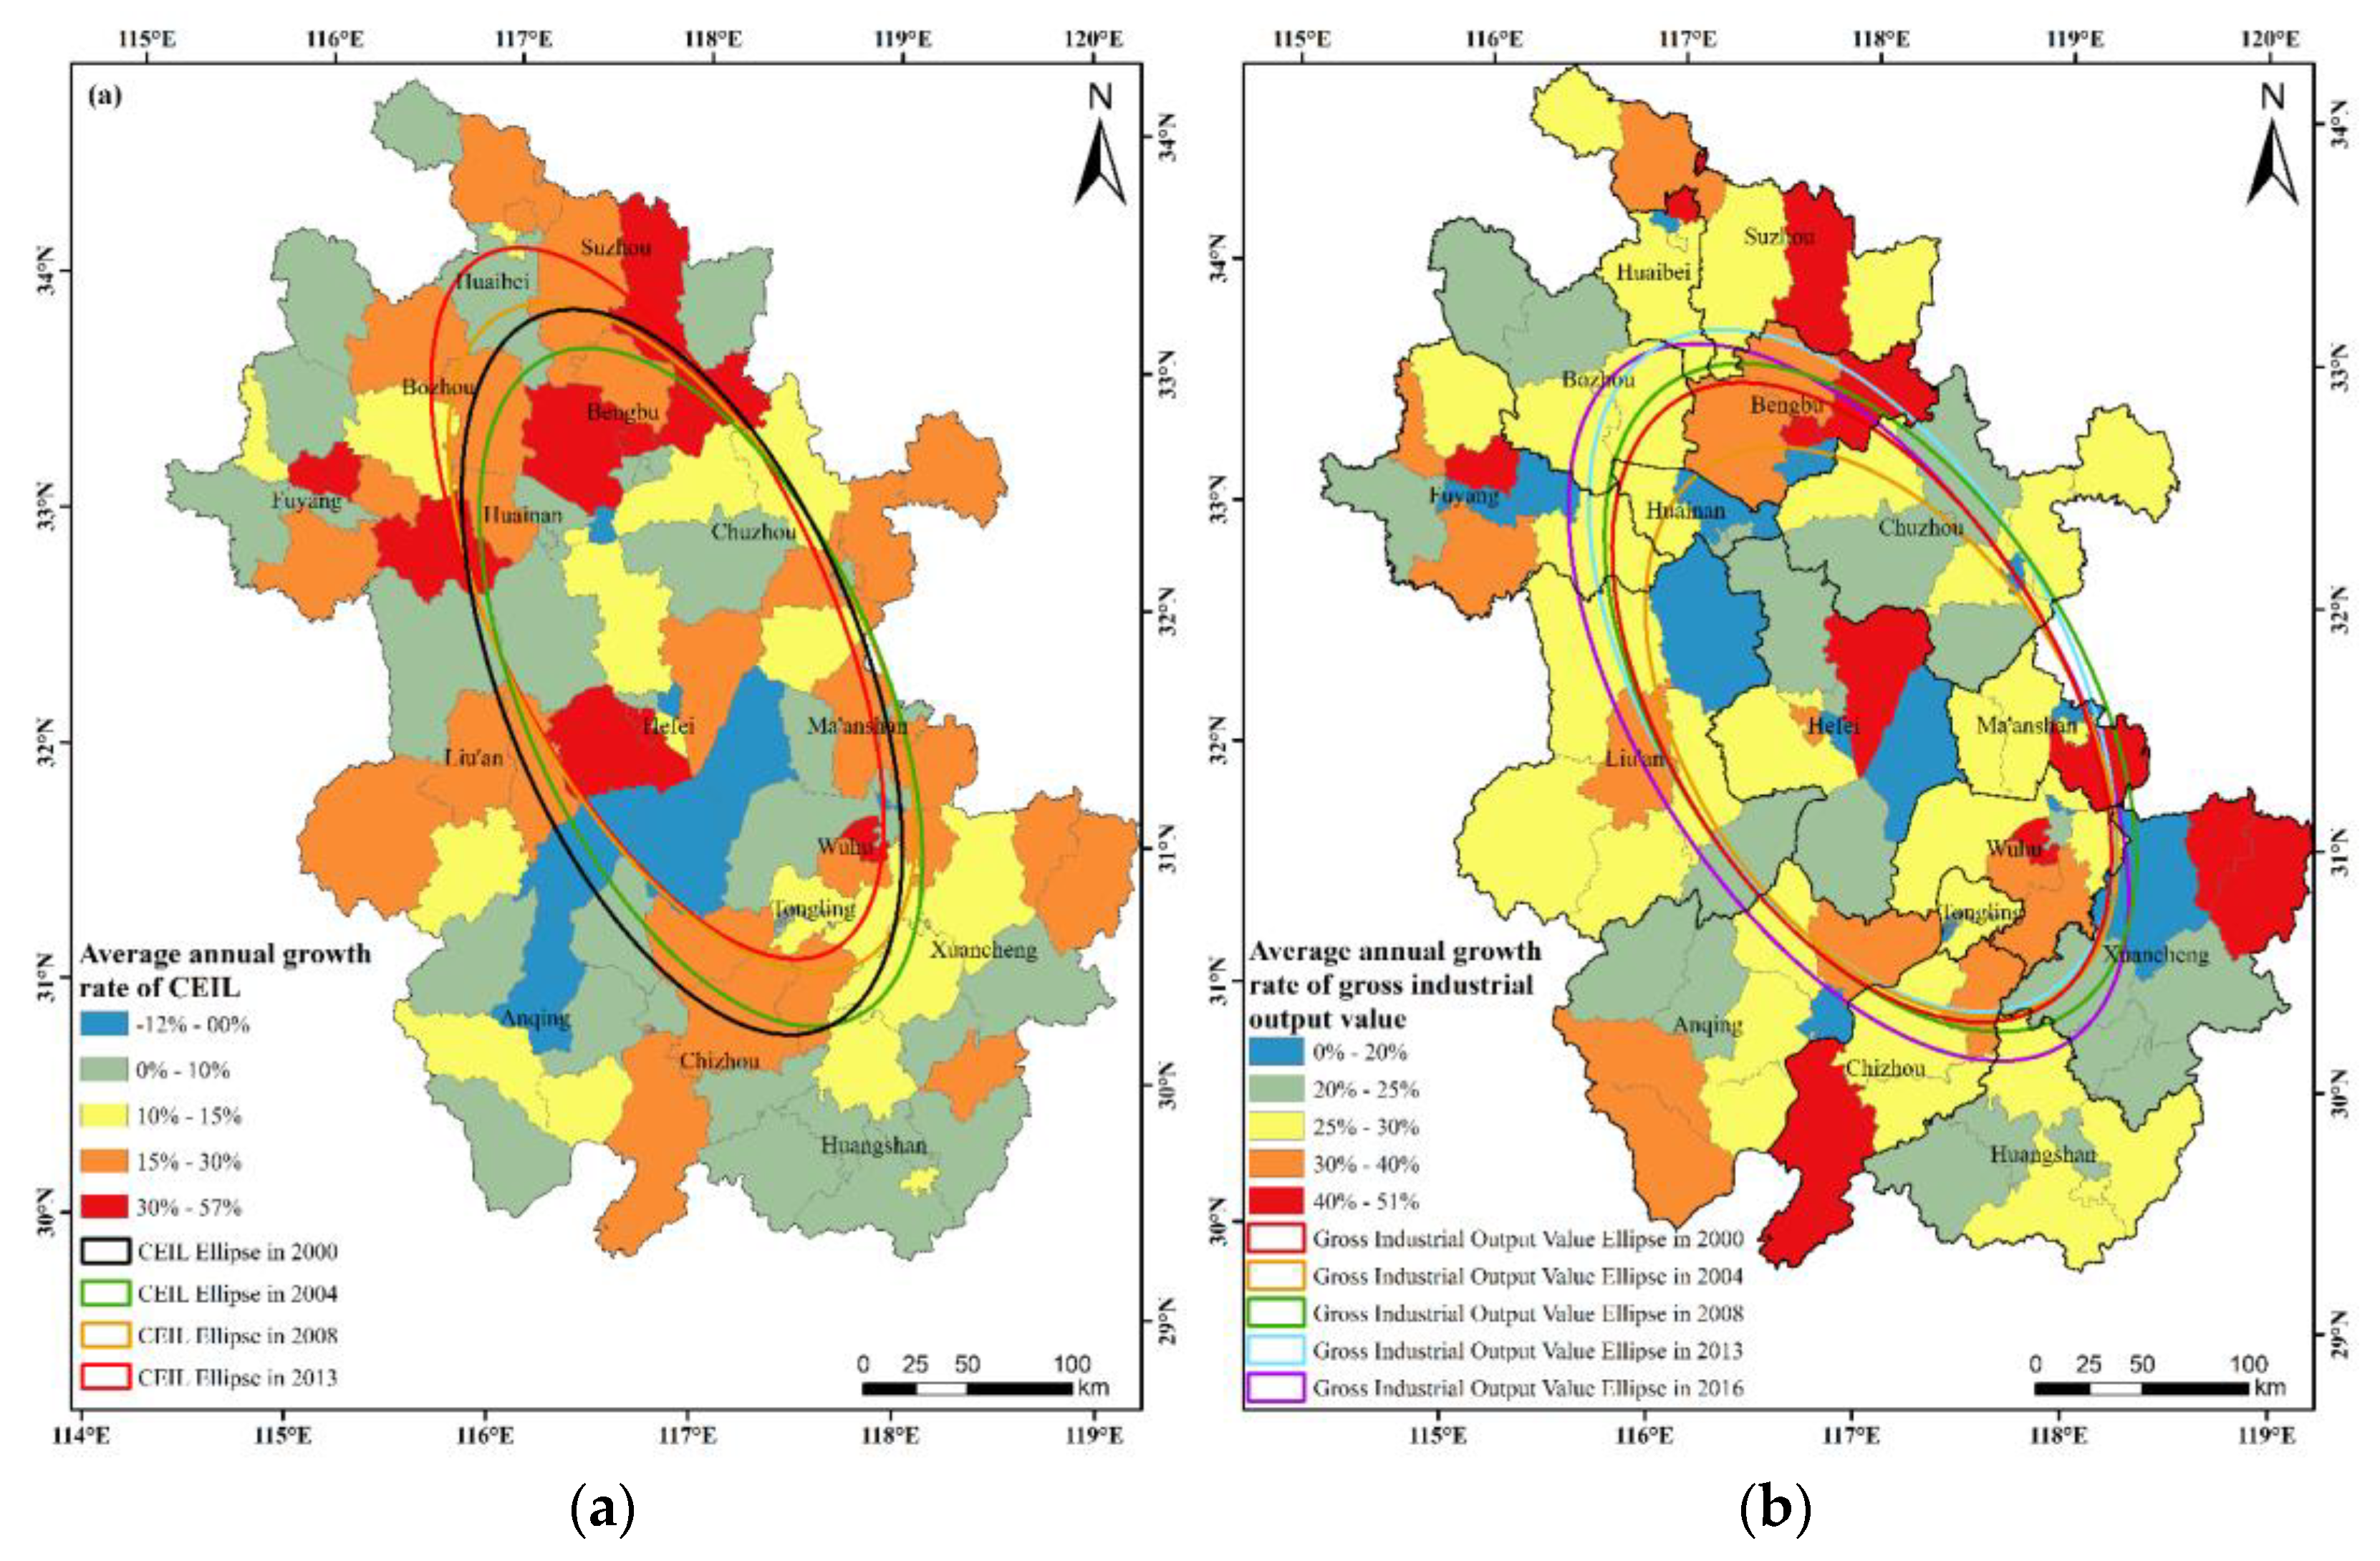
4.3.1. Spatial Distribution Features
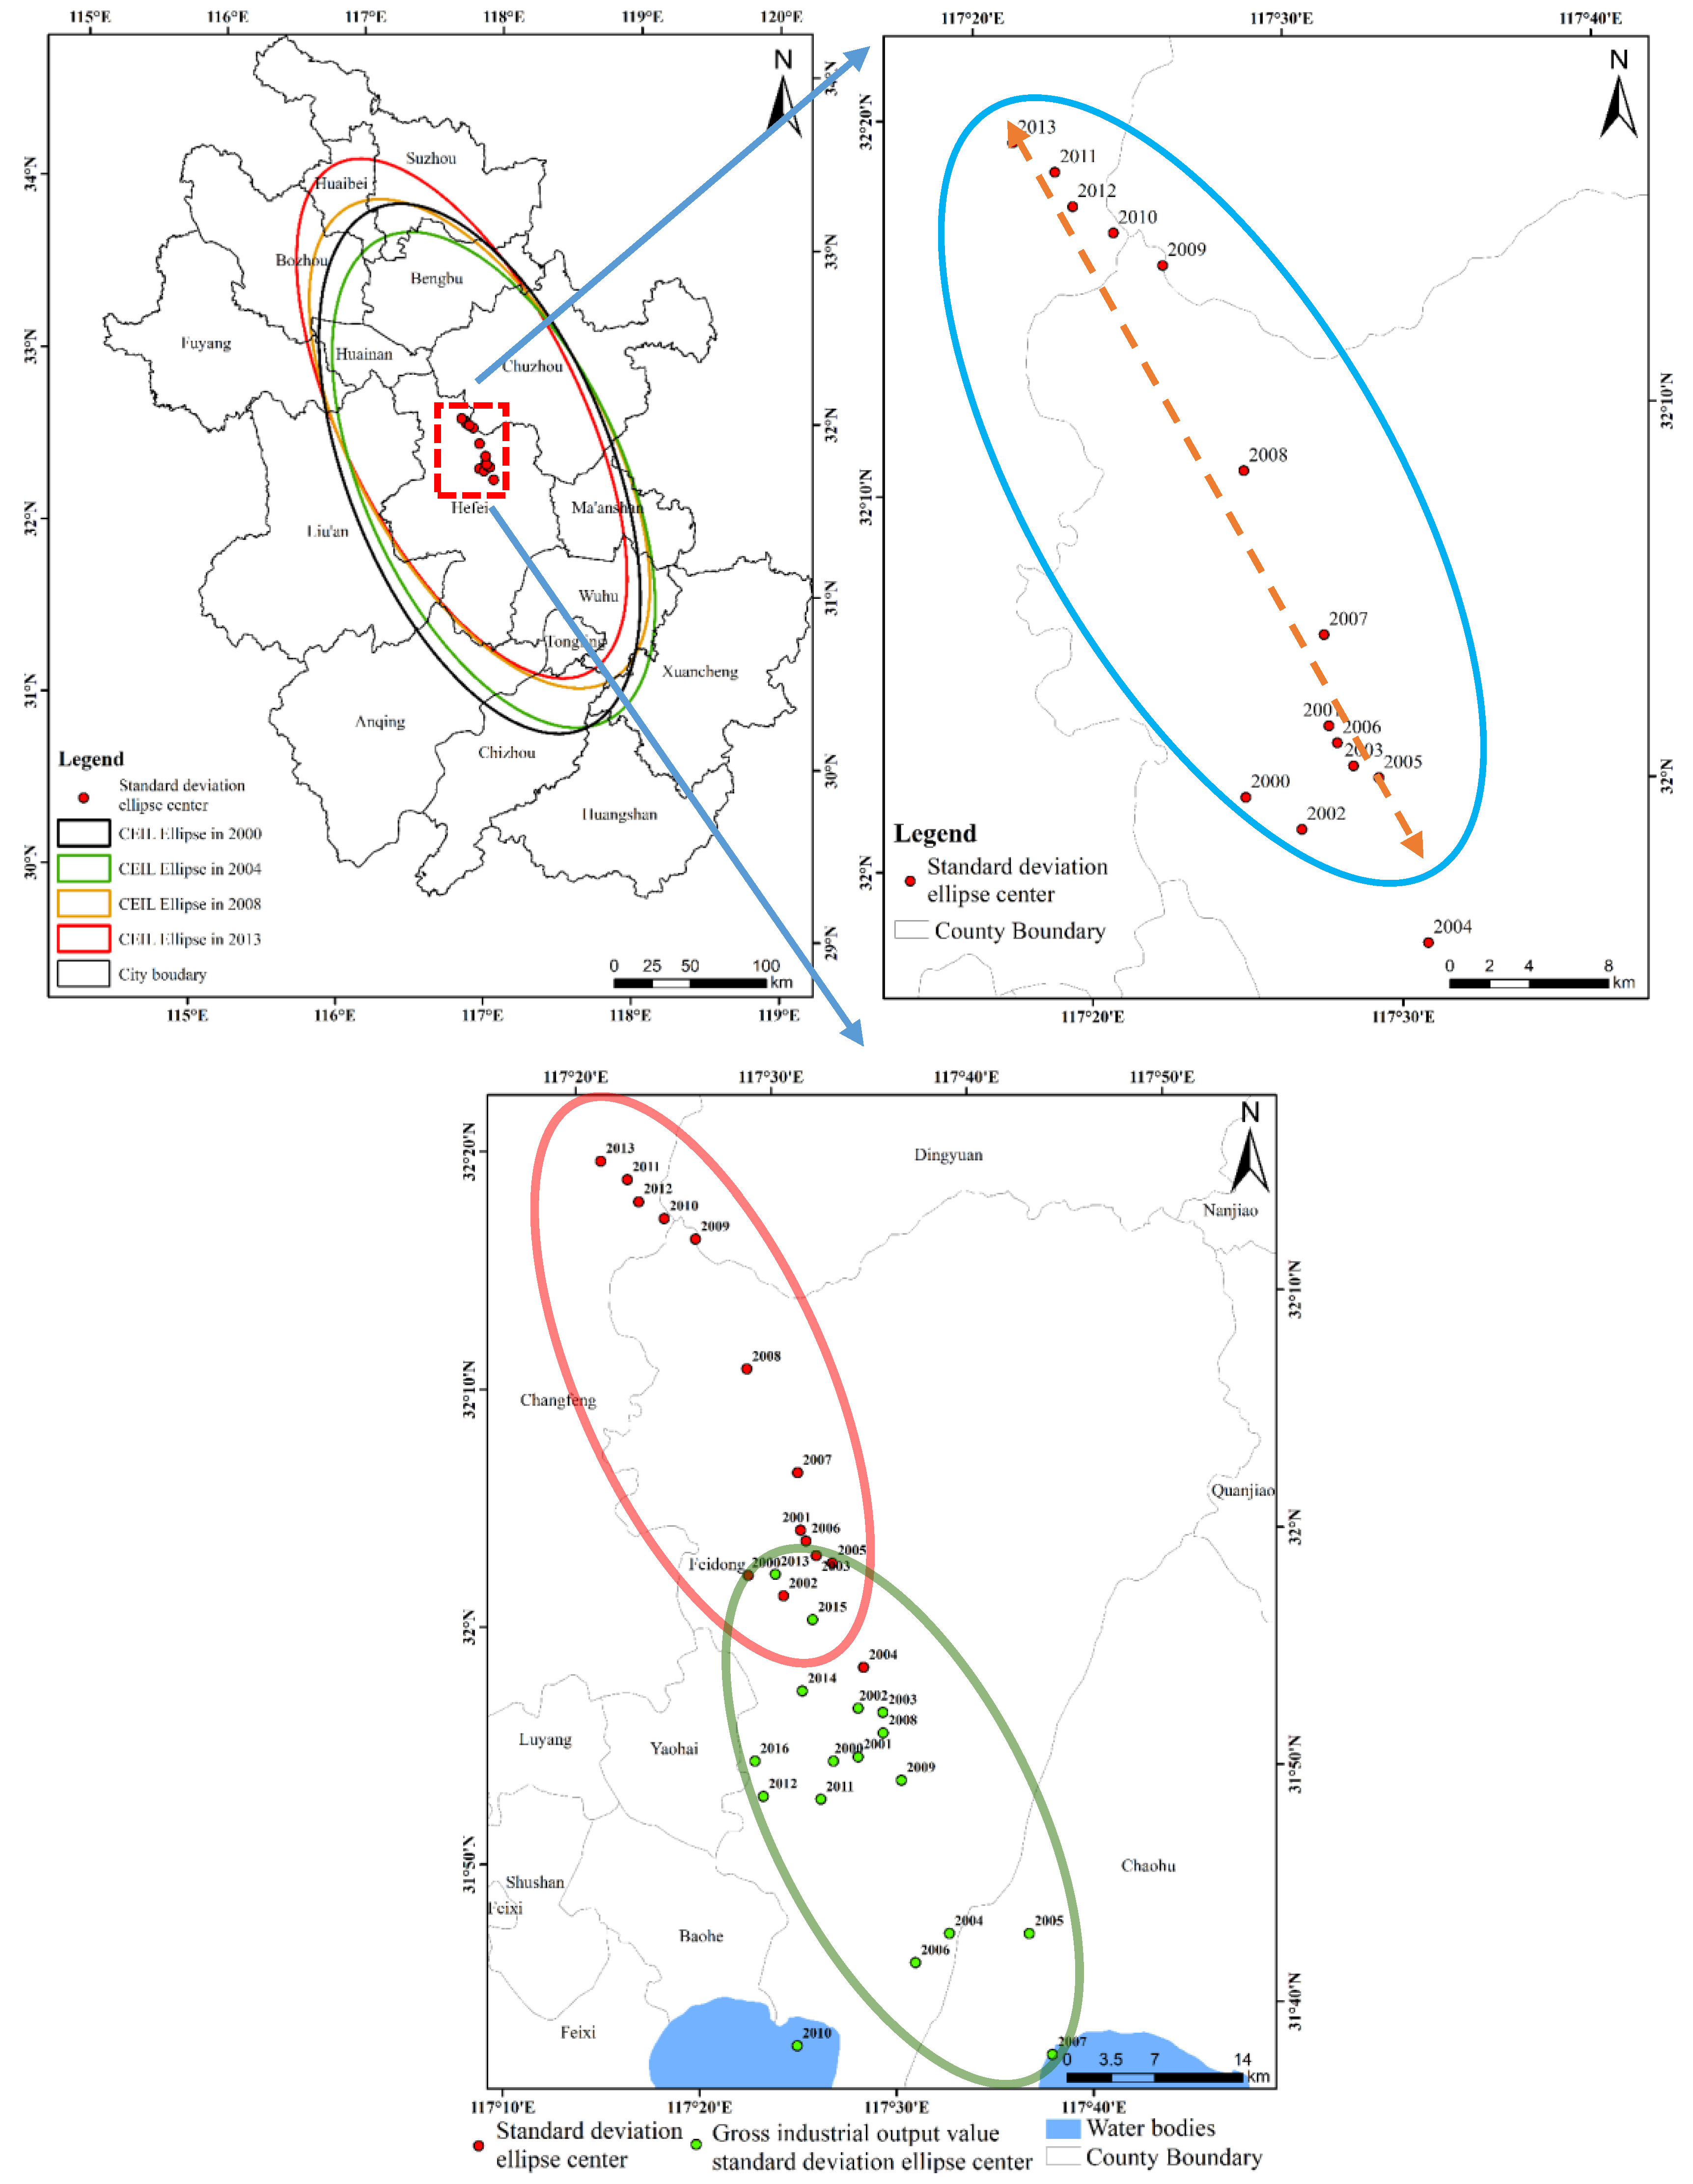
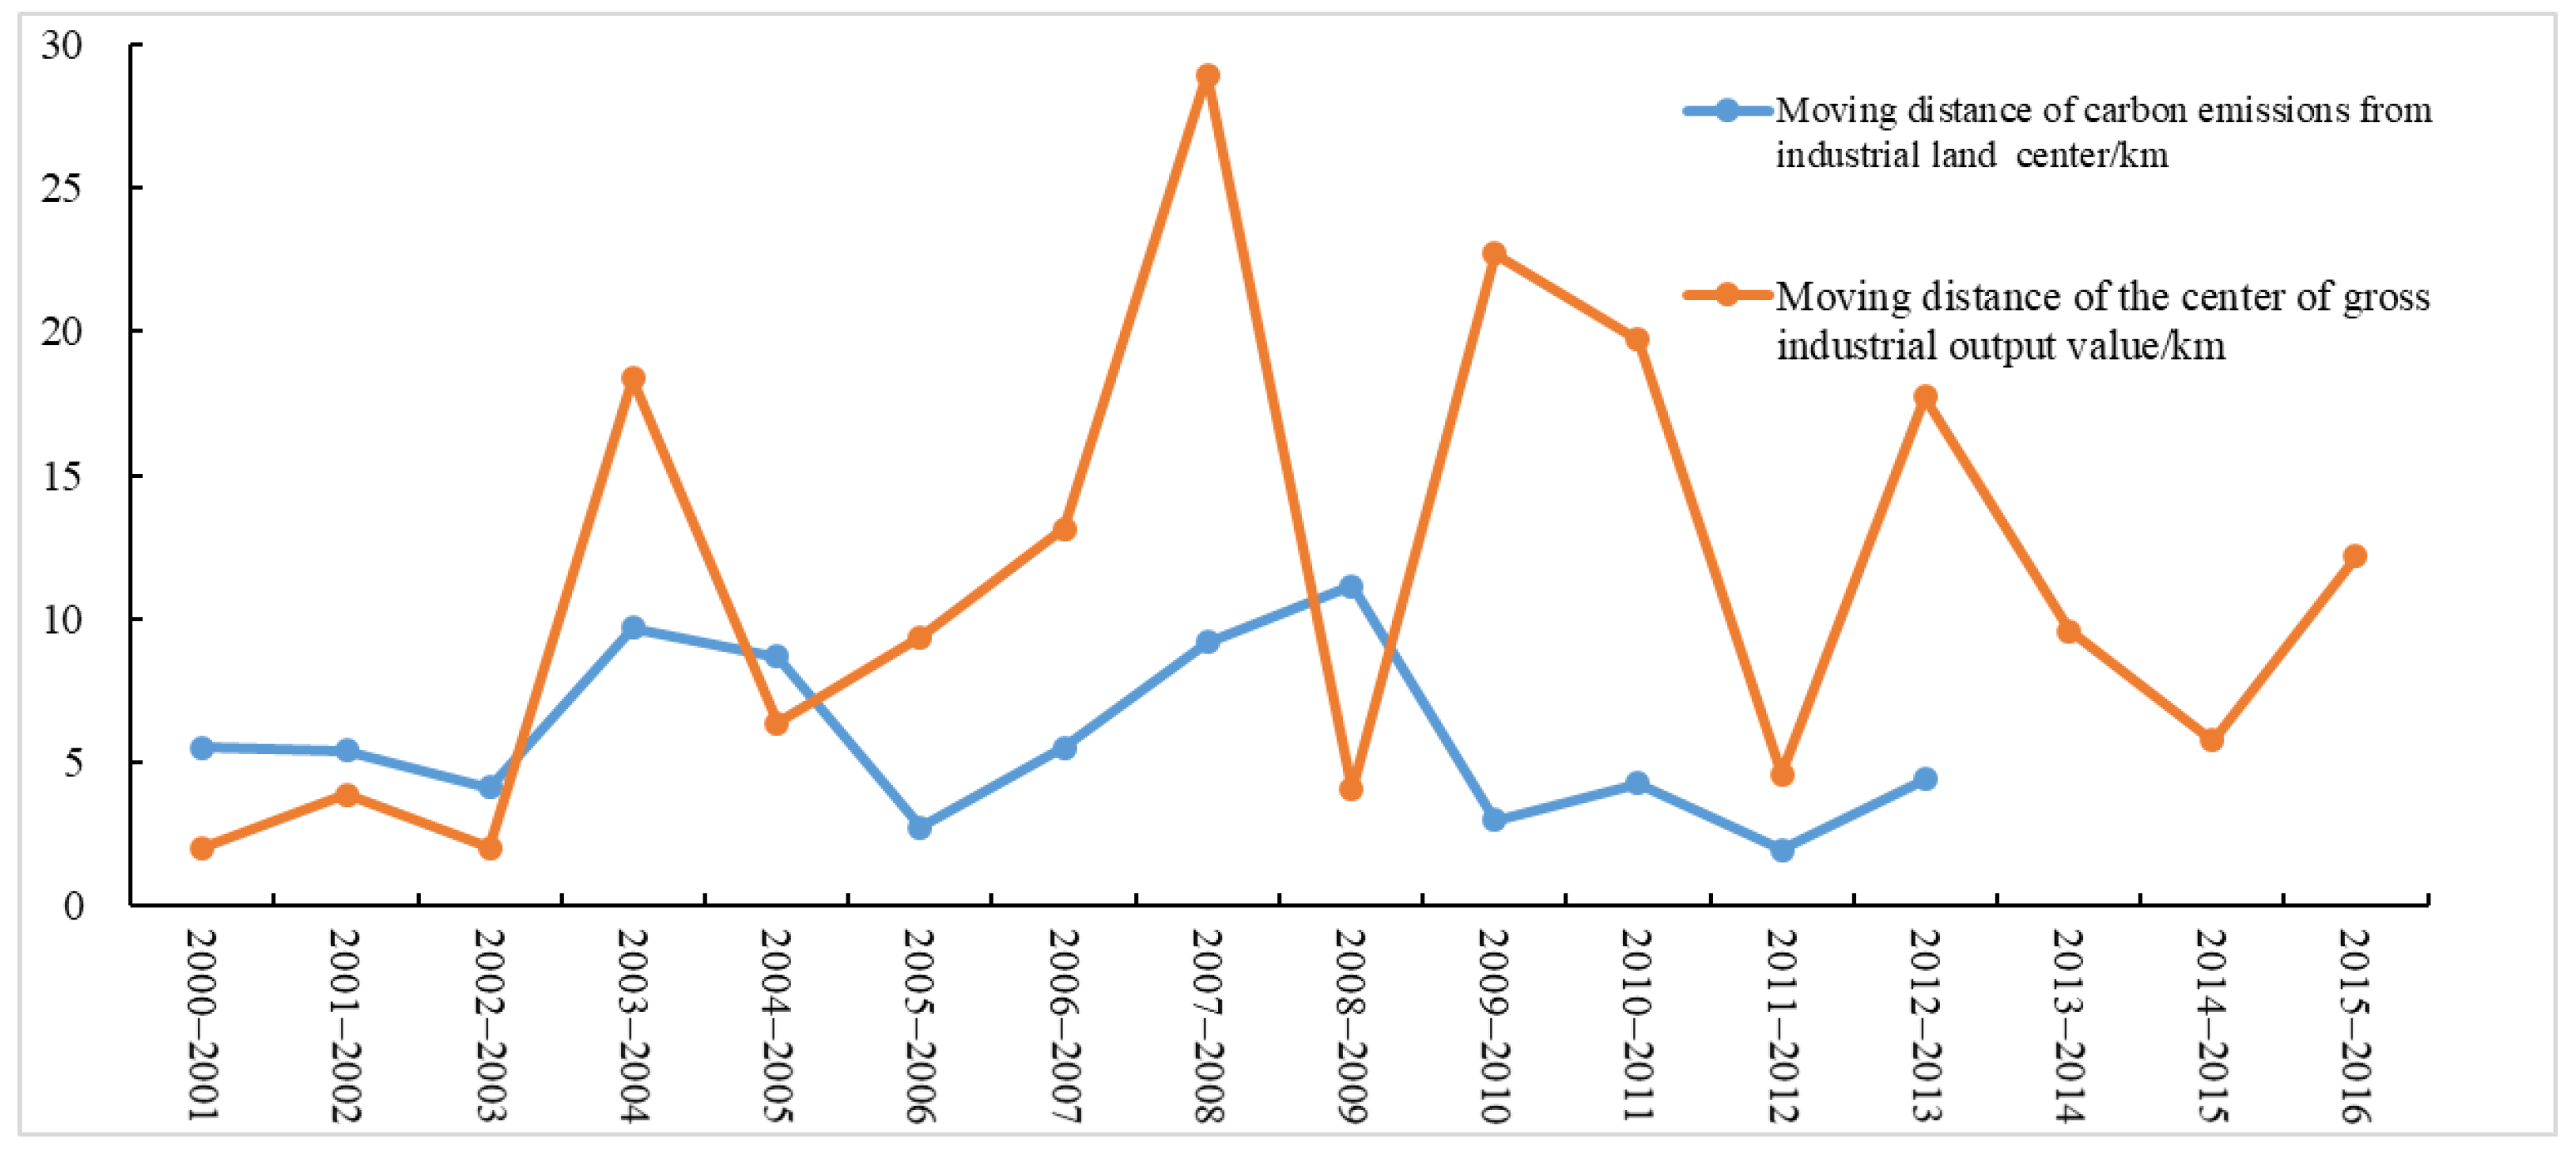
4.3.2. Center Change Feature
- (1)
- The movement trend of the center of CEIL was consistent with that of the industrial sector, although the scope and extent of the latter were larger and more dispersed, and the industrial center was more oriented towards the southeast. In particular, from 2004 to 2007, Anhui’s industrial center moved significantly to the southeast, reaching Chaohu, mainly due to the transfer of a large number of manufacturing industries from the Yangtze River Delta to Anhui Province during this period, particularly to the Wanjiang urban belt area. After 2008, with the implementation of the “Rise of Central China” Plan and the rapid rise of Hefei, its industrial center began to move to the northwest and gradually stabilized in Hefei.
- (2)
- The movement trend and the rate of the CEIL center were consistent with, although lower than, those of the industrial center, indicating that CE followed industrial development (Figure 12).
4.3.3. Spatial Rotation Angle Change
5. Conclusions
- (1)
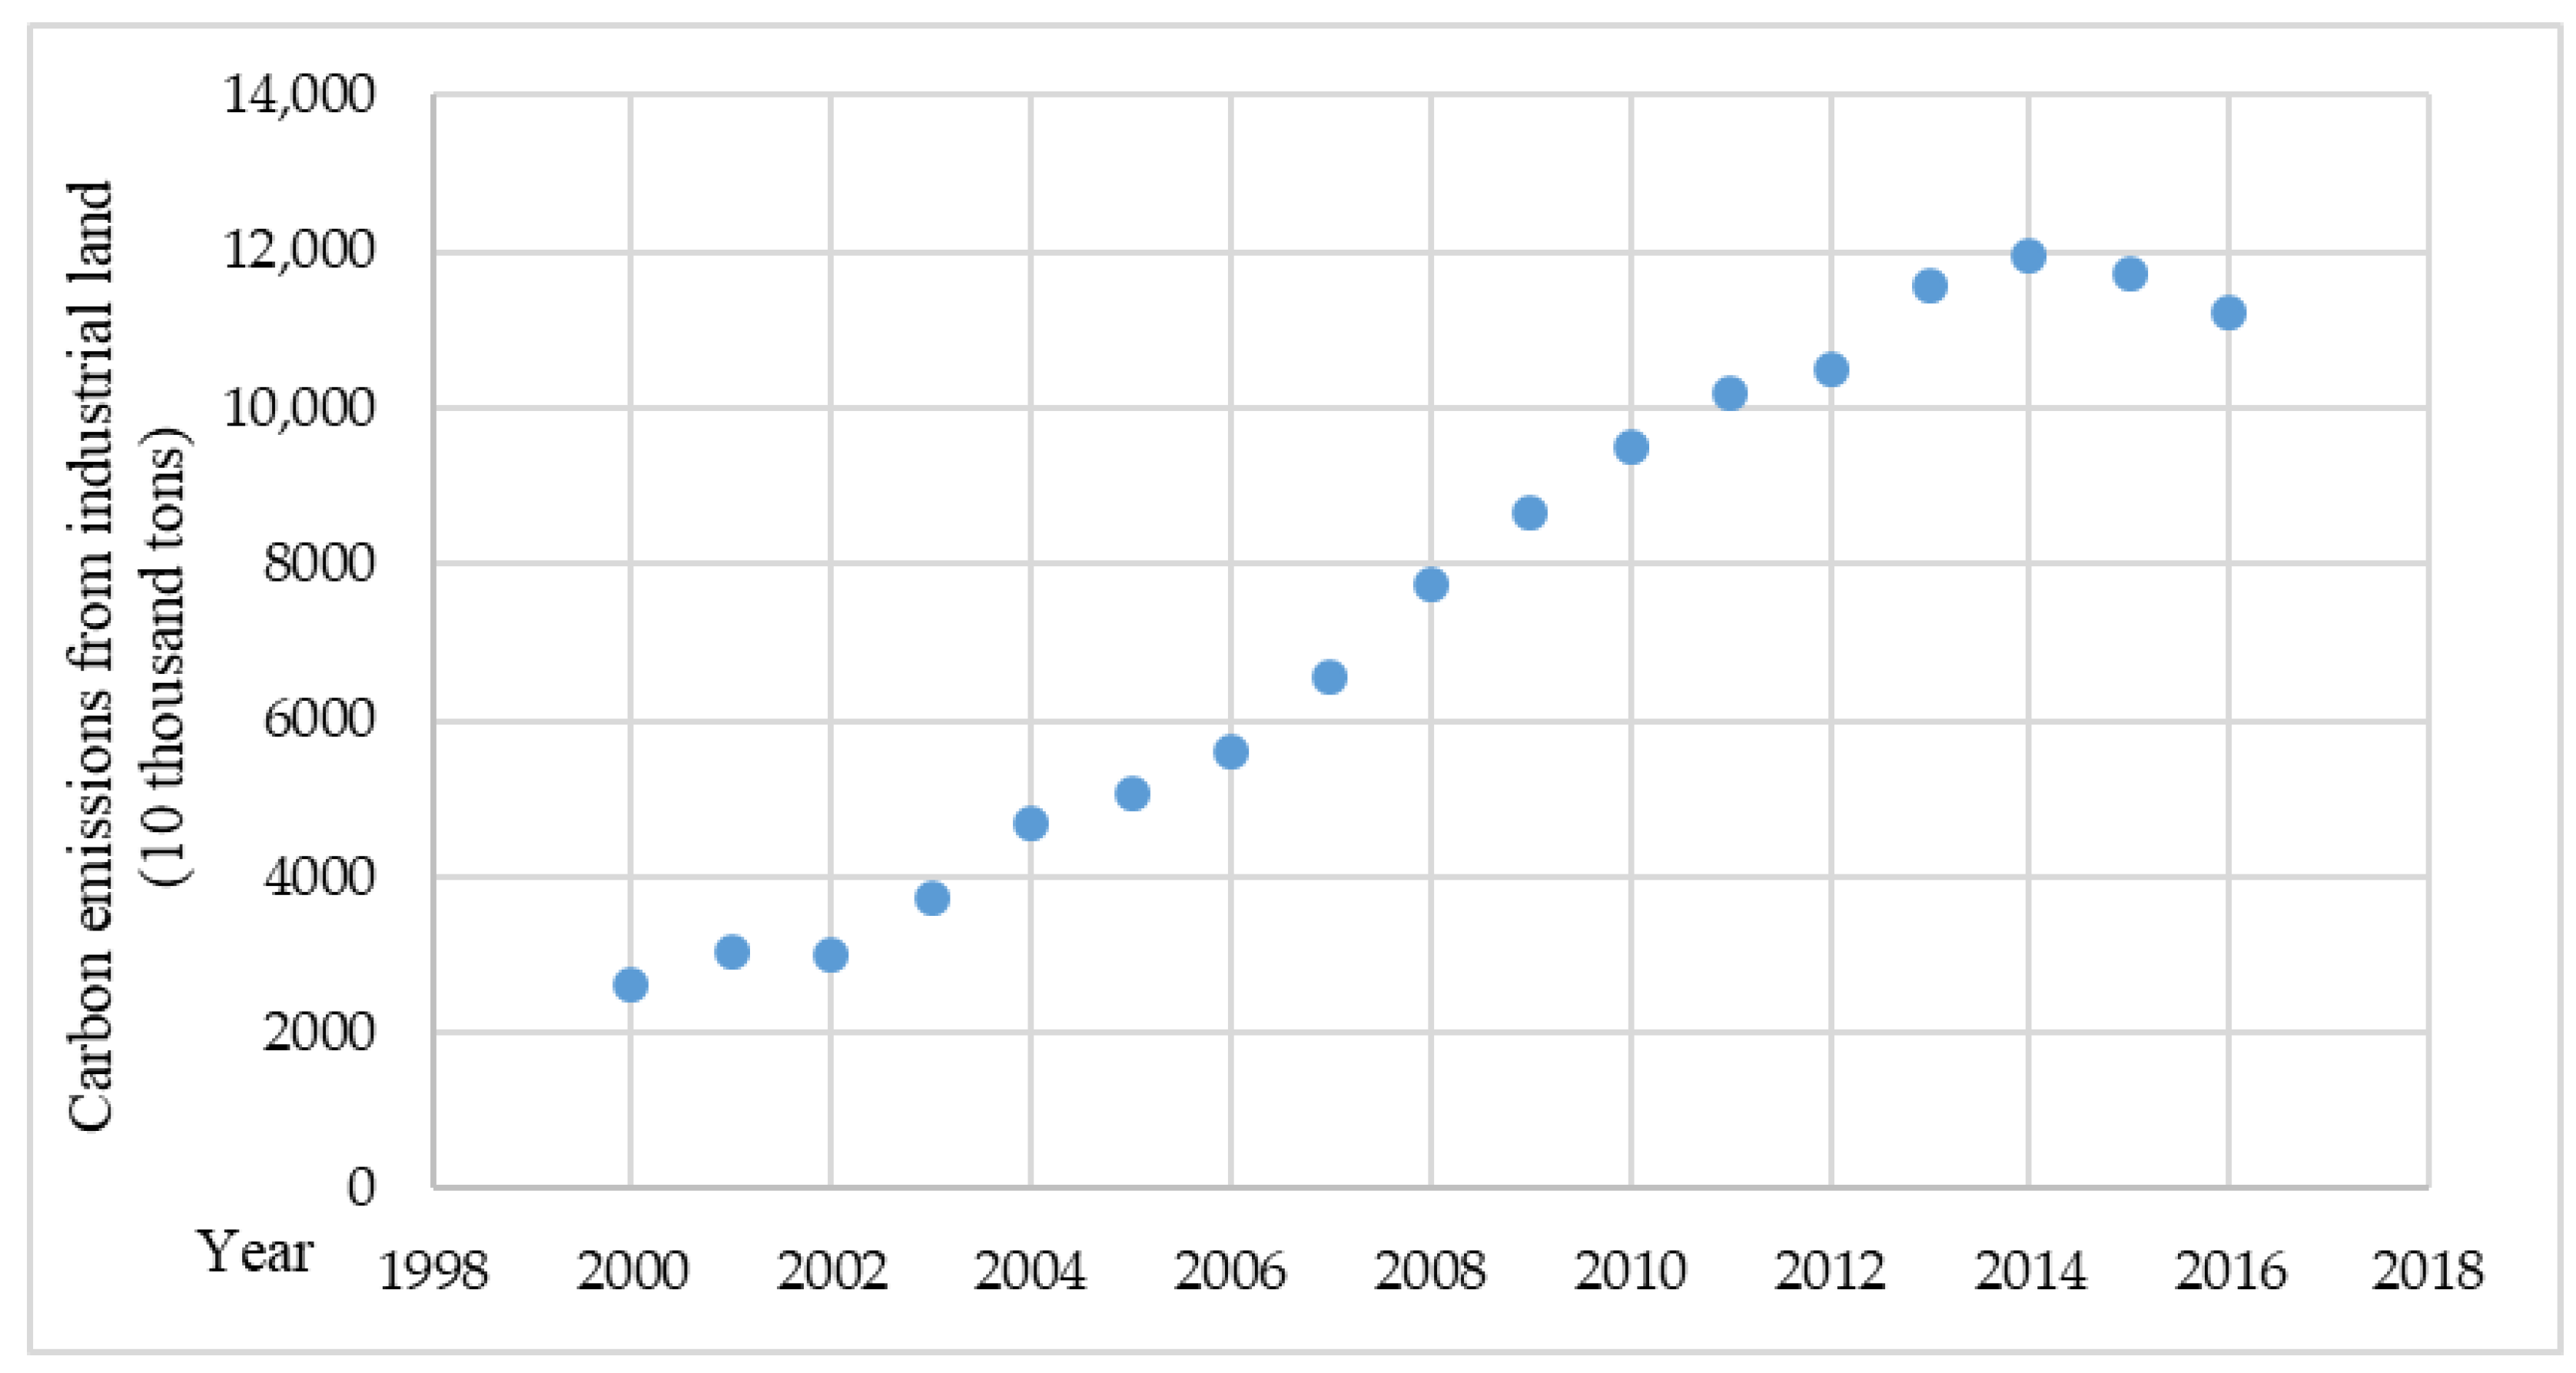
- The CEIL in Anhui Province from 2000 to 2016 followed an inverted U-shaped trend of rapid increase at first, followed by a decrease, while the overall CEIIL showed to follow a downward trend. This shows that Anhui Province has achieved some progress in promoting the transformation of its economic development model and industrial low-carbon transformation during the 12th five-year Plan period, and the rapid growth momentum of CE has been curbed to some extent.
- (2)
- At the city level, the spatial differentiation of CEIL in Anhui Province is obvious, with those from resource-based cities being much higher than those from industrial and tourism-based cities. Based on their ICEI, the 16 cities in Anhui Province were divided into three types: cities with a stable decrease, cities with a first increase followed by a decrease, and cities with a “fast-slow” decrease. In parallel, depending on their CEILI, the 16 cities were divided into three types: cities with a continuous increase, cities with a first increase followed by a decrease, and cities with a fluctuating increase.
- (3)
- The overall CEIL spatial pattern of industrial land in Anhui Province was characterized by the fact that the increase in the north-south direction was significantly higher than that in the east-west direction. The overall industrial growth rate of Southern Anhui, represented by the Wanjiang City Belt, was higher than that of Northern Anhui, although its CEIL center showed to move towards Northern Anhui.
Author Contributions
Funding
Institutional Review Board Statement
Informed Consent Statement
Data Availability Statement
Conflicts of Interest
References
- Nema, P.; Nema, S.; Roy, P. An overview of global climate changing in current scenario and mitigation action. Renew. Sustain. Energy Rev. 2012, 16, 2329–2336. [Google Scholar] [CrossRef]
- Ma, Z.W.; Yan, Y.X.; Wu, R.T.; Li, F.X. Research on the correlation between WTI crude oil futures price and European carbon futures price. Front. Energy Res. 2021, 9, 735665. [Google Scholar] [CrossRef]
- Adnan, M.N.; Safeer, R.; Rashid, A. Consumption based approach of carbon footprint analysis in urban slum and non-slum areas of Rawalpindi. Habitat Int. 2018, 73, 16–24. [Google Scholar] [CrossRef]
- Ma, X.; Jiang, P.; Jiang, Q. Research and application of association rule algorithm and an optimized grey model in carbon emissions forecasting. Technol. Forecast. Soc. Change 2020, 158, 120159. [Google Scholar] [CrossRef]
- Gao, P.; Yue, S.; Chen, H. Carbon emission efficiency of China’s industry sectors: From the perspective of embodied carbon emissions. J. Clean. Prod. 2021, 283, 124655. [Google Scholar] [CrossRef]
- Martins, T.; Barreto, A.C.; Souza, F.M.; Souza, A.M. Fossil fuels consumption and carbon dioxide emissions in G7 countries: Empirical evidence from ARDL bounds testing approach. Environ. Pollut. 2021, 291, 118093. [Google Scholar] [CrossRef]
- Shen, W.; Liang, H.; Dong, L.; Ren, J.; Wang, G. Synergistic CO2 reduction effects in Chinese urban agglomerations: Perspectives from social network analysis. Sci. Total Environ. 2021, 798, 149352. [Google Scholar] [CrossRef] [PubMed]
- Zhang, D.H.; Zhou, C.S.; He, B.J. Spatial and temporal heterogeneity of urban land area and PM2.5 concentration in China. Urban Clim. 2022, 45, 101268. [Google Scholar] [CrossRef]
- Song, C.R.; Yang, J.; Wu, F.; Xiao, X.M.; Xia, J.H.; Li, X.M. Response characteristics and influencing factors of carbon emissions and land surface temperature in Guangdong Province, China. Urban Clim. 2022, 46, 101330. [Google Scholar] [CrossRef]
- Yang, Y.; Yang, S. Are industrial carbon emissions allocations in developing regions equitable? A case study of the northwestern provinces in China. J. Environ. Manag. 2020, 265, 110518. [Google Scholar] [CrossRef]
- Pang, Q.; Zhou, W.; Zhao, T.; Zhang, L. Impact of urbanization and industrial structure on carbon emissions: Evidence from Huaihe River Eco-Economic Zone. Land 2021, 10, 1130. [Google Scholar] [CrossRef]
- Yang, Y.; Yuan, Z.; Yang, S. Difference in the drivers of industrial carbon emission costs determines the diverse policies in middle-income regions: A case of northwestern China. Renew. Sustain. Energy Rev. 2022, 155, 111942. [Google Scholar] [CrossRef]
- Wang, P.P.; Zhao, Y.C.; Zhang, J.Y.; Xiong, Z. Progress of carbon measurement methods for coal-fired power plants under double carbon target. Clean Coal Technol. 2022, 28, 170–183. [Google Scholar] [CrossRef]
- Gao, C.Y.; Niu, J.G.; Wang, F.R. Review of carbon emission accounting methods and carbon emission factorin steel production. Contemp. Econ. Manag. 2021, 43, 33–38. [Google Scholar] [CrossRef]
- Jung, S.; An, K.-J.; Dodbiba, G.; Fujita, T. Regional energy-related carbon emission characteristics and potential mitigation in eco-industrial parks in South Korea: Logarithmic mean Divisia index analysis based on the Kaya identity. Energy 2012, 46, 231–241. [Google Scholar] [CrossRef]
- Gregg, J.S.; Losey, L.M.; Andres, R.J.; Blasing, T.J.; Marland, G. The temporal and spatial distribution of carbon dioxide emissions from fossil-fuel use in North America. J. Appl. Meteorol. Climatol. 2009, 48, 2528–2542. [Google Scholar] [CrossRef] [Green Version]
- Jorgenson, A.K.; Clark, B.; Giedraitis, V.R. The temporal (in)stability of the carbon dioxide emissions/economic development relationship in Central and Eastern European Nations. Soc. Nat. Resour. 2012, 25, 1182–1192. [Google Scholar] [CrossRef]
- Shao, C.; Guan, Y.; Wan, Z.; Guo, C.; Chu, C.; Ju, M. Performance and decomposition analyses of carbon emissions from industrial energy consumption in Tianjin, China. J. Clean. Prod. 2014, 64, 590–601. [Google Scholar] [CrossRef]
- Ouyang, X.; Lin, B. An analysis of the driving forces of energy-related carbon dioxide emissions in China’s industrial sector. Renew. Sustain. Energy Rev. 2015, 45, 838–849. [Google Scholar] [CrossRef] [Green Version]
- Ye, Y.; Yu, R.; Yu, Z.X. Study on industrial land use efficiency under energy carbon emission constraint. J. Anhui Agric. Univ. 2022, 31, 40–48. [Google Scholar] [CrossRef]
- Wang, W.; Xie, H.L.; Jiang, T.; Zhang, D.B.; Xue, X. Measuring the Total-Factor Carbon Emission Performance of Industrial Land Use in China Based on the Global Directional Distance Function and Non-Radial Luenberger Productivity Index. Sustainability 2016, 8, 336. [Google Scholar] [CrossRef] [Green Version]
- Xie, H.L.; Zhai, Q.L.; Wang, W.; Yu, J.L.; Lu, F.C.; Chen, Q.F. Does intensive land use promote a reduction in carbon emissions? Evidence from the Chinese industrial sector. Resour. Conserv. Recycl. 2018, 137, 167–176. [Google Scholar] [CrossRef]
- Zeng, L.G.; Li, C.M.; Liang, Z.Q.; Zhao, X.H.; Hu, H.Y.; Wang, X. The carbon emission intensity of industrial land in China:spatiotemporal characteristics and driving factors. Land 2022, 11, 1156. [Google Scholar] [CrossRef]
- Wu, S.; Hu, S.G.; Frazier, A.E. Spatiotemporal variation and driving factors of carbon emissions in three industrial land spaces in China from 1997 to 2016. Technol. Forecast. Soc. Change 2021, 169, 120837. [Google Scholar] [CrossRef]
- Zhang, T.; Chen, L.Q.; Wang, R.; Wang, B.Y.; Liu, Y.Q.; Liu, W.Q.; Wang, J.; Wen, M.X. The influencing factors of industrial carbon emissions in the context of undertaking industrial transfer in Anhui Province, China. Appl. Ecol. Environ. Res. 2019, 17, 4205–4227. [Google Scholar] [CrossRef]
- Dai, D.; Xing, Q. Low-carbon development forecast analysis of carbon emission in Anhui province (china). Fresenius Environ. Bull. 2022, 31, 3015–3022. [Google Scholar]
- Xie, W.; Guo, W.; Shao, W.; Li, F.; Tang, Z. Environmental and health co-benefits of coal regulation under the carbon neutral target: A case study in Anhui Province, China. Sustainability 2021, 13, 6498. [Google Scholar] [CrossRef]
- Ye, L.; Wu, X.; Huang, D. Industrial energy-related CO2 emissions and their driving factors in the Yangtze River Economic Zone (China): An extended LMDI analysis from 2008 to 2016. Int. J. Environ. Res. Public Health 2020, 17, 5880. [Google Scholar] [CrossRef]
- Tang, L.J.; Jiang, X.D.; Yang, Q.; Xu, X. Characteristics of carbon emission and its countermeasure during“13th Five-Year”. J. Anhui Agric. Sci. 2017, 45, 204–211. [Google Scholar] [CrossRef]
- Hu, S.; Chen, L.; Li, L.; Zhang, T.; Yuan, L.; Cheng, L.; Wang, J.; Wen, M. Simulation of land use change and ecosystem service value dynamics under ecological constraints in Anhui Province, China. Int. J. Environ. Res. Public Health 2020, 17, 4228. [Google Scholar] [CrossRef]
- Ghosh, S.; Dinda, S.; Das Chatterjee, N.; Dutta, S.; Bera, D. Spatial-explicit carbon emission-sequestration balance estimation and evaluation of emission susceptible zones in an Eastern Himalayan city using Pressure-Sensitivity-Resilience framework: An approach towards achieving low carbon cities. J. Clean. Prod. 2022, 336, 130417. [Google Scholar] [CrossRef]
- Burns, D.; Grubert, E. Contribution of regionalized methane emissions to greenhouse gas intensity of natural gas-fired electricity and carbon capture in the United States. Environ. Sci. Technol. Lett. 2021, 8, 811–817. [Google Scholar] [CrossRef]
- Yan, H.; Guo, X.; Zhao, S.; Yang, H. Variation of net carbon emissions from land use change in the Beijing-Tianjin-Hebei region during 1990–2020. Land 2022, 11, 997. [Google Scholar] [CrossRef]
- Asiedu, B.A.; Hassan, A.A.; Bein, M.A. Renewable energy, non-renewable energy, and economic growth: Evidence from 26 European countries. Environ. Sci. Pollut. Res. 2021, 28, 11119–11128. [Google Scholar] [CrossRef]
- Cang, D.; Chen, G.; Chen, Q.; Sui, L.; Cui, C. Does new energy consumption conducive to controlling fossil energy consumption and carbon emissions?-Evidence from China. Resour. Policy 2021, 74, 102427. [Google Scholar] [CrossRef]
- Wei, W.; Zhang, X.; Cao, X.; Zhou, L.; Xie, B.; Zhou, J.; Li, C. Spatiotemporal dynamics of energy-related CO2 emissions in China based on nighttime imagery and land use data. Ecol. Indic. 2021, 131, 108132. [Google Scholar] [CrossRef]
- Ciais, P.; Wang, Y.; Andrew, R.; Breon, F.M.; Chevallier, F.; Broquet, G.; Nabuurs, G.J.; Peters, G.; McGrath, M.; Meng, W.; et al. Biofuel burning and human respiration bias on satellite estimates of fossil fuel CO2 emissions. Environ. Res. Lett. 2020, 15, 074036. [Google Scholar] [CrossRef]
- Rahman, M.M.; Sultana, N.; Velayutham, E. Renewable energy, energy intensity and carbon reduction: Experience of large emerging economies. Renew. Energy 2022, 184, 252–265. [Google Scholar] [CrossRef]
- Zheng, X.; Yu, H.; Yang, L. Factor Mobility, Industrial transfer and industrial carbon emission: A spatial matching perspective. Front. Environ. Sci. 2022, 10, 822811. [Google Scholar] [CrossRef]
- Zhang, Z.; Xie, H.; Zhang, J.; Wang, X.; Wei, J.; Quan, X. Prediction and trend analysis of regional industrial carbon emission in China: A study of Nanjing City. Int. J. Environ. Res. Public Health 2022, 19, 7165. [Google Scholar] [CrossRef]
- Chen, H.; Qi, S.; Tan, X. Decomposition and prediction of China’s carbon emission intensity towards carbon neutrality: From perspectives of national, regional and sectoral level. Sci. Total Environ. 2022, 825, 153839. [Google Scholar] [CrossRef] [PubMed]
- Sun, W.; Huang, C. Predictions of carbon emission intensity based on factor analysis and an improved extreme learning machine from the perspective of carbon emission efficiency. J. Clean. Prod. 2022, 338, 130414. [Google Scholar] [CrossRef]
- Zheng, Y.; Long, Y.; Fan, H. The analysis of spatial-temporal effects of relevant factors on carbon intensity in China. Stoch. Environ. Res. Risk Assess. 2022, 36, 3785–3802. [Google Scholar] [CrossRef] [PubMed]
- Tian, H.Z.; Ma, L. Study on the change of China’s industrial carbon emissionintensity from the perspective of sector structure. J. Nat. Resour. 2020, 35, 639–653. [Google Scholar] [CrossRef]
- Lin, B.; Xu, B. Growth of industrial CO2 emissions in Shanghai City: Evidence from a dynamic vector auto regression analysis. Energy 2018, 151, 167–177. [Google Scholar] [CrossRef]
- Shu, X.; Xia, C.Y.; Li, Y.; Tong, J.E.; Shi, Z. Relationships between carbon emission, urban growth and urban forms of urbanagglomeration in the Yangtze River Delta. Acta Ecol. Sin. 2018, 38, 6302–6313. [Google Scholar] [CrossRef]
- Lin, Q.W.; Zhang, L.; Qiu, B.K.; Zhao, Y.; Wei, C. Spatiotemporal analysis of land use patterns on carbon emissions in China. Land 2021, 10, 141. [Google Scholar] [CrossRef]
- Peng, W.F.; Fan, S.Y.; Pan, H.J.; Mao, H.; Zhou, J.M.; Zhao, J.F.; Yang, C.J. Effects of region land use change on carbon emission and its spatial and temporal patterns, in Sichuan Province. Ecol. Econ. 2013, 9, 28–33. [Google Scholar]
- Chen, Z.L.; Yihua; Lin, H. Decoupling analysis of land-use carbon emissions and economic development in Guangdong Province. Ecol. Econ. 2018, 34, 26–32. [Google Scholar]
- Lefever, D.W. Measuring geographic concentration by means of the standard deviational ellipse. Am. J. Sociol. 1926, 32, 88–94. [Google Scholar] [CrossRef]
- Wang, W.; Samat, A.; Abuduwaili, J.; Ge, Y. Spatio-temporal variations of satellite-based PM2.5 concentrations and its determinants in Xinjiang, Northwest of China. Int. J. Environ. Res. Public Health 2020, 17, 2157. [Google Scholar] [CrossRef] [PubMed] [Green Version]
- Huang, J.; Song, L.; Yu, M.; Zhang, C.; Li, S.; Li, Z.; Geng, J.; Zhang, C. Quantitative spatial analysis of thermal infrared radiation temperature fields by the standard deviational ellipse method for the uniaxial loading of sandstone. Infrared Phys. Technol. 2022, 123, 104150. [Google Scholar] [CrossRef]
- Wang, Y.; Song, J.; Zhang, X.; Sun, H. Sustainable development evaluation and its obstacle factors of the Weihe River Basin in Shaanxi Province, China. Front. Earth Sci. 2021, 9, 789. [Google Scholar] [CrossRef]
- Zuo, Z.; Guo, H.; Cheng, J.; Li, Y. How to achieve new progress in ecological civilization construction?-Based on cloud model and coupling coordination degree model. Ecol. Indic. 2021, 127, 107789. [Google Scholar] [CrossRef]
- Sun, D.; Hu, C.; Wang, Y.; Wang, Z.; Zhang, J. Examining spatio-temporal characteristics of urban heat islands and factors driving them in Hangzhou, China. IEEE J. Sel. Top. Appl. Earth Obs. Remote Sens. 2021, 14, 8316–8325. [Google Scholar] [CrossRef]
- Cheng, L.; Zhang, T.; Chen, L.; Li, L.; Wang, S.; Hu, S.; Yuan, L.; Wang, J.; Wen, M. Investigating the impacts of urbanization on PM2.5 pollution in the Yangtze River Delta of China: A spatial panel data approach. Atmosphere 2020, 11, 1058. [Google Scholar] [CrossRef]
- Li, H.; Li, L.; Chen, L.; Zhou, X.; Cui, Y.; Liu, Y.; Liu, W. Mapping and characterizing spatiotemporal dynamics of impervious surfaces using landsat images: A case study of Xuzhou, East China from 1995 to 2018. Sustainability. 2019, 11, 1224. [Google Scholar] [CrossRef] [Green Version]
- Xia, C.; Hu, S.G.; Wu, S.; Yu, D. Spatial-temporal evolution characteristics of urban land use efficiency in Yangtze River Economic Belt. Econ. Geogr. 2021, 41, 115–124. [Google Scholar] [CrossRef]
- Shu, B.R.; Li, Y.L.; Qu, Y.; Yong, X.Q.; Li, X. Urban land expansion and its driving forces in different functional Cities: An empirical analysis based on 137 cities in China. J. Nanjing Agric. Univ. 2014, 14, 86–92. [Google Scholar]
- Shi, F.; Chu, J.L.; Gu, K.K. Construction of the central city group in Anhui Province based on spatial- Interaction theoretical perspective. J. Shenyang Jianzhu Univ. 2010, 12, 290–295. [Google Scholar]


| Energy Type | The Standard Coal Conversion Coefficient (kg kg−1/kg/m3) | CEC |
|---|---|---|
| Coal | 0.7143 | 0.7599 |
| Cleaned coal | 0.9 | 0.7599 |
| Liquefied petroleum gas | 1.7143 | 0.5042 |
| Crude oil | 1.4286 | 0.5847 |
| Gasoline | 1.4714 | 0.5538 |
| Kerosene | 1.4714 | 0.5714 |
| Diesel oil | 1.4571 | 0.5921 |
| Fuel oil | 1.4286 | 0.6185 |
| Coke | 0.9714 | 0.855 |
| Gas field natural gas | 1.2143 | 0.4483 |
| Oilfield Gas | 1.33 | 0.4483 |
| Coke oven gas | 0.5714 | 0.3548 |
| Type (%) | 2000 (%) | 2016 (%) |
|---|---|---|
| CEIL from raw coal | 69.55 | 80.16 |
| CEIL from crude oil | 10.98 | 4.02 |
| CEIL from natural gas | 0.00 | 0.06 |
| CEIL from other energy sources | 19.47 | 15.76 |
| City | 2000 | 2001 | 2002 | 2003 | 2004 | 2005 | 2006 | 2007 | 2008 | 2009 | 2010 | 2011 | 2012 | 2013 |
|---|---|---|---|---|---|---|---|---|---|---|---|---|---|---|
| Huangshan | 0.95 | 0.95 | 0.78 | 0.85 | 0.96 | 0.60 | 0.48 | 0.38 | 0.28 | 0.21 | 0.16 | 0.14 | 0.20 | 0.14 |
| Hefei | 0.59 | 1.06 | 0.70 | 0.91 | 0.70 | 0.58 | 0.53 | 0.46 | 0.29 | 0.23 | 0.19 | 0.16 | 0.10 | 0.14 |
| Lu’an | 0.83 | 0.82 | 0.90 | 1.02 | 0.95 | 0.71 | 0.67 | 0.53 | 0.34 | 0.31 | 0.26 | 0.22 | 0.21 | 0.18 |
| Chuzhou | 0.39 | 0.43 | 0.35 | 0.42 | 0.54 | 0.45 | 0.52 | 0.48 | 0.48 | 0.27 | 0.26 | 0.23 | 0.22 | 0.20 |
| Wuhu | 0.80 | 0.73 | 0.53 | 0.54 | 0.60 | 0.48 | 0.39 | 0.33 | 0.36 | 0.35 | 0.29 | 0.24 | 0.17 | 0.21 |
| Tongling | 1.11 | 1.36 | 1.22 | 1.22 | 1.02 | 0.80 | 0.57 | 0.47 | 0.38 | 0.42 | 0.29 | 0.24 | 0.20 | 0.21 |
| Bengbu | 0.60 | 0.66 | 0.55 | 0.60 | 0.46 | 0.37 | 0.46 | 0.36 | 0.40 | 0.20 | 0.31 | 0.29 | 0.23 | 0.23 |
| Xuancheng | 0.79 | 0.88 | 0.84 | 1.02 | 1.22 | 0.90 | 0.71 | 0.65 | 0.49 | 0.40 | 0.31 | 0.26 | 0.21 | 0.28 |
| Anqing | 2.49 | 2.39 | 2.33 | 2.20 | 2.11 | 1.72 | 1.48 | 1.11 | 0.83 | 0.63 | 0.52 | 0.41 | 0.32 | 0.34 |
| Chizhou | 1.01 | 1.00 | 0.98 | 1.52 | 1.49 | 1.33 | 1.42 | 1.23 | 0.91 | 0.62 | 0.49 | 0.45 | 0.34 | 0.38 |
| Fuyang | 0.74 | 0.92 | 0.88 | 0.89 | 0.78 | 0.72 | 1.19 | 1.10 | 0.91 | 0.76 | 0.69 | 0.63 | 0.43 | 0.39 |
| Suzhou | 2.58 | 2.57 | 2.46 | 2.69 | 2.41 | 1.30 | 1.12 | 1.41 | 0.87 | 0.73 | 0.61 | 0.41 | 0.40 | 0.48 |
| Bozhou | 0.66 | 0.84 | 0.81 | 0.84 | 0.90 | 0.90 | 0.94 | 0.87 | 0.80 | 0.54 | 0.58 | 0.47 | 0.36 | 0.52 |
| Ma’anshan | 3.27 | 3.26 | 2.64 | 2.29 | 1.71 | 1.59 | 1.51 | 1.30 | 1.07 | 1.03 | 0.85 | 0.66 | 0.52 | 0.54 |
| Huaibei | 4.28 | 3.51 | 3.55 | 2.91 | 2.47 | 3.28 | 2.51 | 2.09 | 2.05 | 1.93 | 1.46 | 1.19 | 1.04 | 1.01 |
| Huainan | 5.20 | 4.85 | 4.26 | 4.36 | 3.49 | 3.33 | 2.67 | 2.72 | 2.34 | 2.45 | 2.03 | 1.80 | 1.44 | 1.73 |
| Average | 1.64 | 1.64 | 1.49 | 1.52 | 1.36 | 1.19 | 1.07 | 0.97 | 0.80 | 0.69 | 0.58 | 0.49 | 0.40 | 0.44 |
| City | 2000 | 2001 | 2002 | 2003 | 2004 | 2005 | 2006 | 2007 | 2008 | 2009 | 2010 | 2011 | 2012 | 2013 |
|---|---|---|---|---|---|---|---|---|---|---|---|---|---|---|
| Hefei | 6.10 | 13.01 | 9.63 | 15.03 | 15.26 | 10.23 | 12.37 | 14.36 | 14.41 | 12.53 | 12.18 | 12.50 | 10.49 | 15.89 |
| Wuhu | 9.21 | 10.39 | 7.22 | 9.72 | 14.59 | 13.37 | 12.96 | 14.25 | 20.52 | 24.47 | 28.39 | 31.23 | 57.17 | 77.16 |
| Bengbu | 6.07 | 7.39 | 7.12 | 9.36 | 5.11 | 4.88 | 7.40 | 5.80 | 6.76 | 5.18 | 11.38 | 19.18 | 16.07 | 17.95 |
| Huainan | 24.03 | 24.43 | 26.62 | 33.54 | 38.45 | 44.00 | 37.61 | 42.91 | 57.60 | 70.29 | 103.54 | 103.91 | 95.70 | 111.16 |
| Ma’anshan | 30.11 | 33.98 | 29.07 | 29.94 | 34.16 | 40.71 | 40.93 | 50.52 | 50.34 | 46.72 | 41.99 | 38.12 | 49.83 | 33.46 |
| Huaibei | 38.83 | 36.27 | 38.96 | 35.89 | 45.50 | 53.54 | 51.34 | 46.13 | 62.03 | 65.22 | 67.30 | 73.58 | 75.89 | 82.25 |
| Tongling | 11.10 | 14.01 | 14.15 | 19.25 | 24.84 | 25.57 | 30.52 | 30.57 | 27.10 | 29.45 | 34.54 | 39.63 | 32.67 | 29.00 |
| Anqing | 26.78 | 24.07 | 25.10 | 25.77 | 28.15 | 23.96 | 28.25 | 24.95 | 21.97 | 19.85 | 21.37 | 21.96 | 19.79 | 25.59 |
| Huangshan | 5.69 | 7.54 | 6.15 | 8.99 | 15.55 | 10.48 | 14.65 | 16.44 | 10.10 | 8.47 | 9.10 | 8.27 | 12.18 | 8.64 |
| Chuzhou | 4.20 | 4.93 | 4.34 | 5.98 | 9.82 | 6.48 | 8.36 | 8.02 | 9.97 | 6.12 | 8.12 | 9.91 | 12.38 | 11.81 |
| Fuyang | 7.75 | 8.86 | 8.32 | 9.92 | 7.41 | 10.20 | 23.56 | 31.53 | 31.50 | 34.49 | 42.40 | 38.23 | 32.04 | 34.37 |
| Suzhou | 7.53 | 7.32 | 7.63 | 8.54 | 12.39 | 8.46 | 18.85 | 34.41 | 29.97 | 28.76 | 31.52 | 35.37 | 24.89 | 40.15 |
| Lu’an | 5.61 | 5.76 | 6.27 | 7.52 | 12.13 | 11.41 | 15.19 | 17.04 | 13.95 | 15.95 | 17.64 | 20.34 | 23.16 | 21.67 |
| Bozhou | 4.91 | 5.00 | 4.91 | 5.98 | 8.90 | 10.68 | 14.42 | 17.20 | 19.14 | 16.50 | 23.74 | 20.07 | 17.25 | 29.80 |
| Chizhou | 6.73 | 6.84 | 8.54 | 19.09 | 21.30 | 20.47 | 24.50 | 22.74 | 27.73 | 31.25 | 27.61 | 31.68 | 37.06 | 47.16 |
| Xuancheng | 12.97 | 13.52 | 12.93 | 18.56 | 27.73 | 21.26 | 24.54 | 30.69 | 26.45 | 23.32 | 21.40 | 22.84 | 11.75 | 17.91 |
| Year | Length Along the X-Axis (km) | Length Along the Y-Axis (km) | Corner θ/° | Shape Index | Center Point Location | Center Point Travel Distance (km) | |
|---|---|---|---|---|---|---|---|
| Longitude | Latitude | ||||||
| 2000 | 332.5648 | 185.9253 | 148.8502 | 0.5591 | 117.4815 | 31.87549 | - |
| 2001 | 329.8621 | 184.5526 | 149.3329 | 0.5595 | 117.503 | 31.87627 | 2.0063 |
| 2002 | 316.7730 | 179.3950 | 148.3463 | 0.5663 | 117.5082 | 31.91052 | 3.8854 |
| 2003 | 332.1035 | 177.4020 | 148.4271 | 0.5342 | 117.5287 | 31.90536 | 2.0018 |
| 2004 | 297.4051 | 179.1823 | 146.5859 | 0.6025 | 117.5613 | 31.74423 | 18.3888 |
| 2005 | 305.7318 | 204.8776 | 145.7331 | 0.6701 | 117.629 | 31.73695 | 6.3682 |
| 2006 | 325.2200 | 200.8603 | 140.3168 | 0.6176 | 117.5295 | 31.72676 | 9.3542 |
| 2007 | 319.1689 | 201.2809 | 146.4969 | 0.6306 | 117.6355 | 31.64998 | 13.1403 |
| 2008 | 350.0887 | 195.8500 | 147.7696 | 0.5594 | 117.5267 | 31.89085 | 28.9476 |
| 2009 | 376.3077 | 206.4175 | 149.7956 | 0.5485 | 117.5371 | 31.85602 | 4.0383 |
| 2010 | 339.9784 | 192.1851 | 158.3078 | 0.5653 | 117.4205 | 31.67886 | 22.7152 |
| 2011 | 339.5637 | 192.7145 | 150.1284 | 0.5675 | 117.4669 | 31.84986 | 19.7251 |
| 2012 | 315.5482 | 184.7639 | 148.6076 | 0.5855 | 117.4183 | 31.85691 | 4.5960 |
| 2013 | 354.6385 | 194.8166 | 149.1212 | 0.5493 | 117.4523 | 32.01192 | 17.7341 |
| Year | Length Along the X-Axis (km) | Length Along the Y-Axis (km) | Shape Index | Corner θ/° | Center Point Location | Center Point Travel Distance (km) | |
|---|---|---|---|---|---|---|---|
| Longitude | Latitude | ||||||
| 2000 | 368.4625 | 173.9290 | 0.4720 | 158.2997 | 117.4290 | 32.0134 | - |
| 2001 | 359.9858 | 172.5175 | 0.4792 | 155.9261 | 117.4780 | 32.0405 | 5.5235 |
| 2002 | 350.1577 | 170.7132 | 0.4875 | 156.5649 | 117.4570 | 31.9960 | 5.3978 |
| 2003 | 359.4039 | 169.6379 | 0.4720 | 155.1829 | 117.4890 | 32.0213 | 4.1235 |
| 2004 | 349.7740 | 170.0246 | 0.4861 | 155.3808 | 117.5170 | 91.9387 | 9.6706 |
| 2005 | 361.6847 | 165.0617 | 0.4564 | 155.1621 | 117.5020 | 32.0146 | 8.6744 |
| 2006 | 361.5075 | 174.9090 | 0.4838 | 155.0922 | 117.4820 | 32.0324 | 2.7294 |
| 2007 | 362.6224 | 175.1150 | 0.4829 | 152.6779 | 117.4820 | 32.0812 | 5.4922 |
| 2008 | 355.7807 | 164.1931 | 0.4615 | 151.1164 | 117.4500 | 32.1585 | 9.1917 |
| 2009 | 360.0115 | 158.2403 | 0.4395 | 151.4397 | 117.4200 | 32.2541 | 11.1228 |
| 2010 | 364.2466 | 159.3147 | 0.4374 | 152.4104 | 117.3960 | 32.2713 | 2.9744 |
| 2011 | 368.4817 | 160.3891 | 0.4353 | 153.3811 | 117.3680 | 32.3015 | 4.2475 |
| 2012 | 370.0547 | 158.7944 | 0.4291 | 153.4240 | 117.3760 | 32.2852 | 1.9519 |
| 2013 | 373.0478 | 157.2671 | 0.4216 | 153.6727 | 117.3480 | 32.3169 | 4.4103 |
Publisher’s Note: MDPI stays neutral with regard to jurisdictional claims in published maps and institutional affiliations. |
© 2022 by the authors. Licensee MDPI, Basel, Switzerland. This article is an open access article distributed under the terms and conditions of the Creative Commons Attribution (CC BY) license (https://creativecommons.org/licenses/by/4.0/).
Share and Cite
Zhang, T.; Chen, L.; Yu, Z.; Zang, J.; Li, L. Spatiotemporal Evolution Characteristics of Carbon Emissions from Industrial Land in Anhui Province, China. Land 2022, 11, 2084. https://doi.org/10.3390/land11112084
Zhang T, Chen L, Yu Z, Zang J, Li L. Spatiotemporal Evolution Characteristics of Carbon Emissions from Industrial Land in Anhui Province, China. Land. 2022; 11(11):2084. https://doi.org/10.3390/land11112084
Chicago/Turabian StyleZhang, Ting, Longqian Chen, Ziqi Yu, Jinyu Zang, and Long Li. 2022. "Spatiotemporal Evolution Characteristics of Carbon Emissions from Industrial Land in Anhui Province, China" Land 11, no. 11: 2084. https://doi.org/10.3390/land11112084