Article

Ecological Well-Being Performance Evaluation of Chinese Major Node Cities along the Belt and Road

1
School of Management, Xi’an University of Architecture and Technology, Xi’an 710055, China
2
Research Center of Green Development and Mechanism Innovation of Real Estate Industry in Shaanxi Province, Xi’an University of Architecture and Technology, Xi’an 710055, China
3
School of Civil Engineering, Chongqing University of Science and Technology, Chongqing 401331, China
*
Author to whom correspondence should be addressed.
Land 2022, 11(11), 1928; https://doi.org/10.3390/land11111928
Submission received: 28 September 2022 / Revised: 24 October 2022 / Accepted: 26 October 2022 / Published: 29 October 2022
(This article belongs to the Special Issue Feature Papers for Land, Biodiversity, and Human Wellbeing Section)

Abstract

:
Under the constraints of resources and the environment, improving the urban ecological well-being performance (EWP) is a fundamental requirement and inevitable choice for urban ecological civilization construction and sustainable development. In this paper, 36 Chinese major node cities along the Belt and Road were selected as the research area, and an EWP evaluation index system was constructed. The two-stage Super Network Slack-based measure (Super-NSBM) model was used to evaluate the static EWP from 2011 to 2018, and the Malmquist–Luenberger productivity index was used to evaluate the dynamic EWP. It was found that: (1) The EWP value of 36 Chinese major node cities along the Belt and Road from 2011 to 2018 did not reach effectiveness, with Sanya, Shenzhen, and Haikou being the top three performers. (2) In terms of two-stage efficiency, the ecological economic efficiency in the first stage was significantly lower than the economic well-being efficiency in the second stage, which indicated that the low ecological economic efficiency was the main reason for the low average value of the EWP. (3) From the dynamic analysis results, the Malmquist–Luenberger productivity index experienced a fluctuating upward trend, and the technical change was the main factor for the improvement in the EWP. Finally, policy recommendations were proposed based on the above findings. This study will contribute to the sustainable development of Chinese major node cities along the Belt and Road, and can provide a reference for other Belt and Road regions.

1. Introduction

The “Silk Road Economic Belt” and “21st Century Maritime Silk Road” (short for the B&R) are major initiatives for China to build a new pattern of all-round opening up and to deeply integrate into the world economic system. It is an important initiative to strengthen mutually beneficial cooperation among regions along the route and promote regional stability and development [1]. The Chinese major node cities along the B&R have geographical location advantages and have the ability to gather and radiate international and domestic elements, which are important economic, trade, and cultural hubs within the Belt and Road regions [2]. However, these cities are at different levels of economic development, facing the serious situation of ecological degradation and urban diseases, as well as the burden of promoting the development of environmental industries and the ecological transformation of industries [3,4].
China has issued the Guidance on Promoting Green Belt and Road Construction, the Belt and Road Ecological Environmental Protection Cooperation Plan, and other documents in recent years, which have made green development the core status and important task of the Belt and Road construction. Green development not only reflects the process of adapting natural environment protection to economic and social development, but it also reflects the process of transforming natural resources into economic benefits and human well-being [5]. The EWP refers to the efficiency of converting natural consumption into a well-being level [6,7,8]. The EWP mirrors the sustainable development degree of a region or country, which shows that the paradigm of sustainable development has changed from weak sustainable development to strong sustainable development [9,10]. To avoid the phenomenon of the inefficiency of converting natural consumption into a well-being level in the urbanization process, an effective and comprehensive urban EWP evaluation is required [11]. It is of great practical significance to evaluate the EWP of Chinese major node cities along the B&R to improve the level of green development and promote the implementation of the Belt and Road initiative.
The existing research on the EWP mainly focuses on two aspects: (1) As for the EWP evaluation, the evaluation methods mainly include the ratio method, data envelopment model (DEA) [6], stochastic frontier approach (SFA) [12], and other methods. (2) The relationship between the EWP and other influencing factors [13,14,15,16]. To sum up, the relevant literature has rich research achievements; however, there are still some shortcomings. Most of the literature is focused on the static measurement and single-stage evaluation research of the EWP, and few studies conducted a multi-stage and dynamic evaluation of the EWP. In addition, the existing literature mainly studied the country as a whole or on a province scale, while rarely exploring the EWP of Chinese major node cities along the Belt and Road.
Therefore, the objectives of this paper are: (1) to construct an EWP evaluation indicator system by selecting a sample of 36 Chinese major node cities along the B&R, and to conduct a static evaluation of the EWP by using the two-stage Super-NSBM model with undesirable output; (2) to conduct a dynamic evaluation of the EWP by using the Malmquist–Luenberger productivity index; and (3) to propose the countermeasures and relevant policy references for improving the EWP.
The contributions of this study are as summarized. First, the two-stage Super-NSBM method with undesirable output was used to evaluate the static EWP of Chinese major node cities along the Belt and Road, which can solve the problems that the “black-box operation” of the traditional DEA method. Second, the Malmquist–Luenberger productivity index was used to compare the EWP, which can help to explore the dynamic changes in urban EWP. Third, 36 Chinese major node cities along the B&R were selected as the research object, which, to a certain extent, makes up for the lack of research on the EWP in this region. This paper provides recommendations for the construction and sustainable development of urban ecological civilization, which can promote the high-quality economic and green development of Chinese major node cities along the Belt and Road.

2. Literature Review

Daly first proposed the EWP as the ratio of services to throughput [17,18,19]. The EWP reflects the efficiency of converting ecological resources into human well-being [20], which is an effective tool for measuring sustainable development [21]. The EWP integrates economic growth, ecological protection, and social well-being improvement, and the essence of the EWP lies in obtaining the maximum social well-being with the least transformation of ecological resource inputs [22,23].
In the evaluation system structure of the EWP, an important problem is the measurement of the well-being level. Generally speaking, well-being mainly includes objective well-being and subjective well-being [24]. Objective well-being usually involves economic stability, education, and medical security, which reflects people’s basic economic and environmental needs. In contrast, subjective well-being reflects people’s views and feelings about their environment. In the existing relevant literature, objective well-being indicators are mainly divided into three types: the first type is the indicator based on gross domestic product (GDP). The second type is a single indicator, such as life expectancy at birth, infant mortality, and so on. The third type is the human development index (HDI) issued by the United Nations Development Programme. The HDI is one of the most widely used objective well-being indicators, including education, health care, and economic dimensions.
Regarding the evaluation of the EWP, there are three main methods, namely, the ratio method, the DEA method, and the SFA method. For example, Moran et al. chose the ratio of ecological footprint (EF) per capita to the HDI for characterizing the EWP, and then measured the sustainable development level between low-income countries and high-income countries [25]. The EWP was commonly measured as the ratio of subjective well-being to the EF [26]. Zhang et al. used the ratio method for measuring the EWP of 82 countries [20]. Long et al. evaluated the sustainability level of the four island regions in China based on the EF and HDI [27]. Feng et al. used the ratio method to analyze the EWP, and they explored the relationship between the EWP and industrial structure green adjustment and green total factor productivity in China [28]. Wang et al. [29] used the ratio method, the Dagum Gini coefficient, and the Logarithmic Mean Divisia Index method to explore the EWP trend of 30 Chinese provinces and its influencing factors.
Many scholars used the DEA method to evaluate the EWP. For example, Iram et al. used the DEA model to study energy efficiency and its impact on carbon dioxide emissions and the economic environmental efficiency in some countries of Economic Co-operation and Development (OECD) economies [30]. Cracolici et al. adopted the DEA model to evaluate the level of sustainable development of Italian regions [31]. Yao et al. studied the spatiotemporal evolution and trend prediction of the EWP in China’s 30 provinces [32]. Zhou et al. adopted the Super-slack-based measure (Super-SBM) model, the spatial Durbin model, and the Tobit regression model to study the EWP of 30 Chinese provinces [33]. Wu et al. used the Super-SBM model and entropy weight models to access the EWP of 78 cities in western China [34]. Hu et al. used the Network DEA to explore the urban EWP of the spatio-temporal trend of the Yangtze River Delta [35]. Song et al. utilized the Super-SBM model to study the EWP of 30 Chinese provinces, and used the spatial Durbin model to explore the relationship between the digital economy, environmental regulations, and the EWP [36]. Wang et al. used the Super-NSBM model and DEA window analysis to evaluate the EWP of Poyang Lake Area [37].
The SFA model and other methods are usually used for evaluating the EWP. For example, Dietz et al. used the SFA model to analyze the EWP of 135 nations [38]. Xiao et al. selected 30 provinces in China as research objects, and measured the EWP through the improved SFA model [12]. Xu et al. took 57 cities in the Yellow River basin as geographical units, and revealed the evolution of the EWP from the provincial and municipal levels by using the SFA method [39]. Some scholars also used the regression method. Knight and Rosa used the non-standardized residual term of the regression function to measure the EWP [40]. There are also other evaluation methods of the EWP such as the vertical and horizontal opening grade method [41] and so on.
The literature has discussed the indicators and methods of measuring the EWP, but there are still the following shortcomings. (1) From the perspective of research objects, most previous studies on the EWP have focused on countries and provinces, but there are few studies focused on the EWP of Chinese major node cities along the B&R. (2) From the aspect of method, although some studies have used the DEA methods to evaluate the EWP, the traditional DEA models treat the whole EWP transformation process as a “black box”, and usually conduct single-stage DEA efficiency measurements without identifying the effectiveness of each stage. (3) From the aspect of study contents, most of the studies only analyze the statical EWP evaluation, but few studies conduct dynamic analyses of the EWP.
Therefore, the two-stage Super-NSBM model with undesirable output and the Malmquist–Luenberger productivity index were selected to evaluate the EWP of Chinese major node cities along the B&R from 2011 to 2018. The references and policy suggestions were provided for the green construction of the Belt and Road.

3. Methods and Materials

3.1. Methods

3.1.1. Super-NSBM Model Considering Undesired Outputs

The traditional DEA model is based on a radial perspective for efficiency evaluation. It requires all inputs and outputs to be scaled down or expanded in the same proportion and cannot cover slack variables, which usually leads to high measurement results. In order to address this shortcoming, Tone proposed the SBM model considering slack variables in 2001, which can realize the specific slack degree of each input–output indicator in the single-stage DEA efficiency evaluation [42]. The non-angle and non-radial characteristics of the SBM model avoid the bias brought in by the angle and radial selection [43,44]. Then, the Super-SBM model was constructed to solve the problem of effective sorting. However, the traditional DEA model and the SBM model for single-stage efficiency measurement are to evaluate the production process as a “black box”, which cannot effectively evaluate the real efficiency of the system operation [45].
The Super-NSBM model with undesired output can evaluate the efficiency of overall decision-making unit and sub-stage efficiency. It distinguishes output into desirable and undesirable output, and provides an effective method to solve the undesirable output problem [46]. Therefore, this paper applies the Super-NSBM model with undesirable outputs to measure the EWP. The equations are as follows:
ρ s e * = min k = 1 K w k [ 1 + 1 m k ( i = 1 m k s i k x i 0 k ) ] k = 1 K w k [ 1 + 1 v 1 k + v 2 k ( r = 1 v 1 k s r g k y r 0 g k + r = 1 v 2 k s r b k y r o b k ) ]
s . t . { j = 1 , 0 n x i j k λ j k + s i k = θ k x i 0 k , i = 1 , , m k , k = 1 , , K j = 1 , 0 n y r j g k λ j k + s g k = φ k y r 0 g k , r = 1 , , s k , k = 1 , , K j = 1 , 0 n y r j b k λ j k s b k = δ k y r 0 b k , r = 1 , , s k , k = 1 , , K ε 1 1 v 1 k + v 2 k ( r = 1 ν 1 k s r g k y r 0 g k + r = 1 ν 2 k s r b k y r 0 b k ) z ( k , h ) λ h = z ( k , h ) λ k , j = 1 , 0 N λ j k = k = 1 K w k = 1 λ k 0 , s k 0 , s g k 0 , s b k 0 , w k 0
In Equations (1) and (2), m k and v k denotes the number of inputs and outputs of the k stage, respectively. ϕ k denotes the number of intermediate indicators. ( k , h ) denotes the connection from k stage to h stage. x represents the input, y represents the output, z represents the intermediate output, λ k represents the model weight of the k stage, and ω k represents the weight of the k stage. s k denotes the slack variables of input indicators, s g k and s b k denote the slack variables of desirable and undesirable outputs, respectively. The two-stage efficiency evaluation was chosen for this study, so that k = 2 . At the same time, the weights of each stage are set equally since the first and second stages are equally important.

3.1.2. Malmquist–Luenberger Productivity Index

The Super-NSBM model can evaluate the EWP statically for production technologies over a period of time. However, the production process is a long-term continuous activity, where the production technology is constantly changing. The Malmquist index has many advantages, such as the possibility of decomposition and so on. However, the Malmquist index cannot effectively calculate the efficiency of production with undesirable outputs. Chung et al. proposed the Malmquist–Luenberger productivity index (MLPI) [47], which is an extension of the Malmquist index and includes the directional distance function of undesirable outputs. Therefore, the MLPI is chosen for dynamic evaluation of the EWP. The MLPI from period t to period t + 1 is calculated as follows:
M L t t + 1 = [ 1 + D o t ( x t , y t , b t ; y t , b t ) 1 + D o t + 1 ( x t + 1 , y t + 1 , b t + 1 ; y t + 1 , b t + 1 ) × [ 1 + D o t ( x t , y t , b t ; y t b t ) ] [ 1 + D o t ( x t + 1 , y t + 1 , b t + 1 ; y t + 1 , b t + 1 ) ] ] 1 2
where ( x t , y t ) and ( x t + 1 , y t + 1 ) denote the input and output of t and t + 1 period as the desirable output and the undesirable output, respectively; D o t and D o t + 1 denote the distance function of t period and t + 1 period, respectively.
The MLPI can be decomposed into the Malmquist–Luenberger Efficiency Change (EC) and the Malmquist–Luenberger Technical Change (TC):
M L t t + 1 = E C t t + 1 × T C t t + 1
If M L > 1, it indicates that the efficiency of the production unit is increasing in both periods (period t to period t + 1). If M L < 1, it indicates the efficiency of the production unit is decreasing. If M L = 1, it indicates that there is no change in the efficiency of the production unit during this period. If E C > 1, it indicates that technical efficiency is improved, and vice versa. If T C > 1, it indicates that the technical level is improved, and vice versa.

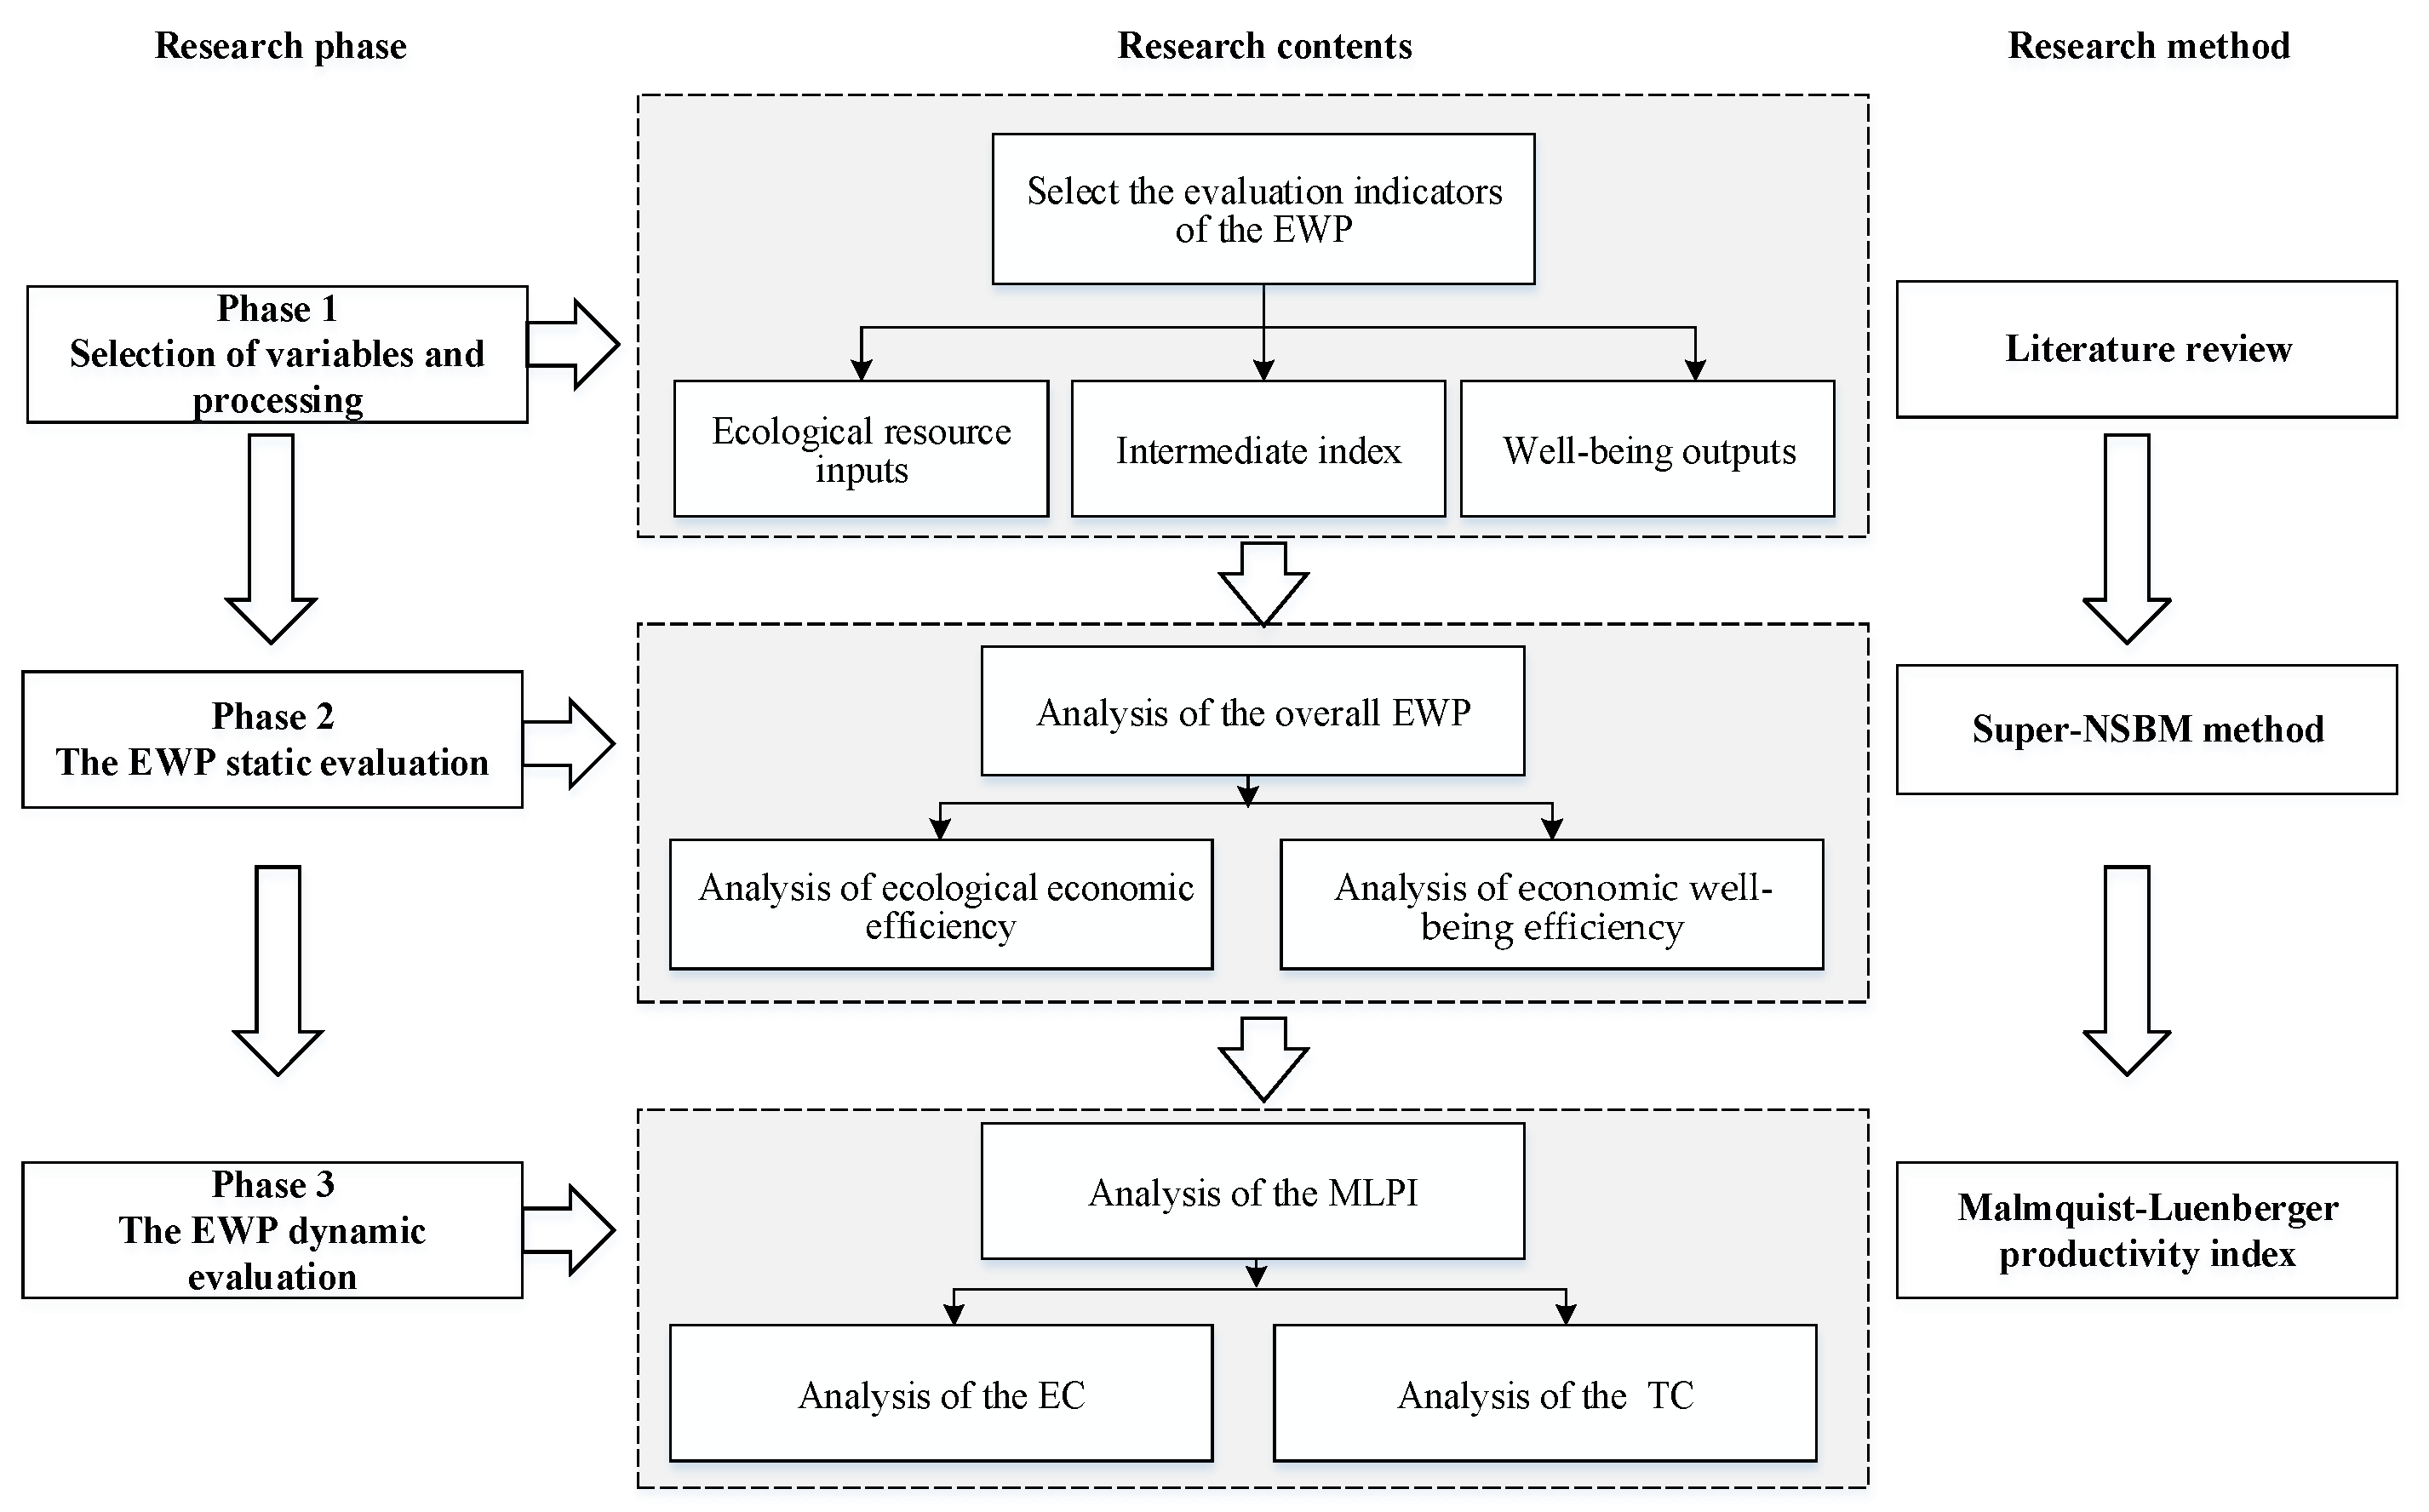
3.1.3. The Overall Research Method

The overall research method mainly includes three research phases. Firstly, the index system for evaluating the EWP was constructed. Secondly, the two-stage Super-NSBM model was selected to statically evaluate the EWP of 36 Chinese major node cities along the B&R from 2011 to 2018. Finally, the MLPI was adopted to conduct a dynamic evaluation of the EWP. The flow chart of the research methods is shown in Figure 1.

3.2. Indicator Selection of the EWP

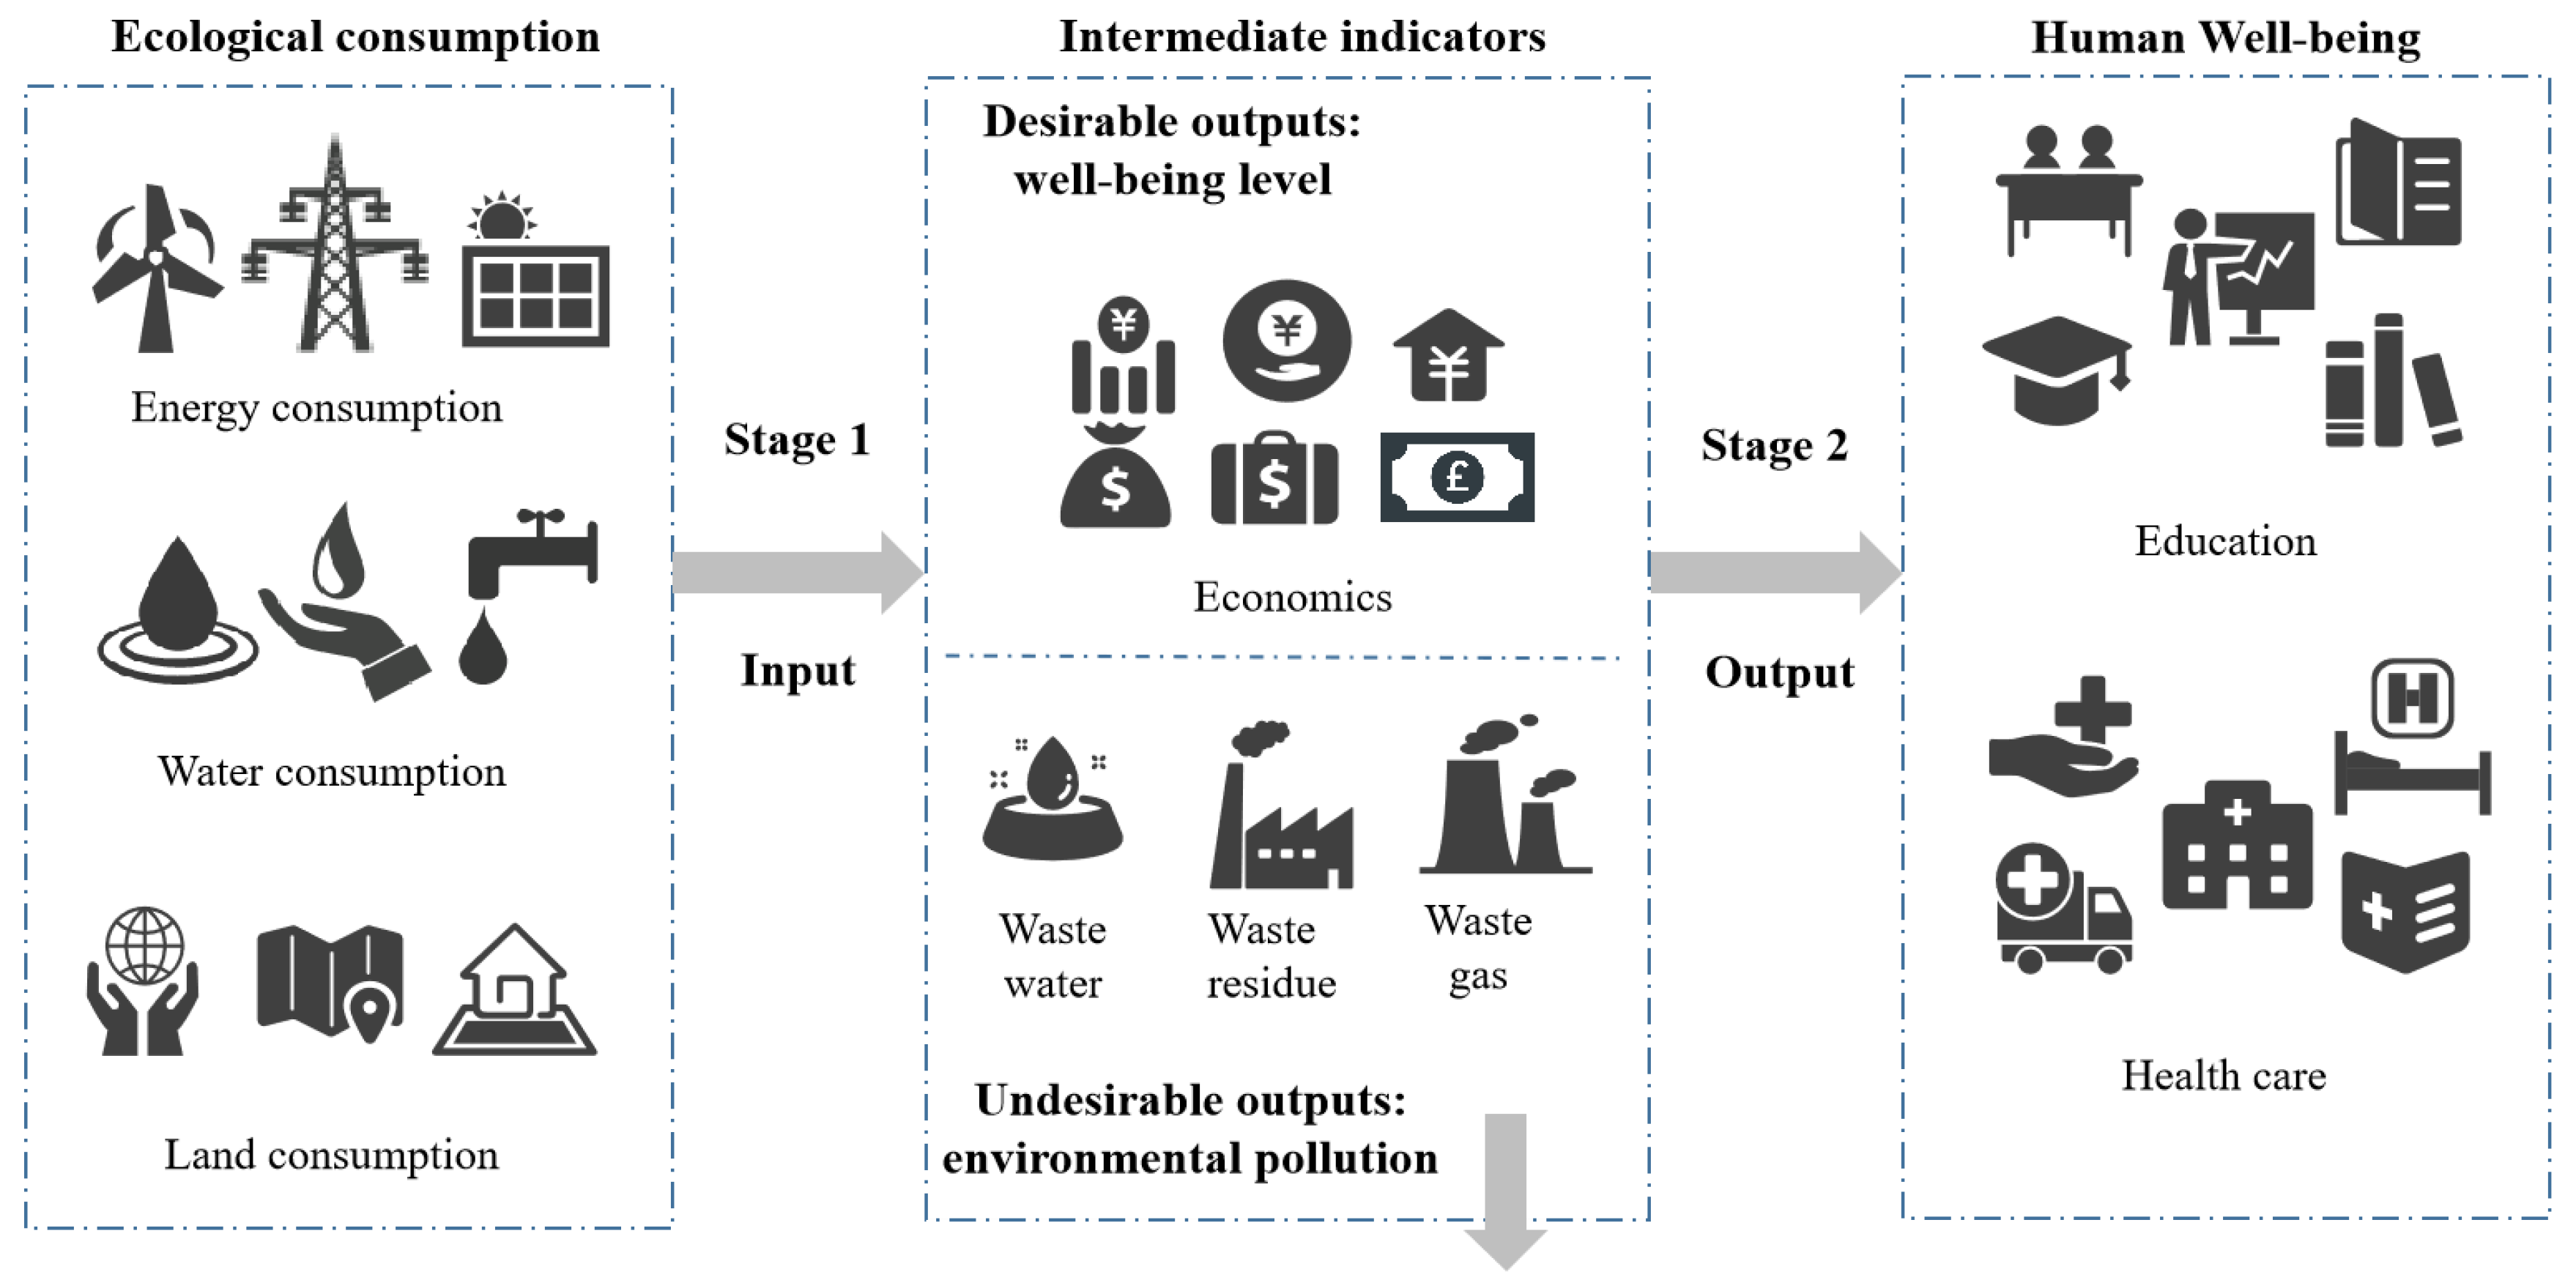
3.2.1. Indicator System Structure

The EWP means obtaining the maximum level of human well-being with the minimum resource and environmental consumption. Figure 2 reflects the EWP relationship of two-stage input–output, namely the composition of the ecological economic transformation system and economic well-being transformation system. In the first stage (ecological economic efficiency), ecological inputs are transformed by the ecological economic transformation system to obtain the output. Economic growth is only an intermediate means, not the ultimate goal [48]. In the intermediate indicators, the economic development level is the desirable output of the first stage and the input of the second stage, which is represented by per capita GDP. The wastewater, waste gas, and solid waste are selected as undesirable outputs of intermediate indicator. In the second stage (economic well-being efficiency), the final output of economic well-being transformation system is the human well-being level.
According to the study of Fu et al. [49], the E W P consists of two parts: ecological economic efficiency ( G D P / E I ) and economic well-being efficiency ( W B / G D P ) , indicating that both ecological economic efficiency and economic well-being efficiency should be emphasized in the construction of ecological civilization. Referring to previous literature [50,51], the EWP can be expressed by the following formula:
E W P = W B E I = G D P E I × W B G D P
where E W P denotes ecological well-being performance. W B denotes well-being. E I denotes ecological input, namely, the amount of resource and environmental consumption. G D P denotes the level of economic development.

3.2.2. The EWP Evaluation Index System

(1) Input indicators
Considering the increasingly prominent problems of land resources, water resources, and energy supply in the current urbanization process, land, water, and energy consumption are included in this paper. In the selection of ecological input indicators, the total urban water supply and the total social electricity consumption are selected to measure the urban water resources and energy input indicators [52]. The area of urban construction land is selected to reflect the land resource input indicator.
(2) Intermediate indicators
Due to economic growth being only an intermediate means [51], the GDP per capita is represented to reflect the desirable output of the intermediate indicator, which is characterized by per capita GDP. The undesirable outputs mainly consider the three indicators, and wastewater discharge, sulfur dioxide (SO2), and soot/dust are chosen to reflect the environmental pollution of the city.
(3) Output indicators
The output indicators of well-being are evaluated from the dimensions of education development level and health care level [11]. The number of college students is chosen to characterize the education level, and the average life expectancy is selected to measure the health care level [53].
Taking into account the availability and continuity of data, the indicator system of the EWP is constructed, as shown in Table 1. Per capita consumption of each city is used in the empirical for eliminating the effect of scale. Referring to the relative literature [54,55], all economic data are converted into comparable prices based on the year 2011 in order to reflect the authenticity of the data.

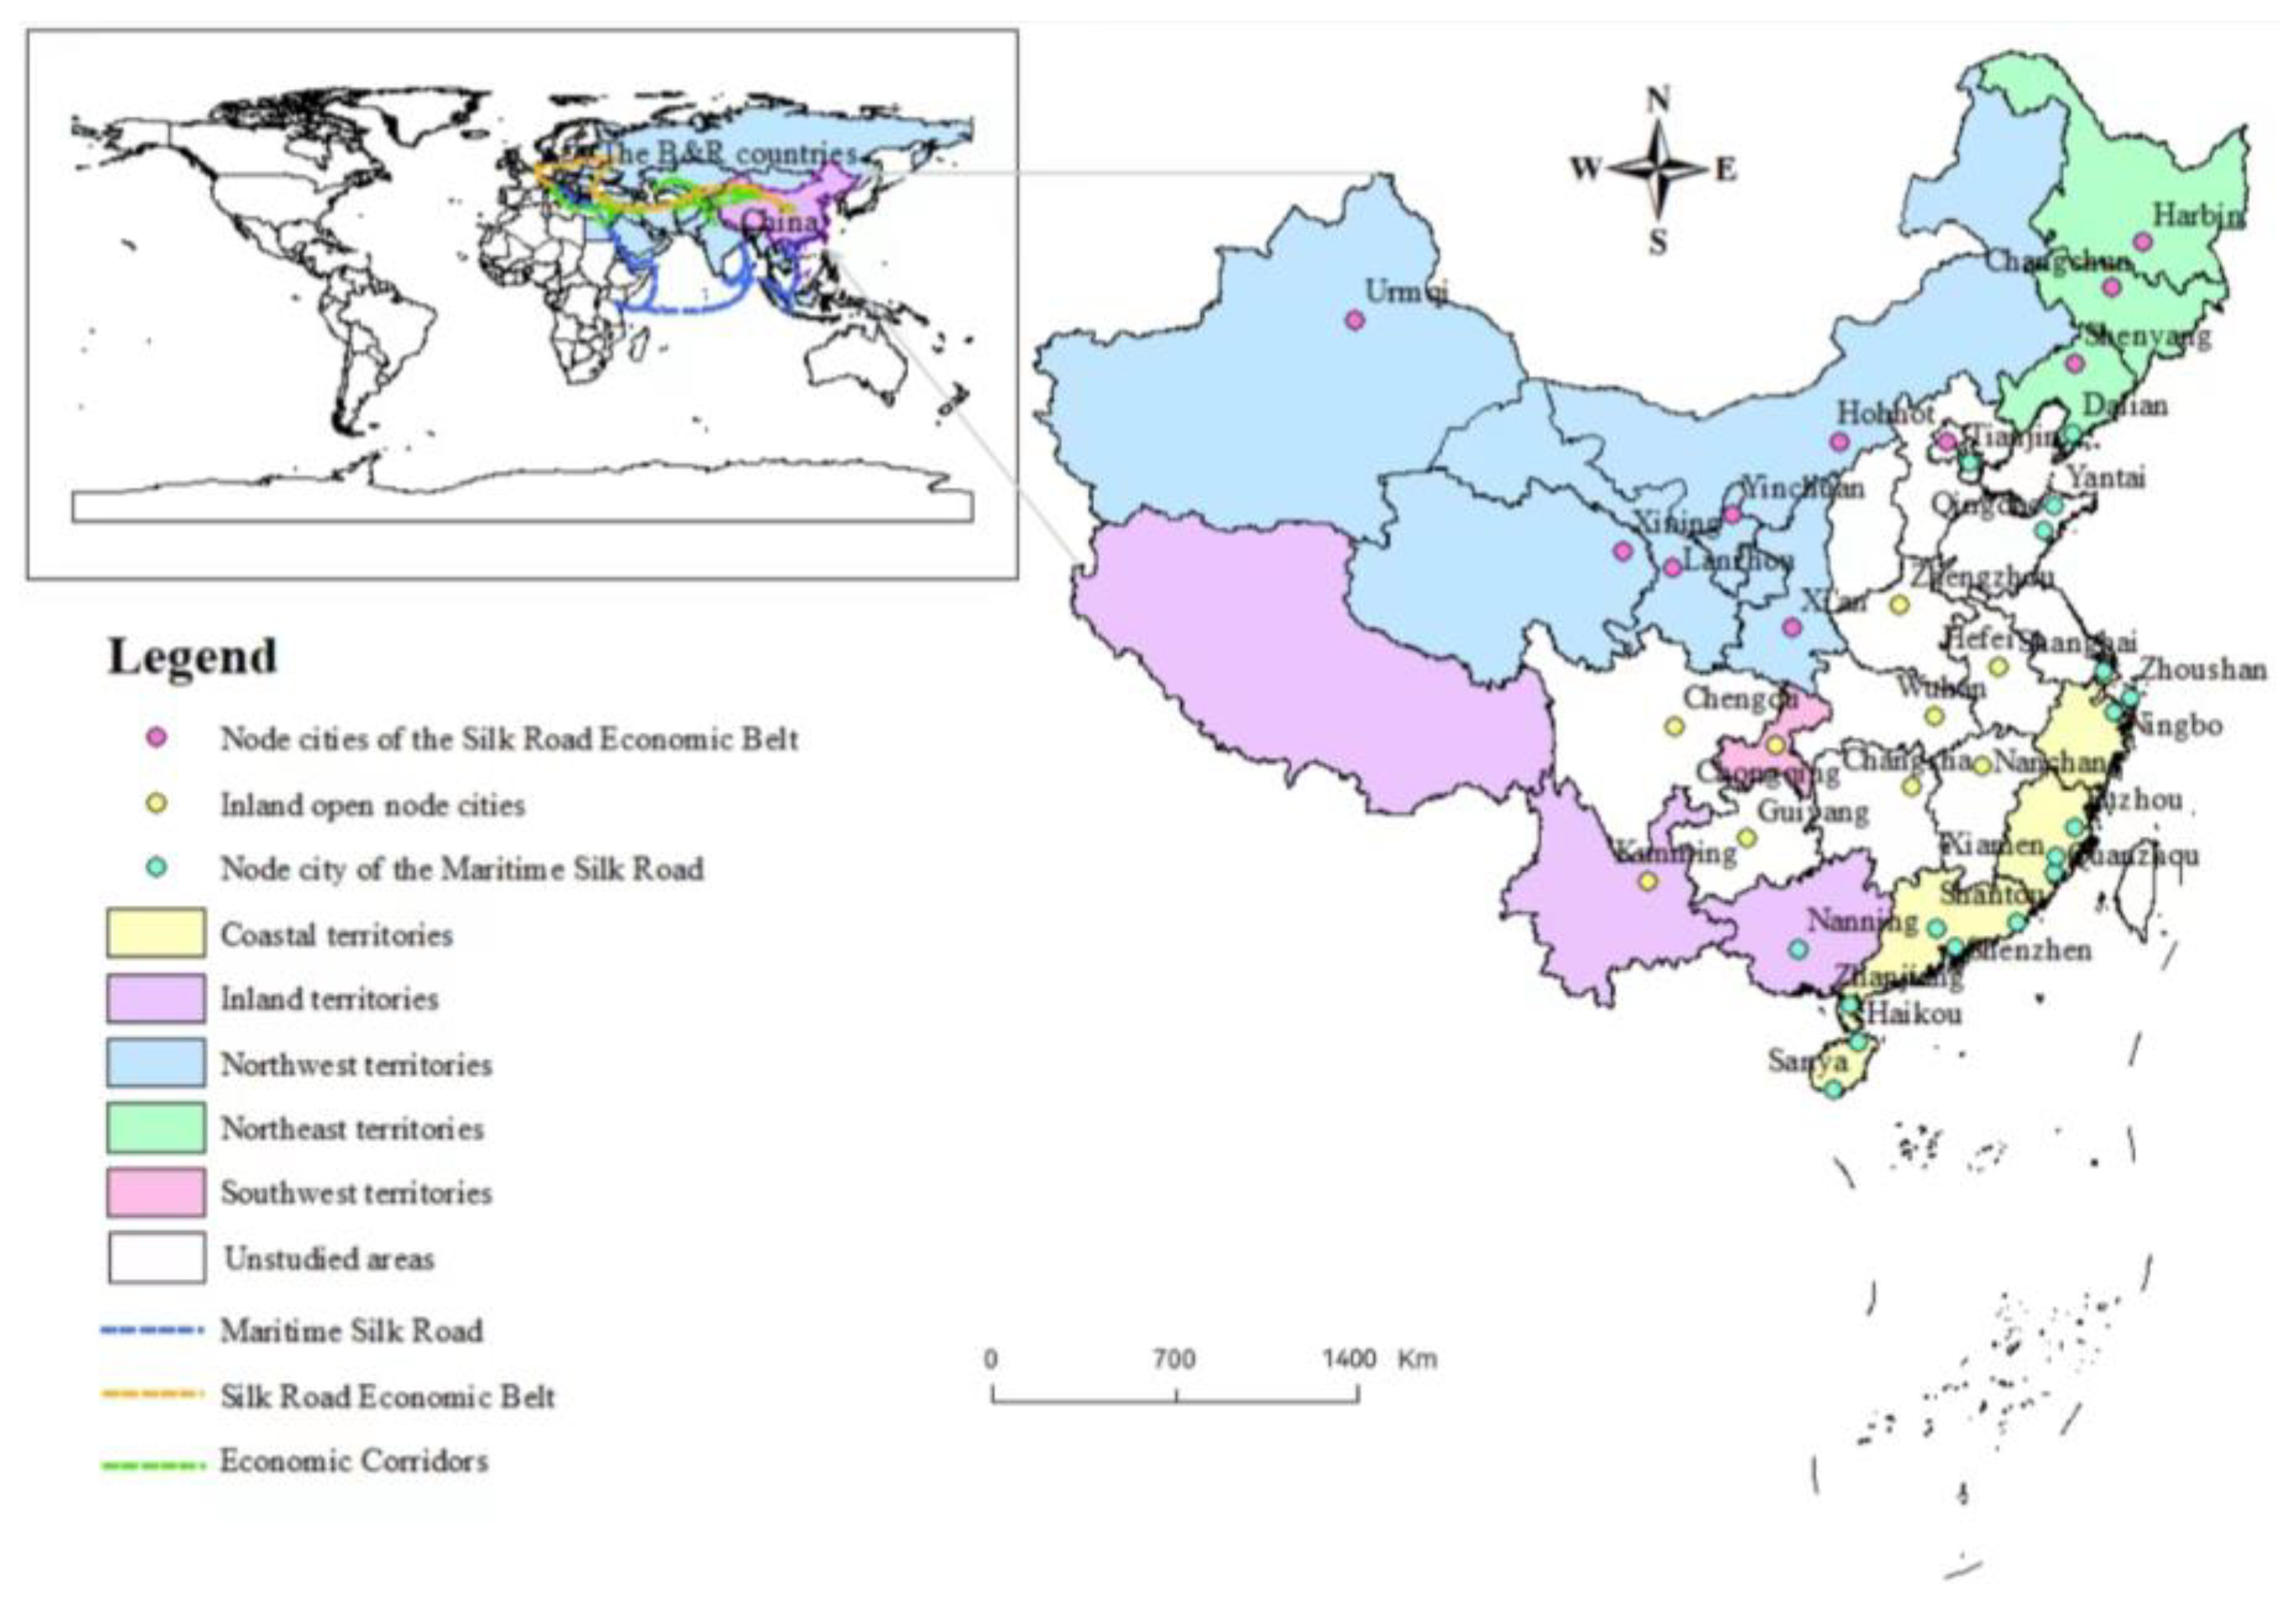
3.3. Study Area and Data Sources

According to “the Vision and Action to Promote the Joint Construction of the Silk Road Economic Belt and the 21st Century Maritime Silk Road” issued by the Chinese government in 2015, 36 Chinese major node cities along the B&R (Lhasa is not analyzed because of the lack of data) are selected in this paper. The study area is shown in Figure 3. The 36 Chinese major node cities along the B&R have high economic levels and openness, strong functions such as gathering and radiating, as well as have advantages in terms of data availability and comparability. The ecological well-being status of the Chinese node cities along the B&R can reflect the scale and quality of sustainable development. The optimization of the EWP of node cities plays an important role in promoting the green Belt and Road initiative, so as to provide a basis for formulating and improving the sustainable development quality policies.
According to the national elaboration of the Belt and Road initiative, the Chinese major node cities along the B&R are classified into three categories according to their opening directions and roles: node cities of the Silk Road Economic Belt, node cities of the Maritime Silk Road, and inland open node cities, and the classification is shown in Table 2. Considering that the statistical caliber of some indicators such as water resource consumption has changed since 2019, the study period from 2011 to 2018 is selected in this paper. The study period has experienced the Belt and Road initiative proposed in 2013, the “12th Five Year Plan”, “13th Five Year Plan”, and “new urbanization construction”, which has important research value. Furthermore, the relative changes in the EWP of node cities before and after the Belt and Road initiative can be compared and analyzed. The data of indicators were obtained from the China Urban Statistical Yearbook, China Statistical Yearbook, and environmental status bulletins of each city, and so on. Since life expectancy at birth is not included in the statistical yearbooks of most cities, data were collected through the internet or relevant health statistics bulletins. The data source of the HDI was collected from China Human Development Report Special Edition 2019.

4. Results

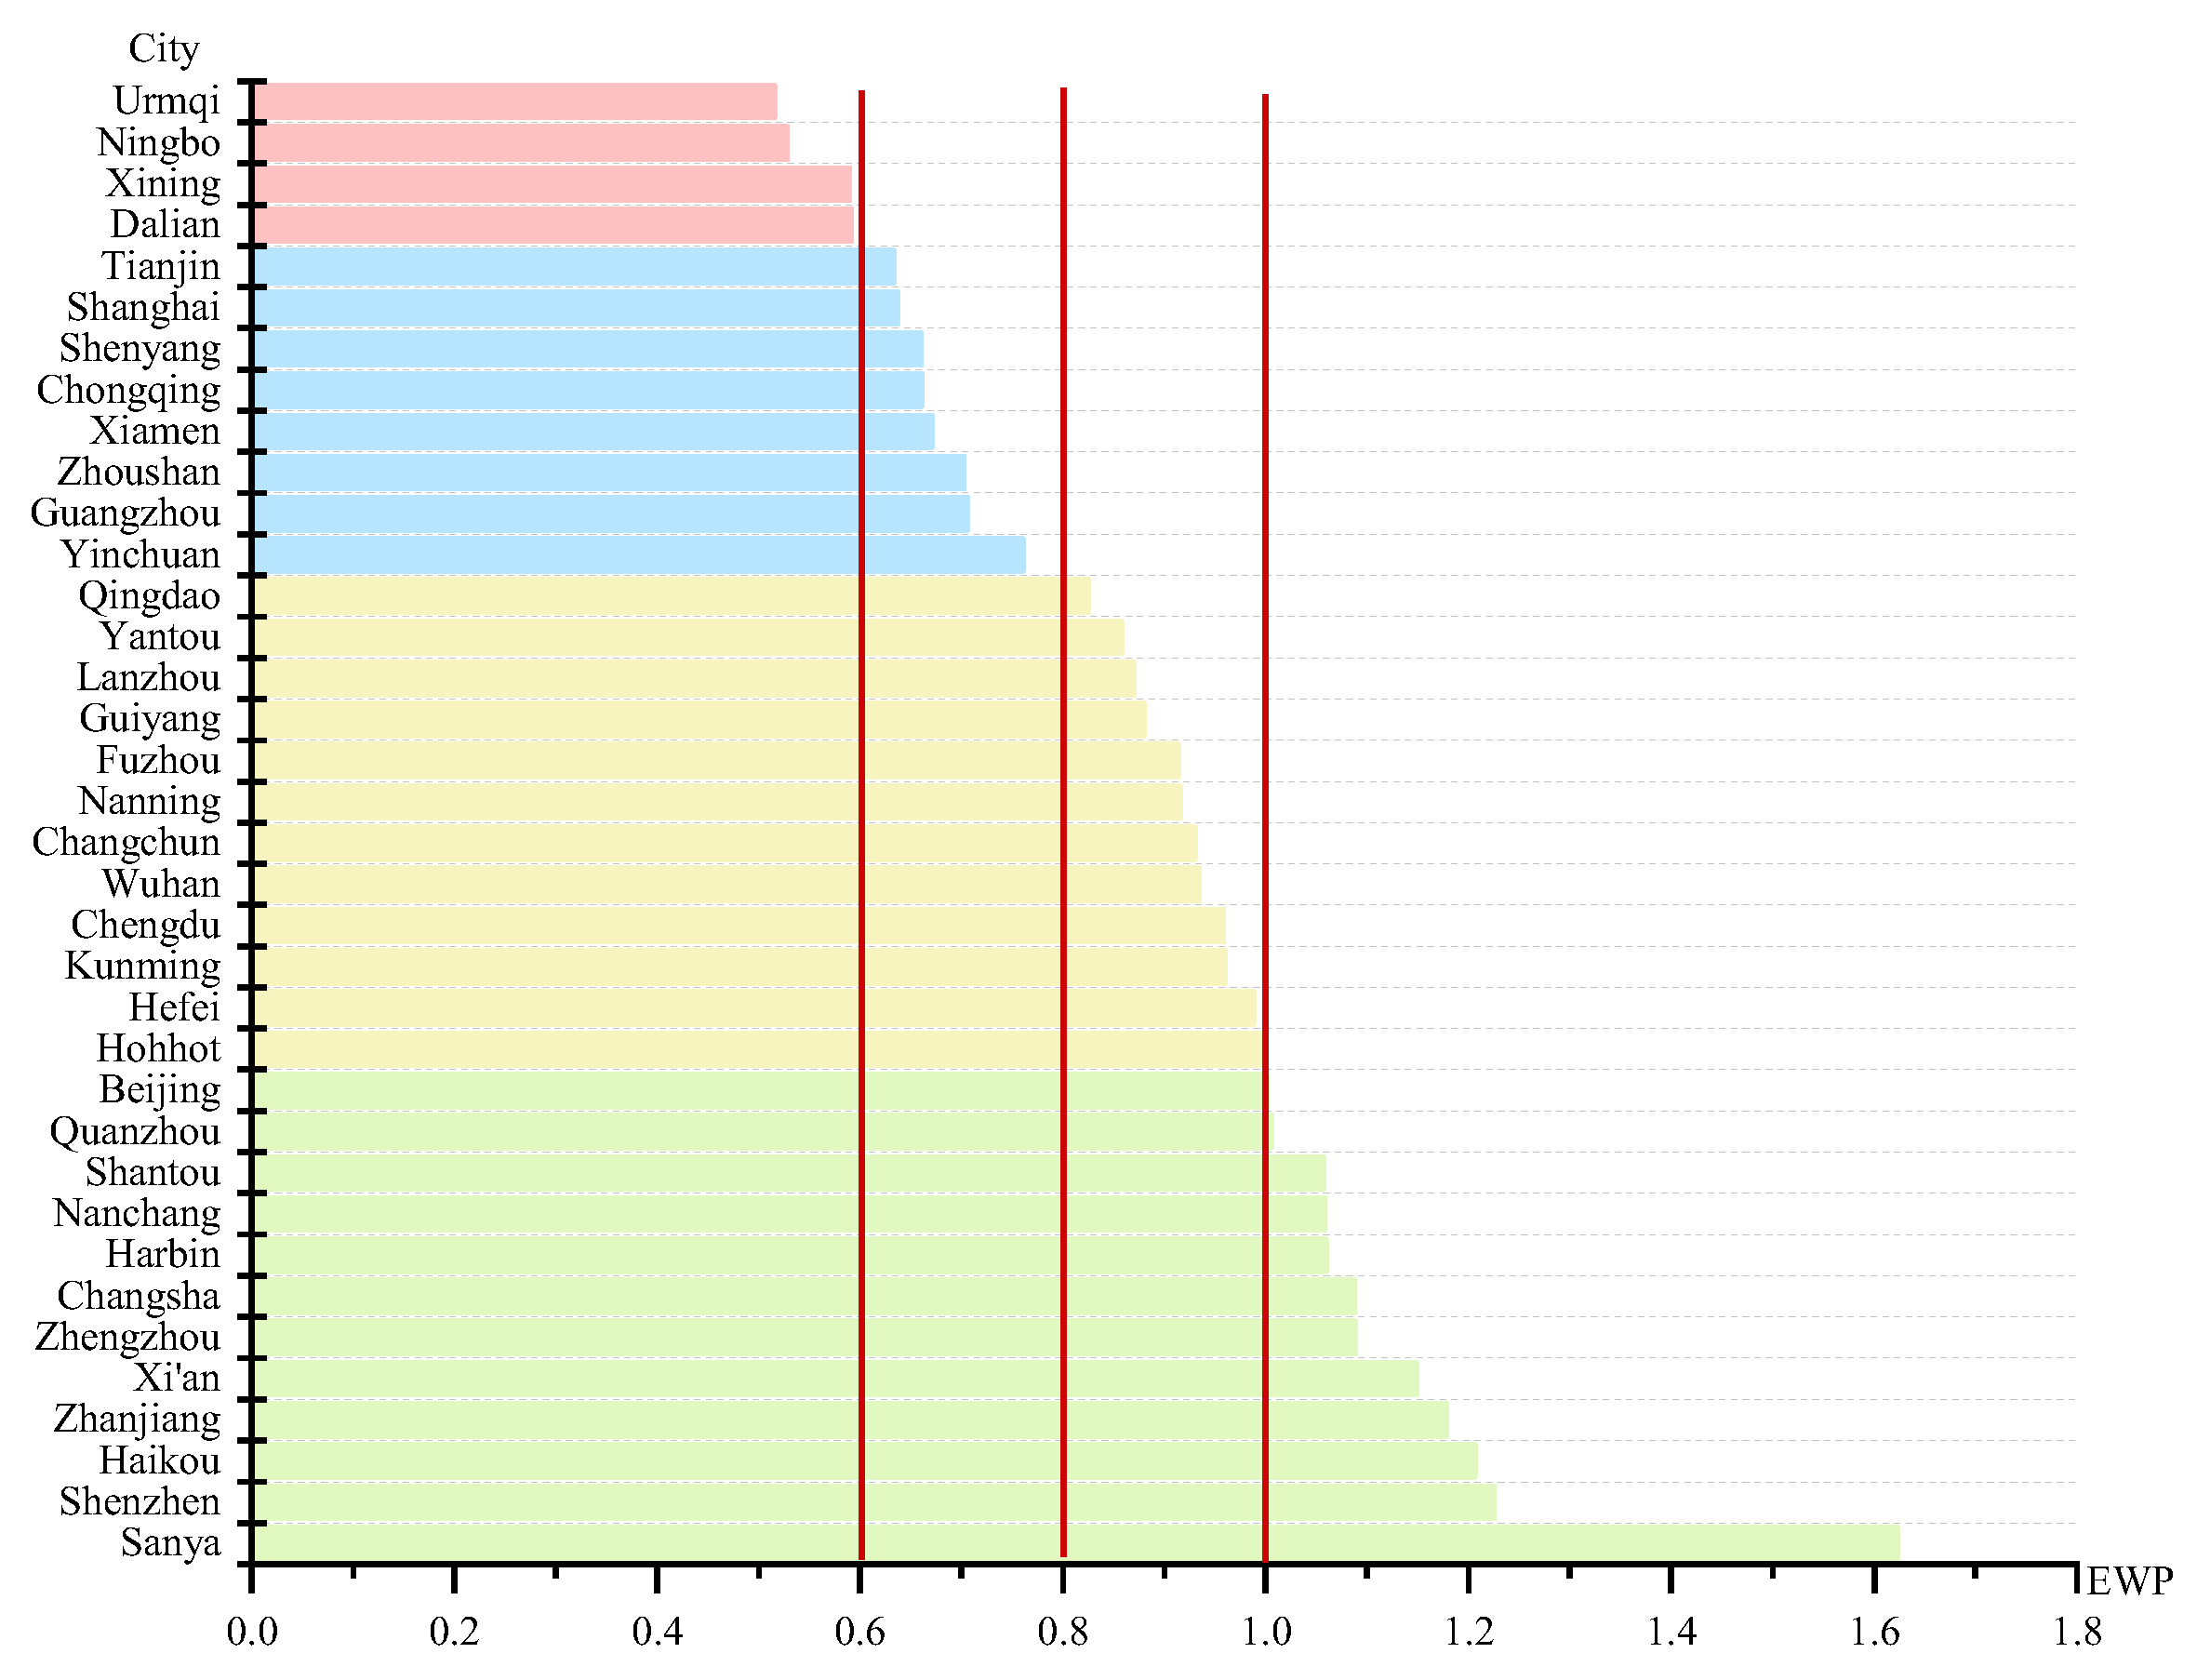
4.1. The EWP Scores and Its Two-Stage Efficiency

The input–output data of Chinese major node cities along the B&R during the period of 2011–2018 were analyzed based on the Super-NSBM model, and MaxDEA software was used to evaluate the EWP. The EWP scores are shown in Table 3. On the whole, the average EWP was 0.901, and the average EWP values of 12 cities reached effectiveness (Figure 4). These cities are the most competitive and green development potential cities, with a strong agglomeration effect and scale benefit. Sanya, Shenzhen, and Haikou are the top three performers in terms of the EWP value. However, the average EWP values of 24 cities were less than one, which did not achieve DEA effectiveness. The cities with relatively low EWP values include Xining, Ningbo, and Urumqi, indicating that the transformation of the EWP in these cities is not satisfactory and needs to reduce resource waste and environmental pollution for promoting the improvement of the EWP.
From the aspect of the trend, the average EWP of 36 Chinese node cities along the B&R in 2011 was 0.858, and the average EWP in 2017 was 0.955, which was higher than that in 2011. Especially after 2013, the average EWP had a significant decline, and then steadily improved. However, the average EWP slightly decreased in 2018, indicating that 2017 was not an inflection point for the continuous improvement of the EWP, and the urban development model for the continuous improvement of the EWP had not yet been formed.
The level of EWP depends on the ecological economic efficiency in the first stage and the economic well-being efficiency in the second stage. Appendix A shows the decomposition of the EWP from 2011 to 2018. It can be seen that only Changsha, Sanya, Shenzhen, and Zhengzhou achieved DEA effectiveness, and the efficiency values in the two stages were consistently greater than one. It shows that most node cities failed to achieve the coordinated development of ecology, economy, and well-being during the study period. The average ecological economic efficiency in the first stage was 0.91. Shenzhen, Sanya, Changsha, Beijing, Quanzhou, Zhanjiang, Zhengzhou, Hohhot, and Haikou had an average ecological economic efficiency greater than one. It indicates that the nine cities achieved better-coordinated development of ecological environment and economic growth.
The average economic well-being efficiency in the second stage was 1.09. From Appendix A, 12 cities of economic well-being efficiency achieved DEA effectiveness, among which Haikou, Sanya, Changsha, Xiamen, Zhengzhou, Hefei, Chongqing, Yinchuan, Nanning, Beijing, Kunming, and Lanzhou all had economic well-being efficiency greater than one. It indicates that the ecological civilization construction of these cities promotes the growth of ecological well-being while boosting the development of the ecological economy. Twenty-three cities in both 2014 and 2017 had economic well-being efficiency greater than one. However, cities such as Lanzhou, Yinchuan, and Xining continue to have low economic well-being efficiency, which has become a shortcoming for these cities to improve people’s well-being.

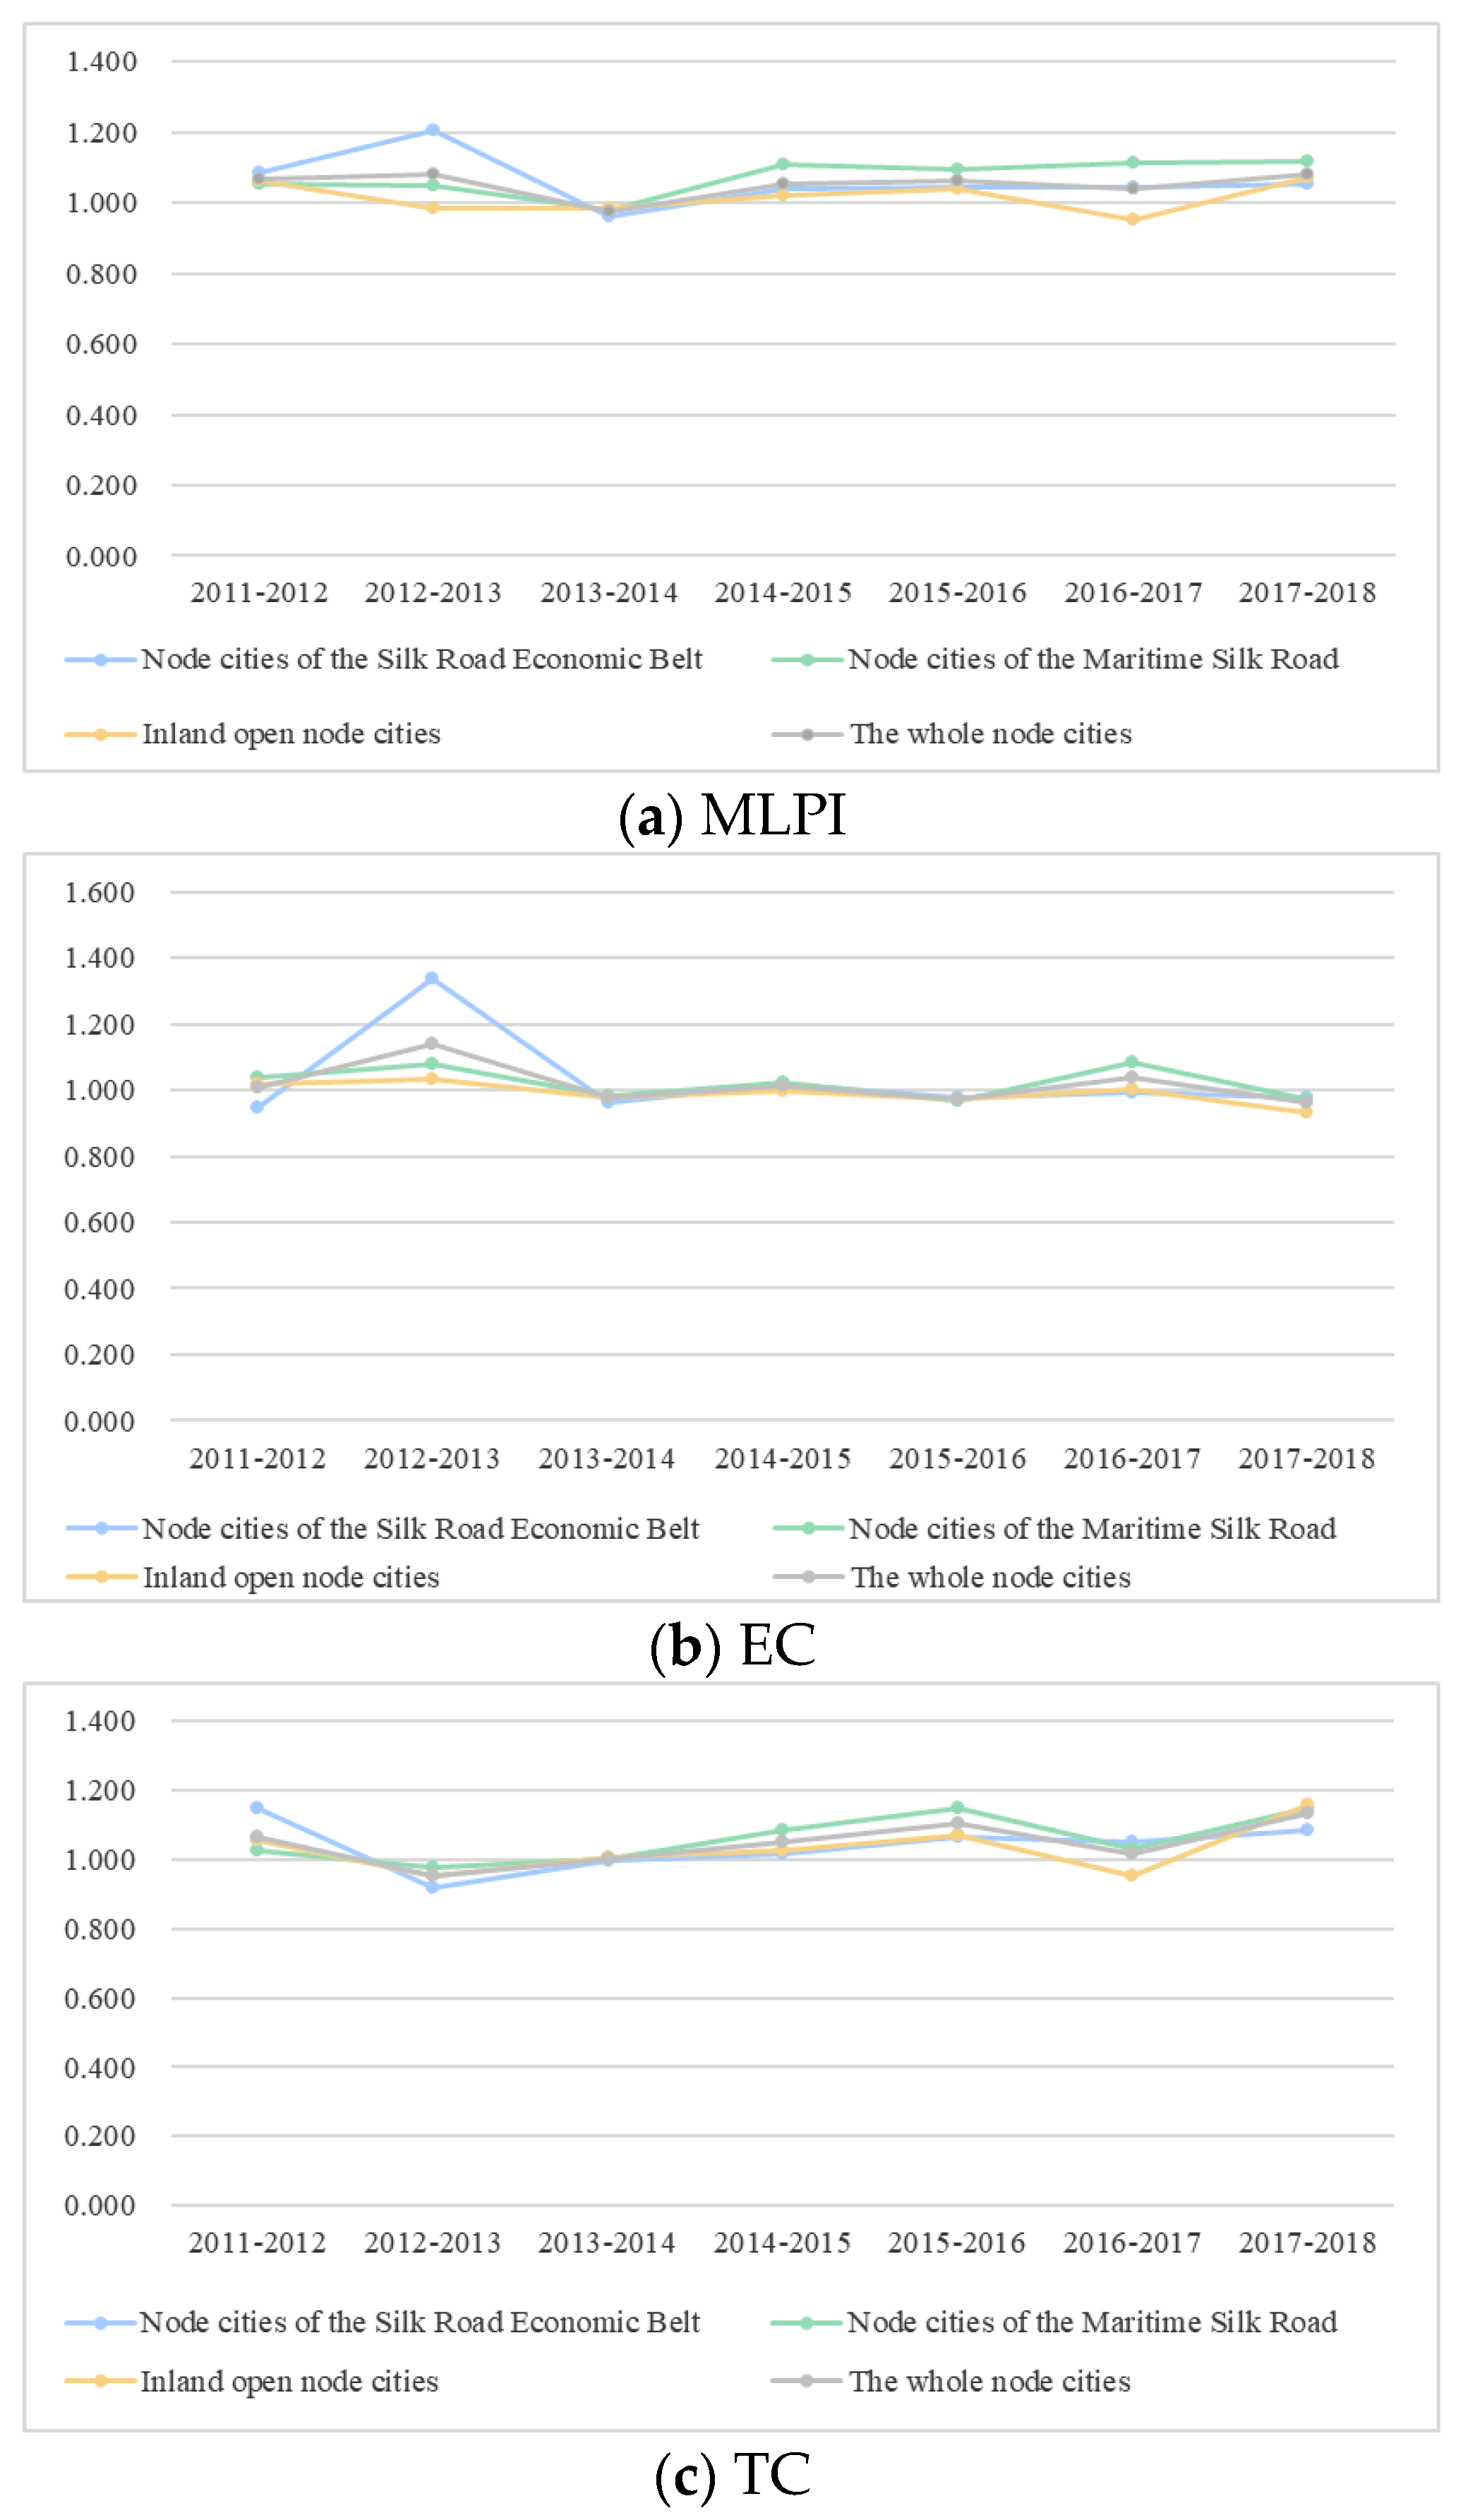
4.2. Analysis of the MLPI and Its Decomposition

Based on the static analysis of the Super-NSBM model, the MLPI approach was used to study the dynamic trend of the EWP. The average values of the MLPI of 36 node cities, and its efficiency change (EC) and technological change (TC) were obtained by using MaxDEA 8 Ultra software, as shown in Table 4. As a whole, the MLPI of Chinese node cities along the B&R ranged from 1.065 to 1.088 during the study period, and the average value of the MLPI was 1.048. Specifically, 2012–2013 was a period of accelerated growth. 2013–2014 was the recession stage of the MLPI, and 2014–2018 was a rising period of the MLPI.
The MLPI and its decomposition are further explored, as shown in Figure 5. The MLPI of Chinese node cities along the B&R has obvious regional characteristics. The MLPI growth rates of the node cities of the Maritime Silk Road and inland open node cities from 2011 to 2018 were 6.034% and 0.837%, respectively. The MLPI decline rate of node cities of the Silk Road Economic Belt was 2.931%. The EC reflects the resource allocation capacity, resource use efficiency, and scale agglomeration changes in cities. The average value of EC from 2011 to 2018 was 1.016. In 2012–2013, the average value of EC had improved obviously. This confirmed the proposal and promotion of the ecological civilization strategy in China. The average values of EC of nine cities, namely, Quanzhou, Xining, Shenyang, Hohhot, Changsha, Chongqing, Hefei, Wuhan, Shanghai, Sanya, and Guiyang had not achieved DEA effectiveness, indicating that the resource utilization rates of these node cities need to be further strengthened.
The TC reflects the impact brought about by new processes and innovative technologies, such as energy conservation and emissions reduction, on the EWP. The average value of TC from 2011 to 2018 was 1.04. It indicates that the TC plays a major role in the development process of urban EWP and is an important driver of EWP improvement. There was a decline in 2012–2013, showing a convergence trend, and it reached a maximum in 2017–2018. Except for Nanchang, Ningbo, and Nanning, the average TC values of the other 33 cities achieve DEA effectiveness. The most obvious growth of TC was Xiamen, which showed that Xiamen’s technological progress and innovation have developed rapidly in recent years.

5. Discussion

5.1. Static Analysis on the EWP

The results in Section 4 have revealed the EWP and its two-stage efficiency. From a general perspective, the overall average EWP of 36 Chinese node cities along the B&R had not reached effectiveness. Sanya, Shenzhen, and Haikou ranked among the top three in terms of average EWP. They have some common characteristics in terms of economic development and environmental protection. These node cities are developed port cities along the east coast, with a high level of economic development and scientific and technological innovation. The industries are mainly high-end manufacturing and service industries and have formulated strict regulations on pollutant control, with strong green development capacity and potential [53]. Green construction of the B&R should consider the major Chinese node cities as a key breakthrough, and should focus on the public–private leading toward integrated management for the Belt and Road region [56].
In terms of the two-stage efficiency evaluation on the EWP, the ecological economic efficiency in the first stage was significantly lower than the economic well-being efficiency in the second stage. It indicates that the low ecological economic efficiency was the main reason for the low overall level of the EWP. The average ecological economic efficiency of the remaining nine cities achieved DEA effectiveness. Especially in some western node cities, low ecological economic efficiency is the main reason for the low overall level of the EWP, and these cities should focus on improving ecological economic efficiency. The economic well-being efficiency of 12 cities achieved DEA effectiveness. In particular, the economic well-being efficiency of the eastern developed node cities was at a low level such as in Ningbo. These node cities should broaden the transformation path of the ecological economy, promote ecological industrialization and industrial ecological development, and increase objective well-being.

5.2. Dynamic Analysis of the EWP

The dynamic change of the MLPI in Table 4 shows that the MLPI has shown a fluctuating upward trend from 2011 to 2018. This was achieved by the node cities, which successively issued a number of policies and regulations in recent years. This observation mirrored that of Zhang [57], China’s “12th Five Year Plan” and “13th Five Year Plan” vigorously promoted the construction of ecological civilization, and 10 of the 36 major node cities of the B&R were approved as the first batch of the ecological civilization construction demonstration areas in 2013. Under the constraint of resources and the environment, protecting the natural environment and ecological resources has gradually become an important task of the state and local governments. The node cities of the Maritime Silk Road ranked first (1.074), and the node cities of the Silk Road Economic Belt (1.062) and inland open node cities (1.017) ranked second and third according to the MLPI, respectively. The MLPI of the node cities of the Maritime Silk Road was significantly higher than the whole average value, and its change trend was the closest to the overall average value. It indicates that the node cities of the Maritime Silk Road have a prominent leading position. As shown in Figure 5, the MLPI of the node cities of the Silk Road Economic Belt in 2013–2014 had significantly declined, which shows that these cities in the northwest and northeast region are more sensitive to the impact of policies.
The average EC of the node cities of the Silk Road Economic Belt ranked first (1.031) and the node cities of the Maritime Silk Road ranked second (1.020), while the inland open node cities ranked third (0.991). The basis of resource allocation capacity and resource use efficiency in the Silk Road Economic Belt is better than that of the Maritime Silk Road node cities, and technical efficiency grows significantly. Moreover, the average TC of the Maritime Silk Road node cities, Silk Road Economic Belt node cities, and inland open node cities were 1.060, 1.041, and 1.033, respectively. This is because the technological innovation levels of the Maritime Silk Road node cities are relatively high. These cities rely on the natural geographical advantages of the coastal areas, and they form a superior cumulative effect of human and capital as well as technology, which has less pressure on the resources and environment [58]. The TC of the inland open cities was the lowest, and these cities need to further promote scientific and technological innovation and technological progress.

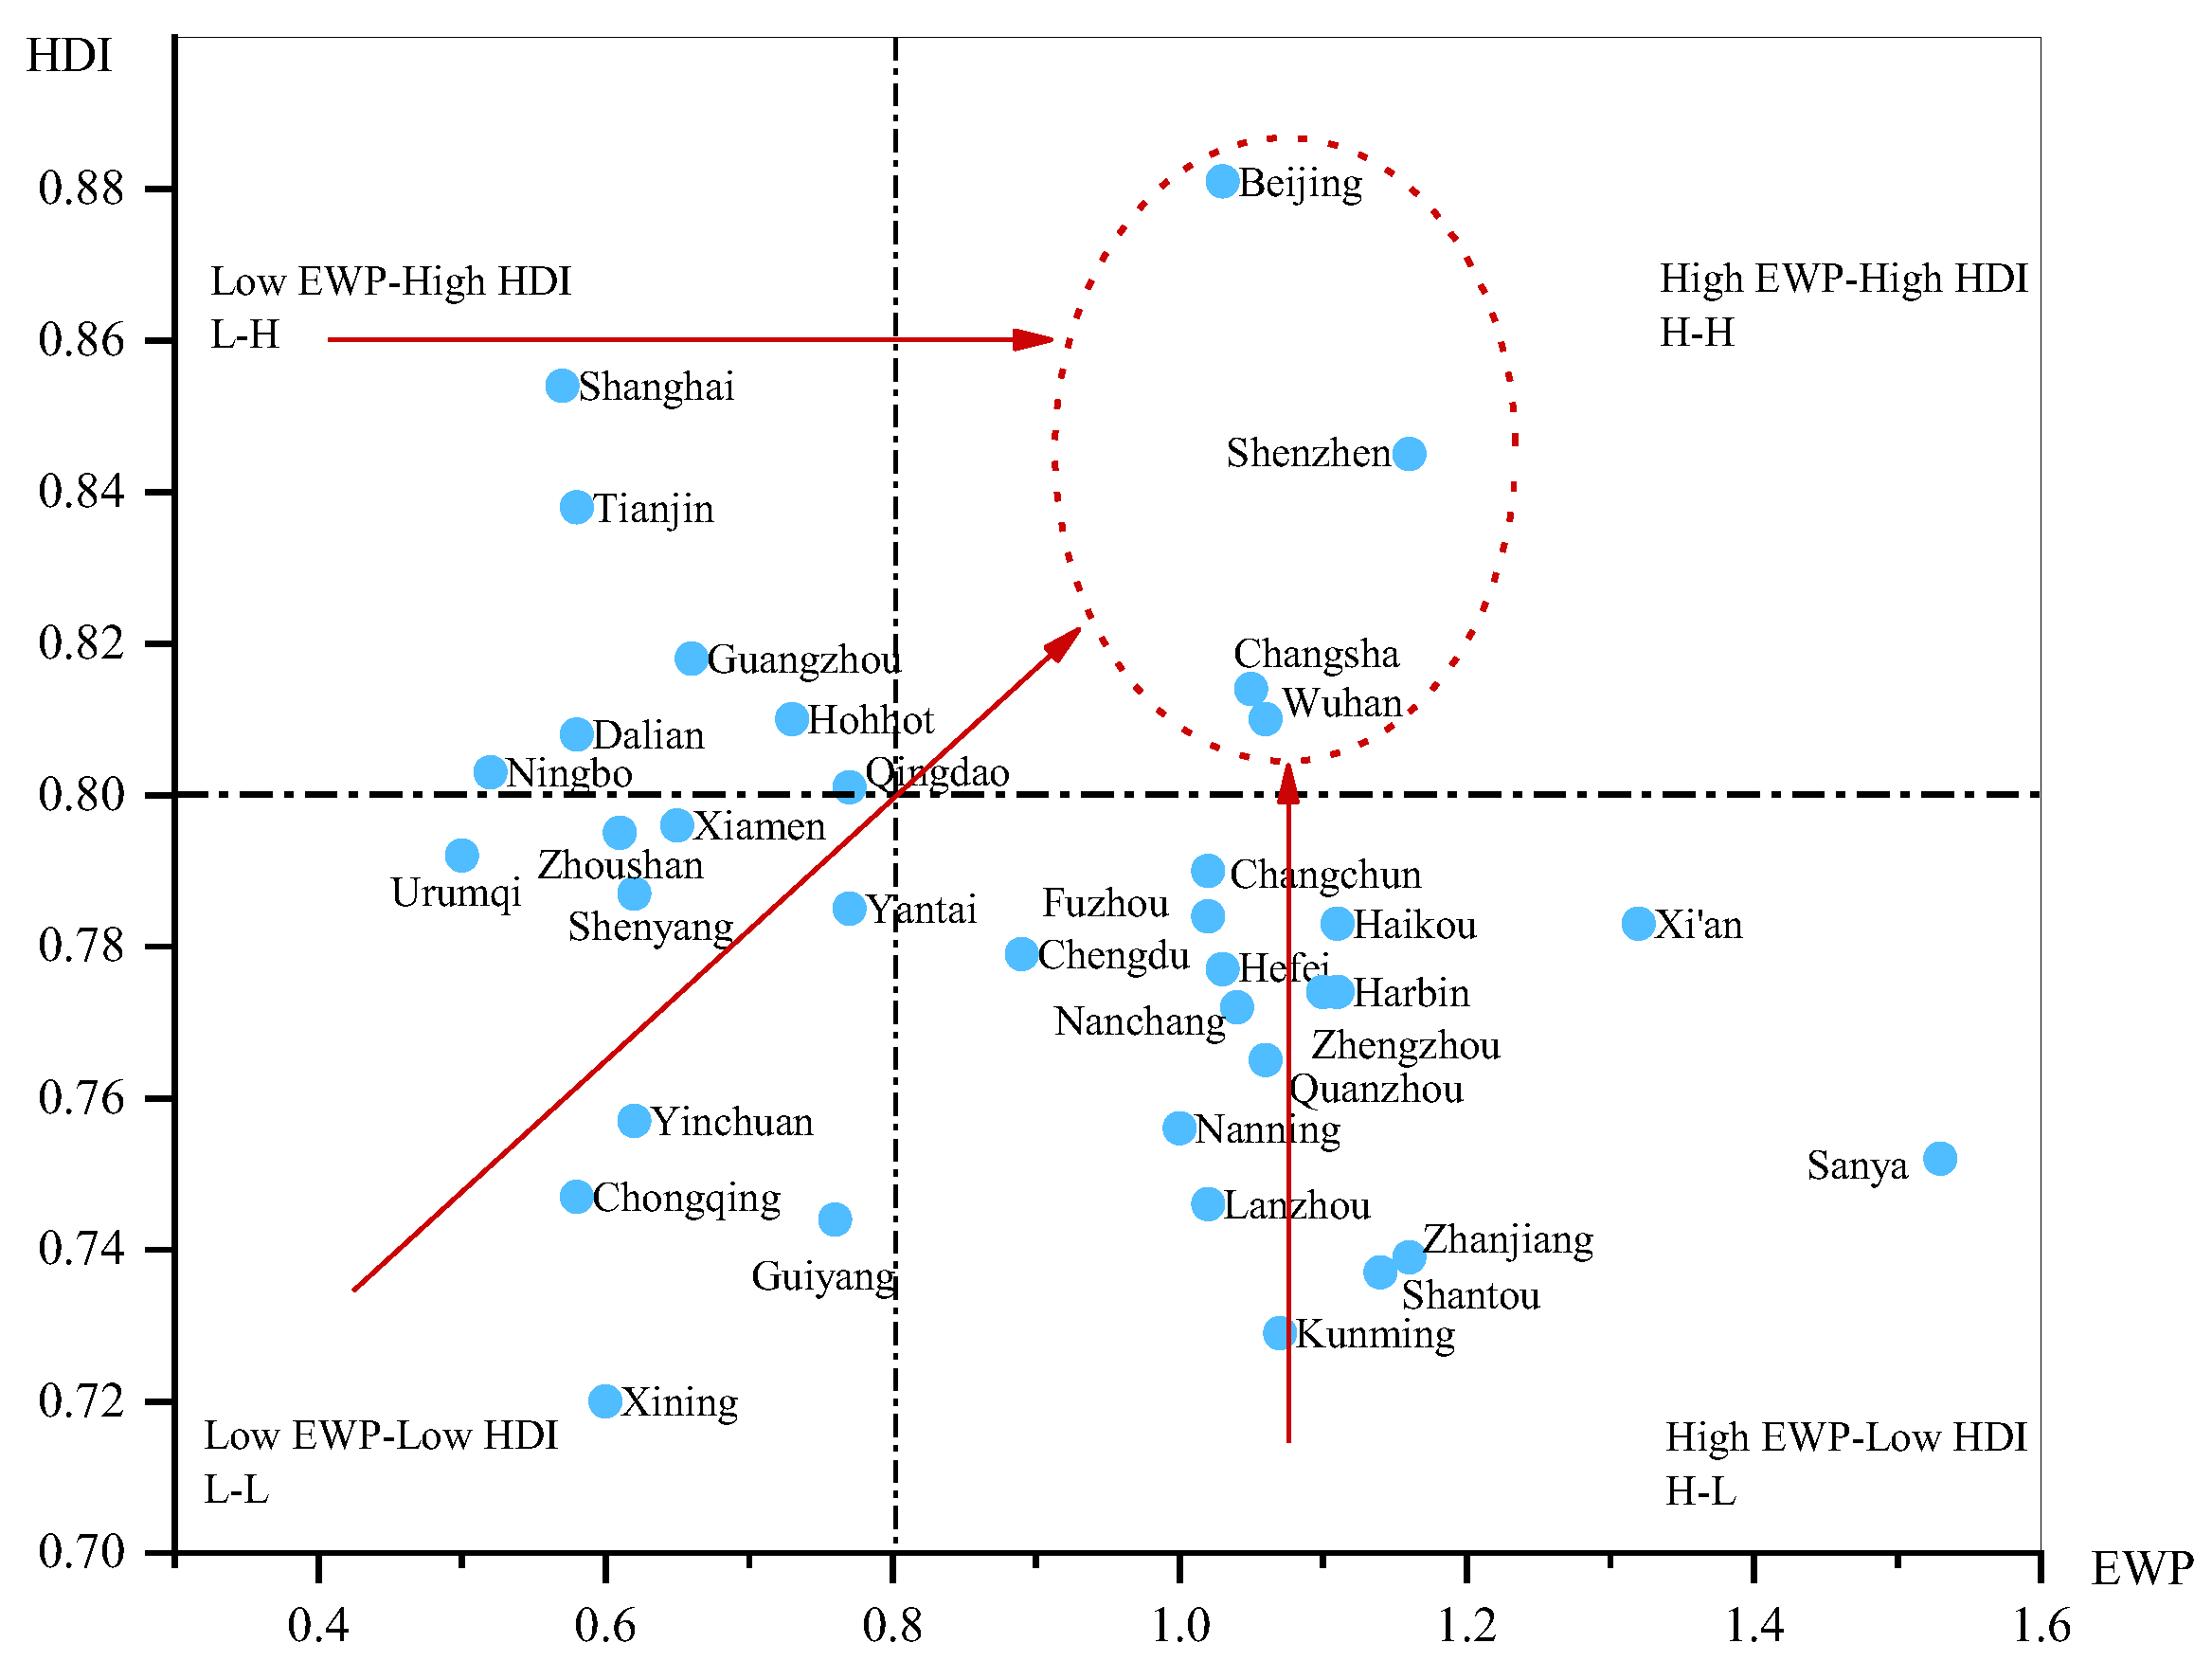
5.3. Comprehensive Comparative Analysis Based on the EWP and HDI

To achieve high-quality urban development, it is necessary not only to improve the efficiency of transforming ecological resources into human well-being, but also to improve the human well-being level. The high EWP values of some cities have low natural consumption, but the well-being levels of these cities are not high. For example, Sanya, Haikou, and other cities are of the environmentally dominant type. In this study, the relationship between the EWP and HDI was comprehensively analyzed by using a quadrant scatter chart. EWP 0.8 donates a city with a good EWP level in this study. According to the classification criteria of the Human Development Report, HDI 0.8 represents a high level of human development. The quadrant scatter chart based on the EWP and HDI of Chinese node cities along the B&R is shown in Figure 6.
There are four cities of the high efficiency and high well-being (H-H) type, including Beijing, Shenzhen, Changsha, and Wuhan. Among them, Beijing has the best coordination between the EWP and HDI. In recent years, the economic aggregate of Beijing and Shenzhen has taken the lead in China. The growth rate of well-being has caught up with the consumption rate of ecological resources. This shows that the efficiency of the transformation of ecological resources into people’s well-being in such cities has reached a high level, and that the economy, society, and environment developed in relative coordination. These cities are the ideal state of the sustainable development model, but their proportion is relatively small.
Low efficiency and high well-being (L-H) cities are Shanghai, Tianjin, Guangzhou, Dalian, Ningbo, Hohhot, and Qingdao. The typical feature of these cities is that the well-being level has reached a high level, but the efficiency of transferring ecological resources into well-being is relatively low. For example, Guangzhou has a high HDI level, but this progress is achieved by using a lot of ecological resources. These cities should combine efficiency enhancement and pollution control, promote the advanced and rational development of industries, build a new and diversified industrial structure, and establish an environmentally friendly green economic development model.
Low efficiency and low well-being (L-L) cities include nine cities, namely, Urumqi, Zhoushan, Yantai, Yinchuan, Chongqing, Xiamen, Shenyang, Guiyang, and Xining. The development characteristics of such cities are that the HDI has not reached a high level of development as a whole, and the efficiency of transforming ecological resource inputs into well-being level is low. These cities have relatively large spaces to improve their sustainable development, and the improvement path of capacity expansion, efficiency enhancement, and pollution control should be adopted. In particular, Urumqi, Xining, and other cities belong to underdeveloped regions in western China, which are remote and underdeveloped in the economy, information, and technology.
High efficiency and low well-being (H-L) cities include 16 cities, namely, Changchun, Chengdu, Fuzhou, Haikou, Sanya, Hefei, Nanchang, Harbin, Quanzhou, Nanning, Lanzhou, Shantou, Zhanjiang, Kunming, Xi’an, and Zhengzhou. The development of these cities is characterized by high EWP, but the HDI is low. In particular, Sanya has an advantage in the ecological environment, but it still needs to improve its medical, educational, and economic levels.

6. Conclusions and Policy Recommendations

6.1. Conclusions

The two-stage Super-NSBM model was used to evaluate the static EWP of 36 Chinese node cities along the B&R from 2011 to 2018. Then, this paper decomposed the EWP into two stages, ecological economic efficiency and economic well-being efficiency, and opened the “black box” of the transformation process of urban EWP. Finally, the MLPI was applied to conduct the dynamic evaluation of the EWP. The following conclusions are obtained.
(1) The overall average EWP of 36 Chinese major node cities along the B&R was 0.901, indicating that the overall production frontier had not reached effectiveness. The average EWP values of 12 cities achieved DEA effectiveness, and Sanya, Shenzhen, and Haikou were the top three performers. The cities with relatively low-efficiency values include Xining, Ningbo, and Urumqi.
(2) The ecological economic efficiency in the first stage was significantly lower than the economic well-being efficiency in the second stage. It shows that low ecological economic efficiency is the main reason for the low comprehensive level of the EWP from 2011 to 2018. Only Changsha, Sanya, Shenzhen, and Zhengzhou achieved DEA effectiveness in two stages, whereas most other node cities along the B&R failed to achieve effectiveness in two stages.
(3) From the dynamic analysis, the average values of the MLPI were all greater than 1. The MLPI from 2011 to 2018 experienced a fluctuating upward trend. The node cities of the Maritime Silk Road ranked first, and node cities of the Silk Road Economic Belt and inland open node cities were ranked second and third according to the MLPI, respectively. From the further decomposition of the MLPI, technological change was the main factor to improve the EWP of node cities along the B&R.
Nonetheless, this study has some inadequacies, and it needs further research. Concerning the EWP evaluation, there are some limitations in data collection at the city scale. The evaluation indicators need to be improved in the next study, such as residents’ subjective perception of the ecological well-being indicator and so on. In addition, the spatio-temporal evolution of the EWP of Chinese major node cities along the B&R should be treated as extensions of this study.

6.2. Policy Recommendations

First, it is necessary to consider fully the comparative advantages of Chinese major node cities, which strengthen the interaction and cooperation between the coastal, inland, northwest, northeast, and southwest territories in China. The node cities of the Maritime Silk Road should take advantage of participating in and leading international cooperation and competition. These node cities should reduce their ecological resource consumption and undesirable outputs, promote green and low-carbon development, strengthen resource utilization economization, reduce pollutant emissions, and establish a long-term monitoring mechanism for production pollution and environmental health. The node cities of the Silk Road Economic Belt and inland open node cities should make full use of ecological resources, improve technologies to enhance ecological economic efficiency, actively cooperate with the eastern coastal cities, and promote these cities to be deeply integrated into the Belt and Road construction.
Second, it is crucial to accurately orient and narrow the differences between node cities along the B&R. The cities with high efficiency and high well-being should focus on reducing the input of ecological resources, improving the utilization rate of resources and energy, and reducing pollution emissions. The cities with low efficiency and high well-being need to increase environmental pollution control, strengthen environmental pollution supervision, and control pollutant emissions. The cities with low efficiency and low well-being need to continue to promote economic development, improve the level of education and health care, and improve the quality of life of residents. At the same time, it is also necessary to improve the utilization efficiency of resources and energy, and control the emissions of pollutants. The cities with high efficiency and low well-being should comprehensively improve their economic, medical, and educational service capabilities.
Finally, the Chinese major node cities along the B&R should strengthen the driving role of scientific and technological innovation on green development, and improve the efficiency of resource allocation. The node cities of the Silk Road Economic Belts and inland open node cities should solve the environmental pollution problem in economic development, accelerate industrial transformation and upgrading, and gradually achieve a cleaner production process and green industrial structure. The node cities of the Maritime Silk Road should strengthen the transformation and utilization of scientific and technological innovation, promote the marketization of innovative achievements, establish an incentive and restraint mechanism for scientific and technological innovation, and accelerate the maximization of ecological well-being.

Author Contributions

J.B. (Jing Bian) performed the research framework and wrote the manuscript; F.L. designed the research framework; Z.H. and J.B. (Jiamin Bai) processed data; Y.W. contributed the methodology. All authors have read and agreed to the published version of the manuscript.

Funding

This work has been supported by the Natural Science Basic Research Program of Shaanxi (Program No. 2022JQ-733), the Special Scientific Research Program of Shaanxi Provincial Department of Education (Program No. 22JK0110), the National Natural Science Foundation of China (Program No. 72174162), and the Project of Chongqing Municipal Education Commission (Program No. KJQN202201513).

Institutional Review Board Statement

Not applicable.

Informed Consent Statement

Informed consent was obtained from all the subjects involved in the study.

Data Availability Statement

Not applicable.

Conflicts of Interest

The authors declare no conflict of interest.

Appendix A. Decomposition of The EWP of Chinese Node Cities along the B&R during the Period of 2011–2018

City20112012201320142015201620172018
S1S2S1S2S1S2S1S2S1S2S1S2S1S2S1S2
Beijing1.16 1.02 0.99 0.56 1.15 1.01 1.15 1.04 1.16 1.09 1.13 1.06 1.06 1.12 1.19 1.33
Changchun0.75 1.00 0.67 0.97 0.75 1.00 1.07 1.05 0.87 0.91 1.09 1.04 1.09 1.27 1.09 1.04
Changsha1.17 1.25 1.17 1.27 1.16 1.21 1.14 1.16 1.12 1.24 1.14 1.10 1.07 1.24 1.13 1.08
Chengdu0.89 1.00 0.78 1.00 0.98 1.00 1.00 1.02 0.95 1.03 0.92 0.82 0.97 1.01 1.06 1.02
Dalian0.81 0.42 0.74 0.46 0.88 0.46 0.77 0.50 0.72 0.64 0.65 0.60 0.70 0.56 0.82 0.65
Fuzhou0.82 1.00 0.67 0.92 0.81 0.97 1.06 1.01 1.09 1.01 1.11 1.04 1.09 1.06 0.79 1.00
Guangzhou0.72 0.68 0.70 0.91 0.73 0.86 0.76 0.88 0.80 0.78 0.81 0.60 0.81 0.80 0.83 0.78
Guiyang0.87 1.07 0.79 1.17 0.85 1.04 0.77 1.00 0.78 1.00 0.68 1.00 0.63 0.79 0.67 0.92
Harbin1.01 1.08 0.72 1.00 0.99 1.27 1.01 1.10 1.05 1.26 1.03 1.24 1.03 1.12 1.05 1.42
Haikou1.00 1.26 1.02 1.26 0.99 1.39 0.99 2.49 0.93 2.02 1.07 1.13 1.02 1.21 0.99 1.67
Hefei0.99 1.09 0.94 1.07 1.00 1.03 1.02 1.05 0.99 1.04 0.96 1.06 0.88 1.00 0.78 1.00
Hohhot1.13 1.13 1.09 1.08 1.12 1.05 1.08 1.03 1.09 1.00 0.70 0.92 1.03 1.22 1.04 1.07
Kunming0.60 0.96 1.01 1.01 0.94 1.00 0.89 1.09 0.90 1.11 0.98 1.16 0.96 1.00 0.75 0.77
Lanzhou0.57 0.73 0.69 0.60 0.79 1.09 0.89 1.02 0.92 1.02 0.87 1.03 0.76 0.87 0.66 0.73
Nanchang0.96 1.14 1.03 1.14 0.97 1.07 0.88 1.12 0.90 1.09 0.92 1.09 1.01 1.17 1.00 1.18
Nanning0.62 0.91 0.61 0.93 0.80 1.02 0.64 0.97 0.76 1.00 0.88 1.00 0.95 1.13 0.97 1.06
Ningbo0.84 0.40 0.79 0.38 0.82 0.42 0.85 0.42 0.76 0.45 0.86 0.40 0.91 0.52 0.84 0.36
Qingdao0.79 0.93 0.72 0.80 0.91 0.72 0.87 0.71 0.84 0.66 1.00 0.69 1.12 1.20 1.11 1.20
Quanzhou0.74 0.86 1.14 1.02 1.16 1.07 1.15 1.07 1.18 1.21 1.19 1.14 0.85 1.16 1.14 1.05
Sanya1.25 2.29 1.23 3.66 1.25 3.74 1.27 4.93 1.25 4.25 1.22 3.25 1.30 4.72 1.27 4.07
Shantou0.97 1.06 0.95 1.01 0.78 1.04 0.92 1.06 0.96 1.04 0.89 1.31 1.19 1.46 0.80 1.09
Shanghai0.93 0.45 0.91 0.40 0.77 0.53 0.72 0.56 0.81 0.56 0.77 0.51 1.16 1.14 0.80 0.41
Shenzhen1.28 1.49 1.30 1.64 1.30 1.63 1.31 1.76 1.30 1.63 1.24 1.39 1.23 1.47 1.29 1.69
Shenyang0.70 0.82 0.74 0.52 0.78 0.64 0.73 0.65 0.70 0.69 0.65 0.65 0.65 0.76 0.67 0.76
Tianjin0.83 0.59 0.81 0.51 0.89 0.54 0.79 0.60 0.77 0.58 0.93 0.43 0.90 0.59 0.89 0.57
Urumqi0.70 0.38 0.57 0.29 0.78 0.37 0.70 0.46 0.77 0.42 0.65 0.38 0.66 0.45 0.74 0.36
Wuhan0.93 1.00 0.80 0.95 1.00 0.99 1.11 1.06 1.13 1.17 1.04 1.13 0.79 0.97 0.67 0.92
Xi’an0.98 1.11 0.88 1.13 1.06 1.23 0.92 1.19 0.98 1.28 0.99 1.95 0.98 1.69 1.10 1.44
Xining0.66 0.53 0.58 0.60 0.55 0.62 0.55 0.64 0.65 0.61 0.64 0.58 0.69 0.62 0.63 0.45
Xiamen0.70 0.75 0.70 0.79 0.74 0.75 0.67 0.60 0.72 0.60 0.76 0.61 0.70 0.67 0.79 0.96
Yantai0.78 1.00 0.73 1.00 0.81 0.92 0.79 1.00 0.89 1.00 0.85 0.84 1.06 1.14 1.17 1.15
Yinchuan0.63 0.48 0.71 0.63 1.32 20.78 0.68 0.63 0.71 0.61 0.68 0.61 0.66 0.45 0.65 0.44
Zhanjiang0.95 1.41 1.16 1.58 1.02 1.40 1.06 1.43 1.04 1.43 1.04 1.39 1.06 1.44 1.04 1.43
Zhengzhou1.04 1.04 1.07 1.10 1.02 1.20 1.07 1.24 1.05 1.15 1.05 1.21 1.01 1.37 1.01 1.28
Chongqing0.78 0.88 0.69 0.93 0.73 0.62 0.75 0.60 0.74 0.54 0.72 0.50 0.79 0.54 0.82 0.50
Zhoushan0.98 0.46 0.79 0.53 0.86 0.45 0.95 0.44 0.78 0.56 0.93 0.49 1.04 1.02 1.19 1.11

References

  1. Wang, C.; Miao, Z.; Chen, X.; Cheng, Y. Factors affecting changes of greenhouse gas emissions in Belt and Road countries. Renew. Sustain. Energy Rev. 2021, 147, 111220. [Google Scholar] [CrossRef]
  2. Yang, Y.; Fan, M. Analysis of the spatial-temporal differences and fairness of the regional energy ecological footprint of the Silk Road Economic Belt (China Section). J. Clean. Prod. 2019, 215, 1246–1261. [Google Scholar] [CrossRef]
  3. Zhang, X.; Yao, L.; Luo, J.; Liang, W. Exploring Changes in Land Use and Landscape Ecological Risk in Key Regions of the Belt and Road Initiative Countries. Land 2022, 11, 940. [Google Scholar] [CrossRef]
  4. Yang, Y.; Hu, N. The spatial and temporal evolution of coordinated ecological and socioeconomic development in the provinces along the Silk Road Economic Belt in China. Sustain. Cities Soc. 2019, 47, 101466. [Google Scholar] [CrossRef]
  5. Huo, T.; Cao, R.; Xia, N.; Hu, X.; Cai, W.; Liu, B. Spatial correlation network structure of China’s building carbon emissions and its driving factors: A social network analysis method. J. Environ. Manag. 2022, 320, 115808. [Google Scholar] [CrossRef]
  6. Long, L.; Wang, X.; Guo, B. Evaluation of urban ecological well-being performance based on revised DEA Model—A case study of 35 major cities in China. J. Nat. Resour. 2017, 32, 595–605. [Google Scholar]
  7. Zhu, D.; Zhang, S. Ecological well-being performance and further research on sustainable development. J. Tongji Univ. 2014, 25, 106–115. [Google Scholar]
  8. Zhu, D.; Zhang, S.; Sutton, D.B. Linking Daly’s Proposition to policymaking for sustainable development: Indicators and pathways. J. Clean. Prod. 2015, 102, 333–341. [Google Scholar] [CrossRef]
  9. Li, J.; Gong, Y.; Jiang, C. Spatio-temporal differentiation and policy optimization of ecological well-being in the Yellow River Delta high-efficiency eco-economic zone. J. Clean. Prod. 2022, 339, 130717. [Google Scholar] [CrossRef]
  10. Wang, R.; Feng, Y. Research on China’s Ecological Welfare Performance Evaluation and Improvement Path from the Perspective of High-Quality Development. Math. Probl. Eng. 2020, 2020, 5476089. [Google Scholar] [CrossRef]
  11. Bian, J.; Lan, F.; Zhou, Y.; Peng, Z.; Dong, M. Spatial and Temporal Evolution and Driving Factors of Urban Ecological Well-Being Performance in China. Int. J. Environ. Res. Public Health 2022, 19, 9996. [Google Scholar] [CrossRef] [PubMed]
  12. Xiao, L.; Zhang, X. Spatio-temporal characteristics of coupling coordination between green innovation efficiency and ecological welfare performance under the concept of strong sustainability. J. Nat. Resour. 2019, 32, 595–605. [Google Scholar] [CrossRef]
  13. Jahanger, A.; Usman, M.; Murshed, M.; Mahmood, H.; Balsalobre-Lorente, D. The linkages between natural resources, human capital, globalization, economic growth, financial development, and ecological footprint: The moderating role of technological innovations. Resour. Policy 2022, 76, 102569. [Google Scholar] [CrossRef]
  14. Fu, L.; Ren, Y.; Lu, L.; Chen, H. Relationship between ecosystem services and rural residential well-being in the Xin’an river Basin, China. Ecol. Indic. 2022, 140, 108997. [Google Scholar] [CrossRef]
  15. Wang, S.; Zhang, Y.; Yao, X. Research on Spatial Unbalance and Influencing Factors of Ecological Well-Being Performance in China. Int. J. Environ. Res. Public Health 2021, 18, 9299. [Google Scholar] [CrossRef]
  16. Masterson, V.A.; Vetter, S.; Chaigneau, T.; Daw, T.M.; Selomane, O.; Hamann, M.; Wong, G.Y.; Mellegård, V.; Cocks, M.; Tengö, M. Revisiting the relationships between human well-being and ecosystems in dynamic social-ecological systems: Implications for stewardship and development. Glob. Sustain. 2019, 2, e8. [Google Scholar] [CrossRef] [Green Version]
  17. Daly, H. A further critique of growth economics. Ecol. Econ. 2013, 88, 20–24. [Google Scholar] [CrossRef]
  18. Daly, H. Economics in a full world. Eng. Manag. Rev. IEEE 2006, 293, 21. [Google Scholar]
  19. Daly, H. The economics of the steady state. Am. Econ. Rev. 1974, 64, 15–21. [Google Scholar]
  20. Zhang, S.; Zhu, D.; Shi, Q.; Cheng, M. Which countries are more ecologically efficient in improving human well-being? An application of the Index of Ecological Well-being Performance. Resour. Conserv. Recycl. 2018, 129, 112–119. [Google Scholar] [CrossRef]
  21. Dietz, T.; Jorgenson, A.K. Towards a new view of sustainable development: Human well-being and environmental stress. Environ. Res. Lett. 2014, 9, 31001. [Google Scholar] [CrossRef]
  22. Liu, L.; Wu, J. Ecosystem services-human wellbeing relationships vary with spatial scales and indicators: The case of China. Resour. Conserv. Recycl. 2021, 172, 105662. [Google Scholar] [CrossRef]
  23. Bian, J.; Zhang, Y.; Shuai, C.; Shen, L.; Ren, H.; Wang, Y. Have cities effectively improved ecological well-being performance? Empirical analysis of 278 Chinese cities. J. Clean. Prod. 2019, 245, 118913. [Google Scholar] [CrossRef]
  24. Summers, J.K.; Smith, L.M.; Case, J.L.; Linthurst, R.A. A Review of the Elements of Human Well-Being with an Emphasis on the Contribution of Ecosystem Services. AMBIO 2012, 41, 327–340. [Google Scholar] [CrossRef] [PubMed]
  25. Moran, D.D.; Wackernagel, M.; Kitzes, J.A.; Goldfinger, S.H.; Boutaud, A. Measuring sustainable development—Nation by nation. Ecol. Econ. 2008, 64, 470–474. [Google Scholar] [CrossRef]
  26. Common, M. Measuring national economic performance without using prices. Ecol. Econ. 2007, 64, 92–102. [Google Scholar] [CrossRef]
  27. Long, X.; Yu, H.; Sun, M.; Wang, X.-C.; Klemeš, J.J.; Xie, W.; Wang, C.; Li, W.; Wang, Y. Sustainability evaluation based on the Three-dimensional Ecological Footprint and Human Development Index: A case study on the four island regions in China. J. Environ. Manag. 2020, 265, 110509. [Google Scholar] [CrossRef]
  28. Feng, Y.; Zhong, S.; Li, Q.; Zhao, X.; Dong, X. Ecological well-being performance growth in China (1994–2014): From perspectives of industrial structure green adjustment and green total factor productivity. J. Clean. Prod. 2019, 236, 117556. [Google Scholar] [CrossRef]
  29. Wang, S.; Duan, L.; Jiang, S. Research on Spatial Differences and Driving Effects of Ecological Well-Being Performance in China. Int. J. Environ. Res. Public Health 2022, 19, 9310. [Google Scholar] [CrossRef]
  30. Iram, R.; Zhang, J.; Erdogan, S.; Abbas, Q.; Mohsin, M. Economics of energy and environmental efficiency: Evidence from OECD countries. Environ. Sci. Pollut. Res. 2020, 27, 3858–3870. [Google Scholar] [CrossRef]
  31. Cracolici, M.F.; Cuffaro, M.; Lacagnina, V. Assessment of Sustainable Well-being in the Italian Regions: An Activity Analysis Model. Ecol. Econ. 2018, 143, 105–110. [Google Scholar] [CrossRef]
  32. Yao, L.; Yu, Z.; Wu, M.; Ning, J.; Lv, T. The Spatiotemporal Evolution and Trend Prediction of Ecological Wellbeing Performance in China. Land 2021, 10, 12. [Google Scholar] [CrossRef]
  33. Zhou, L.; Zhang, Z. Ecological well-being performance and influencing factors in China: From the perspective of income inequality. Kybernetes, 2021; ahead-of-print. [Google Scholar]
  34. Wu, C.; Li, Y.; Qi, L. Assessing the Impact of Green Transformation on Ecological Well-Being Performance: A Case Study of 78 Cities in Western China. Int. J. Environ. Res. Public Health 2022, 19, 11200. [Google Scholar] [CrossRef]
  35. Hu, M.; Sarwar, S.; Li, Z. Spatio-Temporal Differentiation Mode and Threshold Effect of Yangtze River Delta Urban Ecological Well-Being Performance Based on Network DEA. Sustainability 2021, 13, 4550. [Google Scholar] [CrossRef]
  36. Song, X.; Tian, Z.; Ding, C.; Liu, C.; Wang, W.; Zhao, R.; Xing, Y. Digital Economy, Environmental Regulation, and Ecological Well-Being Performance: A Provincial Panel Data Analysis from China. Int. J. Environ. Res. Public Health 2022, 19, 11801. [Google Scholar] [CrossRef] [PubMed]
  37. Wang, S.; Duan, L.; Zhu, Q.; Zhang, Y. Spatial Differences of Ecological Well-Being Performance in the Poyang Lake Area at the Local Level. Int. J. Environ. Res. Public Health 2022, 19, 11439. [Google Scholar] [CrossRef]
  38. Dietz, T.; Rosa, E.A.; York, R. Environmentally Efficient Well-Being: Rethinking Sustainability as the Relationship between Human Well-being and Environmental Impacts. Hum. Ecol. Rev. 2009, 16, 114–123. [Google Scholar]
  39. Xu, Z.; Xu, W.; Liu, C. Dynamic evolution and driving mechanism of ecological well-being performance of cities in the Yellow River basin. Urban Probl. 2021, 07, 52–60. [Google Scholar] [CrossRef]
  40. Knight, K.W.; Rosa, E.A. The environmental efficiency of well-being: A cross-national analysis. Soc. Sci. Res. 2011, 40, 931–949. [Google Scholar] [CrossRef]
  41. Li, C. China’s multi-dimensional ecological well-being performance evaluation: A new method based on coupling coordination model. Ecol. Indic. 2022, 143, 109321. [Google Scholar] [CrossRef]
  42. Demiral, E.E.; Sağlam, Ü. Eco-efficiency and Eco-productivity assessments of the states in the United States: A two-stage Non-parametric analysis. Appl. Energy 2021, 303, 117649. [Google Scholar] [CrossRef]
  43. Hou, J.; Ruan, X.; Lv, J.; Guo, H. Two-Stage Super-Efficiency Slacks-Based Model to Assess China’s Ecological Wellbeing. Int. J. Environ. Res. Public Health 2020, 17, 7045. [Google Scholar] [CrossRef] [PubMed]
  44. Long, L. Eco-efficiency and effectiveness evaluation toward sustainable urban development in China: A super-efficiency SBM–DEA with undesirable outputs. Environ. Dev. Sustain. 2021, 23, 14982–14997. [Google Scholar] [CrossRef]
  45. Zhang, Y.; Mao, Y.; Jiao, L.; Shuai, C.; Zhang, H. Eco-efficiency, eco-technology innovation and eco-well-being performance to improve global sustainable development. Environ. Impact Assess. Rev. 2021, 89, 106580. [Google Scholar] [CrossRef]
  46. Moutinho, V.; Madaleno, M. A Two-Stage DEA Model to Evaluate the Technical Eco-Efficiency Indicator in the EU Countries. Int. J. Environ. Res. Public Health 2021, 18, 3038. [Google Scholar] [CrossRef] [PubMed]
  47. Chung, Y.H.; Färe, R.; Grosskopf, S. Productivity and Undesirable Outputs: A Directional Distance Function Approach. J. Environ. Manag. 1997, 51, 229–240. [Google Scholar] [CrossRef] [Green Version]
  48. Vaninsky, A. Energy-environmental efficiency and optimal restructuring of the global economy. Energy 2018, 153, 338–348. [Google Scholar] [CrossRef]
  49. Fu, H.; Zhou, J.; Tan, T. Performance Evaluation of Provincial Ecological Civilization Construction from the Perspective of People’s Livelihood and Well-being. J. Southwest For. Univ. (Soc. Sci.) 2022, 6, 34–38. [Google Scholar]
  50. Xia, M.; Li, J. Assessment of ecological well-being performance and its spatial correlation analysis in the Beijing-Tianjin-Hebei urban agglomeration. J. Clean. Prod. 2022, 362, 132621. [Google Scholar] [CrossRef]
  51. Long, L. Evaluation of urban ecological well-being performance of Chinese major cities based on two-stage super-efficiency network SBM Model. China Popul. Resour. Environ. 2019, 29, 1–10. [Google Scholar]
  52. Zhang, Y.; Shen, L.; Shuai, C.; Bian, J.; Zhu, M.; Tan, Y.; Ye, G. How is the environmental efficiency in the process of dramatic economic development in the Chinese cities? Ecol. Indic. 2019, 98, 349–362. [Google Scholar] [CrossRef]
  53. Bian, J.; Ren, H.; Liu, P. Evaluation of urban ecological well-being performance in China: A case study of 30 provincial capital cities. J. Clean. Prod. 2020, 254, 120109. [Google Scholar] [CrossRef]
  54. Su, N.; Li, H.; Zhang, H. Reunderstanding of GDP deflator. Econ. Perspect. 2016, 5, 62–73. [Google Scholar]
  55. Zhang, N. A Study on Inflation Rate and the Moderate Range of Economic Growth—Based on the Analysis of GDP Deflator Index. Price Theory Pract. 2019, 1, 83–87. [Google Scholar]
  56. Su, M.; Xie, H.; Yue, W.; Zhang, L.; Yang, Z.; Chen, S. Urban ecosystem health evaluation for typical Chinese cities along the Belt and Road. Ecol. Indic. 2019, 101, 572–582. [Google Scholar] [CrossRef]
  57. Zhang, W.; Deng, L.; YIn, C. Evaluation of green economic efficiency of major node cities along the “the Belt and Road” and analysis of influencing factors. Inq. Econ. Issues 2017, 11, 84–90. [Google Scholar]
  58. Liu, Z.; Xin, L. Has China’s Belt and Road Initiative promoted its green total factor productivity?—Evidence from primary provinces along the route. Energy Policy 2019, 129, 360–369. [Google Scholar] [CrossRef]
Figure 1. The flowchart of the research methods in this study.
Land 11 01928 g001
Figure 2. Network structure of two-stage ecological well-being transformation system considering undesirable outputs.
Land 11 01928 g002
Figure 3. The study area.
Land 11 01928 g003
Figure 4. Ranking of the average EWP of Chinese major node Cities along the B&R.
Land 11 01928 g004
Figure 5. The trend comparison of MLPI and its decomposition of Chinese major node cities along the B&R.
Land 11 01928 g005
Figure 6. The quadrant scatter chart of EWP and HDI of Chinese major node cities along the B&R.
Land 11 01928 g006
Table 1. The indicator descriptions of the EWP.
StageCategoryDimensionSecondary IndicatorsUnit
Input indicatorsResource inputsWater consumptionPer capita water consumptionTon
Energy consumptionPer capita urban electricity consumptionKw·h
Land consumptionPer capita urban construction land aream2
Intermediate indicatorsDesirable outputsEconomic developmentPer capita GDPYuan
Undesirable outputsWastewater dischargePer capita wastewater dischargeTon
Exhaust gas emissionPer capita SO2kg
Waste emissionPer capita Soot/dustkg
Output indicatorsWell-being outputsEducation developmentThe number of college students enrolled per 104 personsPerson
Health care developmentThe average life expectancyYear
Table 2. Classification of Chinese major node cities along the B&R.
CategoryNumberCities
Node cities of Silk Road Economic Belt 10Beijing, Hohhot, Shenyang, Changchun, Harbin, Xi’an, Lanzhou, Xining, Yinchuan, Urumqi
Node cities of Maritime Silk Road17Tianjin, Dalian, Shanghai, Ningbo, Zhoushan, Fuzhou, Xiamen, Quanzhou, Qingdao, Yantai, Guangzhou, Shenzhen, Shantou, Zhanjiang, Nanning, Haikou, Sanya
Inland open node cities9Kunming, Hefei, Nanchang, Zhengzhou, Wuhan, Changsha, Chongqing, Chengdu, Guiyang
Table 3. The EWP of 36 Chinese major node cities along the B&R from 2011 to 2018.
CategoryCity201120122013201420152016201720182011–2018
Node cities of Silk Road Economic BeltBeijing1.0100.7101.0001.0201.0401.0301.0601.1401.001
Hohhot1.0601.0401.0301.0101.0000.7301.1001.0301.000
Shenyang0.7200.6000.6700.6600.6600.6200.6700.6900.661
Changchun0.8100.7600.8201.0200.8501.0201.1201.0300.929
Harbin1.0400.8101.1201.0601.1101.1101.0601.1701.060
Xi’an1.0501.0601.1001.0901.1201.3201.2601.1801.148
Lanzhou0.6900.6701.0401.0101.0101.0200.8000.7100.869
Xining0.5800.5800.5900.6000.6200.6000.6200.5300.590
Yinchuan0.5500.6401.9100.6400.6400.6200.5500.5300.760
Urumqi0.5100.4100.5300.5600.5600.5000.5400.5300.518
Node cities ofMaritime Silk Road Tianjin0.6700.6100.6400.6300.6100.5800.6700.6700.635
Dalian0.5400.5400.5900.5900.6300.5800.5800.6900.593
Shanghai0.5900.5400.6000.6000.6300.5701.0600.5200.639
Ningbo0.5100.4900.5300.5400.5300.5200.6200.4800.528
Zhoushan0.6100.5900.5600.5800.6100.6101.0101.0500.703
Fuzhou0.8600.7400.8501.0101.0101.0201.0300.8000.915
Xiamen0.6600.6700.6800.5800.6100.6500.6700.8500.671
Quanzhou0.7201.0101.0401.0301.0901.0601.0701.0201.005
Qingdao0.7900.7100.7500.7200.6900.7701.0901.0900.826
Yantai0.7800.7400.7800.7900.8600.7701.0701.0700.858
Guangzhou0.6400.7100.7100.7300.7200.6600.7500.7400.708
Shenzhen1.2001.2401.2401.2701.2401.1601.1901.2601.225
Shantou1.0301.0001.0201.0301.0201.1401.1901.0401.059
Zhanjiang1.1701.2201.1701.1801.1801.1601.1801.1801.180
Nanning0.7600.7601.0100.8000.9001.0001.0601.0300.915
Haikou1.1101.1201.1601.4301.3401.1101.1301.2501.206
Sanya1.4401.5701.5801.6601.6201.5301.8301.7501.623
Inland Open node citiesKunming0.7401.0101.0001.0401.0501.0701.0000.7700.960
Hefei1.0401.0401.0201.0301.0201.0300.9300.8100.990
Nanchang1.0701.0601.0301.0601.0501.0401.0801.0801.059
Zhengzhou1.0201.0501.0901.1101.0701.1001.1601.1201.090
Wuhan1.0000.8500.9501.0301.0801.0600.8000.7100.935
Changsha1.1101.1201.1001.0801.1101.0501.1101.0401.090
Chongqing0.8200.7500.6500.6500.6100.5800.6100.6100.660
Chengdu0.9300.8500.9601.0101.0100.8901.0001.0100.958
Guiyang1.0701.0801.0200.8400.8400.7600.7000.7400.881
Average value0.858 0.843 0.931 0.908 0.909 0.890 0.955 0.915 0.901
Table 4. MLPI and its decomposition of 36 Chinese major node cities along the B&R from 2011 to 2018.
CityMLPIECTCCityMLPIECTC
Changsha1.025 1.039 1.063 Shenzhen1.007 1.020 1.027
Changchun1.043 1.067 1.105 Shenyang0.994 1.035 1.024
Changsha0.990 1.017 1.007 Tianjin1.018 1.145 1.143
Chengdu1.020 1.038 1.048 Urumqi1.013 1.083 1.082
Dalian1.028 1.079 1.109 Wuhan0.969 1.053 1.005
Fuzhou1.021 1.058 1.057 Xi’an1.012 1.019 1.031
Guangzhou1.035 1.083 1.090 Xining0.994 1.017 1.007
Guiyang0.952 1.063 1.012 Xiamen1.028 1.149 1.173
Harbin1.028 1.043 1.054 Yantai1.009 1.022 1.032
Haikou1.013 1.018 1.028 Yinchuan1.167 1.030 1.156
Hefei0.971 1.034 1.002 Zhanjiang1.001 1.004 1.006
Hohhot0.991 1.019 1.010 Zhengzhou1.007 1.024 1.031
Kunming1.031 1.026 1.042 Chongqing0.976 1.039 1.006
Lanzhou1.045 1.057 1.091 Zhoushan1.080 1.106 1.193
Nanchang1.002 0.999 1.000 2011–20121.065 1.008 1.068
Nanning1.077 0.965 1.038 2012–20131.076 1.140 0.955
Ningbo1.087 1.104 1.162 2013–20140.976 0.975 1.004
Qingdao1.023 1.062 1.080 2014–20151.066 1.015 1.053
Quanzhou0.999 1.051 1.051 2015–20161.068 0.972 1.107
Sanya0.954 1.017 0.967 2016–20171.054 1.038 1.017
Shantou1.005 1.148 1.148 2017–20181.088 0.964 1.133
Shanghai0.955 0.995 0.946 Average value1.056 1.016 1.048
Publisher’s Note: MDPI stays neutral with regard to jurisdictional claims in published maps and institutional affiliations.

