Article

Assessing the Potential of Vegetation Carbon Uptake from Optimal Land Management in the Greater Guangzhou Area

1
Key Laboratory of Natural Resources Monitoring in Tropical and Subtropical area of South China, Ministry of Natural Resources, Guangzhou 510631, China
2
School of Remote Sensing and Information Engineering, Wuhan University, Wuhan 430079, China
3
Department of Geography and Geology, Eastern Michigan University, Ypsilanti, MI 48197, USA
*
Author to whom correspondence should be addressed.
Land 2022, 11(11), 1878; https://doi.org/10.3390/land11111878
Submission received: 9 September 2022 / Revised: 13 October 2022 / Accepted: 18 October 2022 / Published: 22 October 2022

Abstract

:
Rapid urbanization has threatened sustainable urban development in many cities across the globe, causing green space loss and vegetation cover degradation which reduce carbon sequestration. Optimal land management practices (LMPs) in an urban context are known as ways capable of promoting urban vegetation growth and contributing to carbon sequestration. Due to variations of physical, biological, and social structures in urban areas, policymakers often lack relevant information to decide and implement site-specific LMPs. Here we try to extract the areas in need of the optimal LMPs, identify location-dependent optimal LMPs, and assess how much more carbon can be captured by applying a combination of segmenting homogeneous urban environments and neighborhood-based analysis. As one of the most developed cities in China, the greater Guangzhou area (GGA) was selected as a case study. We found that the carbon uptake from the urban vegetation in GGA could be improved on average by 185 gC m−2 yr−1 in flux (or 1.3 TgC yr−1 in total) with optimal LMPs, equivalent to a ~30% increase considering the current level of 662 gC m−2 yr−1 in flux (4.4 TgC yr−1 in total). The carbon uptake potential was found to differ considerably across locations and among different ecosystem types, highlighting spatially varied priorities for implementing optimal LMPs over the space. This study reveals the usefulness of the model in assessing carbon uptake potential from optimal LMPs and emphasizes that future urban planning may consider the importance of optimal LMPs in enhancing vegetation carbon uptake in urban planning.

1. Introduction

The global population in urban areas grew tenfold in the last century and over half of the people live in towns or cities today, with a projected number of more than 60% by 2030 [1,2]. Cities provide more advanced infrastructure such as recreation spots, convenient transportation, and better health care systems than in the countryside. The advantages of living in cities combined with the population growth attract more people crowding into cities, causing loss or degradation of green vegetation space [3,4], which in turn degrades vegetation carbon sequestration. Vegetation in urban landscapes plays multiple roles, including mitigation of heat islands, purification of air quality, and reduction of urban noises [5,6]. Urban vegetation also contributes to atmospheric carbon dioxide (CO2) removal. Cities are responsible for more than 70% of the greenhouse gas (GHG) emissions with CO2 as the primary component [7]. A growing number of cities have recognized their potential contribution to mitigate climate change and aspired to achieve net-zero [8]. Clean energy and energy efficiency are probably the mainstream topics to achieve carbon-neutral cities [9]. Cities cannot achieve net-zero by reducing emissions without improving vegetation carbon sequestration from urban and regional landscapes [8]. Land-based GHG removal options can contribute positively to urban ecosystem services [10]. One of the important issues for sustainable urban development is to protect vegetation cover and increase carbon sequestration [11].
An urban ecosystem involves social, ecological, and physical components which interact to create a unique environment and urban infrastructure [12]. Land-based carbon sequestration is the process of capturing and storing organic carbon in biological forms, driven by vegetation assimilation of CO2 from the atmosphere through photosynthesis [13]. Vegetation is the pivotal element for the carbon sequestration process. Several indices have been proposed to measure and evaluate carbon sequestration from vegetation, including gross primary productivity (GPP), net primary productivity (NPP), and net ecosystem productivity (NEP) which are, though from different aspects, closely correlated [14,15]. The indices are important for assessing and comparing vegetation carbon sequestration from urban ecosystems at regional or larger scales.
Urban areas characterize different land (vegetation) cover types, including build-up of settlements as well as croplands, pastures, and/or forests [16,17]. Vegetation is a core component of nearly all the urban land cover types [18]. Urban land management intends to maximize land benefits with consideration of landscape of vegetation cover. Land management can have location-specific impact on urban vegetation [10]. Several methods have been proposed to improve urban vegetation cover, including reducing roadside constraints, tackling underground utility restrictions to allow tree root growth, and even tree trunk injection for better protection from pests and diseases [19]. Further, from landscape and urban ecology principles, designing shape and connectivity of green spaces and creating green wedges are also among the land management practices for vegetation recovery and enhancement [20,21]. Optimal land management for a sustainable urban development is a harmony between the nature and the interventions that take full advantage of nature to provide solutions to specific targets, e.g., climate mitigation and adaptation challenges, which is also the core notion from nature-based solutions (NBSs) [22]. Though traditional land use and land cover changes, e.g., converting croplands to forests (afforestation), are capable of increasing vegetation cover, large scale afforestation is rarely practical due to food security [23].
Remote sensing technology allows the mapping of key environment variables, vegetation cover, and carbon sequestration from vegetation in an efficient and effective manner [24,25]. One of the commonly used remote sensing products to indicate vegetation health is normalized distribution of vegetation index (NDVI) which can present the relative greenness of vegetation cover over a large region. Health of vegetation cover and thus the carbon sequestration from vegetation can be attributed to a number of environmental factors, e.g., landforms, soil types, and meteorological conditions [26,27]. Climatic factors are included by most carbon cycle models [28]. For example, the Carnegie–Ames–Stanford Approach (CASA), a light use efficiency (LUE) model which has been widely applied to map NPP over space, takes input of monthly precipitation and temperature. Similarly, vegetation cannot maximize carbon sequestration without favorable natural conditions such as landforms [29], soil properties [30], and biome groups [31]. Remote sensing can invert key environmental variables, including land cover and land use [32], terrain properties [33], climate changes (e.g., precipitation, temperature, and solar radiation) [34,35], soil properties [36], and atmospheric contents [37]. Vegetation productivity is dependent on a variety of environmental factors as well as anthropogenic activities. While it is unrealistic to numerate all the influential factors, meteorological factors such as temperature; precipitation; sun radiation; soil properties such as soil classes and soil moisture; landforms; and plant types are generally recognized as the principal contributors or constraints on vegetation growth [38].
This study tries to quantify, in an urban context, the potential of vegetation carbon uptake, given that land management practices (LMPs) are freely transferrable across a region. We assume that for a set of available LMPs, some promote vegetation growth while others do not, depending on various urban environments. Carbon uptake from urban vegetation can be improved either by adopting LMPs that favor vegetation growth to less productive areas or discontinuing or replacing LMPs that show a negative effect on vegetation growth. We define optimal LMPs as any land management practices that help vegetation sequester more carbon and enhance carbon uptake potential by filling the gap between the capacity of carbon uptake before and after the implementation of the optimal LMPs. This definition acknowledges that optimal LMPs pertain to locations characterized by unique environmental conditions. Urban areas are characterized by a number of ecosystem types, e.g., forests, grasslands, croplands, rangelands, wetlands, and human settlements [39]. We selected Guangzhou, a metropolitan region in southern China as the case study and assessed the potential of carbon uptake from vegetation by combining segmentation of homogeneous urban environments and neighborhood-based analysis.

2. Study Area, Data Sources, and Methodology

2.1. Study Area

Guangzhou city is the capital of Guangdong Province, China (Figure 1). It is located on the northern edge of the Pearl River Delta in southern China, typically with a subtropical and marine monsoon climate [40]. The annual average temperature is about 21.5°C. The annual precipitation is relatively high, reaching nearly 2000 mm, most of which is between April and September [40]. Apart from a dense urban core area which is dominantly covered by urbanized land (approximately 15% out of the total area), the greater Guangzhou Area (GGA) is mainly covered by larger suburban and rural areas. Forests, urbanized/settlement lands, water bodies, croplands, and rangelands are the main land cover types. Vegetation in the land cover types plays an important role in providing ecosystem services, including carbon sequestration. Forests contribute the most to carbon sequestration and consist of subtropical mountain evergreen broad-leaved forests in the north, subtropical evergreen seasonal rainforests in the middle, and tropical evergreen seasonal rainforests in the south [40]. Croplands are dominated by farmlands for crop production. In the urbanized area, road-side trees, gardens, and residential green spaces also play an important role in carbon sink for GGA. Rangelands are open areas covered in homogenous grasses or other plants with little to no taller vegetation.
GGA has been observed to undertake rapid urbanization in the past three decades. During that period, the urbanized/built-up area showed an average annual growth of 41 km2 while urban vegetation was reduced by an average of 40 km2 per year [41]. The decrease of vegetation cover imposed a direct effect in degrading carbon sequestration from urban vegetation. In addition, previous studies showed that human activities have significantly reduced vegetation productivity in GGA and recommended continuous efforts to improve the intensity of protection and management in the urban environment [42]. We hypothesize that the optimized land management of forests, croplands, rangelands, and urbanized areas helps to increase carbon uptake from the vegetation in the urban ecosystem of GGA. This work tries to answer questions about how to locate optimal LMPs and the spatial patterns in terms of possible extra carbon uptake capacity from optimal LMPs in an urban context.

2.2. Data Sources

Monthly climate variables, including temperature, precipitation, sun radiation, and water balance (evapotranspiration and soil moisture) were obtained from two well-known global climate datasets, ERA5-L [43] and TerraClimate [44]. They were combined to provide the necessary meteorological variables for modeling vegetation productivity. All the meteorological data variables were prepared on a monthly scale during the study year.
This study applied Sentinel-2 (S2) surface reflectance (SR) data (S2_SR) to obtain the normalized difference vegetation index (NDVI) [45]. Clouds in S2_SR were identified from the S2 cloud probability dataset [46] and gap-filled by the smoothed values by performing a linear interpolation and Savitzky–Golay filter from the closest time neighboring scenes within three month [47]. The monthly NDVI time series were obtained by the maximum composite from the NDVI in each month.
Soil properties are largely determined by soil classes. Vegetation carbon uptake and the potential of improvement in the carbon uptake can be constrained by soil cover. Because soil data is hard to obtain, this work selected the Harmonized World Soil Database (HWSD ver. 1.2, http://www.fao.org/soils-portal, access on 28 July 2022). HWSD integrates the soil map of China and provides the most up-to-date soil properties that we can obtain for GGA. HWSD incorporates a data table of 48,148 soil profile descriptions related to the various soils associated with each mapping unit at a spatial resolution 1-km [48]. Soil type classes from FAO-90 code (SU_Code90), which includes 194 labels globally, were used for mapping soil type cover in GGA.
Land (vegetation) cover was obtained from Environmental Systems Research Institute (ESRI) at a fine scale of 10 m [49]. This land use/land cover (LULC) was derived from ESA Sentinel-2 imagery at 10 m resolution. A deep learning model was used to classify land cover by using as a massive training dataset of human-labeled image pixels. The algorithm generated LULC predictions for 10 classes, described in detail below. This outcome was produced by a deep learning model for all major biomes. For the area in GGA, only 5 of the land cover types are present, as shown in Table 1. Waters are excluded from further analysis.
Landform properties add another constraint/contribution to vegetation carbon uptake. Here, we applied the classified landform cover from the European Soil Data Centre (ESDAC) to indicate landform variations. This product includes 16 landform labels dynamically classified by an unsupervised nested-means algorithm from three geometric criteria (slope, surface texture, and local convexity) from the Shuttle Radar Topography Mission 30 m (SRTM30) digital elevation data [50].
We selected the most recent year, i.e., 2021, to study the spatial pattern of current carbon uptake and assess the carbon uptake potential from optimal LMPs. The required datasets are listed in Table 2. All the datasets were resampled to a 10 m resolution to match the NDVI to facilitate further analysis.

2.3. Methodology

For the case study, forests, croplands, rangelands, and urbanized areas were mapped based on the land cover classification schema (Table 1). The urbanized areas are mainly covered by imperious material but mixed with green spaces from road-side trees, gardens, or other recreation spots, and thus potentially contribute to carbon sequestration. The carbon uptake potential was assessed based on historical carbon capture capacity for different ecosystems. We applied two phases to assess the potential increase of carbon capture in GGA. We first mapped the distribution of carbon uptake proxied by NPP. We then applied the segmentation of environmental factors and neighborhood analysis to compute the carbon uptake potential.

2.3.1. Mapping NPP to Indicate Carbon Uptake from Urban Vegetation

In the first phase, net primary productivity (NPP) was most commonly taken as the proxy for vegetation carbon capture. Development in remote sensing technology combined by ecological models has allowed timely NPP mapping over a large region. This study integrated two models to map NPP in GGA: the Carnegie–Ames–Stanford Approach (CASA) for croplands, settlements, and rangelands, and 3-PGS (Physiological Principles Predicting Growth with Satellite Data) for forests. First, the CASA model is one of the NPP models that have been widely applied to map large-scale NPP with only a few land cover and climate variables inverted by remote sensing imagery. NPP reflects the absorbed photosynthesis active radiation (APAR) and light use efficiency in turning energy into biomass from vegetation, in the form of:
N P P ( x , t ) = A P A R ( x , t ) × ε ( x , t )
and
A P A R ( x , t ) = S O L ( x , t ) × F P A R ( x , t ) × r
where ε(x,t) is light utilization; x represents the location; and t denotes the month for the model. SOL (x,t) is solar radiation location x and month t) of each year. FPAR(x,t) is the fraction of incoming photosynthetically active radiation by the vegetation cover. R is the proportion of total solar radiation and assigned to be 0.5 as recommended by previous study [52].
F P A R ( x , t ) = ( N D V I ( x , t ) N D V I i , min ) ( N D V I i , max N D V I i , min ) × ( F P A R max F P A R min ) + F P A R min
where NDVIi,max and NDVIi,min are the maximum and minimum NDVI, respectively, for the ith (I = #2, #5, #7, and #11, Table 1) vegetation cover class; FPARmax and FPARmin are the maximum and minimum proportion of incoming photosynthetically active radiation absorbed which are set to be 0.950 and 0.001, respectively. Computation of light use rate ε(x,t) is detailed in the literature [52]. As CASA outputs monthly NPP, the NPP at the monthly scale output is then summed up to derive yearly NPP.
In addition to CASA, the 3-PGS model was applied for NPP in vegetation productivity in forests. 3-PGS is a modified version of 3-PG (Physiological Processes Predicting Growth), a well-known process-based carbon balance model designed to predict the growth, diameter distribution, and annual mortality for forest stands [53]. The 3-PGS model takes the use of satellite data in the model framework to assess productivity at a range of forest sites [54,55,56]. The 3-PGS model has been applied to several projects; its performance was reported to be extremely encouraging (r2 = 0.93, in comparison to field measurement) for forest ecosystem [54]. NPP computation takes the form of:
NPP ( x , t ) = C p p · GPP ( x , t ) = C p p · APAR ( x , t ) · ε max · f x , t
where x and t indicate the location and month of a year, GPP(x,t) is the gross primary productivity for location x and time t. Cpp, a conversion coefficient for forests from GPP to NPP and without calibration data, is assigned to be 0.47. εmax is the max conversion rate from light energy to biomass, which is 1.80 gC∙MJ−1. fx,t is the coefficient of the overall environmental constraints. APAR(x,t) is the absorbed photosynthetically active radiation in forest vegetation which is modeled using:
APAR ( x , t ) = PAR ( x , t ) × FPAR ( x , t ) = PAR ( x , t ) × ( a × NDVI ( x , t ) + b
where PAR is effective photosynthetically active radiation; FPAR is the fraction absorbed from PAR; NDVI reflects vegetation greenness and is positively related to FPAR; and a and b are coefficients which are empirically set to be 1.24 and −0.168. The complete protocol and processes for the 3-PGS model are detailed in the literature [54,55,56].
In the end, NPP of forest vegetation from 3-PGS and NPP from the other vegetation cover types were combined for the complete region to reflect the spatial pattern of carbon uptake for the study area.

2.3.2. Carbon Uptake Potential by Segmenting Urban Environments and Neighborhood-Based Analysis

The carbon uptake potential from optimal LMPs was assessed based on the segmentation of homogeneous urban environments and neighborhood-based analysis. First, the effect on NPP from the environmental factors was isolated through region segmentation, resulting in non-overlapped homogeneous patches with identical conditions of the corresponding environments. The internal variation of NPP across locations in the patches was then evaluated and the potential of carbon uptake was computed recursively at location from the statistics of the NPP distribution within the patches by a neighborhood-based analysis. The processes are detailed as follows.
The impact from the climate factors, including precipitation, temperature, and solar radiation, has been isolated in the models, i.e., CASA and 3-PGS, in the spatial variations of the output NPP. Next, the impact on NPP from different landforms, soil properties, and vegetation cover must be isolated across locations, leaving the impact from LMPs only. In this regard, a region segmentation operation was performed by overlaying landforms (L), vegetation types (V), and soil types (S) to derive homogeneous patches known as LVS labeled zones so that all locations (pixels) in an LVS zone are labeled by the same LVS#, or properties of the landforms, vegetation cover, and soil type (Figure 2). For the pixels (locations) within zones labeled by the same LVS#, the impact from the LVS factors on the internal NPP variation should be insignificant. Thus, the NPP variation in an LVS zone, if any, should be attributed only to differed LMPs across the locations in LVS zones.
Given a location i with relatively low vegetation NPP (NPPi) in an LVS zone, the carbon uptake potential or the extra carbon that vegetation can sequester after implementation of optimal LMPs is computed as the gap from NPPi to a reasonably higher target NPP level (NPPTarget,i) observed at all identically LVS labeled locations in its neighborhood, in the form of:
NPPgap, i = NPPTarget,i − NPPi
where NPPgap,i is the extra carbon at location i that vegetation can sequester through the implementation of optimal LMPs. NPPTarget,i can be decided either simply by looking for a high NPP at other locations (e.g., the local maximum NPP) or computed statistically from the NPP distribution observed at all other locations in the same LVS labeled zones (e.g., the top 10% NPP level for all locations). The maximum NPP flux in segmented zones labeled by a unique LVS# may theoretically serve as the NPPTarget,i for other locations in the zones. However, this configuration means that the optimal LMPs are too strictly defined to be implemented because only a single candidate is available in the optimal LMPs list, leaving no alternative choices in the selection of the optimal LMPs. It is more reasonable to compute NPPTarget,i by setting a flexible standard based on the context of NPP in the LVS zones.
Due to the complexity in urban ecosystems, here we consider two parameters to compute the NPPTarget,i. The first one is the size of the neighborhood, or a radius defined by the distance starting from the location i. A larger distance means more locations in the neighborhood to be searched to derive the NPPTarget,i. The second parameter is a reference percentage (RP), which is a percentile threshold to derive the NPPTarget,i from the NPP distribution of all the locations in the LVS zones. A high RP means a higher NPPTarget,i and greater carbon uptake potential but, at the same time, fewer LMPs candidates for practical implementation. Instead of targeting the maximum NPP (RP = 100%), setting RP = 90% is more robust to data noises in the segmented patches and the modeled NPP because this setting cuts off 10% of the top NPP values to avoid the impact on NPPTarget,i from abnormal data in NPP. Furthermore, a neighborhood size of ~20 km is preferable for not only producing a stable NPPTarget,i but also for allowing an easier implementation of optimal LMPs because the LMPs are transferred only from a close neighborhood [38]. The combination of ~20 km and RP = 90% was finally decided to derive NPPTarget,i.
The climate data and the Sentinel-2 imagery for deriving NDVI can be obtained directly from the Google earth engine (GEE) which also supports data upload from end users. All other required data were uploaded into user’s asset repository. The built-in algorithms for image computation and spatial statistics prove to be powerful to analyze many spatial questions [32]. In this work, we applied the GEE to model NPP and analyze the carbon uptake potential.

3. Results

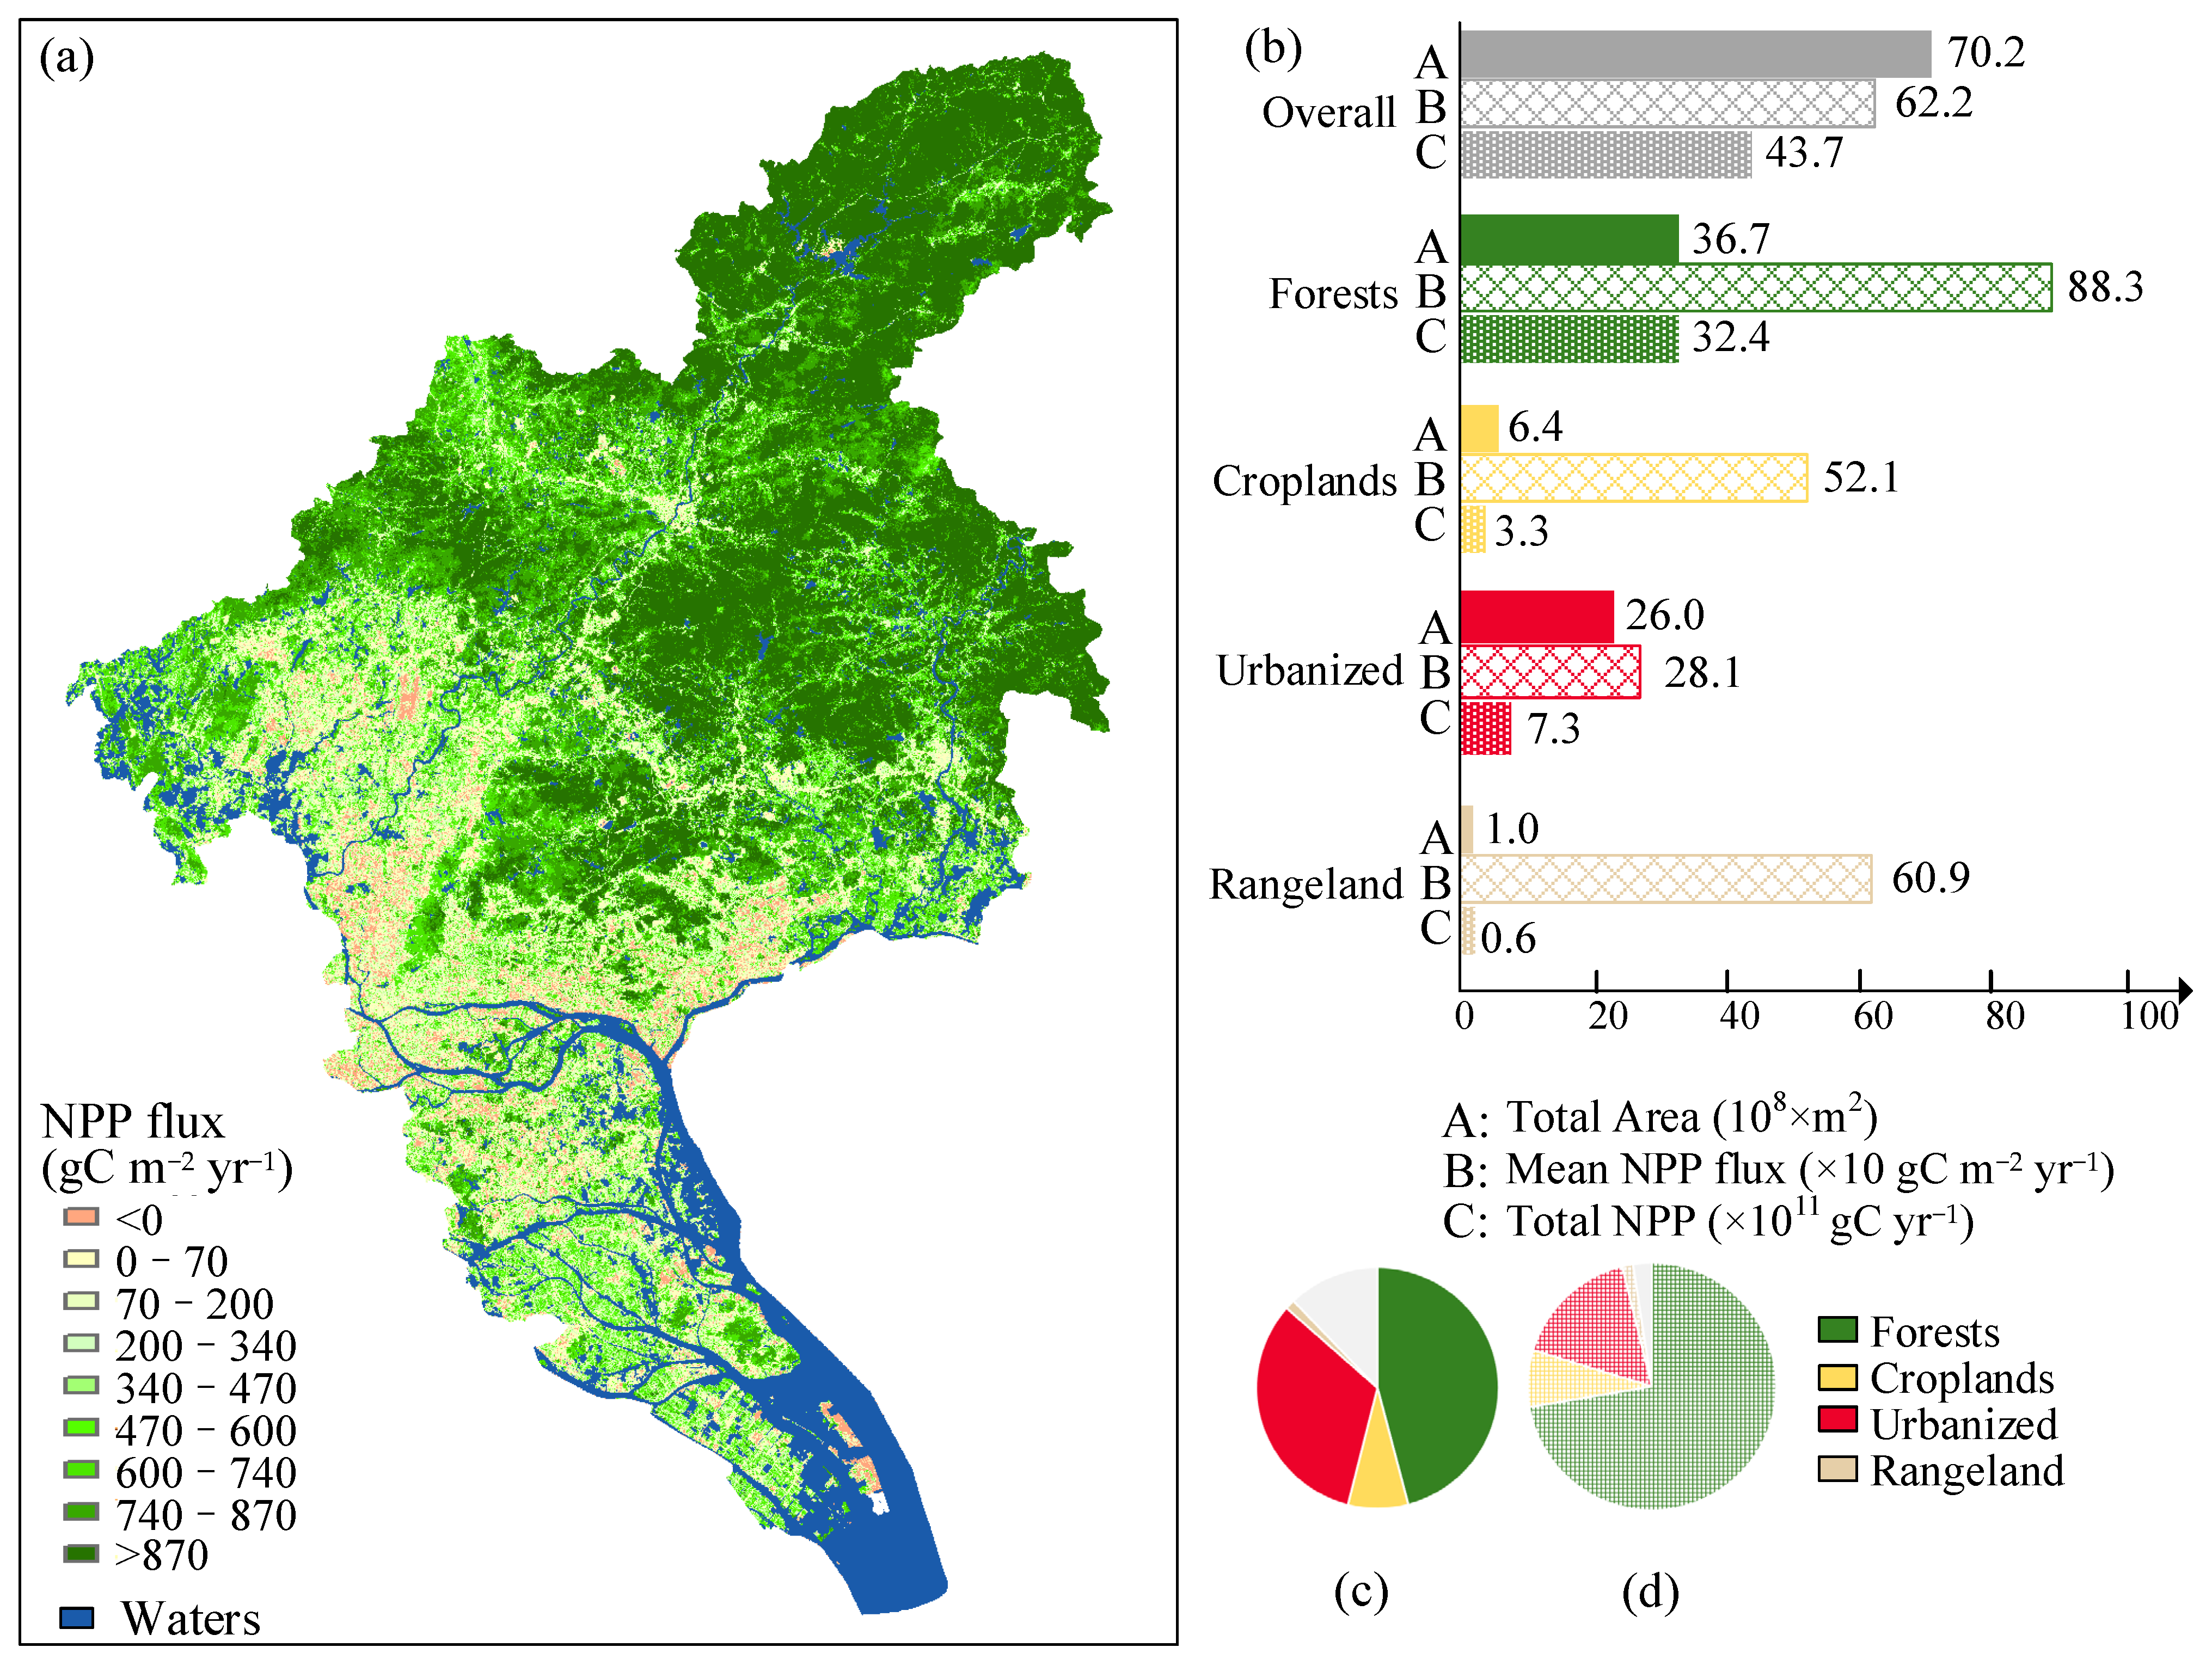
3.1. Carbon Uptake Patterns in the Urban Ecosystems

The spatial distribution of vegetation carbon uptake in GGA, proxied by NPP, shows considerable spatial variation. The northern part, which is mainly covered by forests, presents a higher NPP flux than the other areas. Conversely, the middle to south of the area representing the core urban area shows much lower density in NPP flux (Figure 3a). The spatial variation in NPP flux differs considerably among the land (vegetation) cover classes. Furthermore, the variation in NPP flux may also be linked to both environmental factors, e.g., climate, landforms, and soil properties, and human activities (e.g., land management).
The comparisons of the fraction of the land cover area, NPP flux, and total NPP among different vegetation cover classes are presented in Figure 3b. The NPP flux for the whole vegetated area of 7020 km2 reached 622 gC m−2 yr−1 in flux and totaled 4.37 TgC yr−1 (1TgC = 1012gC), with considerable variations observed among the land cover classes. Forests show the highest NPP flux and total carbon capture, reaching 883 gC m−2 yr−1 and 3.24 TgC yr−1, respectively. Croplands present an NPP flux of 521 gC m−2 yr−1, or 0.33 TgC yr−1 in total. NPP in the urbanized area shows the lowest flux, reaching 281 gC m−2 yr−1 and 0.33 TgC yr−1 in total. It is worthy to point out that, though most parts of urbanized area are characterized by impervious lands, it is not uncommon to observe street trees along sides of most urban roads, and scattered lawns and gardens which are important elements of urban vegetation. Lastly, rangelands take the second place in NPP flux after forests, reaching 609 gC m−2 yr−1 in carbon flux, though the total value carbon uptake, i.e., 0.06 TgC yr−1, is the smallest among all the ecosystem types because of the lowest proportion of its land area. Forests take the largest part of the land area (Figure 3c) and contribute the most to the carbon uptake in GGA (Figure 3d).

3.2. Potential of Carbon Uptake from Optimal LMPs

Mapping the environmental factors revealed that there was considerable heterogeneity in terms of vegetation cover (Figure 1c), soil cover (Figure 4a), and landforms (Figure 4b). The segmentation analysis using a combination of all the key environmental factors highlights both spatial heterogeneity among the patches and spatial homogeneity within the patches in terms of the factors (Figure 4c). The heterogeneity among the segmented patches can be one important reason explaining the variations of NPP across GGA. The NPP variation within the patches, on the other hand, does not come from the environmental factors and will be attributed solely to the differed impact from LMPs.
The spatial distribution of the carbon uptake potential, with implementation of optimal LMPs, in GGA is presented in Figure 5a. Compared to NPP flux, the carbon uptake potential highlights a reversed pattern, namely locations presenting a relatively high potential flux in carbon capture have a lower NPP flux. For example, forests in the northern part in GGA, which present the highest NPP flux, have less potential in carbon capture; conversely, the region showing less NPP flux, e.g., the settlement area in the middle and southern part, is likely to bring more potential in carbon capture if the LMPs are optimized.
The potential of carbon uptake in GGA suggests that, on average, vegetation can bring an extra flux of 185 gC m−2 yr−1, or 1.3 TgC yr−1 in total across the land cover area of 7020 km2, given a full implementation of the optimal LMPs (Figure 5b). However, the carbon uptake potential shows high variation among the land cover classes (forests, croplands, urbanized, and rangelands). As the largest carbon sink, forests in GGA are expected to improve NPP by only 60 gC m−2 yr−1 in flux and 0.22 TgC yr−1 in total by optimizing LMPs. Croplands can bring a higher flux, i.e., 209 gC m−2 yr−1 in carbon uptake potential but less total potential, i.e., 0.07 TgC yr−1 due to its relatively small land cover area. Urbanized/settlement areas are likely to contribute the most in terms of carbon uptake potential, totaling 0.92 TgC yr−1 with an average flux of 354 gC m−2 yr−1. Lastly, rangelands are expected to bring an extra carbon uptake by 249 gC m−2 yr−1 in flux and 0.026 TgC yr−1 in total. It is clear that urbanized areas, though taking only the second position in the land cover area, may play the most important part in improving carbon uptake after the implementation of optimal LMPs (Figure 5c,d).
The current carbon uptake and future potential in carbon uptake of different land cover classes are illustrated in Table 3. On average, the carbon uptake is expected to improve by ~30% compared to its current amount (1.3 vs. 4.4 TgC yr−1 in total and 185 vs. 622 gC m−2 yr−1 in flux). For urbanized areas, carbon uptake is expected to more than double its current level (1.25 times) given optimal LMPs are implemented. Croplands and rangelands can capture 40% and 41% more carbon, respectively, than their current carbon uptake level if LMPs are freely transferrable across locations. It is disappointing to note that forests can potentially add only an extra 7% carbon uptake to its current level; nevertheless, the limited carbon uptake potential does not mean that it is not important to manage forests well, because vegetation degradation in forests will induce a critical decrease in NPP flux since NPP flux in forests is much higher than that of the other land cover classes. The low potential in carbon uptake in forests is likely to suggest that forests were managed well. Instead, more attention can be given to optimize land management for the urbanized lands, croplands, and rangelands to increase carbon capture.

4. Discussions

4.1. Optimal Land Management Practices

Land management practices (LMPs) refer to any administration strategies on lands, including activities related to the benefit of land use and development targeting individual, collective, and economic purposes, which may vary under different ecosystem contexts. In an urban context, LMPs may focus on satisfying commercial or residential needs for the economy while maintaining an ecological benefit for a healthy urban environment [57]. In an agroecosystem, most LMPs target to promote food or crop production, e.g., by weed removal, fertilizer application, and irrigation [58]. Wood production and soil erosion control are among the targets in a forest ecosystem [59]. Vegetation in urban ecosystems captures atmospheric carbon, indicated by NPP. To maximize the carbon capture, land management strategies need to be adjusted to fit environmental conditions. The effectiveness of LMPs from the perspective of the carbon uptake potential can be computed as the difference between the capacity of carbon uptake with and without the implementation of the LMPs.
While those environmental factors, e.g., temperature, precipitation, or landform/soil classes may update vegetation productivity and increase carbon capture, they are much more difficult, if not impossible, to be implemented in practice. Transformation of land use and land cover (LULC), for example, from croplands to forests has shown ecological benefit and can potentially capture more atmospheric carbon [60]. However, such practices are not widely acceptable due to food security in an urban context [23]. Reversing impervious land to croplands/forests is also discouraged, given the need for urban expansion to support economic development. This study emphasizes that the strategy to increase vegetation productivity should resort to optimizing LMPs without changes in LULC. Such consideration reflects the goal of sustainable urban development satisfying both ecological and socio-economic needs.
The LMPs to improve carbon uptake optimize three targets: vegetation proportion, vegetation density, and vegetation complexity [21] (Table 4). Increasing the proportion of vegetation cover can be realized simply by extending vegetated area and urban green space; for example, through planting more trees in barren or discarded lands However, the potential is limited considering unused lands are rare in modern cities. A more promising strategy introduced previously to increase proportion of urban greenspace is to create green walls and roofs in new buildings by applying an ecological urban index called biotope area factor [61]. In addition, the strategies by optimizing vegetation cover density and vegetation landscapes are more welcome and recommended since they promote vegetation growth without altering land use.

4.2. Implication of Carbon Uptake Potential to Policies

Urban expansion inevitably results in a loss of vegetation cover and, most likely, reduces the overall carbon sequestration of cities [26,66]. One way to promote carbon uptake capacity in urban ecosystems can be made possible through designing optimal LMPs. The approach proposed in this study segmented GGA into homogeneous patches, allowing an objective comparison of the effect on carbon uptake from different LMPs. The study assumes that multiple LMPs coexist in the urban areas. The NPP variation within the environmentally homogeneous patches was illustrated, suggesting that the LMPs varied across locations and showed different impact on vegetation carbon uptake. The historical records of LMPs effective for vegetation carbon uptake provide reference candidates for future land management optimization. Policy makers should pay more attention to areas with a high potential of carbon uptake when planning urban development.
The optimal LMPs can be identified from existing LMPs that have produced a high target level of NPP flux and, if extended to wider areas, are expected to improve carbon capture from vegetation. One common approach for policy makers to decide optimal LMPs and a target level of carbon capture is to compare the existing LMPs across locations. Comparative to a location with a low NPP, its neighbors presenting a high NPP with identical environmental conditions, if available, are believed to be under better LMPs which form a candidate list of optimal LMPs. The optimal LMPs, identified recursively at each location, are location-dependent because spatial heterogeneity is common in an urban environment and optimal LMPs do not apply uniformly [67]. Assisted by spatial modeling and remote sensing datasets, this study provides a way to automate the extraction of the neighboring references and dig out the LMPs. If the discovered optimal LMPs are freely transferrable and can be applied to locations presenting lower carbon uptake, improvement in carbon uptake flux can be achieved. It is worth noting that, because the carbon uptake potential is assessed based on existing LMPs, the optimal LMPs might not be the best choices under the current urban context. Nature-based solutions (NBSs) are actions that protect, sustainably manage, or restore an ecosystem to address societal challenges [68]. In an urban context, the optimal LMPs are examples of NBSs that promote the local nature (in terms of soil, terrain, and vegetation) as a means for realizing a targeted level in vegetation carbon uptake. A large candidate in NBSs makes it possible to create or design a new LMP, resulting in even higher carbon uptake potential. Nevertheless, the advantage of our approach is that the effectiveness of the discovered LMPs has been confirmed by historical records, while any newly designed one must be verified via field observation before implementation. Therefore, the identified optimal LMPs from this study are safer to be carried out.

4.3. Parameterization and Uncertainties

Several parameters are required to derive the potential of carbon uptake from the optimal LMPs in an urban ecosystem. First of all, the carbon uptake potential is based on the vegetation productivity of historical datasets. To model NPP distribution, two models, namely CASA and 3-PGS, were integrated to map NPP for GGA. Those process-based models are simple to build but a couple of empirical parameters must be decided for model execution. In the CASA model, a constant value of 0.5 for the ratio of effective solar radiation is given for all the locations; other parameters such as FPARmax and FPARmin were fixed to be 0.001 and 0.95 (Equation (3)). Similarly, the 3-PGS model depends on several empirical parameters (for example, Cpp and εmax; see Equations (4) and (5)) which are likely to vary over space. Though such parameters have been tested and recommended by previous studies, they are often questioned whether they are really constant across different locations and vegetation cover classes. An alternative way to determine the model coefficients is to make them dynamically fit from field collected samples, which is believed to be more acceptable.
In the computation of the potential of carbon uptake, the size of the neighborhood within which to search for the optimal LMPs was set to be 20 km and the reference percentage (RP) 90%. Combination of the two parameters may affect the target level of carbon uptake under optimal LMPs and the carbon uptake potential. Our previous study has shown that given a reference percentage (RP) of 90%, a neighborhood with a size of ~20 km is optimal [38]. The result is rather sensitive to the parameter RP. A comparative study with RP setting at different levels in the Inner Mongolia grasslands revealed that the potential of carbon capture differed considerably; for example, with RP set at three levels, i.e., mean (50%), 95%, and max (100%), vegetation could add an extra carbon of 11.8, 58.9, and 74.6 gC m−2 yr−1, respectively, to its original level [69]. Higher RP means a stricter standard in defining the optimal LMPs, resulting in fewer candidates to select from and making it harder to implement the LMPs in practice. The decision by setting RP = 90% considers the tradeoff between the carbon uptake potential and practical implementation of the optimal LMPs.
Instead of NEP, or net ecosystem productivity which reflects the net carbon gain (source or sink) within an ecosystem, we apply NPP as the proxy to indicate the capacity of vegetation carbon uptake. NPP reflects the net carbon sequestration from vegetation but does not account for the carbon sequestration from soil pool. Conversely, NEP considers the carbon released from heterotrophic respiration (Rh) by soils and is derived from NPP and Rh. Because of the difficulty in obtaining Rh, the current study was unable to use NEP. Nevertheless, previous studies show that the total amount of Rh is largely proportional to NPP; for example, the previous study showed that the ratio of Rh to NPP was 0.71 [15]. Thus, the general pattern in the NEP potential from optimal LMPs is likely identical to the potential of NPP, though in different magnitude, and thus the conclusion that optimal LMPs can improve net carbon sequestration from vegetation should still hold. We acknowledge the uncertainties in our assessed potential of carbon uptake due to various reasons. First, the carbon uptake potential was essentially derived from the historical vegetation productivity data, i.e., NPP, simulated by process-based LUE models. The models were not calibrated. The key driven variables for the models, including NDVI from the sentinel-2 remote sensing images and the meteorological variables may also contain certain noises [70], which would be reflected in the output from the models. Second, the factors driving vegetation carbon capture are complex and quantitative analysis of the impact from LMPs imposes a big challenge. Both environmental factors and human activities can affect vegetation carbon sequestration [71]. The study applied region segmentation on three key environmental factors to level off their impact on vegetation, followed by an analysis of the internal variation within environmentally segmented patches to extract the optimal LMPs and derive the potential of carbon uptake. Inaccurate delimitation of homogeneous patches can come from any noise in the environmental datasets. Lastly, some other factors such as the variations of atmospheric content across the urban ecosystems, though probably not as important as the included, might still play an unignorable role in vegetation growth [72]. However, it is unrealistic to numerate them all, leading to uncertainties in assessed effect from the optimal LMPs. Verification of the carbon uptake potential can be evaluated through field control experiment (FCE) with multiple parallel fields under identical environmental conditions; carbon uptake can be compared between fields with and without LMPs. Unfortunately, FCE may take years to obtain the results. The current study applied patch segmentation by taking into consideration the environmental heterogeneity in the landforms (L), vegetation (V) cover, and soil (S) types, which largely simulates the idea from FCE.

5. Conclusions

Urban vegetation is a key component supporting the services of urban ecosystems. The spatial distribution of historical vegetation carbon uptake records important patterns related to the impact on vegetation productivity from both environmental factors (e.g., precipitation, temperature, or terrain slope) and human-dominated activities. While most environmental constraints on vegetation growth are hard to be lifted, it is relatively easier to adjust location-dependent land management practices. This study combined the segmentation of urban environments with neighborhood analysis to assess carbon uptake potential and extract optimal LMPs. The great Guangzhou area (GGA) was selected as the case study. The carbon uptake from urban vegetation was firstly modeled with input from remote sensing imagery and climatic datasets. The carbon uptake potential from urban vegetation was then assessed by isolating the impact from the spatially heterogeneous environmental factors. The study shows that the optimal LMPs can sequester, on average, ~30% more carbon, or 1.3 TgC yr−1 compared to its current total 4.4 TgC yr−1 in the GGA. The spatial variation in the carbon uptake potential provides useful information for prioritizing the regions to implement optimal LMPs. Urban planning should take into account optimal LMPs and focus on regions that present relatively higher potential in carbon uptake to realize cost efficiency in the implementation of optimal LMPs.

Author Contributions

Conceptualization, Z.S., Y.X., J.C. and X.T.; methodology, H.F. and D.Q.; software, H.F. and J.T.; validation, D.Q., X.L. and J.C.; formal analysis, H.F.; investigation, Z.S.; writing—original draft preparation, Z.S.; writing—review and editing, J.C. and Y.X.; visualization, H.F.; funding acquisition, Z.S. and J.C. All authors have read and agreed to the published version of the manuscript.

Funding

This research was supported by the Key Laboratory of Natural Resources Monitoring in Tropical and Subtropical Area of South China, Ministry of Natural Resources (No. 2022NRM006).

Institutional Review Board Statement

Not applicable.

Informed Consent Statement

Not applicable.

Data Availability Statement

Publicly available datasets were analyzed in this study. The Sentenel-2 and the climate variables can be found from Google Earth Engine at https://earthengine.google.com.

Conflicts of Interest

The authors declare no conflict of interest.

References

  1. Davies, Z.G.; Edmondson, J.L.; Heinemeyer, A.; Leake, J.R.; Gaston, K.J. Mapping an urban ecosystem service: Quantifying above-ground carbon storage at a city-wide scale. J. Appl. Ecol. 2011, 48, 1125–1134. [Google Scholar] [CrossRef] [Green Version]
  2. Seto, K.C.; Güneralp, B.; Hutyra, L.R. Global forecasts of urban expansion to 2030 and direct impacts on biodiversity and carbon pools. Proc. Natl. Acad. Sci. USA 2012, 109, 16083–16088. [Google Scholar] [CrossRef] [PubMed] [Green Version]
  3. El Garouani, A.; Mulla, D.J.; El Garouani, S.; Knight, J. Analysis of urban growth and sprawl from remote sensing data: Case of Fez, Morocco. Int. J. Sustain. Built Environ. 2017, 6, 160–169. [Google Scholar] [CrossRef]
  4. Churkina, G. The role of urbanization in the global carbon cycle. Front. Ecol. Evol. 2016, 3, 144. [Google Scholar] [CrossRef] [Green Version]
  5. Chang, J.; Qu, Z.; Xu, R.; Pan, K.; Xu, B.; Min, Y.; Ren, Y.; Yang, G.; Ge, Y. Assessing the ecosystem services provided by urban green spaces along urban center-edge gradients. Sci. Rep. 2017, 7, 11226. [Google Scholar] [CrossRef] [Green Version]
  6. Mao, Q.; Wang, L.; Guo, Q.; Li, Y.; Liu, M.; Xu, G. Evaluating Cultural Ecosystem Services of Urban Residential Green Spaces from the Perspective of Residents’ Satisfaction with Green Space. Front. Public Health 2020, 8, 226. [Google Scholar] [CrossRef]
  7. Wei, T.; Wu, J.; Chen, S. Keeping Track of Greenhouse Gas Emission Reduction Progress and Targets in 167 Cities Worldwide. Front. Sustain. Cities 2021, 3, 64. [Google Scholar]
  8. Seto, K.C.; Churkina, G.; Hsu, A.; Keller, M.; Newman, P.W.G.; Qin, B.; Ramaswami, A. From Low- to Net-Zero Carbon Cities: The Next Global Agenda. Annu. Rev. Environ. Resour. 2021, 46, 377–415. [Google Scholar] [CrossRef]
  9. Krarti, M.; Aldubyan, M. Role of energy efficiency and distributed renewable energy in designing carbon neutral residential buildings and communities: Case study of Saudi Arabia. Energy Build. 2021, 250, 111309. [Google Scholar] [CrossRef]
  10. Smith, P.; Adams, J.; Beerling, D.J.; Beringer, T.; Calvin, K.V.; Fuss, S.; Griscom, B.; Hagemann, N.; Kammann, C.; Kraxner, F.; et al. Land-Management Options for Greenhouse Gas Removal and Their Impacts on Ecosystem Services and the Sustainable Development Goals. Annu. Rev. Environ. Resour. 2019, 44, 255–286. [Google Scholar] [CrossRef]
  11. Du, J.; Fu, Q.; Fang, S.; Wu, J.; He, P.; Quan, Z. Effects of rapid urbanization on vegetation cover in the metropolises of China over the last four decades. Ecol. Indic. 2019, 107, 105458. [Google Scholar] [CrossRef]
  12. Jia, J.; Cui, W.; Liu, J. Urban Catchment-Scale Blue-Green-Gray Infrastructure Classification with Unmanned Aerial Vehicle Images and Machine Learning Algorithms. Front. Environ. Sci. 2022, 9, 734. [Google Scholar] [CrossRef]
  13. Sun, Y.; Frankenberg, C.; Wood, J.D.; Schimel, D.S.; Jung, M.; Guanter, L.; Drewry, D.T.; Verma, M.; Porcar-Castell, A.; Griffis, T.J.; et al. OCO-2 advances photosynthesis observation from space via solar-induced chlorophyll fluorescence. Science 2017, 358, eaam5747. [Google Scholar] [CrossRef] [Green Version]
  14. Landsberg, J.J.; Waring, R.H.; Williams, M. The assessment of NPP/GPP ratio. Tree Physiol. 2020, 40, 695–699. [Google Scholar] [CrossRef]
  15. Bond-lamberty, B.; Epron, D.; Harden, J.; Harmon, M.E.; Hoffman, F.; Kumar, J.; Mcguire, A.D.; Vargas, R. Estimating heterotrophic respiration at large scales: Challenges, approaches, and next steps. Ecosphere 2016, 7, e01380. [Google Scholar] [CrossRef]
  16. Wang, Y.; Li, X.; Li, J.; Huang, Z.; Xiao, R. Impact of Rapid Urbanization on Vulnerability of Land System from Complex Networks View: A Methodological Approach. Complexity 2018, 2018, 8561675. [Google Scholar] [CrossRef] [Green Version]
  17. Zhou, T.; Vermaat, J.E.; Ke, X. Variability of agroecosystems and landscape service provision on the urban–rural fringe of Wuhan, Central China. Urban Ecosyst. 2019, 22, 1207–1214. [Google Scholar] [CrossRef]
  18. Niemelä, J.; Breuste, J.H.; Elmqvist, T.; Guntenspergen, G.; James, P.; McIntyre, N.E. Urban Ecology: Patterns, Processes, and Applications; Oxford University Press: Oxford, UK, 2011; ISBN 9780199563562. [Google Scholar]
  19. Berger, C.; Laurent, F. Trunk injection of plant protection products to protect trees from pests and diseases. Crop Prot. 2019, 124, 104831. [Google Scholar] [CrossRef]
  20. Bogaert, J.; Barima, Y.S.S.; Mongo, L.I.W.; Bamba, I.; Mama, A.; Toyi, M.; Lafortezza, R. Forest Fragmentation: Causes, Ecological Impacts and Implications for Landscape Management. In Landscape Ecology in Forest Management and Conservation; Springer: Berlin/Heidelberg, Germany, 2011; pp. 273–296. [Google Scholar]
  21. Threlfall, C.G.; Williams, N.S.G.; Hahs, A.K.; Livesley, S.J. Approaches to urban vegetation management and the impacts on urban bird and bat assemblages. Landsc. Urban Plan. 2016, 153, 28–39. [Google Scholar] [CrossRef]
  22. Tan, B.A.; Gaw, L.Y.F.; Masoudi, M.; Richards, D.R. Nature-Based Solutions for Urban Sustainability: An Ecosystem Services Assessment of Plans for Singapore’s First “Forest Town. ” Front. Environ. Sci. 2021, 9, 610155. [Google Scholar] [CrossRef]
  23. Fujimori, S.; Wu, W.; Doelman, J.; Frank, S.; Hristov, J.; Kyle, P.; Sands, R.; van Zeist, W.J.; Havlik, P.; Domínguez, I.P.; et al. Land-based climate change mitigation measures can affect agricultural markets and food security. Nat. Food 2022, 3, 110–121. [Google Scholar] [CrossRef]
  24. Field, C.B.; Randerson, J.T.; Malmström, C.M. Global net primary production: Combining ecology and remote sensing. Remote Sens. Environ. 1995, 51, 74–88. [Google Scholar] [CrossRef] [Green Version]
  25. Hazarika, M.K.; Yasuoka, Y.; Ito, A.; Dye, D. Estimation of net primary productivity by integrating remote sensing data with an ecosystem model. Remote Sens. Environ. 2005, 94, 298–310. [Google Scholar] [CrossRef]
  26. Xu, Q.; Dong, Y.X.; Yang, R. Influence of land urbanization on carbon sequestration of urban vegetation: A temporal cooperativity analysis in Guangzhou as an example. Sci. Total Environ. 2018, 635, 26–34. [Google Scholar] [CrossRef] [PubMed]
  27. Peng, J.; Shen, H.; Wu, W.; Liu, Y.; Wang, Y. Net primary productivity (NPP) dynamics and associated urbanization driving forces in metropolitan areas: A case study in Beijing City, China. Landsc. Ecol. 2016, 31, 1077–1092. [Google Scholar] [CrossRef]
  28. Pan, S.; Tian, H.; Dangal, S.R.S.; Ouyang, Z.; Tao, B.; Ren, W.; Lu, C.; Running, S. Modeling and monitoring terrestrial primary production in a changing global environment: Toward a multiscale synthesis of observation and simulation. Adv. Meteorol. 2014, 2014, 965936. [Google Scholar] [CrossRef] [Green Version]
  29. Baartman, J.E.M.; Temme, A.J.A.M.; Saco, P.M. The effect of landform variation on vegetation patterning and related sediment dynamics. Earth Surf. Process. Landf. 2018, 43, 2121–2135. [Google Scholar] [CrossRef] [Green Version]
  30. Zhang, Y.; Huang, K.; Zhang, T.; Zhu, J.; Di, Y. Soil nutrient availability regulated global carbon use efficiency. Glob. Planet. Change 2019, 173, 47–52. [Google Scholar] [CrossRef]
  31. Del Grosso, S.; Parton, W.; Stohlgren, T.; Zheng, D.; Bachelet, D.; Prince, S.; Hibbard, K.; Olson, R. Global potential net primary production predicted from vegetation class, precipitation, and temperature. Ecology 2008, 89, 2117–2126. [Google Scholar] [CrossRef]
  32. Huang, H.; Chen, Y.; Clinton, N.; Wang, J.; Wang, X.; Liu, C.; Gong, P.; Yang, J.; Bai, Y.; Zheng, Y.; et al. Mapping major land cover dynamics in Beijing using all Landsat images in Google Earth Engine. Remote Sens. Environ. 2017, 202, 166–176. [Google Scholar] [CrossRef]
  33. Li, W.; Hsu, C.-Y. Automated terrain feature identification from remote sensing imagery: A deep learning approach. Int. J. Geogr. Inf. Sci. 2020, 34, 637–660. [Google Scholar] [CrossRef]
  34. Xu, S.; Wu, C.; Wang, L.; Gonsamo, A.; Shen, Y.; Niu, Z. A new satellite-based monthly precipitation downscaling algorithm with non-stationary relationship between precipitation and land surface characteristics. Remote Sens. Environ. 2015, 162, 119–140. [Google Scholar] [CrossRef]
  35. Levizzani, V.; Cattani, E. Satellite Remote Sensing of Precipitation and the Terrestrial Water Cycle in a Changing Climate. Remote Sens. 2019, 11, 2301. [Google Scholar] [CrossRef] [Green Version]
  36. Greve, M.H.; Greve, M.B.; Kheir, R.B.; Bøcher, P.K.; Larsen, R.; McCloy, K. Comparing Decision Tree Modeling and Indicator Kriging for Mapping the Extent of Organic Soils in Denmark; Springer: Dordrecht, The Netherlands, 2010; Volume 2. [Google Scholar]
  37. He, L.; Chen, J.M.; Croft, H.; Gonsamo, A.; Luo, X.; Liu, J.; Zheng, T.; Liu, R.; Liu, Y. Nitrogen Availability Dampens the Positive Impacts of CO2 Fertilization on Terrestrial Ecosystem Carbon and Water Cycles. Geophys. Res. Lett. 2017, 44, 11590–11600. [Google Scholar] [CrossRef] [Green Version]
  38. Sha, Z.; Bai, Y.; Li, R.; Lan, H.; Zhang, X.; Li, J.; Liu, X.; Chang, S.; Xie, Y. The global carbon sink potential of terrestrial vegetation can be increased substantially by optimal land management. Commun. Earth Environ. 2022, 3, 8. [Google Scholar] [CrossRef]
  39. Wang, H. Earth Human Settlement Ecosystem and Underground Space Research. Procedia Eng. 2016, 165, 765–781. [Google Scholar] [CrossRef]
  40. Wang, X.; Li, R.; Ding, H.; Fu, Y. Fine-Scale Improved Carbon Bookkeeping Model Using Landsat Time Series for Subtropical Forest, Southern China. Remote Sens. 2022, 14, 753. [Google Scholar] [CrossRef]
  41. Guo, L.; Xi, X.; Yang, W.; Liang, L. Monitoring Land Use/Cover Change Using Remotely Sensed Data in Guangzhou of China. Sustainability 2021, 13, 2944. [Google Scholar] [CrossRef]
  42. Wu, Y.; Wu, Z. Quantitative assessment of human-induced impacts based on net primary productivity in Guangzhou, China. Environ. Sci. Pollut. Res. 2018, 25, 11384–11399. [Google Scholar] [CrossRef]
  43. Vanella, D.; Longo-Minnolo, G.; Belfiore, O.R.; Ramírez-Cuesta, J.M.; Pappalardo, S.; Consoli, S.; D’Urso, G.; Chirico, G.B.; Coppola, A.; Comegna, A.; et al. Comparing the use of ERA5 reanalysis dataset and ground-based agrometeorological data under different climates and topography in Italy. J. Hydrol. Reg. Stud. 2022, 42, 101182. [Google Scholar] [CrossRef]
  44. Abatzoglou, J.T.; Dobrowski, S.Z.; Parks, S.A.; Hegewisch, K.C. TerraClimate, a high-resolution global dataset of monthly climate and climatic water balance from 1958–2015. Sci. Data 2018, 5, 170191. [Google Scholar] [PubMed]
  45. Runge, A.; Grosse, G. Mosaicking Landsat and Sentinel-2 Data to Enhance LandTrendr Time Series Analysis in Northern High Latitude Permafrost Regions. Remote Sens. 2020, 12, 2471. [Google Scholar] [CrossRef]
  46. Ebel, P.; Meraner, A.; Schmitt, M.; Zhu, X.X. Multisensor Data Fusion for Cloud Removal in Global and All-Season Sentinel-2 Imagery. IEEE Trans. Geosci. Remote Sens. 2021, 59, 5866–5878. [Google Scholar] [CrossRef]
  47. Karlsen, S.R.; Stendardi, L.; Tømmervik, H.; Nilsen, L.; Arntzen, I.; Cooper, E.J. Time-series of cloud-free sentinel-2 ndvi data used in mapping the onset of growth of central spitsbergen, svalbard. Remote Sens. 2021, 13, 3031. [Google Scholar] [CrossRef]
  48. Jones, P.G.; Thornton, P.K. Representative soil profiles for the Harmonized World Soil Database at different spatial resolutions for agricultural modelling applications. Agric. Syst. 2015, 139, 93–99. [Google Scholar] [CrossRef]
  49. Karra, K.; Kontgis, C.; Statman-Weil, Z.; Mazzariello, J.C.; Mathis, M.; Brumby, S.P. Global land use/land cover with Sentinel 2 and deep learning. In Proceedings of the 2021 IEEE International Geoscience and Remote Sensing Symposium IGARSS, Virtual Conference, 12–16 July 2021; pp. 4704–4707. [Google Scholar]
  50. Iwahashi, J.; Pike, R.J. Automated classifications of topography from DEMs by an unsupervised nested-means algorithm and a three-part geometric signature. Geomorphology 2007, 86, 409–440. [Google Scholar] [CrossRef]
  51. Jian, J.; Du, X.; Stewart, R.D. A database for global soil health assessment. Sci. Data 2020, 7, 16. [Google Scholar] [CrossRef] [Green Version]
  52. Wang, Y.; Xu, X.; Huang, L.; Yang, G.; Fan, L.; Wei, P.; Chen, G. An improved CASA model for estimating winter wheat yield from remote sensing images. Remote Sens. 2019, 11, 1088. [Google Scholar] [CrossRef] [Green Version]
  53. Landsberg, J.J.; Waring, R.H. A generalised model of forest productivity using simplified concepts of radiation-use efficiency, carbon balance and partitioning. For. Ecol. Manag. 1997, 95, 209–228. [Google Scholar] [CrossRef]
  54. Coops, N.C.; Waring, R.H.; Landsberg, J.J. Estimation of potential forest productivity across the Oregon transect using satellite data and monthly weather records. Int. J. Remote Sens. 2001, 22, 3797–3812. [Google Scholar] [CrossRef]
  55. Nolè, A.; Law, B.E.; Magnani, F.; Matteucci, G.; Ferrara, A.; Ripullone, F.; Borghetti, M. Application of the 3-PGS model to assess carbon accumulation in forest ecosystems at a regional level. Can. J. For. Res. 2009, 39, 1647–1661. [Google Scholar] [CrossRef]
  56. Coops, N.C.; Waring, R.H.; Landsberg, J.J. Assessing forest productivity in Australia and New Zealand using a physiologically-based model driven with averaged monthly weather data and satellite-derived estimates of canopy photosynthetic capacity. For. Ecol. Manag. 1998, 104, 113–127. [Google Scholar] [CrossRef]
  57. Li, X.; Song, J.; Lin, T.; Dixon, J.; Zhang, G.; Ye, H. Urbanization and health in China, thinking at the national, local and individual levels. Environ. Health A Glob. Access Sci. Source 2016, 15, S32. [Google Scholar] [CrossRef] [PubMed] [Green Version]
  58. Fallahi, H.-R.; Mahmoodi, S. Impact of water availability and fertilization management on saffron (Crocus sativus L.) biomass allocation. J. Hortic. Postharvest Res. 2018, 1, 131–146. [Google Scholar]
  59. Bayle, G.K. Ecological and social impacts of eucalyptus tree plantation on the environment. J. Biodivers. Conserv. Bioresour. Manag. 2019, 5, 93–104. [Google Scholar] [CrossRef] [Green Version]
  60. Xie, Y.; Hou, Z.; Liu, H.; Cao, C.; Qi, J. The sustainability assessment of CO2 capture, utilization and storage (CCUS) and the conversion of cropland to forestland program (CCFP) in the Water–Energy–Food (WEF) framework towards China’s carbon neutrality by 2060. Environ. Earth Sci. 2021, 80, 468. [Google Scholar] [CrossRef]
  61. Peroni, F.; Pristeri, G.; Codato, D.; Pappalardo, S.E.; De Marchi, M. Biotope Area Factor: An Ecological Urban Index to Geovisualize Soil Sealing in Padua, Italy. Sustainability 2019, 12, 150. [Google Scholar] [CrossRef] [Green Version]
  62. Nesbitt, L.; Meitner, M.J.; Girling, C.; Sheppard, S.R.J.; Lu, Y. Who has access to urban vegetation? A spatial analysis of distributional green equity in 10 US cities. Landsc. Urban Plan. 2019, 181, 51–79. [Google Scholar] [CrossRef]
  63. Pei, N.; Wang, C.; Sun, R.; Xu, X.; He, Q.; Shi, X.; Gu, L.; Jin, J.; Liao, J.; Li, J.; et al. Towards an integrated research approach for urban forestry: The case of China. Urban For. Urban Green. 2019, 46, 126472. [Google Scholar] [CrossRef]
  64. Wei, S.; Chen, Q.; Wu, W.; Ma, J. Quantifying the indirect effects of urbanization on urban vegetation carbon uptake in the megacity of Shanghai, China. Environ. Res. Lett. 2021, 16, 064088. [Google Scholar] [CrossRef]
  65. Yang, J.; Gong, P.; Zhou, J. Spatial and Temporal Change of Urban Vegetation Distribution in Beijing. In Ecology, Planning, and Management of Urban Forests; Springer: New York, NY, USA, 2008; pp. 346–356. [Google Scholar]
  66. Li, D.; Wu, S.; Liang, Z.; Li, S. The impacts of urbanization and climate change on urban vegetation dynamics in China. Urban For. Urban Green. 2020, 54, 126764. [Google Scholar] [CrossRef]
  67. Li, M.; Zhang, G.; Liu, Y.; Cao, Y.; Zhou, C. Determinants of urban expansion and spatial heterogeneity in China. Int. J. Environ. Res. Public Health 2019, 16, 3706. [Google Scholar] [CrossRef] [PubMed]
  68. Nesshöver, C.; Assmuth, T.; Irvine, K.N.; Rusch, G.M.; Waylen, K.A.; Delbaere, B.; Haase, D.; Jones-Walters, L.; Keune, H.; Kovacs, E.; et al. The science, policy and practice of nature-based solutions: An interdisciplinary perspective. Sci. Total Environ. 2017, 579, 1215–1227. [Google Scholar] [CrossRef] [PubMed]
  69. Sha, Z.; Bai, Y.; Lan, H.; Liu, X.; Li, R.; Xie, Y. Can more carbon be captured by grasslands? A case study of Inner Mongolia, China. Sci. Total Environ. 2020, 723, 138085. [Google Scholar] [CrossRef] [PubMed]
  70. Hird, J.N.; McDermid, G.J. Noise reduction of NDVI time series: An empirical comparison of selected techniques. Remote Sens. Environ. 2009, 113, 248–258. [Google Scholar] [CrossRef]
  71. Chen, B.; Zhang, X.; Tao, J.; Wu, J.; Wang, J.; Shi, P.; Zhang, Y.; Yu, C. The impact of climate change and anthropogenic activities on alpine grassland over the Qinghai-Tibet Plateau. Agric. For. Meteorol. 2014, 189–190, 11–18. [Google Scholar] [CrossRef]
  72. Gu, F.; Zhang, Y.; Tao, B.; Wang, Q.; Yu, G.; Zhang, L.; Li, K. Modeling the effects of nitrogen deposition on carbon budget in two temperate forests. Ecol. Complex. 2010, 7, 139–148. [Google Scholar] [CrossRef]
Figure 1. The study area: (a) The provincial boundaries of China. (b) The administrative boundary of Guangdong province, where the study area (the greater Guangzhou area, GGA) is located. (c) The land (vegetation) cover classes in GGA.
Land 11 01878 g001
Figure 2. Workflow for computing carbon uptake potential from urban vegetation with implementation of optimal LMPs. The diagram shows segmentation of environmentally homogeneous patches (zones), the unique LVS# for a given location i, the neighborhood, NPP distribution of the location, and the overlapped area of the LVS zones and neighborhood to derive NPPTarget,i and NPPgap,i or the potential of carbon uptake. The computation of carbon uptake potential is repeated for all locations in the study region.
Land 11 01878 g002
Figure 3. Distribution of NPP and statistics among different land cover classes. (a) NPP flux. (b) Land cover area, NPP flux, and total NPP among land cover classes. (c) Land area statistics of the land cover classes. (d) Contribution of carbon uptake from vegetation in the different land cover types.
Land 11 01878 g003
Figure 4. Soil (S) types: (a) landforms (L) (b) and the derived segmented patches (c) from S, vegetation (V) cover (refer to Figure 1c), and L. The colors in (a,b) show aggregation of the environmental factors (i.e., soil cover and landforms) and in (c) the homogeneous patches derived from the L, V, and S factors, where n in each figure indicates the numbers of classes.
Land 11 01878 g004
Figure 5. Distribution of carbon uptake potential and its variations among the land cover classes. (a) the flux of potential of carbon uptake, (b) the carbon uptake potential from different land cover classes, (c) area of the land cover classes, (d) contribution of carbon uptake potential among the land cover classes.
Land 11 01878 g005
Table 1. Land (vegetation) cover classification schema.
Class #Area (%)ClassificationExamples
112.7WatersRivers, ponds, lakes, oceans, flooded salt plains.
245.4Trees/forestsWooded vegetation, clusters of dense tall vegetation within savannas, plantations, swamps or mangroves.
57.9CropsCorn, wheat, soy, fallow plots of structured land.
732.2Urbanized areasHouses, dense villages/towns/cities, paved roads, asphalt.
111.3RangelandsNatural meadows and fields with sparse to no tree cover; open savanna with few to no trees; parks/golf courses/lawns; pastures; moderate to sparse cover of bushes, shrubs, and tufts of grass; savannas with very sparse grasses, trees, or other plants.
# Other classes with area less than 1.0% are excluded.
Table 2. Data description and data sources.
Data TypeData Description and VariablesData Sources
Climate dataA number of variables are included: monthly minimum, mean and maximum temperature, monthly precipitation, monthly sun shortwave radiation, average dewpoint temperature, surface pressure, soil moisture, vapor pressure deficit (VPD), and reference evapotranspirationERA5-L and TerraClimate, both at monthly scale, are combined; it provides a consistent view of the evolution of land variables over several decades at a spatial resolution 5 km [43]. TerraClimate is a dataset of monthly climate and climatic water balance for global terrestrial surfaces, with coarser spatial resolution (~10 km) [44].
NDVIDynamics of vegetation greenness proxied by monthly maximum NDVI which indicates the part, or the effective absorption, of solar radiation and thus vegetation productivity.Sentinel-2 multispectral instrument (MSI), Level-2A, at 10 m in spatial resolution and a combined revisit time of 5 days. The monthly NDVI can be obtained by maximum composite and cloud gap filling [46].
Soil coverSoil properties are largely reflected in soil classes. The same soil type usually shows similar contribution/constraint to vegetation growth. Soil cover data can map the difference in soil type distribution.Harmonized World Soil Database (HWSD) at ~1 km in spatial resolution and 194 classes [51].
LandformsLandforms represent the combined effect of slope, surface roughness, and local convexity for a given location, which is important for vegetation growth.European Soil Data Centre (ESDAC) at ~1 km, with 16 landform labels [50].
Vegetation (land) coverVegetation (land) cover determines the base level for vegetation productivity. For example, forests usually outperform grassland in vegetation productivity. Carbon uptake potential can be evaluated for the same land cover type.Land cover with 10 classes at 10 m, derived from Sentinel-2 and a deep learning algorithm, by Environmental Systems Research Institute (ESRI) [49].
Table 3. Contribution of carbon potential in different land (vegetation) cover classes in GGA.
ItemsForestsCroplandsUrbanizedRangelandsAverage #Total
Land area (×108 m2) (%)36.7 (52.3)6.4 (9.1)26.0 (37.1)1.1 (1.5)/70.2 (100)
NPP flux (gC m−2 yr−1)883.3521.5281.5608.7622.2/
Carbon potential flux (gC m−2 yr−1)60.4209.4353.9249.2185.0/
Total NPP (×1011 gC yr−1) (%)32.4 (74.1)3.4 (7.7)7.3 (16.8)0.6 (1.5)/43.7 (100)
Total potential (×1011 gC yr−1) (%)2.2 (16.9)1.3 (10.3)9.2 (70.7)0.3 (2.0)/13.0 (100)
Ratio (Carbon potential/NPP)0.070.401.250.410.300.30
# The averaged NPP column and carbon potential flux is area-weighted from the land cover types.
Table 4. Urban vegetation management to improve vegetation carbon sequestration.
StrategiesExampleDescriptionOutcome
Increased vegetation proportionArtificially plant trees to increase vegetation proportion [62]Turn previously barren or discarded lands into human-made parksMore greenspace (parks) in urban areas enhances ecosystem services to local residents
Optimized vegetation cover densityManage urban forests to increase vegetation density [63]Improve trees in forest area to optimize landscape patterns and tree densityThe higher tree density improves vegetation productivity and provides green welfares for residents
Optimized vegetation landscapesApply landscape design to increase vegetation complexity [64,65]Scatter vegetation cover over space and improve fragmentation or reduce connectivity of vegetation landscape patternsThe increased fragmentation or reduced connectivity in vegetation cover promotes vegetation carbon uptake
Publisher’s Note: MDPI stays neutral with regard to jurisdictional claims in published maps and institutional affiliations.

