Article

On the Landscape Activity Measure Coupling Ecological Index and Public Vitality Index of UGI: The Case Study of Zhongshan, China

1
School of Architecture and Urban Planning, Beijing University of Civil Engineering and Architecture, Beijing 100044, China
2
School of Architecture, Southeast University, Nanjing 210096, China
*
Author to whom correspondence should be addressed.
Land 2022, 11(11), 1879; https://doi.org/10.3390/land11111879
Submission received: 7 September 2022 / Revised: 19 October 2022 / Accepted: 20 October 2022 / Published: 22 October 2022

Abstract

:
In the context of high-quality urban development and the increasingly important role of urban green infrastructure (UGI) in public life, landscape activity (LA) has gradually become a dominant indicator for improving UGI quality and efficiency, as well as optimizing its environmental friendliness and meeting the recreational needs of the public. Relevant studies have shown that the ecological index (EI) and the public vitality index (PVI) can characterize LA from the perspectives of greening quality and public activities, respectively, and their simultaneous analysis can provide professional judgment and quantitative technical approaches for the LA analysis of UGI. At the same time, with the support of remote sensing, big data, GIS, and other spatial information data, the LA model coupling EI and PVI of UGI needs to be developed. First, this article established a research framework for UGI landscape activity, and by combining environmental remote sensing and location-based services (LBS) technology, a technical LA measurement strategy suitable for the coupled analysis of EI and PVI was formed. Then, based on the MATLAB platform and the entropy-weighted TOPSIS model, this research developed a fusion analysis algorithm of EI and PVI to establish the LA model, taking the central urban area of Zhongshan as a case study. Finally, four-quadrant classification and quantitative grading of LA were developed based on the ArcGIS platform. Empirical research showed that the UGI area of the study area was about 176.43 km2, and 160 UGI units were identified. The minimum LA value is 0.06, and the maximum is 0.85. The LA of UGI in the study area can be divided into three grades: low (0–0.24), medium (0.24–0.46), and high (0.46–0.85). Among them, the top 5% of UGI units mainly correspond to urban parks and waterfront greenways, and the bottom 5% mainly correspond to islands and farmland. The quantitative distribution of UGI in the four quadrants of LA in the study area is relatively balanced: among them, the number of high-quality developing types is the largest, accounting for 29.4%, and that of high-quality mature types is the least, accounting for 20.0%. This article forms a concise model and technical process for the LA of UGI, which can be used for its quantitative analysis and evaluation. It is expected that the research result will be significant for the high-quality construction of UGI and the sustainable development of the urban landscape in terms of research and exploration.

1. Introduction

1.1. Background

The systematic integration and harmonious development of the natural environment and the built environment has always been an important topic in scientific research on human settlements, including landscape architecture. As a natural and artificial system formed by the interconnection of all open green spaces, wetlands, and water bodies in and around a city, urban green infrastructure (UGI) has a variety of ecological, social, and economic landscape functions [1]. With the support of synergistic research on landscape architecture and landscape ecology, UGI has become a landscape strategy to support the integration of people and nature in the process of urban development. As it is difficult to make structural changes to the built environment in the era of urban stock development, research on the spatial structure of the UGI network has little guiding effect on practice, and the effect of UGI on sustainable urban development occurs more through the improvement of the landscape effectiveness of its internal units. According to the actual construction and humanized use, the stock UGI covers all the green spaces in and around a city; thus, it is not only an important carrier of the city’s natural environment, but also a destination for public activities, showing the landscape service characteristics of the coordinated development of greening quality and public vitality, and increasingly becoming a landscape node where human activities and the natural environment are integrated [2]. In the context of the increasingly prominent landscape function of UGI, landscape activity (LA) has gradually become a dominant indicator for UGI to improve its quality and efficiency [3]. Therefore, how to scientifically evaluate and quantitatively study the LA of UGI in an urbanized environment is not only a key issue in research on landscape performance and evidence-based design, but also a related issue in the context of contemporary research on the quality and efficiency improvement of UGI. In this sense, this research has scientific value and practical significance for the high-quality construction and sustainable development of UGI.
Landscape activity (LA) describes the coordinated development of public vitality and environmental quality in the same landscape space [4], which is a feature of the people-environment isomorphism. The public vitality directly reflects the social use of the landscape environment [5], and the physical environment represents the sustainability of LA based on the quality of environmental elements [6]. With the deepening of relevant research, the correlation between public vitality and environmental quality has gradually become a research hotspot in urban landscape studies, and a lot of research has been carried out on urban forests, public green spaces, and country parks, etc. Many research results supported the fact that high-quality environmental elements have a positive effect on LA [7], laying a research foundation for the development of UGI transformation and its landscape activity. For the specific landscape object of UGI, considering green-based environmental characteristics, the two characteristic dimensions of LA study should be public vitality and green quality. Combining the professional vision of landscape architecture to carry out the coupling research of greening quality and public vitality can provide a unique analysis path for LA research of UGI against a background of urban green development in the postindustrial city.
Quantitative description and coupling analysis of greening quality and public vitality are the core issues of UGI landscape activity research. The ecological index (EI) and public vitality index (PVI), two quantitative indices commonly used to assess the greening quality and public vitality of a scenic recreation environment, aid in the subjective and objective analysis of LA cognition. EI mainly includes a series of objective and explicit indices of greening environment components and their overall characterization. Because it can concisely characterize environmental quality without going deep into ecosystem research, it is used for landscape environmental monitoring and greenery quality evaluation [8,9]. PVI mainly characterizes the vitality of leisure activities in the public environment, including the type, intensity, hot/cold spots, and spatial distribution of the population and their activities [10]. In the context of built environment stock development, external indices such as spatial pattern and location have little effect on the quality and efficiency improvement demand of UGI, and thus, relevant indices describing the internal characteristics of UGI patches are mainly selected when establishing the analysis mechanism of greening quality and public vitality in this research. In the coupling analysis session, the contribution of the characteristics of green quality and public vitality to the landscape activity system needs to be further determined. It focuses on establishing a model that combines objective weight calculation and comprehensive evaluation, and realizing LA measurement through PVI and EI coupling. The establishment of this model can provide a technical path for the UGI’s unique LA study against a backdrop of urban green development in the postindustrial era and human-centered cities.
As an urban-scale landscape system, UGI has the characteristics of large scale, complex shape, diverse constituent elements, and interlaced natural patches and green patches of the built environment; therefore, a traditional field survey method cannot meet the related research needs [11]. The development of spatial information technology and multisource data fusion technology has provided a way of multisource data integration collection and collaborative analysis for LA research on UGI [12]. Environmental remote sensing technology and big data technology based on location services have been widely used in urban-scale greening quality and public vitality research [13,14]. With this technical background, the combination of the ecological index (EI) based on remote sensing technology and the public vitality index (PVI) based on big data provides observable data and applicable indices for LA research of UGI at the urban scale. However, the current integration of LA research with big data is low, and LA research for large-scale landscape objects has not been carried out yet. Combining the LA analysis mechanism of UGI with big data technology will contribute to the technical synergy of big data in LA research. Based on that, this article establishes a coupling analysis mechanism between EI and PVI, develops an LA model and key technology suitable for UGI, and further carries out the spatial mapping, information integration, and quantitative evaluation of LA measurements. The technical results of this research will provide an objective basis for UGI landscape activity analysis, control, planning, and construction.

1.2. Relevant Research Progress

1.2.1. Landscape Research on UGI Based on Remote Sensing Technology

In August 1999, the “GI Work Group” organized by the Conservation Fund and the USDA Forest Service proposed the definition of green infrastructure (GI) for the first time [15]. The practice of GI begins with regional-scale land use and conservation planning, and has been gradually applied to ecological planning at the urban scale. In 2007, “The Urban Green Infrastructure Plan for Seattle” received an analysis and planning honor award from the American Society of Landscape Architects (ASLA). After that, the focus of GI began to shift from the regional scale to the urban scale, and the concept of UGI was formed. As a macro-ecology research unit, UGI has a long time span and a wide range in its landscape research, and thus remote sensing images are essential basic data for such research. In recent years, UGI landscape research based on remote sensing technology has mainly focused on the landscape pattern [16] and landscape change [17] of UGI. Research on landscape patterns and changes in UGI mainly concentrates on the spatiotemporal distribution characteristics and morphological evolution of its landscape components. Under the influence of ecological theories such as landscape connectivity and landscape heterogeneity, related research is supported by geographic information technology, forming a basic path for the remote sensing interpretation, landscape pattern evaluation, and dynamic change analysis of UGI. The in-depth research mainly focuses on the analysis of the internal mechanism about the driving force [18], ecological response [19], and optimization simulation [20] of UGI landscape change.
At present, remote sensing mainly relies on high-resolution image data and image interpretation technology to provide a quantitative analysis of UGI patches for related research. In terms of data, ALOS (with a resolution of 10 m), SPOT (with a resolution of 10 m), GF-6 (with a resolution of 2 m), GF-2 (with a resolution of 1 m), QuickBird (with a resolution of 0.61 m), Pleiades (with a resolution of 0.5 m), and other high-scoring data sources can all achieve high classification accuracy in the interpretation of landscape elements. In terms of technology, remote sensing image interpretation methods can be divided into “pixel-based” and “object-oriented” according to the different basic units of classification. The object-oriented classification method was proposed by Baatz and Schape, and its superiority over the pixel-level classification has been proven [21], including two steps: segmentation and classification [22]. Common segmentation methods include traditional methods such as thresholds [23], edges [24], regions [25], and clusters [26], as well as deep learning methods such as full convolutional network (FCN) [27], pyramid scene parsing network (PSPNet) [28], Deep Lab [29], and Mask R-CNN [30], etc. Common features used in UGI classification include various vegetation indices based on visible and near-infrared bands, such as the normalized difference vegetation index (NDVI), ratio vegetation index (RVI), and enhanced vegetation index (EVI). Commonly used classification methods cover traditional methods (support vector machine (SVM), Bayesian, decision tree, random forest, etc.) and deep learning methods (U-Net, SegNet, etc.). Combined with the mature technology and methods of remote sensing processing, the remote sensing image processing platform has simplified the process of remote sensing image interpretation and improved the interpretation efficiency, which provides a stable platform and technical support for remote sensing image interpretation.
Based on object-based image analysis (OBIA) theory and practice, the eCognition platform integrates rich segmentation and classification algorithms, which have been effectively applied to research on the urban landscape. Based on the OBIA and fuzzy classification methods in eCognition, Hofmann et al. mapped the green space of the city of Bishkek, Kyrgyzstan [31]. Saini et al. conducted change detection on multitemporal Landsat data in Chandigarh, India, using an object-oriented classification method through eCognition, to observe urban growth patterns in Chandigarh during rapid urbanization [32]. Using eCognition as a platform, Tunay et al. carried out a green space extraction experiment in downtown Bartin based on three different kinds of remote sensing data, namely, Landsat 7 ETM+, SPOT 4 level 2A, and IKONOS [33]. Macfaden et al. achieved fine-scale tree canopy mapping in the complex urban environment of New York City through a combination of eCognition and human review based on high-definition LiDAR [34]. Object-oriented classification methods based on eCognition are currently mainly used for component interpretation, analysis of land use and land cover, and change detection in urban environments. It can be seen from the research above that eCognition has a wide range of applicability to the interpretation of landscape elements. How to combine relevant research progress to build an object-oriented UGI interpretation process based on eCognition and realize the accurate extraction of UGI is one of the focuses of this research.

1.2.2. Study on the Ecological Index and Public Vitality Index of Urban Landscape

The urban landscape provides ecological, social, economic, and other diversified services for urban life, and its greening quality and public vitality are the dominant indicators of landscape performance. With the popularization of big data (remote sensing, population distribution, etc.) and its processing technology, related research is developing at the level of method and technology. The ecological index (EI) integrates a series of basic observation indices of environmental ecology. Based on the theories of environment, geography, and landscape ecology, relevant research has been carried out in various fields of urban landscape greening quality, such as its spatial differentiation [35], change detection [36,37], driving force analysis [38], and so on. EI mainly includes characteristic indices of environmental components based on environmental science, and characteristic indices of ecological pattern and process based on landscape ecology. After determining EI for specific objects and goals, analytic hierarchy process (AHP), comprehensive evaluation method, value evaluation method, and ecological footprint analysis are commonly used methods of greening quality evaluation. Based on the indices and methods above, as well as the different characteristics and target needs of different landscape objects, diversified evaluation systems have been developed and established. However, the methods, standards, and processes of greening quality evaluation have not formed a unified standard up to now, and there are large differences due to differences in countries and regions, spatial scales, and evaluation objects. In 2006, the Ministry of Ecology and Environment of the People’s Republic of China launched the ecological index (EI), applicable to the regional scale in the form of environmental protection industry standards, including five indices: vegetation coverage, biological abundance, land degradation, water network density, and pollution load. The EI standardizes the indices and calculation methods of greening quality evaluation to a certain extent. However, due to the difficulty of obtaining data for thepollution load index, it only supports the annual evaluation of greening quality at the regional level, which is not conducive to real-time monitoring and change evaluation of greening quality. Moreover, EI also does not have the potential for spatial visualization. With the continuous development of remote sensing technology, a series of remote sensing indices provides opportunities for EI improvement, including fractional vegetation coverage (FAV) [39], leaf area index (LAI) [40], fraction of absorbed photosynthetically active radiation (FAPAR) [41], land surface temperature (LST) [42], evapotranspiration (ET) [43], and aboveground biomass (AGB) [44]. These indices are derived from the combination of remotely sensed observation parameters and ecological models, and therefore have some ecological significance. In 2013, Xu selected four remote sensing indices that were highly related to EI according to the expression of its subindices, combined with principal component analysis to establish a remote sensing improved EI, and verified its consistency with the original EI [45]. The improved EI compensates for the shortcomings of EI in terms of visualization and is widely used in spatiotemporal analysis, change detection, modeling, and the prediction of greening quality [46].
Based on MODIS data stored on Google Earth Engine (GEE), Xia et al. studied the spatiotemporal changes and related factors of greening quality in California from 2000 to 2020 with RSEI [38]. Based on a series of Landsat images, Nie et al. used an improved RSEI to monitor and evaluate the greening quality of Yangquan Coal Mine in Shanxi Province from 1987 to 2020 [47]. At present, greening quality research, supported by remote sensing technology, provides urban-scale quantitative ecological indices for urban landscape quality monitoring. It has become a focus of current research to combine relevant research results with the need to improve the quality and efficiency of urban landscapes, develop research on landscape efficiency combined with quantitative indices of greening quality, and satisfy the demand for the sustainable development of urban landscapes.
A public vitality index can quantitatively describe the ability of a space in terms of attracting and supporting public activities. Relevant research based on the theory of landscape environmental behavior and landscape psychology has been carried out in the fields of type classification, vitality grading, and characteristic analysis of urban landscape public vitality, and PVI is also widely used in waterfront spaces, urban parks, and greenways, etc. [48,49]. Behavioral observation is the most commonly used method in research on public vitality and is carried out by investigating people’s behavior and perceptions to obtain the relevant public vitality index. The traditional data sources of the behavioral observation include field survey data obtained through spatial observation, questionnaires, and on-site interviews, among which the public space and public life (PSPL) survey proposed by Jan Gale is a representative one. However, research based on traditional behavioral observation methods is time-consuming, labor-intensive, and expensive, and these methods cannot meet the needs of large-scale public vitality research. In contrast, big data such as social network data, environmental perception data, and positioning and navigation data have the characteristics of wide coverage and strong objectivity, opening up new perspectives and fields for the study of public vitality [50]. Relevant indices such as cumulative population density, which represents vitality intensity; cold/hot spot, which represents vitality aggregation; and population diversity and activity diversity, which represent vitality diversity, have been studied and applied.
Among them, population density has gradually become the main data representation of public vitality. Meng et al. selected the population density of LBS data as a spatial vitality representation and evaluated the relationship between landscape features and urban vitality through regression analysis [51]. On this basis, Gomez-Varo et al. demonstrated that the combination of population density and environmental quality elements is an important prerequisite for space vitality [52]. Public vitality research based on big data is mainly carried out on public spaces such as urban business districts, street spaces, and waterfront spaces and has the advantages of quantification, indexation, high precision, and transferability. At present, related research focuses on the groups and activities that are the main body of vitality. How can we combine the relevant research results with the need for improving the quality and efficiency of the urban landscape, explore the effect of landscape environmental quality on vitality, and realize the integration of the “human-space” perspective? These questions have become hot topics in current LA research.
To sum up, the research on the ecological index and public vitality index of urban landscape has a sufficient foundation for joint research. Spatial information technologies such as remote sensing, big data, and GIS provide objective indices for the ecological index and public vitality index at the urban scale. Such indices are characterized by wide coverage, fast update speed, and strong transferability, which make them highly suitable for measuring UGI landscape activity. Fully applying the above techniques and indices, the UGI landscape activity research coupled with the ecological index and public vitality index can make up for the existing research’s inadequate response to the demand for high quality of life, but can also be a new theoretical growth point for UGI research and may provide scientific opportunities for collaborative innovation on related methods and technologies.

1.3. Purpose

With the increasing value of public activities, the landscape transformation of UGI has become an important indicator of the high-quality development of human settlements. Landscape activity characterizes the ability of UGI to attract crowd activities on the basis of maintaining its own greening quality and is now an important indicator of its quality improvement and efficiency. The first question the LA research of UGI faced is how to establish a unique landscape activity analysis mechanism of UGI. By analyzing the concept and characteristics of LA and combining the green-based environmental characteristics of UGI, this paper selects greening quality and public vitality as the characteristics of UGI landscape activity. Further research focuses on the selection of greening quality and public vitality evaluation indices. Combined with big data technology, improved ecological indices based on remote sensing data and public vitality indices based on LBS data are selected to construct EI and PVI, which are used to quantitatively describe the greening quality and public vitality, respectively, of UGI patches. On this basis, EI and PVI constitute the two-dimensional characteristics of UGI landscape activity. A further question is how to determine the contribution of the two to a landscape activity system and measure them together. The entropy-weighted TOPSIS model, suitable for multi-index comprehensive evaluation, is selected in this research to form the index weights and measurements of UGI landscape activity. By integrating the measurements and indices’ values above, the spatial differentiation map and eigenvalue table indexed by UGI patches are formed on the ArcGIS platform. We used cluster grading and four-quadrant classification methods to further evaluate and discuss the results.
This research focuses on the landscape activity (LA) of UGI, using the ecological index (EI) to characterize the basic qualities of the green environment, and the public vitality index (PVI) to characterize the openness and public service quality, combining big data and 3S technology to conduct coupled research on EI and PVI, and then realizing the logical derivation and quantitative assessment of UGI landscape activity.
The research includes the following four steps:
(1) Analyze the actual needs of UGI landscape activity research, realize the logical derivation of UGI landscape activity, and establish its analysis mechanism. Combined with the research progress of LA and the environmental characteristics of UGI, this research constructs a research framework of UGI landscape activity from the dual perspectives of greening quality and public vitality, which provides a basis for the quantitative analysis of UGI with “environment-human” coupling.
(2) Combine the concepts of greening quality and public vitality, as well as related indices supported by big data, to construct an “EI-PVI” index system suitable for UGI, and then establish respective analysis mechanisms for EI and PVI. On this basis, develop entropy-weight TOPSIS as the coupling algorithm model of EI and PVI for LA measurement, and deepen the integrated research and technical synergy of remote sensing, big data, GIS, and other spatial information technologies in UGI quality and efficiency improvement.
(3) Taking the central urban area of Zhongshan, Guangdong, as an example, conduct an empirical study to verify the feasibility of the LA model and the credibility of EI and PVI in terms of reflecting the greening quality and public vitality. Based on the quantitative results and relying on the ArcGIS platform, we develop spatial discretization maps and an eigenvalue table of measurements.
(4) Carry out the grading and classification evaluation of landscape activity. The grading evaluation adopts the “Natural Breaks” method to form three types of LA levels, high, medium, and low, which are suitable for the qualitative and quantitative description of the overall LA state in the study area. The classification evaluation adopts the four-quadrant method, which divides UGI into four categories according to the two-dimensional eigenvalues. The classification results can reflect the LA composition of UGI units and assist decision making on LA improvement.

2. Materials and Methods

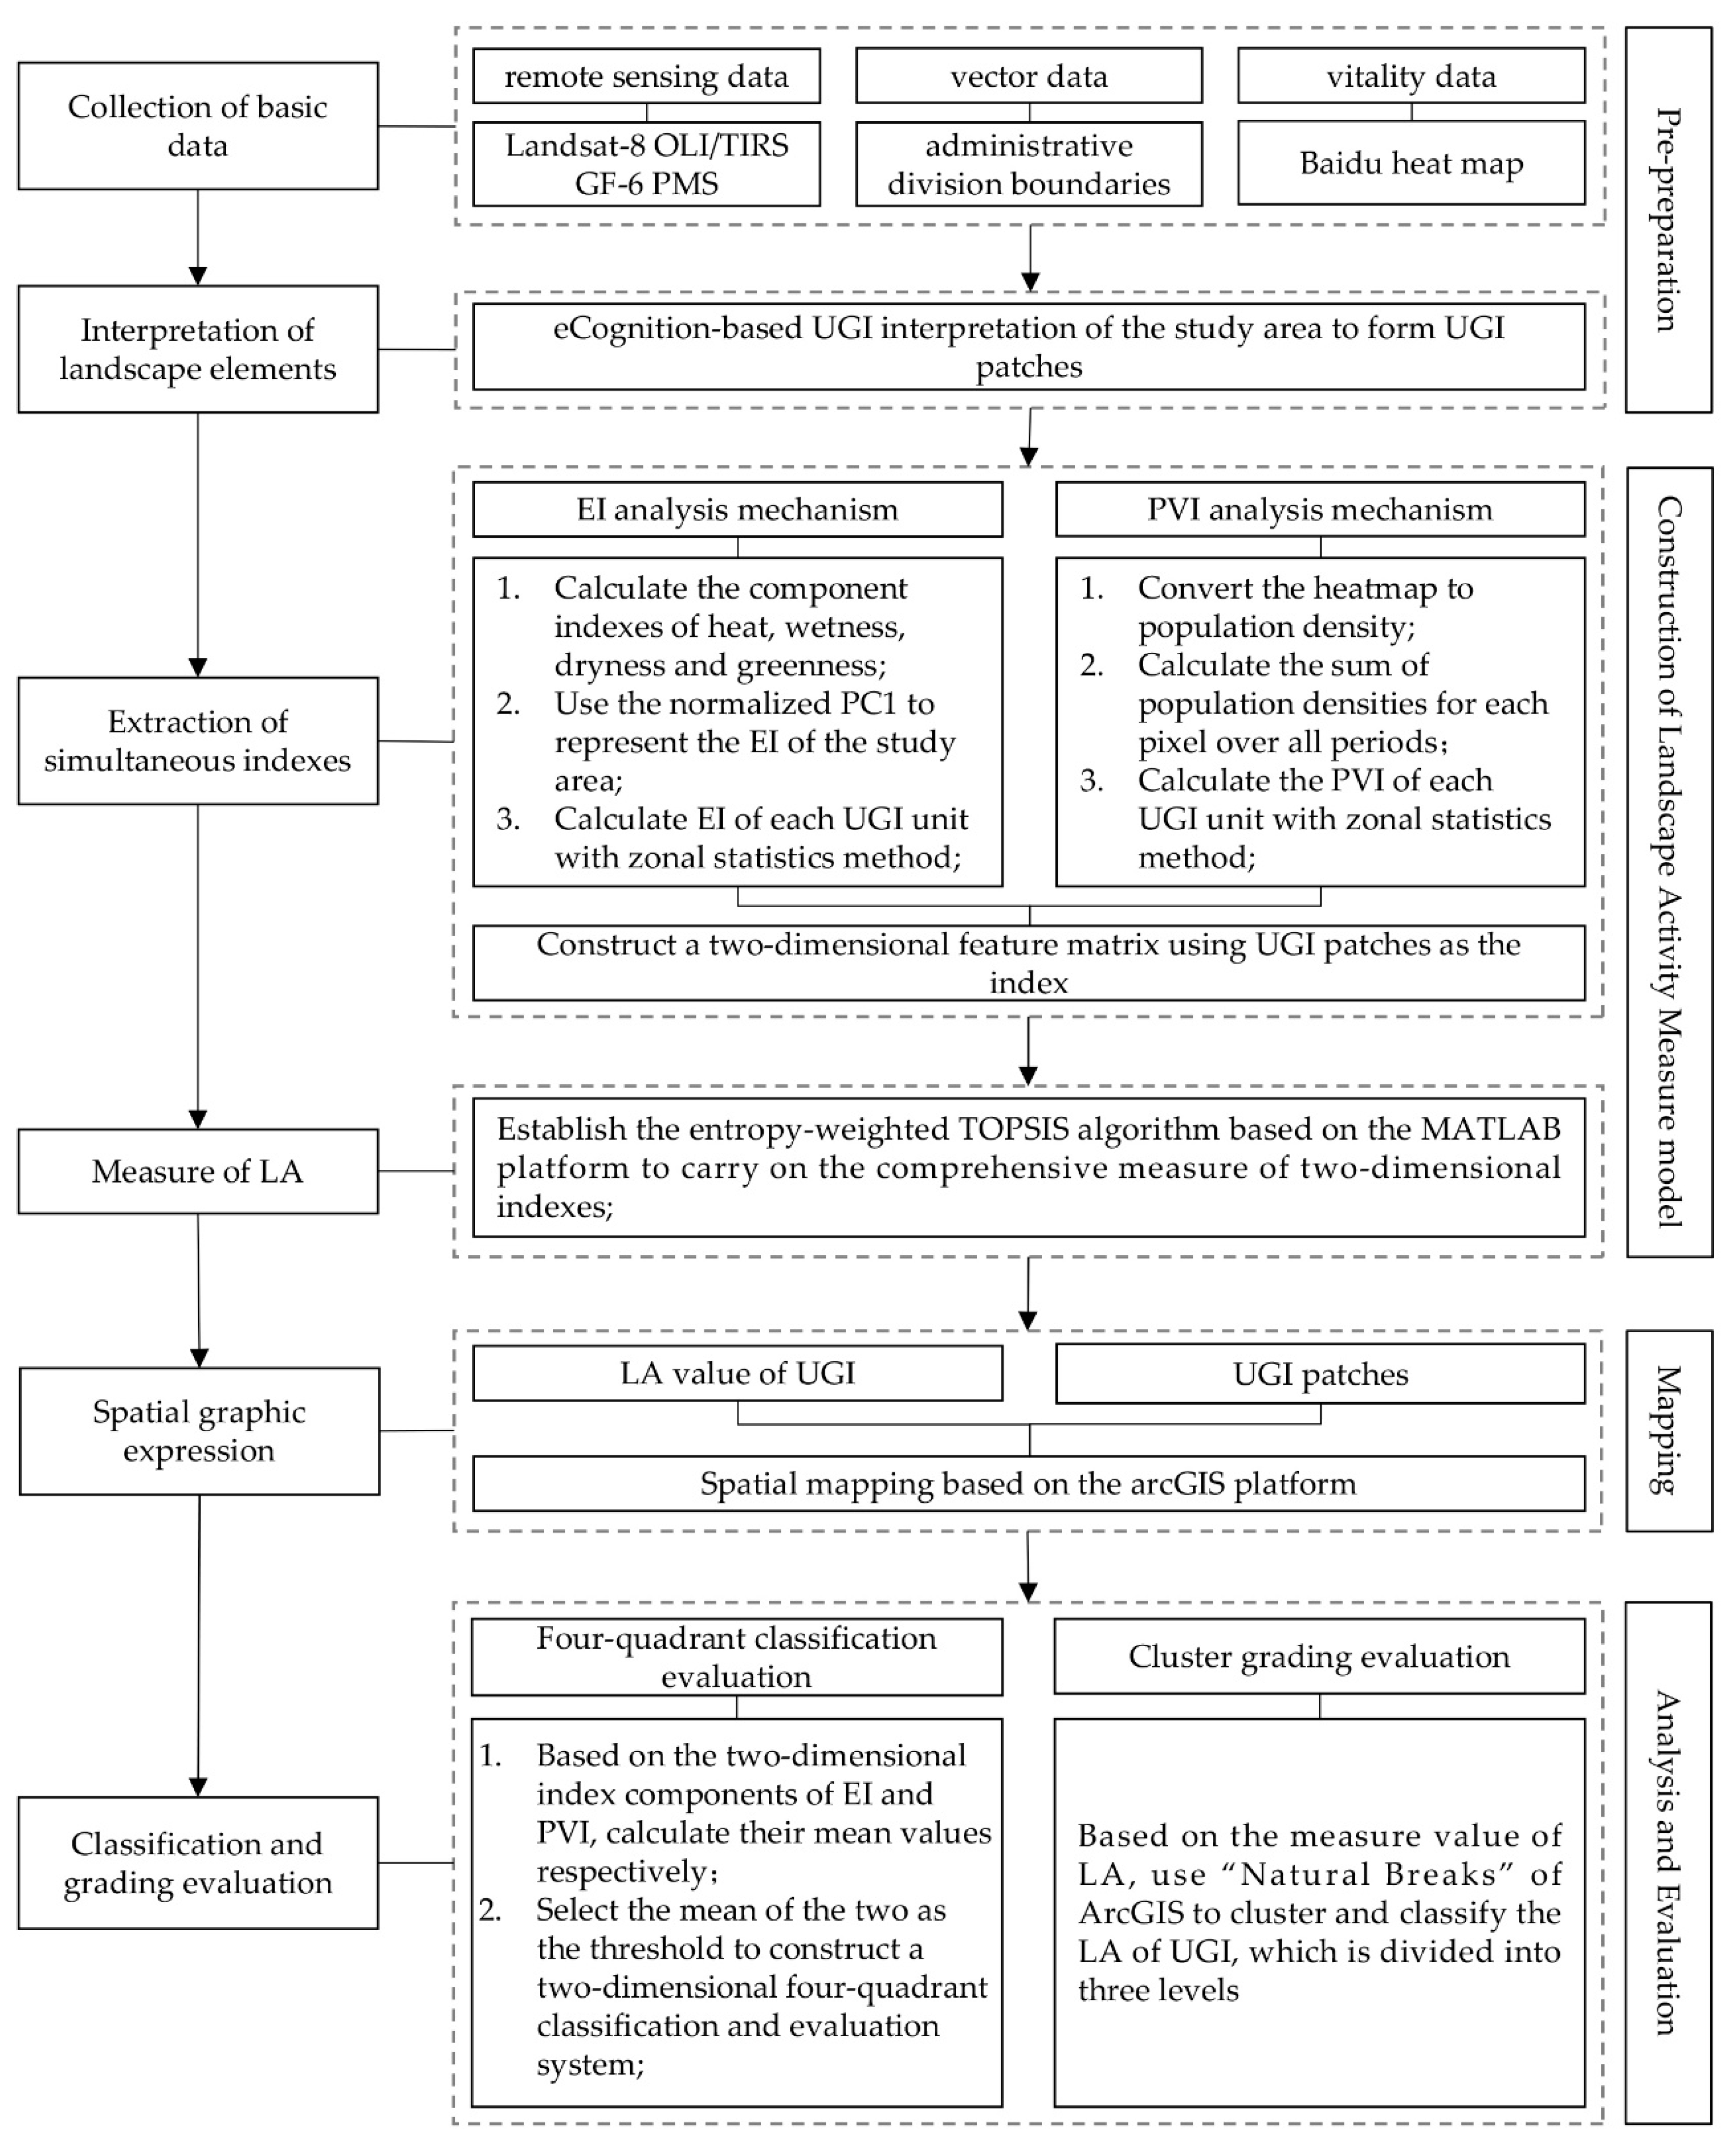
2.1. Research Framework

The research steps are as follows:
(1) Collection of basic data: separately collect the remote sensing data required for UGI interpretation and EI calculation, the population distribution big data required for the calculation of PVI, and the vector data required to define and indicate the research scope.
(2) Interpretation of UGI patches: extract UGI patches in the study area from GF-6 remote sensing images based on eCognition interpretation technology, further combine the morphological spatial pattern analysis (MSPA) to measure, identify, and segment the spatial pattern of UGI, and then conduct a qualitative evaluation of the overall network pattern.
(3) Extraction of simultaneous indices:
(a)
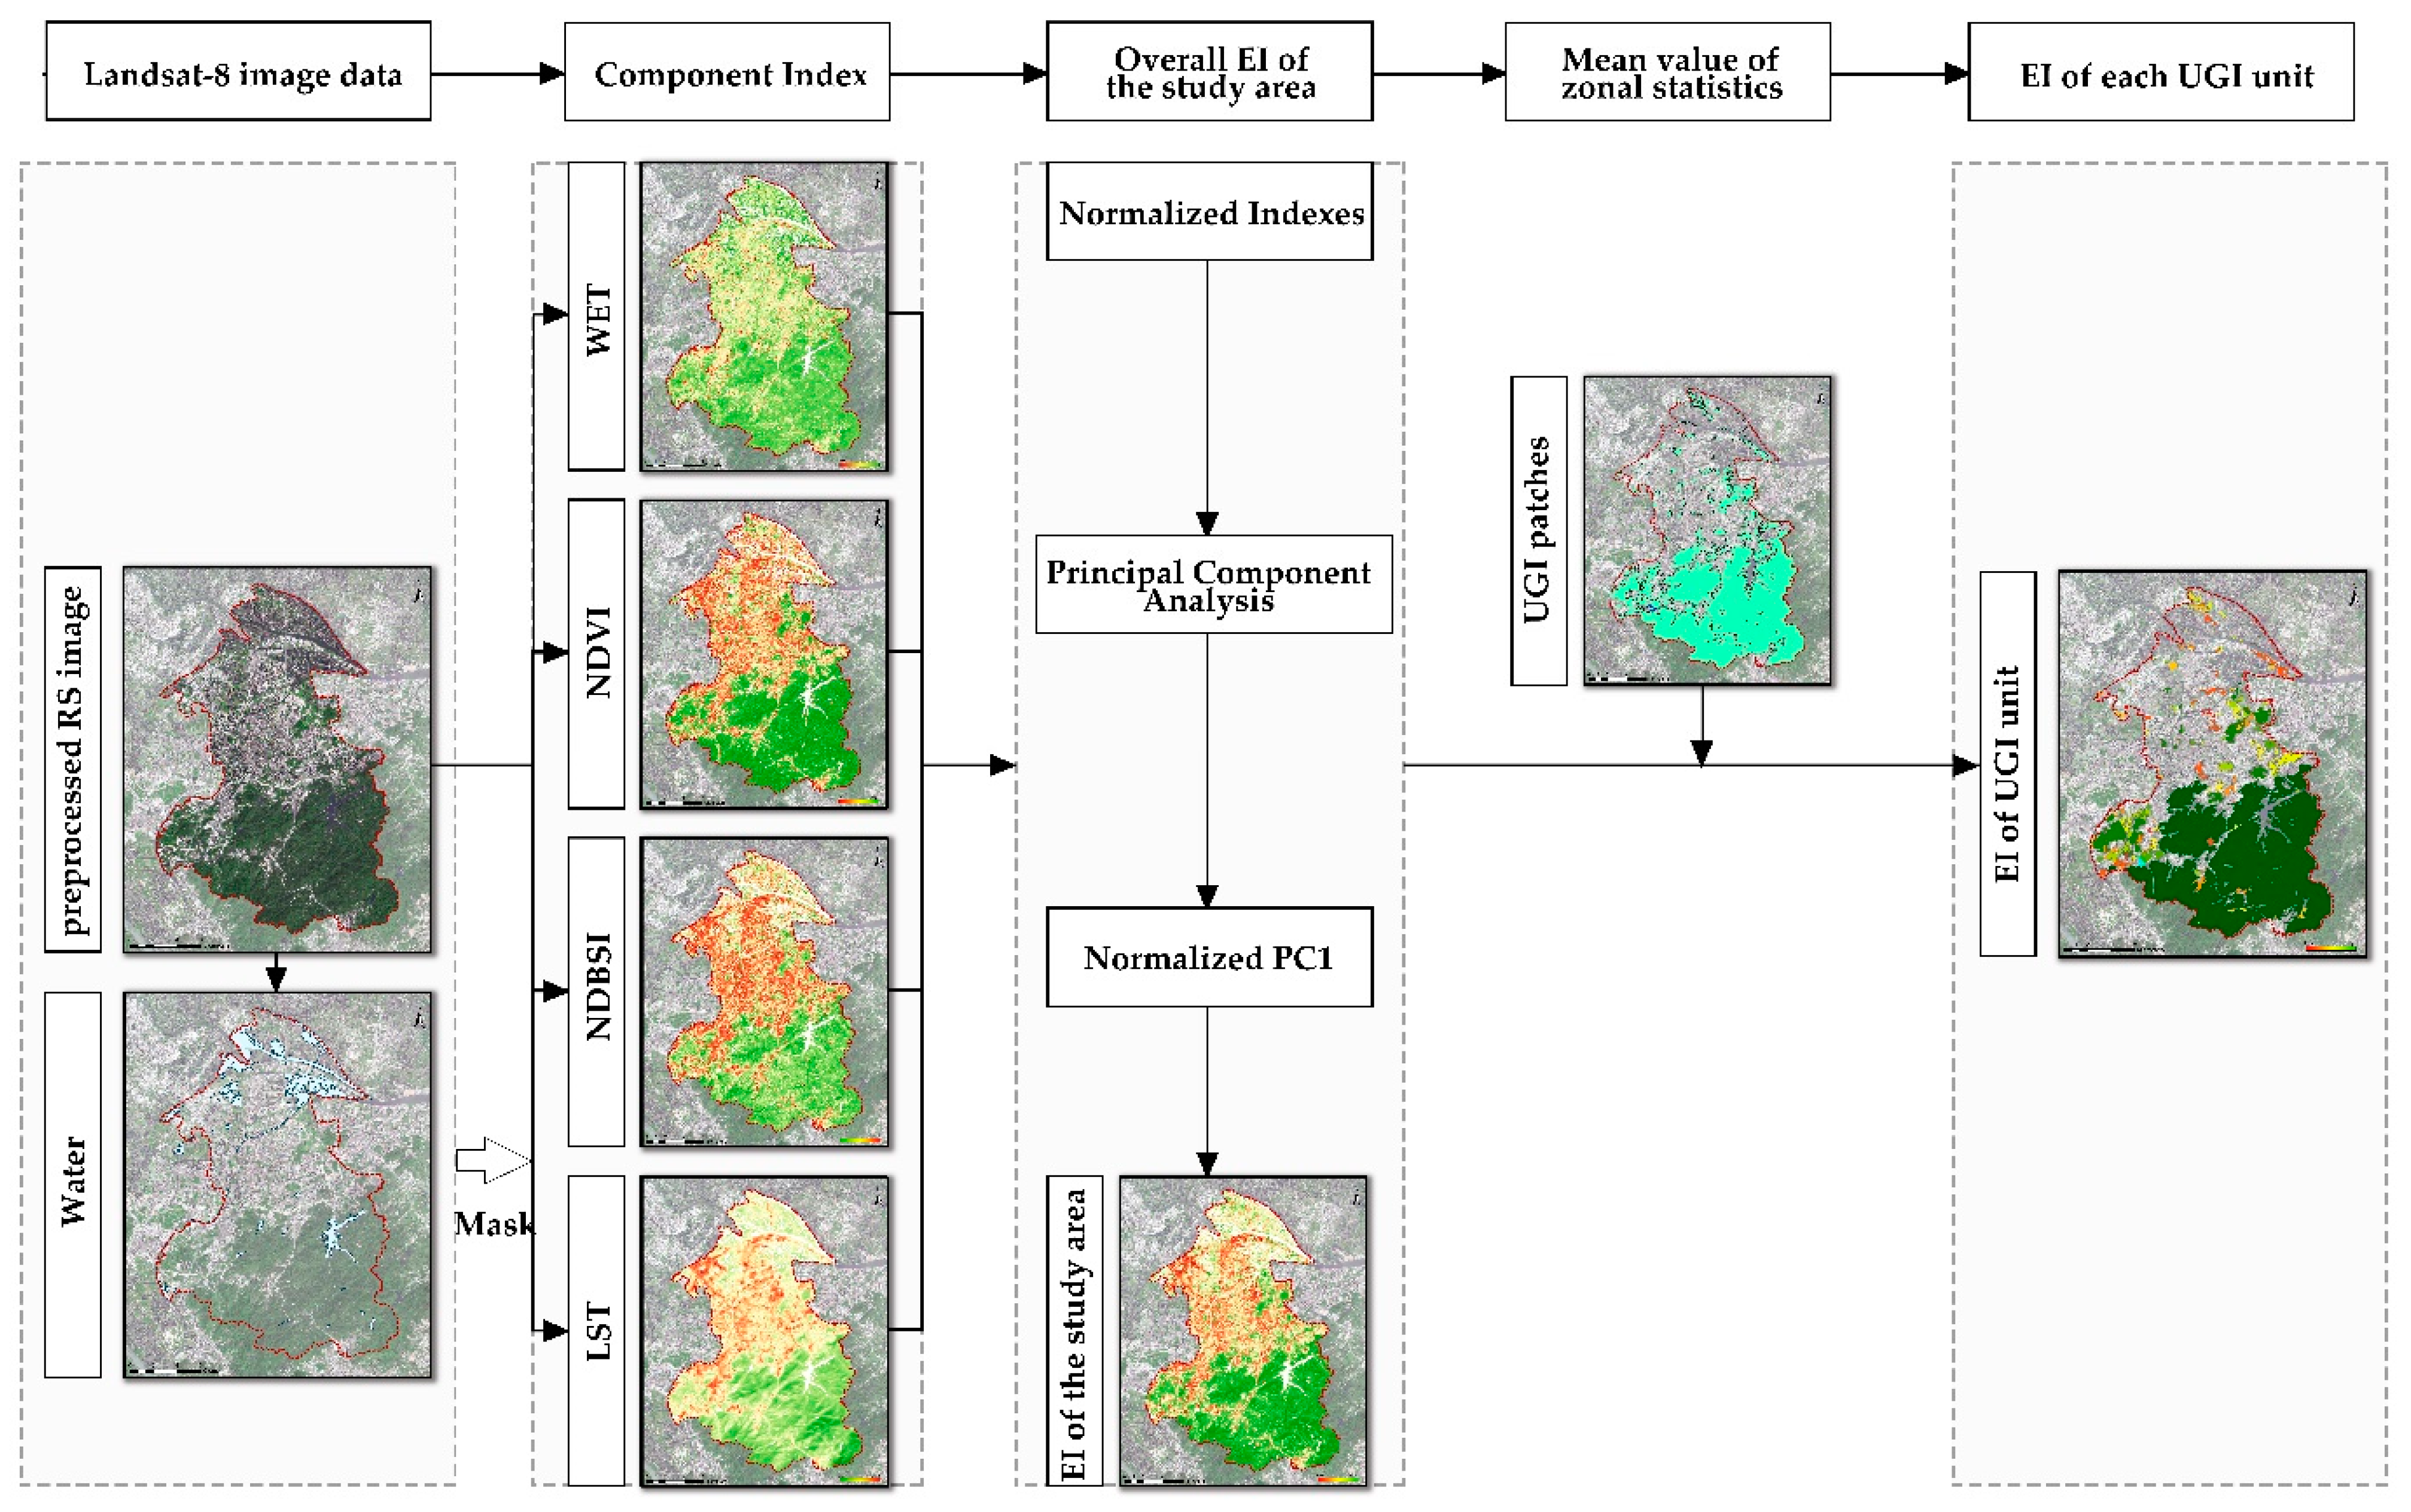
Obtain the ecological index (EI) based on the remote sensing technique. Landsat 8 remote sensing data with thermal infrared band are selected, and four remote sensing ecological indices of greenness, wetness, dryness and heat are quantified and extracted by the ENVI platform. After normalization, the first principal component is extracted by principal component analysis (PCA) to represent the overall greening quality of the study area. Finally, the zonal statistics method is used to obtain the EI of each UGI patch.
(b)
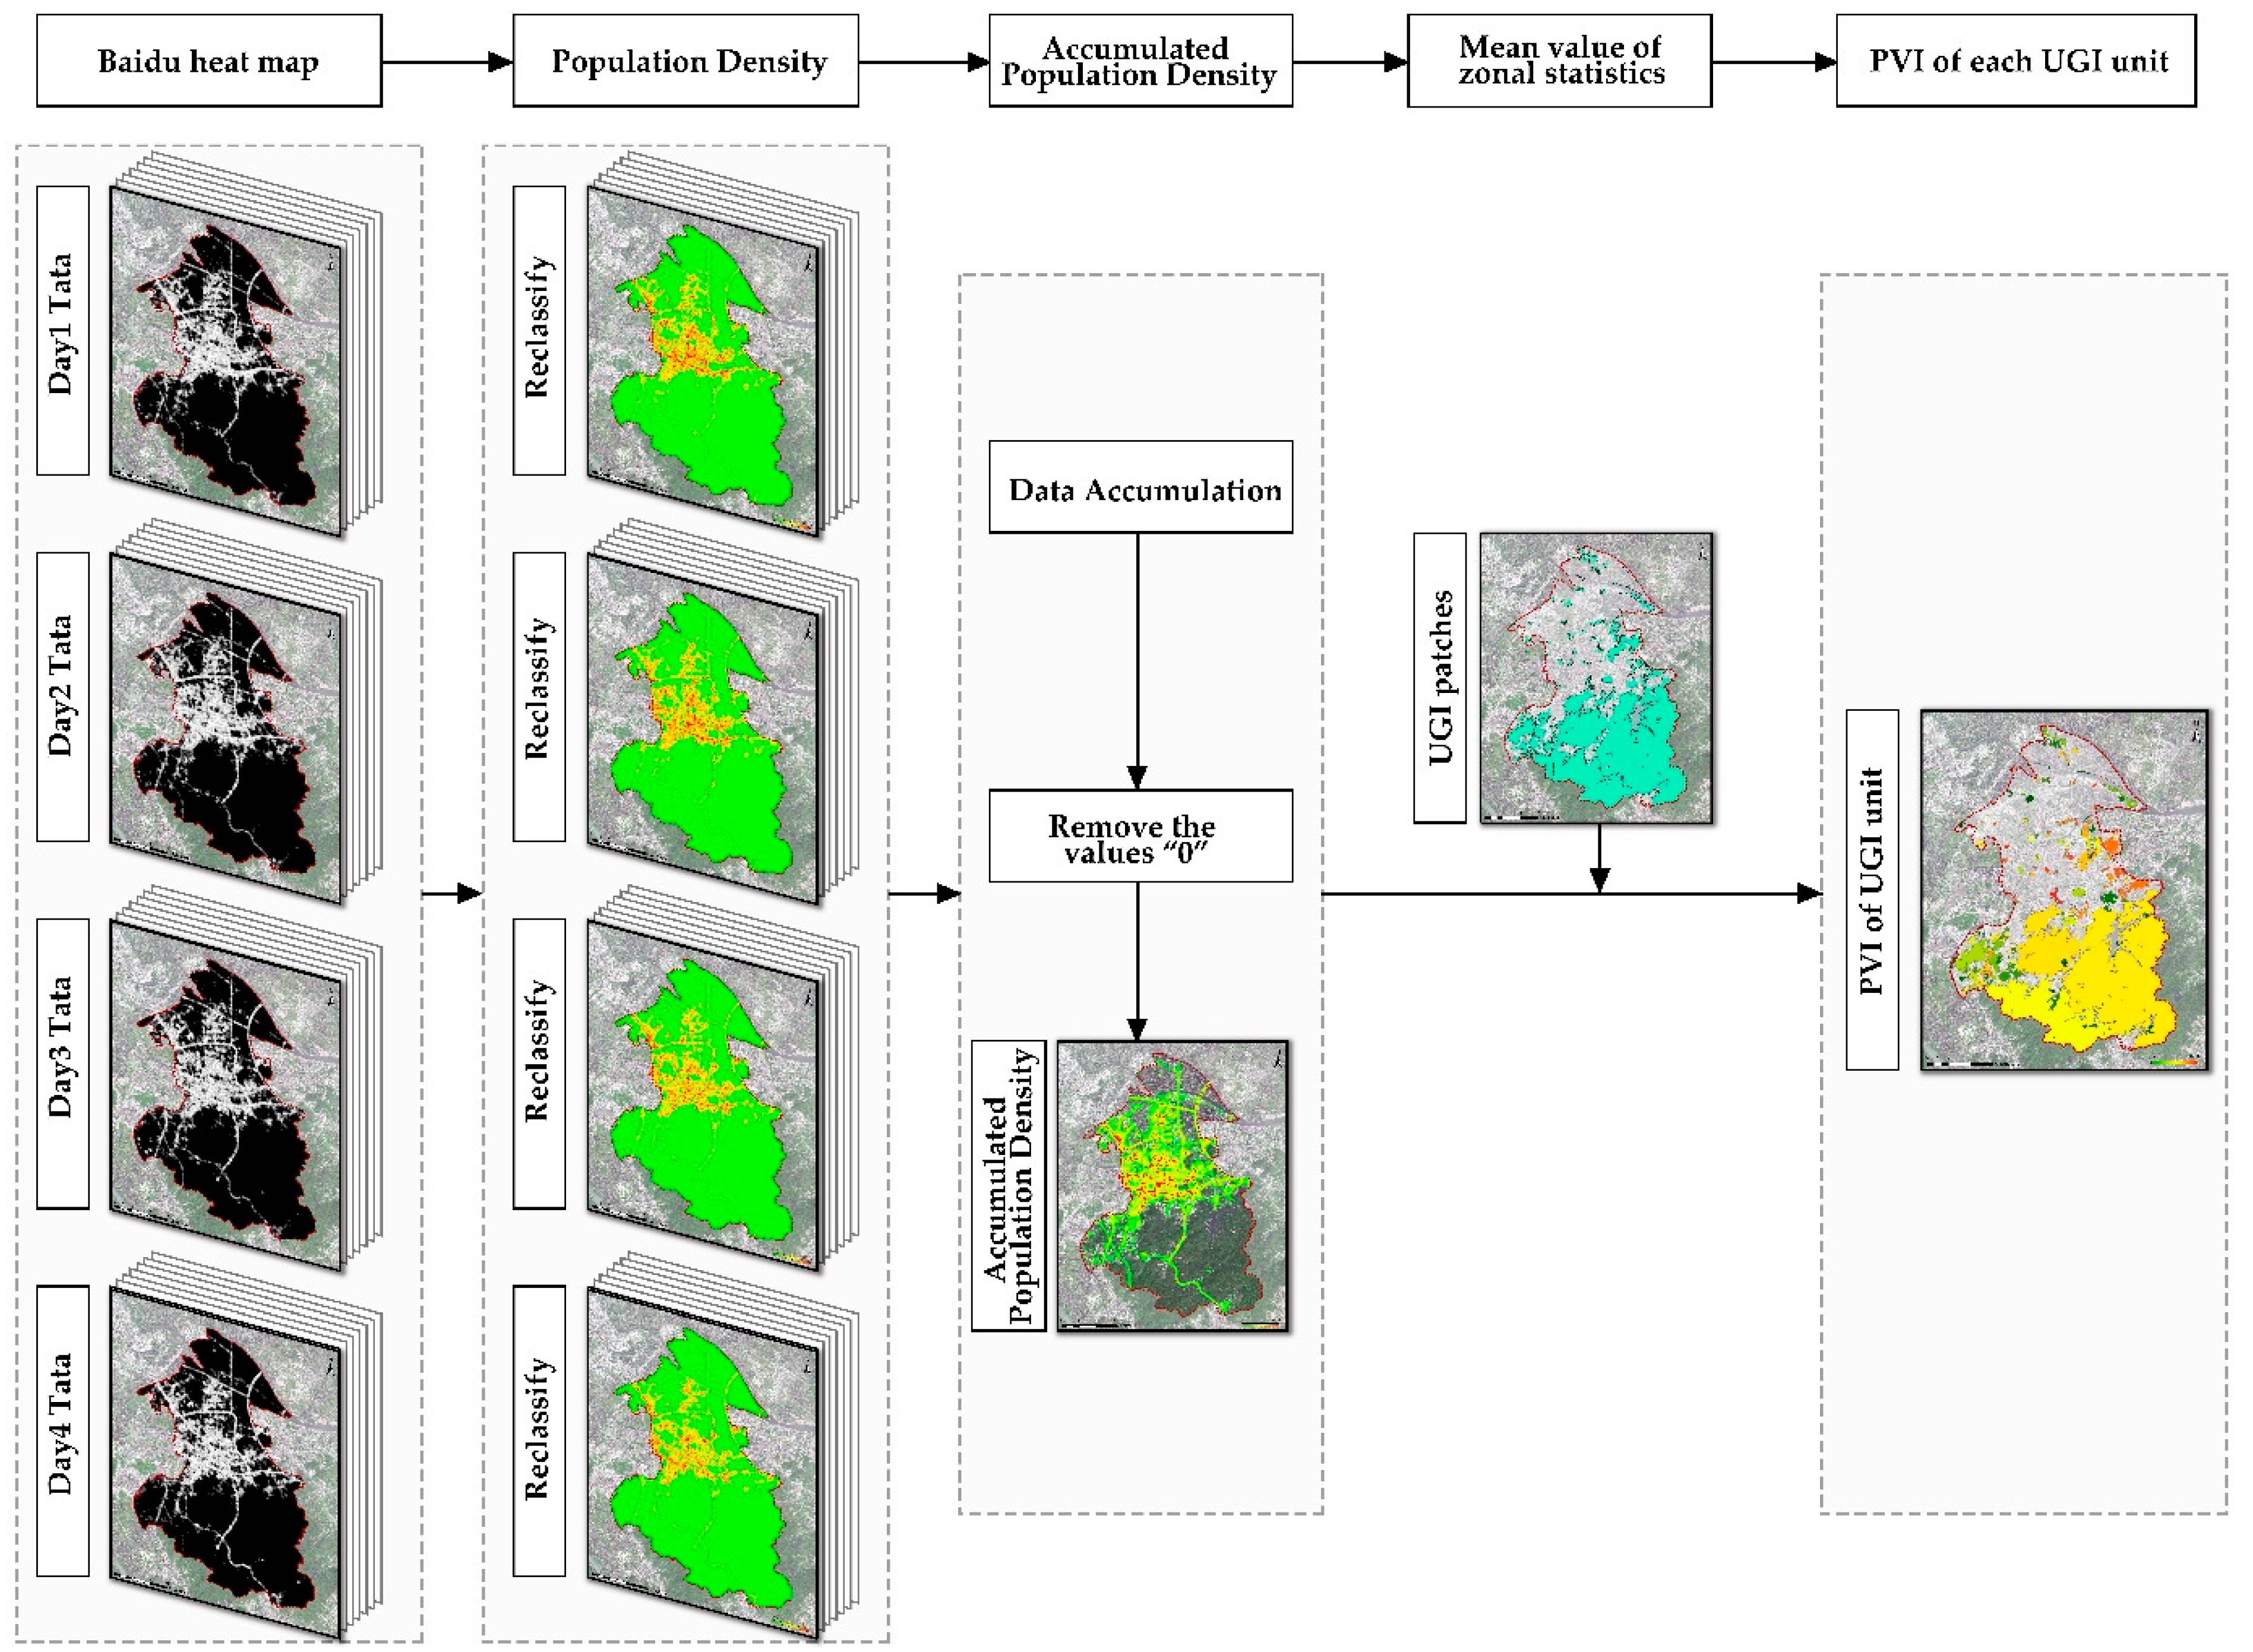
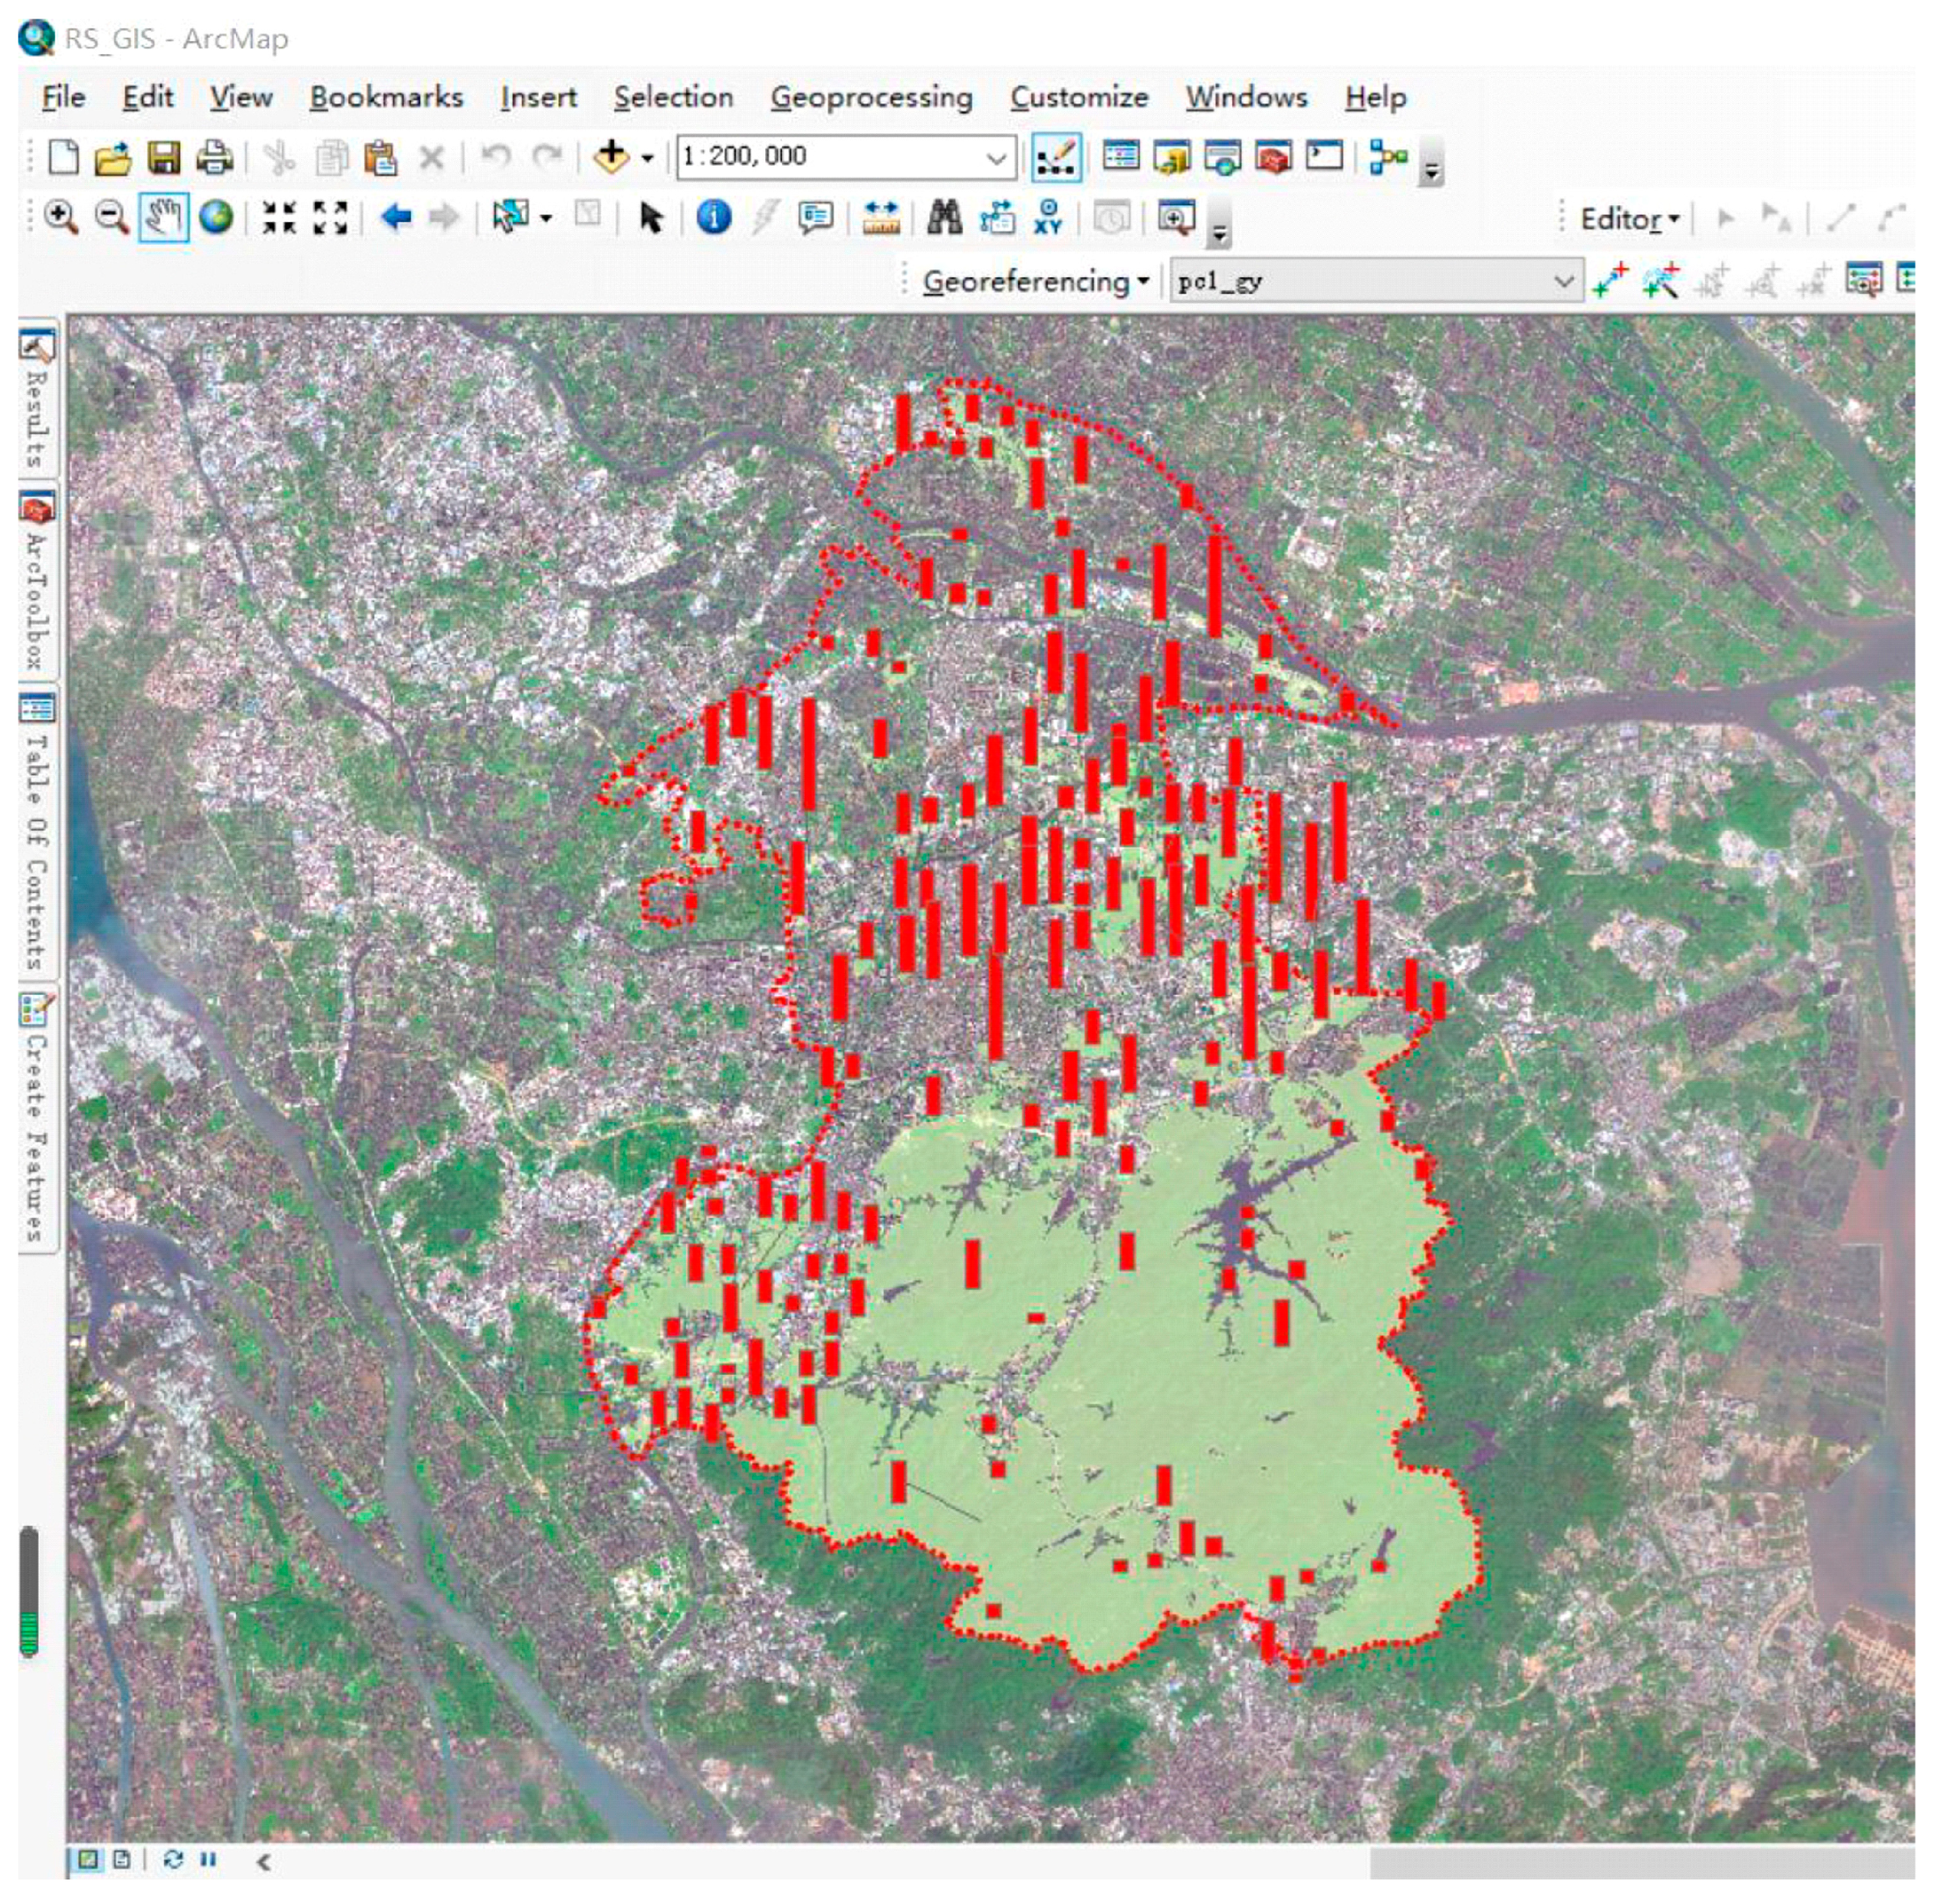
Obtain the public vitality index (PVI) based on the statistics of population distribution data. Select the Baidu heat map data that display population density in real time, and collect 28 heat maps in the study area over 2 working days and 2 rest days. Establish a linear correlation between the alpha channel value of the heat map and the actual crowd density, and then input the ArcGIS platform to invert and accumulate the population density. Finally, the PVI of each UGI patch is calculated by the zonal statistics method.
(4) Measure of LA: establish a two-dimensional indices matrix of EI and PVI of UGI patches, and then develop the entropy-weighted TOPSIS algorithm based on the MATLAB platform to conduct a comprehensive measure of two-dimensional indices.
(5) Spatial graphic expression: Form a table of LA and its indices’ values, indexed by UGI patches. Combine this with the graphical functions of ArcGIS to further express the spatial differentiation of UGI landscape activity and its eigenvalues.
(6) Classification and grading evaluation: Based on the LA measurements, the grading evaluation of UGI landscape activity is carried out using the “Natural Breaks” method integrated with ArcGIS. The mean values of the two subindices, EI and PVI, are selected as thresholds for the four-quadrant classification evaluation of UGI landscape activity.
According to the above research steps, the research framework is constructed as Figure 1.

2.2. Survey and Data Sources of Study Area
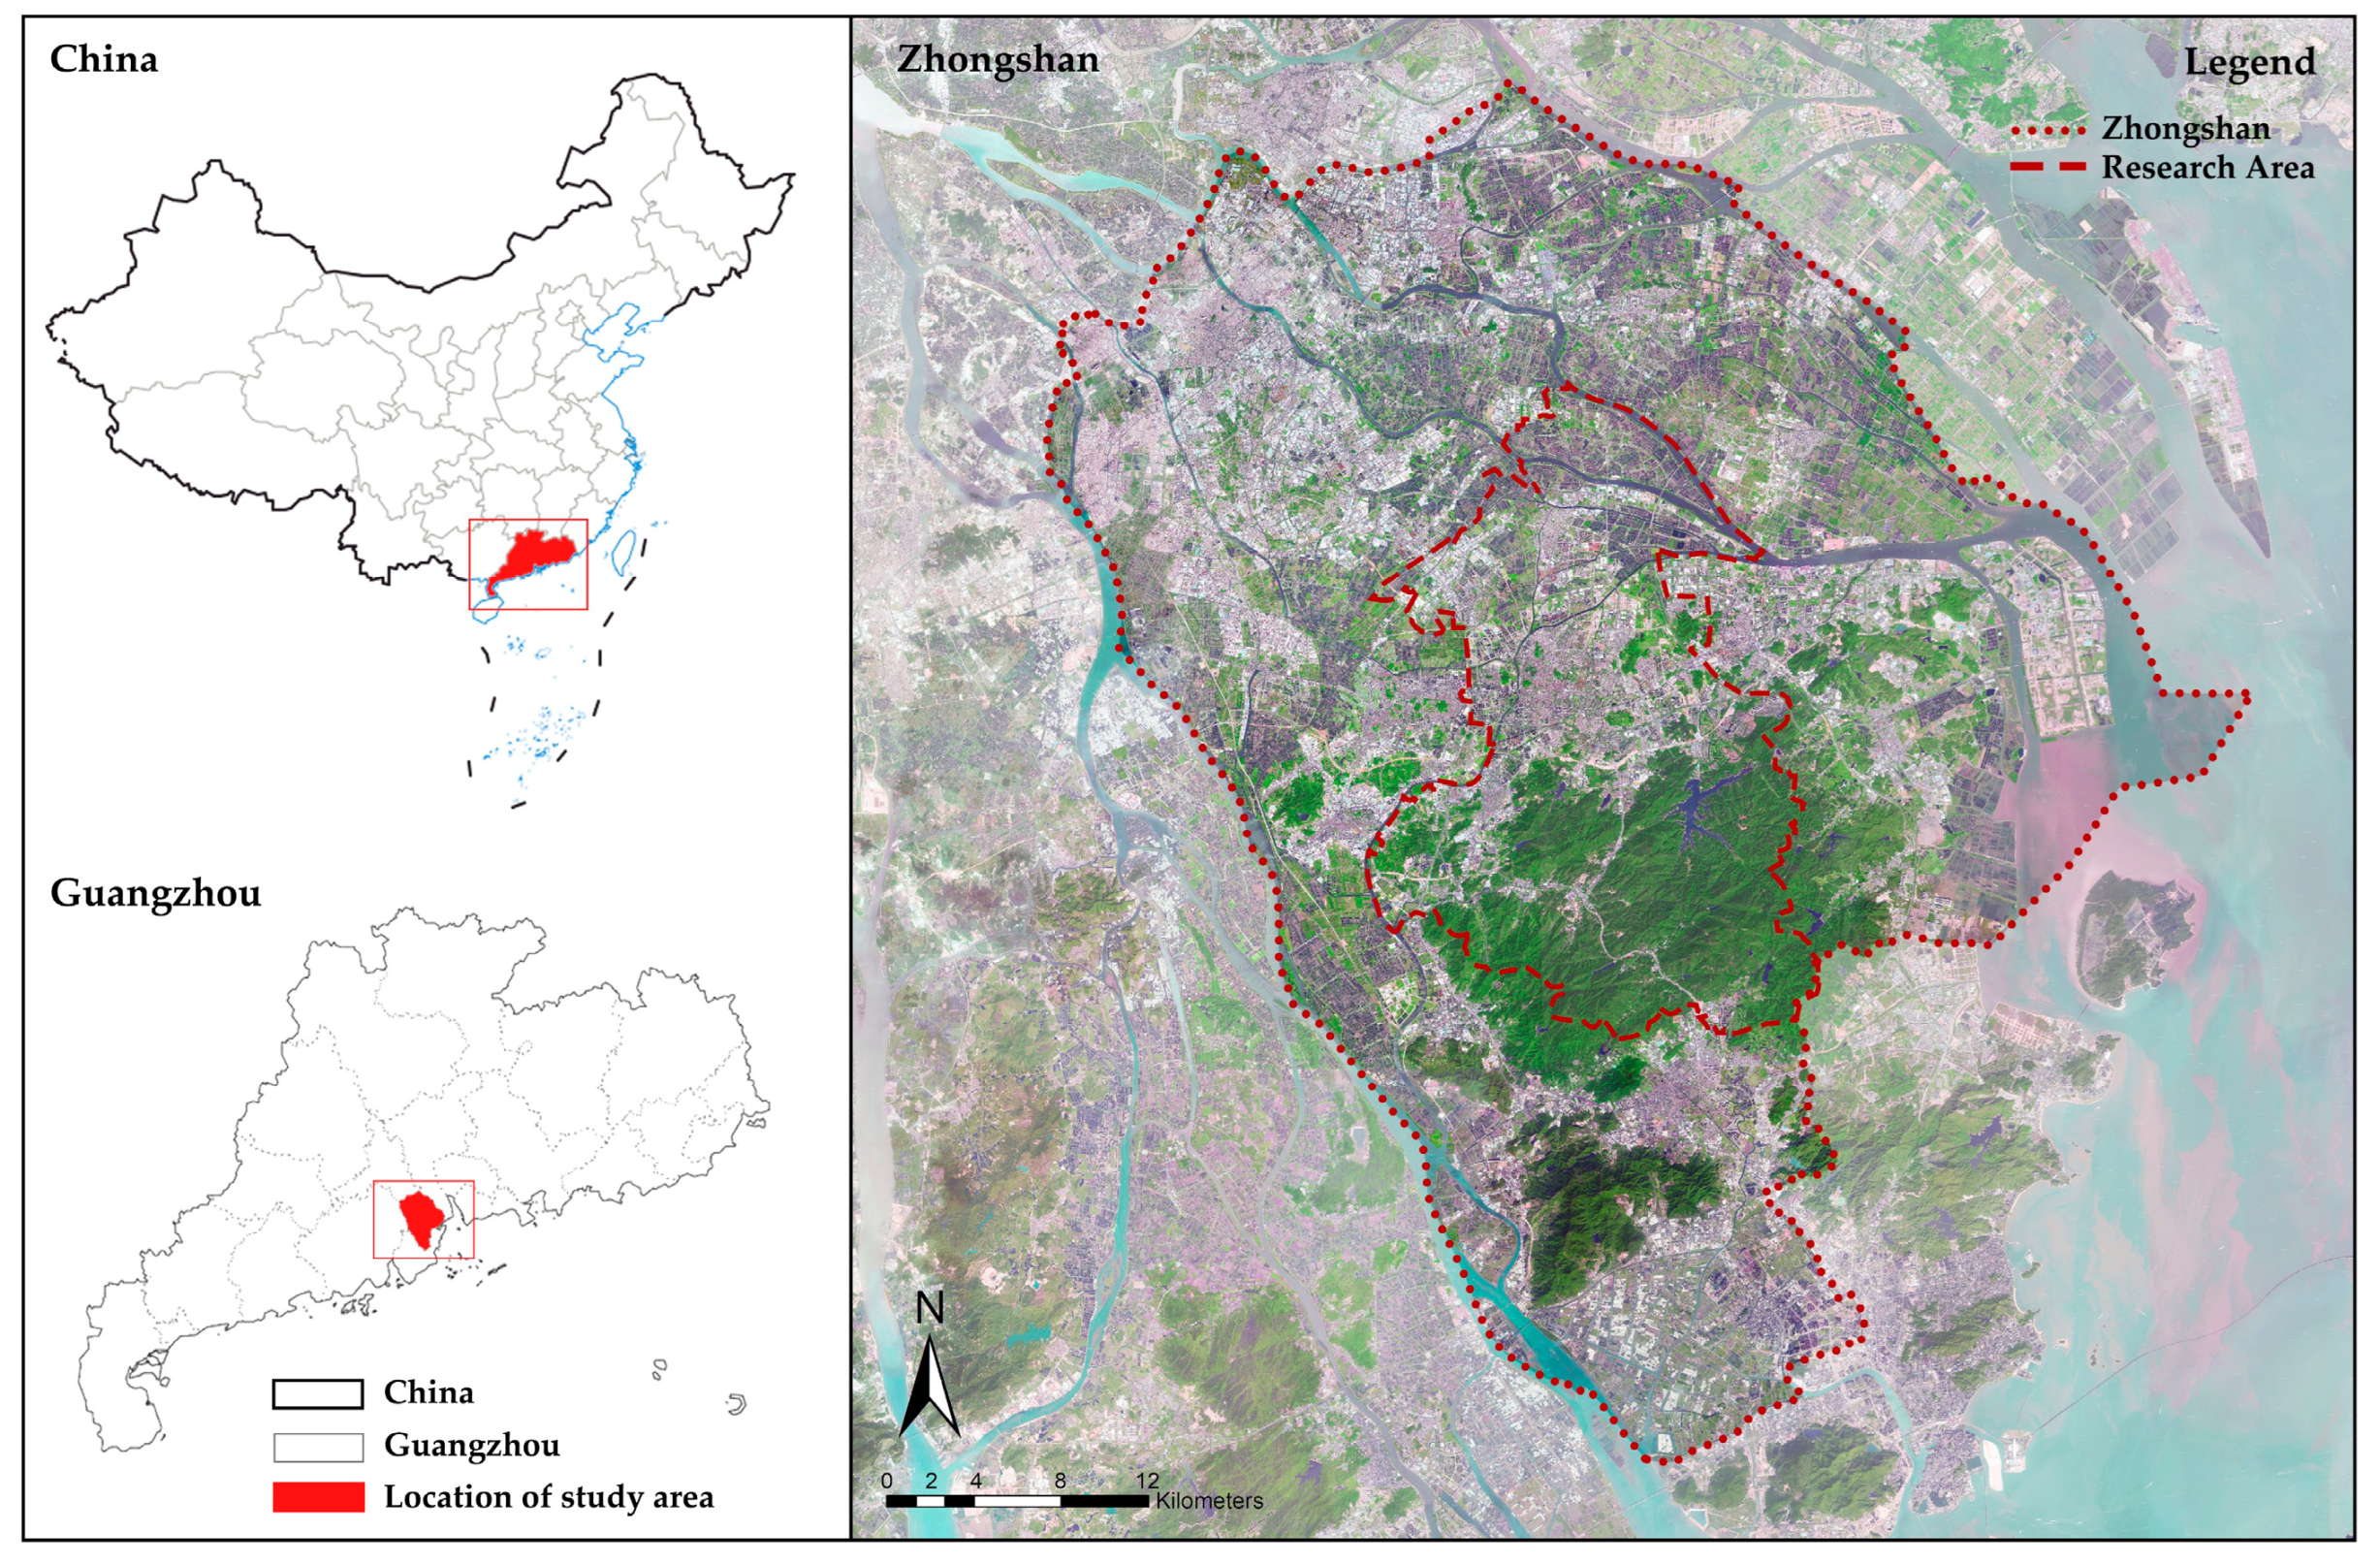
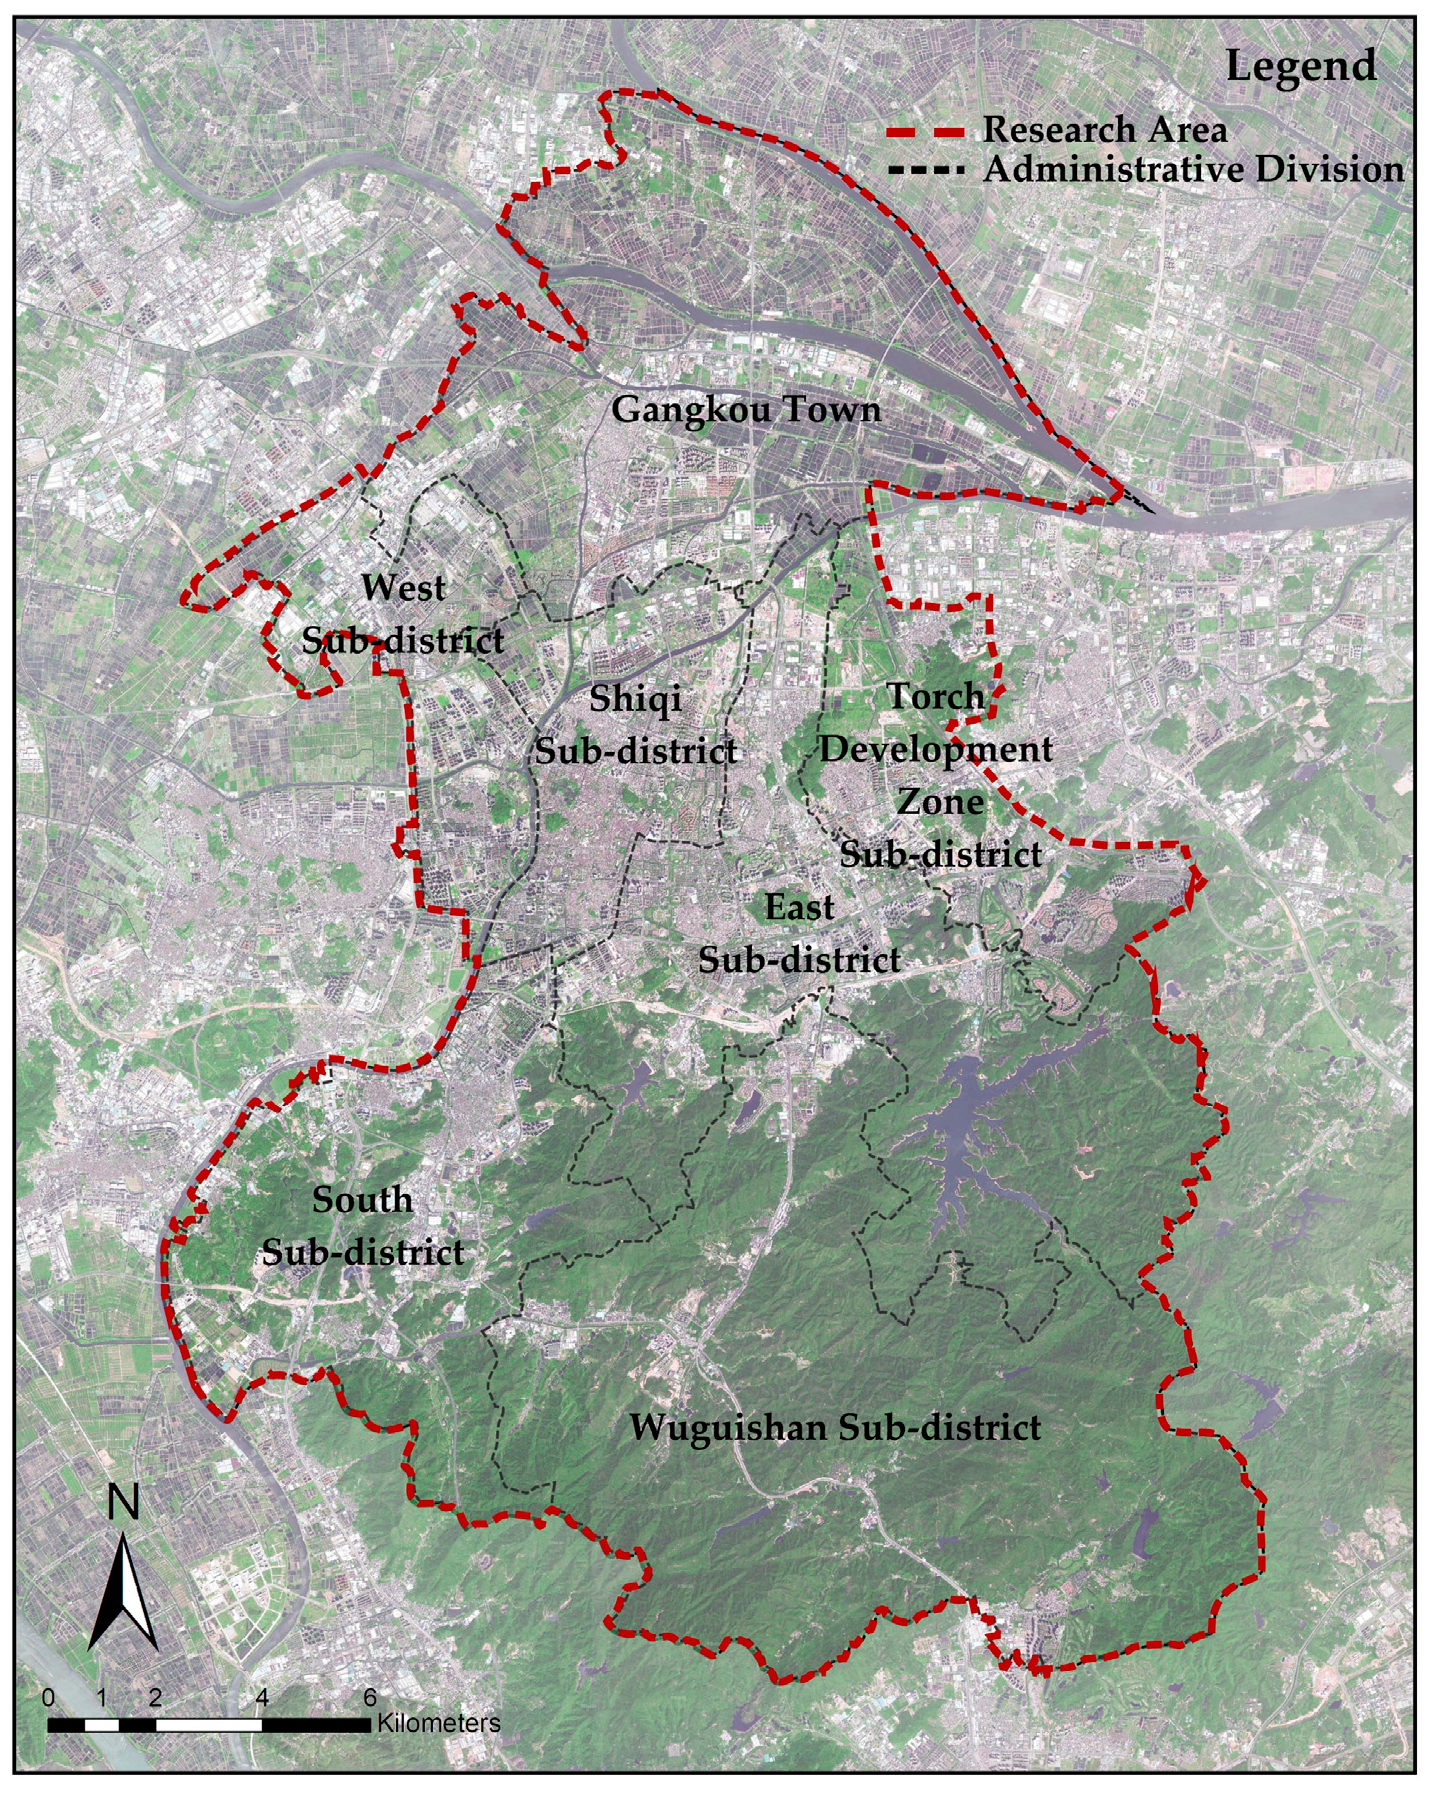
2.2.1. Study Area

Zhongshan is located in the central and southern part of the Pearl River Delta, where the lower reaches of Xijiang River and Beijiang River leave the sea. The terrain is high in the middle and flat all around, and the plain area slopes from northwest to southeast. Mountains such as Wugui and Zhusong stand out in the south-central part of the city. The main peak of Wugui Mountain is 531 m above sea level, which is the highest point of the city. The urban forest coverage rate of Zhongshan City reaches 35.5%, the urban green coverage rate reaches 43.1%, and the per capita park green space area in the urban area reaches 18.62 m2. The central urban area of Zhongshan covers five subdistricts (Shiqi, East, West, South, and Wuguishan), Gangkou Town, and Torch High-tech Development Zone (west of Guangzhou-Macao Expressway and part of Qijiang New Town), with an area of 368.61 km2 (Figure 2 and Figure 3). Its UGI includes not only ecological reserves, but also a series of urban green spaces and community parks, and thus, it presents the basic conditions for carrying out research on landscape activity (LA).

2.2.2. Data Sources and Preprocessing

The image data used in this research include two Landsat 8 OLI/TIRS remote sensing images of Zhongshan City (imaging date: 29 October 2019) with a spatial resolution of 30 m (from the United States Geological Survey: https://earthexplorer.usgs.gov/ (accessed on 27 June 2022).), and one scene GF-6 PMS remote sensing image (imaging date: 30 September 2019) with a spatial resolution of 2 m (from Natural Resources Satellite Remote Sensing Cloud Service Platform: http://www.sasclouds.com/chinese/normal/ (accessed on 27 June 2022).). The vector data include the administrative division data of Zhongshan City (from National Catalogue Service For Geographic Information: http://www.webmap.cn/ (accessed on 25 June 2022).). The vitality data include 28 Baidu heat maps (from Baidu Huiyan: https://huiyan.baidu.com/ (accessed on 7 July to 10 July 2022).) from 7 July to 10 July 2022, with a map level of 17 and a spatial resolution of 2 m. The heat map data were captured using Python to create the Baidu map API interface, and the researchers selected two working days (7 and 8 July 2022) and two rest days (9 and 10 July 2022). The time period was from 9:00 to 21:00, with a time interval of 2 h. The data sources of the study area are shown in Table 1.
The data that needed preprocessing included remote sensing images and Baidu heat maps. In order to eliminate or correct the distortion caused by the sun height, atmospheric quality, and sensor sensitivity in the image data, the remote sensing images were subjected to radiometric calibration, atmospheric correction, image fusion, and clipping based on the ENVI 5.2 platform. First, the digital number (DN) of the pixel was converted into the radiance by radiometric calibration. Second, the FLAASH atmospheric correction tool was used to perform atmospheric correction. Then, through image fusion, remote sensing images not only retained multispectral features but also had high spatial resolution. Finally, the remote sensing images were clipped with the vector data of the study area. The raw data of Baidu heat maps were clipped, georeferenced, and projected through the ArcGIS platform. All the data in this study were georeferenced based on the WGS-84 coordinate system.

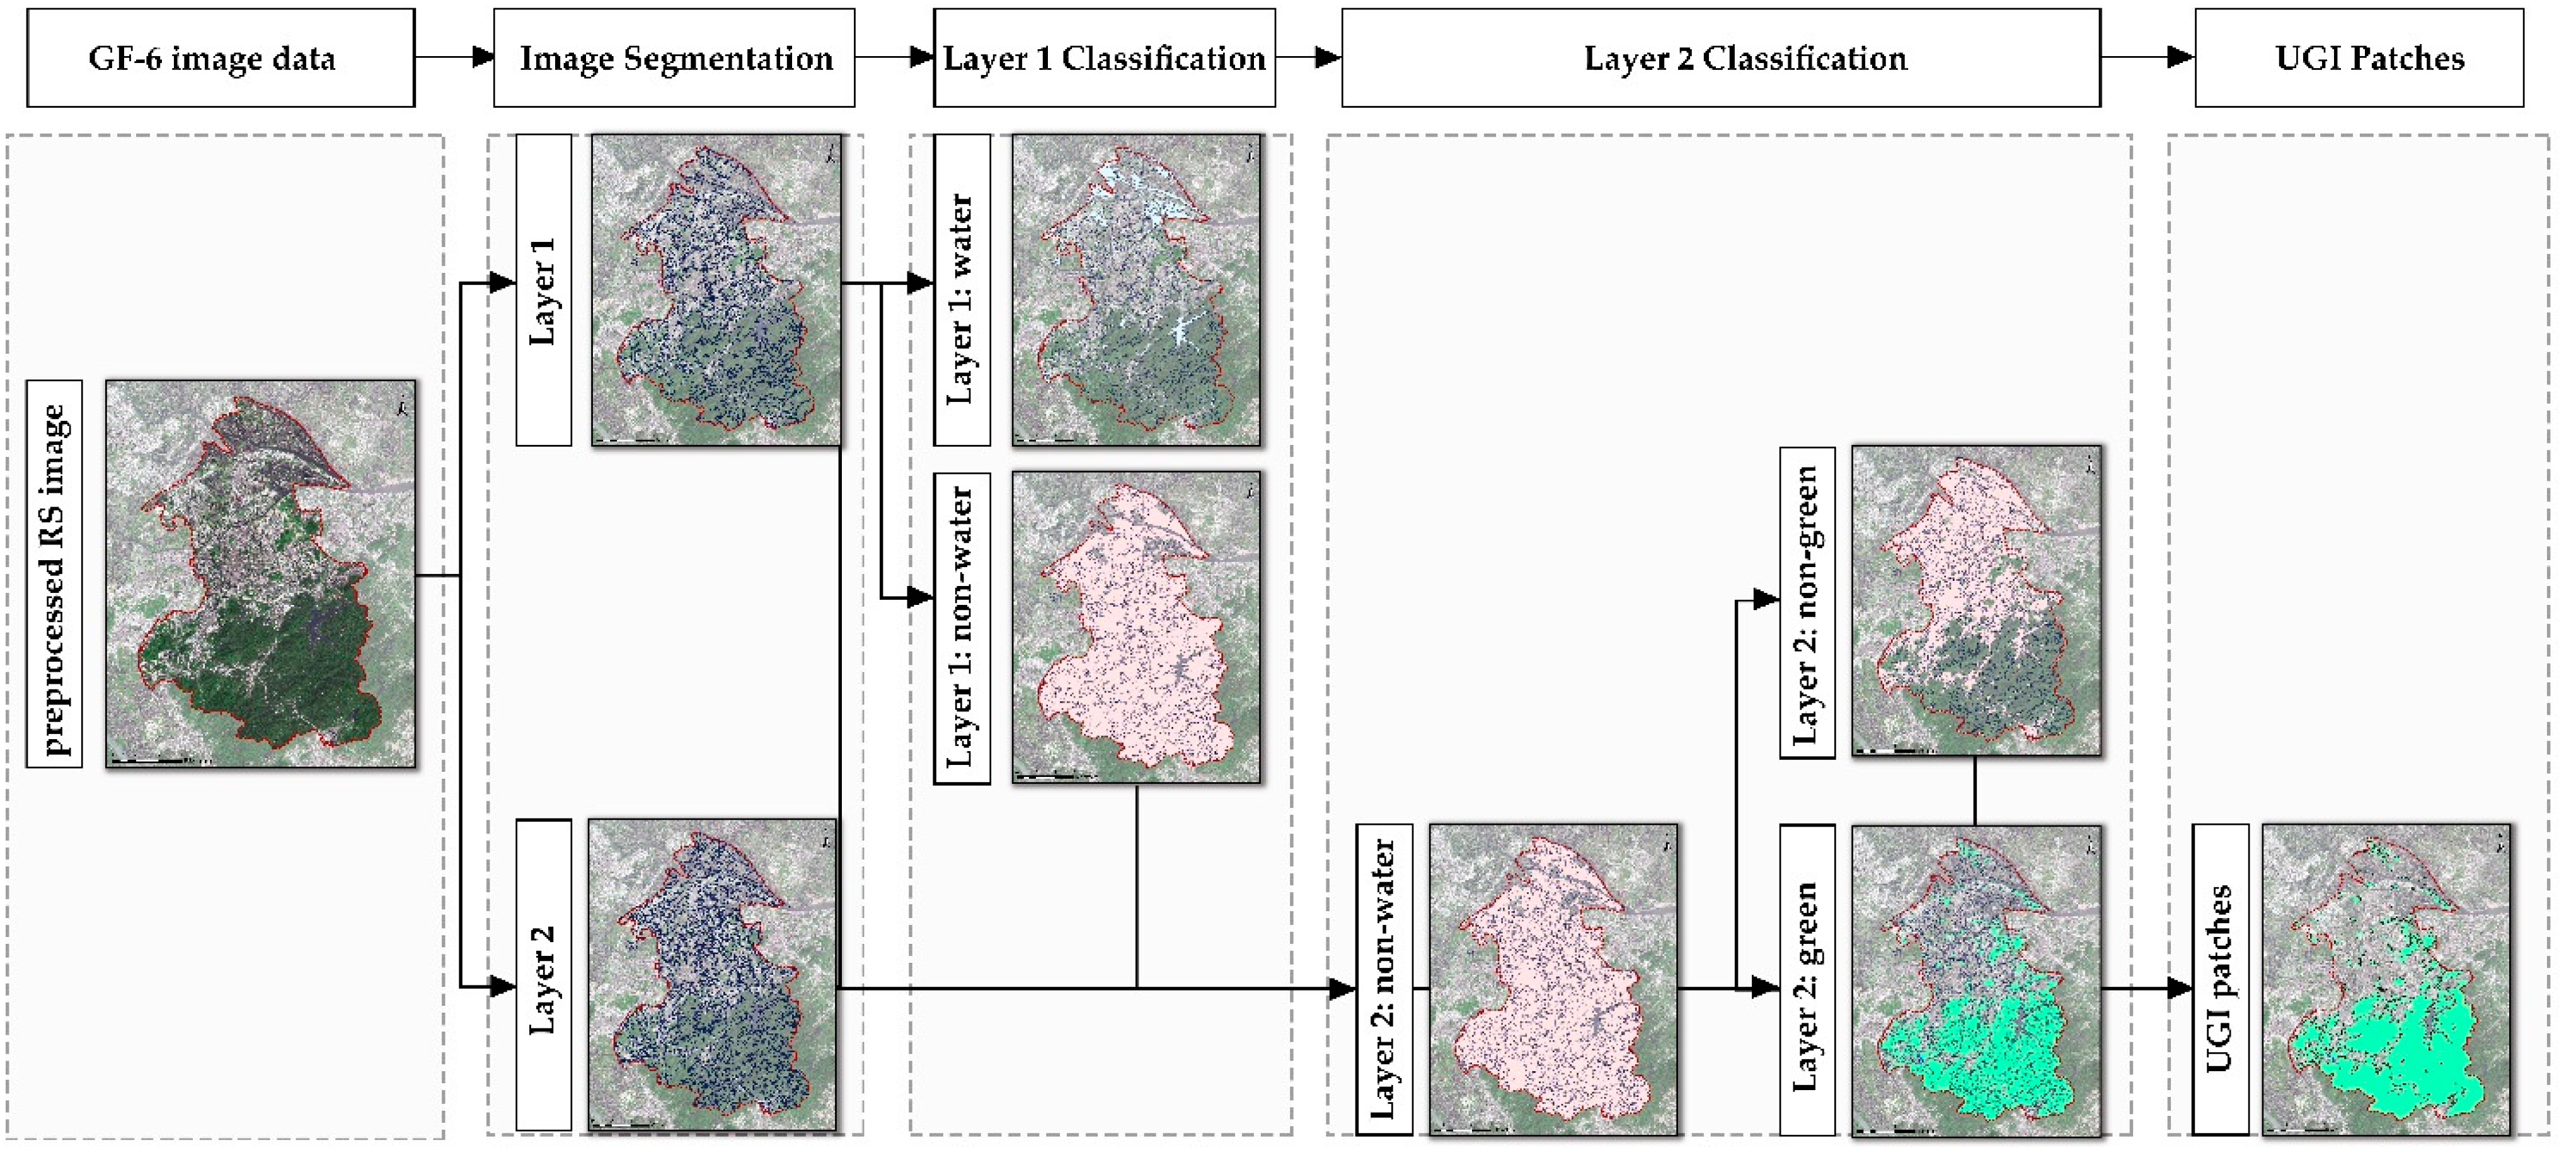
2.3. UGI Interpretation Based on eCognition

The remote sensing image processing platform selected in this study was eCognition Developer 9.0, and the data were preprocessed GF-6 PMS images. As the first object-oriented intelligent image analysis and interpretation platform, eCognition adds an image segmentation step before the traditional classification process and uses the homogeneous object obtained by image segmentation as the smallest unit of classification [53]. In this study, UGI interpretation included two steps: segmentation and classification. The multiresolution segmentation technology in eCognition was used for image segmentation, and the indices included the scale index, shape index, and compactness index. The specific values of these indices were determined according to existing research and multiple experiments. In this study, two segmentation layers, “a” and “b”, were established for hierarchical classification, and the scale indices were 3000 and 2000, respectively. The other indices are shown in Table 2.
There is a relatively high degree of overlap between water and nonwater in the study area. Layer a was mainly used to distinguish water and nonwater, so as to reduce the interference of water and paddy fields with UGI identification. The normalized difference water index (NDWI) was selected as the characteristic index during classification. It was found through observation: when NDWI is within the range of [−0.08, −0.07], it is difficult for visual interpretation to distinguish water and nonwater; accordingly, the fuzzy classification method based on membership function was adopted, so that when the NDWI approaches −0.07, the probability of its membership in the water body approaches 1. Finally, all objects were divided into “water” and “nonwater” in layer a.
Layer b was mainly used to identify urban green infrastructure (UGI). First, the classification results of “nonwater” in layer a were inherited at layer b. Then, taking NDVI as the characteristic index, and determining 0.46 as the threshold based on sample selection and eigenvalue observation, “nonwater” was subdivided into “green space” and “non-green space”. Afterwards, based on the “rel. border to class” feature in eCognition, image objects with eigenvalues greater than 0.8 were divided from nongreen spaces. Such image objects are completely or partly surrounded by green space. Generally speaking, they are gray space that host public activities in UGI. Finally, after reclassification, the “green space” and the filtered gray space were merged, obtaining the UGI patches of the study area (Figure 4).
The accuracy evaluation of classification took the field manual survey data as a reference, and an error matrix was established based on UGI sample database and remote sensing analysis results for statistical calculation. In this study, 150 sample objects were finally established. Through manual translation, the sample objects were used as statistical objects, and the accuracy evaluation results were expressed, with the error matrix based on samples and the overall accuracy (OA). This study adopted the error matrix provided by eCognition, and the final overall accuracy was 90.8%.

2.4. Analysis of UGI Ecological Index and Public Vitality Index

2.4.1. Ecological Index (EI) Calculation

In this research, an improved EI based on remote sensing technology was adopted to quantify the greening quality, including four subindices: normalized difference vegetation index (NDVI), the wetness component of tasseled cap transformation (WET), land surface temperature (LST), and the normalized difference bare soil index (NDBSI). Among them, NDVI stands for greenness, which is similar to the vegetation coverage index in the original EI, and is highly correlated with the biological abundance index; WET is an expansion of the original EI‘s water network index, which can not only represent open water bodies, but also the moisture of soil and vegetation; NDBSI indicates dryness, which is closely related to the land degradation index in EI, and the higher the NDBSI, the more exposed the surface and the more serious the land degradation; and LST stands for heat, which is an expansion beyond the original indices of EI [45]. As an important indicator of urban thermal environment, the improved EI is suitable for greening quality research. The improved EI used in this study was established entirely based on remote sensing technology, and its consistency with the original EI has been verified. The remote sensing expression of EI is as follows:
EI = f ( NDVI , WET , NDBSI , LST ) .
In the formula, NDVI represents the greenness index; WET is the wetness index; NDBSI is the dryness index, which is the average of soil index (SI) and index-based built-up index (IBI); and LST stands for the heat index. The calculation formulas of the EI components are shown in Table 3.
In this study, ENVI 5.2 was selected as the EI computing platform, and the data were Landsat 8 OLI/TIRS images that had been preprocessed. Due to the water system developed in the study area, NDWI was used to mask the water information, so the WET index value could truly reflect the wetness of the land surface [54]. The formal experiment consisted of four steps. First, after being calculated separately, the four indices (NDVI, WET, NDBSI, and LST) were normalized. Then, a principal component analysis was carried out on the normalized four indices. It can be seen from Table 4 that the accumulative eigenvalue of the first principal component (PC1) is 73.3%, indicating that PC1 contains most of the information in the four indices. The synthetic PC1 can be used to replace the original greenness, wetness, heat, and dryness indices. Afterwards, PC1 was normalized to obtain the EI of the study area. The value of EI ranges from 0 to 1; the closer it is to 1, the better the greening quality of the area. Finally, the mean algorithm was used to calculate the EI of each UGI based on the ArcGIS zonal statistics method (Figure 5).

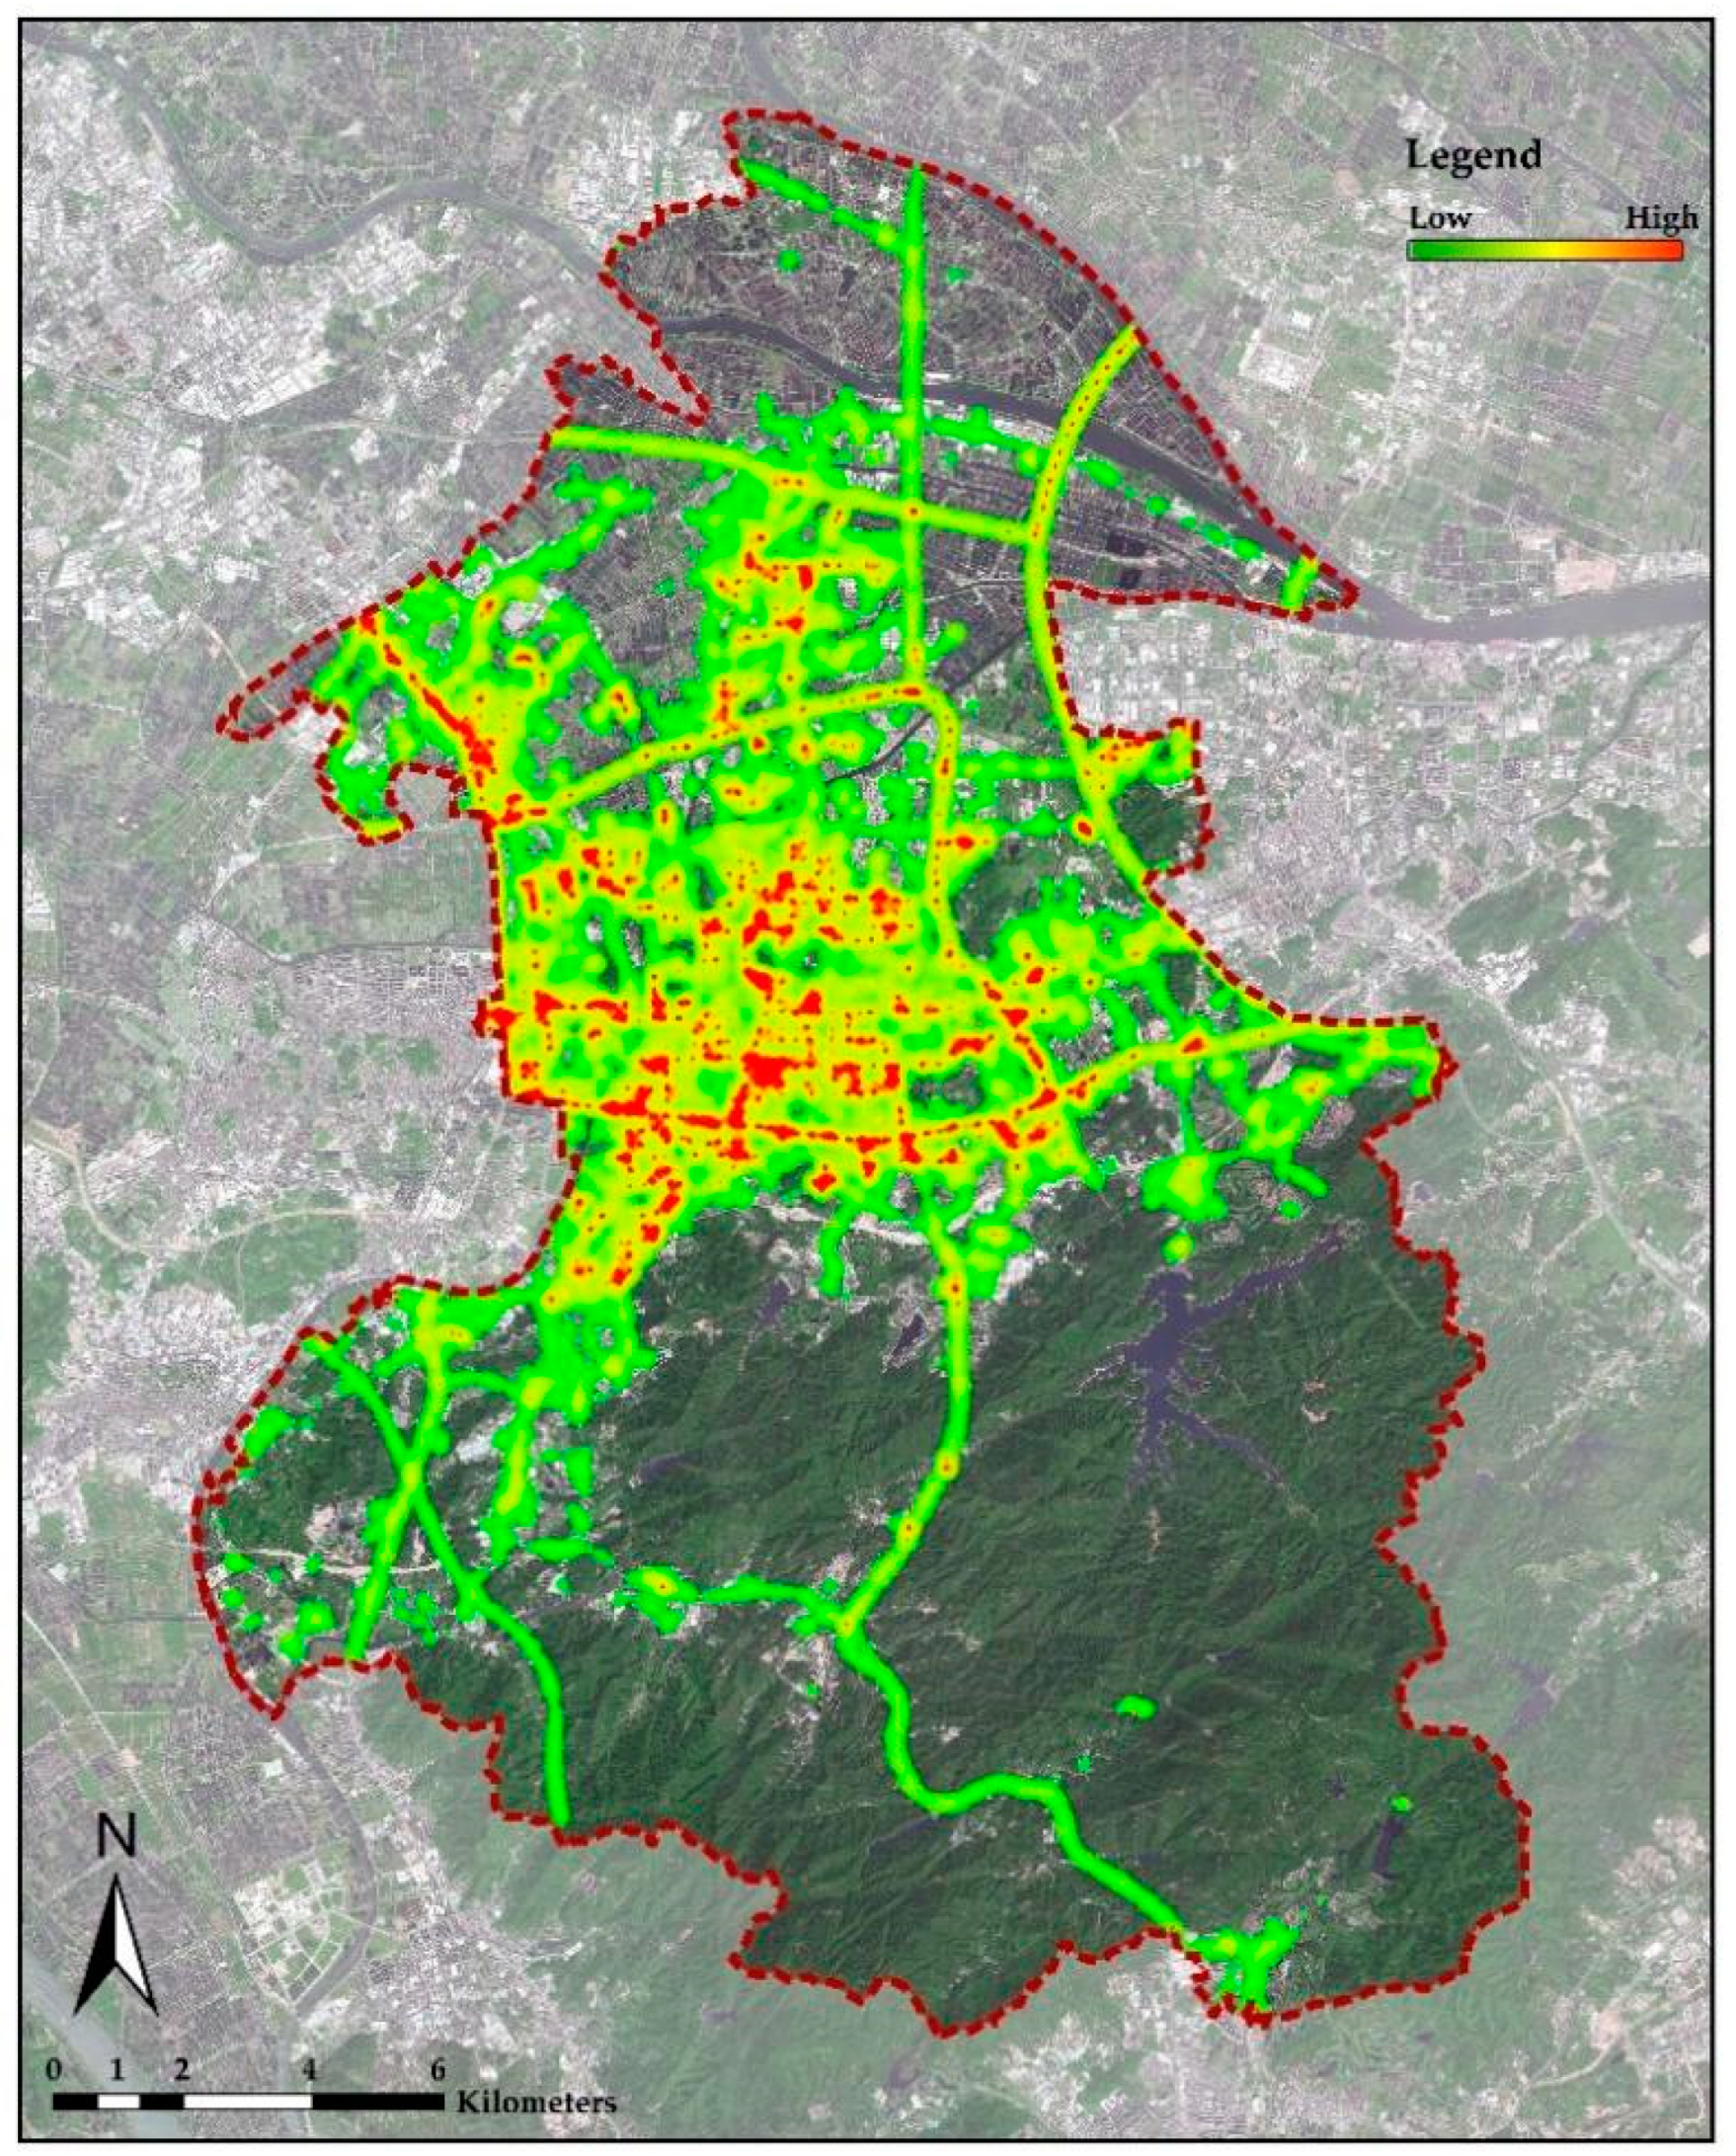
2.4.2. Public Vitality Index (PVI) Calculation

Baidu Heat Map is a big data visualization product based on location service technology, which can dynamically reflect the characteristics of urban population aggregation in real time. In terms of the working principle, Baidu Heat Map counts the number of population activities in different regions based on the location information of hundreds of millions of users accessing Baidu products. The relevant data are presented as visualized heat maps after being processed by density analysis. Depending on the map zoom level (ZL), the spatial resolution of Baidu heat maps is about 2(18-ZL) m, and the level of 14–18 zoom corresponds to 1.0–16 m.
In this study, ArcGIS 10.7 was selected as the platform for accumulating population density, and the data were 28 pieces of 17-level Baidu heat maps that had been preprocessed. According to Baidu’s official legend, the seven colors (red, orange, yellow, etc.) in the heat maps correspond to different population densities. It has been found in relevant research that the alpha channel value of a Baidu heat map ranges from 60 to 194, which has a continuous corresponding relationship with the seven colors, as shown in Table 5.
According to research on the linear correlation between the alpha channel value of the heat map and the population density [55], a reclassification function of the population density was established in this study, and the expression is as follows:
P i = { 10 0 151 60 × ( S A i 60 ) , 60 S A i 151   ( Blue ,   Light   blue ,   Cyan ) 2 0 - 1 0 163 151 × ( S A i 151 ) + 10 , 151 < S A i 163   ( Green ) 40 - 2 0 170 163 × ( S A i 163 ) + 20 , 163 < S A i 170   ( Yellow ) 60 - 40 179 170 × ( S A i 170 ) + 40 , 170 < S A i 179   ( Orange )   60 , 179 < S A i 194   ( Red ) .
In this expression, Pi is the population density (person/hm2) of the “ith” raster, and SAi is the alpha channel value of the “ith” raster. According to the classification function above, this research first reclassified the data of the Baidu heat maps based on the ArcGIS platform, and the pixel value of the raster pixel after reclassification was the corresponding population density value. Then, the “raster calculator” function of ArcGIS was used to accumulate the population density of 28 Baidu heatmaps to obtain the overall accumulated population density in the study area. Finally, based on the zonal statistical algorithm of ArcGIS, the average value of the accumulated population density was used as the PVI of each UGI. It should be noted that the calculation process of zonal statistical method involves the actual area of the study area. In order to avoid the interference of the results in areas where tourists cannot set foot in UGI (mountains, nature reserves, etc.), it is necessary to set the pixels whose accumulated population density is 0 as “No Data” in advance (Figure 6).

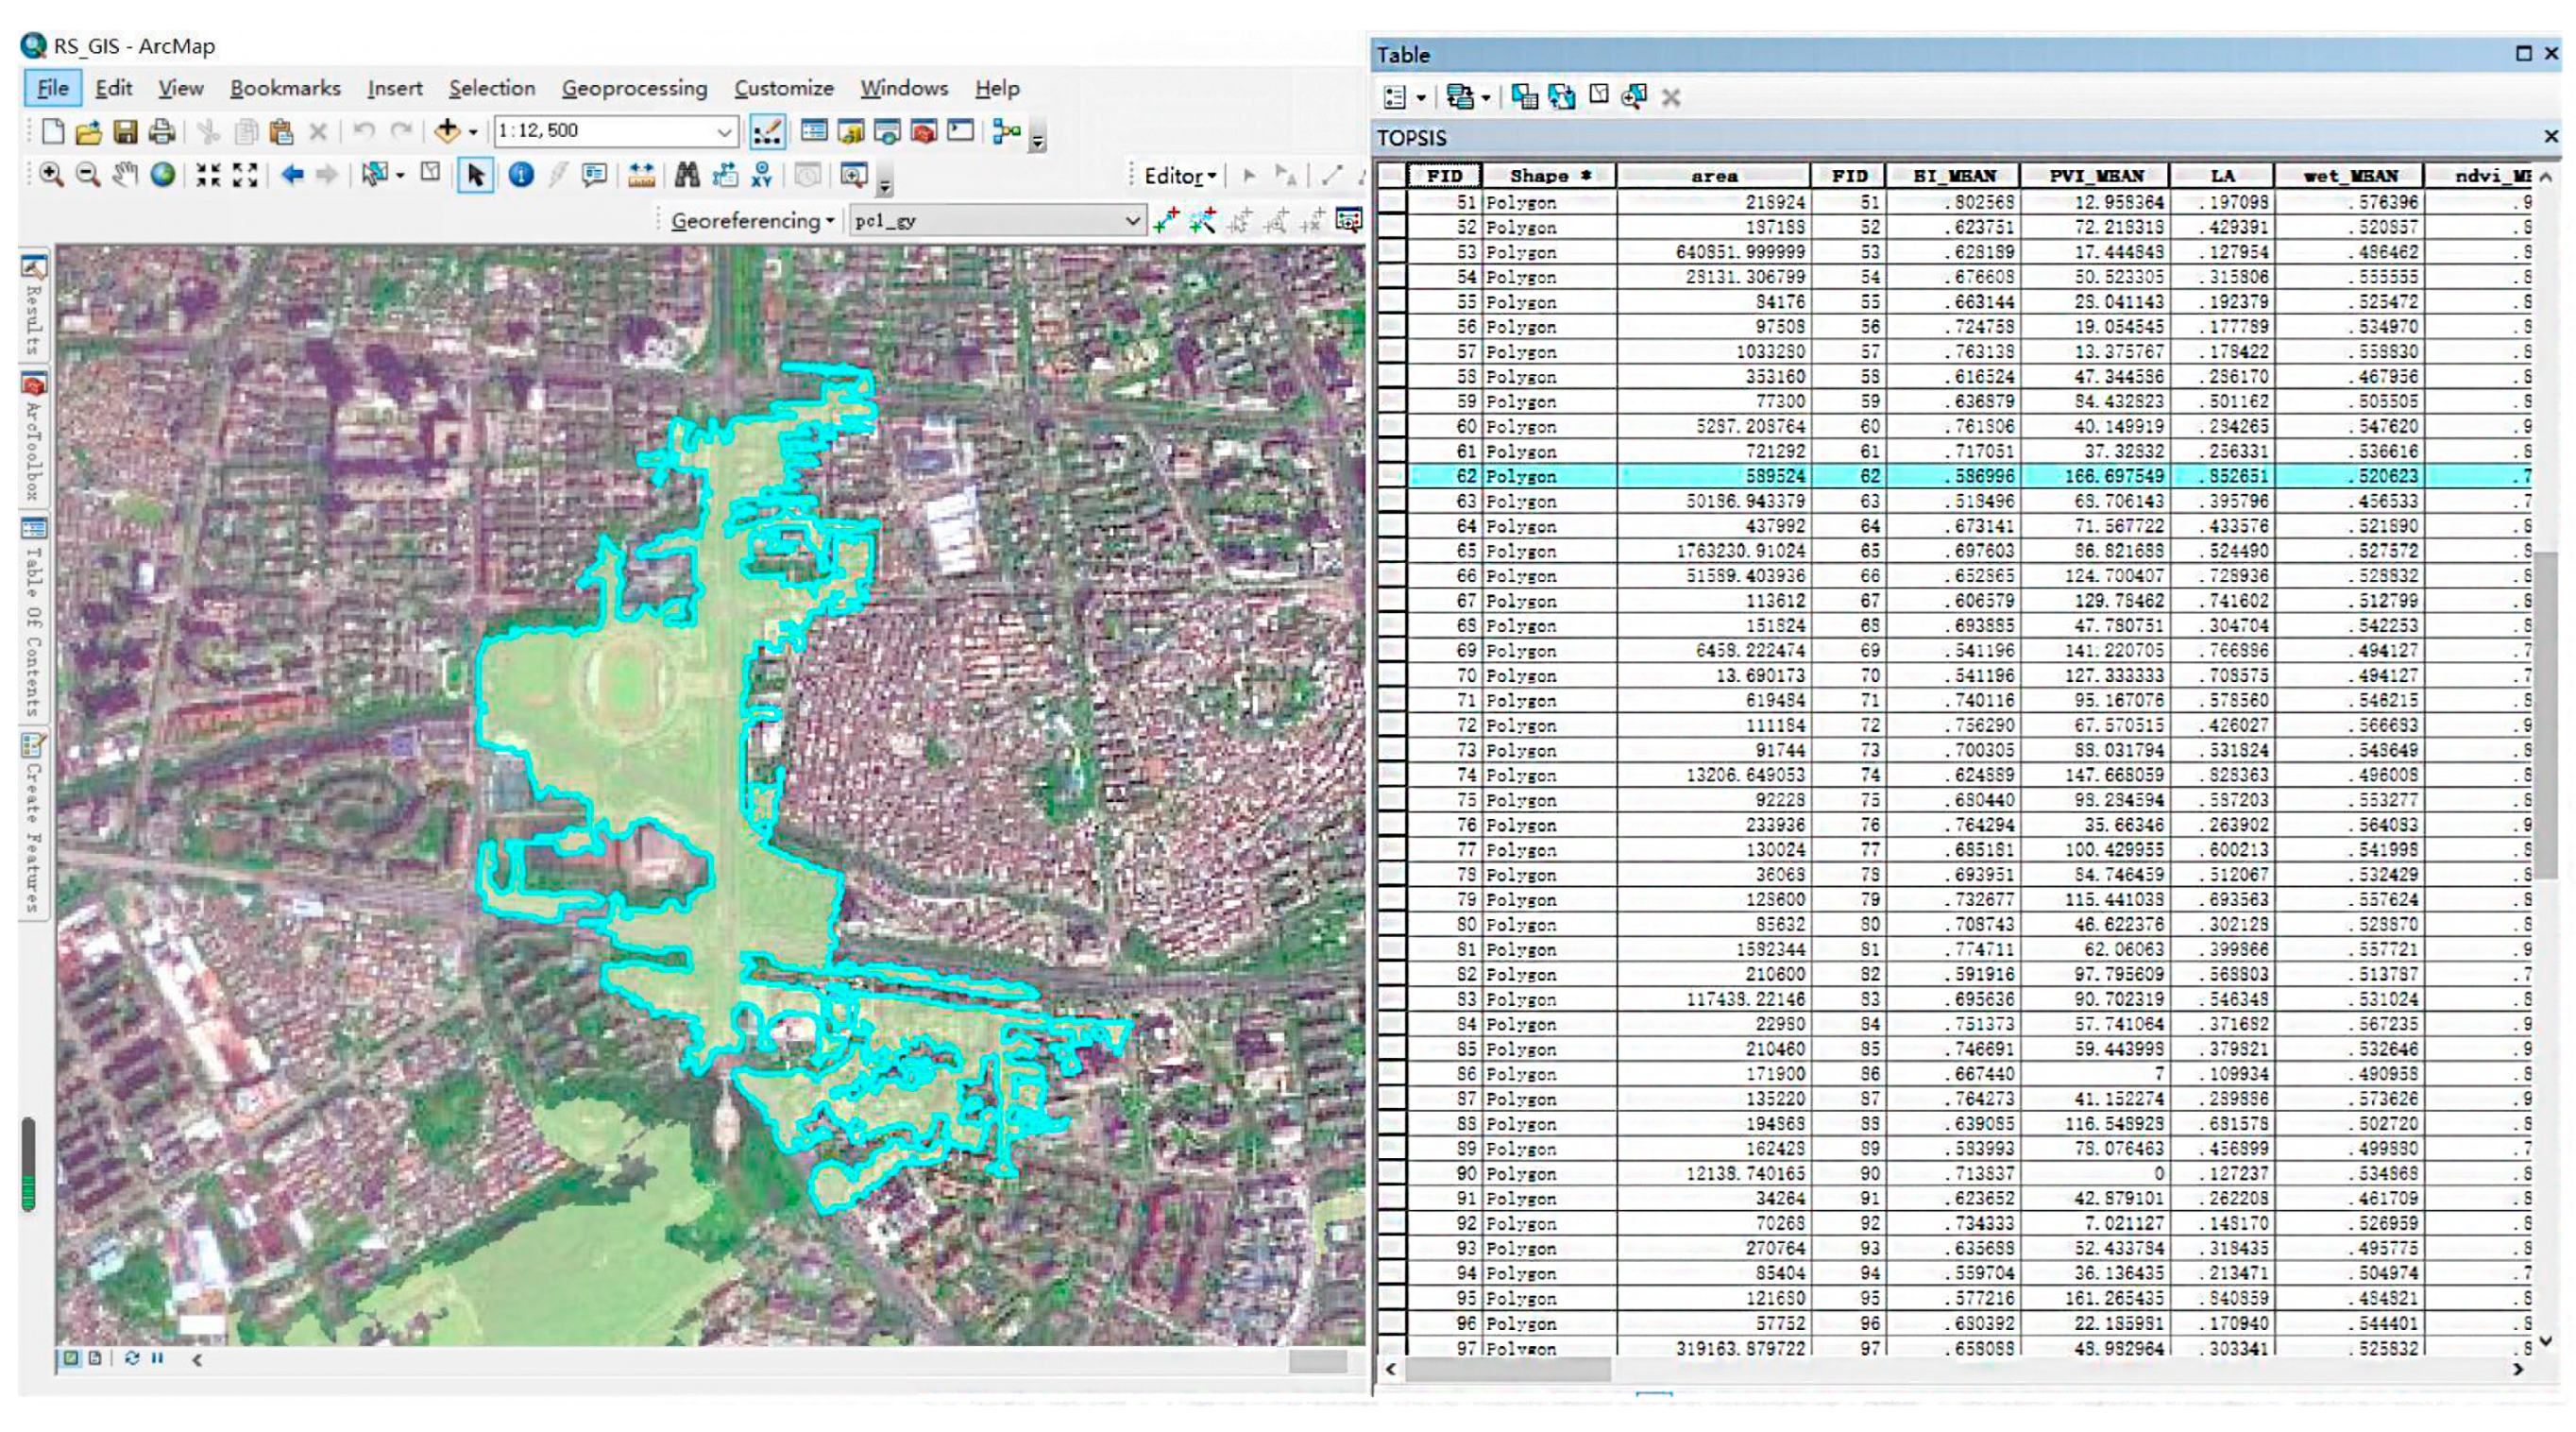
2.5. UGI Landscape Activity Measure Based on Entropy-Weighted TOPSIS Model

The entropy-weighted TOPSIS model is a comprehensive evaluation model that combines the entropy method and the TOPSIS method. Entropy is a method to determine the weight of each evaluation index according to the degree of dispersion, which can objectively describe the importance of each index in the index system. TOPSIS is the “technique for order preference by similarity to ideal solution”. Its action principle is to rank the evaluation objects according to their proximity to the ideal target, and it is mainly used to solve multi-objective decision-making problems with limited solutions. The entropy-weighted TOPSIS model first determines the weight of the evaluation index through the entropy, and then uses TOPSIS to approximate the ideal solution to determine the ranking of the evaluation objects. After establishing an entropy-weighted TOPSIS model on the MATLAB platform, this study measured the landscape activity (LA) of the two-dimensional index matrix of ecological index (EI) and public vitality index (PVI). The main steps were as follows:
(1) Construct a judgment matrix based on 160 UGI units and 2 indices (EI and PVI):
X = ( x i j ) m × n   ( i = 1 , 2 , , m ;   j = 1 , 2 , , n )   .
In the formula, m is the number of evaluated objects, 160; n is the number of indices,
(2) Standardize the judgment matrix:
x i j = x i j min ( x i j ) max ( x i j ) min ( x i j ) .
(3) Calculate the information entropy of EI and PVI separately:
H j = k i = 1 m p i j   l n ( p i j ) .
In the formula, p i j = x i j i = 1 m x i j ; k = 1 ln   m . .
(4) Define the weight of the index j:
ω j = 1 H j i = 1 n ( 1 H j ) .
In the formula, ω j [ 0 , 1 ] , and j = 1 n ω i = 1 .
(5) Calculate the weighting matrix:
R = ( r i j ) m × n   , r i j = ω j x i j ( i = 1 , 2 , , m ; j = 1 , 2 , , n )
(6) Determine the optimal solution Sj+ and the worst solution Sj:
S j + = max ( r 1 j , r 2 j , , r m j ) ,   S j = min ( r 1 j , r 2 j , , r m j ) .
(7) Calculate the Euclidean distance between each scheme and the optimal and worst solutions:
s e p i + = j = 1 n ( s j + r i j ) 2 ,   s e p i = j = 1 n ( s j r i j ) 2 .
(8) Calculate the comprehensive evaluation index:
C i = s e p i s e p i + s e p i + ,   C i [ 0 , 1 ] .
In the formula: the larger the Ci value, the better the evaluated object.

2.6. Grading and Classification of UGI Landscape Activity

Based on the calculation of EI, PVI, and LA, we conducted a grading evaluation of the measurements and a classification evaluation based on the indices’ values. The grading method adopted was “Natural Breaks”, proposed by George Frederick Jenks, which is a grading statistical method to find the natural turning point in the statistical sequence according to the law of numerical statistical distribution. The “Natural Breaks” method ensures the maximum similarity of data within groups and the maximum difference between groups by iterating the data, while taking into account that the range and number of elements between each group are as similar as possible. In this article, the number of grading targets for LA was set to three (high, medium, and low), and the key thresholds were obtained based on the “Natural Breaks” algorithm integrated on the ArcGIS platform.
The landscape activity classification method used in this article was the four-quadrant method proposed by management scientist Stephen R. Covey. This method sets two-dimensional descriptive features for specific decision-making goals and classifies the decision-making objects into four quadrants according to the eigenvalue. The classification results can reflect the support degree of a decision object for the decision goal in different dimensions, which is suitable for supporting decision making in landscape management. In this study, the analysis mechanism of UGI landscape activity is constructed from the two dimensions (namely, EI and PVI), which is in line with the application scenarios of the four-quadrant method. Selecting the EI and PVI mean of UGI in the study area as the coordinate axis origins, a four-quadrant conceptual model of UGI landscape activity was constructed, as shown in Figure 7.

3. Results

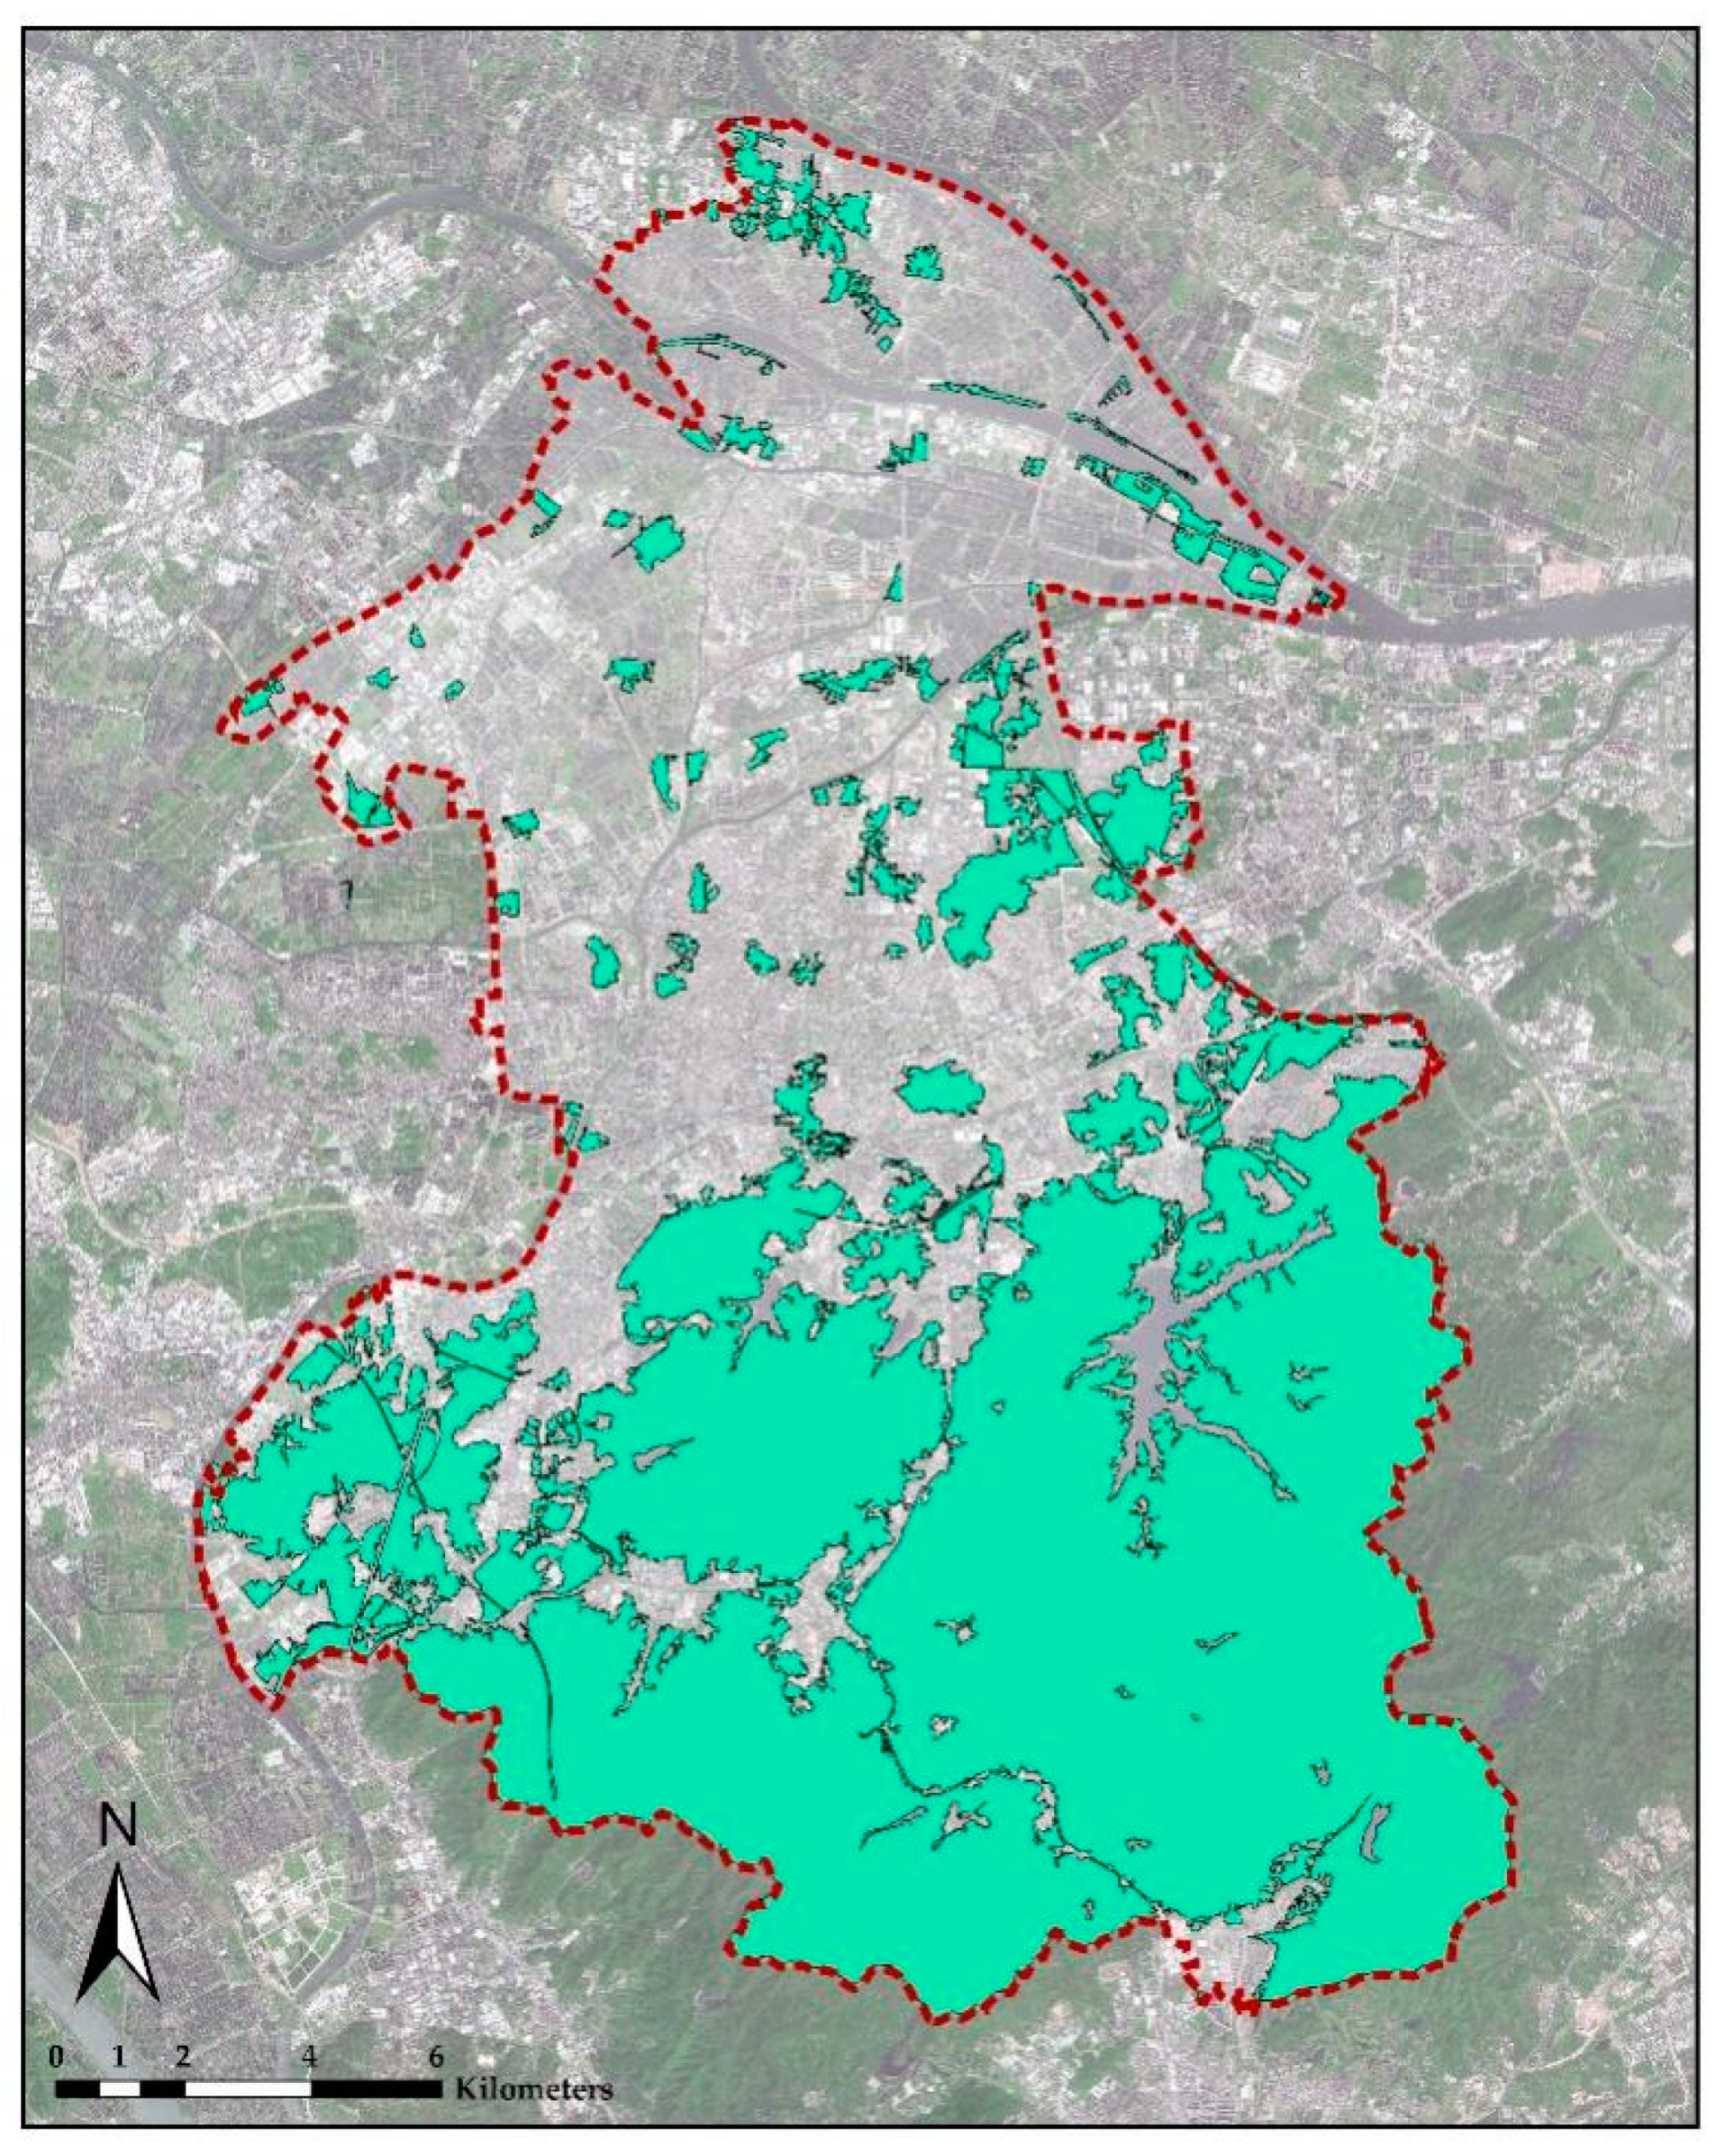
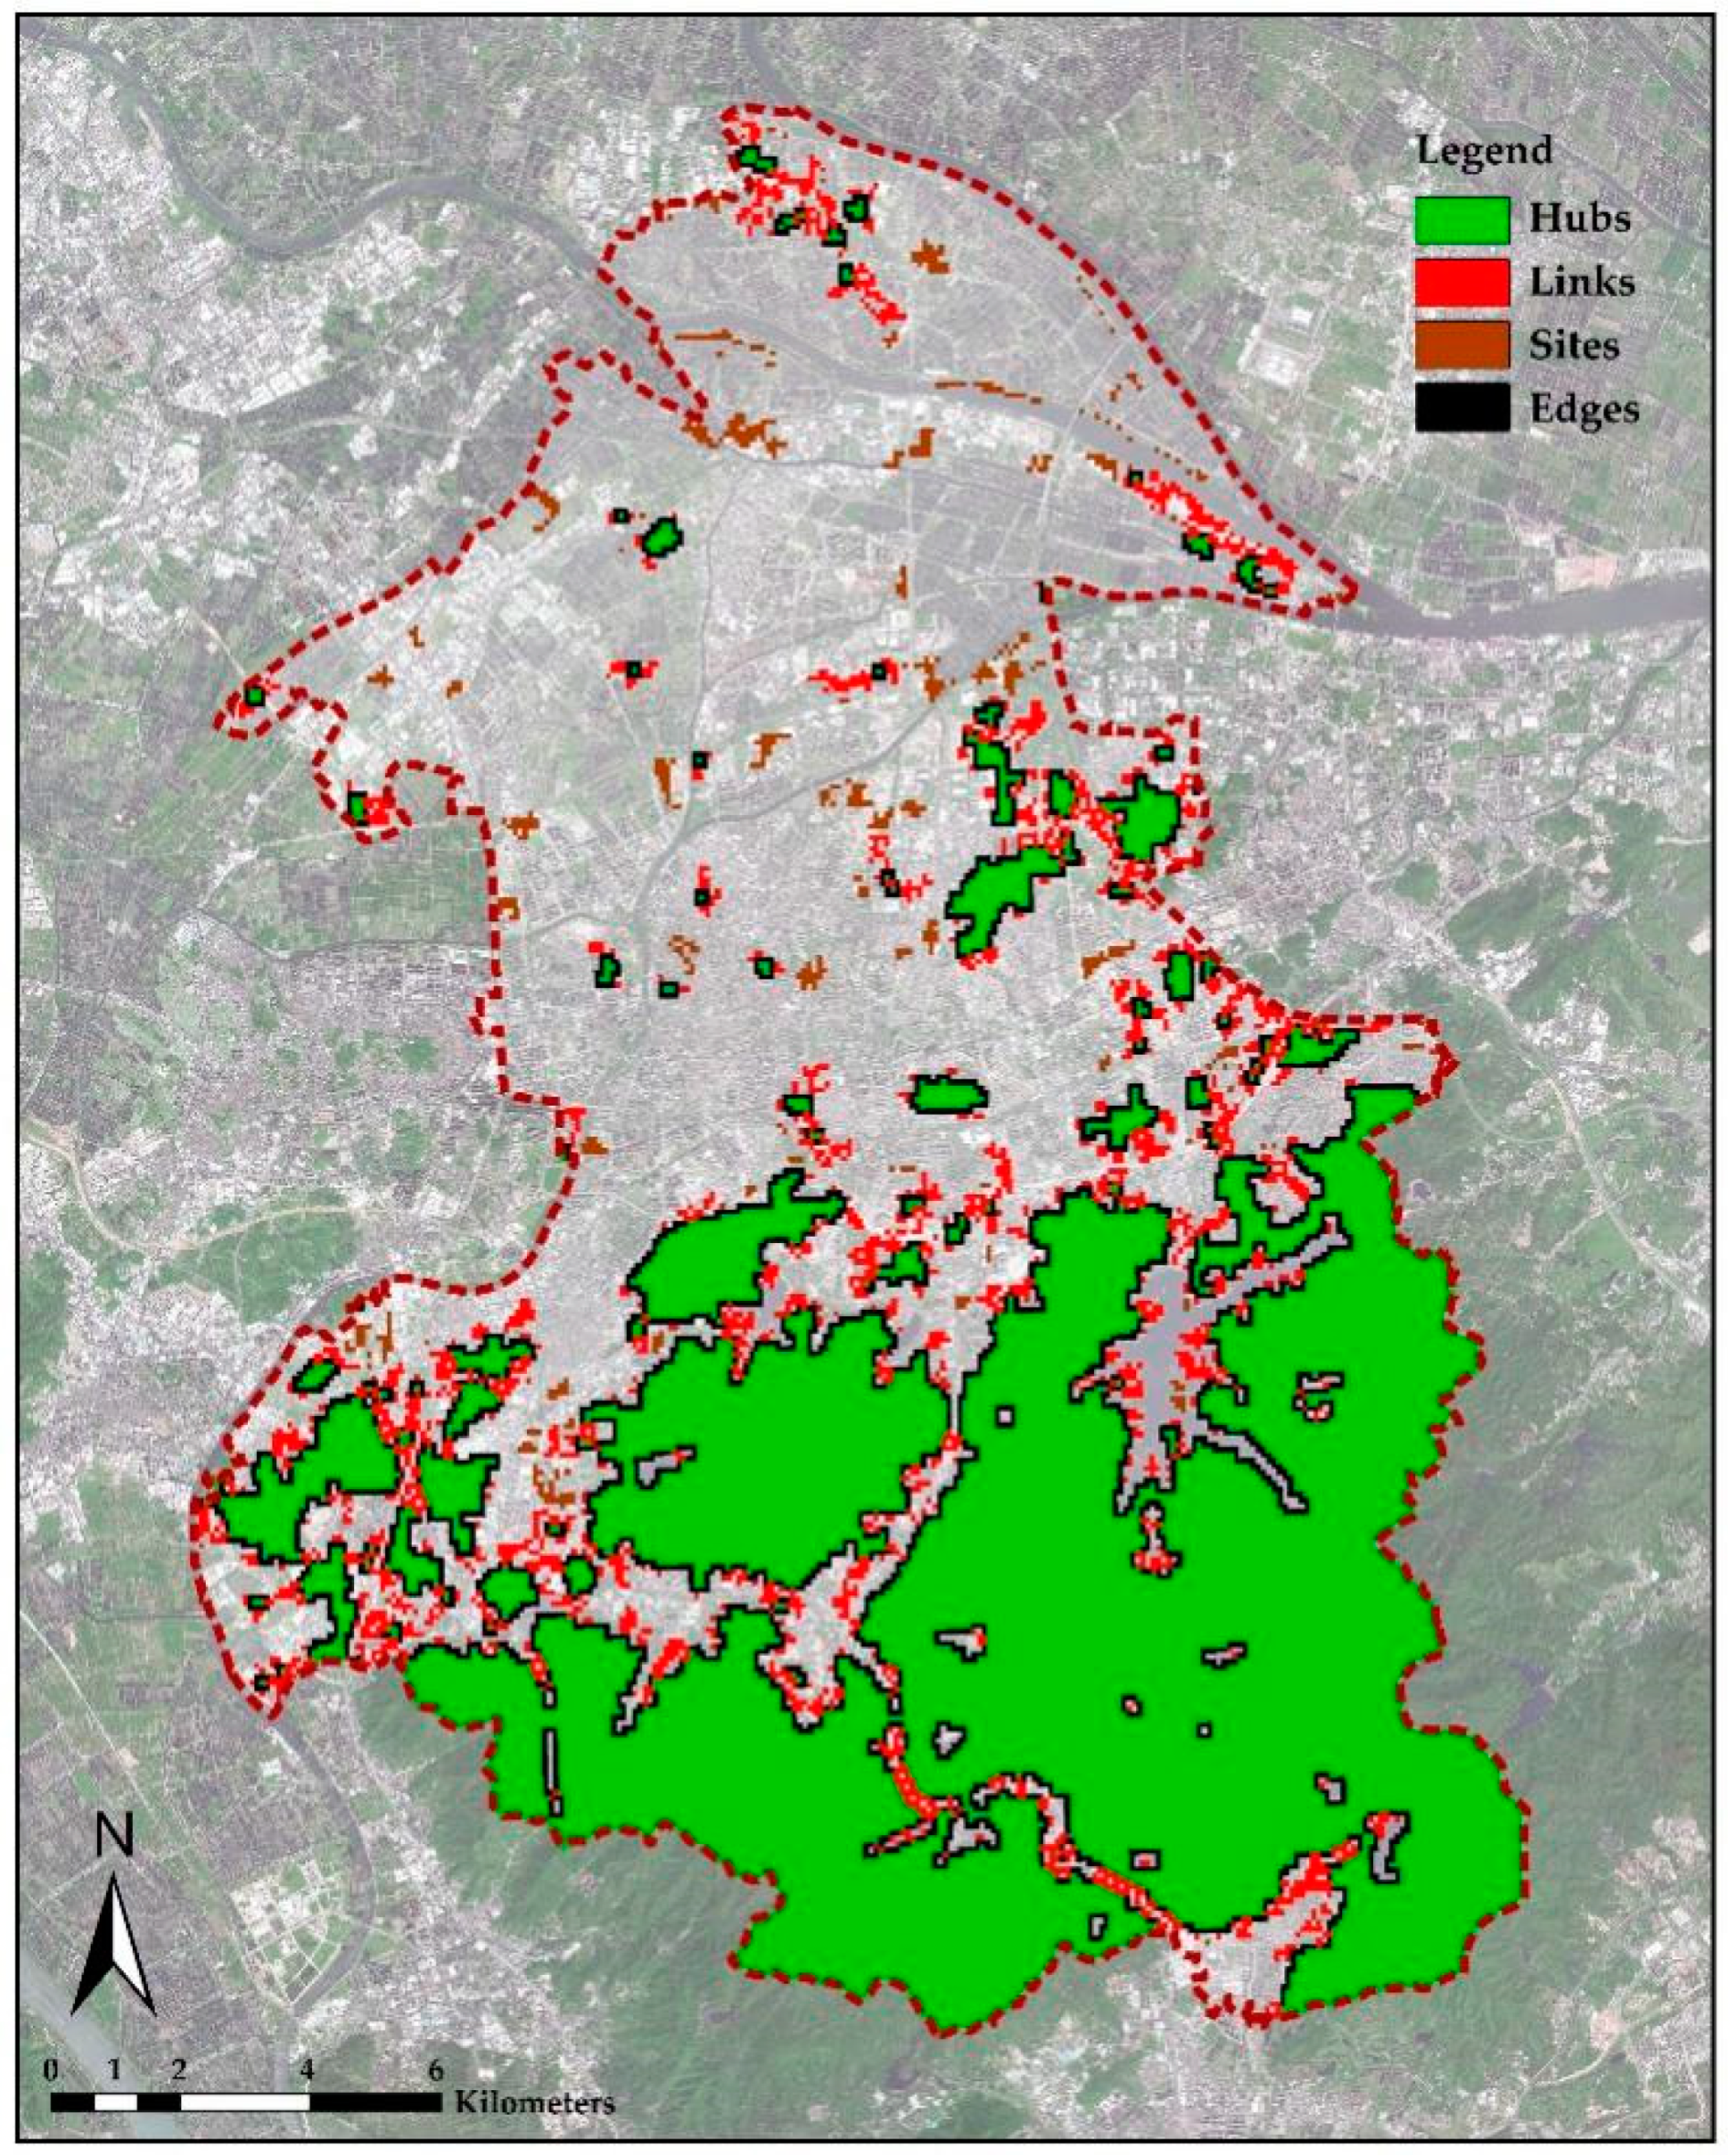
3.1. UGI Network Pattern in the Study Area

The remote sensing interpretation results of UGI are shown in Figure 8. A total of 160 UGI units were extracted in the study area, including farmland, green links, urban parks, community green spaces, and woodlands, showing obvious spatial differences in land use from north to south. UGI in the northern part of the study area is dominated by green links and farmland, and the distribution relies on the water system. UGI in the central part of the study area is dominated by urban parks and community green spaces, with scattered woodlands, which are closely integrated with public life. UGI in the southern part is dominated by large-scale mountains and forests, which have the main ecological functions. To further describe the overall pattern of UGI in the study area, we measured, identified, and segmented the spatial pattern of UGI based on the MSPA method, so as to distinguish the hubs, links, and sites of the UGI network. According to the relationship between them, the connectivity of the UGI landscape pattern in the study area can be judged. It can be seen from Figure 9 that the overall connectivity of UGI in the study area is poor, showing several small groups in the north and central parts and forming a green network with strong connections in the south.
According to the statistical analysis of data, the total area of UGI is about 176.43 km2, accounting for 47.9% of the total area of the study area. The total area of UGI hubs is 152.36 km2, accounting for 86.4%, of which there are five patches whose area is larger than 1 km2; they are the core ecological sources in the UGI network. The total area of UGI links is 19.30 km2, accounting for 10.9% of the total area of UGI. They are important bridges to realize the ecological function of UGI and the connectivity of public services. The total area of UGI sites is 4.77 km2, accounting for 2.7% of the total area of UGI. They are important sites for the integration of human activities and natural environment in the UGI network. The relevant statistical results are shown in Table 6.
The overall distribution of UGI in the study area is “large and isolated, small and scattered, and poorly connected”. Large UGI patches are concentrated in the southern part, while small ones are deeply embedded in the urban built environment, including a series of urban parks and community green spaces. The UGI links in the study area mainly rely on rivers and roads, which have weak ecological functions.

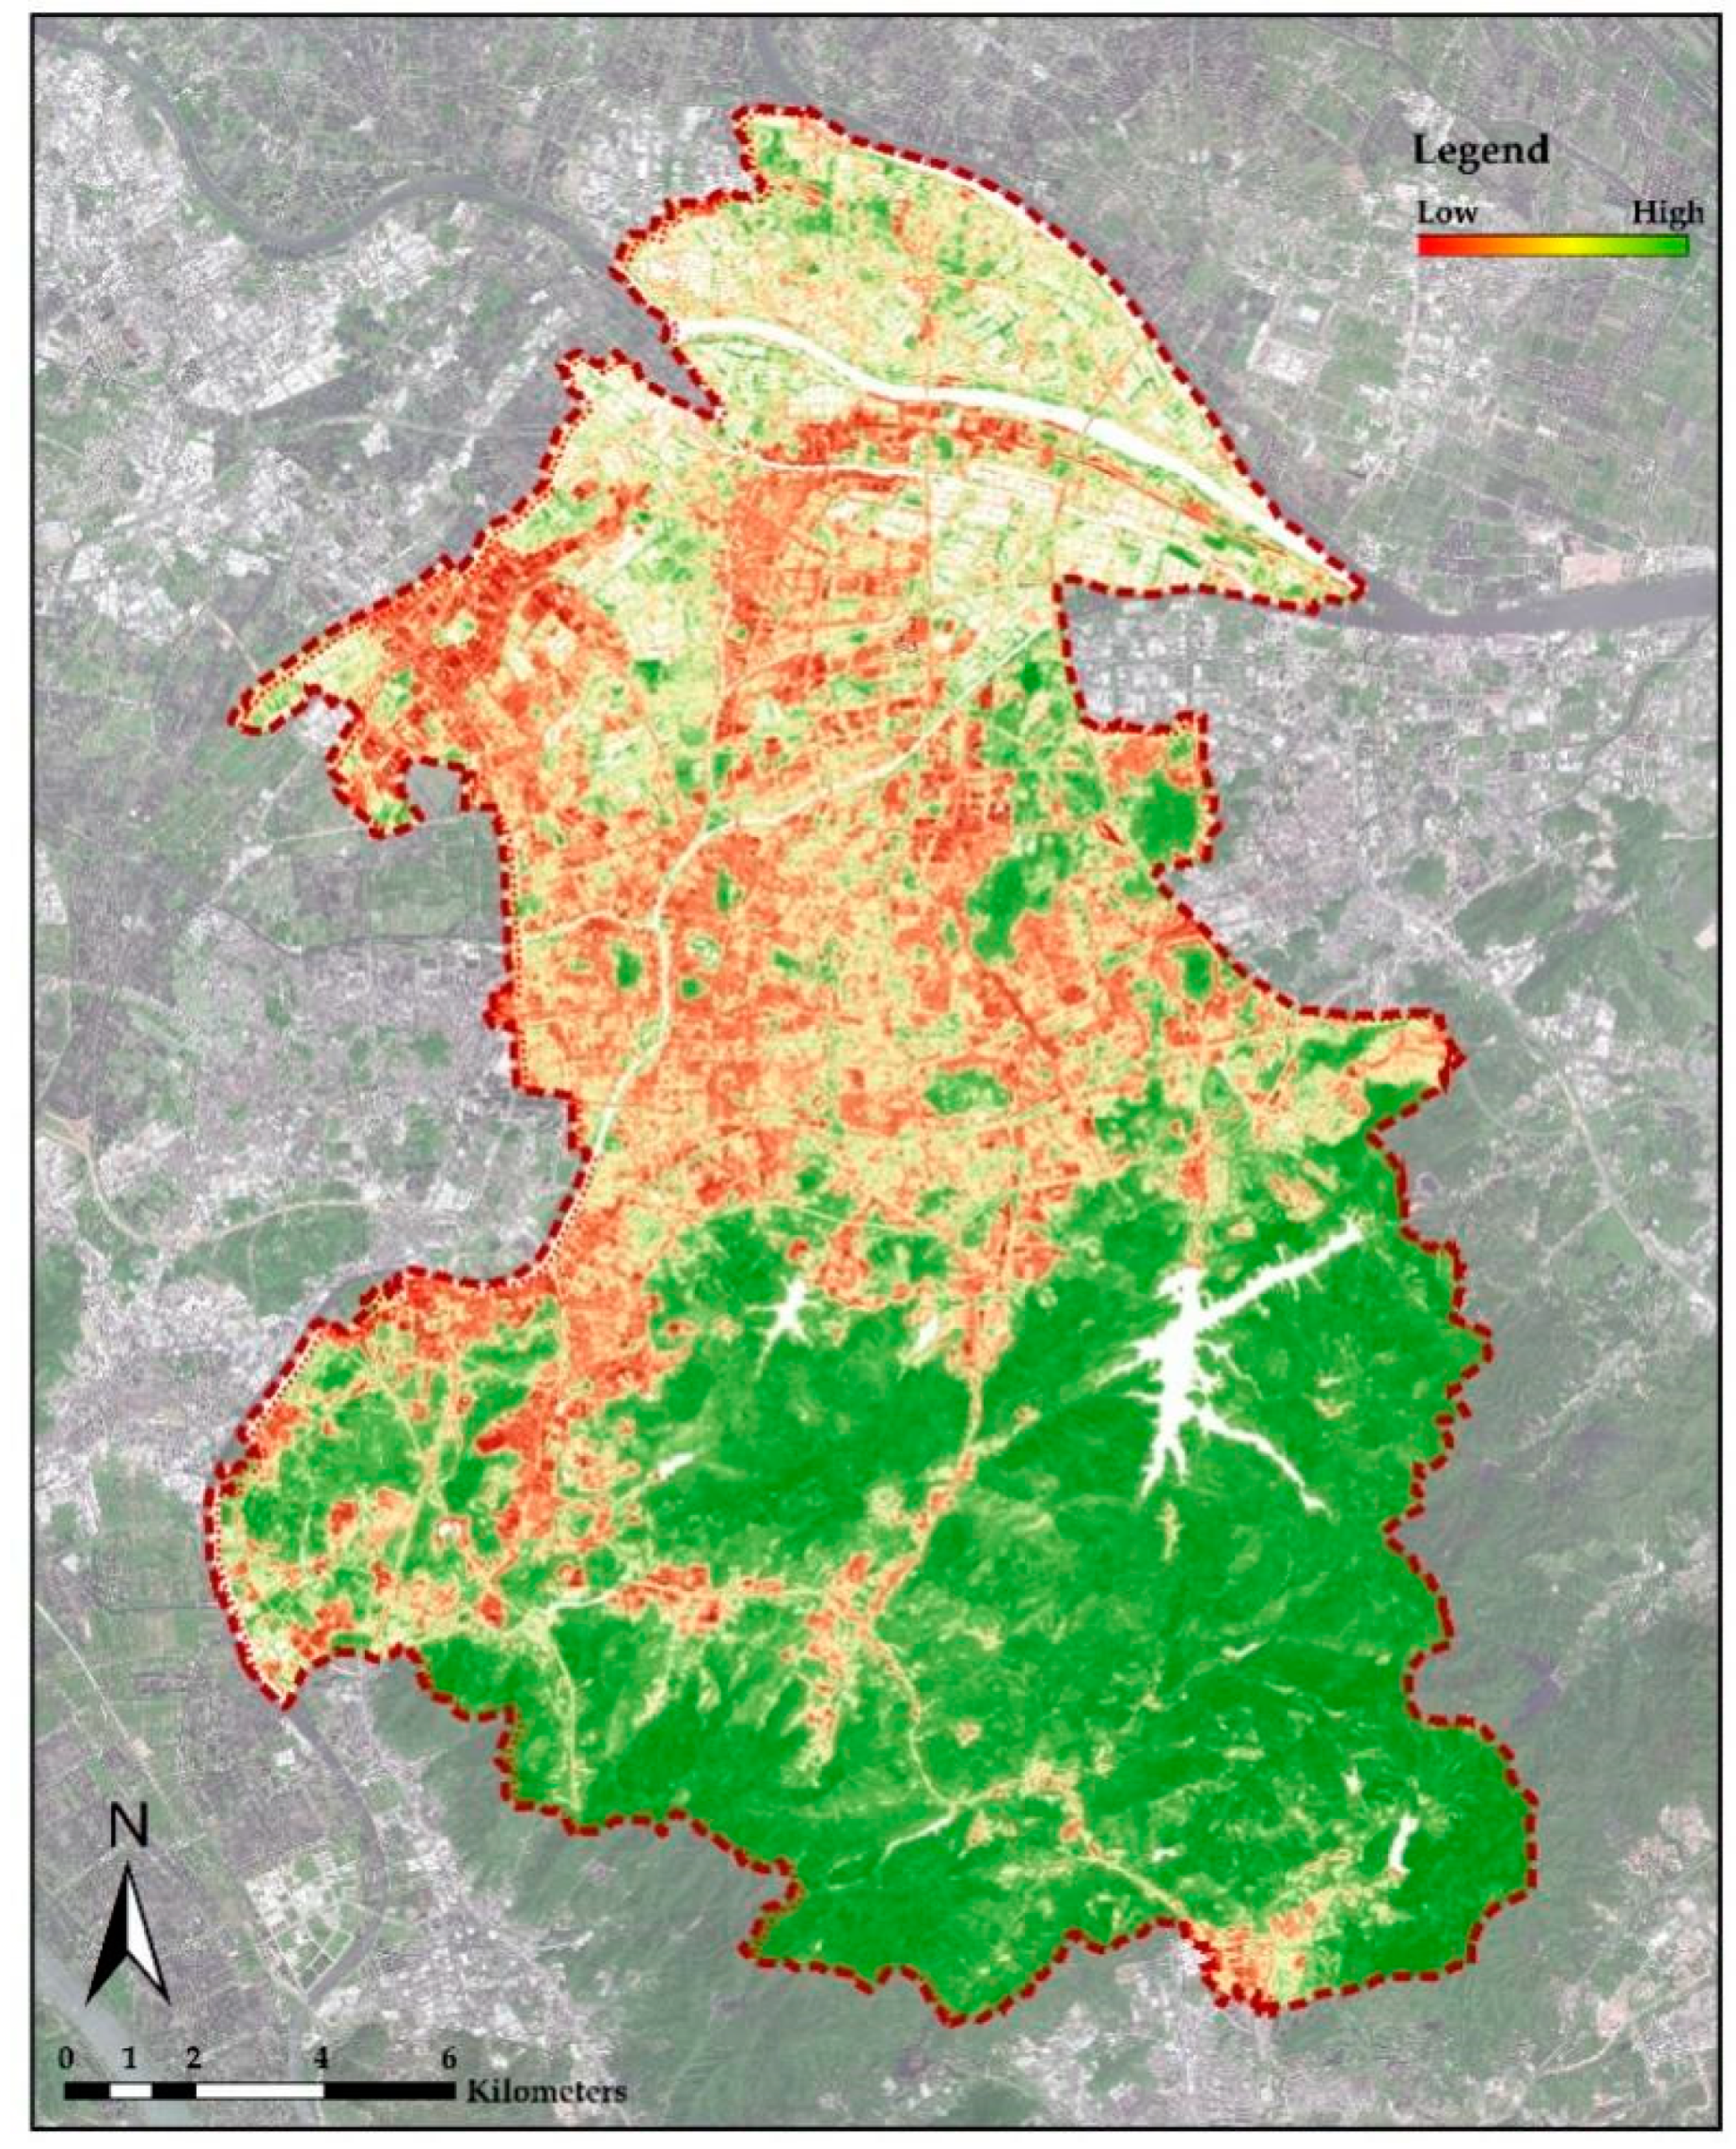
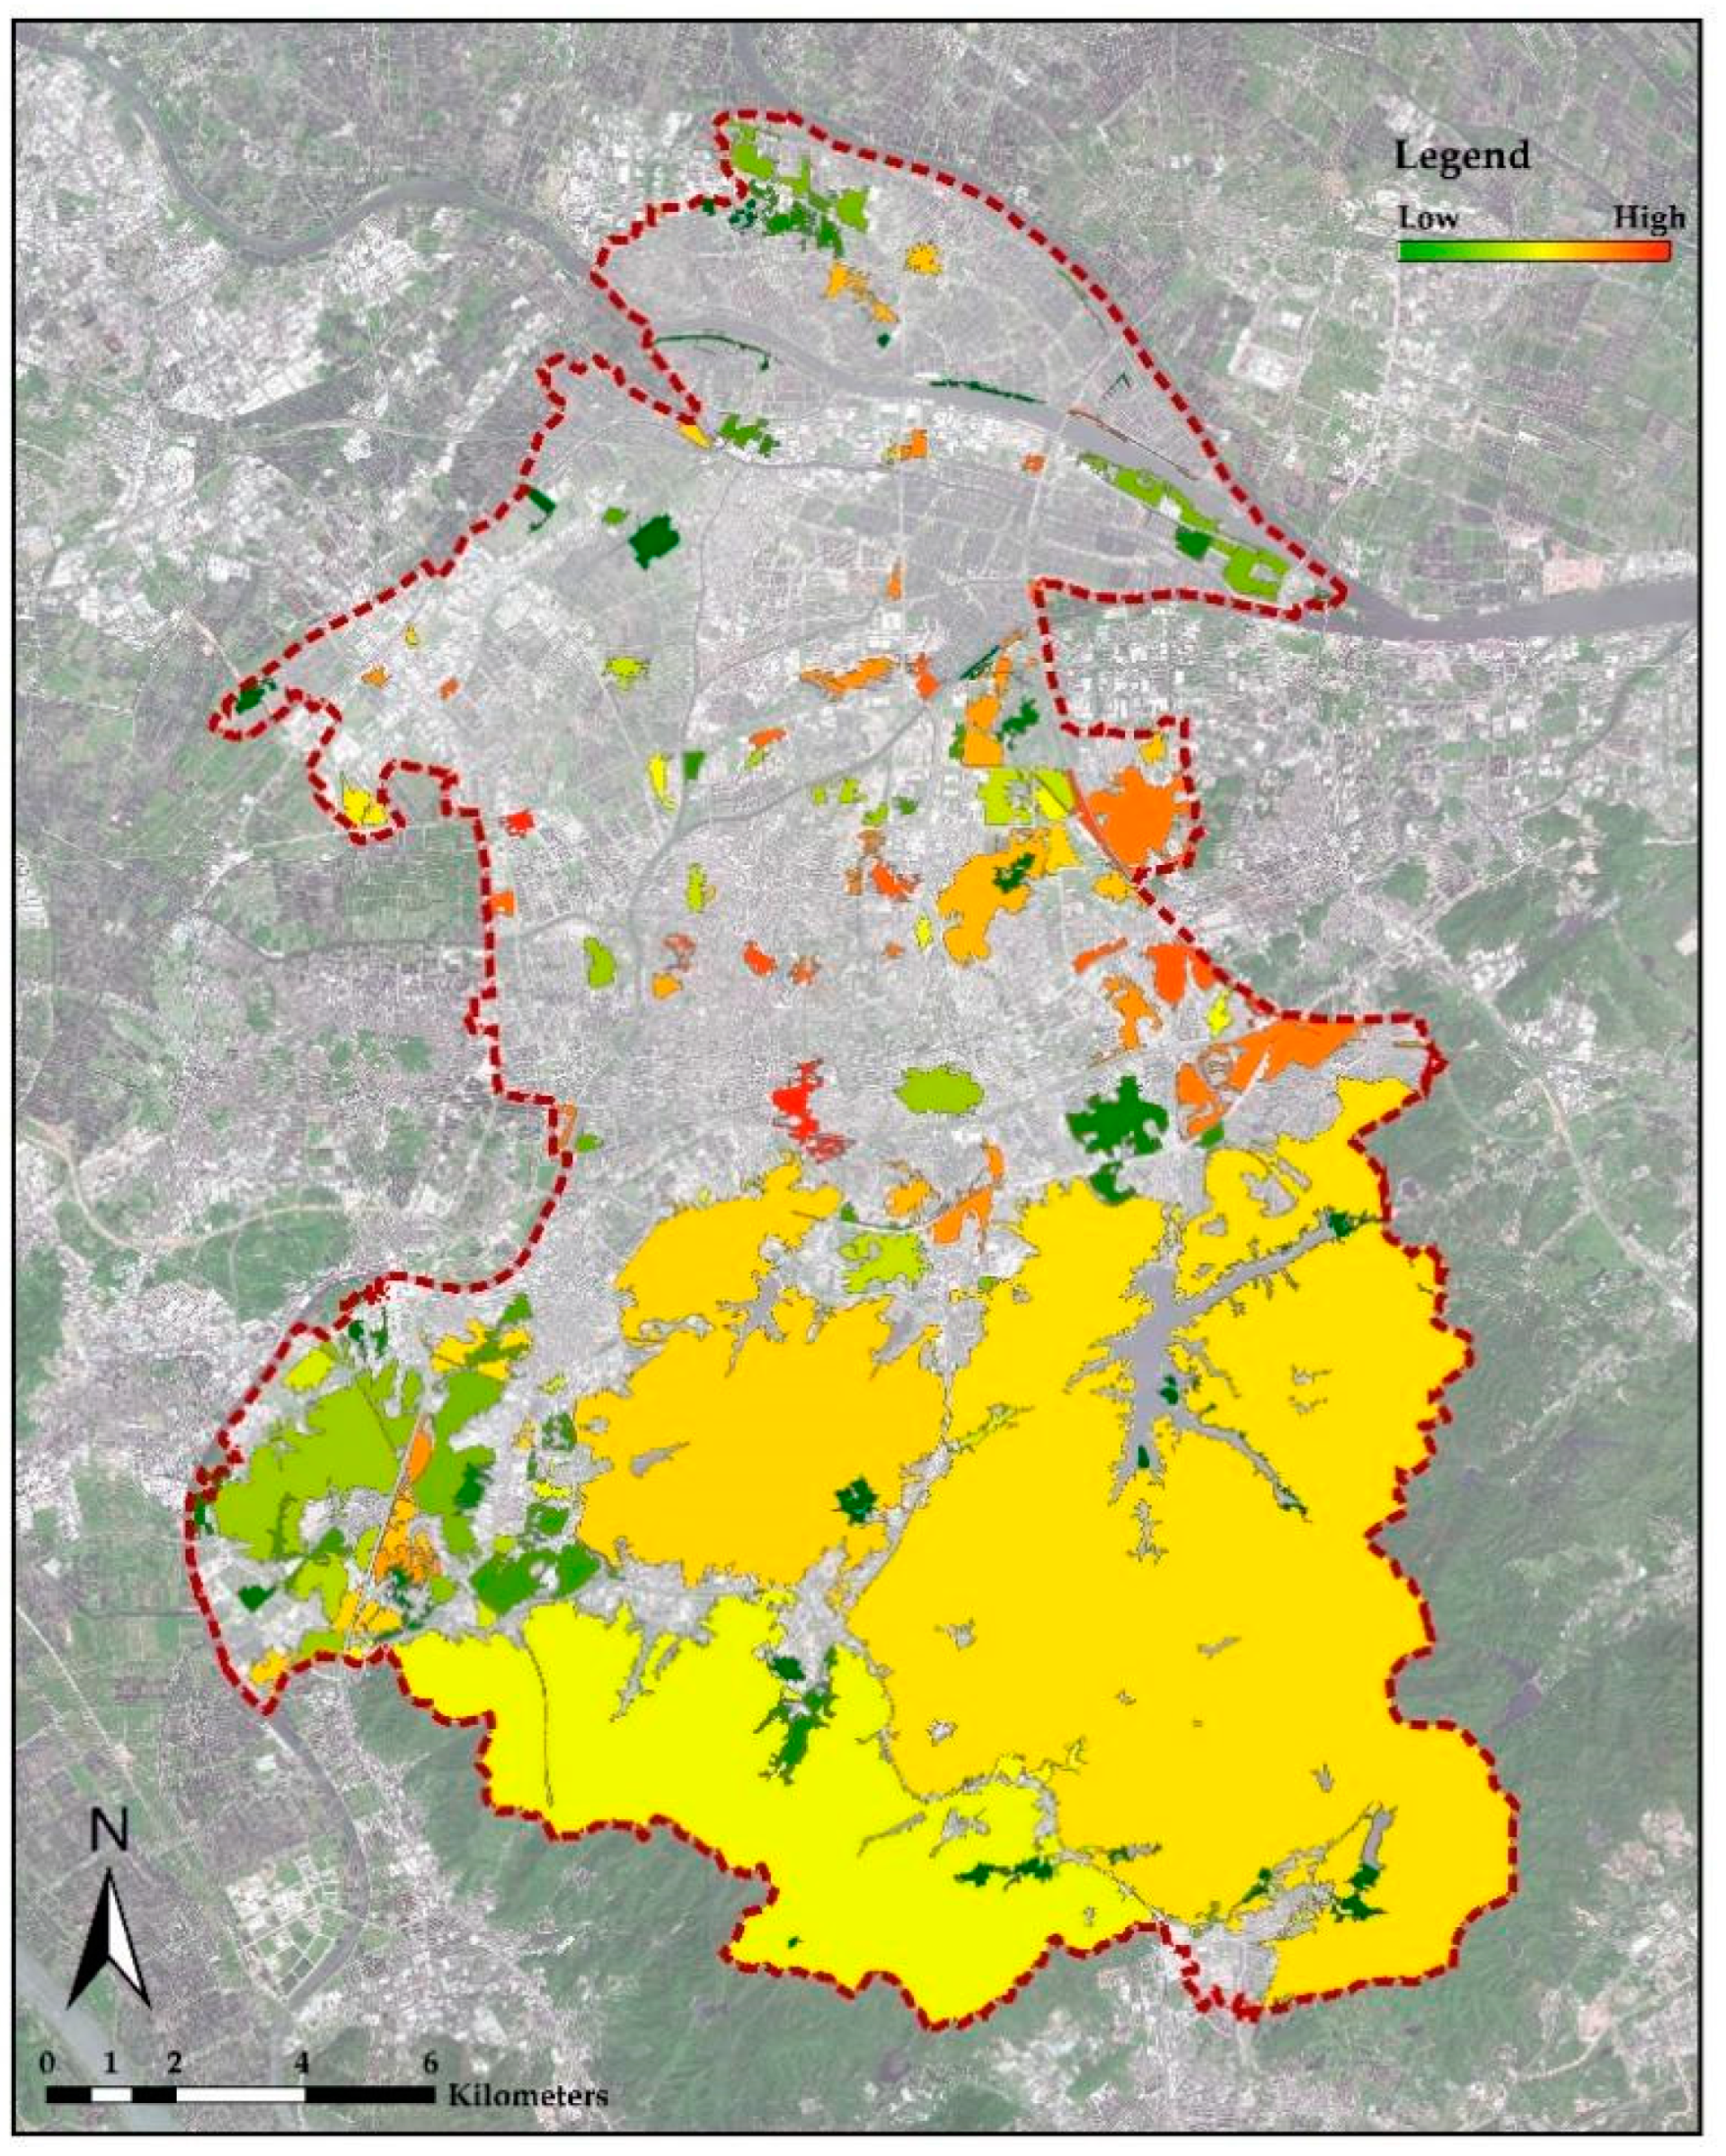
3.2. Analysis on the UGI Greening Quality in the Study Area

The ecological index (EI) in this study is based on the first principal component (PC1) of greenness, wetness, dryness, and heat. The positive and negative eigenvalues of the four subindices in PC1 represent the positive and negative effects of their contribution on greening quality. It can be seen from the PC1 load values of the four subindices in Table 7 that NDVI (representing greenness) and WET (representing wetness) have positive values, while NDBST (representing dryness) and LST (representing heat) have negative values. This is consistent with the fact that greenness and wetness have positive effects on the environment, while dryness and heat have negative effects on it. The contribution of NDVI is 0.73, which is the maximum value among the four subindices, indicating that vegetation plays a great role in improving the greening quality of UGI in the study area.
The greening quality of the overall study area and each UGI unit is shown in Figure 10 and Figure 11, respectively. The greening quality of UGI shows a distribution pattern that gradually increases from northwest to southeast. In order to further analyze the greening quality of UGI, the ecological indices (EI) were divided into five grades according to previous research results: excellent (0.8–1.0), good (0.6–0.8), medium (0.4–0.6), poor (0.2–0.4), and bad (0–0.2). In the study area, the minimum EI value of the UGI units was 0.52, the maximum value was 0.82, and the mean value was 0.68, indicating that the greening quality was generally good. Among them, 4 UGI units were graded “excellent”, with a total area of 114.12 km2, accounting for 64.7%; 141 UGI units were graded “good”, with a total area of 59.75 km2, accounting for 33.9%; and 15 UGI units were graded “medium”, with a total area of 2.56 km2, accounting for 1.4%. The results of further grading prove that the overall greening quality of UGI in the study area was good. The relevant statistics are shown in Table 8.
In addition, to verify the reasonableness of the EI assessment of greening quality, 4 UGI units with a grade of “excellent” and 15 UGI units with a grade of “medium” were subjected to a whole-layer sampling survey. The UGI units with a grade of “excellent” corresponded to four natural areas dominated by Wuguishan subdistrict (Table 9, sample 1). The UGI units with a grade of “medium” mainly corresponded to the green space by the expressway, the green space of the urban highly built-up area, and the agricultural land. This result is in line with the commonsense perception of greening quality, and typical samples are shown in Table 9 and Table 10.

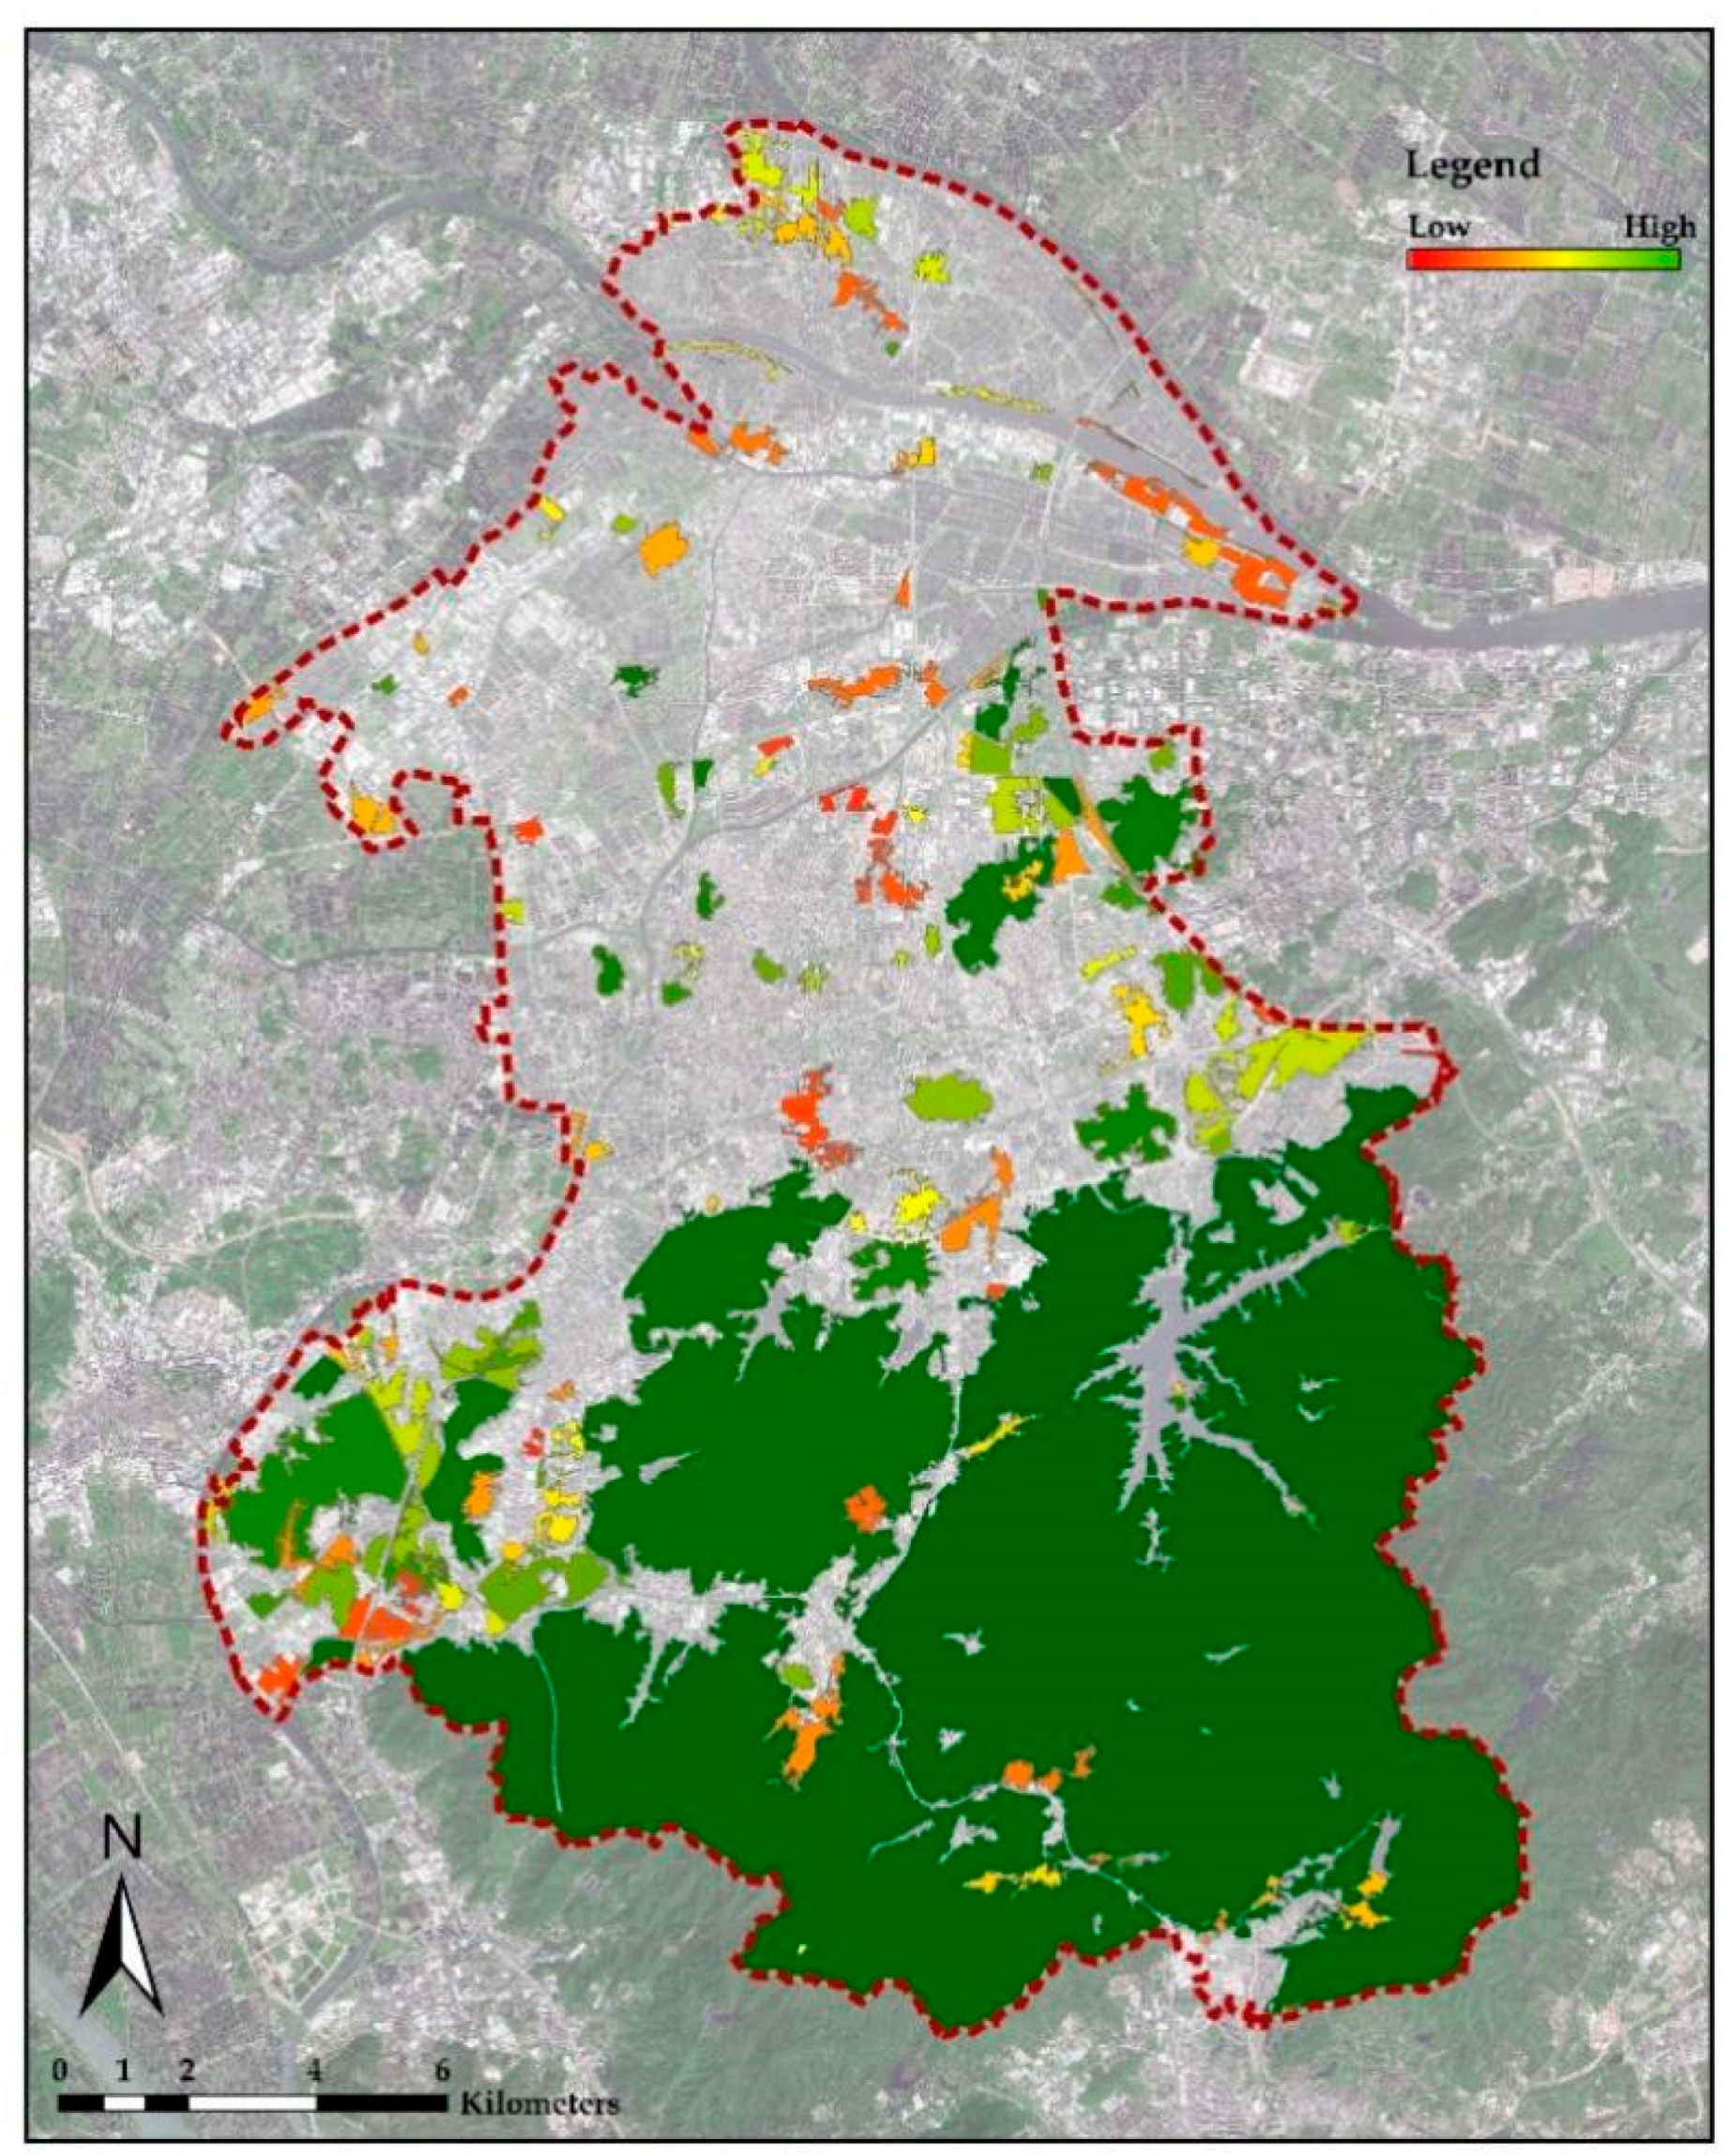
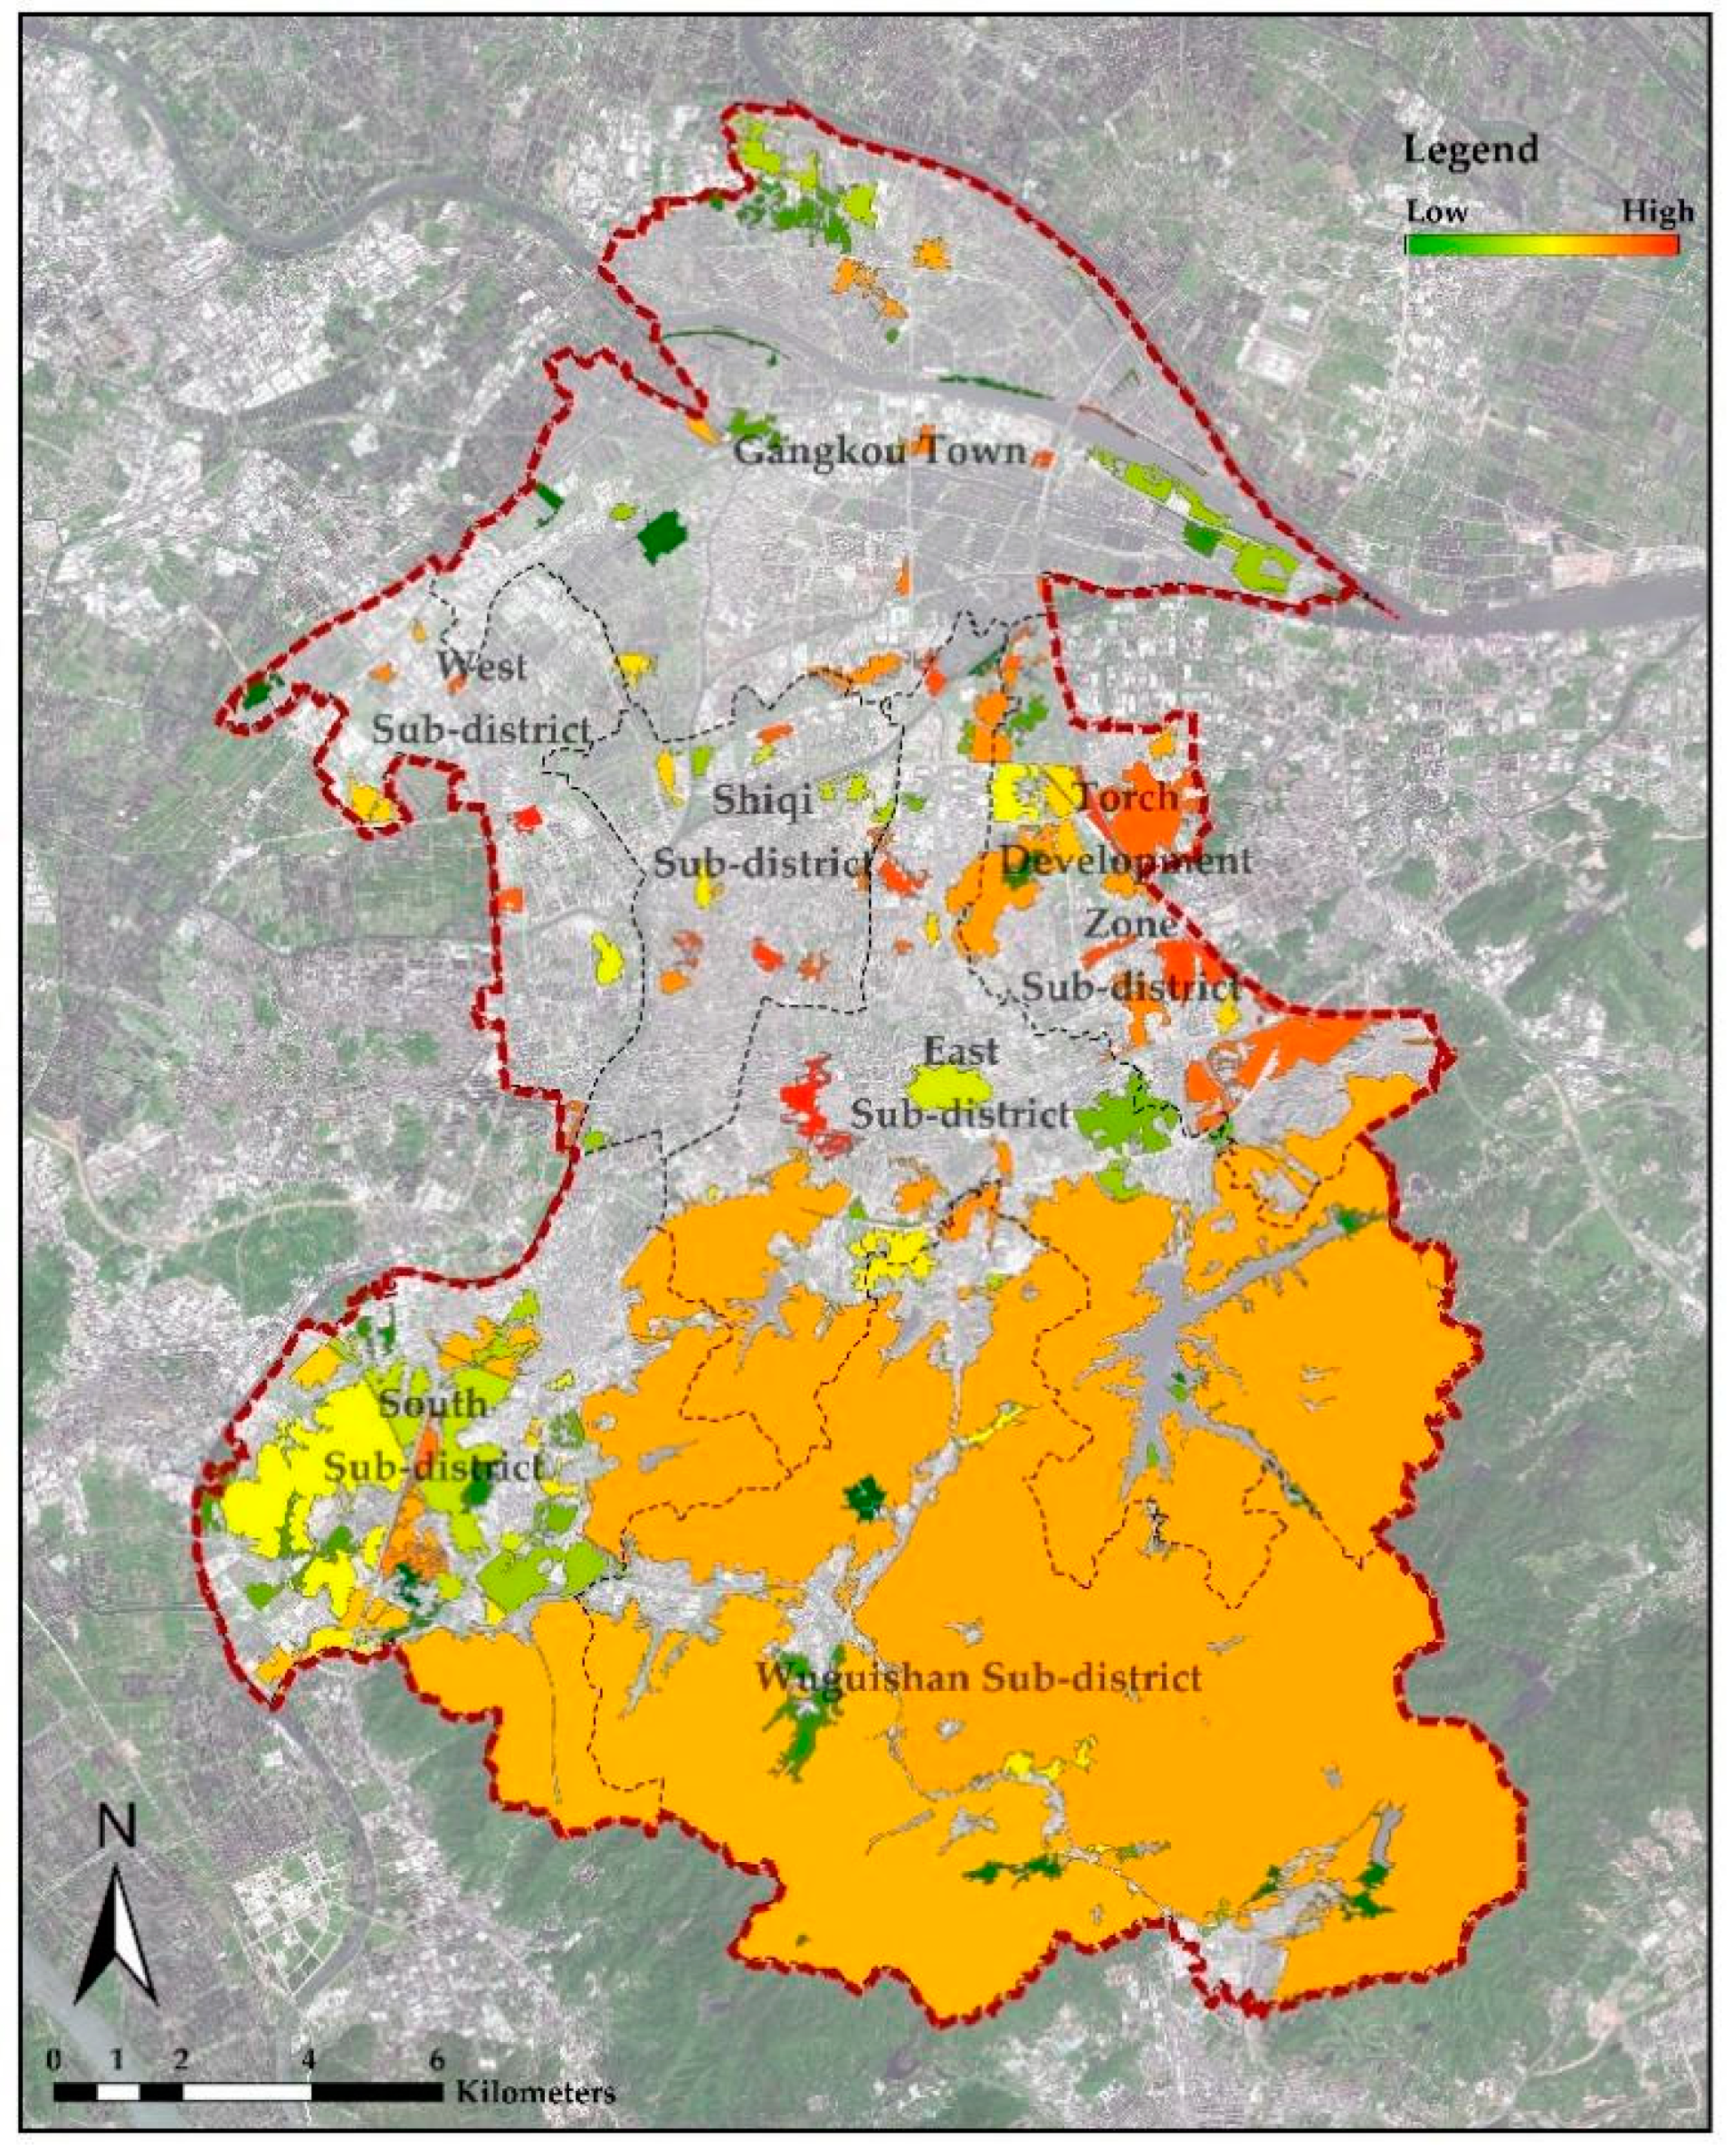
3.3. Analysis of the Public Vitality of UGI in the Study Area

Figure 12 and Figure 13 show the overall public vitality of the study area and each UGI unit. It seems that UGI public vitality is generally high in built-up areas and low in surrounding areas. In order to further analyze the public vitality of UGI, the PVIs were divided into three grades by using “Natural Breaks”: low (0–31.12 persons/hm2), medium (31.12–80.13 persons/hm2), and high (80.13–166.70 persons/hm2). The minimum PVI value of UGI units in the study area was 0 person/hm2, the maximum was 166.70 persons/hm2, and the mean was 44.38 persons/hm2. Among them, there were 26 UGI units with a public vitality grade of “high”, with a total area of 6.39 km2, accounting for 3.6%; 69 UGI units were graded “medium”, with a total area of 156.86 km2, accounting for 88.9%; and 65 UGI units were graded “low”, with a total area of 13.18 km2, accounting for 7.47%. The relevant statistics are shown in Table 11.
In addition, in order to verify the validity of the PVI assessment of public vitality, 26 UGI units with a public vitality grade of “high” and 15 UGI units with a grade of “low” were subjected to a whole-layer sampling survey. The former mainly correspond to urban parks, roads, and waterfront greenbelts. The latter mainly correspond to natural areas and some farmland that are difficult for humans to access. This result is in line with the commonsense perception of public vitality, and typical samples are shown in Table 12.

3.4. The Landscape Activity (LA) of UGI in the Study Area

The entropy-weighted TOPSIS method was used in this paper to measure the coupled two-dimensional indices of landscape activity. The entropy-weighted method determined that the weight of EI is 0.183, and that of PVI is 0.817, which reveals the contribution of the two to the LA system generated by their coupling. This result is in line with the fact that the greening quality of UGI in the study area is generally good, but the PVIs are very different. On the basis of the entropy-weighted analysis, we calculated the comprehensive LA value of the UGI according to the TOPSIS method.
The maximum LA value of UGI in the study area was 0.85, and the minimum value was 0.06, with the spatial distribution shown in Figure 14. For further overall qualitative description, the “Natural Breaks” was used to divide the LA into three grades: low (0–0.24), medium (0.24–0.46), and high (0.46–0.85). The classification results are shown in Figure 15.
On the whole, the UGI landscape activity of Gangkou Town and South subdistrict was generally low, while the UGI in other areas showed high LA. Among them, UGI units with an LA grade of “high” were distributed in the Torch Development Zone and the Shiqi, West, and East subdistricts, and the overall UGI landscape activity of Wuguishan subdistrict was at a medium level.
At the individual level, after arranging the UGI units in positive order according to the LA value, the top 5% and the bottom 5% are shown in Table 13 and Table 14. The top 5% of UGI units mainly include urban parks and waterfront greenways, while the bottom 5% are mainly islands and farmland. Among them, the UGI unit ranking the first in LA corresponds to Xingzhong Stadium and the green space along Xingzhong Road, with an EI of 0.57, a PVI of 166 person/hm2, and a LA value of 0.85. The last UGI unit in the LA ranking corresponds to the Dajianshan Camping Park, with an EI of 0.61, a PVI of 0 person/hm2, and an LA value of 0.06.

3.5. Integration of UGI Landscape Activity Information in the Study Area

Integrating the results obtained through the above technologies, we formed a visual information model of landscape activity on the ArcGIS platform, including the spatial differentiation map of LA and the eigenvalue table linked to it. The LA map can show the overall spatial distribution of UGI landscape activity (Figure 16), while the eigenvalue table supports the query of the LA measurement and indices’ values of a specific UGI patch (Table 15, Figure 17).

4. Discussion

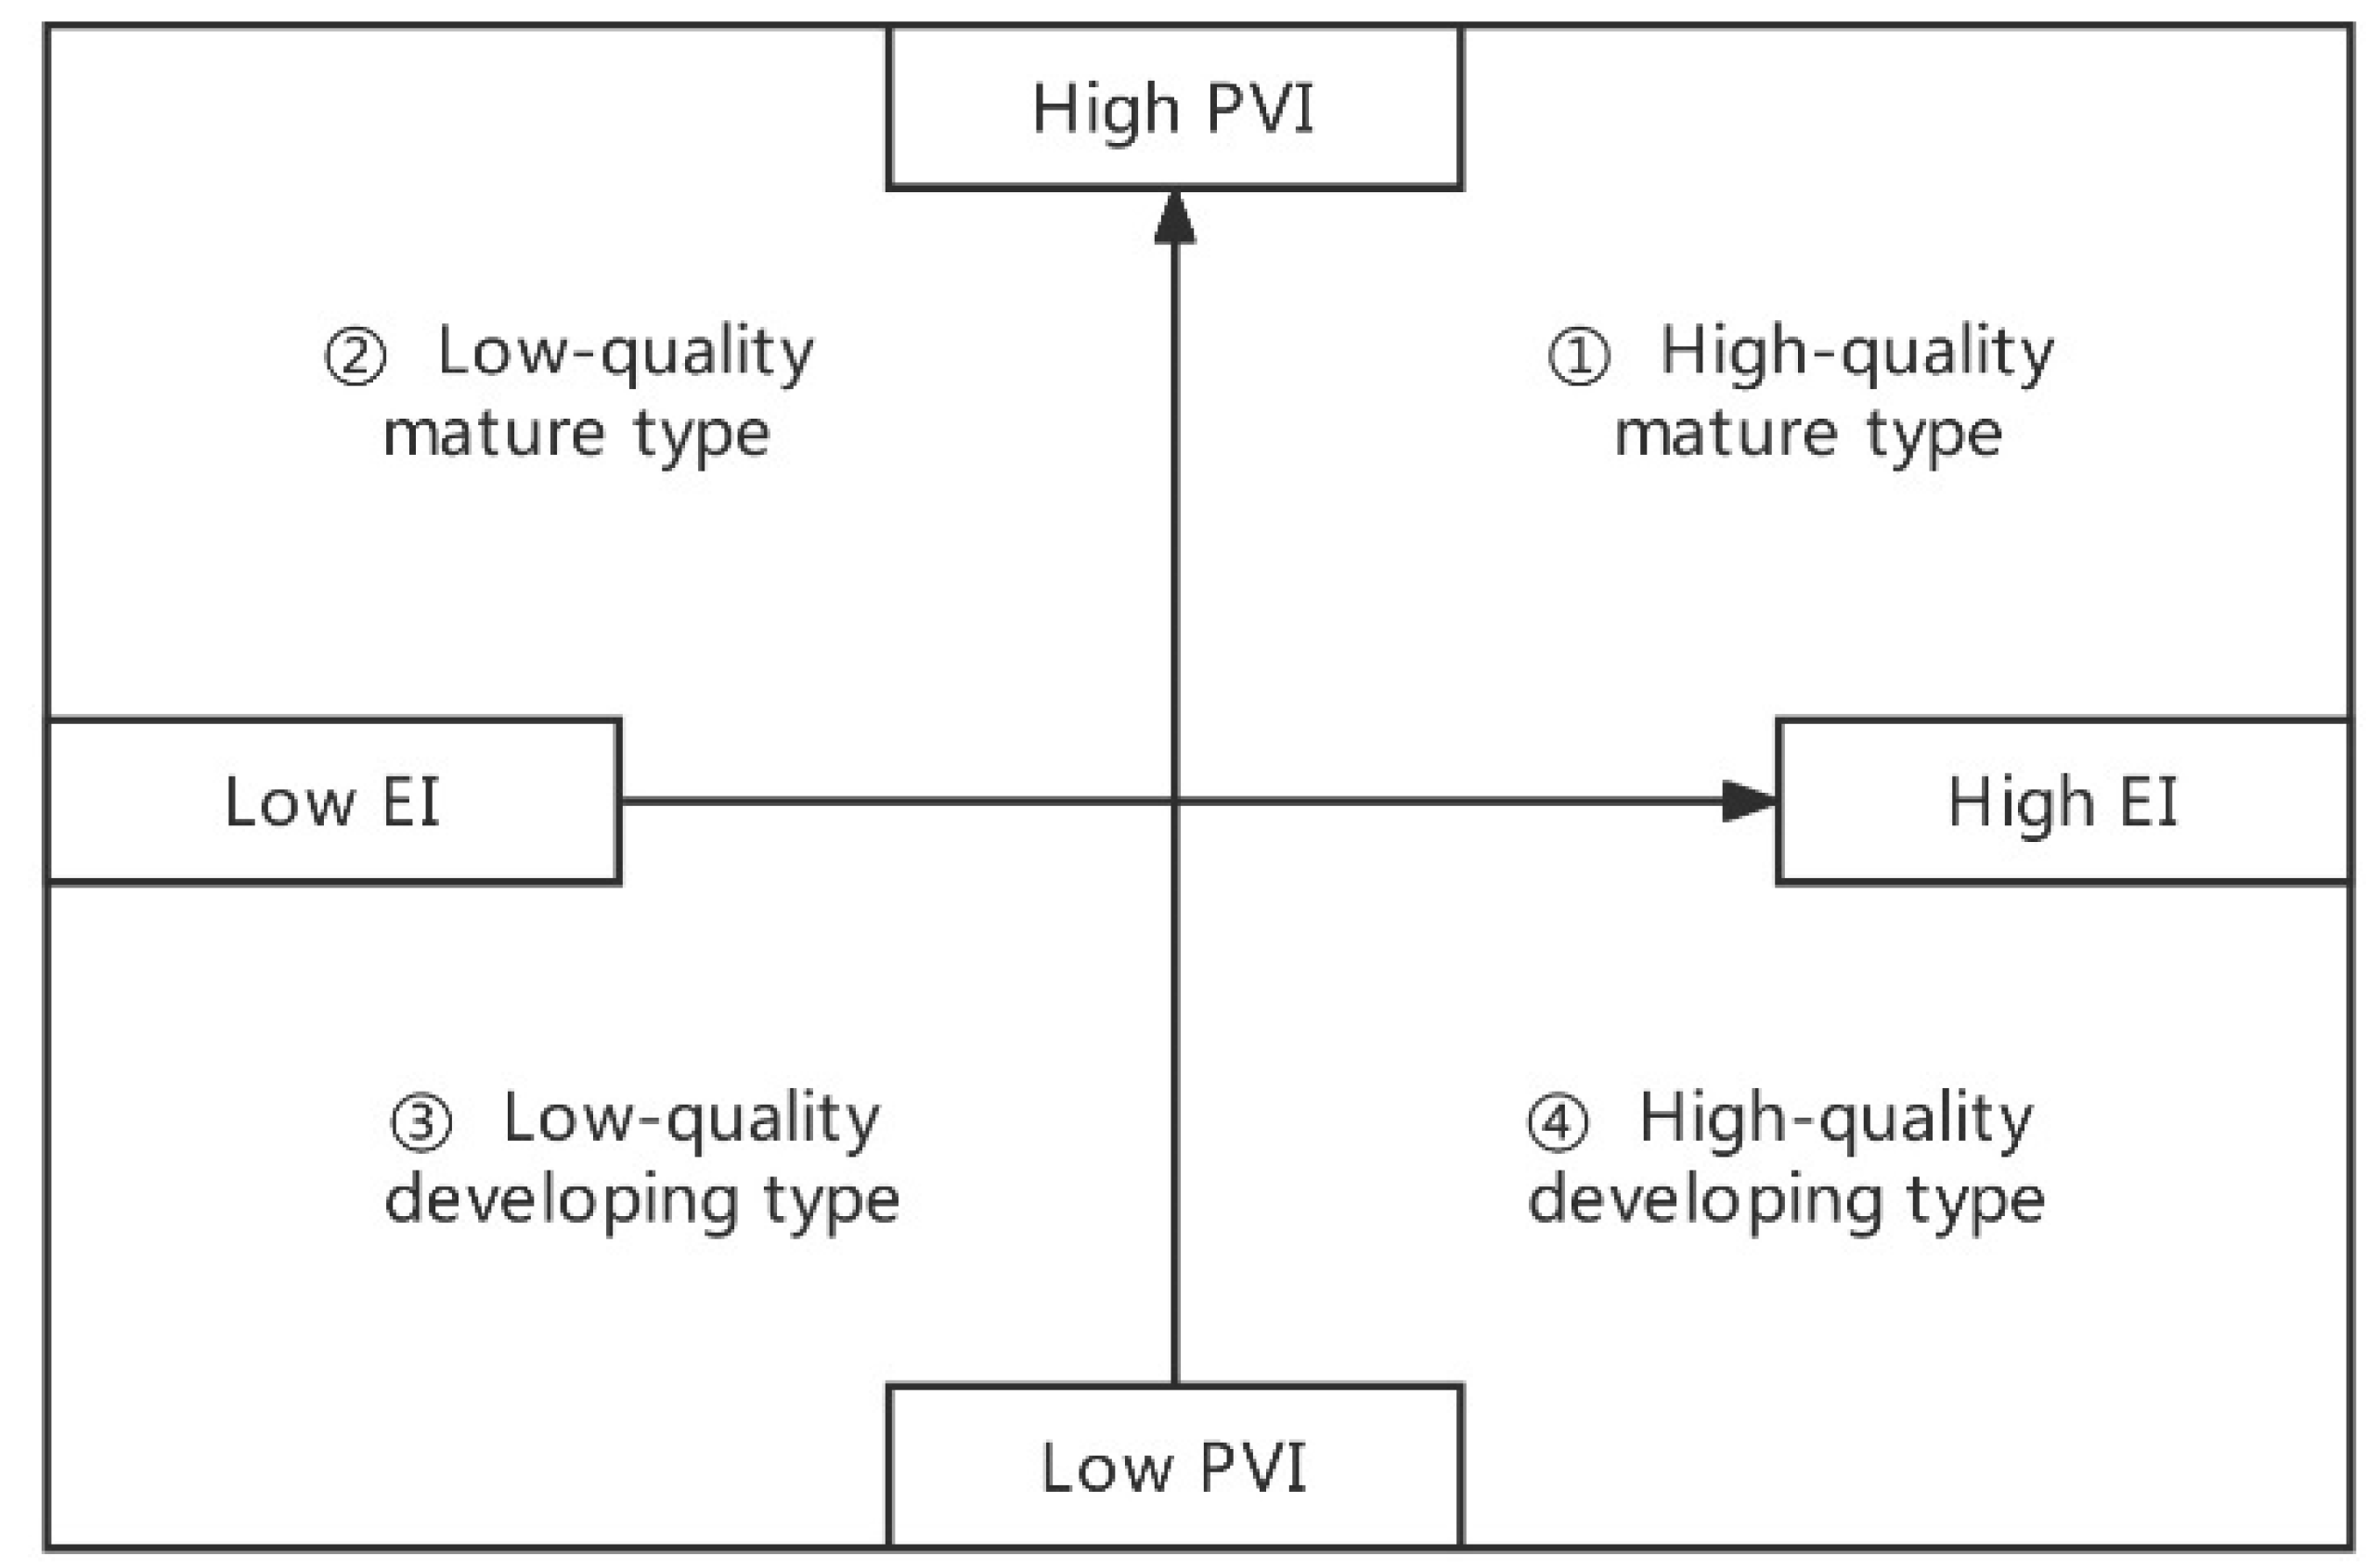
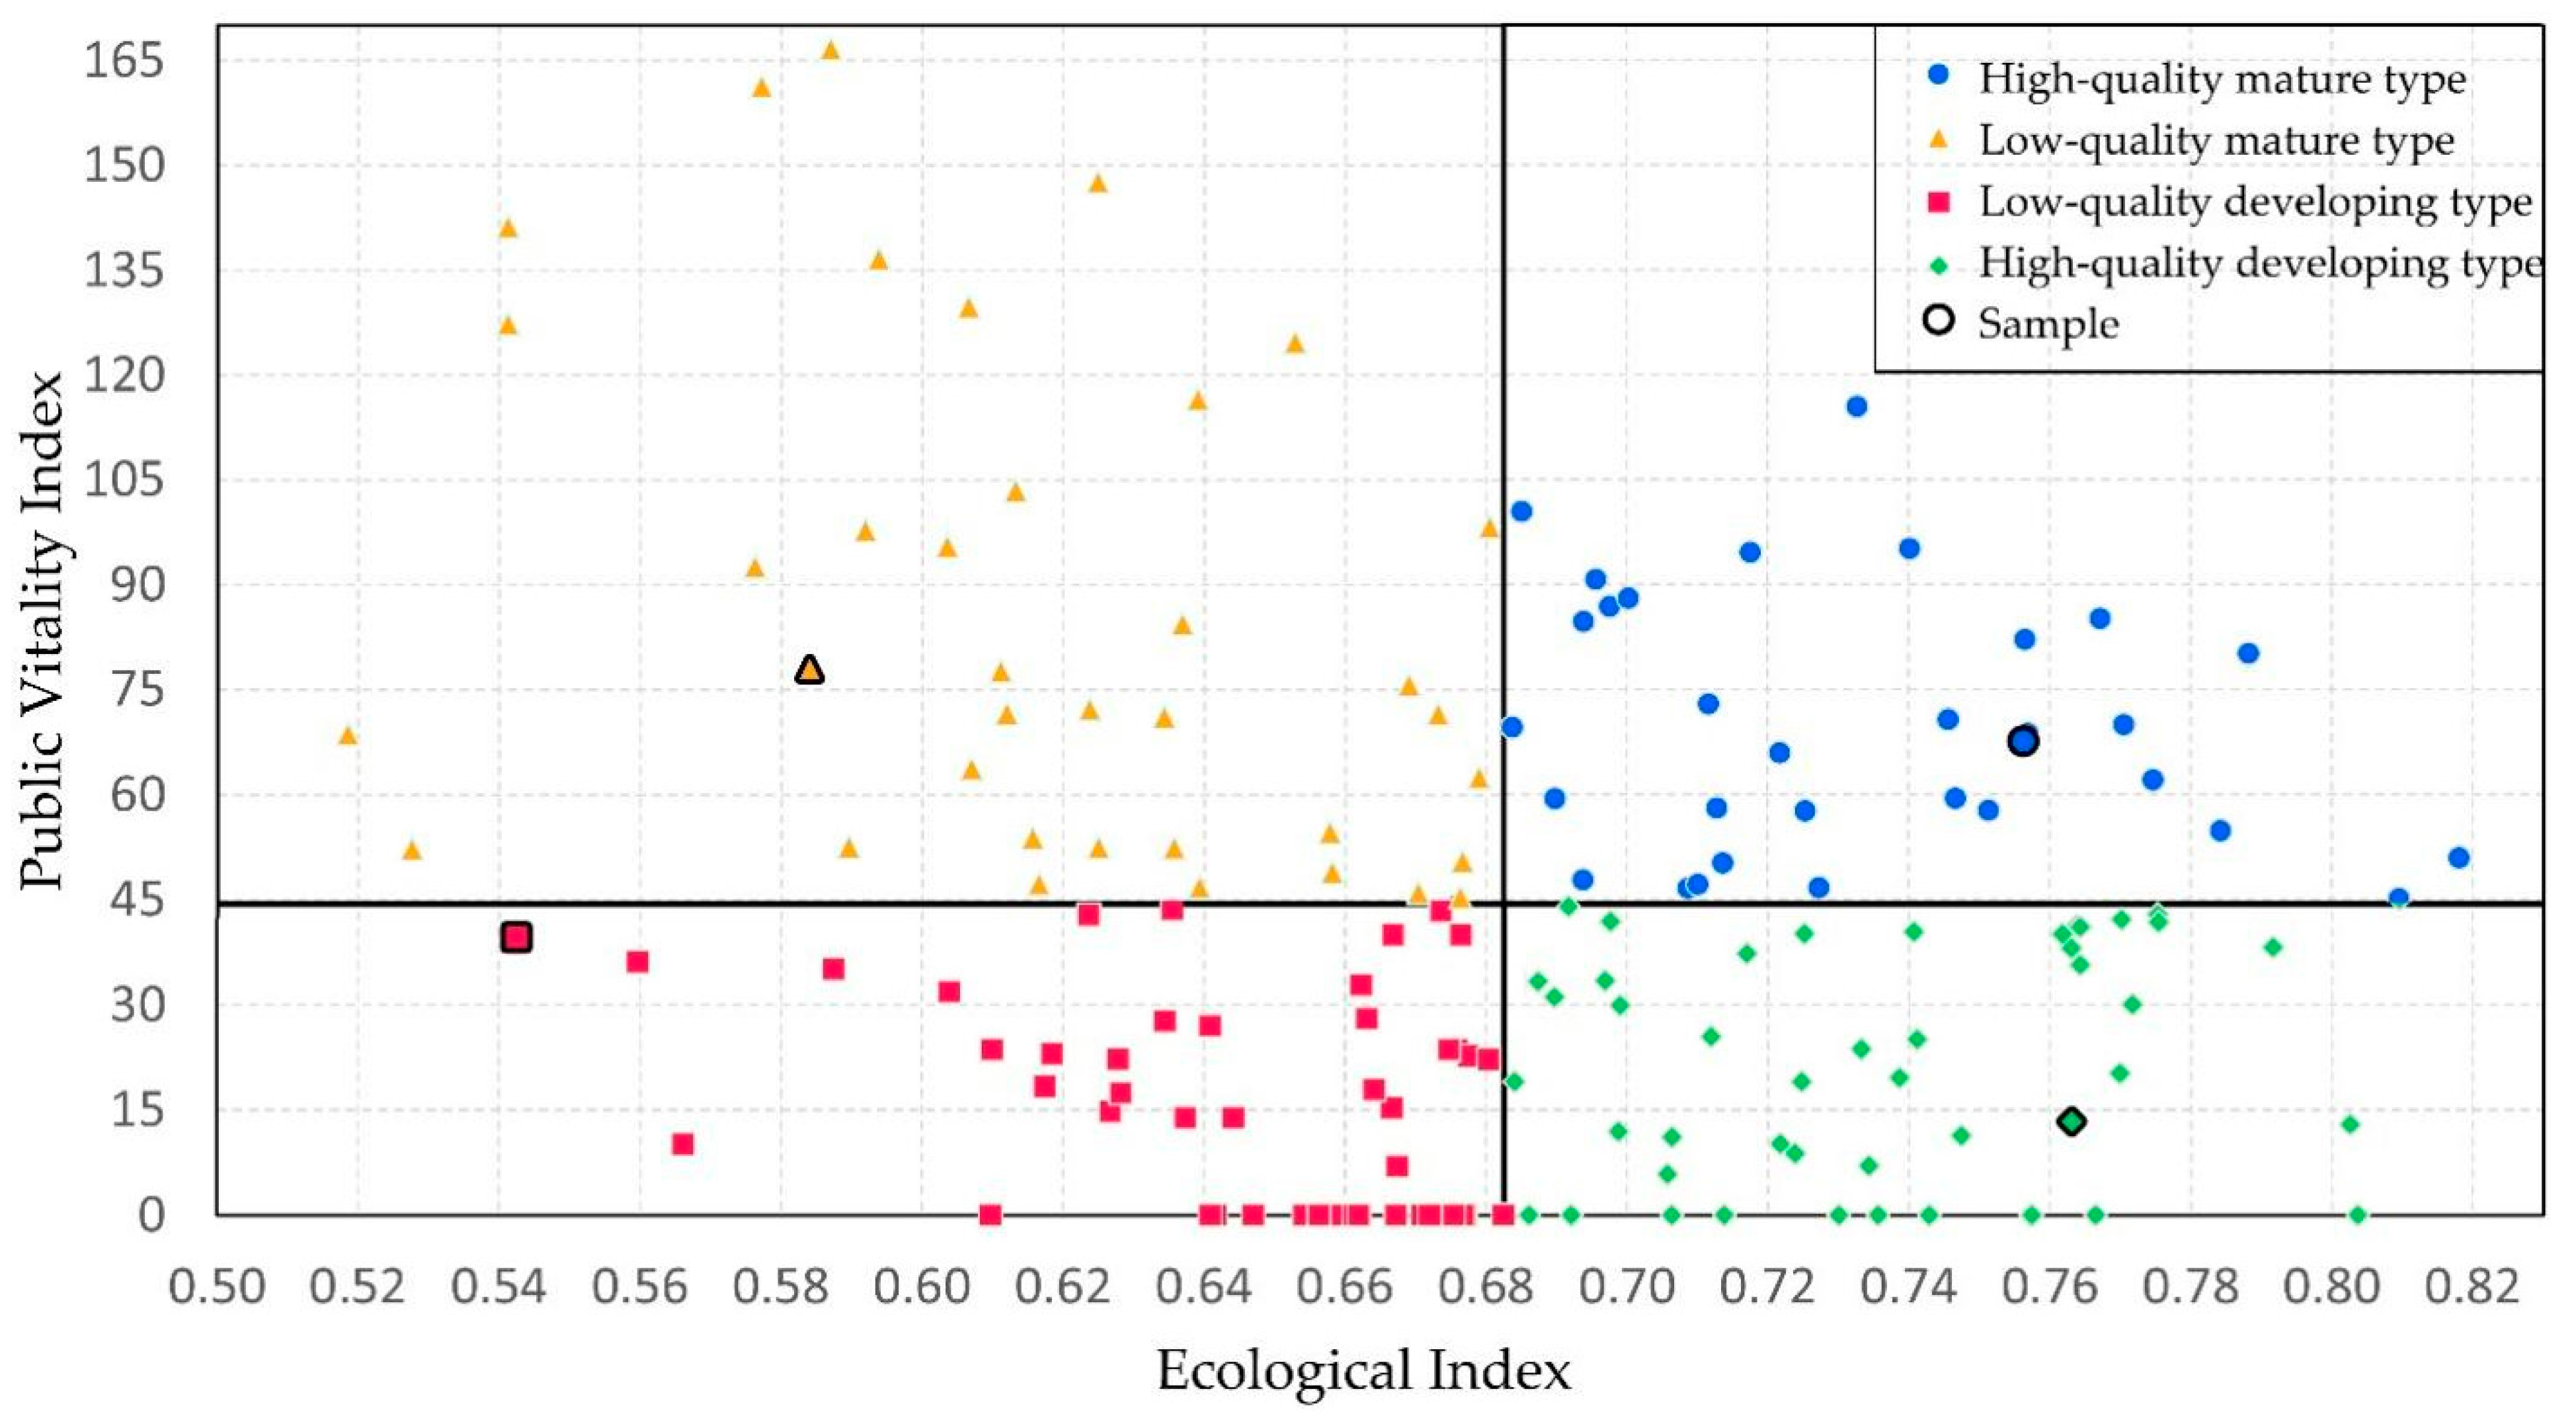
4.1. Four-Quadrant Classification of LA

Based on the overall EI mean (0.68) and the overall PVI mean (44 persons/hm2) of the 160 sites, the LA of UGI is divided into four categories (Figure 18): (1) High-quality mature type, accounting for 20.0%. It manifests higher EI and PVI than the average level of the study area, which indicates good greening quality and high population density. (2) Low-quality mature type, accounting for 23.1%. It manifests low EI but high PVI in the UGI unit, which means poor greening quality and high population activity density. (3) Low-quality developing type, accounting for 27.5%, which means that the EI and PVI in the UGI unit are lower than the average level of the study area, indicating that the greening quality is poor and that the population activity density is low. (4) High-quality developing type, accounting for 29.4% of the total, is characterized by high EI but low PVI in the UGI unit, indicating good greening quality but low population activity density.
From the perspective of LA, the construction of high-quality mature UGI is its goal [56], and the existing high-quality mature UGI units can be used as references for UGI landscape improvement. Among the other three types of UGI, low-quality mature UGI has a strong ability to attract people, but the greening quality needs improvement. The low-quality, developing UGI has poor greening quality and does not have the ability to attract population activities. It is the key area for improving the quality of UGI stock and needs to be improved according to the location of the site. The high-quality developing UGI has high greening quality but cannot attract population activities. It should be kept as it is now or moderately increase its attraction to the public according to the specific conditions of the venue. Here, we select samples from the four types of UGI for further demonstration (Table 16).
Sample 1 corresponds to Zhongshan Park, a high-quality mature UGI unit with both good greening quality and high public vitality; it can be used as a target case for UGI landscape quality improvement. Sample 2 corresponds to a waterfront greenbelt next to the “Qiwan Road” water system, located in the urban built-up area. It has high public vitality but the greening quality needs to be improved, and it is a typical low-quality mature UGI. Sample 3 corresponds to Dongmingqiao Aquatic Botanical Park and a waterfront green space connected to it. It is a low-quality developing UGI whose greening quality and public vitality need improving. It is necessary to further analyze the reasons for the lack of LA, and to improve both the greening quality and the public vitality. Sample 4 corresponds to the Shigoupo ecological patch, which has the potential to further develop in terms of public vitality, but the first priority should be to maintain greening quality. It is a typical high-quality developing UGI.

4.2. Overall Research

Landscape activity (LA) is a landscape performance characterization that reveals the ability of a UGI to maintain internal greening quality and attract people to continue engaging in public activities. Based on the ecological index (EI) and the public vitality index (PVI) derived from big data, we have established a coupled model of the two, thereby forming a widely applicable method for the LA measurement of UGI.
Taking the central urban area of Zhongshan as a study case, we extracted a total of 160 UGI units with an area of about 176.43 km2. The minimum EI value of UGI in the study area is 0.52, and the maximum value is 0.82. The minimum PVI value is 0 persons/hm2, and the maximum is 166 persons/hm2. A normalization matrix was established based on “EI-PVI” two-dimensional indices, and the entropy weighting method determined the weights of EI and PVI to be 0.183 and 0.817. Based on the weighted matrix, the minimum LA value of UGI obtained by the TOPSIS method was 0.06, and the maximum value was 0.85. Among them, the top 5% of UGI patches corresponded to urban parks and waterfront greenways, and the first-ranked patch corresponded to the greenway and stadium on the central axis of the city; the bottom 5% mainly included islands and farmland, and the last-ranked patch corresponded to the camping park, which was affected by COVID-19. This result is in line with general assumptions about landscape activity, and verifies the rationality and sensitivity of the UGI landscape activity model built in this article. Based on that, a further study was conducted to grade and classify the landscape activity. The grading showed that UGI patches with high LA were mostly distributed in urban built-up areas; the LA of ecological UGI patches such as Wugui Mountain was mostly moderate, which may be attributed to the construction of the national park; most of the farmland-like UGI patches presented low landscape activity. According to the four-quadrant LA classification, UGI in different quadrants faces different challenges in improving the quality of landscape activity. In combination with samples, the application rationality of this classification method to landscape management has been verified.

5. Conclusions

Based on the need for UGI quality improvement in the era of urban stock development, we established an analysis framework of UGI landscape activity, combining big data technology and the entropy-weighted TOPSIS method to establish an LA model, and then a corresponding information model and supporting evaluation method. As shown in the Section 3, the measurement, information integration, and evaluation analysis methods proposed in this research have practical significance for the landscape quality improvement and stock renewal of UGI and are applicable to UGI’s landscape management, monitoring, and decision making. However, the technical process still has room for development and horizontal expansion.
At the theoretical and technical levels, this research combined the perspectives of environmental determinism and humanism in assessing landscape activity, selected greening quality and public vitality as indicators of UGI landscape activity to establish the research framework, and then integrated remote sensing, big data, GIS, and other spatial information technologies to construct two-dimensional subindices of EI and PVI for LA research at the urban scale. Specifically, mathematical evaluation methods such as principal component analysis and entropy-weighted TOPSIS were used to establish the technical process of subindices’ calculation and coupling [57], thereby forming an LA model coupling EI and PVI. Combined with the values of the LA and its subindices, a clustering-grading method and a four-quadrant classification method were established to provide further evaluation methods for LA research on UGI. At this stage, the indicator system of this study has the potential for further improvement. Further research can systematically expand and optimize the indices of the model in this article according to related research on EI, PVI, and LA. The expansion of EI should integrate the multidisciplinary perspectives of ecology, landscape ecology, environmental science, geography, and so on, while considering the pattern and internal spatial characteristics of UGI. The expansion of PVI should further combine the characteristics of the type, preference, persistence, and stability of activities, and develop in depth at the level of data types and a diversity of indices. At the same time, the expansion of indices should bear in mind the availability, accuracy, and matching degree of data.
At a practical level, the technical achievements of this study are oriented to the needs of quantitative research on UGI landscape activity at the urban scale, which can not only present the overall spatial structure and differentiation of UGI landscape activity, but also quantitatively describe the objective LA status of each individual UGI unit with its measurement and subindices’ values, thereby realizing the identification and extraction of key UGI units. The landscape model proposed in this study can effectively quantify the UGI landscape activity represented by the study area and thus has practical significance for landscape management, decision assistance, and achievement detection of UGI stock improvement. At the current stage, the technical process of this research has potential for further development. Further research can combine the research results of this study to focus on temporal and spatial changes, driving forces, optimization simulation, and even correlation with landscape elements of UGI landscape activity, contributing to the deeper development of UGI landscape activity research.

Author Contributions

Conceptualization, X.Z. and R.H.; methodology, X.Z. and R.H.; software, R.H. and Y.Y.; validation, X.Z. and R.H.; formal analysis, X.Z.; investigation, R.H.; resources, R.H. and Y.Y.; data curation, R.H.; writing—original draft preparation, R.H.; writing—review and editing, X.Z.; visualization, R.H.; supervision, X.Z.; project administration, X.Z. and R.H.; funding acquisition, X.Z. and Y.Y. All authors have read and agreed to the published version of the manuscript.

Funding

This research was supported by the National Natural Science Foundation of China (No. 52108036, 51938002), the Scientific Research Ability Promotion Project for Young Teacher, BUCEA (No. X21047), the 2018-2020 Key Project of Social Science Program of Beijing Municipal Education Commission (No. SZ201810016009), and the Pyramid Talent Training Project of Beijing University of Civil Engineering and Architecture (No. JDYC20220802).

Data Availability Statement

The data are proprietary or confidential in nature and may only be provided with restrictions. The data presented in this study are available on request from the corresponding author.

Acknowledgments

We thank Dayu Zhang, Xuehua Li, Xiaoyong Lv, Zhenwei Zhang, and colleagues at the Beijing Advanced Innovation Center of Future Urban Design for their indispensable help with this research. We also acknowledge the effective support from Beijing Hangyao Space Technology Co., Ltd. The authors are grateful to the reviewers and the editors for the time and effort they put into their detailed comments that helped improve this paper.

Conflicts of Interest

The authors declare that the research was conducted in the absence of any commercial or financial relationships that could be construed as a potential conflict of interest.

References

  1. Hawken, S.; Rahmat, H.; Sepasgozar, S.M.E.; Zhang, K. The SDGs, Ecosystem Services and Cities: A Network Analysis of Current Research Innovation for Implementing Urban Sustainability. Sustainability 2021, 13, 14057. [Google Scholar] [CrossRef]
  2. Cortinovis, C.; Zulian, G.; Geneletti, D. Assessing Nature-Based Recreation to Support Urban Green Infrastructure Planning in Trento (Italy). Land 2018, 7, 112. [Google Scholar] [CrossRef] [Green Version]
  3. Năstase, I.I.; Pătru-Stupariu, I.; Kienast, F. Landscape Preferences and Distance Decay Analysis for Mapping the Recreational Potential of an Urban Area. Sustainability 2019, 11, 3620. [Google Scholar] [CrossRef] [Green Version]
  4. Wu, J. Landscape Sustainability Science: Ecosystem Services and Human Well-Being in Changing Landscapes. Landsc. Ecol. 2013, 28, 999–1023. [Google Scholar] [CrossRef]
  5. Gao, S.; Janowicz, K.; Couclelis, H. Extracting Urban Functional Regions from Points of Interest and Human Activities on Location-Based Social Networks: GAO et al. Trans. GIS 2017, 21, 446–467. [Google Scholar] [CrossRef]
  6. Saelens, B.E.; Frank, L.D.; Auffrey, C.; Whitaker, R.C.; Burdette, H.L.; Colabianchi, N. Measuring Physical Environments of Parks and Playgrounds: EAPRS Instrument Development and Inter-Rater Reliability. J. Phys. Act. Health 2006, 3, S190–S207. [Google Scholar] [CrossRef] [Green Version]
  7. Takayama, N.; Korpela, K.; Lee, J.; Morikawa, T.; Tsunetsugu, Y.; Park, B.-J.; Li, Q.; Tyrväinen, L.; Miyazaki, Y.; Kagawa, T. Emotional, Restorative and Vitalizing Effects of Forest and Urban Environments at Four Sites in Japan. Int. J. Environ. Res. Public Health 2014, 11, 7207–7230. [Google Scholar] [CrossRef] [Green Version]
  8. Boori, M.S.; Choudhary, K.; Paringer, R.; Kupriyanov, A. Eco-Environmental Quality Assessment Based on Pressure-State-Response Framework by Remote Sensing and GIS. Remote Sens. Appl. Soc. Environ. 2021, 23, 100530. [Google Scholar] [CrossRef]
  9. Kang, J.; Zhang, X.; Zhu, X.; Zhang, B. Ecological Security Pattern: A New Idea for Balancing Regional Development and Ecological Protection. A Case Study of the Jiaodong Peninsula, China. Glob. Ecol. Conserv. 2021, 26, e01472. [Google Scholar] [CrossRef]
  10. Zeng, C.; Song, Y.; He, Q.; Shen, F. Spatially Explicit Assessment on Urban Vitality: Case Studies in Chicago and Wuhan. Sust. Cities Soc. 2018, 40, 296–306. [Google Scholar] [CrossRef]
  11. Feltynowski, M.; Kronenberg, J.; Bergier, T.; Kabisch, N.; Łaszkiewicz, E.; Strohbach, M.W. Challenges of Urban Green Space Management in the Face of Using Inadequate Data. Urban For. Urban Green. 2018, 31, 56–66. [Google Scholar] [CrossRef]
  12. Xiao, Y.; Wang, D.; Fang, J. Exploring the Disparities in Park Access through Mobile Phone Data: Evidence from Shanghai, China. Landsc. Urban Plan. 2019, 181, 80–91. [Google Scholar] [CrossRef]
  13. Nagendra, H.; Lucas, R.; Honrado, J.P.; Jongman, R.H.G.; Tarantino, C.; Adamo, M.; Mairota, P. Remote Sensing for Conservation Monitoring: Assessing Protected Areas, Habitat Extent, Habitat Condition, Species Diversity, and Threats. Ecol. Indic. 2013, 33, 45–59. [Google Scholar] [CrossRef]
  14. Zeng, P.; Wei, M.; Liu, X. Investigating the Spatiotemporal Dynamics of Urban Vitality Using Bicycle-Sharing Data. Sustainability 2020, 12, 1714. [Google Scholar] [CrossRef] [Green Version]
  15. Hansen, R.; Pauleit, S. From Multifunctionality to Multiple Ecosystem Services? A Conceptual Framework for Multifunctionality in Green Infrastructure Planning for Urban Areas. AMBIO 2014, 43, 516–529. [Google Scholar] [CrossRef] [Green Version]
  16. Wei, J.; Qian, J.; Tao, Y.; Hu, F.; Ou, W. Evaluating Spatial Priority of Urban Green Infrastructure for Urban Sustainability in Areas of Rapid Urbanization: A Case Study of Pukou in China. Sustainability 2018, 10, 327. [Google Scholar] [CrossRef] [Green Version]
  17. Han, J.; Hu, Z.; Wang, P.; Yan, Z.; Li, G.; Zhang, Y.; Zhou, T. Spatio-Temporal Evolution and Optimization Analysis of Ecosystem Service Value—A Case Study of Coal Resource-Based City Group in Shandong, China. J. Clean. Prod. 2022, 363, 132602. [Google Scholar] [CrossRef]
  18. Spanò, M.; Gentile, F.; Davies, C.; Lafortezza, R. The DPSIR Framework in Support of Green Infrastructure Planning: A Case Study in Southern Italy. Land Use Policy 2017, 61, 242–250. [Google Scholar] [CrossRef]
  19. Li, K.; Li, C.; Liu, M.; Hu, Y.; Wang, H.; Wu, W. Multiscale Analysis of the Effects of Urban Green Infrastructure Landscape Patterns on PM2.5 Concentrations in an Area of Rapid Urbanization. J. Clean. Prod. 2021, 325, 129324. [Google Scholar] [CrossRef]
  20. Mitsova, D.; Shuster, W.; Wang, X. A Cellular Automata Model of Land Cover Change to Integrate Urban Growth with Open Space Conservation. Landsc. Urban Plan. 2011, 99, 141–153. [Google Scholar] [CrossRef]
  21. Mahdianpari, M.; Salehi, B.; Mohammadimanesh, F.; Homayouni, S.; Gill, E. The First Wetland Inventory Map of Newfoundland at a Spatial Resolution of 10 m Using Sentinel-1 and Sentinel-2 Data on the Google Earth Engine Cloud Computing Platform. Remote Sens. 2018, 11, 43. [Google Scholar] [CrossRef] [Green Version]
  22. Baatz, M.; Schäpe, A. Object-Oriented and Multi-Scale Image Analysis in Semantic Networks. In Proceedings of the 2nd International Symposium: Operationalization of Remote Sensing, Enschede, The Netherlands, 16–20 August 1999; pp. 1–7. [Google Scholar]
  23. Otsu, N. A Threshold Selection Method from Gray-Level Histograms. IEEE Trans. Syst. Man Cybern. 1979, 9, 62–66. [Google Scholar] [CrossRef] [Green Version]
  24. Rosenfeld, A. The Max Roberts Operator Is a Hueckel-Type Edge Detector. IEEE Trans. Pattern Anal. Mach. Intell. 1981, PAMI-3, 101–103. [Google Scholar] [CrossRef] [PubMed]
  25. Pham, D.; Xu, C.; Prince, J. A Survey of Current Methods in Medical Image Segmentation. Annu. Rev. Biomed. Eng. 2000, 2, 315–337. [Google Scholar] [CrossRef] [PubMed]
  26. Shi, Y.; Chen, Z.; Qi, Z.; Meng, F.; Cui, L. A Novel Clustering-Based Image Segmentation via Density Peaks Algorithm with Mid-Level Feature. Neural Comput. Appl. 2017, 28, 29–39. [Google Scholar] [CrossRef]
  27. Zhang, X.; Ma, W.; Li, C.; Wu, J.; Tang, X.; Jiao, L. Fully Convolutional Network-Based Ensemble Method for Road Extraction From Aerial Images. IEEE Geosci. Remote Sens. Lett. 2020, 17, 1777–1781. [Google Scholar] [CrossRef]
  28. Shao, Z.; Zhou, Z.; Huang, X.; Zhang, Y. MRENet: Simultaneous Extraction of Road Surface and Road Centerline in Complex Urban Scenes from Very High-Resolution Images. Remote Sens. 2021, 13, 239. [Google Scholar] [CrossRef]
  29. Chen, L.-C.; Papandreou, G.; Kokkinos, I.; Murphy, K.; Yuille, A.L. DeepLab: Semantic Image Segmentation with Deep Convolutional Nets, Atrous Convolution, and Fully Connected CRFs. IEEE Trans. Pattern Anal. Mach. Intell. 2018, 40, 834–848. [Google Scholar] [CrossRef] [Green Version]
  30. He, K.; Gkioxari, G.; Dollar, P.; Girshick, R. Mask R-CNN. IEEE Trans. Pattern Anal. Mach. Intell. 2020, 42, 386–397. [Google Scholar] [CrossRef]
  31. Hofmann, P.; Strobl, J.; Nazarkulova, A. Mapping Green Spaces in Bishkek—How Reliable Can Spatial Analysis Be? Remote Sens. 2011, 3, 1088–1103. [Google Scholar] [CrossRef]
  32. Saini, V.; Tiwari, R.K. An Object-Based Image Analysis Approach for Determining the Pattern of Urban Growth in the First Planned City of India. In Proceedings of the Remote Sensing Technologies and Applications in Urban Environments Iii, Berlin, Germany, 10–12 September 2018; Erbertseder, T., Chrysoulakis, N., Zhang, Y., Eds.; Spie-Int Soc Optical Engineering: Bellingham, WA, USA, 2018; Volume 10793, p. 107930T. [Google Scholar]
  33. Tunay, M.; Marangoz, M.A.; Karakis, S.; Atesoglu, A. Detecting Urban Vegetation from Different Images Using an Object-Based Approach in Bartin, Turkey. In Proceedings of the 2007 3rd International Conference on Recent Advances in Space Technologies, Istanbul, Turkey, 14–16 June 2007; IEEE: Istanbul, Turkey, 2007; pp. 636–640. [Google Scholar]
  34. MacFaden, S.W.; O’Neil-Dunne, J.P.M.; Royar, A.R.; Lu, J.W.T.; Rundle, A.G. High-Resolution Tree Canopy Mapping for New York City Using LIDAR and Object-Based Image Analysis. J. Appl. Remote Sens 2012, 6, 063567. [Google Scholar] [CrossRef]
  35. Zheng, X.; Zou, Z.; Xu, C.; Lin, S.; Wu, Z.; Qiu, R.; Hu, X.; Li, J. A New Remote Sensing Index for Assessing Spatial Heterogeneity in Urban Ecoenvironmental-Quality-Associated Road Networks. Land 2022, 11, 46. [Google Scholar] [CrossRef]
  36. Cui, R.; Han, J.; Hu, Z. Assessment of Spatial Temporal Changes of Ecological Environment Quality: A Case Study in Huaibei City, China. Land 2022, 11, 944. [Google Scholar] [CrossRef]
  37. Zhou, Z.; Feng, Q.; Zhu, C.; Luo, W.; Wang, L.; Zhao, X.; Zhang, L. The Spatial and Temporal Evolution of Ecological Environment Quality in Karst Ecologically Fragile Areas Driven by Poverty Alleviation Resettlement. Land 2022, 11, 1150. [Google Scholar] [CrossRef]
  38. Xia, Q.-Q.; Chen, Y.-N.; Zhang, X.-Q.; Ding, J.-L. Spatiotemporal Changes in Ecological Quality and Its Associated Driving Factors in Central Asia. Remote Sens. 2022, 14, 3500. [Google Scholar] [CrossRef]
  39. Jia, K.; Liang, S.; Liu, S.; Li, Y.; Xiao, Z.; Yao, Y.; Jiang, B.; Zhao, X.; Wang, X.; Xu, S.; et al. Global Land Surface Fractional Vegetation Cover Estimation Using General Regression Neural Networks From MODIS Surface Reflectance. IEEE Trans. Geosci. Remote Sens. 2015, 53, 4787–4796. [Google Scholar] [CrossRef]
  40. Baret, F.; Hagolle, O.; Geiger, B.; Bicheron, P.; Miras, B.; Huc, M.; Berthelot, B.; Niño, F.; Weiss, M.; Samain, O.; et al. LAI, FAPAR and FCover CYCLOPES Global Products Derived from VEGETATION. Remote Sens. Environ. 2007, 110, 275–286. [Google Scholar] [CrossRef] [Green Version]
  41. Verger, A.; Baret, F.; Weiss, M.; Filella, I.; Peñuelas, J. GEOCLIM: A Global Climatology of LAI, FAPAR, and FCOVER from VEGETATION Observations for 1999–2010. Remote Sens. Environ. 2015, 166, 126–137. [Google Scholar] [CrossRef] [Green Version]
  42. Xin, J.; Yang, J.; Sun, D.; Han, T.; Song, C.; Shi, Z. Seasonal Differences in Land Surface Temperature under Different Land Use/Land Cover Types from the Perspective of Different Climate Zones. Land 2022, 11, 1122. [Google Scholar] [CrossRef]
  43. Wang, K.; Dickinson, R.E. A Review of Global Terrestrial Evapotranspiration: Observation, Modeling, Climatology, and Climatic Variability: Global Terrestrial Evapotranspiration. Rev. Geophys. 2012, 50, 1–54. [Google Scholar] [CrossRef]
  44. Filippi, A.M.; Güneralp, İ.; Randall, J. Hyperspectral Remote Sensing of Aboveground Biomass on a River Meander Bend Using Multivariate Adaptive Regression Splines and Stochastic Gradient Boosting. Remote Sens. Lett. 2014, 5, 432–441. [Google Scholar] [CrossRef]
  45. Xu, H.; Wang, M.; Shi, T.; Guan, H.; Fang, C.; Lin, Z. Prediction of Ecological Effects of Potential Population and Impervious Surface Increases Using a Remote Sensing Based Ecological Index (RSEI). Ecol. Indic. 2018, 93, 730–740. [Google Scholar] [CrossRef]
  46. Liao, W.; Jiang, W. Evaluation of the Spatiotemporal Variations in the Eco-Environmental Quality in China Based on the Remote Sensing Ecological Index. Remote Sens. 2020, 12, 2462. [Google Scholar] [CrossRef]
  47. Nie, X.; Hu, Z.; Zhu, Q.; Ruan, M. Research on Temporal and Spatial Resolution and the Driving Forces of Ecological Environment Quality in Coal Mining Areas Considering Topographic Correction. Remote Sens. 2021, 13, 2815. [Google Scholar] [CrossRef]
  48. Chen, Y.; Jia, B.; Wu, J.; Liu, X.; Luo, T. Temporal and Spatial Attractiveness Characteristics of Wuhan Urban Riverside from the Perspective of Traveling. Land 2022, 11, 1434. [Google Scholar] [CrossRef]
  49. Li, L.; Gao, X.; Li, J.; Meng, L.; Wang, Z.; Yang, L. Difference of Usage Behavior between Urban Greenway and Suburban Greenway: A Case Study in Beijing, China. Land 2022, 11, 1245. [Google Scholar] [CrossRef]
  50. Liu, S.; Long, Y.; Zhang, L.; Liu, H. Quantifying and Characterizing Urban Leisure Activities by Merging Multiple Sensing Big Data: A Case Study of Nanjing, China. Land 2021, 10, 1214. [Google Scholar] [CrossRef]
  51. Meng, Y.; Xing, H. Exploring the Relationship between Landscape Characteristics and Urban Vibrancy: A Case StudyUsing Morphology and Review Data. Cities 2019, 95, 102389. [Google Scholar] [CrossRef]
  52. Gomez-Varo, I.; Delclos-Alio, X.; Miralles-Guasch, C. Jane Jacobs Reloaded: A Contemporary Operationalization of Urban Vitality in a District in Barcelona. Cities 2022, 123, 103565. [Google Scholar] [CrossRef]
  53. Zhang, X. Practice Teaching of Landscape Survey Course Based on ECognition Remote Sensing Image Interpretation Technology. Educ. Sci. Theory Pract. 2018, 18, 1411–1423. [Google Scholar] [CrossRef]
  54. Xiong, Y.; Xu, W.; Lu, N.; Huang, S.; Wu, C.; Wang, L.; Dai, F.; Kou, W. Assessment of Spatial–Temporal Changes of Ecological Environment Quality Based on RSEI and GEE: A Case Study in Erhai Lake Basin, Yunnan Province, China. Ecol. Indic. 2021, 125, 107518. [Google Scholar] [CrossRef]
  55. Feng, D.; Tu, L.; Sun, Z. Research on Population Spatiotemporal Aggregation Characteristics of a Small City: A Case Study on Shehong County Based on Baidu Heat Maps. Sustainability 2019, 11, 6276. [Google Scholar] [CrossRef] [Green Version]
  56. Li, Z.; He, Y.; Lu, X.; Zhao, H.; Zhou, Z.; Cao, Y. Construction of Smart City Street Landscape Big Data-Driven Intelligent System Based on Industry 4.0. Comput. Intell. Neurosci. 2021, 2021, 1716396. [Google Scholar] [CrossRef] [PubMed]
  57. Li, Z.; Lin, X.; Han, X.; Lu, X.; Zhao, H. Landscape Efficiency Assessment of Urban Subway Station Entrance Based on Structural Equation Model: Case Study of Main Urban Area of Nanjing. Buildings 2022, 12, 294. [Google Scholar] [CrossRef]
Figure 1. UGI landscape activity measure research framework integrating the ecological index and public vitality index.
Land 11 01879 g001
Figure 2. Location of Zhongshan City and its central city, Guangdong Province, China.
Land 11 01879 g002
Figure 3. Study area and its administrative divisions.
Land 11 01879 g003
Figure 4. Flowchart of UGI interpretation.
Land 11 01879 g004
Figure 5. Flowchart of EI analysis.
Land 11 01879 g005
Figure 6. Flowchart of PVI analysis.
Land 11 01879 g006
Figure 7. The four-quadrant conceptual model of landscape activity.
Land 11 01879 g007
Figure 8. UGI patches interpreted from GF6.
Land 11 01879 g008
Figure 9. UGI spatial pattern components.
Land 11 01879 g009
Figure 10. The overall greening quality of the study area.
Land 11 01879 g010
Figure 11. The ecological index of UGI.
Land 11 01879 g011
Figure 12. Overall public vitality in the study area.
Land 11 01879 g012
Figure 13. UGI public vitality index of the study area.
Land 11 01879 g013
Figure 14. The landscape activity of UGI in the study area.
Land 11 01879 g014
Figure 15. Grading of UGI landscape activity in the study area.
Land 11 01879 g015
Figure 16. The landscape activity map.
Land 11 01879 g016
Figure 17. LA information query for a specific UGI patch.
Land 11 01879 g017
Figure 18. Four-quadrant classification of UGI landscape activity.
Land 11 01879 g018
Table 1. Data sources and processing platforms.
DataYearResolutionData SourceProcessing
Platform
Landsat 8
OLI/TIRS
201930 mUnited States Geological Survey:
https://earthexplorer.usgs.gov/ (accessed on 27 June 2022).
ENVI 5.2
GF-6 PMS20192 mNatural Resources Satellite Remote Sensing Cloud Service
Platform: http://www.sasclouds.com/chinese/normal/ (accessed on 27 June 2022).
ENVI 5.2
Vector data//National Catalogue Service For Geographic Information:
http://www.web-map.cn/ (accessed on 25 June 2022).
/
Baidu heat map20222 mBaidu Huiyan:
https://huiyan.baidu.com/ (accessed on 7 July to 10 July 2022).
ArcGIS 10.7
Table 2. Multiscale segmentation parameters and classification features.
Object
Hierarchy
Segmentation
Scale
Shape
Weight
CompactnessClassification
Target
Classification Feature
and Formula
Layer a30000.10.5Distinguish water
and nonwater
NDWI = ( B Green B Nir ) / ( B Green + B Nir )
Layer b20000.10.5Distinguish UGI and non-UGI NDVI = ( B Nir B Red ) / ( B Nir + B Red )
Table 3. Calculation formulas and descriptions of EI subindices.
Sub-IndexCalculation FormulaFormula Description
Greenness NDVI = ( B Nir B Red ) / ( B Nir + B Red ) BRed, BGreen, BBlue, BNIR, BSWIR1, BSWIR2 corresponding to the respective bands in Landsat 8 OLI images.
In the LST expression,
K1 = 774.89 W·m−2·sr-1·μm−1, K2 = 1321.08 K.
BT is the black-body radiation brightness. In the BT expression, τ is the transmittance of the atmosphere in the thermal infrared band; ε is the land surface emissivity. L is the reflectivity of the thermal infrared band after radiometric calibration. L and L are the upward and downward radiance of the atmosphere, and the value needs to be obtained by querying the relevant atmospheric profile parameters on NASA
(http://atmcorr.gsfc.nasa.gov (accessed on 27 June 2022).).
Wetness WET OLI = 0.1511 × B Blue + 0.1973 × B Green + 0.3283 × B Red + 0.3407 × B Nir 0.7117 × B SWIR 1 0.4559 × B SWIR 1 0.7117 × B SWIR 1 0.4559 × B SWIR 1
Heat LTS = K 2 / ln ( K 2 / B T + 1 ) 237.15
B T = [ L τ ( 1 ε ) L ] / τ ε
Dryness NDBSI = [ SI + IBI ] / 2
SI = ( B SWIR 1 + B Red ) ( B Blue + B Nir ) ( B SWIR 1 + B Red ) + ( B Blue + B Nir )
IBI = 2 × B SWIR 1 / ( B SWIR 1 + B Nir ) B Nir / ( B Nir + B Red ) B Green / ( B Green + B SWIR 1 ) 2 × B SWIR 1 / ( B SWIR 1 + B Nir ) + B Nir / ( B Nir + B Red ) + B Green / ( B Green + B SWIR 1 )
Table 4. Principal component analysis statistics.
PC LayerEigenvaluePercent of EigenvaluesAccumulative Eigenvalues
10.0129973.328973.3289
20.0032718.451191.7801
30.001357.625899.4059
40.000110.5941100.0000
Table 5. Correspondence between population density and alpha channel value.
ColorBlue Light Blue Cyan Green Yellow Orange Red
Value
Population activity density value
(person/hm2)
//≤10>10–20>20–40>40–60>60
Alpha channel value60–132>132–138>138–151>151–163>163–170>170–179>179–194
Table 6. Component statistics of UGI spatial pattern.
Component Type Area (km2) Proportion to the Total
Area of UGI
SumMeanMaximum
Hubs152.361.30100.8186.4%
Links19.300.030.3210.9%
Sites4.770.030.212.7%
Table 7. Statistics of ecological index (EI) and subindices.
IndexNDVIWETNDBSILSTEI
Mean0.8530.5300.7660.5020.68
Maximum0.9280.6330.8240.5950.82
Minimum0.7470.4400.7220.3830.52
PC1 load value0.730.42−0.33−0.42/
Table 8. UGI area and proportion of each greening quality grade.
UGI StatisticsExcellent (0.8–1.0)Good (0.6–0.8)Medium (0.4–0.6)
Grade
Number414115
Total area (km2)114.1259.752.56
Proportion64.7%33.9%1.4%
Average area (km2)28.530.420.17
Table 9. Distribution and typical samples of UGI with a quality grade of “excellent”.
Distribution Map of UGI with a Quality Grade of “Excellent”Sample 1IndexSample 2Index
Land 11 01879 i001Land 11 01879 i002EI = 0.82Land 11 01879 i003EI = 0.81
NDVI = 0.929NDVI = 0.926
WET = 0.560WET = 0.559
NDBSI = 0.733NDBSI = 0.733
LST = 0.404LST = 0.417
Sample 3IndexSample 4Index
Land 11 01879 i004EI = 0.80Land 11 01879 i005EI = 0.80
NDVI = 0.924NDVI = 0.921
WET = 0.569WET = 0.763
NDBSI = 0.729NDBSI = 0.727
LST = 0.438LST = 0.445
Table 10. Distribution and typical samples of UGI with a quality grade of “medium”.
Distribution of UGI with a Quality
Grade of “Medium”
Sample 1 Index Sample 2 Index
Land 11 01879 i008Land 11 01879 i006EI = 0.52Land 11 01879 i007EI = 0.54
NDVI = 0.766NDVI = 0.765
WET = 0.457WET = 0.476
NDBSI = 0.824NDBSI = 0.810
LST = 0.577LST = 0.555
Sample 3IndexSample 4Index
Land 11 01879 i009EI = 0.58Land 11 01879 i010EI = 0.59
NDVI = 0.813NDVI = 0.795
WET = 0.473WET = 0.490
NDBSI = 0.780NDBSI = 0.797
LST = 0.574LST = 0.535
Table 11. UGI area and proportion of each public vitality grade.
UGI StatisticsHigh
(80.13–166.70 persons/hm2)
Middle
(31.12–80.13 persons/hm2)
Low
(0–31.12 persons/hm2)
Grade
Number 266915
Total area (km2) 6.39156.8613.18
Proportion 3.6%88.9%7.5%
Average area (km2) 28.530.420.17
Table 12. Distribution and typical samples of UGI with public vitality grades of “high” and “low”.
GradeHigh Low
Description
Distribution Land 11 01879 i011Land 11 01879 i012
Sample Sample 1 Sample 2 Sample 1 Sample 2
Land 11 01879 i013Land 11 01879 i014Land 11 01879 i015Land 11 01879 i016
Public Vitality
Index
117 persons/hm2 98 persons/hm2 0 person/hm2 0 person/hm2
Table 13. The top 5% of UGI units for landscape activity and their measurements.
No. 1No. 2No. 3No. 4
Land 11 01879 i017Land 11 01879 i018Land 11 01879 i019Land 11 01879 i020
LA = 0.85LA = 0.84LA = 0.77LA = 0.74
No. 5No. 6No. 7No. 8
Land 11 01879 i021Land 11 01879 i022Land 11 01879 i023Land 11 01879 i024
LA = 0.69LA = 0.68LA = 0.61LA = 0.60
Table 14. The bottom 5% UGI units for landscape activity and their measurements.
No. 153No. 154No. 155No. 156
Land 11 01879 i025Land 11 01879 i026Land 11 01879 i027Land 11 01879 i028
LA = 0.11LA = 0.10LA = 0.09LA = 0.09
No. 157No. 158No. 159No. 160
Land 11 01879 i029Land 11 01879 i030Land 11 01879 i031Land 11 01879 i032
LA = 0.09LA = 0.08LA = 0.07LA = 0.06
Table 15. Landscape activity eigenvalue table (partial data).
FIDLAEIPVIWETNDVINDBSILST
10.28 0.69 44 0.541 0.856 0.760 0.504
20.20 0.73 24 0.541 0.889 0.752 0.479
30.23 0.69 44 0.533 0.858 0.765 0.505
40.17 0.75 11 0.578 0.884 0.736 0.491
50.07 0.57 10 0.468 0.794 0.807 0.551
60.15 0.63 22 0.510 0.805 0.783 0.500
........................
The retention digits of the data in the table are determined according to the 1/4 standard deviation of the statistical values.
Table 16. Four types of UGI samples.
TypeHigh-Quality
Mature Type
Low-Quality
Mature Type
Low-Quality
Developing Type
High-Quality
Developing Type
TDescription
Sample Sample 1 Sample 2 Sample 3 Sample 4
Land 11 01879 i033Land 11 01879 i034Land 11 01879 i035Land 11 01879 i036
EI0.760.580.540.76
PVI67 persons/hm278 persons/hm239 persons/hm213 persons/hm2
Publisher’s Note: MDPI stays neutral with regard to jurisdictional claims in published maps and institutional affiliations.

