
County-Level City Shrinkage in China: Representation, Cause, and Response


Abstract
:1. Introduction
2. Literature Review
3. Data Methodology and Case Study
3.1. Data
- (1)
- Version 4 DMSP/OLS Nighttime Lights Time Series dataset (non-radiometrically calibrated) (a total of 34 images shot by six satellites F10, F12, F14, F15, F16, and F18 during 1992–2013) released by the National Oceanic and Atmospheric Administration (NOAA) of America, global radiometrically calibrated NTL products (6 images in total), and VIIRS/DNA synthesized monthly average light radiation dataset (96 images in total during 2013–2020).
- (2)
- Vector data of the administrative division (1:1,000,000) released by the National Geomatics Center of China.
- (3)
- Global location data released by the Tencent Location Big Data platform on 30 August, 13 September, and 27 September 2019.
- (4)
- Data of the fourth (1990), fifth (2000), sixth (2010), and seventh (2020) Zhejiang Province censuses.
- (5)
- Data of the fifth (2000) and sixth (2010) Changshan County censuses.
3.2. Methodology
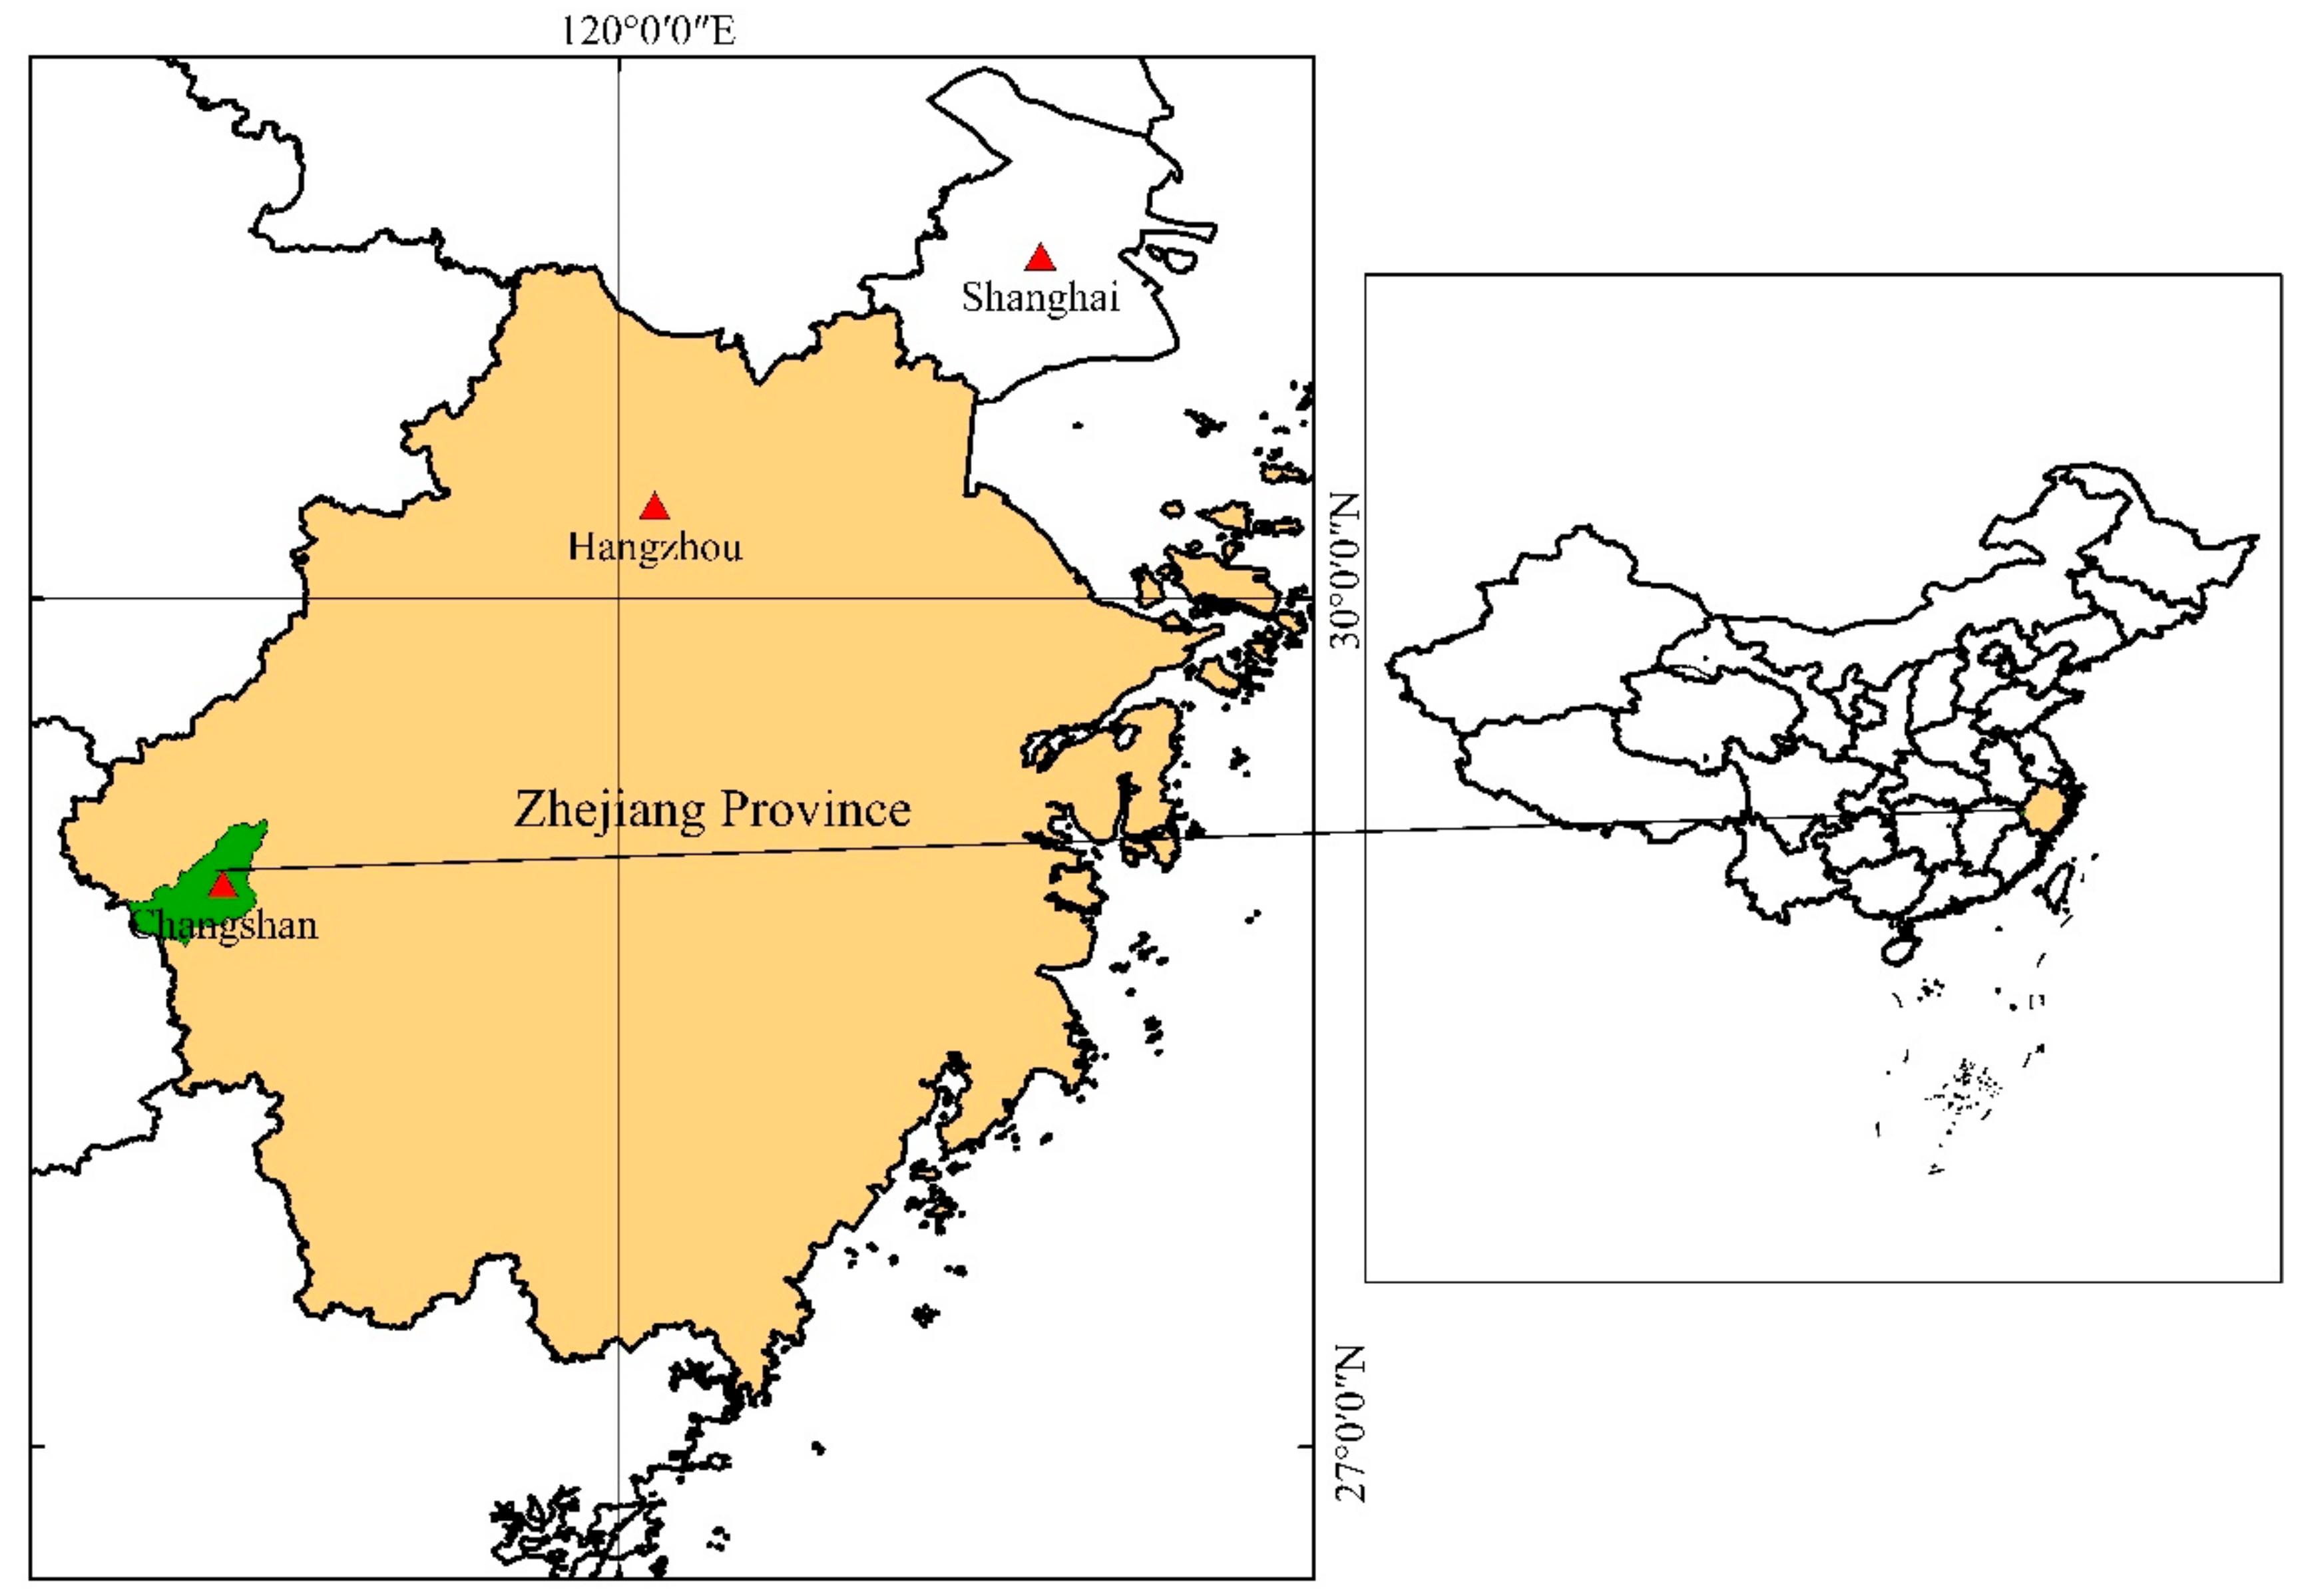
3.3. Research Area
4. County-Level City Shrinkage Representation
4.1. Population Size and NTL Intensity
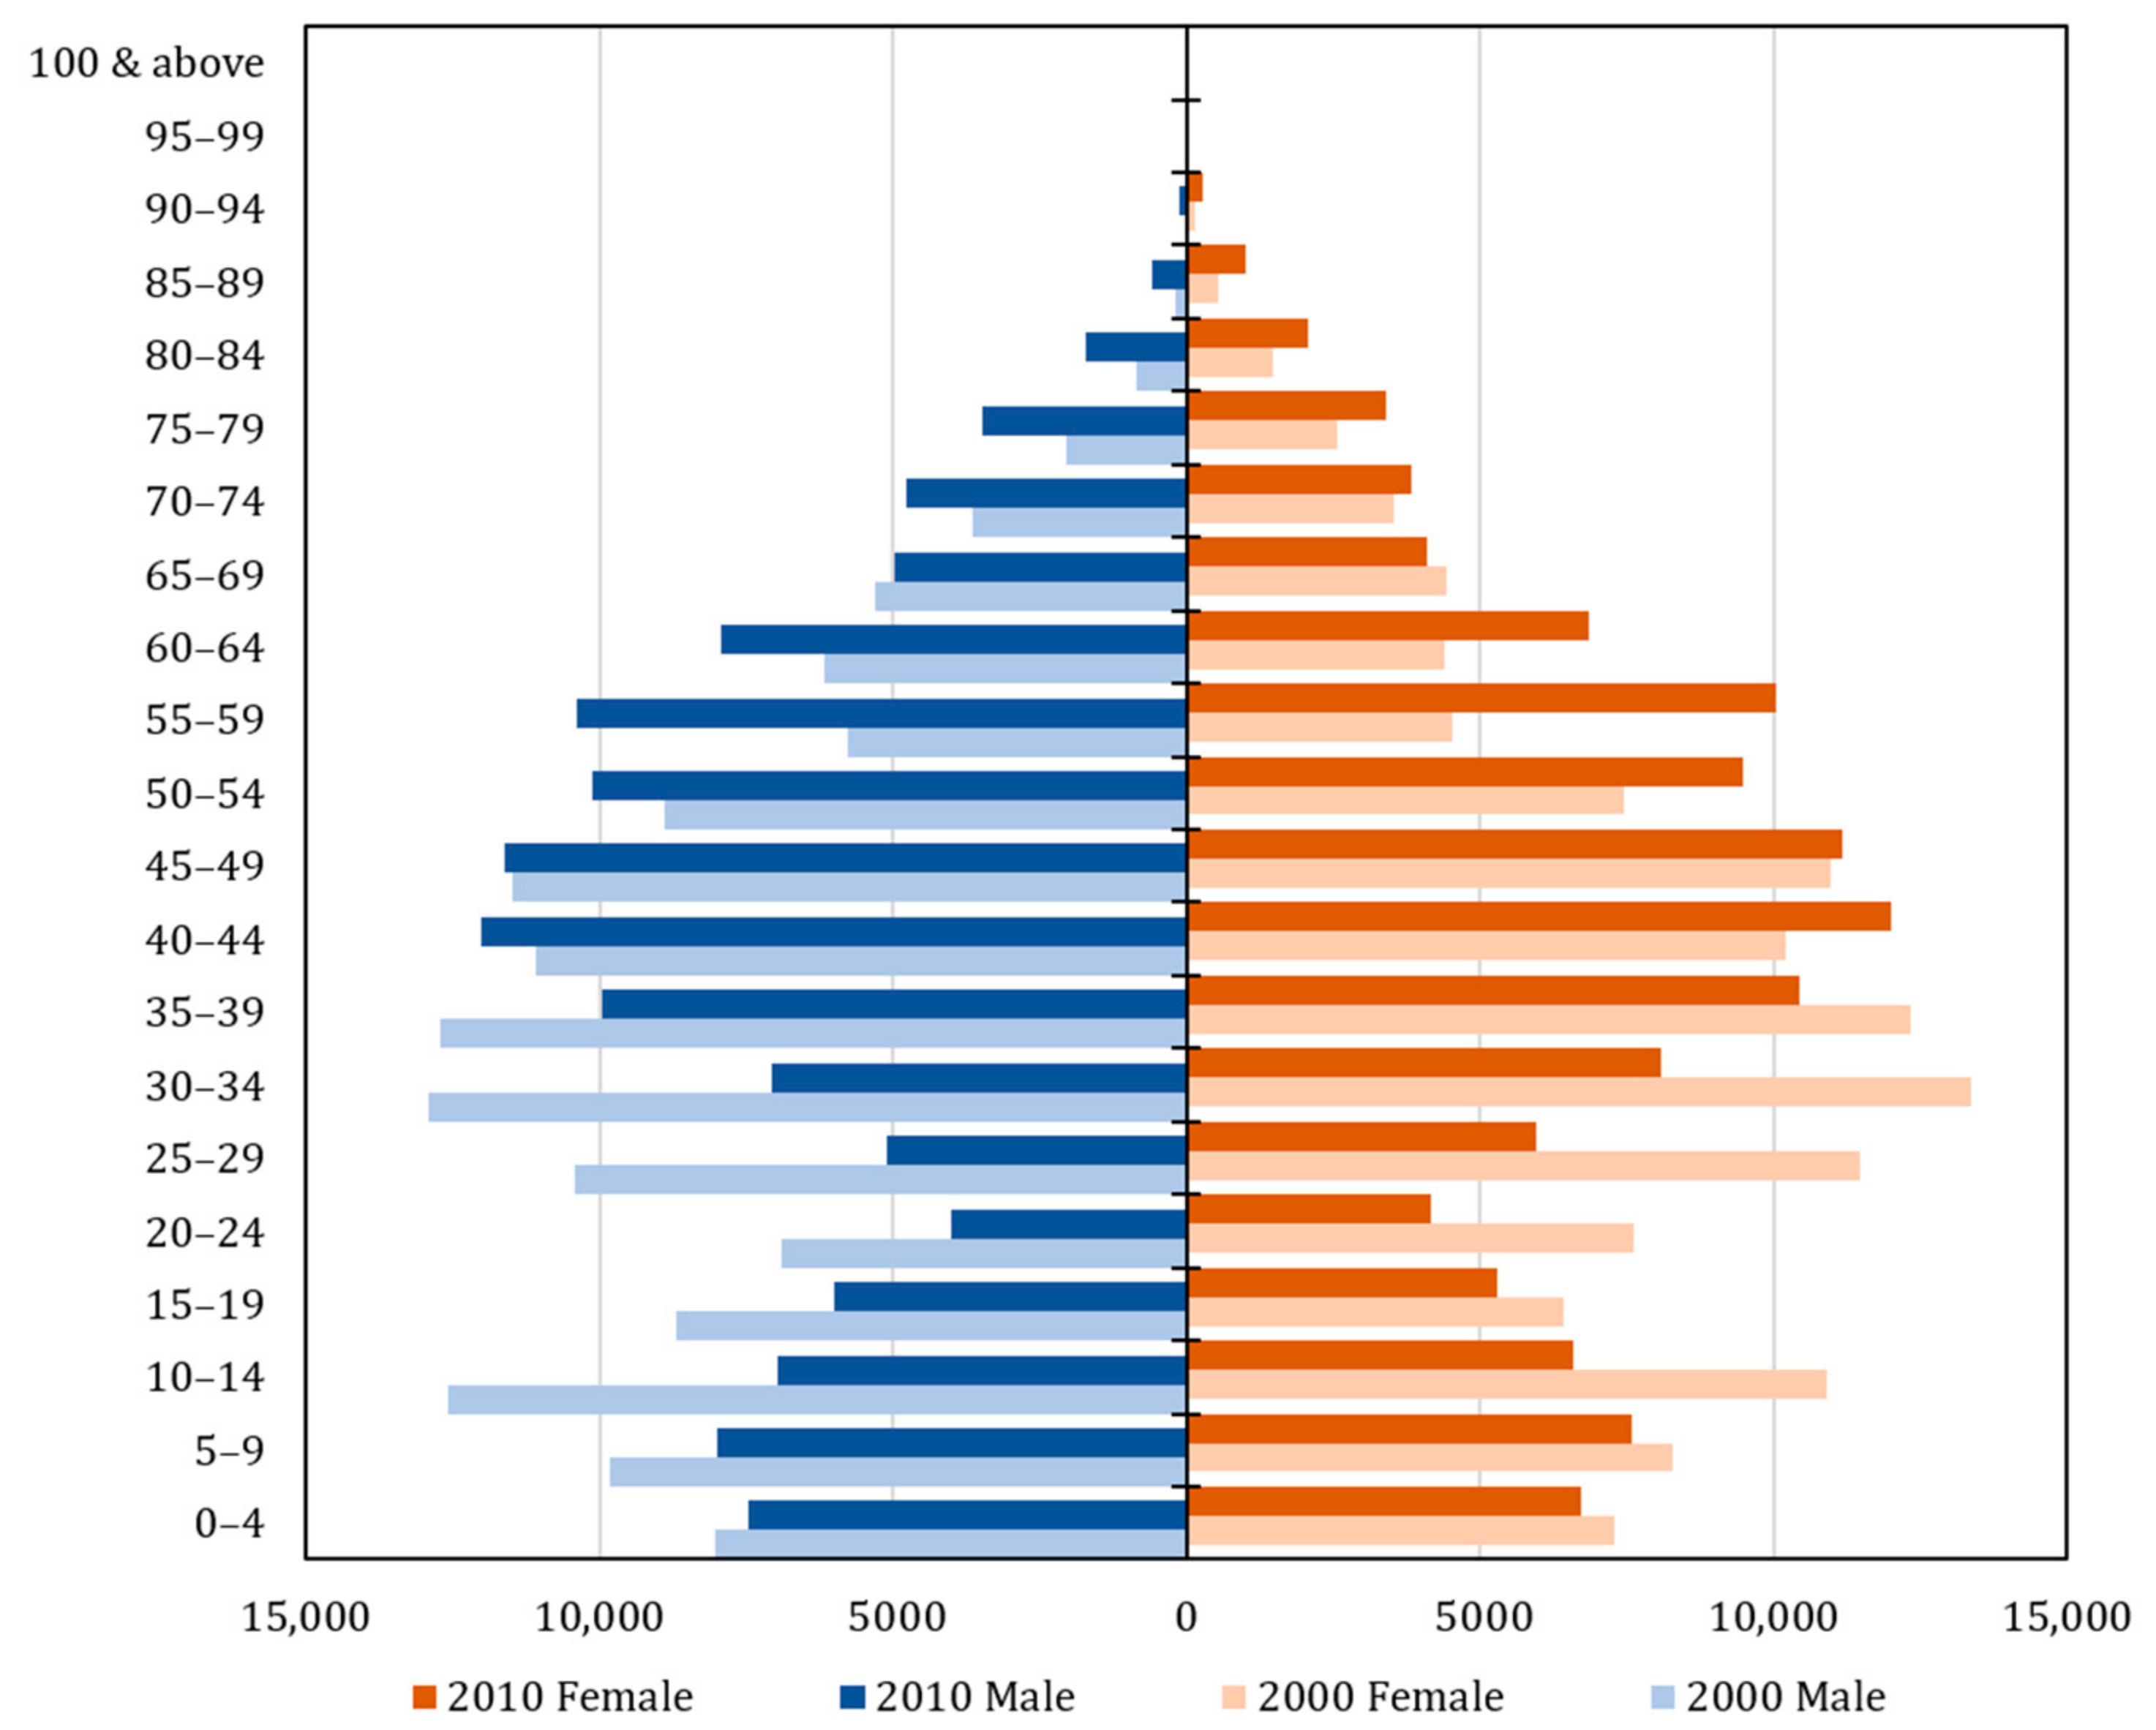
4.2. Population Age Structure
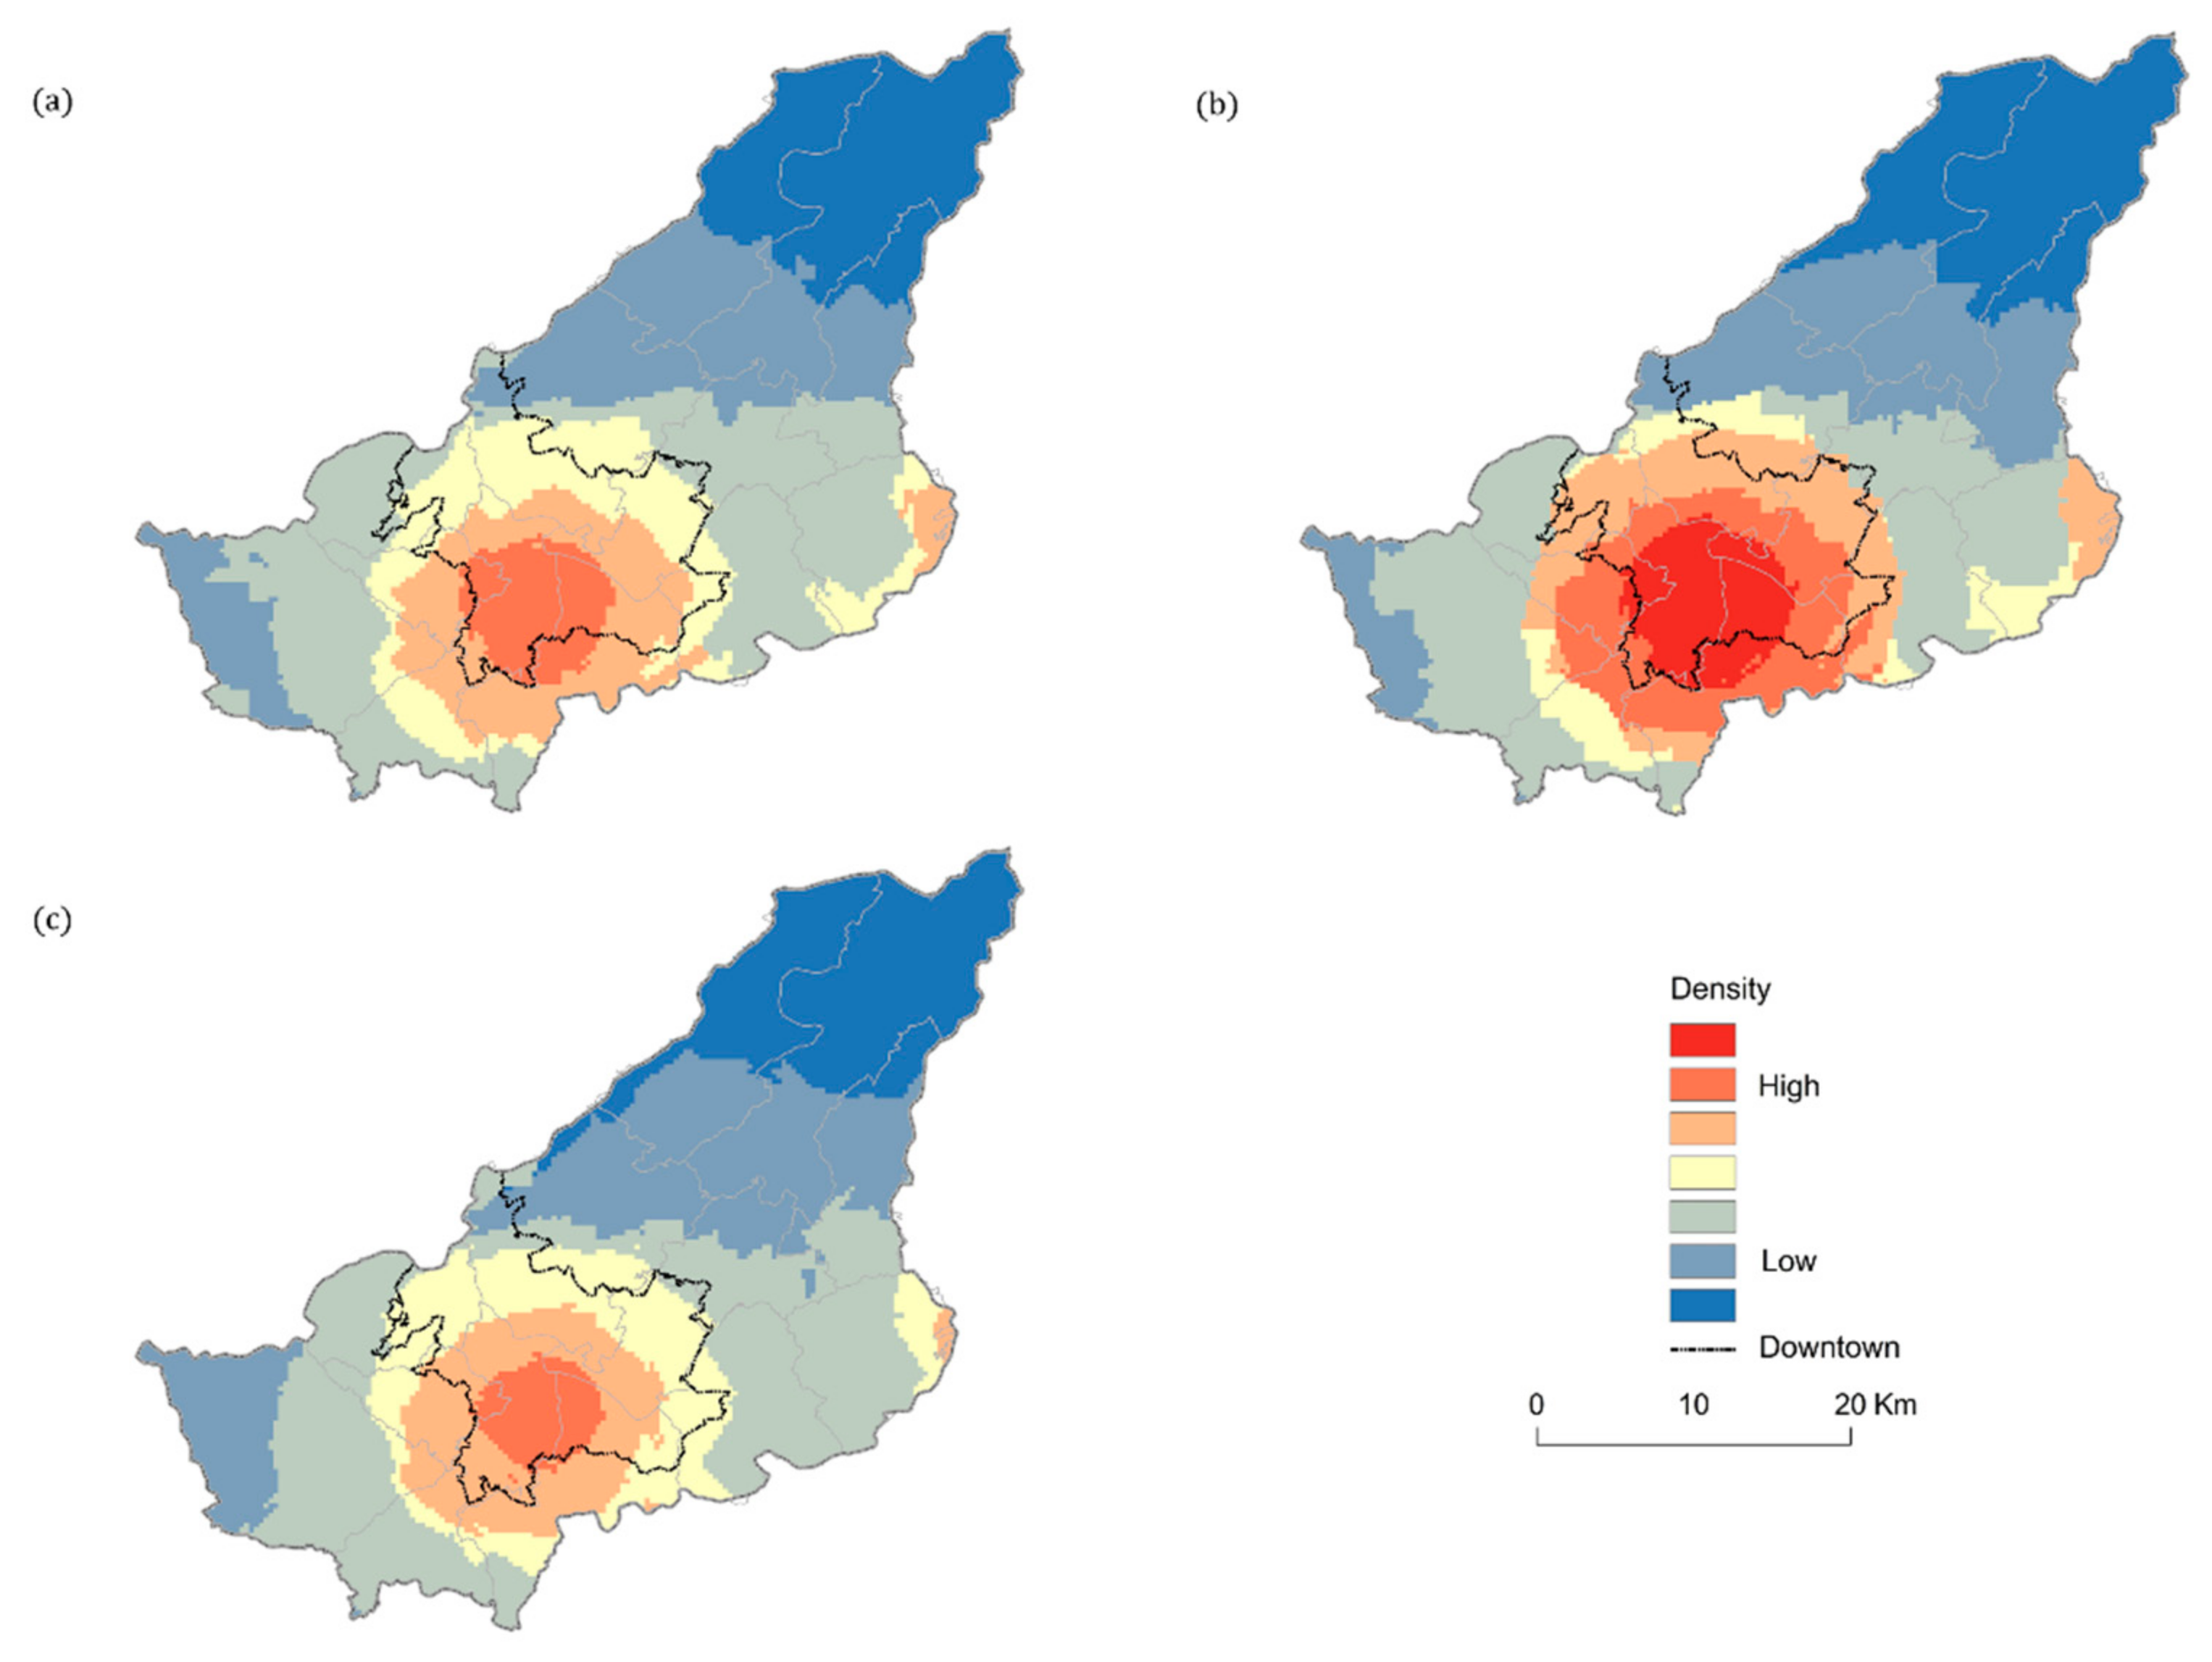
4.3. Population Changes during Holidays and Festivals
5. Analysis on the Causes of County-Level City Shrinking
5.1. Decay of Traditional Industry
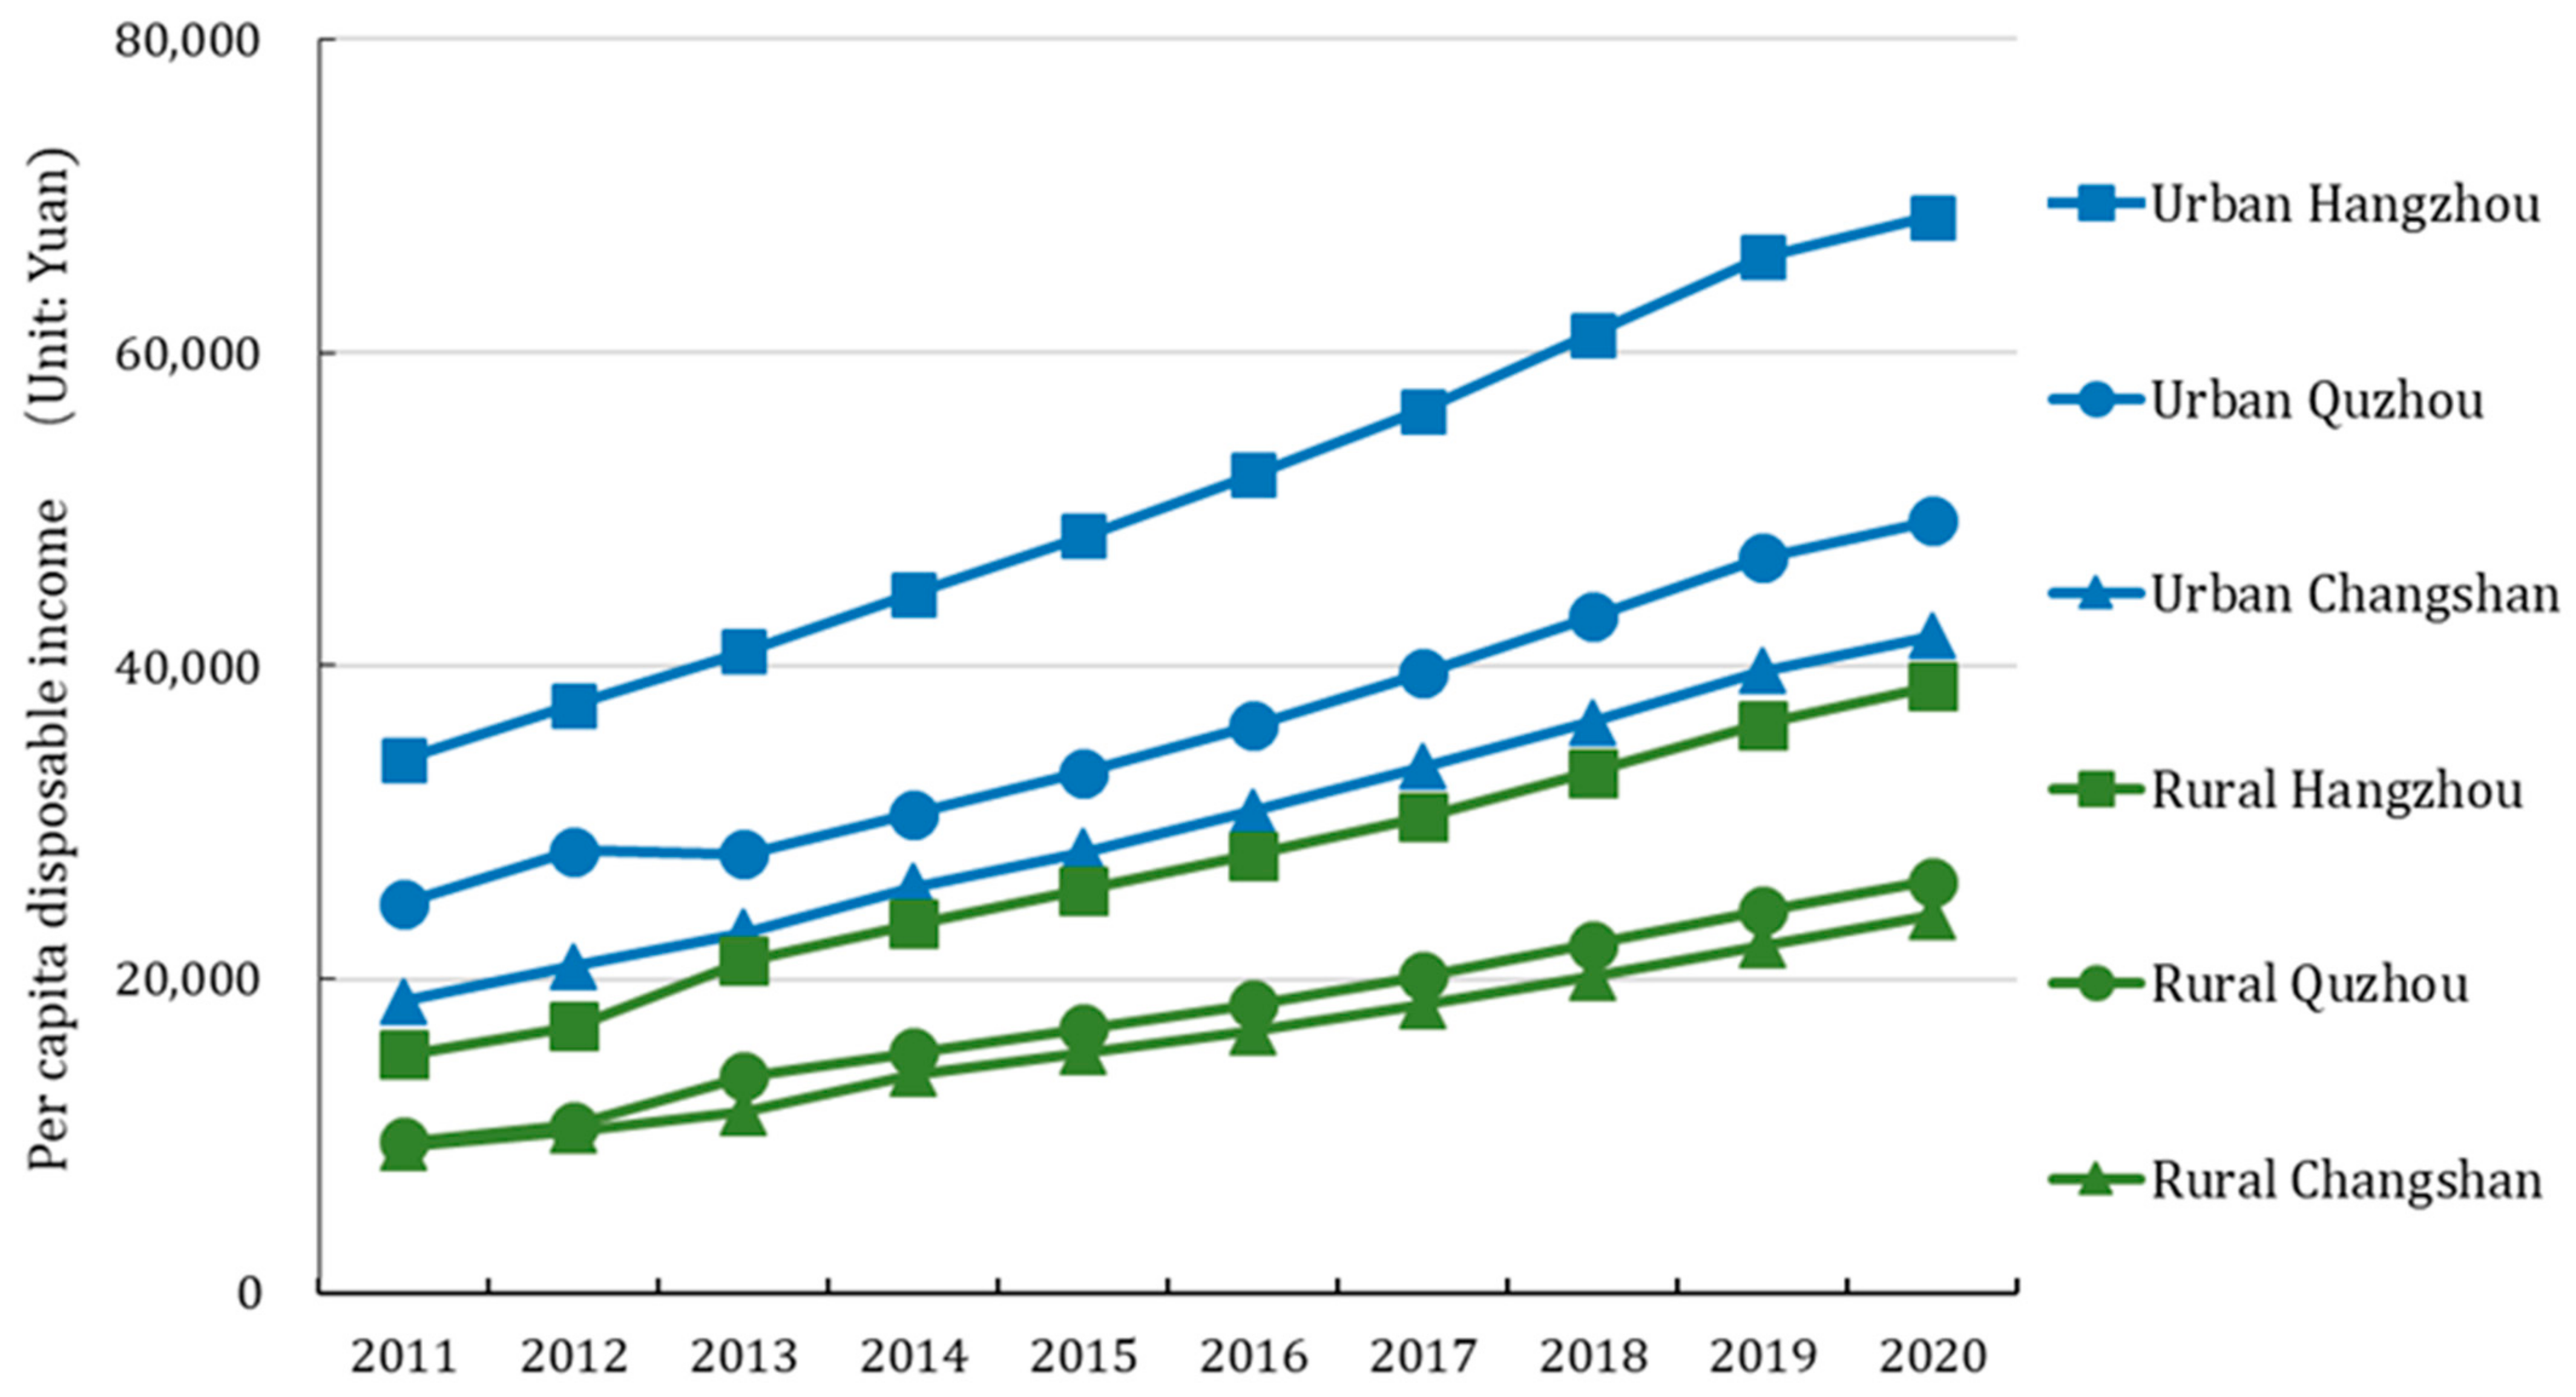
5.2. Widening Gaps in Per Capita Income
5.3. Shortage of Highly Skilled Labor Forces
5.4. Population Age Structure Changes
6. Policy Response to County-Level City Shrinking
6.1. Boost the Upgrading and Transformation of Industrial Structure
6.2. Shaping Compact and Green Urban Space
6.3. Improve Social Governance
6.4. Care for the Elderly
7. Conclusions
Author Contributions
Funding
Institutional Review Board Statement
Informed Consent Statement
Data Availability Statement
Acknowledgments
Conflicts of Interest
References
- Oswalt, P. Shrinking Cities, Vol. 1. International Research; Hantje Cantz: Berlin, Germany, 2005. [Google Scholar]
- Martinez-Fernandez, C.; Kubo, N.; Noya, A.; Weyman, T. Demographic Change and Local Development: Shrinkage, Regeneration and Social Dynamics; OECD Publishing Paris: Paris, France, 2012. [Google Scholar]
- Rieniets, T. Shrinking Cities: Causes and Effects of Urban Population Losses in the Twentieth Century. Nat. Cult. 2009, 4, 231–254. [Google Scholar] [CrossRef]
- Howe, S.R.; Bier, T.; Allor, D.; Finnerty, T.; Green, P. The Shrinking Central City Amidst Growing Suburbs: Case Studies of Ohio’s Inelastic Cities. Urban Geogr. 1998, 19, 714–734. [Google Scholar] [CrossRef]
- Wiechmann, T. Errors Expected—Aligning Urban Strategy with Demographic Uncertainty in Shrinking Cities. Int. Plan. Stud. 2008, 13, 431–446. [Google Scholar] [CrossRef]
- Un-Habitat. State of the World’s Cities 2008/2009: Harmonious Cities; Routledge: Nairobi, Kenya, 2008. [Google Scholar]
- Liang, K. Dilemma of China’s Discourse Power in Economic Globalization and Coutermeasures. Int. Bus. 2014, 2, 111–118. [Google Scholar]
- Meng, X.; Long, Y. Shrinking cities in China: Evidence from the latest two population censuses 2010–2020. Environ. Plan. A Econ. Space 2022, 54, 449–453. [Google Scholar] [CrossRef]
- Wu, Y.; Luo, J.; Zhang, X.; Skitmore, M. Urban growth dilemmas and solutions in China: Looking forward to 2030. Habitat Int. 2016, 56, 42–51. [Google Scholar] [CrossRef] [Green Version]
- Liu, C.; Yang, P. A Comparative Study on the Motivation Mechanism and Performance Characteristics of Chinese and Foreign Shrinking Cities. Mod. Urban Res. 2017, 3, 64–71. [Google Scholar]
- Sun, P.; Wang, K. Identification and stage division of urban shrinkage in the three provinces of Northeast China. Acta Geogr. Sin. 2021, 76, 1366–1379. [Google Scholar]
- Qiao, X. China’s Population Development, Changes and Current Situation, Reference to Data of the Seventh Population Census. Popul. Dev. 2021, 27, 74–88. [Google Scholar]
- The State Council. China to Promote Urbanization through Development of County Seats. Available online: http://english.www.gov.cn/statecouncil/ministries/202205/08/content_WS62771e93c6d02e533532a647.html (accessed on 28 August 2022).
- Yang, Z.; Sun, Y. City Shrinking: Phenomenon, Progress and Problems. Hum. Geogr. 2015, 30, 6–10. [Google Scholar]
- Xu, B. Shrinking Cities and Smart Development: Intrinsic Logical Matching and Reform and Innovation Space for Government Governance and Market Efficiency in Shrinking Small and Medium-Sized Cities. Economist 2019, 12, 34–45. [Google Scholar]
- Yang, Z.; Yang, D. Exploring Shrinking Areas in China Availing of City Development Index. Hum. Geogr. 2019, 34, 63–72. [Google Scholar]
- Long, Y.; Wu, K.; Wang, J. Shrinking Cities in China. Mod. Urban Res. 2015, 9, 14–19. [Google Scholar]
- Alves, D.; Barreira, A.P.; Guimaraes, M.H.; Panagopoulos, T. Historical trajectories of currently shrinking Portuguese cities: A typology of urban shrinkage. Cities 2016, 52, 20–29. [Google Scholar] [CrossRef] [Green Version]
- Wu, K.; Long, Y.; Yang, Y. Urban Shrinkage in the Beijing-Tianjin-Hebei Region and Yangtze River Delta: Pattern, Trajectory and Factors. Mod. Urban Res. 2015, 9, 26–35. [Google Scholar]
- Gao, S.; Long, Y. Distinguishing And Planning Shrinking Cities In Northeast China. Planners 2017, 33, 26–32. [Google Scholar]
- Gao, Z.; Wang, S.; Gu, J. Identification and Mechanisms of Regional Urban Shrinkage: A Case Study of Wuhan City in the Heart of Rapidly Growing China. J. Urban Plan. Dev. 2021, 147, 05020033. [Google Scholar] [CrossRef]
- Liu, Z.; Qi, W.; Qi, H.; Liu, S. The evolution of regional population decline and its driving factors at the county level in China from 1990 to 2015. Geogr. Res. 2020, 39, 1565–1579. [Google Scholar]
- Yang, X.; Ning, X.; Zhao, B. County Level Spatial Planning Strategies and Practice of Resource Based Cities in the Context of Contraction: Lueyang County, Shaanxi Province. Planners 2019, 35, 82–88. [Google Scholar]
- Cunningham-Sabot, E.; Audirac, I.; Fol, S. Theoretical approaches of “shrinking cities”. In Shrinking Cities; Routledge: Nairobi, Kenya, 2013; pp. 30–46. [Google Scholar]
- Häussermann, H.; Siebel, W. Die Schrumpfende Stadt und die Stadtsoziologie. In Soziologische Stadtforschung; VS Verlag für Sozialwissenschaften: Wiesbaden, Germany, 1988; pp. 78–94. [Google Scholar] [CrossRef]
- Downs, A. Some Realities About Sprawl and Urban Decline. Hous. Policy Debate 1999, 10, 955–974. [Google Scholar] [CrossRef]
- Schilling, J.; Logan, J. Greening the Rust Belt A Green Infrastructure Model for Right Sizing America’s Shrinking Cities. J. Am. Plan. Assoc. 2008, 74, 451–466. [Google Scholar] [CrossRef]
- Cunningham-Sabot, E.; Fol, S. Shrinking cities in france and great britain: A silent process? Future Shrinking Cities Probl. Patterns Strateg. Urban Transform. A Glob. Context 2009, 1, 24–35. [Google Scholar]
- Pallagst, K. Shrinking Cities: Planning Challenges from an International Perspective. Urban Infill 2008, 10, 6–16. [Google Scholar]
- Downs, A. Smart Growth: Why We Discuss It More than We Do It. J. Am. Plan. Assoc. 2005, 71, 367–378. [Google Scholar] [CrossRef]
- Wiechmann, T.; Pallagst, K. Urban Shrinkage in Germany and the USA: A Comparison of Transformation Patterns and Local Strategies. Int. J. Urban Reg. 2012, 36, 261–280. [Google Scholar] [CrossRef] [PubMed]
- Oswalt, P.; Rieniets, T. Atlas of Shrinking Cities; Hatje Cantz: Ostfildern, Germany, 2006. [Google Scholar]
- Lötscher, L. Shrinking east German cities? Geograhia Pol. 2005, 78, 79–98. [Google Scholar]
- Beauregard, R.A. Urban Population Loss in Historical Perspective: United States, 1820–2000. Environ. Plan. A Econ. Space 2009, 41, 514–528. [Google Scholar] [CrossRef]
- Martinez-Fernandez, C.; Audirac, I.; Fol, S.; Cunningham-Sabot, E. Shrinking Cities: Urban Challenges of Globalization. Int. J. Urban Reg. 2012, 36, 213–225. [Google Scholar] [CrossRef]
- Haase, A.; Rink, D.; Grossmann, K.; Bernt, M.; Mykhnenko, V. Conceptualizing urban shrinkage. Environ. Plan. A 2014, 46, 1519–1534. [Google Scholar] [CrossRef] [Green Version]
- Matanle, P.; Sato, Y. Coming Soon to a City Near You! Learning to Live ‘Beyond Growth’ In Japan’s Shrinking Regions. Soc. Sci. Jpn. J. 2010, 13, 197–210. [Google Scholar] [CrossRef] [Green Version]
- Boustan, L.P. Was Postwar Suburbanization “White Flight”? Evidence from the Black Migration. Q. J. Econ. 2010, 125, 417–443. [Google Scholar] [CrossRef]
- Azarnert, L.V. Migration, Congestion, And Growth. Macroecon. Dyn. 2019, 23, 3035–3064. [Google Scholar] [CrossRef] [Green Version]
- Pallagst, K.; Aber, J.; Audirac, I.; Cunningham-Sabot, E.; Fol, S.; Martinez-Fernandez, C.; Moraes, S.; Mulligan, H.; Vargas-Hernandez, J.; Wiechmann, T.; et al. The Future of Shrinking Cities: Problems, Patterns and Strategies of Urban Transformation in a Global Context; University of California: Berkeley, CA, USA, 2009. [Google Scholar]
- Barro, R.J.; Sala-I-Martin, X. Public Finance in Models of Economic Growth. Rev. Econ. Stud. 1992, 59, 645–661. [Google Scholar] [CrossRef] [Green Version]
- Reckien, D.; Martinez-Fernandez, C. Why Do Cities Shrink? Eur. Plan. Stud. 2011, 19, 1375–1397. [Google Scholar] [CrossRef]
- Qiao, X.C. Household Registraion System, Urbanization and Great Population Flow. Popul. Econ. 2019, 5, 1–17. [Google Scholar]
- Li, X.; Chen, K.; Guo, X. A Comparison of the Strategies to Cope with Shrinkage in the USA and Germany: Under the Background of Transformation of Growth Orientation Values. Urban Plan. Int. 2015, 30, 81–86. [Google Scholar]
- Deng, J.; Zheng, S.; Li, X. Research on the Strategies to cope with Shrinkage in Germany: A Case Study of “Urban Rebuilding East”. J. Hum. Settl. West China 2018, 33, 13–20. [Google Scholar] [CrossRef]
- Wu, C.; Zhang, X.; Cui, G.; Cui, S. Peri-urban Shrinkage and Expansion: Case Study from China. In Shrinking Cities—International Perspectives and Policy Implications; Pallagst, K., Wiechmann, T., Martinez-Fernandez, C., Eds.; Routledge: London, UK, 2013; pp. 164–185. [Google Scholar]
- Zhang, Y.; Wang, Q.; Fu, Y.; Zhang, F. Identification of Shrinking Cities at Prefecture-Level in China and Its Driving Forces. J. Geomat. 2020, 45, 15–19. [Google Scholar] [CrossRef]
- Gong, P.; Zhang, S.; Wang, W. The Evolutionary Characteristics and Spatial-temporal Pattern of China’s Urban Shrinkage from the Perspective of Population: Based on the Analysis of the Seventh National Census Bulletin Data. Popul. Econ. 2022, 3, 1–15. [Google Scholar]
- Zhang, J.; Feng, C.; Chen, H. International Research and China’s Exploration of Urban Shrinking. Urban Plan. Int. 2017, 32, 1–9. [Google Scholar]
- Li, Q. An Analysis of Push and Pull Factors in the Migration of Rural Workers in China. Soc. Sci. China 2003, 1, 125–136. [Google Scholar]
- Chen, C.; Luo, Z.; He, H. The Progress of the Research on the Shrinkage of Small Towns: Mechanism and Countermeasures. Mod. Urban Res. 2016, 2, 23–28. [Google Scholar]
- Wang, B.Z.K. The Differences between County, County-level City and Municipal District in the System of Administrative Divisions in China. J. Geogr. Res. 2022, 5, 25–38. [Google Scholar]
- Li, X.; Wu, K.; Long, Y.; Li, Z.; Luo, X.; Zhang, X.; Wang, D.; Yang, D.; Gui, Y.; Li, Y.; et al. Academic debates upon shrinking cities in China for sustainable development. Geogr. Res. 2017, 36, 1997–2016. [Google Scholar]
- Liu, Y.; Zhou, P. Analysis on the Spatial Scale of Urban Shrinking in China and Identification of Typical Shrinking Patterns (in Chinese). Beijing Plan. Rev. 2019, 3, 42–47. [Google Scholar]
- Sun, P. Urban shrinkage: Connotation-sinicization-framework of analysis. Prog. Geogr. 2022, 41, 1478–1491. [Google Scholar] [CrossRef]
- Guan, D.; He, X.; Hu, X. Quantitative identification and evolution trend simulation of shrinking cities at the county scale, China. Sustain. Cities Soc. 2021, 65, 102611. [Google Scholar] [CrossRef]
- Zhang, H.; Chen, M.; Liang, C. Urbanization of county in China: Spatial patterns and influencing factors. J. Geogr. Sci. 2022, 32, 1241–1260. [Google Scholar] [CrossRef]
- Zhao, D.; Zhang, J. Shrinking city characterized by competitiveness: Phenomenon, mechanism, and countermeasures: Taking Sheyang City for example. Urban Probl. 2018, 3, 12–18. [Google Scholar]
- Pallagst, K.; Wiechmann, T. Shrinking Smart? Städtische Schrumpfungsprozesse in den USA. Jahrb. Stadtregion 2005, 5, 105–127. [Google Scholar] [CrossRef]
- Kuznets, S. National income and industrial structure. Econom. J. Econom. Soc. 1949, 17, 205–241. [Google Scholar] [CrossRef]
- Gan, C.; Zheng, R.; Yu, D. An Empirical Study on the Effects of Industrial Structure on Economic Growth and Fluctuations in China. Econ. Res. J. 2011, 46, 4–16+31. [Google Scholar]
- Lin, J.Y.; Wang, Y. Remodeling Strucural Change. In The Oxford Handbook of Structural Transformation; Monga, C., Lin, J.Y., Eds.; Oxford University Press: Oxford, UK, 2019; pp. 70–96. [Google Scholar]
- Chen, X.; Deng, S. China’s Economic Growth and Industrial Structure Changes in the 40 Years of Reform and Opening Up. Mod. Econ. Res. 2019, 2, 11–18. [Google Scholar] [CrossRef]
- Liu, W.; Li, S. Industrial Structure and Economic Growth. China Ind. Econ. 2002, 5, 14–21. [Google Scholar] [CrossRef]
- Xu, K.; Chen, F.; Liu, X. The Truth of China Economic Growth: Evidence from Global Night-time Light Data. Econ. Res. J. 2015, 9, 17–29. [Google Scholar]
- Elvidge, C.D.; Cinzano, P.; Pettit, D.R.; Arvesen, J.; Sutton, P.; Small, C.; Nemani, R.; Longcore, T.; Rich, C.; Safran, J.; et al. The Nightsat mission concept. Int. J. Remote Sens. 2007, 28, 2645–2670. [Google Scholar] [CrossRef]
- Doll, C.; Muller, J.P.; Morley, J. Mapping regional economic activity from night-time light satellite imagery. Ecol. Econ. 2006, 57, 75–92. [Google Scholar] [CrossRef]
- Wang, Q.; Yuan, T.; Zheng, X. GDP Gross Analysis at Province-Level in Chine Based on Night-Time Lightsatellite Imagery. Urban Dev. Stud. 2013, 20, 44–48. [Google Scholar]
- Cao, Z.; Wu, Z.; Mi, S.; Yang, K. A Method for Classified Correction of Stable DMSP/OLS Nighttime Light Imagery Across China. J. Earth Inf. Sci. 2020, 22, 246–257. [Google Scholar]
- Liang, L.; Bian, J.; Li, A.; Feng, W.; Lei, G.; Zhang, Z.; Zuo, J. Consistent intercalibration of nighttime light data between DMSP/OLS and NPP/VIIRS in the China-Pakistan Economic Corridor. J. Remote Sens. 2020, 24, 149–160. [Google Scholar]
- Long, Y.; Wu, K. Several Emerging Issues of China’s Urbanization: Spatial Expansion, Population Shrinkage, Low-density Human Activities and City Boundary Delimitaion. Urban Plan. Forum. 2016, 2, 72–77. [Google Scholar]
- Long, Y.; Liu, L. Four Transformations of Chinese Quantitative Urban Research in the New Data Environment. Urban Plan. Int. 2017, 32, 64–73. [Google Scholar] [CrossRef] [Green Version]
- Qin, X.; Zhen, F.; Xiong, L.; Zhu, S. Methods in urban temporal and spatial behavior research in the Big Data Era. Prog. Geogr. 2013, 32, 1352–1361. [Google Scholar]
- Kwan, M.-P.; Lee, J. Geovisualization of human activity patterns using 3D GIS: A time-geographic approach. Spat. Integr. Soc. Sci. 2004, 27, 721–744. [Google Scholar]
- Wang, A.; Zhang, A.; Chan, E.H.W.; Shi, W.; Zhou, X.; Liu, Z. A Review of Human Mobility Research Based on Big Data and Its Implication for Smart City Development. ISPRS Int. J. Geo Inf. 2021, 10, 13. [Google Scholar] [CrossRef]
- Gao, J.; Zhang, Z.; Li, W.; Sun, F.; Hu, Y.; Wang, L.; Fu, J.; Li, X.; Cheng, G. Urban Sustainable Development Evaluation with Big Earth Data: Data, Indicators, and Methods. Bull. Chin. Acad. Sci. 2021, 36, 940–949. [Google Scholar] [CrossRef]
- Becker, R.A.; Caceres, R.; Hanson, K.; Loh, J.M.; Urbanek, S.; Varshavsky, A.; Volinsky, C. A tale of one city: Using cellular network data for urban planning. IEEE Pervasive Comput. 2011, 10, 18–26. [Google Scholar] [CrossRef]
- Zhang, W.; Chong, Z.; Li, X.; Nie, G. Spatial patterns and determinant factors of population flow networks in China: Analysis on Tencent Location Big Data. Cities 2020, 99, 102640. [Google Scholar] [CrossRef]
- Wang, X.; Wang, H.; Li, Q. Location Based Big Data Analysis of the Short-term Population Flow of Beijing, Tianjin and Hebei Urban Agglomeration. J. Dalian Univ. Technol. (Soc. Sci.) 2017, 38, 105–113. [Google Scholar] [CrossRef]
- Zhao, J. Retrospect and Prospect of the Development of China’s State-owned Enterprises in the Past Seventy Years. Shandong Soc. Sci. 2019, 9, 75–80. [Google Scholar] [CrossRef]
- Yan, S.; Zhan, X. The Dilemma Faced by State-owned Enterprises in Chanshan County, Zhejinag Province. Zhejiang Financ. 1997, 7, 39. [Google Scholar]
- Zheng, Y. Analysis of the Growth of Industrial Enterprises Output Value in Changshan County. Mod. Econ. Inf. 2014, 17, 476. [Google Scholar]
- Jin, B.; Lu, T.; Deng, Z. Transformation and Upgrading of China’s Industrial Structure: Process, Issues and Trends. China Ind. Econ. 2011, 2, 5–15. [Google Scholar]
- Wiechmann, T.; Bontje, M. Responding to Tough Times: Policy and Planning Strategies in Shrinking Cities. Eur. Plan. Stud. 2015, 23, 1–11. [Google Scholar] [CrossRef]
- Mallach, A. What we talk about when we talk about shrinking cities: The ambiguity of discourse and policy response in the United States. Cities 2017, 69, 109–115. [Google Scholar] [CrossRef]
- Wang, L. Countermeasures ofTransformation and Upgrading of Large Health Industry in Southeast Jilin Province. J. Tonghua Norm. Univ. 2017, 38, 65–68. [Google Scholar] [CrossRef]
- Yuwei, W.; Ruifeng, L.; Lingjuan, H.; Dongmei, G.; Zhanquan, W.; Dongmei, G.; Jing, Z.; Qi, L.; Pengyue, S.; Fangyuan, Y. Analysis on the Current Situation of Domestic Health Food in China. J. Food Nutr. Sci. 2016, 4, 65–69. [Google Scholar] [CrossRef]
- Chen, C.; Zhao, S.; Pei, Z.; Zeng, H.; Li, S.; Wang, G.; Bi, C.; Yang, B. The current situation of the grapefruit industry in Changshan County and suggestions for development countermeasures. Zhejiang Ganju 2018, 35, 2–7. [Google Scholar] [CrossRef]
- Shi, X. Discussion of the Triple Logic and Path of Manufacturing Digital Transformation. Contemp. Econ. Manag. 2022, 9, 48–56. [Google Scholar]
- Liu, Q.; Lin, L.; Fang, Y. Changshan: Digital Transformation Empowers Intelligent Manufacturing. Informatiz. Constr. 2021, 5, 41. [Google Scholar]
- Zhang, J.; Zhao, D.; Chen, H. Termination of Growth Supremacism and Transformation of China’s Urban Planning. City Plan. Rev. 2013, 37, 47–55. [Google Scholar]
- Luan, Z.; Luan, Z. Adaptation Strategies and Spatial Reorganizations of City Shrinkage Era: Focus on Compact and Network City Planning in Japan. Trop. Geogr. 2019, 39, 37–49. [Google Scholar]
- Raed, A.A. Rehabilitation of industrial sites: Economical and social aspects. J. Eng. Appl. Sci. 2018, 13, 5688–5691. [Google Scholar]
- Yu, T. Research on the operation status and countermeasures of unemployment insurance in China. Investig. Entrep. 2021, 32, 222–225. [Google Scholar]
- Ma, Z.; Chen, Q. Re-exploration of the Guarantee Function of the Unemployment Insurance System: A Case Study of Quzhou City, Zhejiang Province. Chin. Hum. Resour. Soc. Secur. 2014, 12, 39–40. [Google Scholar]
- Shi, J.; Wang, Y. On the Construction of Old-age Spiritual Security System. Soc. Secur. Stud. 2013, 2, 3–15. [Google Scholar]


| Year | 1953 | 1964 | 1982 | 1990 | 2000 | 2010 | 2020 |
|---|---|---|---|---|---|---|---|
| Population size (ten thousand people) | 13.92 | 18.87 | 28.60 | 30.00 | 26.55 | 24.14 | 26.00 |
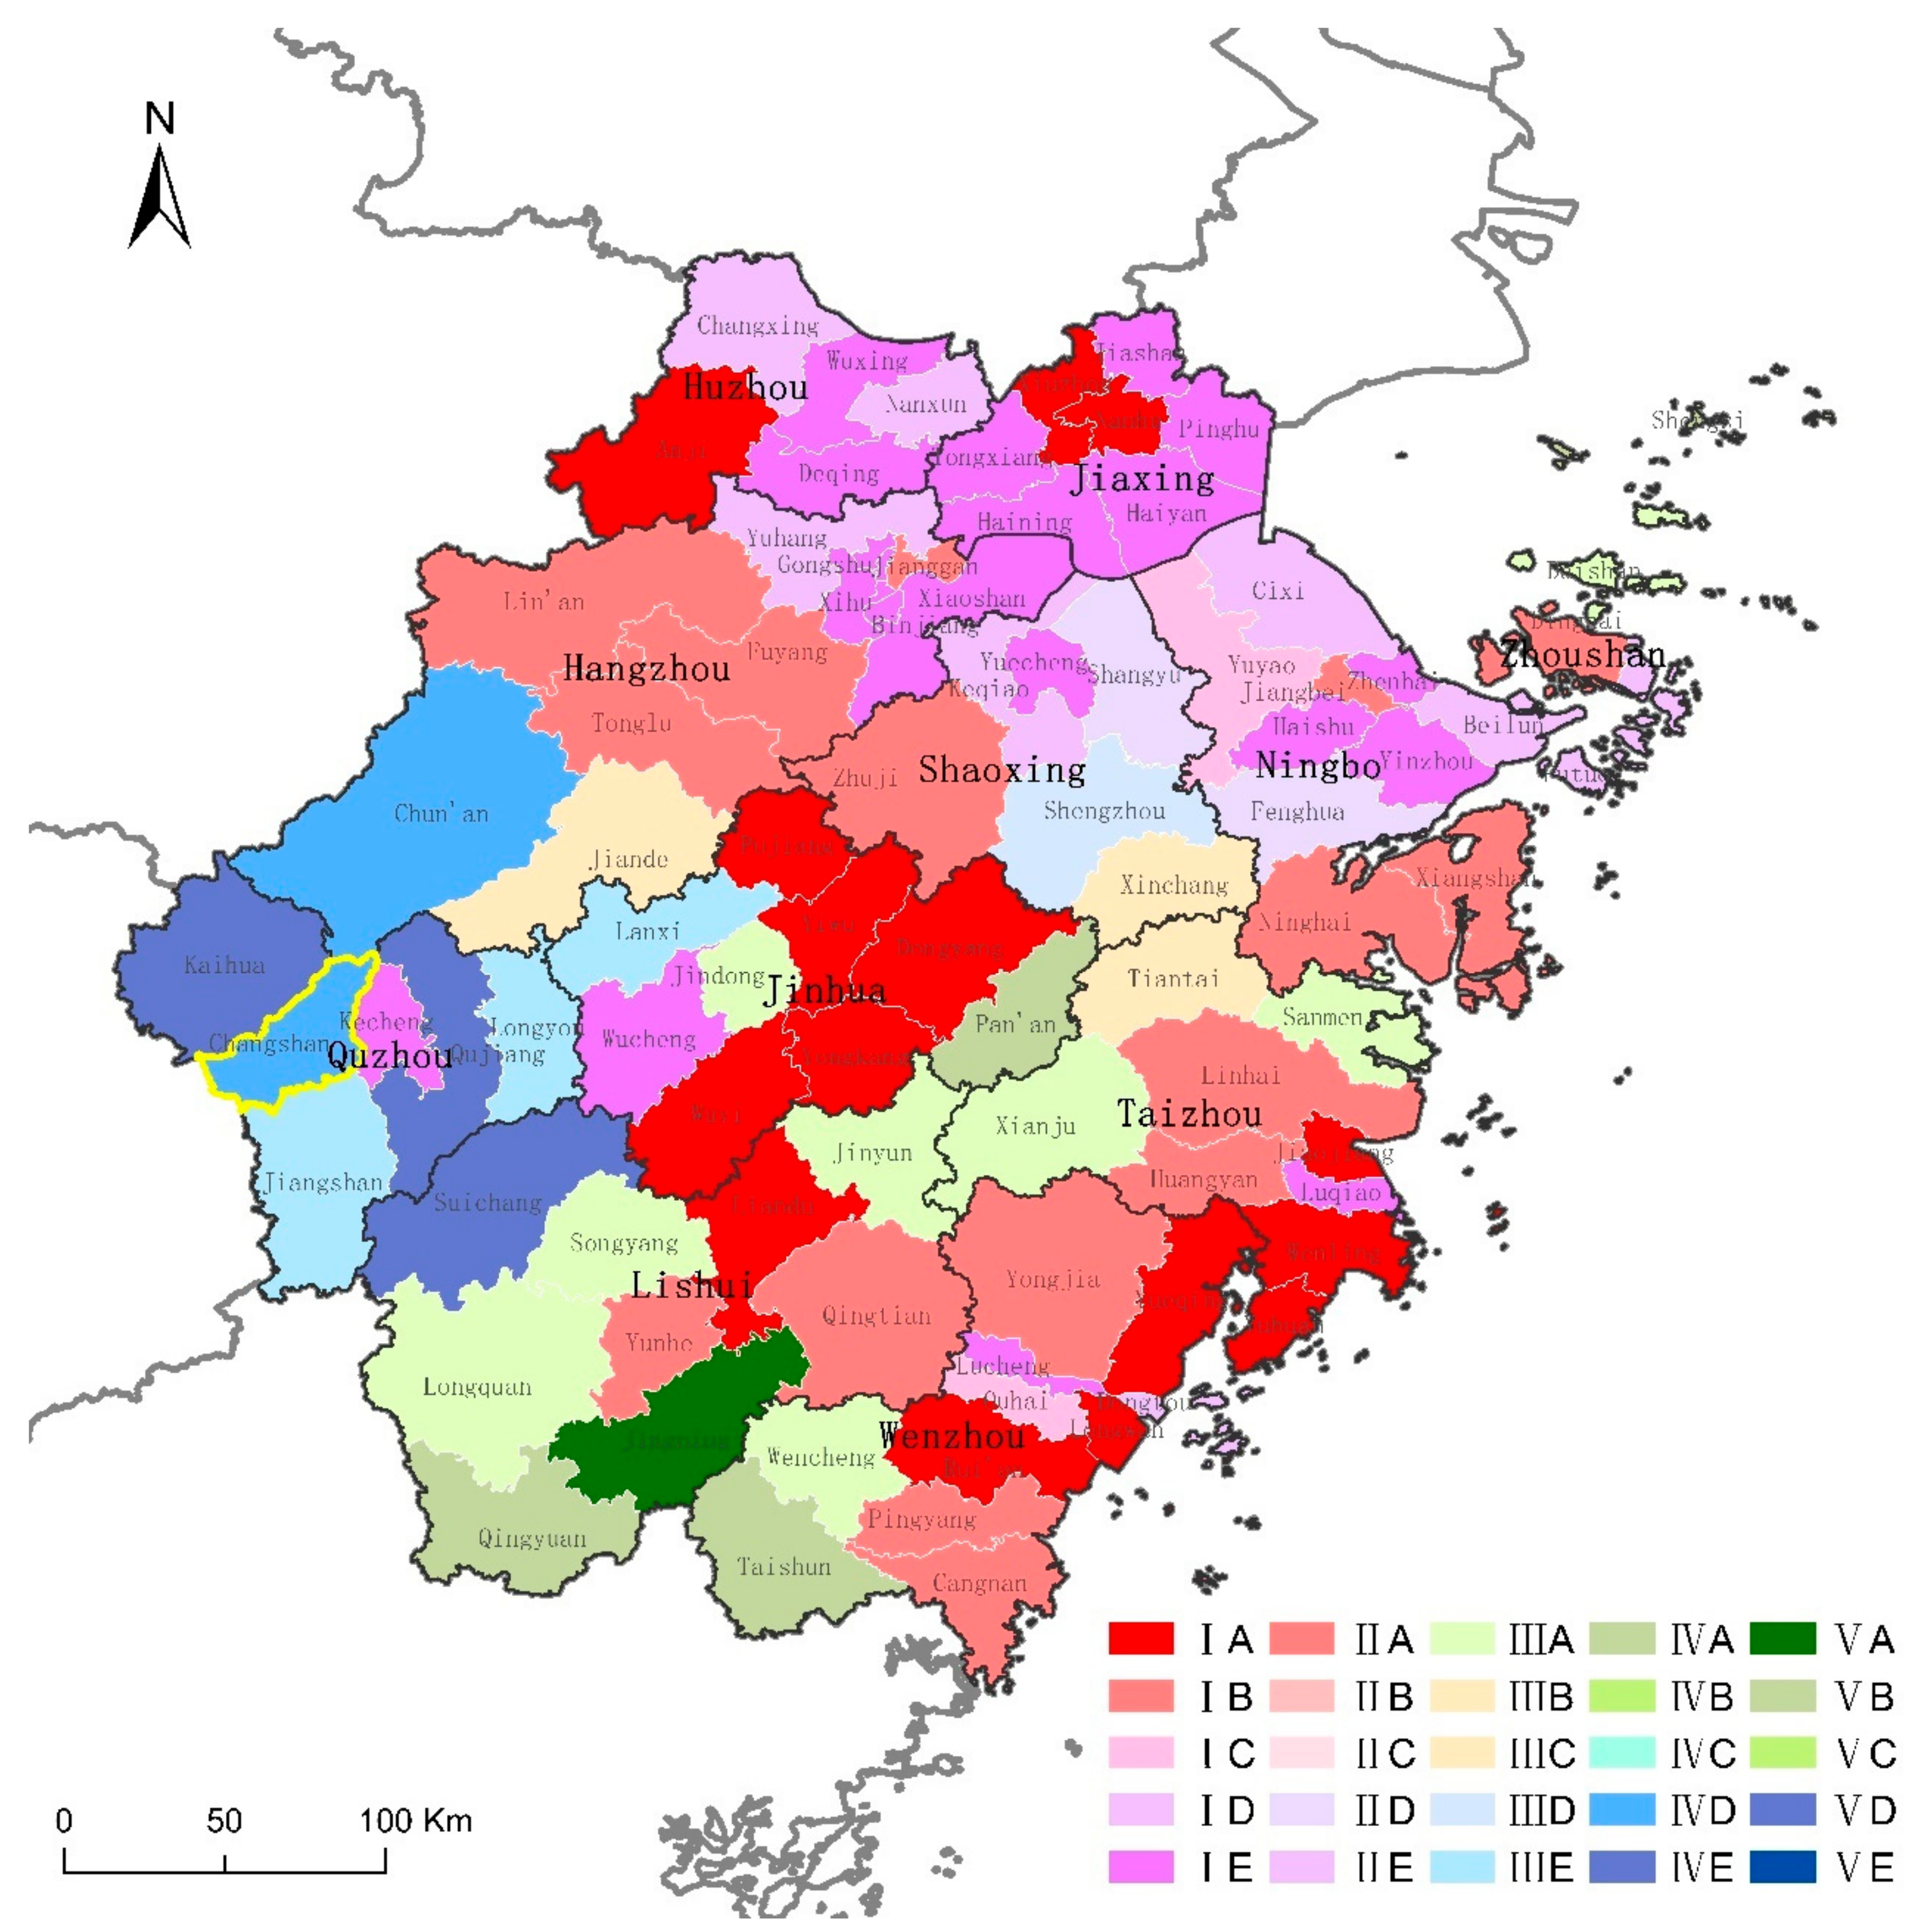
| I | II | III | IV | V | |
|---|---|---|---|---|---|
| A | 14 | 12 | 8 | 4 | 1 |
| B | 5 | 0 | 1 | 0 | 0 |
| C | 2 | 0 | 2 | 0 | 0 |
| D | 3 | 2 | 1 | 2 | 0 |
| E | 20 | 6 | 3 | 3 | 0 |
| Population Change (% P.A.) | NTL Intensity Growth Ratio | |
|---|---|---|
| Chun’an (IVD) | −0.93 | 8.80 |
| Qujiang (IVE) | −0.95 | 8.06 |
| Changshan (IVD) | −0.48 | 8.82 |
| Kaihua (IVE) | −0.80 | 7.66 |
| Suichang (IVE) | −0.47 | 8.11 |
| Zhejiang | 1.48 | 9.57 |
Publisher’s Note: MDPI stays neutral with regard to jurisdictional claims in published maps and institutional affiliations. |
© 2022 by the authors. Licensee MDPI, Basel, Switzerland. This article is an open access article distributed under the terms and conditions of the Creative Commons Attribution (CC BY) license (https://creativecommons.org/licenses/by/4.0/).
Share and Cite
Chen, D.; Wu, Y.; Lin, Z.; Xu, Z. County-Level City Shrinkage in China: Representation, Cause, and Response. Land 2022, 11, 1845. https://doi.org/10.3390/land11101845
Chen D, Wu Y, Lin Z, Xu Z. County-Level City Shrinkage in China: Representation, Cause, and Response. Land. 2022; 11(10):1845. https://doi.org/10.3390/land11101845
Chicago/Turabian StyleChen, Dingpan, Yuzhe Wu, Zhou Lin, and Zhiyi Xu. 2022. "County-Level City Shrinkage in China: Representation, Cause, and Response" Land 11, no. 10: 1845. https://doi.org/10.3390/land11101845