Article

Locational Dynamics of Luxury Hotels in Shanghai Metropolis, China: A Spatial-Temporal Perspective

Key Research Institute of Yellow River Civilization and Sustainable Development & Collaborative Innovation, Center on Yellow River Civilization Jointly Built by Henan Province and Ministry of Education, Henan University, Kaifeng 475001, China
*
Author to whom correspondence should be addressed.
Land 2022, 11(10), 1690; https://doi.org/10.3390/land11101690
Submission received: 31 August 2022 / Revised: 24 September 2022 / Accepted: 26 September 2022 / Published: 29 September 2022
(This article belongs to the Special Issue Urban Land Development in the Process of Urbanization)

Abstract

:
This study aims to investigate the spatial associations of luxury hotels by using geographical information system (GIS) tools and the multiscale geographically weighted regression (MGWR) model to examine the relationships between the distribution of luxury hotels and exogenous (regional) determinants of urban subdistricts in which the luxury hotels are located. Shanghai City is used as an example. The study first introduces the spatial-temporal characteristics of luxury hotels in Shanghai City, and the key exogenous determinants that contribute to luxury hotel location choice are identified with the MGWR model. The nearest neighbor index decreased from 1.01 to 0.47 and Moran’s I statistics increased from 0.268 to 0.452, revealing that the spatial-temporal evolution pattern of luxury hotels presents a cluster trend from 1995 to 2015. The significance level of the standard regression coefficient shows that the institutional proximity, room rate, green space and the World Expo are the primary determining factors that influence the distribution of luxury hotels in Shanghai City. The analysis is important theoretically, as it presents new and novel methodologies for shedding light on the influencing factors of the locational dynamics of luxury hotels. Meanwhile, it enriches the methodologies for analyzing the relationships between luxury hotels and urban structures, and it is important for practitioners, as it provides strategic information that would enable them to globally select appropriate locations for luxury hotels.

1. Introduction

Locational choice has been listed as one of the most influential factors for a hotel’s long-term business prosperity and success [1,2,3]. A superior location is significantly associated with higher demand [4], customer purchasing intention [5], and thus higher revenue, better performance and market profitability [6] and elevated customer satisfaction [7]. In contrast, poor choices of locations increase capital costs, reduce hotel performance, and increase failure rates [8]. Once a hotel is located in a spatial location, relocating it will incur great cost [9]. As such, an understanding of the spatial-temporal dynamics of the location choices of hotels and the potential factors, consisting of a superior location, is of great importance for the hotel industry and urban development. On one hand, the analysis of hotel location can help local governments and tourism organizations better develop and implement strategies to attract new hotels, which will facilitate local economic development [10]. For the urban planners, the study of hotel location choices facilitates the understanding of urban spatial structures and their dynamics [11]. On the other hand, an understanding of the spatial-temporal evolution of hotel location is important for private hotel investors to understand hotel market competition and equilibrium [12].
Although the significance of hotel location is self-evident, the hotel location choice is a highly complex process, involving multi-faceted factors that are often difficult to measure [13]. A large body of literature has been devoted to deciphering hotel location patterns and mechanisms through different perspectives and disciplines, such as tourism and hospitality management, geography, economics, marketing, and urban planning. Moreover, theories of different disciplines have been introduced to shed light on hotels’ location selection, such as geographical theories [14,15], economic theories [16] and marketing theories [9,17]. Several research methodologies, such as qualitative descriptions, the zoning regression model and discrete choice model, have been employed to calculate the pattern of hotel location or mechanisms and summarize the refined hotel location rule based on empirical observations [18,19,20]. Linear regression has been dominantly used to recognize the preferred site with considerable potential in most existing empirical studies [12], but the limitations associated with simple linear regression result in failure to consider spatial dependency and spatial heterogeneity [21]. To bridge this research gap, significant demand has arisen regarding the use of GIS tools and spatial statistical models to investigate the spatial relationships between hotel location distribution and related factors.
Although the importance of hotel location selections has been long recognized by members of both academia and industry, the relationship between regional factors and hotel locations requires careful consideration. Only a single or a very limited set of location factors have been investigated by researchers [10] and these factors mainly include municipal regulations [22], hotel characteristics, and market positioning [15,23]. These studies were restricted to specific regions or destinations [6,24] and it is still unclear whether and how regional factors affect hotel location distribution in a metropolis. Examining the exogenous factors, such as the business environment, regional attractions and economic development, can help to guide hotel investors in making better location decisions, because the hotel industry requires customers to visit and stay and it is deeply embedded in local regional conditions [25]. A wide variety of factors should be scrutinized for each potential site; nonetheless, to our knowledge, previous empirical studies have not fully addressed the interactions and associations between regional factors and hotel location, and the external environment characteristics, which are likely to affect customers’ choice of destination, have seldom been systematically investigated.
With China’s fast economic development and increasing globalization, the hotel industry serves the accommodation needs of a burgeoning number of domestic and international travelers [26], as indicated by that fact that the total number of guest rooms in China’s star-rated hotels developed rapidly, with a compound annual growth rate of 10%, from 2000 to 2012. Among them, the supply of guest rooms in five-star hotels developed rapidly, with a compound annual growth rate of about 20% (https://m.keyunzhan.com/knews-350972/, accessed on 12 June 2022). Luxury hotels have played an essential role in fostering tourism and stimulating local economic development. Given the significance and consequence of luxury hotels to China’s tourist industry, it is essential to investigate how luxury hotels choose their location and the resulting spatio-temporal patterns. The present study aims to answer the following two questions: (1) what are the spatio-temporal patterns in the distribution of luxury hotels in the study area? (2) What are the key factors of the locational choices of luxury hotels? To answer these questions, we present the spatio-temporal characteristics in the distribution of luxury hotels from 1995 to 2015 by using a set of spatial statistical tools. In addition, an innovative multiscale geographically weighted regression (MGWR) model was employed to investigate the driving forces behind the spatio-temporal pattern of luxury hotels from 1995 to 2015.
This paper contributes to the existing hotel location choice literature in four aspects. First, the paper presents a spatio-temporal characterization of the distribution of luxury hotels. Second, this paper investigates and tests the spatial heterogeneity in locational choices of luxury hotels. By using rich geo-referenced firm-level data with detailed information about each luxury hotel in Shanghai City, we can investigate the spatial patterns of luxury hotels in more depth. The location patterns and their dynamics of luxury hotels have been analyzed and compared by using a range of spatial statistical tools, such as the standard deviation ellipse (SDE), nearest neighbor analysis and exploratory spatial data analysis (ESDA). This spatial analysis of the geographic distribution of luxury hotel location assists in discovering the factors that shape this distribution [20]. Additionally, by investigating this spatial pattern, the set of spatial statistics improves our understanding of luxury hotel location mechanisms and the MGWR model applied in this paper is another innovative feature, and contributes to the literature from the methodology perspective. The MGWR model is a new statistical method used to detect a spatial heterogeneity pattern and reveal potential driving factors behind it [27]. This model improves the classical GWR model by considering different bandwidths of various variables, and then obtains more reliable estimation results. At the same time, the spatial scales of different variables are given, which can effectively explore the spatial heterogeneity and scale effect of the influencing factors of the luxury hotel distribution. This study presents the extended application of the model to examine locational choices in the hotel industry [28].
The remaining parts of this paper are organized as follows. In Section 2, we review location choice of hotels and key literature on hotel location patterns and determinants. In Section 3, we describe our data sources and explain the empirical methodology. In Section 4, we present the estimation results from the specified models. Lastly, in Section 5, final conclusions will be drawn by discussing the theoretical and policy implications of the study, and future research directions will be provided. The technical flowchart is shown in Figure 1.

2. Literature Review

2.1. Luxury Hotel Location Models

According to the previous studies, several theories models have been proposed in the literature to better understand hotel location. Egan and Nield derived a mono-centric model from the partial-equilibrium bid-rent approach, and explained the spatial hierarchy of different hotels’ levels in terms of the distance to the city center, suggesting that luxury hotels choose central locations, whereas budget hotels are located at the edge of the city [14]. In fact, because hotels are not randomly distributed, their locations are usually clustered with other heterogeneous or homogeneous hotels to achieve an agglomeration effect, which refers to hotel co-location patterns that potentially lead to competitive advantages and benefits from clustering [29]. The agglomeration model specifically sheds light on the relative location of new hotels and how to position a hotel relative to other hotel incumbents [12]. Some studies found that lower-end hotels are more likely to receive positive spillover effects by co-locating in a cluster with high-end hotels [30]. Other scholars also pointed out that a price premium is associated with locations close to more upscale and luxury hotels; nevertheless, high-end hotels undergo substantial price erosion by being located close to low-end hotels [31]. In general, the abundance of prior studies on theoretical hotel location models implements different research disciplines. It is important for the luxury hotels to depict the spatial hierarchy of hotel distribution, and it is also significant for the luxury hotels to choose a relative location as suggested by the agglomeration model.
In addition, substantial sophisticated empirical models were also used to explain the choices and spatial patterns of hotel locations; these methods can also shed light on the factors that determine hotel location and help us to understand the driving factors behind the hotel location decision. Two types of empirical models can be used, the count data model (CDM) and the discrete choice model (DCM) [12]. The count data model (CDM) is used to treat the dependent variable as a count number to analyze which characteristics of a zone will affect hotels based on the number of new entrants established there [20,32]. The discrete choice model (DCM) explains hotel location choice based on the economic principle of profit maximization; it is used to examine which characteristics make a zone more attractive than others [12,33,34]. Some scholars applied a binary logistic model to understand the location choices of upper-grade and lower-grade hotels in Hong Kong [35]. In numerous intra-metropolitan and intra-regional studies, many sophisticated spatial statistical tools have emerged to shed light on the spatial distribution of hotel location and these spatial statistics can be used to investigate the dependence and relationship of observations over a particular space [26], such as geographically weighted regression tools [36], the nearest neighbor analysis, standard deviational ellipses and so on. Along with a wide range of available geographic information data and computerized technology, GIS has been a powerful and credible tool to analyze hotel location distribution. This paper will employ some new GIS tools to investigate the luxury hotel location questions in Shanghai City of China.

2.2. Factors Influencing the Location Distribution of Luxury Hotels
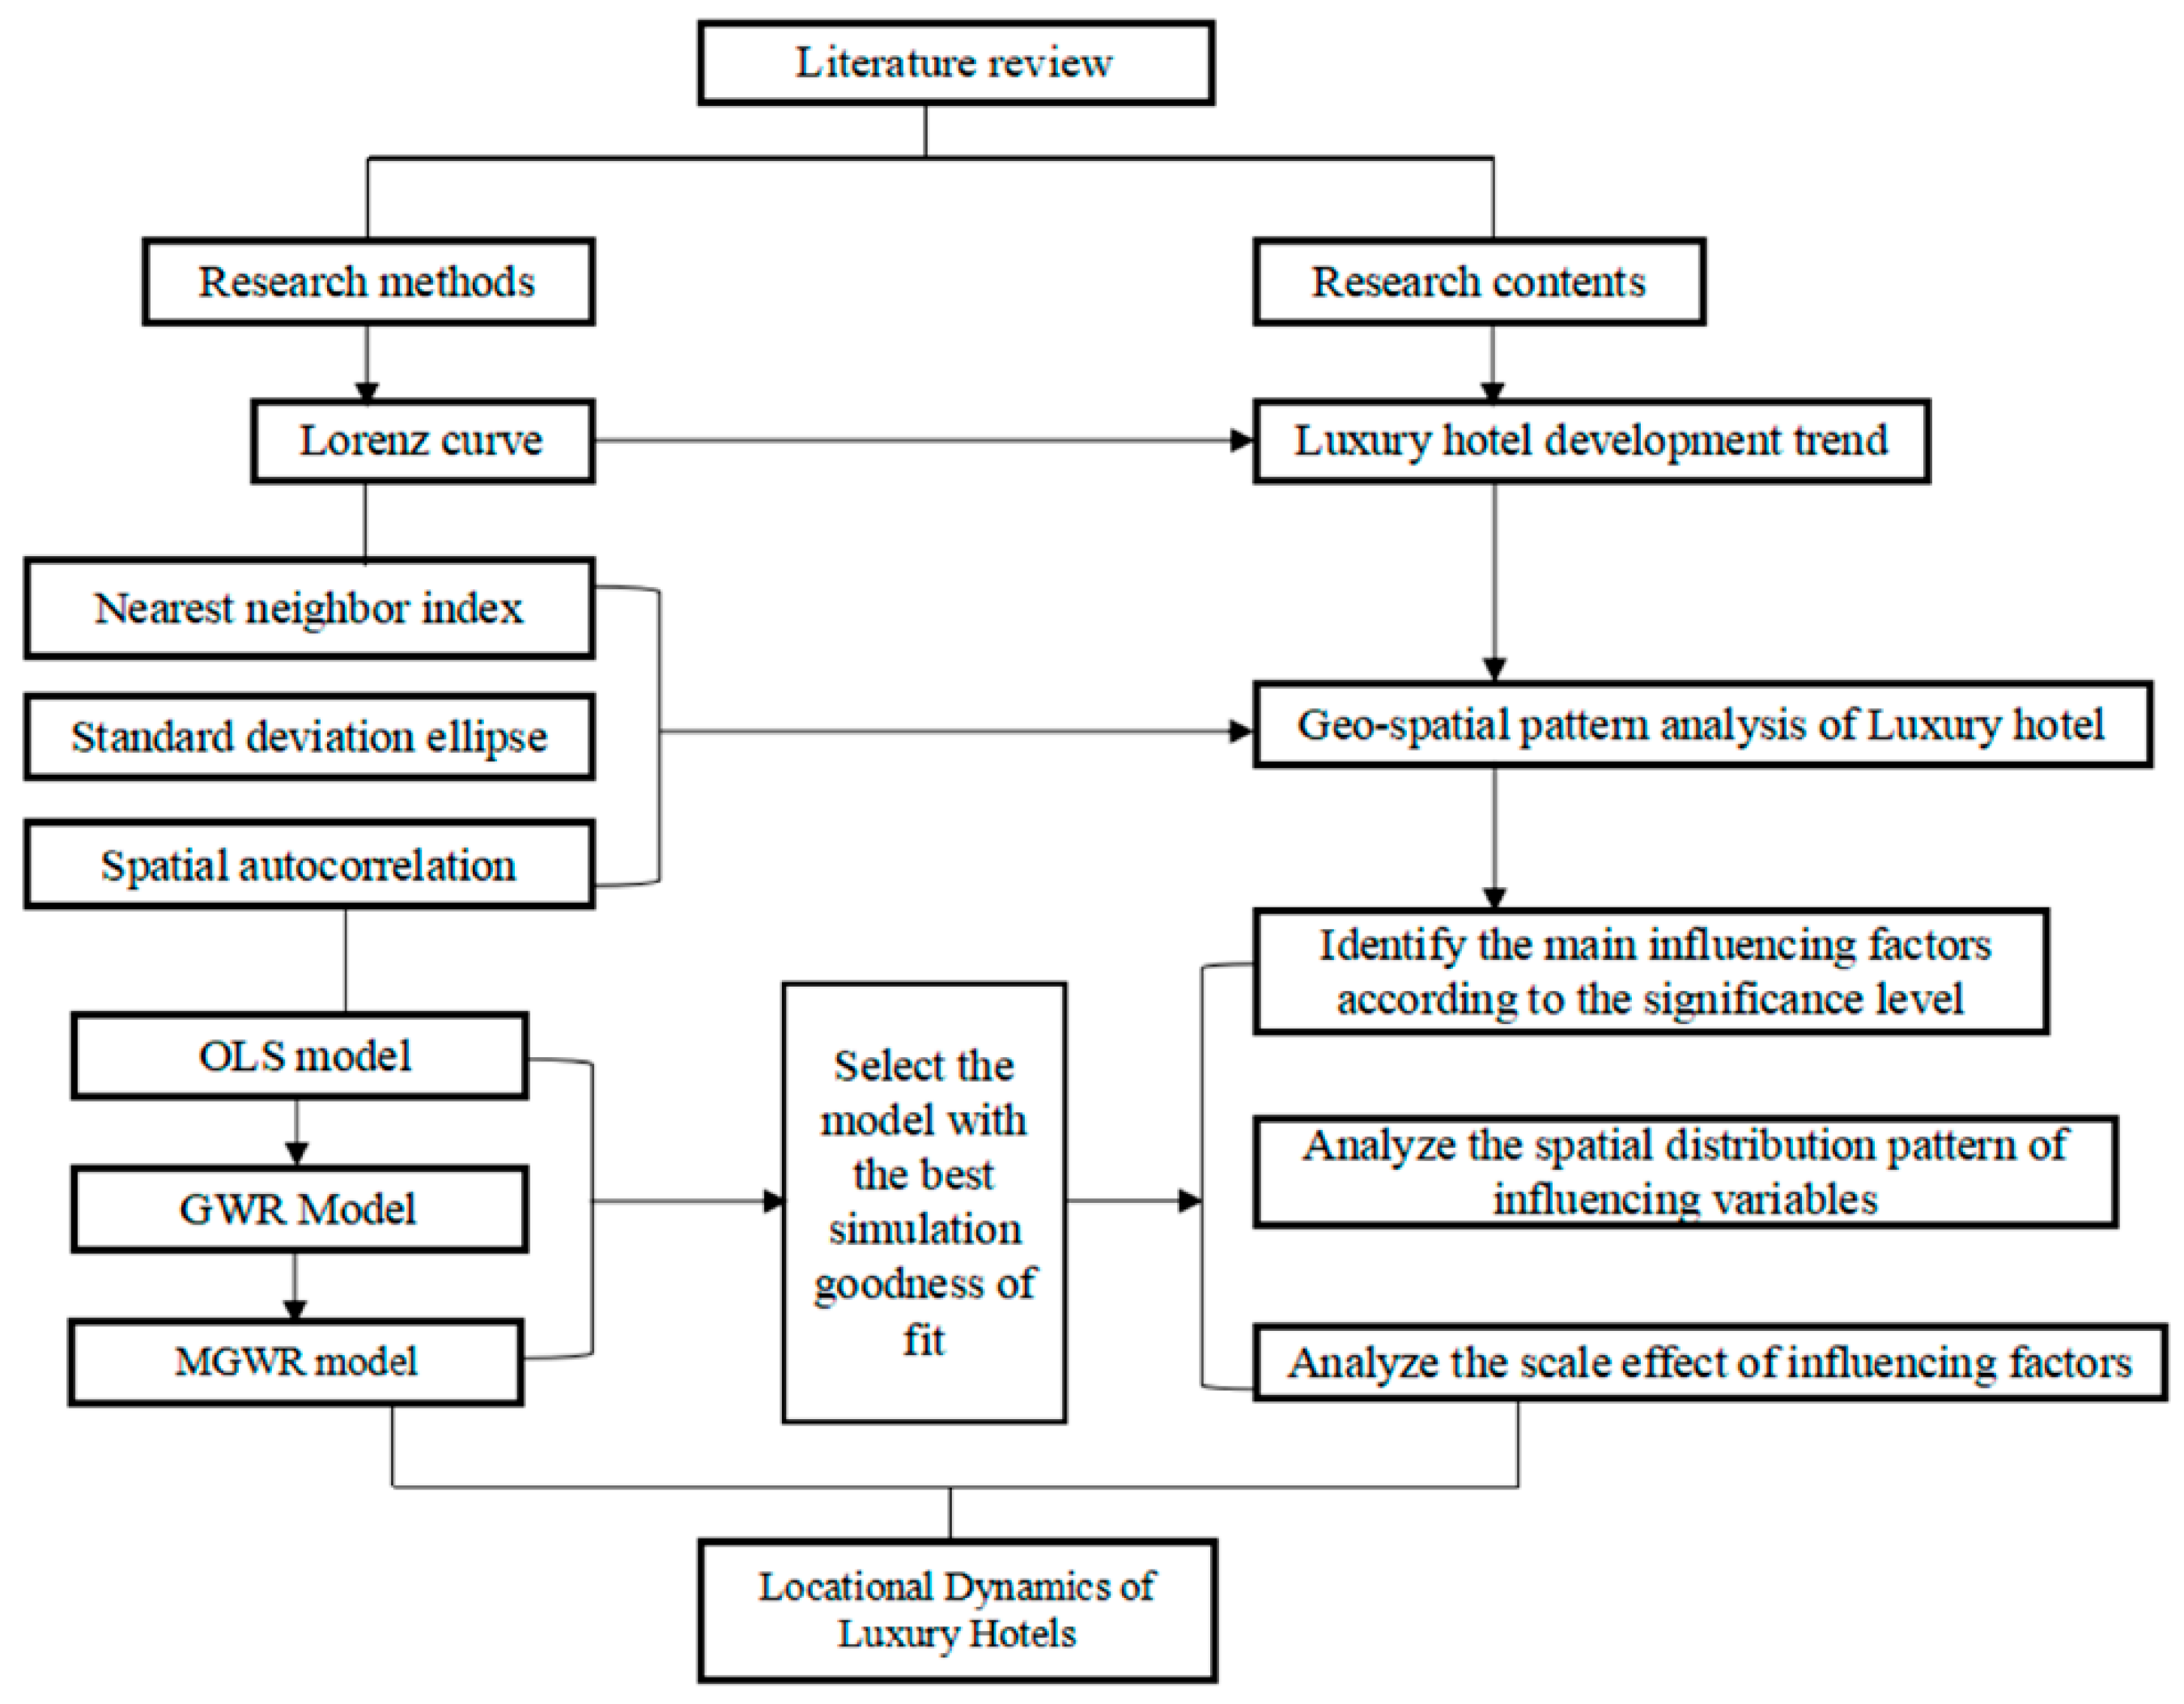
Previous studies focused on hotel-level factors, such as capital investment, star rating, the quality of facilities, ownership and service diversity [20,37,38]. Egan and Nield found that large hotels generally tend to be located far from the city center to reduce the land cost [14]. In addition, the larger a new hotel is, the closer it will choose to be to other hotels [17]. Hotels with different star ratings cater to different potential markets and luxury hotels commonly attract affluent business travelers, so these hotels prefer a central location in the city [20]. Newell and Seabrook revealed that the main influences on hotel investment decisions were financial factors [39], while Ruggero and Rodolfo found that structural social capital was the stronger positive determinant of hotel performance [40]. Some researchers argued that service diversification was a helpful strategy to improve the stability of hotel performance [41,42] and other studies emphasized the importance of entrepreneurship and various promotion strategies [43,44]. These determinants can be considered individual hotel characteristics and consist of the hotel’s internal management.
Compared to the extensive studies on internal factors, the influences of regional or external factors on hotel location, especially on luxury hotels, are relatively under-researched. The hotel industry is closely linked to tourism and economic activities, which are in turn driven by general economic conditions, the business environment, and market supply and demand. For instance, some studies found that a wide range of destination-related external factors are the most important determinants among the competition for international hotel chains, such as business regulations market size and socioeconomic factors [45]. Other scholars argued that the economic efficiency of the hospitality industry in Spain was significantly affected by regional tourist flow [46].
Tourism resources are an important element of hotel location choice and the eclectic paradigm clearly indicates that “opportunities for tourism” are an important influence on international hotels’ choice of a host location [47]. In addition, international meetings, incentives, mega-events, and exhibitions have boosted local economic development [48]. This business and also shopping activities help to form an important nexus that links the hotel industry with regional economic development. The impact of mega-events, such as international festivals and sports competitions, has drawn the attention of some researchers [49,50]. Other scholars found that mega-events (the Olympic Games, for example) were significant factors in the choice of hotel location in China, because hosting a mega-event requires the host city to provide sufficient accommodation for guests and visitors [51].
Good accessibility to travel destinations and traffic facilities is found to be an important factor that influences hotel locations [52,53]. Some studies argued that hotels were likely to choose locations with a high supply of public goods and an abundant supply of services, because proximity to rich public infrastructures can influence a hotel’s room rates and generate higher revenue for hotels [54,55]. Barros found that hotels close to potential markets outperform their counter parts with poor accessibility in terms of efficiency [56]. From the tourists and consumers’ perspective, when making a hotel location decision, it is thought that the objective of selecting a good hotel location can be accomplished if accessibility to facilities such as commercial districts, airports or railway stations, and tourism attractions can be taken into consideration [53].
In addition, the economic conditions affect the occupancy rates and the revenue generated per available room of hotel firms [57]. It is arguable that the level of economic development affects the level of competition at various hotel locations [58]. In urban areas, the choice of hotel location is highly dependent on urban development, which inevitably changes urban structures. For instance, Bégin recognized that with urban structure change, the locations of hotel had altered accordingly in Xiamen of China [59]. Available evidence from other literature also confirmed that the location of hotels established in different periods is highly associated with urban development [60,61].
Aside from the aforesaid regional factors, spatial agglomeration is also regarded as an important determinant of hotel locations [62]. Generally, hotels that choose to spatial agglomerate can gain a significant positive spillover effect from their neighbors in hotel efficiency [56]. Freedman and Kosová found that hotels particularly prefer locations with a high concentration of mid-and up-scale neighboring hotels [63]. In Chinese cities, the spatial agglomeration is more obvious because the role of agglomeration economies may hold more importance due to the large size of the city [10,64].

3. Methods and Data

3.1. Study Area

Shanghai City is an important economic, trade, finance and tourism center of China. It covers a land area of approximately 6340.50 km2, and the population was 24.15 million in 2015 (https://tjj.sh.gov.cn/ydsj/index.html, accessed on 12 August 2022). As of 2015, Shanghai City had a total of 247 star-rated hotels in the Shanghai metropolitan area, including 68 five-star hotels and 66 four-star hotels (https://tjj.sh.gov.cn/ydsj/index.html, accessed on 12 August 2022). Shanghai City attracts a substantial amount of business people and tourists from home and abroad. In 2015, the business revenues of the star-rated tourism hotels were CNY 19,815 million. With increasing income and changes in attitudes towards consumption, tourism consumption is gradually transforming from sightseeing to a high-quality vacation experience, providing a large consumer market for new development of high-star hotels. Several ring roads form the metropolitan transportation skeleton and we restricted our sample to the metropolis area of Shanghai City, which is conventionally defined as eight central urban districts (Huang pu, Jing’an, Hongkou, Xuhui, Changning, Putuo, Zhabei and Yangpu), four inner suburban districts (Pudong, Minhang, Baoshan and Jiading) and five outer suburban districts (Songjiang, Qingpu, Fengxian, Jinshan and Chongming). The basic census geographic units in Shanghai City are subdistricts (or jiedao). There were about 285 subdistricts within our study area.

3.2. Spatial Statistics Approaches

3.2.1. Exploratory Spatial Analysis Tools

The standard deviation ellipse (SDE) method is commonly used in analyzing the spatial distribution of a point data set, covering the mean center and the standard distance. The long axis of the ellipse aligns with the direction of maximum diffusion, while the short axis aligns with the direction of minimum diffusion. The acreage of the ellipse determines the degree of dispersion of luxury hotels. A smaller acreage indicates that the hotel distribution is closer to the center of gravity. The azimuth indicates the directional trend of the hotel distribution, with angles of 0° and 180° indicating that the distribution of hotels is predominantly in a north–south direction and an angle of 90° indicates that the distribution is predominantly in an east–west direction. Some researchers employed this tool to evaluate the distribution of tourism resources in different destinations [65]. This paper uses the SDE tool to examine the spatial pattern and distribution trend of luxury hotels in Shanghai City.
The nearest neighbor index (NNI) can measure the overall characteristics of spatial distribution of the luxury hotels. The NNI can be calculated as follows [66]:
N N I = d ( n n ) / d ( r a n )
where d(nn) denotes the nearest neighbor distance; d(ran) denotes the expectation of the average nearest neighboring distance if all luxury hotels are randomly distributed and they can be calculated as follows:
d ( n n ) = i = 1 n min ( d i j ) n ;   d ( r a n ) = 0.5 A / n
where n is the number of luxury hotels; and A denotes the area. When NNI < 1, the sample points represent a clustered distribution; when NNI > 1, the sample points tend to be dispersed; when NNI = 1, the sample points are randomly distributed.
In order to measure the agglomeration effects of luxury hotels, we will employ a set of exploratory spatial data analysis (ESDA) tools to measure the degree of dependency among luxury hotel locations. Global Moran’s I statistic was used to detect the extent of spatial clustering or dependency of hotel locations in the Shanghai metropolitan area, which is expressed as follows [67]:
M or a n s I = n i = 1 n i = 1 n w i j ( x i x _ ) ( x j x _ ) i = 1 n i = 1 n w i j i = 1 n ( x i x _ ) 2
where xi and xj denote the observed values in this study and x ¯ is the mean value of x. Wij is the spatial weights matrix, measuring the connection structure of spatial units in the area. n denotes the number of luxury hotels. A positive Moran’s I statistic indicates positive spatial autocorrelation of hotel locations, while negative values indicate dispersed patterns of hotel locations.
For a closer look at the local structure of the spatial distributions of luxury hotels, local Moran’s I statistics were also employed and the measure equation is as follows [68]:
M o r a n s I = n ( x i x _ ) j w i j ( x j x _ ) j = 1 n ( x j x _ ) 2
In Equation (4), n denotes the number of luxury hotels, xi and xj denote the observed values in this study and x ¯ is the mean value of x. Wij is the spatial weights matrix.
The local spatial autocorrelation can be divided into the following four categories of clustering, corresponding to the spatial association between a subdistrict and its neighbors: ① the high-high (H-H) aggregation type denotes a subdistrict with a high value surrounded by subdistricts of high values; ② low-low (L-L) aggregation type denotes a subdistrict with a low value surrounded by subdistricts of low values; ③ high-low (H-L) aggregation type denotes a subdistrict with a high value surrounded by subdistricts of low values; ④ low-high (L-H) aggregation type denotes a subdistrict with a low value surrounded by subdistricts of high values. Therefore, based on the local spatial autocorrelation types, significant hotel location clusters can be visualized and identified.

3.2.2. MGWR Model

The multiscale geographically weighted regression (MGWR) model can consider various bandwidths of different independent variables, and identify the scale effect affected by different variables. Therefore, this study uses the MGWR model to explore the spatial heterogeneity characteristics and scale effect of the influencing factors on the distribution of luxury hotels in Shanghai City. The calculation formula of MGWR model is as follows [69]:
y i = j = 1 k β b w j ( u i , v i ) x i j + ε i
where the observation unit i { 1 | , 2 | , , | n } , yi denotes the dependent variable, xij denotes the j-th independent variable, j { 1 | , 2 | , , | k } , bwj denotes the bandwidth of estimating the j-th variable, βbwj denotes the estimator of the j-th parameter at the position (ui, vi), and εi denotes the error term [70].

3.3. Data and Variables

We obtained the data on the number of luxury hotels in each subdistrict from the Shanghai Statistical Yearbook (1996–2016) published by China Statistical Press, and a popular online travel service (www.ctrip.com/, accessed on 20 October 2017). In China, the national tourism administration and travel operators promoted the star classification system, which was quickly accepted as a regulatory system and as a general standard to discriminate between hotel quality levels [25]. Therefore, this study focuses on the luxury hotels that are rated as 4-star or 5-star according to the Standards for Tourist Hotels’ Star-rating published by the China National Tourism Administration. The data for our explanatory variables at the sub-district level were obtained from the Shanghai Statistical Yearbook (1996–2016) and other data platforms. Figure 2 presents the spatial location of all luxury hotels in the Shanghai metropolitan area as of 2015. A general pattern was found, that is, most luxury hotels were located around the city center but within the outer ring of the city. The distribution of luxury hotels in Shanghai City also exhibits a clear geographical attenuation trend from the city center.
Our independent variables for explaining locational choices of luxury hotels are divided into several sets (Table 1). The first is transport accessibility, which is measured by the following two indicators: the number of subway stations in each subdistrict and the distance from a luxury hotel to the nearest airport. As Shanghai City is the top financial center in China, the proximity to the nearest financial center was calculated to reflect the impact of market demand on luxury hotel location choice. To capture the effect on hotel location choice of physical environment or natural amenities, we include in our model the number of parks in each subdistrict. In addition, distances of each hotel to the central business center (CBD) are also included in the model. In order to test the potential administrative institution influences on luxury hotel location choice, we also calculate the distances from each luxury hotel to the Shanghai municipal government site and include it our model. Previous studies have argued that the mega events have a significant impact on local tourism and the local economy [49,50]. Shanghai City hosted the 2010 Expo with the Shanghai Expo Garden constructed along the Huangpu River. We expect that the Expo might have a positive impact on luxury hotel location decisions. Therefore, this paper takes the distance from the World Expo as one of the variables. The average price of hotel rooms may also have a certain impact on the distribution of hotels. Therefore, the average price of hotel rooms is included in the model as a variable.

4. Results

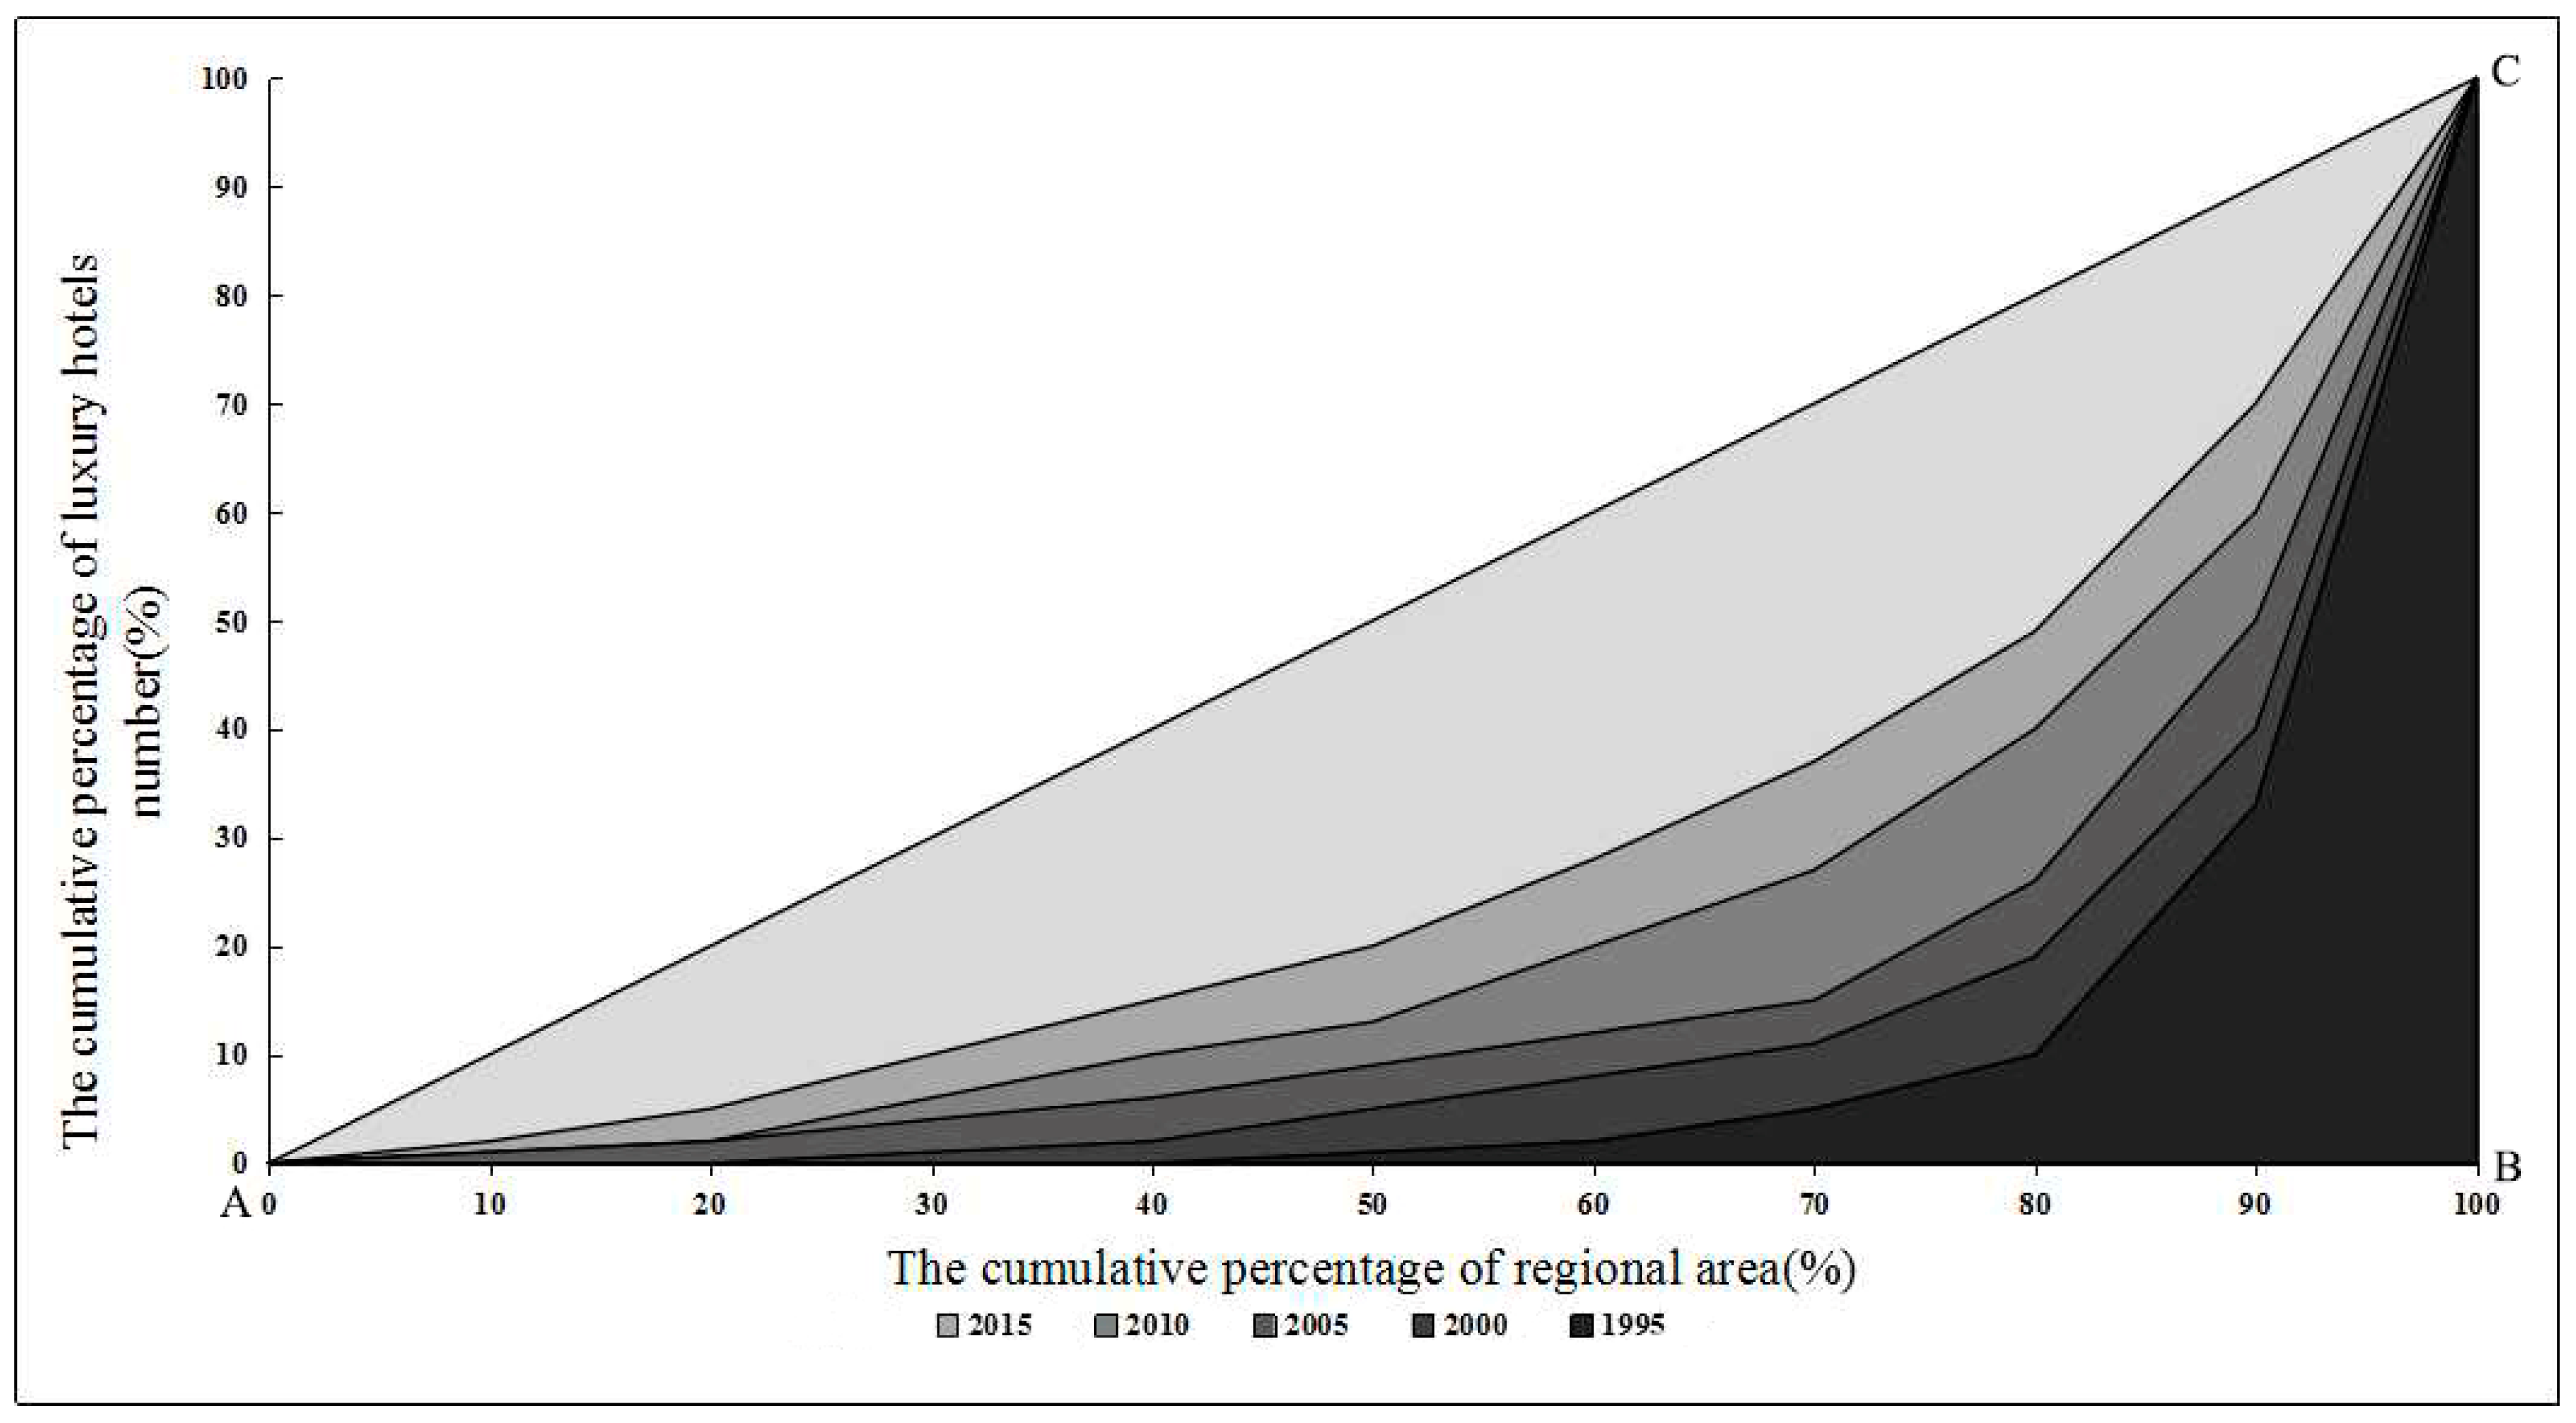
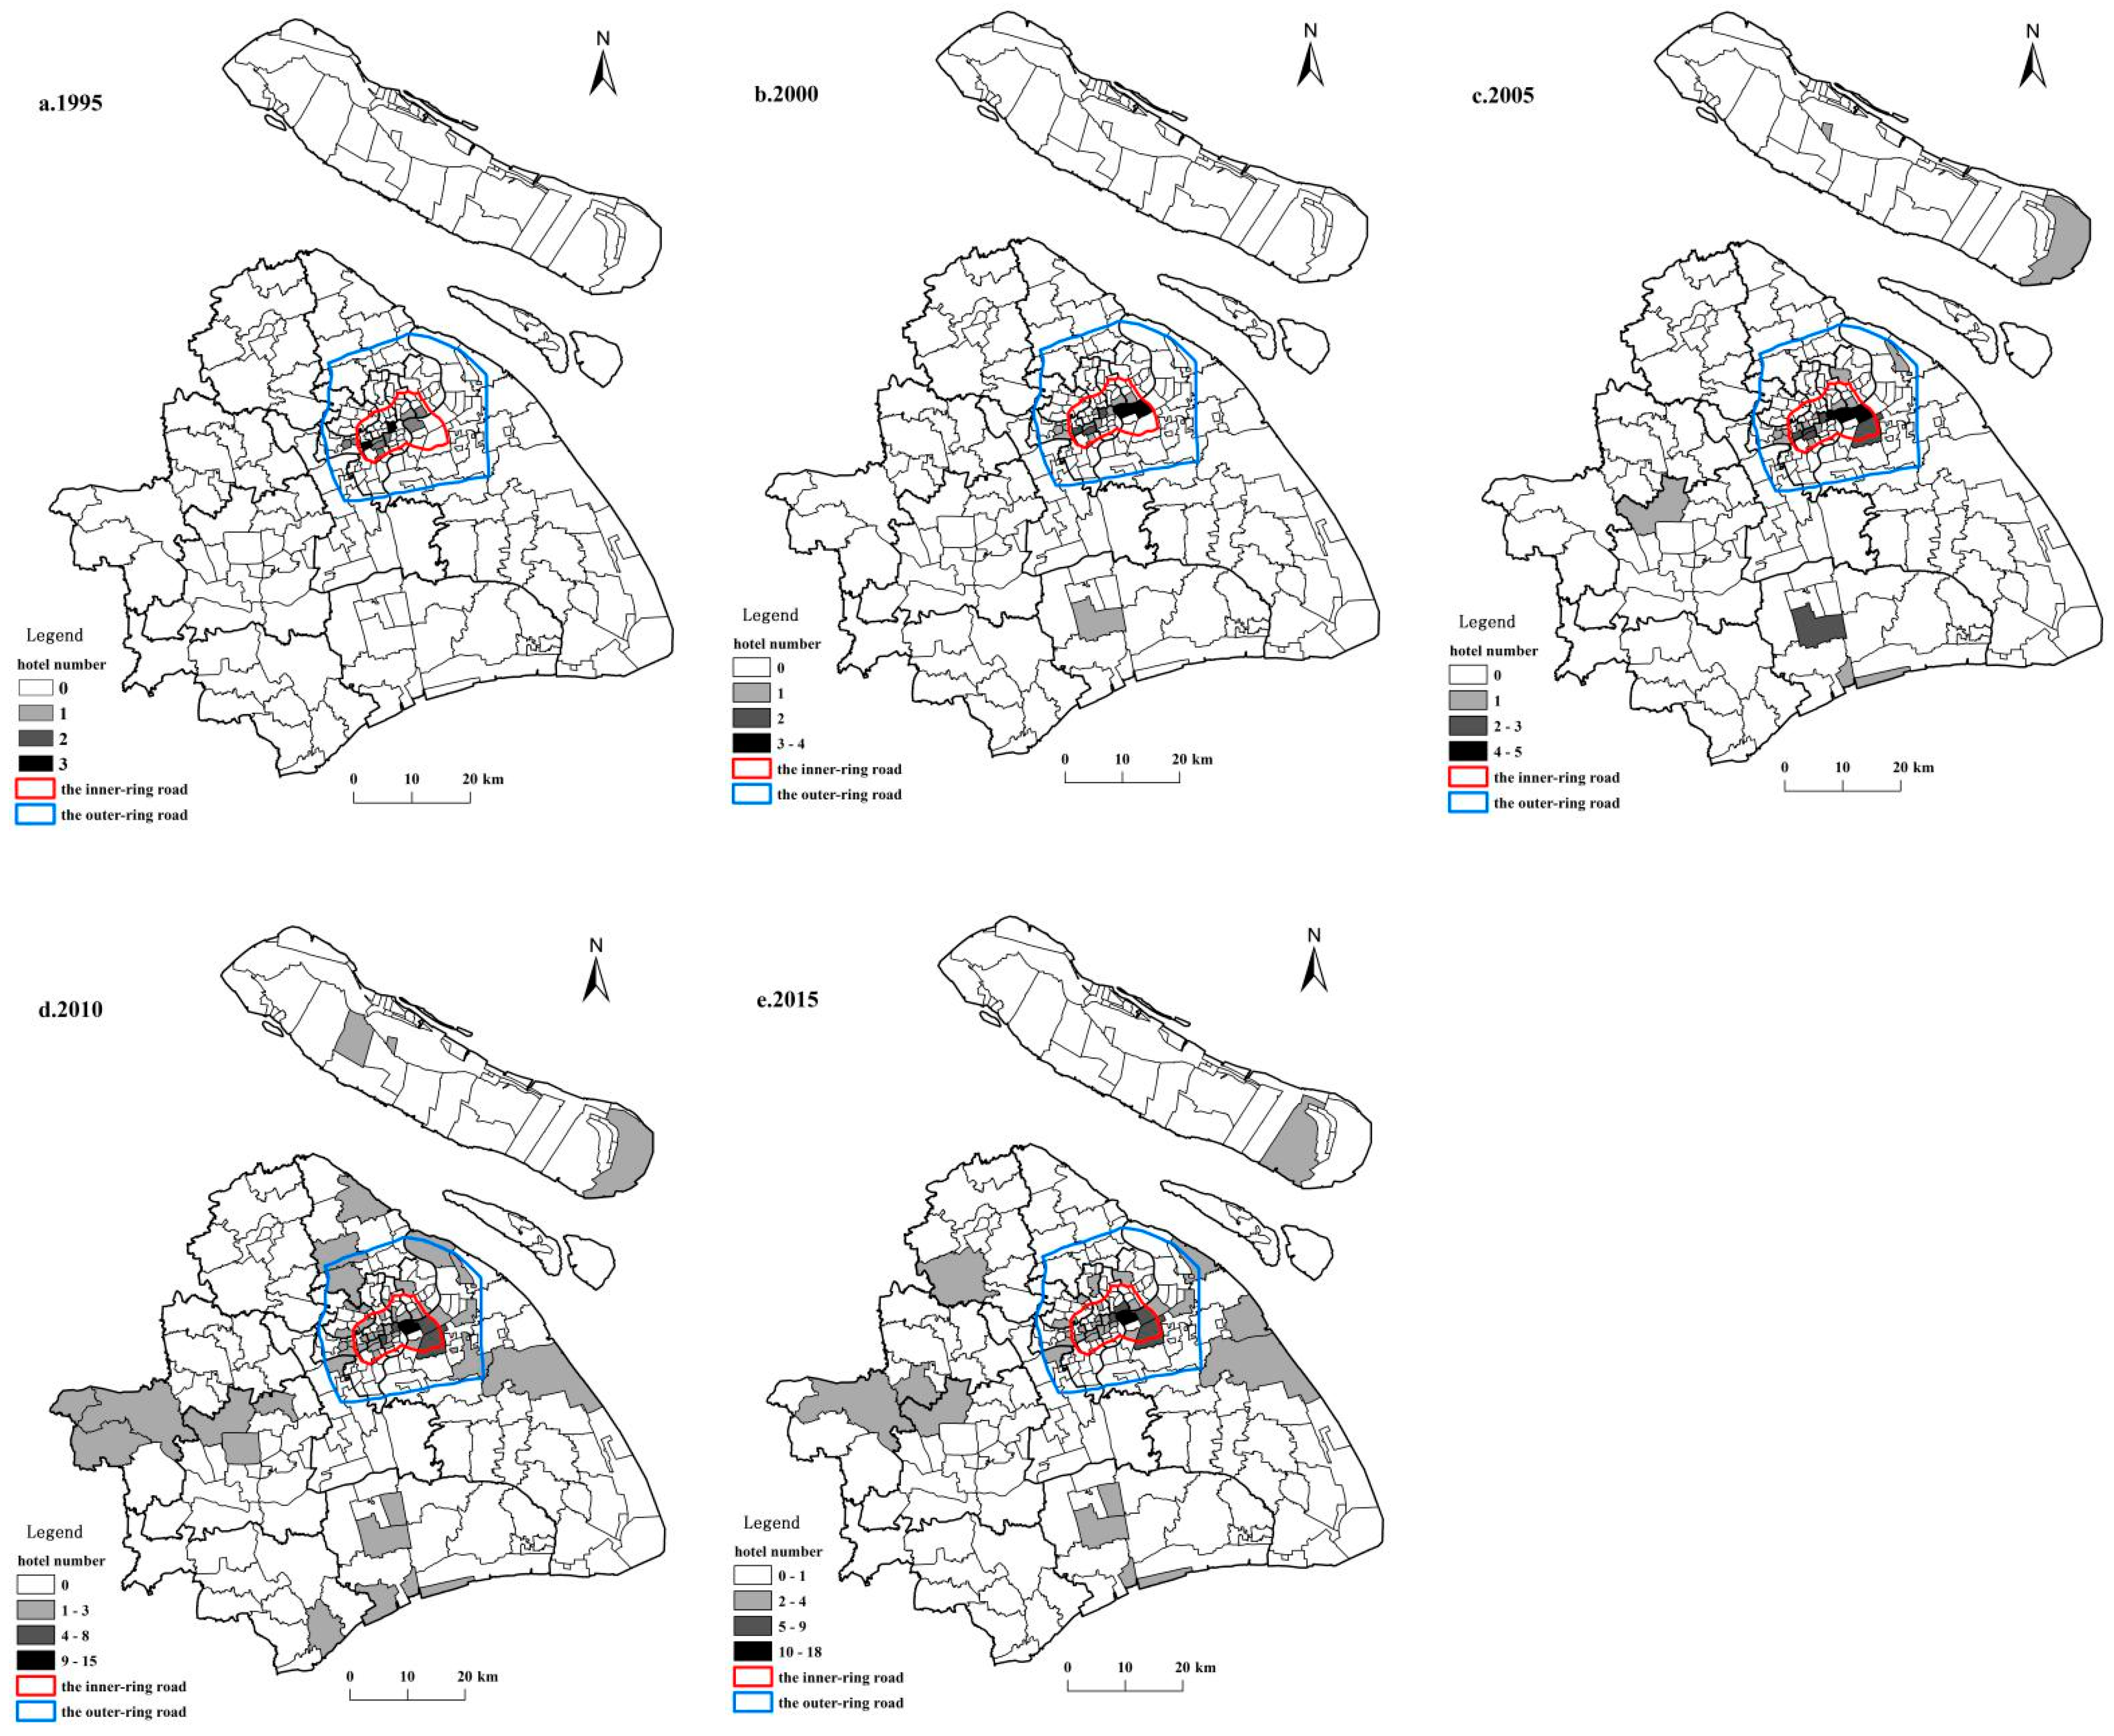
4.1. Luxury Hotel Development Trend in Shanghai City

According to the tourism statistics for the 1995 to 2015 period, the number of luxury hotels increased from 13 in 1995 to 160 in 2015 (Table 2) and the average annual growth rate was as high as 56.5%. The Lorenz curve approached the average line (line AC) during 1995–2015, indicating that the luxury hotels were gradually expanding into the surrounding districts in Shanghai City (Figure 3). This trend is related to the urban development strategy and mega events of Shanghai City; in particular, Shanghai City accelerated the development of its modern service industry and the construction of international financial centers during 2006–2010, and there was a period of rapid growth in the number of luxury hotels at this time. During this period, the number of luxury hotels increased by 74, and by 32 in 2010 alone because of the 2010 Shanghai World Expo.

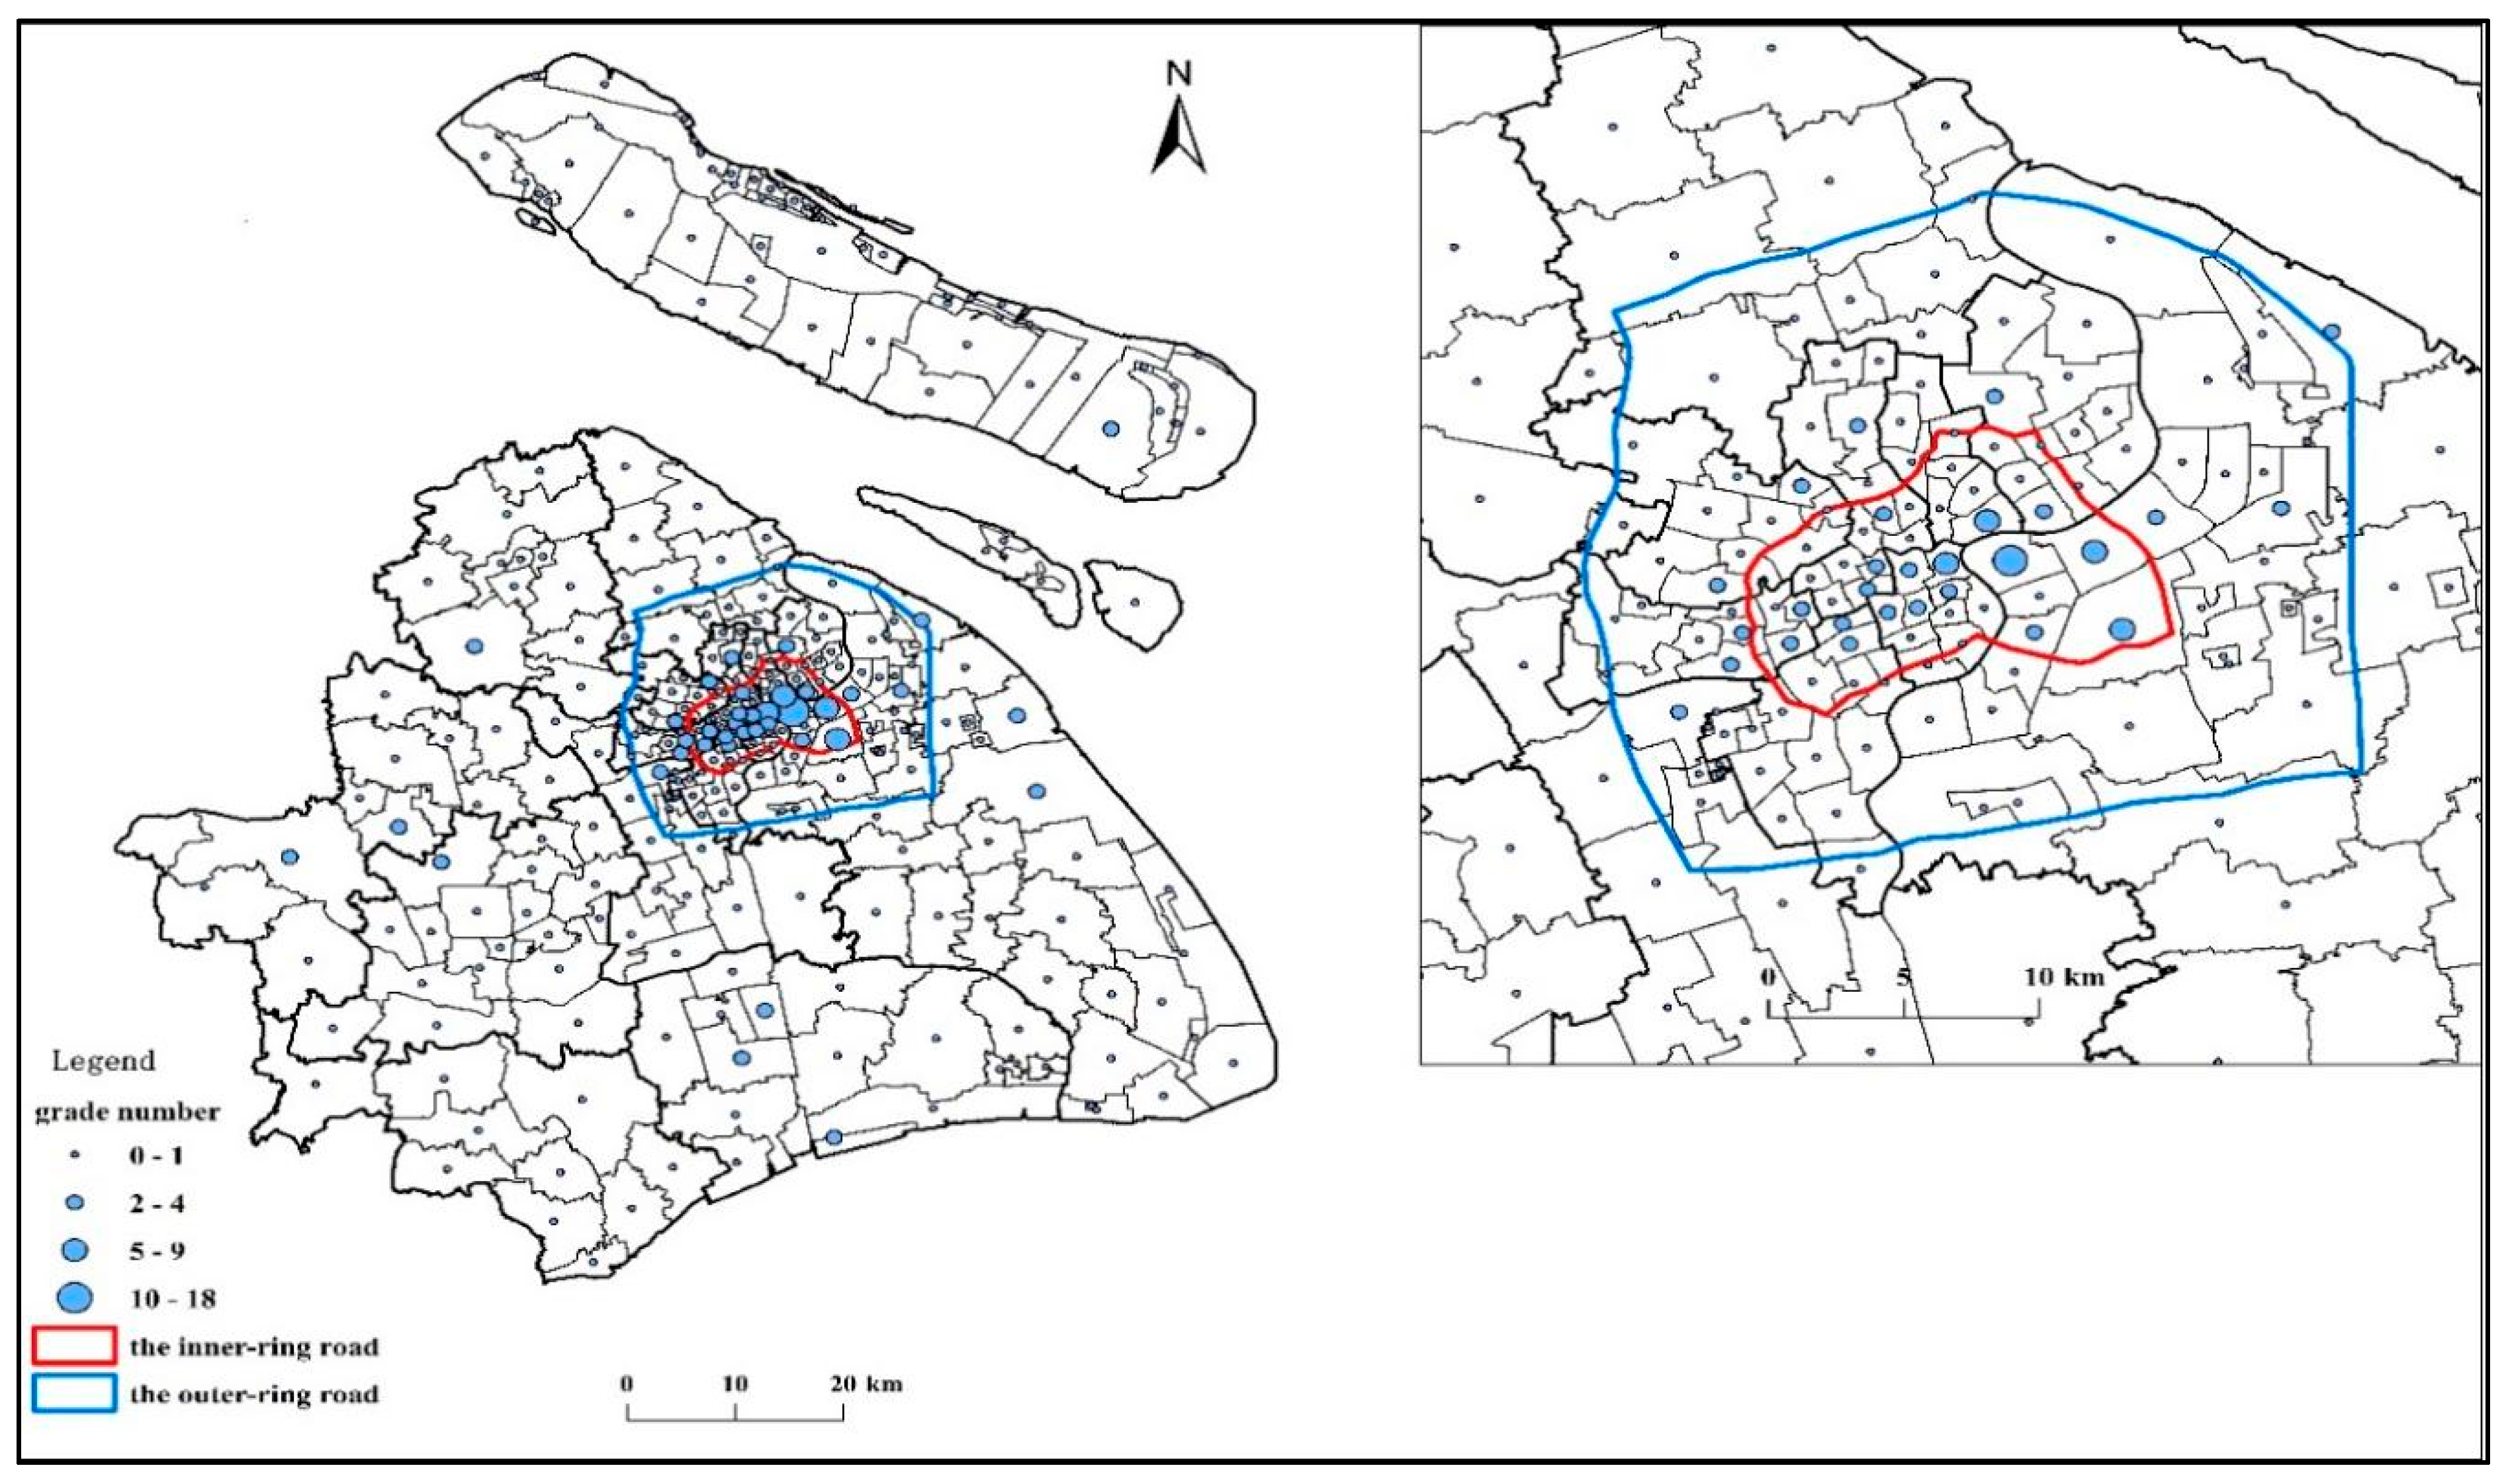
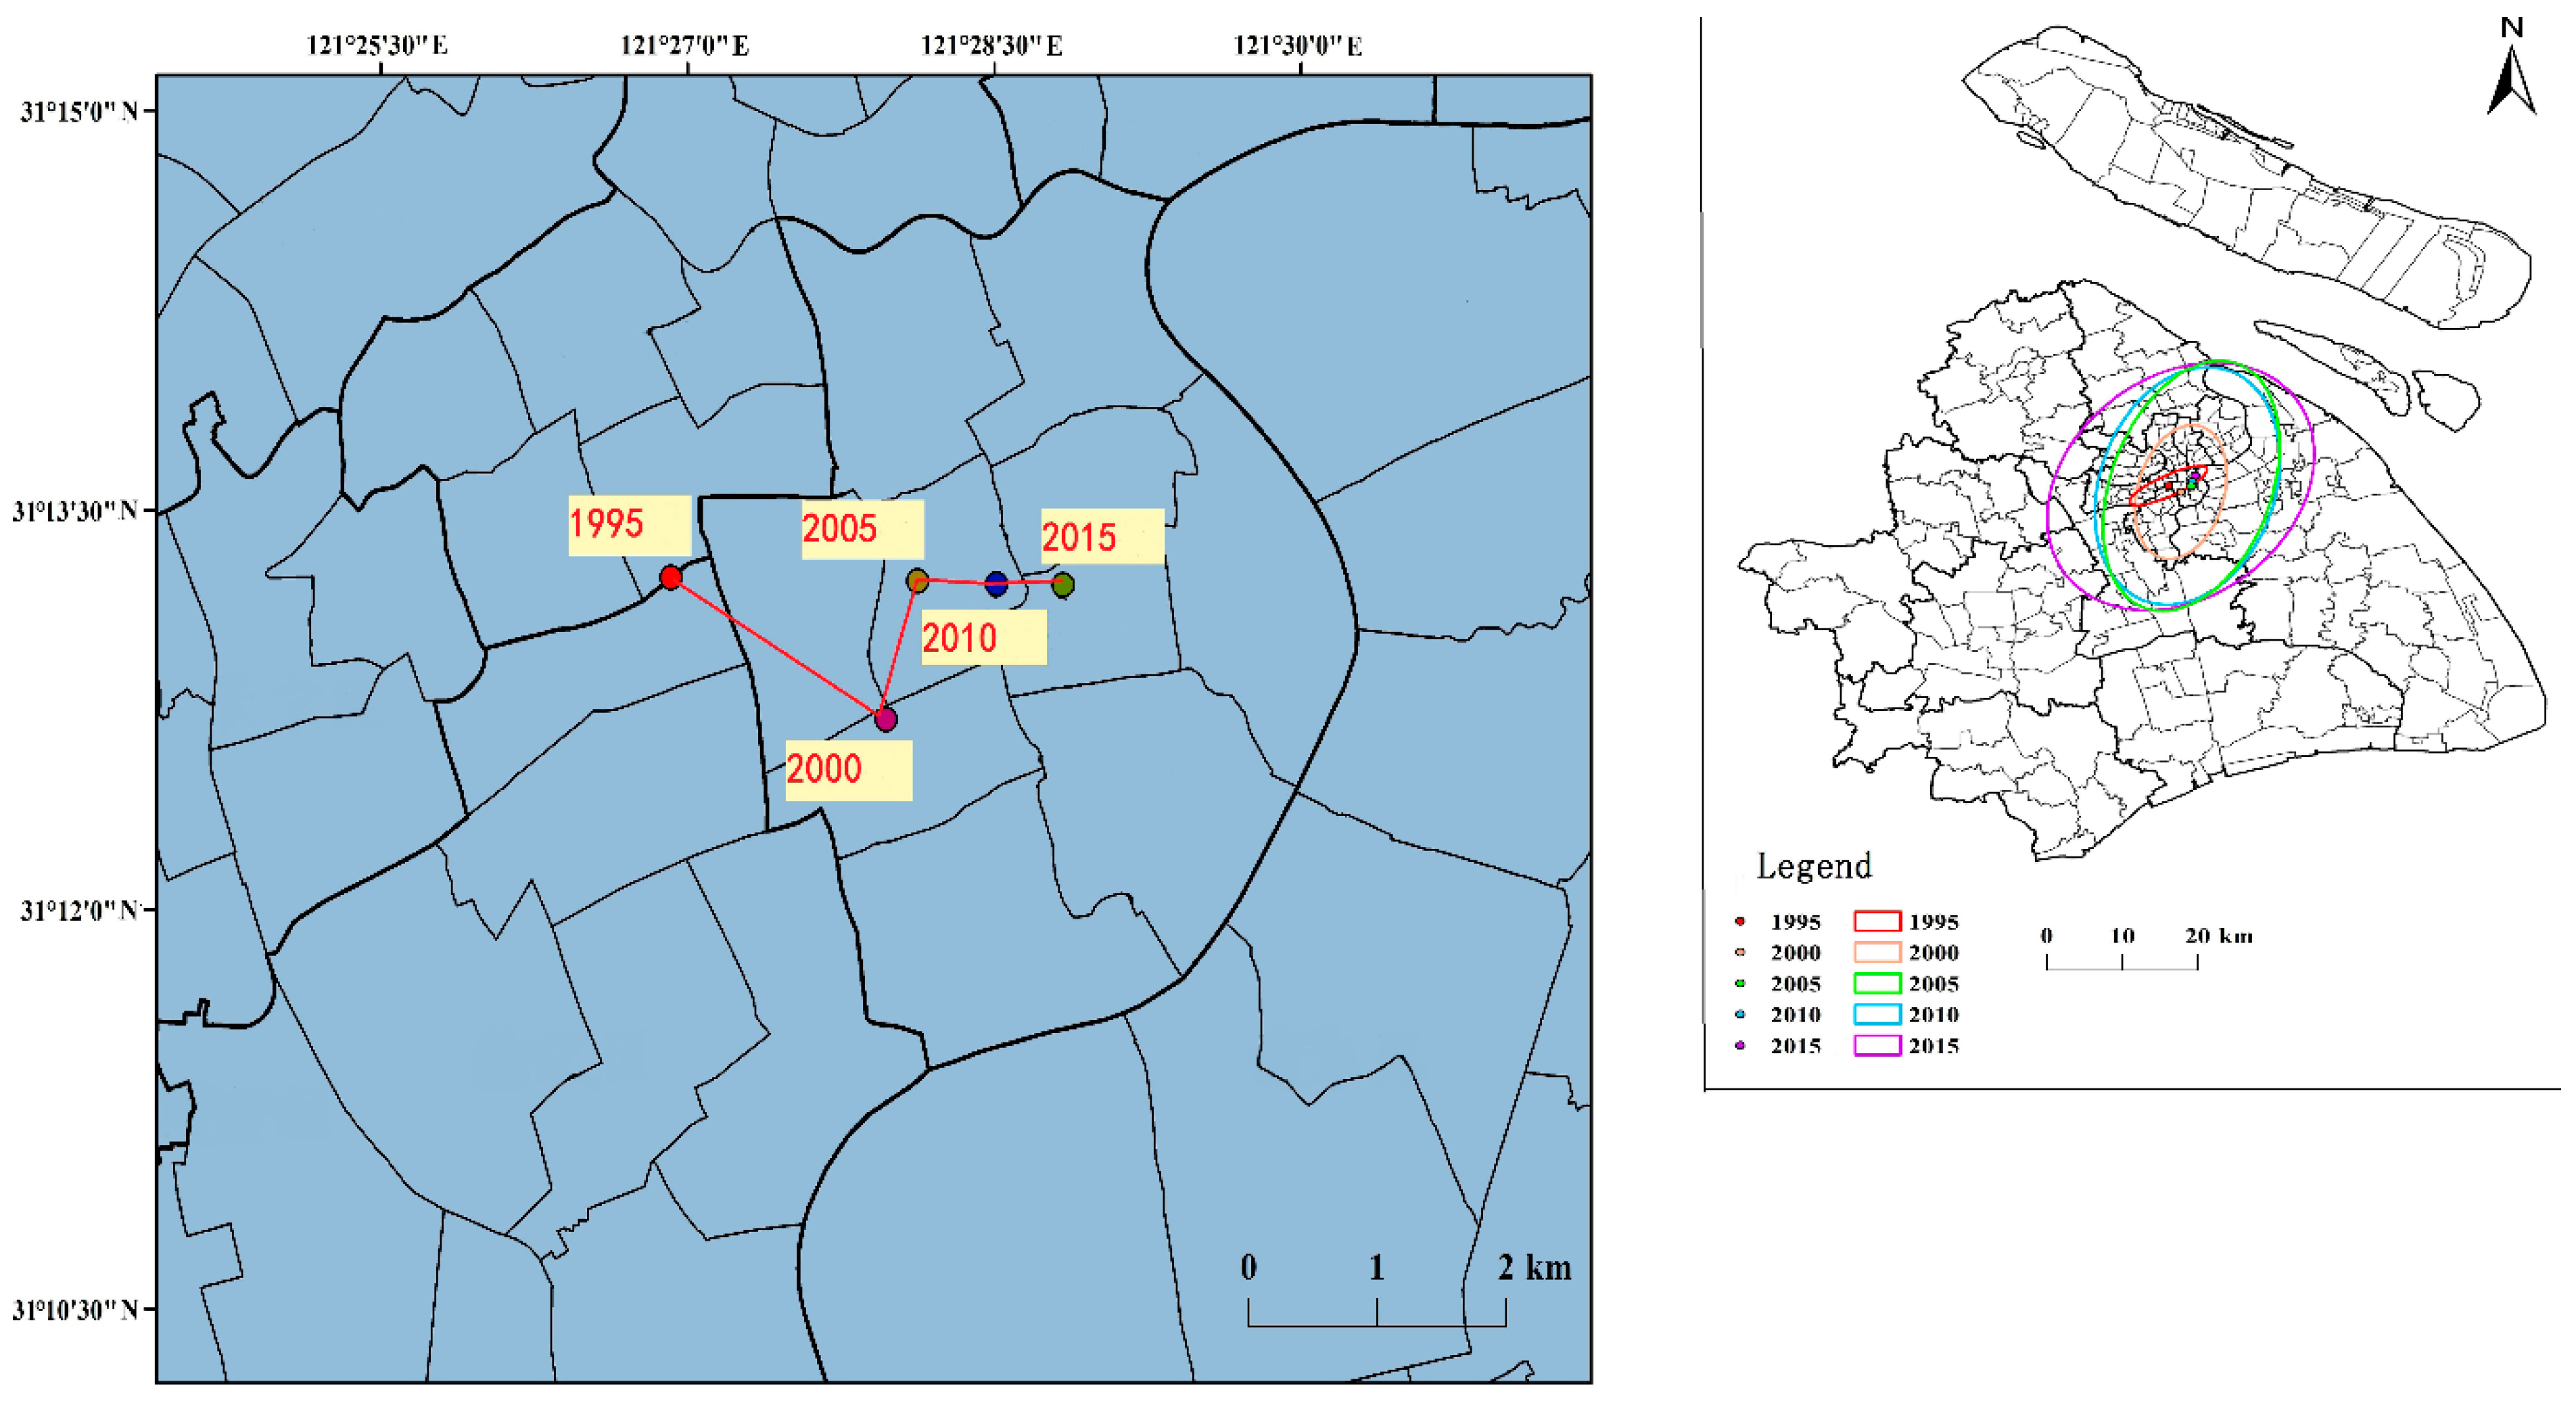
4.2. Geo-Spatial Pattern Analysis

To understand the spatial proximity of the luxury hotels and its dynamics in Shanghai City, the distances between each hotel and its nearest neighbor index were calculated. The nearest neighbor index of luxury hotels decreased from 1.01 to 0.47 during the period 1995–2015 (Table 3), indicating that luxury hotels gradually agglomerated in a particular space. In 1995, because of the low density of luxury hotels, the phenomenon of spatial agglomeration was not clear. In 2000, the nearest neighbor index was less than 1, and spatial clustering emerged at a marginal significance level of 10%. There was significant spatial agglomeration of hotels in 2005 (at the 5% significance level) and stronger agglomeration after 2010 (at a significance level of less than 1%). This suggests that the extent of agglomeration in the distribution of luxury hotels in Shanghai City becomes stronger with time.
Figure 4 depicts the spatial distribution of new hotel entrants in Shanghai City during the research period. In Figure 4a, the overall density of luxury hotels was relatively low, with few luxury hotels and no clear agglomeration pattern in 1995. The distribution density was highest in the Nanjing East Road and Huangpu District. In 2000, the initial development stage of luxury hotels in Shanghai City was reported. There was an increasing number of luxury hotels, and an agglomeration trend gradually emerged. In Figure 4b, it can be observed that the regions of highest density were concentrated in the Pudong New Area. This was mainly due to the implementation of the Pudong New Area Development Policy. All-round cooperation with foreign investment resulted in a rapid increase in the number of luxury hotels in Pudong New Area. At the same time, the location of luxury hotels was beginning to spread to suburban areas in Shanghai City. In 2005, the distribution density of luxury hotels increased greatly, and the agglomeration phenomenon was clear. In Figure 4c, it can be observed that the areas of highest density were in the Lujiazui zone (financial center of Shanghai). With the Expo 2010 held in Shanghai, a series of policies, including promotion of the development of the modern service industry and the construction of the Shanghai international financial center, were introduced. The luxury hotel industry entered a stage of rapid development. In Figure 4d, one can observe that the areas with a high density of luxury hotels were mainly concentrated around the city center and the Expo site. This result indicates that the location around the Shanghai Expo site was attractive for new luxury hotel entrants before the Expo. In 2015, the spatial distribution of luxury hotels in the suburbs of Shanghai City gradually became the mainstream distribution. Figure 4e shows that the number of luxury hotels located near the Expo site decreases, which might be a signal of excess hotel room supply in the area.
Figure 5 provides the maps of the barycenter and SDE of luxury hotels from 1995 to 2015. The barycenter of the new luxury hotel entrants’ distribution gradually shifted to the north–east direction. In 1995, the barycenter of luxury hotels was located near the Nanjing West Road in the Jing’an District. With continuous development of the hotel industry, the barycenter elongated along the south–east direction to the vicinity of the Huangpu District in 2000. Then, the barycenter began to move towards the north–east direction in 2015. In addition, the SDEs of luxury hotels from 1995 to 2015 are different, suggesting that the centroid of hotel locations evolved significantly with time. Among them, the SDEs in 2015 were much larger than that in 1995, indicating that the agglomeration effect was significantly enhanced.

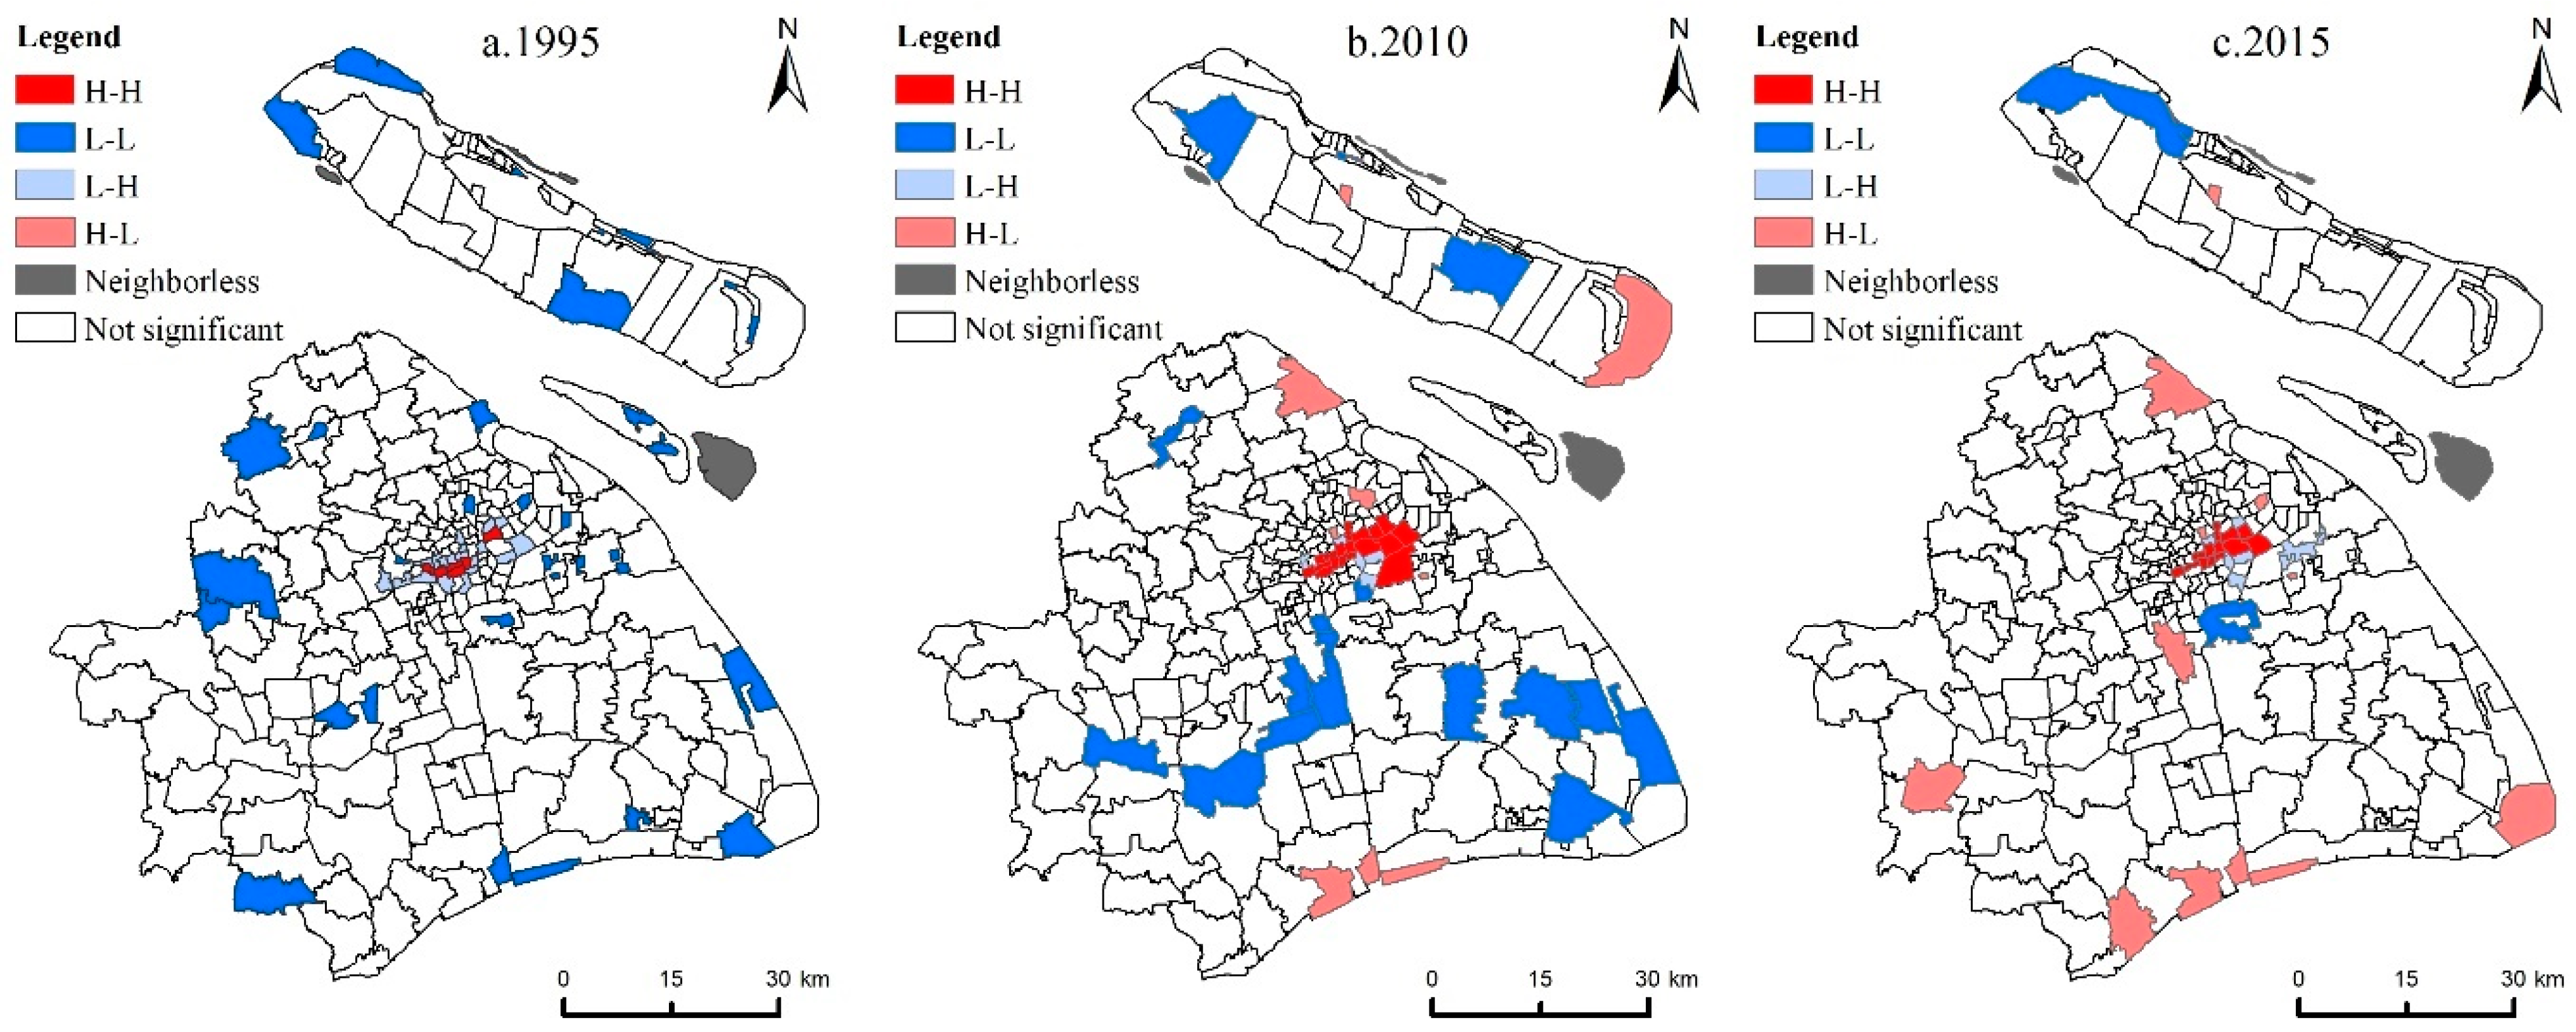
4.3. Spatial Autocorrelation Analysis

The global Moran’s I statistics for the luxury hotels in different years are all positive and statistically significant (Table 4). More importantly, Moran’s I statistics increase from 0.268 in 1995 to 0.452 in 2015, indicating an increasing level of spatial clustering in the distribution of luxury hotels. The local spatial clustering patterns are revealed by using the LISA statistics, with local clustering maps of luxury hotels presented in Figure 6. The H-H clusters are mainly distributed in the Pudong New Area, the Nanjing East Road of the Huangpu District, and the Nanjing West Road of the Jing’an District. The H-H cluster reveals a hot-spot for hotel locations, suggesting a greater geographic concentration of luxury hotels in these areas. Alternatively, the L-L clusters highlight the areas where there is a less-developed hotel industry. L-L clusters cover the areas in the Langxia zone, Jinshan District, and Chongming County. The H-L clusters suggest that the area with more luxury hotels is adjacent to areas with fewer luxury hotels and the H-L clusters are mainly distributed in the Jiading District. The L-H clusters highlight the fact that the areas with fewer luxury hotels are adjacent to areas with more luxury hotels. The distribution of L-H clusters is mainly attached to the surrounding areas of H-H clusters.

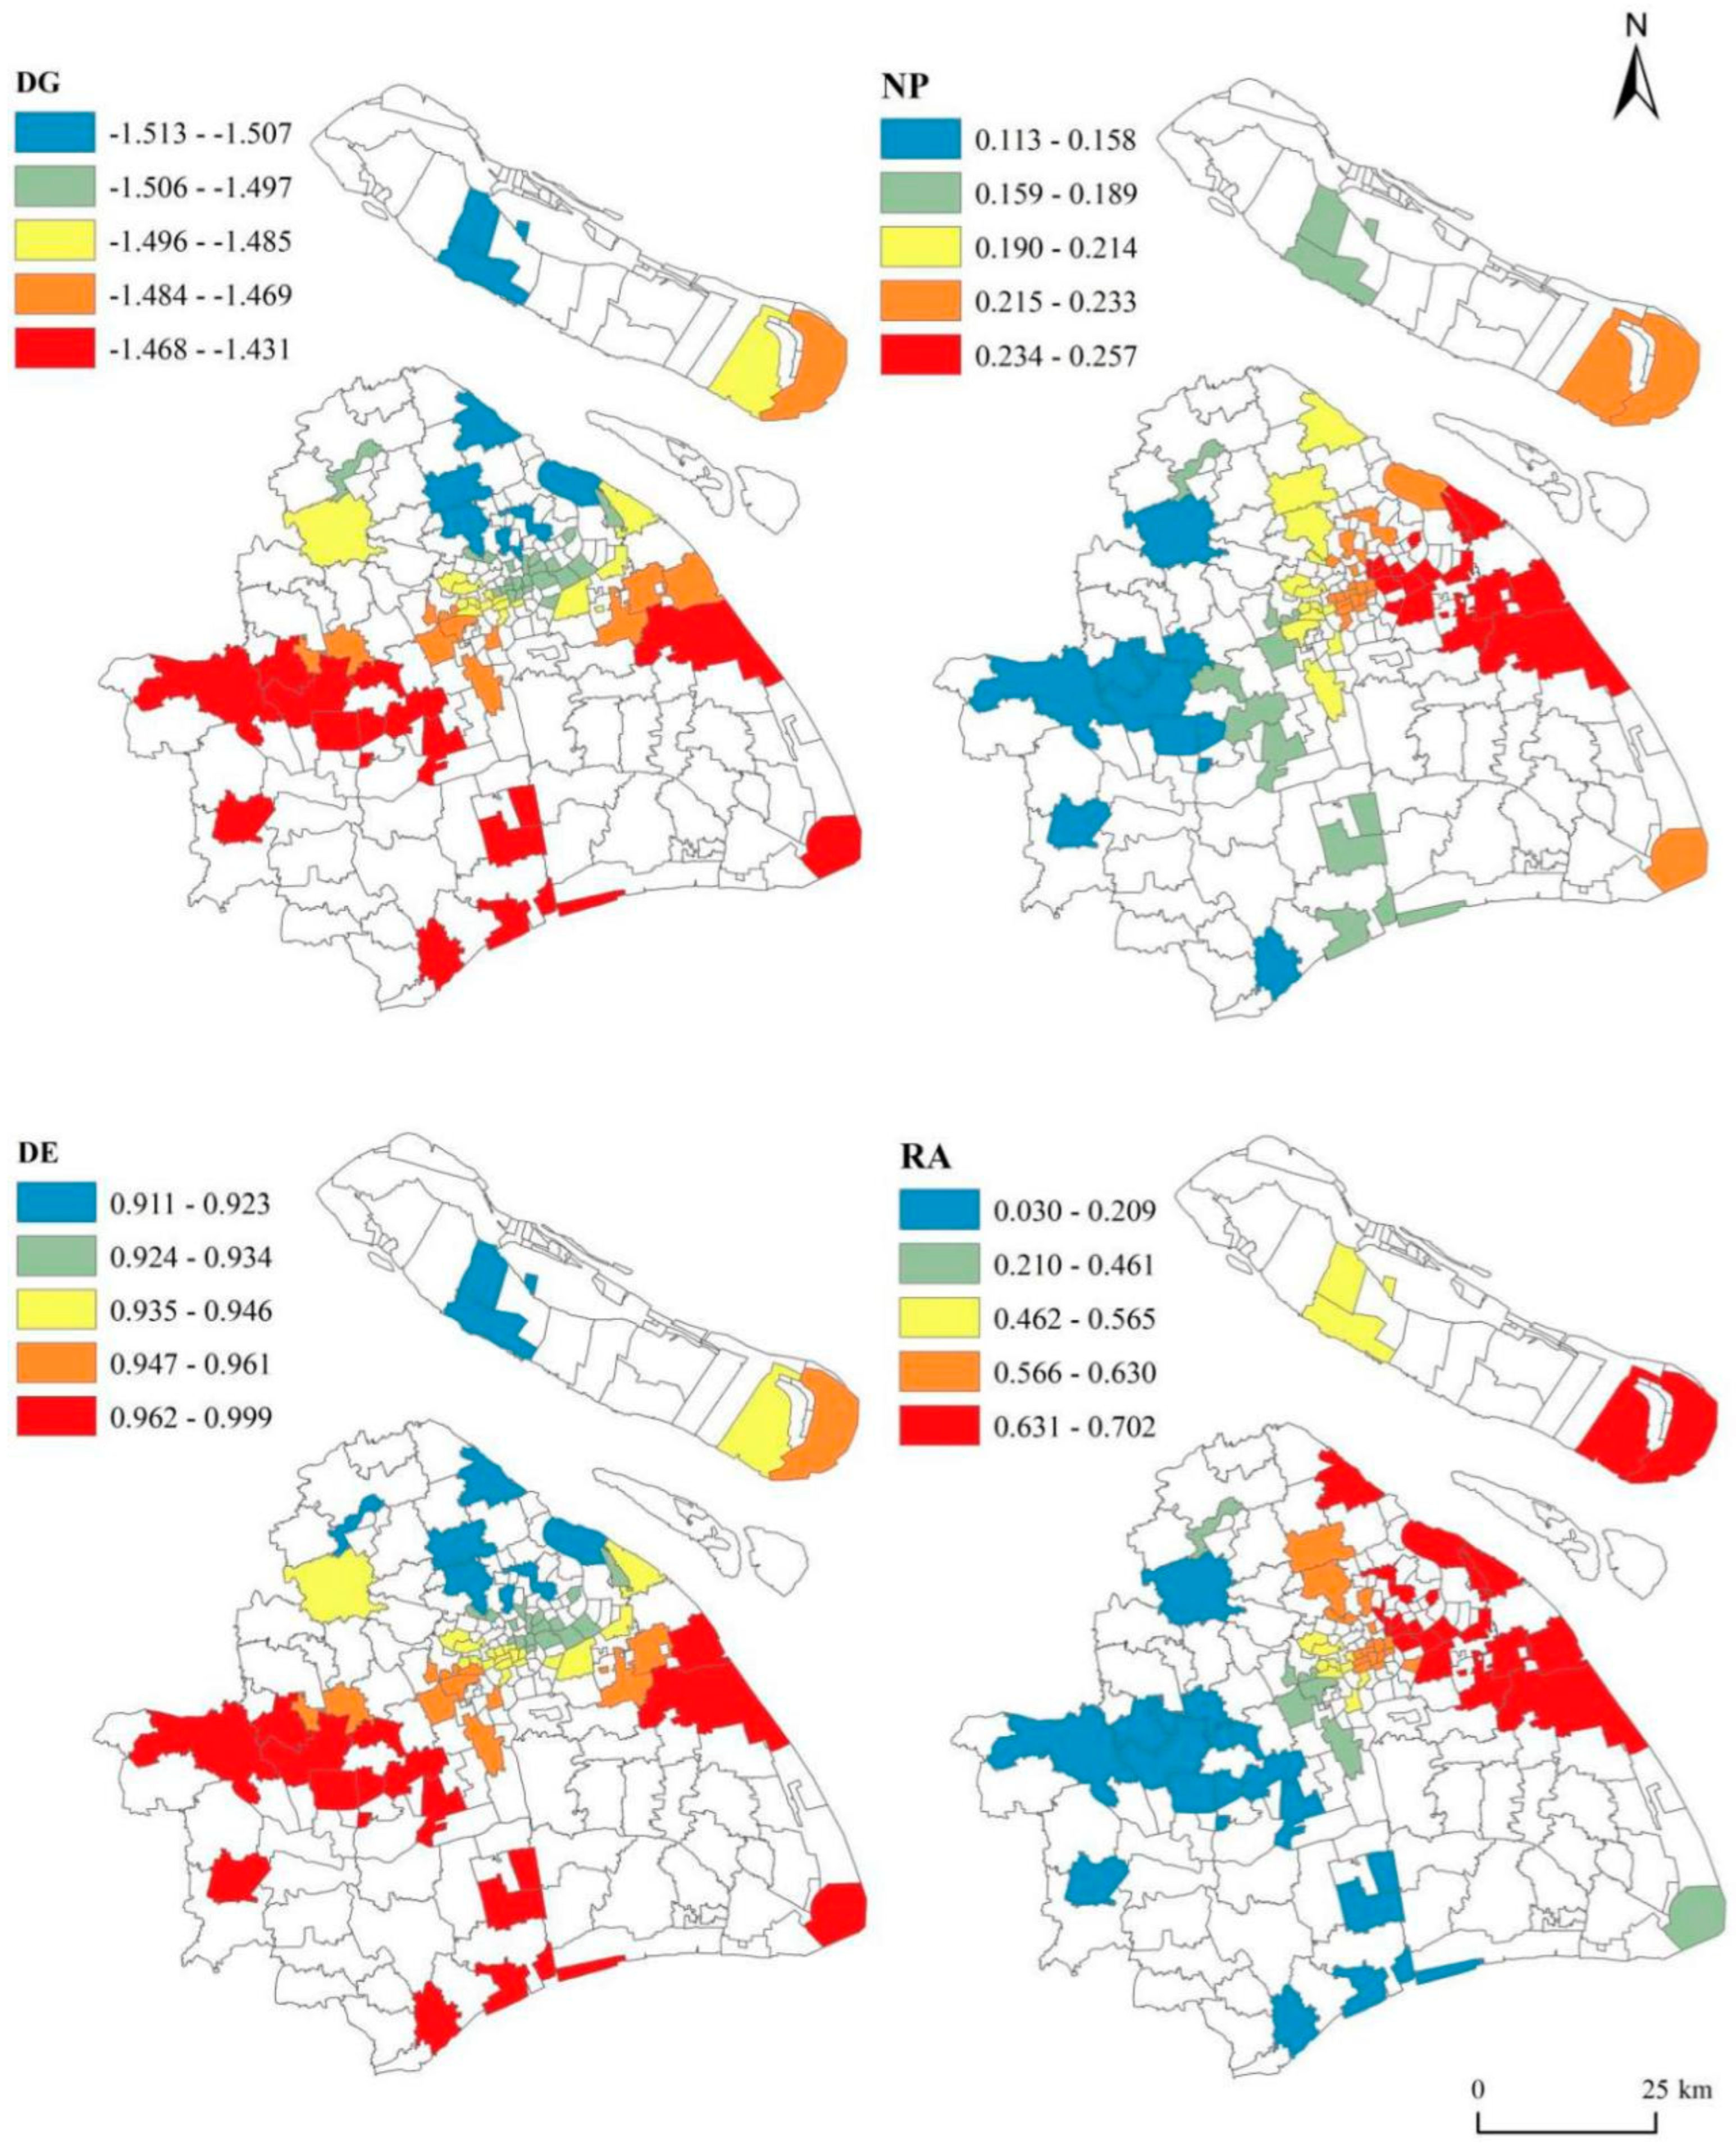
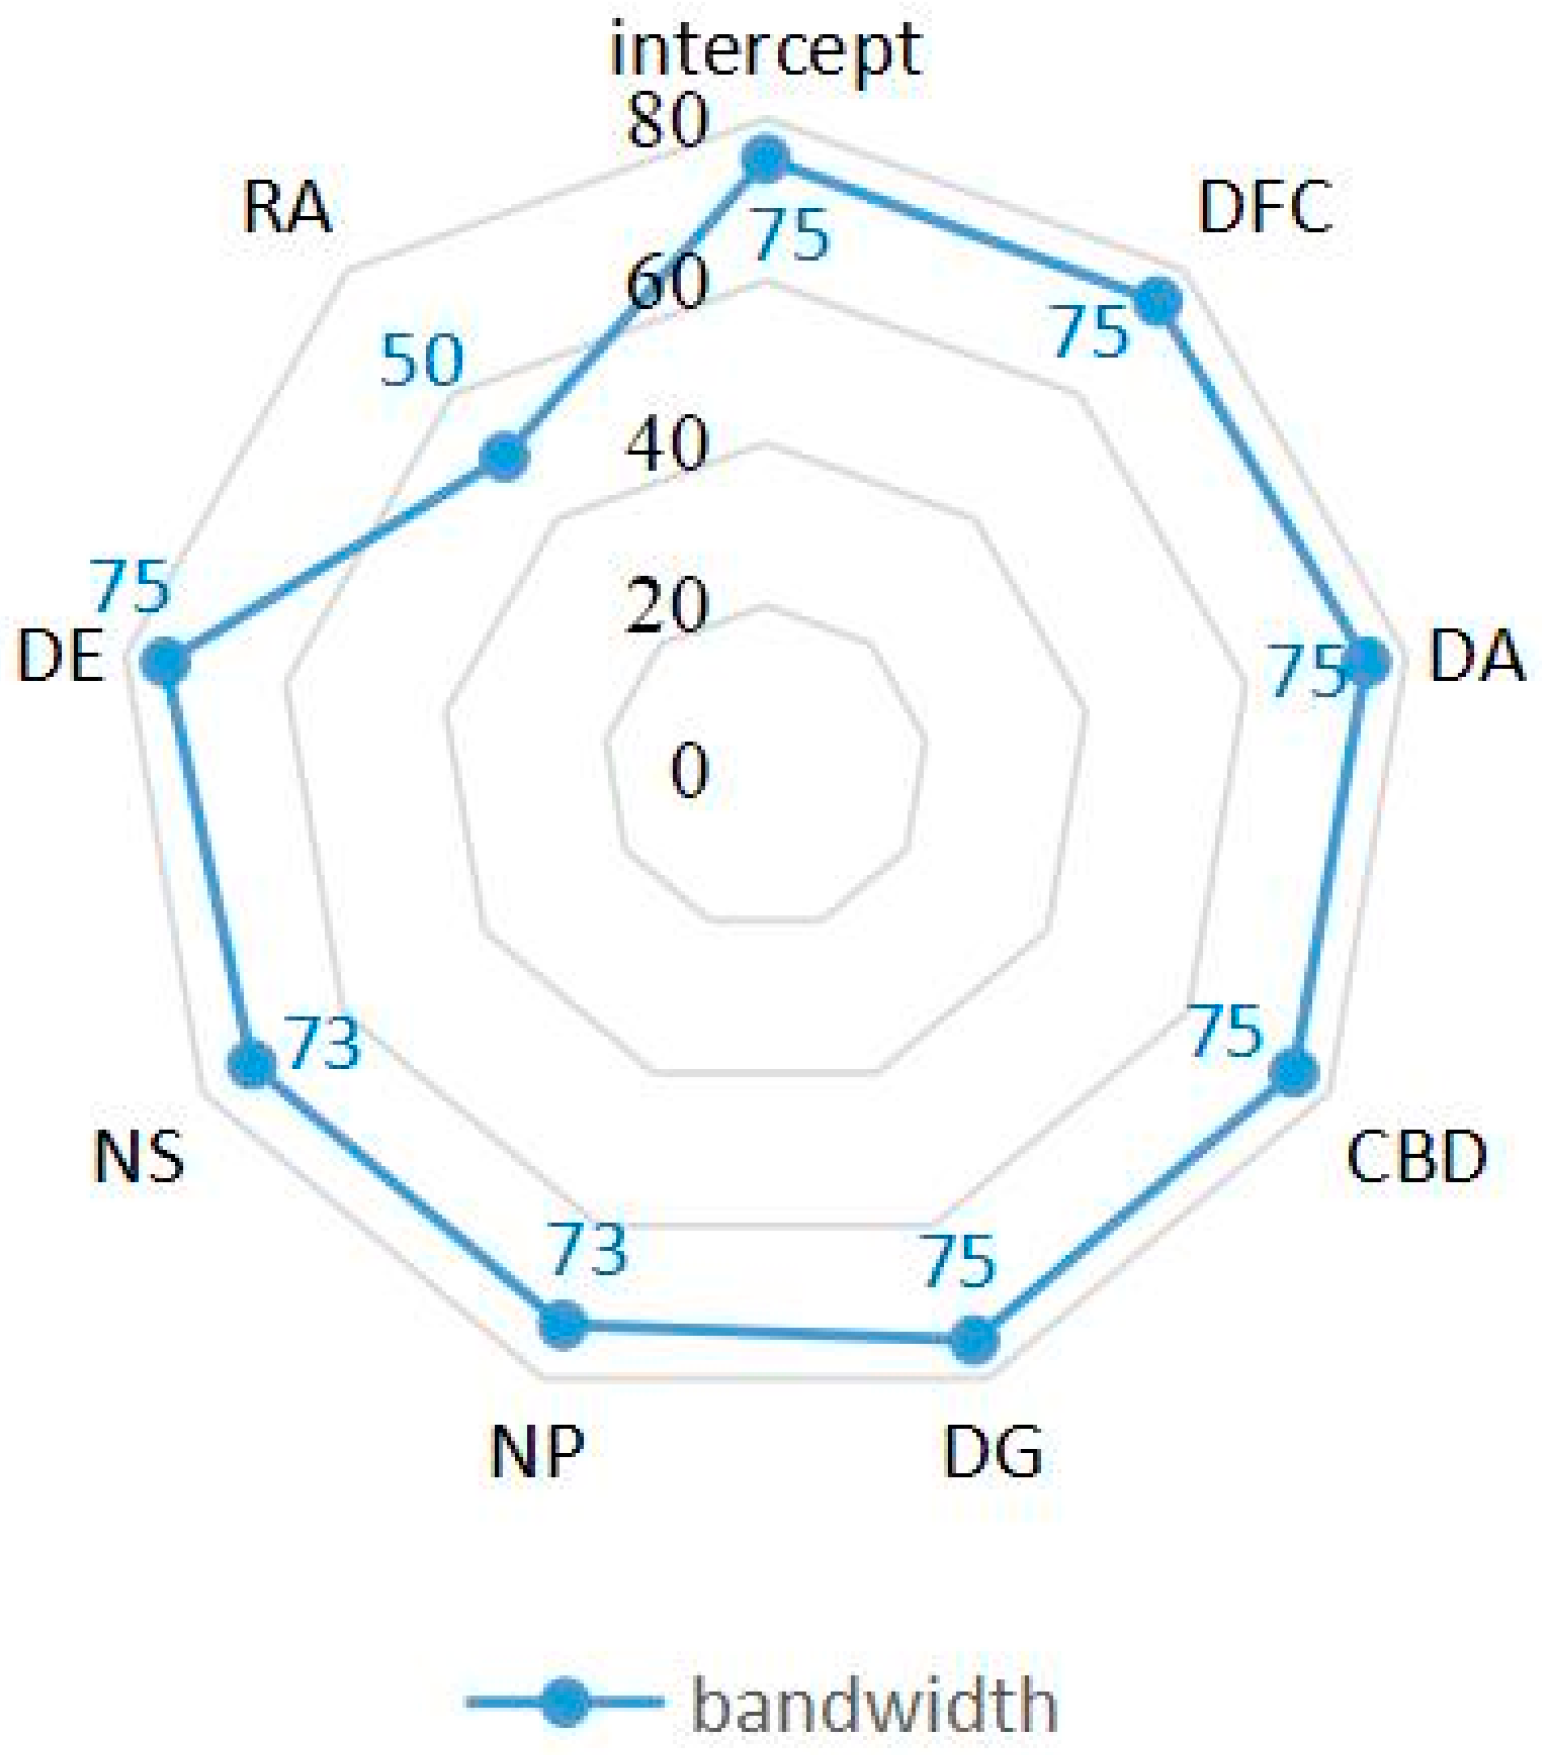
5. Factors of Luxury Hotel Location

In the analysis of influencing factors on the spatial distribution of luxury hotels in Shanghai City, this study constructs the following three regression models: the OLS model, GWR model and MGWR model. Before calculating the model results, we conducted a collinearity test on the independent variables and the results showed that the variance expansion factor is less than 7, indicating that there is no collinearity between each variable. By analyzing the results of these three models (Table 5), it is found that the AICC values of OLS, GWR and MGWR are 194.085, 196.331 and 193.769, respectively. The R2 value gradually increases in OLS, GWR and MGWR, and the maximum value is found in the MGWR model (0.551). Thus, the fitting effect of the MGWR model is the best among the three models. In addition, the MGWR model has various bandwidth choices for different influencing factors, so the MGWR model is more suitable for studying the influencing factors of luxury hotel distribution in Shanghai City.
Firstly, the results of the MGWR model are analyzed. It can be found from the estimation results that the distance to the nearest financial center (DFC), distance to the nearest airport (DA), distance to the nearest business center (CBD), number of subway stations (NS) in each zone and other variables have no significant impact on the number of luxury hotels in Shanghai City. Distance to municipal government (DG) has a significant negative impact on the number of luxury hotels, indicating that the closer the area is to the municipal government, the fewer hotels there are. The number of parks in each zone (NP) has a significant positive impact on the number of luxury hotels. The more parks distributed in the subdistricts, the more luxury hotels there are. For distance to the World Expo (DE), the luxury hotels are closer to the Expo and the more hotels there are. Meanwhile, the room rate (RA) has a positive correlation with the distribution of luxury hotels. The average prices of hotel rooms are higher and the more luxury hotels are distributed in the subdistricts. It is worth mentioning that from the coefficient β in absolute terms, distance to municipal government (DG) is the most dominant influence on the distribution of luxury hotels.
Secondly, this study uses ArcGIS 10.2.2 software to visualize the regression coefficients of variables with significant influencing factors, as shown in Figure 7. Different variables have significant spatial differences in the number of luxury hotels in different subdistricts of Shanghai City. There is a negative correlation between distance to municipal government and the distribution of luxury hotels. The higher negative value mainly appears in the north subdistricts of the city, mainly in the Baoshan District and Chongming District. The number of parks in each zone (NP) has a positive correlation with the number of luxury hotels in the subdistricts of Shanghai City. The high values of the regression coefficient are mainly distributed in the eastern zones of the city, such as Pudong New Area and Huangpu District. The low value areas are mainly distributed in the subdistricts of the Jiading District, Qingpu District and Songjiang District. This shows that the number of parks in each zone (NP) has a greater impact on the distribution of luxury hotels in the eastern part of Shanghai City, and a smaller impact on the distribution of luxury hotels in the western part of the city. The distance to the World Expo (DE) has a positive correlation with the number of luxury hotels in the subdistricts. The high value areas of the regression coefficient are mainly distributed in the subdistricts of the Qingpu District, Songjiang District, Pudong New Area and Jinshan District, while the low value areas of the regression coefficient are mainly distributed in the subdistricts of Baoshan District, Jiading District and Songming District in the north of the city; this shows that distance to the World Expo has a relatively small impact on the spatial distribution of luxury hotels in these subdistricts. On the whole, the impact of distance to the World Expo on the distribution of luxury hotels gradually decreases from the south to the north in Shanghai City. The room rate (RA) also shows a positive correlation with the number of luxury hotels in the subdistricts, and its regression coefficient gradually decreases from the northeast to the southwest of Shanghai City, which indicates that room rate has small impact on the number of luxury hotels in the Qingpu District, Songjiang District and Jinshan District, but it has a significant impact on the number of luxury hotels in Pudong New Area, Baoshan District and Chongming District.
Finally, according to the influencing factors of the distribution of luxury hotels in Shanghai City, this study further carried out the analysis of their scale effects. Figure 8 shows the different bandwidths of each variable in the MGWR model, that is, different variables have an appropriate bandwidth to reflect the scale effect. This can explain the spatial change degree of the factors that affect the distribution of luxury hotels. However, it is only the average bandwidths of each variable in the GWR model, and the scale difference of influencing factors that are not reflected. Among the significant independent variables, the bandwidth of these factors from small to large includes room rate (RA), number of parks in each zone (NP), distance to municipal government (DG) and distance to the World Expo (DE). The bandwidth value of room rate is 50, indicating that the effect of room rate on the distribution of luxury hotels is limited to 51 subdistricts, and its effect shows significant spatial heterogeneity outside the subdistricts. The bandwidth value of the number of parks in each zone is 73 and it shows that the impact on the distribution of luxury hotels has increased to 73 subdistricts. Therefore, these two variables have significant spatial non-stationarity and scale effects. In addition, the bandwidth values of distance to the World Expo and distance to municipal government are the largest (75), indicating that these two variables act on a global scale, and there is no obvious spatial difference in their effects.
Other variables are not significant and will not be discussed here.

6. Conclusions and Discussion

This study analyses the spatial-temporal distributions of luxury hotels and identifies underlying factors of the distributional dynamics by using a range of spatial statistical tools and the MGWR model. We found that the distribution of luxury hotels in Shanghai City is mainly concentrated in the central city within the inner ring road, which has formed a mono-central cluster pattern in the metropolitan area. This finding is consistent with the observation made by Egan and Nield [14] that luxury hotels prefer a central location because their higher room rates that target affluent guests are likely to cover the higher land values associated with a central location. Overall, the spatial locations of luxury hotels in Shanghai City spread gradually from the city center to suburban areas during the research period. Shanghai’s luxury hotels developed quickly and presented an overall agglomeration from 2000, and the luxury hotels are characterized by high-concentration development, which became increasingly obvious in the research period.
Institutional proximity, green space, mega events, and room rate are the primary factors in influencing the locational choices of luxury hotels in Shanghai City. Institutional proximity has a negative impact on the distribution of the number of luxury hotels. For Shanghai City, the municipal government is mostly located in the central area of the city. The high land price and serious traffic congestion problems in this area not only increase the operating cost of luxury hotels, but also may limit their future development opportunity. Therefore, from the distribution of luxury hotels, the location around the municipal government is not a suitable area. The finding that regional green environments are paramount to hotel location also supports previous research [40]. A perfect urban landscape is more likely to result in the higher satisfaction of hotel guests, and in turn, they may revisit. This study also unveiled that the Expo 2010 Shanghai had a significant impact on luxury hotel’s location decisions. Luxury hotels with a higher land rent affordability were likely to be located around the Expo core area. This result reinforces the previous findings from Zhang et al. [51] that the relationship between mega-events and hotel location choices was important in China. Generally, the room rate is related to the service quality of the hotel and the results show that the location sites of luxury hotels associated with advantages of green environments, and service quality are assumed to be endowed with higher demand for business travelers and more developed public infrastructure systems. This finding supports the common notion that with attractive green environments and high-quality service, the region becomes increasingly welcoming for clients who stay at luxury hotels [25]. In summary, the spatial pattern of formation and evolution of the luxury hotels corresponded with the urban spatial development pattern and the urban function structure evolution. Various elements, such as institutional proximity, regional green landscape, and mega events, and the room rate of hotels, effectively promote the agglomeration and decentralization of the luxury hotel through mutually influenced comprehensive mechanisms.
This research has several policy implications in the following aspects. On the one hand, when new luxury hotel entrants choose a location in metropolitan settings, it is essential for them to identify the most important regional factors in choosing an attractive destination to expand to. On the other hand, the result is useful in assisting luxury hotel investor’s assessment in identifying a potential location in Shanghai City. The spatial distribution of luxury hotels in Shanghai City is very imbalanced and we anticipate that some peripheral areas in Shanghai City have potential for future luxury investment. Meanwhile, mega-event zones (the Expo site) have experienced market saturation and a decline in occupancy rate and it is necessary for hotel investors to think about the long term for luxury hotel development and expansion. In addition, the level of regional green environments can effectively improve the hotel service quality, and the room rate is a direct reflection of the hotel service quality. Therefore, luxury hotels with excellent green environments and high room rates may be the first choice for investors.
This study is also of interest to urban planners and based on the analytical results, various exogenous factors of luxury hotel location provide useful suggestions for urban planning. Green environments and construction conditions are significant variables, so urban planners need to consider these factors to boost their chances of attracting luxury hotels. Increasing the construction of park green landscapes is a necessary measure to promote the development of the hotel service industry. Since luxury hotel location selection in Shanghai City is influenced by several dimensions of regional factors, there is a need for a holistic understanding of the hotel industry and the regional economy by the urban planners. As the regional factors that influence a luxury hotel’s location are now known, it is possible for urban planners to project future spatial growth patterns of luxury hotels and identify areas of strengths and weaknesses to attract luxury hotels in the future.
Finally, several limitations may hinder the applicability of our findings that need to be addressed in future research. First, due to data unavailability, there are exogenous factors that are not taken into consideration in this paper. For example, during certain periods of time, the Chinese government played a dominant role in the selection of hotel location [20], and policy issues are complex and vary across regions [51]. Therefore, the variables tested in the study’s models need to consider more sophisticated factors, such as regional policy, institutions, land-use changes and FDI projects. Second, we cannot consider any of the hotel’s characteristics in the current study, such as number of rooms, revenues, and profit; if these data could have been obtained and examined in this research, the results would be more convincing to shed light on the choice of luxury hotel location. Finally, we also acknowledge that performance and development strategies affect the location selection of luxury hotels in a way that the empirical model was not able to consider, owing to the limitation of the data source. With regard to future work, it is possible to analyze hotel location choice at the company level. As the era of big data is approaching, the integrated application of big data and spatial information technology is becoming mainstream and the use of these methods to analyze hotel location selection in a more meticulous manner is the direction of future studies.

Author Contributions

H.Z. analyzed the data and wrote the manuscript. T.G. investigated the data of the manuscript. L.Y. helped in the organization and improvement of the manuscript. X.X. provided the method analysis of the manuscript. All authors have read and agreed to the published version of the manuscript.

Funding

This research was funded by the Key Program for Cultivating First-rate Disciplines of Henan University (Grant No. G21001G).

Institutional Review Board Statement

Not applicable.

Informed Consent Statement

Not applicable.

Data Availability Statement

Not applicable.

Conflicts of Interest

The authors declare no conflict of interest.

References

  1. Kim, J.; Okamoto, N. Importance analysis on hotel components from a manager’s perspective: Using conjoint analysis. Asia Pac. J. Tour. Res. 2006, 11, 227–238. [Google Scholar] [CrossRef]
  2. Adam, I.; Amuquandoh, F.E. Dimensions of hotel location in the Kumasi Metropolis, Ghana. Tour. Manag. Perspect. 2013, 8, 1–8. [Google Scholar] [CrossRef]
  3. Yang, Y.; Roehl, W.S.; Huang, J.H. Understanding and projecting the restaurant scape: The influence of neighborhood sociodemographic characteristics on restaurant location. Int. J. Hosp. Manag. 2017, 67, 33–45. [Google Scholar] [CrossRef]
  4. Lockyer, T. Understanding the dynamics of the hotel accommodation pur-chase decision. Int. J. Contemp. Hosp. Manag. 2005, 17, 481–492. [Google Scholar] [CrossRef]
  5. Lim, C.; Loh, S. Gen Y consumers’ perceptions of quick service restaurant andthe mediating role of purchase intentions–A case study of McDonald’s inSingapore. Eur. J. Tour. Res. 2014, 7, 31–44. [Google Scholar] [CrossRef]
  6. Sainaghi, R. RevPAR determinants of individual hotels: Evidences from Milan. Int. J. Contemp. Hosp. Manag. 2011, 23, 297–311. [Google Scholar] [CrossRef]
  7. Haghighi, M.; Dorosti, A.; Rahnama, A.; Hoseinpour, A. Evaluation of factorsaffecting customer loyalty in the restaurant industry. Afr. J. Bus. Manag. 2012, 6, 5039–5046. [Google Scholar]
  8. Ahmadi-Javid, A.; Seyedi, P.; Syam, S.S. A survey of healthcare facility location. Comput. Oper. Res. 2017, 79, 223–263. [Google Scholar] [CrossRef]
  9. Urtasun, A.; Gutiérrez, I. Hotel location in tourism cities: Madrid 1936–1998. Ann. Tour. Res. 2006, 33, 382–402. [Google Scholar] [CrossRef]
  10. Luo, H.; Yang, Y. Intra-metropolitan location choice of star-rated and non-rated budget hotels: The role of agglomeration economies. Int. J. Hosp. Manag. 2016, 59, 72–83. [Google Scholar] [CrossRef]
  11. Rogerson, J.M. The changing location of hotels in South Africa’s coastal cities, 1990–2010. Urban Forum 2012, 23, 73–91. [Google Scholar] [CrossRef]
  12. Yang, Y.; Luo, H.; Law, R. Theoretical, empirical, and operational models in hotel location research. Int. J. Hosp. Manag. 2014, 36, 209–220. [Google Scholar] [CrossRef]
  13. Roginsky, R.J. A critical analysis of hotel impact issues. Cornell Hotel. Adm. Q. 1995, 13, 12–19. [Google Scholar] [CrossRef]
  14. Egan, D.J.; Nield, K. Towards a theory of intraurban hotel location. Urban Stud. 2000, 37, 611–621. [Google Scholar] [CrossRef]
  15. Shoval, N. The geography of hotels in cities: An empirical validation of a forgotten model. Tour. Geogr. 2006, 8, 56–75. [Google Scholar] [CrossRef]
  16. Kalnins, A.; Chung, W. Resource-seeking agglomeration: A study of market entry in the lodging industry. Strateg. Manag. J. 2004, 25, 689–699. [Google Scholar] [CrossRef]
  17. Baum, J.A.C.; Haveman, H.A. Love thy neighbor? Differentiation and agglomeration in the Manhattan hotel industry, 1898–1990. Adm. Sci. Q. 1997, 42, 304–338. [Google Scholar] [CrossRef]
  18. Bloomfield, G.T. Lodging at the interchange in London, Ontario. Can. Geogr. 1996, 40, 173–180. [Google Scholar] [CrossRef]
  19. Holl, A. Transport infrastructure, agglomeration economies, and firm birth: Empirical evidence from Portugal. J. Reg. Sci. 2004, 44, 693–712. [Google Scholar] [CrossRef]
  20. Yang, Y.; Wong, K.K.F.; Wang, T. How do hotels choose their location? Evidence from hotels in Beijing. Int. J. Hosp. Manag. 2012, 31, 675–685. [Google Scholar] [CrossRef]
  21. Yang, Y.; Tang, J.; Luo, H.; Law, R. Hotel location evaluation: A combination of machine learning tools and web GIS. Int. J. Hosp. Manag. 2015, 47, 14–24. [Google Scholar] [CrossRef]
  22. Tarras, J. Location, location, location. Restaur. Hosp. 1991, 75, 84. [Google Scholar]
  23. Roehl, W.S.; Van Doren, C.S. Locational characteristics of American resort hotels. J. Cult. Geogr. 1990, 11, 71–83. [Google Scholar] [CrossRef]
  24. Alias, A.; Tan, S.B. Key determinants for marketing and operational strategies of hotel business. J. Surv. Constr. Prop. 2014, 5, 1–7. [Google Scholar] [CrossRef]
  25. Yang, Z.; Cai, J. Do regional factors matter? Determinants of hotel industry performance in China. Tour. Manag. 2016, 52, 242–253. [Google Scholar] [CrossRef]
  26. Luo, H.; Yang, Y. Spatial pattern of hotel distribution in China. Tour. Hosp. Res. 2013, 13, 3–15. [Google Scholar] [CrossRef]
  27. Yue, L.; Zhao, H.; Xu, X.; Gu, T.; Jia, Z. Quantifying the Spatial Fragmentation Pattern and Its Influencing Factors of Urban Land Use: A Case Study of Pingdingshan City, China. Land 2022, 11, 686. [Google Scholar] [CrossRef]
  28. Lao, X.; Gu, H.; Yu, H.; Xiao, F. Exploring the Spatially-Varying Effects of Human Capital on Urban Innovation in China. Appl. Spat. Anal. Policy 2021, 14, 827–848. [Google Scholar] [CrossRef]
  29. Alcácer, J.; Chung, W. Location strategies for agglomeration economies. Strateg. Manag. J. 2014, 35, 1749–1761. [Google Scholar] [CrossRef]
  30. Canina, L.; Enz, C.A.; Harrison, J.S. Agglomeration effects and strategic orientations: Evidence from the U.S. lodging industry. Acad. Manag. J. 2005, 148, 565–581. [Google Scholar] [CrossRef]
  31. Enz, C.A.; Canina, L.; Liu, Z. Competitive dynamics and pricing behavior in UShotels: The role of co-location. Scand. J. Hosp. Tour. 2008, 8, 230–250. [Google Scholar] [CrossRef]
  32. Ingram, P.; Inman, C. Institutions, intergroup competition, and the evolution of hotel populations around Niagara falls. Adm. Sci. Q. 1996, 41, 629–658. [Google Scholar] [CrossRef]
  33. Arauzo-Carod, J.-M.; Liviano-Solis, D.; Manjón-Antolín, M. Empirical studiesin industrial location: An assessment of their methods and results. J. Reg. Sci. 2010, 50, 685–711. [Google Scholar] [CrossRef]
  34. Guimarães, P.; Figueiredo, O.; Woodward, D. Industrial location modeling: Extending the random utility framework. J. Reg. Sci. 2004, 44, 1–20. [Google Scholar] [CrossRef]
  35. Li, M.; Fang, L.; Huang, X.; Goh, C. A spatial-temporal analysis of hotels in urban tourism destination. Int. J. Hosp. Manag. 2015, 45, 34–43. [Google Scholar] [CrossRef]
  36. Zhang, H.; Zhang, J.; Lu, S.; Cheng, S. Modeling hotel room price with geographically weighted regression. Int. J. Hosp. Manag. 2011, 30, 1036–1043. [Google Scholar] [CrossRef]
  37. Pan, F.C. Practical application of importance-performance analysis in determining critical job satisfaction factors of a tourist hotel. Tour. Manag. 2015, 46, 84–91. [Google Scholar] [CrossRef]
  38. Prayag, G.; Hosany, S. Human resource development in the hotel industry of Mauritius: Myth or reality? Curr. Issues Tour. 2015, 18, 249–266. [Google Scholar] [CrossRef]
  39. Newell, G.; Seabrook, R. Factors influencing hotel investment decision making. J. Prop. Investig. Financ. 2006, 24, 279–294. [Google Scholar] [CrossRef]
  40. Sainaghi, R.; Baggio, R. Structural social capital and hotel performance: Is there a link? Int. J. Hosp. Manag. 2014, 37, 99–110. [Google Scholar] [CrossRef]
  41. Lin, B.-H.; Liu, H.-H. A study of economies of scale and economies of scope in Taiwan international tourist hotels. Asia Pac. J. Tour. Res. 2000, 5, 21–28. [Google Scholar] [CrossRef]
  42. Lee, M.J.; Jang, S. Market diversification and financial performance and stability: A study of hotel companies. Int. J. Hosp. Manag. 2007, 26, 362–375. [Google Scholar] [CrossRef]
  43. Nieves, J.; Segarra-Ciprés, M. Management innovation in the hotel industry. Tour. Manag. 2015, 46, 51–58. [Google Scholar] [CrossRef]
  44. Xiao, Q.; O’Neill, J.W.; Mattila, A.S. The role of hotel owners: The influence of corporate strategies on hotel performance. Int. J. Contemp. Hosp. Manag. 2012, 24, 122–139. [Google Scholar] [CrossRef]
  45. Assaf, A.G.; Josiassen, A.; Agbola, F.W. Attracting international hotels: Locational factors that matter most. Tour. Manag. 2015, 47, 329–340. [Google Scholar] [CrossRef]
  46. Parte-Esteban, L.; Alberca-Oliver, P. Determinants of technical efficiency in the Spanish hotel industry: Regional and corporate performance factors. Curr. Issues Tour. 2013, 18, 391–411. [Google Scholar] [CrossRef]
  47. Johnson, C.; Vanetti, M. Locational strategies of international hotel chains. Ann. Tour. Res. 2005, 32, 1077–1099. [Google Scholar] [CrossRef]
  48. Dwyer, L.; Forsyth, P. Impacts and benefits of mice tourism: A framework for analysis. Tour. Econ. 1997, 3, 21–38. [Google Scholar] [CrossRef]
  49. Lee, C.; Taylor, T. Critical reflections on the economic impact assessment of a mega-event: The case of 2002 FIFA World Cup. Tour. Manag. 2005, 26, 595–603. [Google Scholar] [CrossRef]
  50. Malfas, M.; Theodoraki, E.; Houlihan, B. Impacts of the Olympic games as mega-events. Munic. Eng. 2004, 157, 209–220. [Google Scholar] [CrossRef]
  51. Zhang, H.Q.; Guillet, B.D.; Gao, W. What determines multinational hotel groups’ locational investment choice in China? Int. J. Hosp. Manag. 2012, 31, 350–359. [Google Scholar] [CrossRef]
  52. Wall, G.; Dudycha, D.; Hutchinson, J. Point pattern analyses of accommodation in Toronto. Ann. Tour. Res. 1985, 12, 603–618. [Google Scholar] [CrossRef]
  53. Adam, I. Urban hotel development patterns in the Kumasi Metropolis, Ghana. Tour. Plan. Dev. 2013, 10, 85–98. [Google Scholar] [CrossRef]
  54. Rigall-I-Torrent, R.; Fluvià, M. Public goods in tourism municipalities: Formal analysis, empirical evidence and implications for sustainable development. Tour. Econ. 2007, 13, 361–378. [Google Scholar] [CrossRef]
  55. Rigall-I-Torrent, R.; Fluvià, M. Managing tourism products and destinations embedding public good components: A hedonic approach. Tour. Manag. 2011, 32, 244–255. [Google Scholar] [CrossRef]
  56. Barros, C.P. Evaluating the efficiency of a small hotel chain with a Malmquist productivity index. Int. J. Tour. Res. 2005, 7, 173–184. [Google Scholar] [CrossRef]
  57. Zheng, T. What caused the decrease in RevPAR during the recession? An ARIMA with intervention analysis of room supply and market demand. Int. J. Contemp. Hosp. Manag. 2014, 26, 1225–1242. [Google Scholar] [CrossRef]
  58. Assaf, A.G.; Josiassen, A.; Woo, L.; Agbola, F.W.; Tsionas, M. Destination characteristics that drive hotel performance: A state-of-the-art global analysis. Tour. Manag. 2017, 60, 270–279. [Google Scholar] [CrossRef]
  59. Bégin, S. The geography of a tourist business: Hotel distribution and urban development in Xiamen, China. Tour. Geogr. 2000, 2, 448–471. [Google Scholar] [CrossRef]
  60. Shoval, N.; Cohen-Hattab, K. Urban hotel development patterns in the face of political shifts. Ann. Tour. Res. 2001, 28, 908–925. [Google Scholar] [CrossRef]
  61. Oppermann, M.; Din, K.; Amri, S.Z. Urban hotel location and evolution in a developing country: The case of Kuala Lumpur, Malaysia. Tour. Recreat. Res. 1996, 21, 55–63. [Google Scholar] [CrossRef]
  62. Freedman, M.L.; Kosová, R. Agglomeration, product heterogeneity and firmentry. J. Econ. Geogr. 2012, 12, 601–626. [Google Scholar] [CrossRef]
  63. Egan, D.J.; Chen, W.; Zhang, Y. The intra-urban location of hotels in the Chinese cities of Beijing, Shanghai & Shenzhen. China Tour. Res. 2006, 2, 516–530. [Google Scholar]
  64. Awaritefe, O.D. Evaluating tourism resource areas in Nigeria for development. Tour. Rev. 2007, 62, 37–45. [Google Scholar] [CrossRef]
  65. Islam, M. Spatial Distribution of Market Centers. Int. Res. J. Bus. Stud. 2018, 10, 135–146. [Google Scholar] [CrossRef]
  66. Anselin, L. Specification tests on the structure of interaction in spatial econometric models. Pap. Reg. Sci. 1984, 54, 165–182. [Google Scholar] [CrossRef]
  67. Anselin, L. Local indicator of spatial association-lisa. Geogr. Anal. 1995, 27, 91–115. [Google Scholar] [CrossRef]
  68. Gu, H.; Yu, H.; Sachdeva, M.; Liu, Y. Analyzing the distribution of researchers in China: An approach using multiscale geographically weighted regression. Growth Chang. 2020, 52, 443–459. [Google Scholar] [CrossRef]
  69. Lao, X.; Gu, H. Unveiling various spatial patterns of determinants of hukou transfer intentions in China: A multi-scale geographically weighted regression approach. Growth Chang. 2020, 51, 1860–1876. [Google Scholar] [CrossRef]
  70. Leonidou, L.C.; Leonidou, C.N.; Fotiadis, T.A.; Zeriti, A. Resources and capabilities as drivers of hotel environmental marketing strategy: Implications for competitive advantage and performance. Tour. Manag. 2013, 35, 94–110. [Google Scholar] [CrossRef]
Figure 1. The technical flowchart of this study.
Land 11 01690 g001
Figure 2. Quantitative description of luxury hotels location in Shanghai metropolitan area (2015).
Land 11 01690 g002
Figure 3. Lorenz curve of luxury hotel distribution in Shanghai City.
Land 11 01690 g003
Figure 4. Spatial distribution of luxury hotels in Shanghai City.
Land 11 01690 g004
Figure 5. The barycenter distribution (left) and standard deviational ellipse (SDE) map (right) of luxury hotel locations from 1995 to 2015.
Land 11 01690 g005
Figure 6. LISA spatial cluster map of all luxury hotels in Shanghai.
Land 11 01690 g006
Figure 7. Spatial patterns of estimators of variables.
Land 11 01690 g007
Figure 8. Bandwidths for influencing factors in the MGWR model.
Land 11 01690 g008
Table 1. The descriptive statistics of model variables.
IndicatorsMeasurementUnite
Transportation accessibilityNumber of subway stations in each zone (NS)Number
Distance to the nearest airport (DA)Km
Market demandDistance to the nearest financial center (DFC)Km
Business environmentDistance to the nearest business center (CBD)Km
Room rate (RA)Yuan
Institutional proximityDistance to municipal government (DG)Km
Green spaceNumber of parks in each zone (NP)Number
Mega eventsDistance to the World Expo (DE)Km
Table 2. Descriptive statistics of luxury hotels characteristics in Shanghai City.
Year of OpeningNumber of Luxury HotelsPercentTotal Number of RoomsPercent
Before 1995138.1346249.56
1995–2000116.8846609.64
2001–20051911.87704114.56
2006–20107446.2520,92443.28
2010–20154326.8711,10422.96
Table 3. The nearest neighbor index (NNI) of luxury hotels.
SampleAverage Distance
to the Nearest
Neighbor (m)
Expect Distance to the Nearest Neighbor (m)The Nearest Neighbor IndexZ-Test ValueSignificance Level
199513971031.01−0.37Non-significant
2000241862300.81−1.770.1
2005433214430.72−3.450.05
20101171653290.49−10.310.01
20151601713410.47−12.380.01
Table 4. Moran’s I index for luxury hotels in Shanghai.
YearMoran’s I Valuep-ValueZ(I)-Score
19950.2680.0017.775
20100.3140.0019.089
20150.4520.00112.76
Table 5. Model results of OLS, GWR, and MGWR.
VariablesModel1: OLSModel2: GWRModel3: MGWR
βTβTBandwidthsβTBandwidths
Intercept00−0.027−0.263 −0.079−0.615
DFC0.0580.1780.3280.653750.2150.45675
DA0.307 *1.4220.2771.224750.2381.07275
CBD0.0030.0080.0000.00475−0.052−0.13875
DG−0.424−0.685−1.206 **−1.61775−1.488 ***−2.03675
NP0.14 *1.3730.213 ***1.929750.208 **1.89273
NS0.090.7880.0870.753750.0870.77773
DE−0.032−0.0530.4810.700750.943 *1.38275
RA0.486 ***4.9270.507 ***4.945750.487 ***3.90850
AICc194.085196.331193.769
R20.4470.5040.551
Adj.R20.3810.4030.445
Notes: β represents the average estimates of variables. T represents the average t values of variables. * p < 0.10; ** p < 0.05; *** p < 0.01.
Publisher’s Note: MDPI stays neutral with regard to jurisdictional claims in published maps and institutional affiliations.

