Article

Multi-Criteria GIS-Based Analysis for Mapping Suitable Sites for Onshore Wind Farms in Southeast France

1
Faculty of Geography and Planning, University of Strasbourg, 3, rue de l’Argonne, 67000 Strasbourg, France
2
Mathematics and Computer Science Research Training Unit, 7, rue René Descartes, 67084 Strasbourg, France
3
Department of Earth Sciences, Faculty of Sciences and Techniques of Tangier, University Abdelmalek Essaadi, Tetouan 93000, Morocco
4
Institute of Applied Technology, Thu Dau Mot University, Thu Dau Mot 75000, Binh Duong Province, Vietnam
5
Remote Sensing Laboratory (2GRNT), Department of Geology, Geoscience, Geotourism, Natural Hazards, Faculty of Sciences Semlalia, University of Cadi Ayyad, BP 2390, Marrakesh 40000, Morocco
*
Author to whom correspondence should be addressed.
Land 2022, 11(10), 1839; https://doi.org/10.3390/land11101839
Submission received: 14 September 2022 / Revised: 13 October 2022 / Accepted: 14 October 2022 / Published: 19 October 2022
(This article belongs to the Special Issue Feature Papers for Land Innovations – Data and Machine Learning)

Abstract

:
Wind energy is critical to traditional energy sources replacement in France and throughout the world. Wind energy generation in France is quite unevenly spread across the country. Despite its considerable wind potential, the research region is among the least productive. The region is a very complicated location where socio-environmental, technological, and topographical restrictions intersect, which is why energy production planning studies in this area have been delayed. In this research, the methodology used for identifying appropriate sites for future wind farms in this region combines GIS with MCDA approaches such as AHP. Six determining factors are selected: the average wind speed, which has a weight of 38%; the protected areas, which have a relative weight of 26%; the distance to electrical substations and road networks, both of which have a significant influence on relative weights of 13%; and finally, the slope and elevation, which have weights of 5% and 3%, respectively. Only one alternative was investigated (suitable and unsuitable). The spatial database was generated using ArcGIS and QGIS software; the AHP was computed using Excel; and several treatments, such as raster data categorization and weighted overlay, were automated using the Python programming language. The regions identified for wind turbines installation are defined by a total of 962,612 pixels, which cover a total of 651 km2 and represent around 6.98% of the research area. The theoretical wind potential calculation results suggest that for at least one site with an area bigger than 400 ha, the energy output ranges between 182.60 and 280.20 MW. The planned sites appear to be suitable; each site can support an average installed capacity of 45 MW. This energy benefit will fulfill the region’s population’s transportation, heating, and electrical demands.

1. Introduction

Increased energy consumption in developed and developing countries as a result of prolonged economic growth [1] may lead to fast resource depletion, environmental degradation, biodiversity loss, and climate change [2,3,4]. Therefore, governments are required to focus their efforts on reducing greenhouse gas emissions and other environmental, social, and economic problems [5,6,7], as well as converting energy supply to green energy production methods.
Indeed, France generates electricity, heat, and transportation using a variety of energy sources. This energy mix includes nuclear, fossil fuels, and renewable sources. According to the Minister of Environmental Transition’s key energy numbers for 2021/2020, nuclear accounts for 40% of energy, oil for 28%, and natural gas for 16%. However, in France, renewable energy accounts for just 13% of total energy consumption [8]. Due to its support for activities concerned with the energy and ecological transition, as well as its obligations to reduce the dangers associated with global warming, France would want to see the 30% renewable energy target reached by 2030 [8].
Previous investigations have demonstrated that wind power is one of the most promising renewable energy sources [9,10,11,12]. It is becoming increasingly popular worldwide due to its several benefits, including simple access to efficient multi-megawatt wind turbines [13]. Furthermore, wind energy sources will supply more power than any other form of energy source by 2050 in the European Union’s renewable energy decarbonization scenario [14]. In addition, due to variables such as the availability of stronger and longer-lasting winds and land for installation, wind energy has recently become an important component of France’s increasing renewable energy sector. Currently, there are already 11,625 onshore wind turbines in France. Thus, wind power has increased its proportion of the country’s energy output from 2.2% 10 years ago to 7.9% in 2020, up from 6.1% in 2019 (https://www.revolution-energetique.com/, accessed on 2 July 2022). In addition, most wind turbines are unevenly spread across the Hauts-de-France and Grand-Est regions (as illustrated in Figure 1). Nonetheless, some regions, such as Aquitaine, Auvergne-Rhône-Alpes, and Provence-Alpes-Côte d’Azur, have insufficient infrastructures.
Many studies have reported significant environmental, social, economic, political, legal, and technological issues associated with wind farms sitting around the world [16]. To address these limits, geographic information systems (GIS) and hierarchical multi-criteria analysis (AHP) methodologies have been frequently adopted. These methods have recently been applied in various studies, including the identification of suitable sites for sitting solar farms [17,18,19,20,21] and suitable sites for marine wind farms [16,22,23,24,25,26,27].
Unfortunately, no study has been conducted in France on the application of multicriteria analysis approaches combined with GIS. However, there are studies that have been conducted on territories in Europe such as Greece [28,29] or southern Spain [30].
Different scenarios were considered. The result is a site suitability index map ranging from inadequate to highly suitable, which seems impractical for a sensitivity analysis of the overall site suitability index. Uncertainty is often inherent in such cases and leads to decision-making problems and inconsistency between decision makers’ preferences [31]. All this research has highlighted the capabilities of GIS-based multi-criteria analysis approaches to site selection for onshore wind farms while considering regulations, legislation, and other constraints.
The results vary from one study area to another depending on the area of the study area, its topography, its natural resources (wind, temperature, etc.), and the criteria chosen for the study and the weights assigned to the criteria.
We conducted this study with the aim of identifying suitable sites for the planning of future wind farm construction projects in an area that is extremely complex due to the existing constraints in the region, considering environmental or topographical factors. The proposed methodological approach can be applied to any region of the world by adapting the characteristics considered. The implementation of the proposed methodology could facilitate the achievement of national objectives in the energy sector and encourage energy interdependence between many geographical areas in France.
Thus, our study area choice is influenced by previously mentioned reasons, such as the lack of wind farms in this region, which has a high population and high-power consumption (including heating), as well as environmental and relief limits that make it difficult to find suitable sites. The research aims are as follows: (1) to promote the use of GIS-based multi-criteria analysis methodologies in decision-making processes; (2) to contribute to the country’s growth by providing cartographic and documentary materials related to wind projects; (3) to provide users with a Python code template that combines each component of the multi-criteria analysis technique for choosing potential onshore wind farm locations. By replacing the criteria, this code can be used for any research that involves decision making. Some of the pre-processing activities must be performed using GIS software such as QGIS or ArcGIS because they are not included in the source code.
It is hoped that this research will contribute to France’s efforts in spatial energy planning. Effective wind farm siting options, as outlined in this study, could help the state meet its energy goals and policies.

2. Study Area

The research area is in southeast France (Figure 2a), which is part of the Provence-Alpes-Côte d’Azur region and covers 80% of the Var department. Moreover, it is bounded to the west by the Bouches-du-Rhône department, to the north by the Alpes-de-Haute-Provence department, to the east by the Alpes-Maritimes department, and to the south by the Mediterranean Sea (Figure 2b). It has an area of 11,208 km2 with a perimeter of around 424 km (Figure 2c).
The study area is known for its Mediterranean climate, of the Trewartha Cs or Köppen Csa type on the coast. Although it is a maritime climate, the annual temperature range is between 11 and 14 °C (Figure 3). The average annual rainfall is between 45 and 95 mm (Figure 3). The dominant winds are the Mistral (especially in Provence) and the Tramontane (especially in Languedoc) whose power comes from the channeling effect of the surrounding massifs to the north and west (Alps, Pyrenees, and Massif Central). Generally, these winds dry the air and clear the sky, and their intensity is very variable from one place to another, depending strongly on the sheltering or accelerating effect of the neighboring massifs [32]. In recent years, the average annual wind speed has been between 5.2 and 5.9 m/s (Figure 3). Interannual mean temperature (°C) and precipitation (mm) data were collected from the Climatic Research Unit Time Series (CRUTS) database at the University of East Anglia (CRU TS v. 4.01, https://www.cru.uea.ac.uk/, accessed on 10 July 2022, Harris et al., (2014)). Wind speed data were downloaded from the “Power Data Access” site via the link (https://www.uea.ac.uk/web/groups-and-centres/climatic-research-unit/data, accessed on 15 July 2022).
France’s southeast is one of the country’s most heavily populated regions. According to INSEE’s 2019 census statistics (Figure 4), the research’s area population distribution is heterogeneous, reaching around 5200 inhabitants/km2 in the south (along the coastline), particularly in important towns such as Marseille, Toulon, and Aix-en-province. In contrast, population density in the region’s north is modest, with values lower than 100 inhabitants/km2. Consequently, the high population density in southeastern France leads to high energy and electricity usage. However, with only one wind farm, as indicated in Figure 1, satisfying electricity needs using wind is not possible, prompting us to identify potential places for further wind project execution.

3. Methodology

To map suitable sites for wind farm construction in southeast France, we adopted the methodology presented in Figure 5.

3.1. Data Collection

This research’s approach mobilizes the whole set of data that determines onshore wind project placement planning. The data collected covers socioeconomic, environmental, and technical parameters (Table 1).
The average wind speed raster data with a spatial resolution of 300 m was obtained from the “Global wind speed” website (https://globalwindatlas.info/, accessed on 15 July 2022). These data are based on ten years of hourly measurements recorded at a height of 100 m (2001–2010). Subsequently, the digital terrain model (DTM) retrieved from the USGS website was employed to generate a mosaic of two DTM rasters covering the whole research region with a spatial resolution of 30 m. Moreover, the IGN 2021 topo database [35] was used to collect information on protected areas (urbanized areas, industrial or commercial areas, infrastructures and equipment, continental waters), road networks (departmental, national, highways, railroads), and electrical substations. All data are resampled in 26 m.

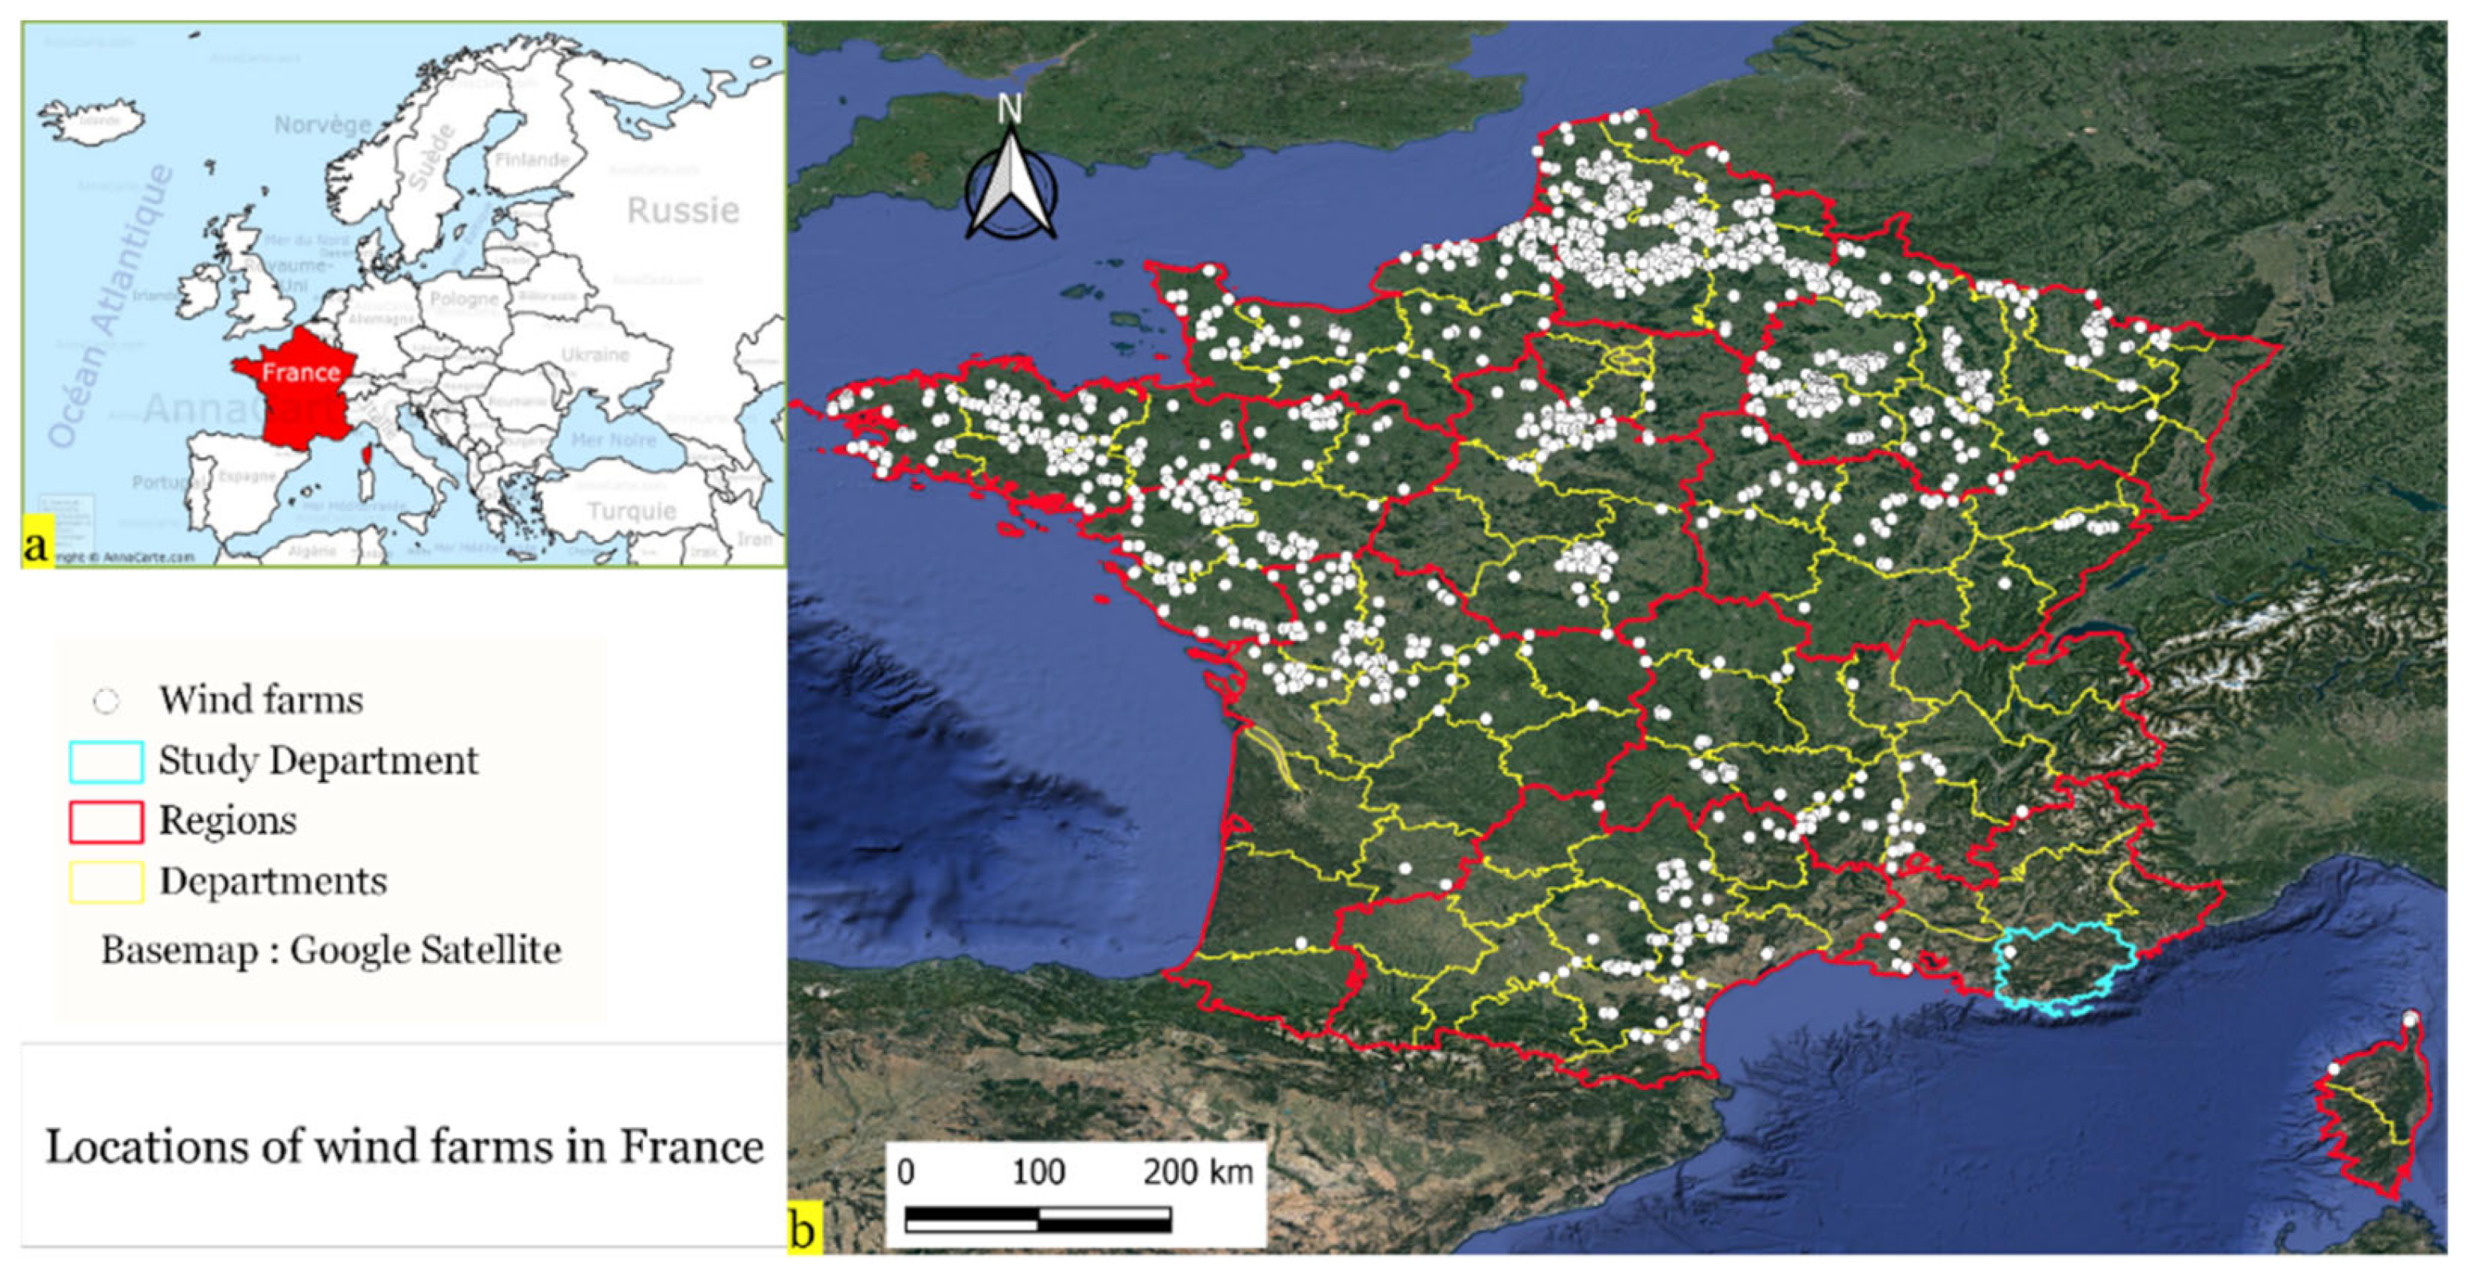
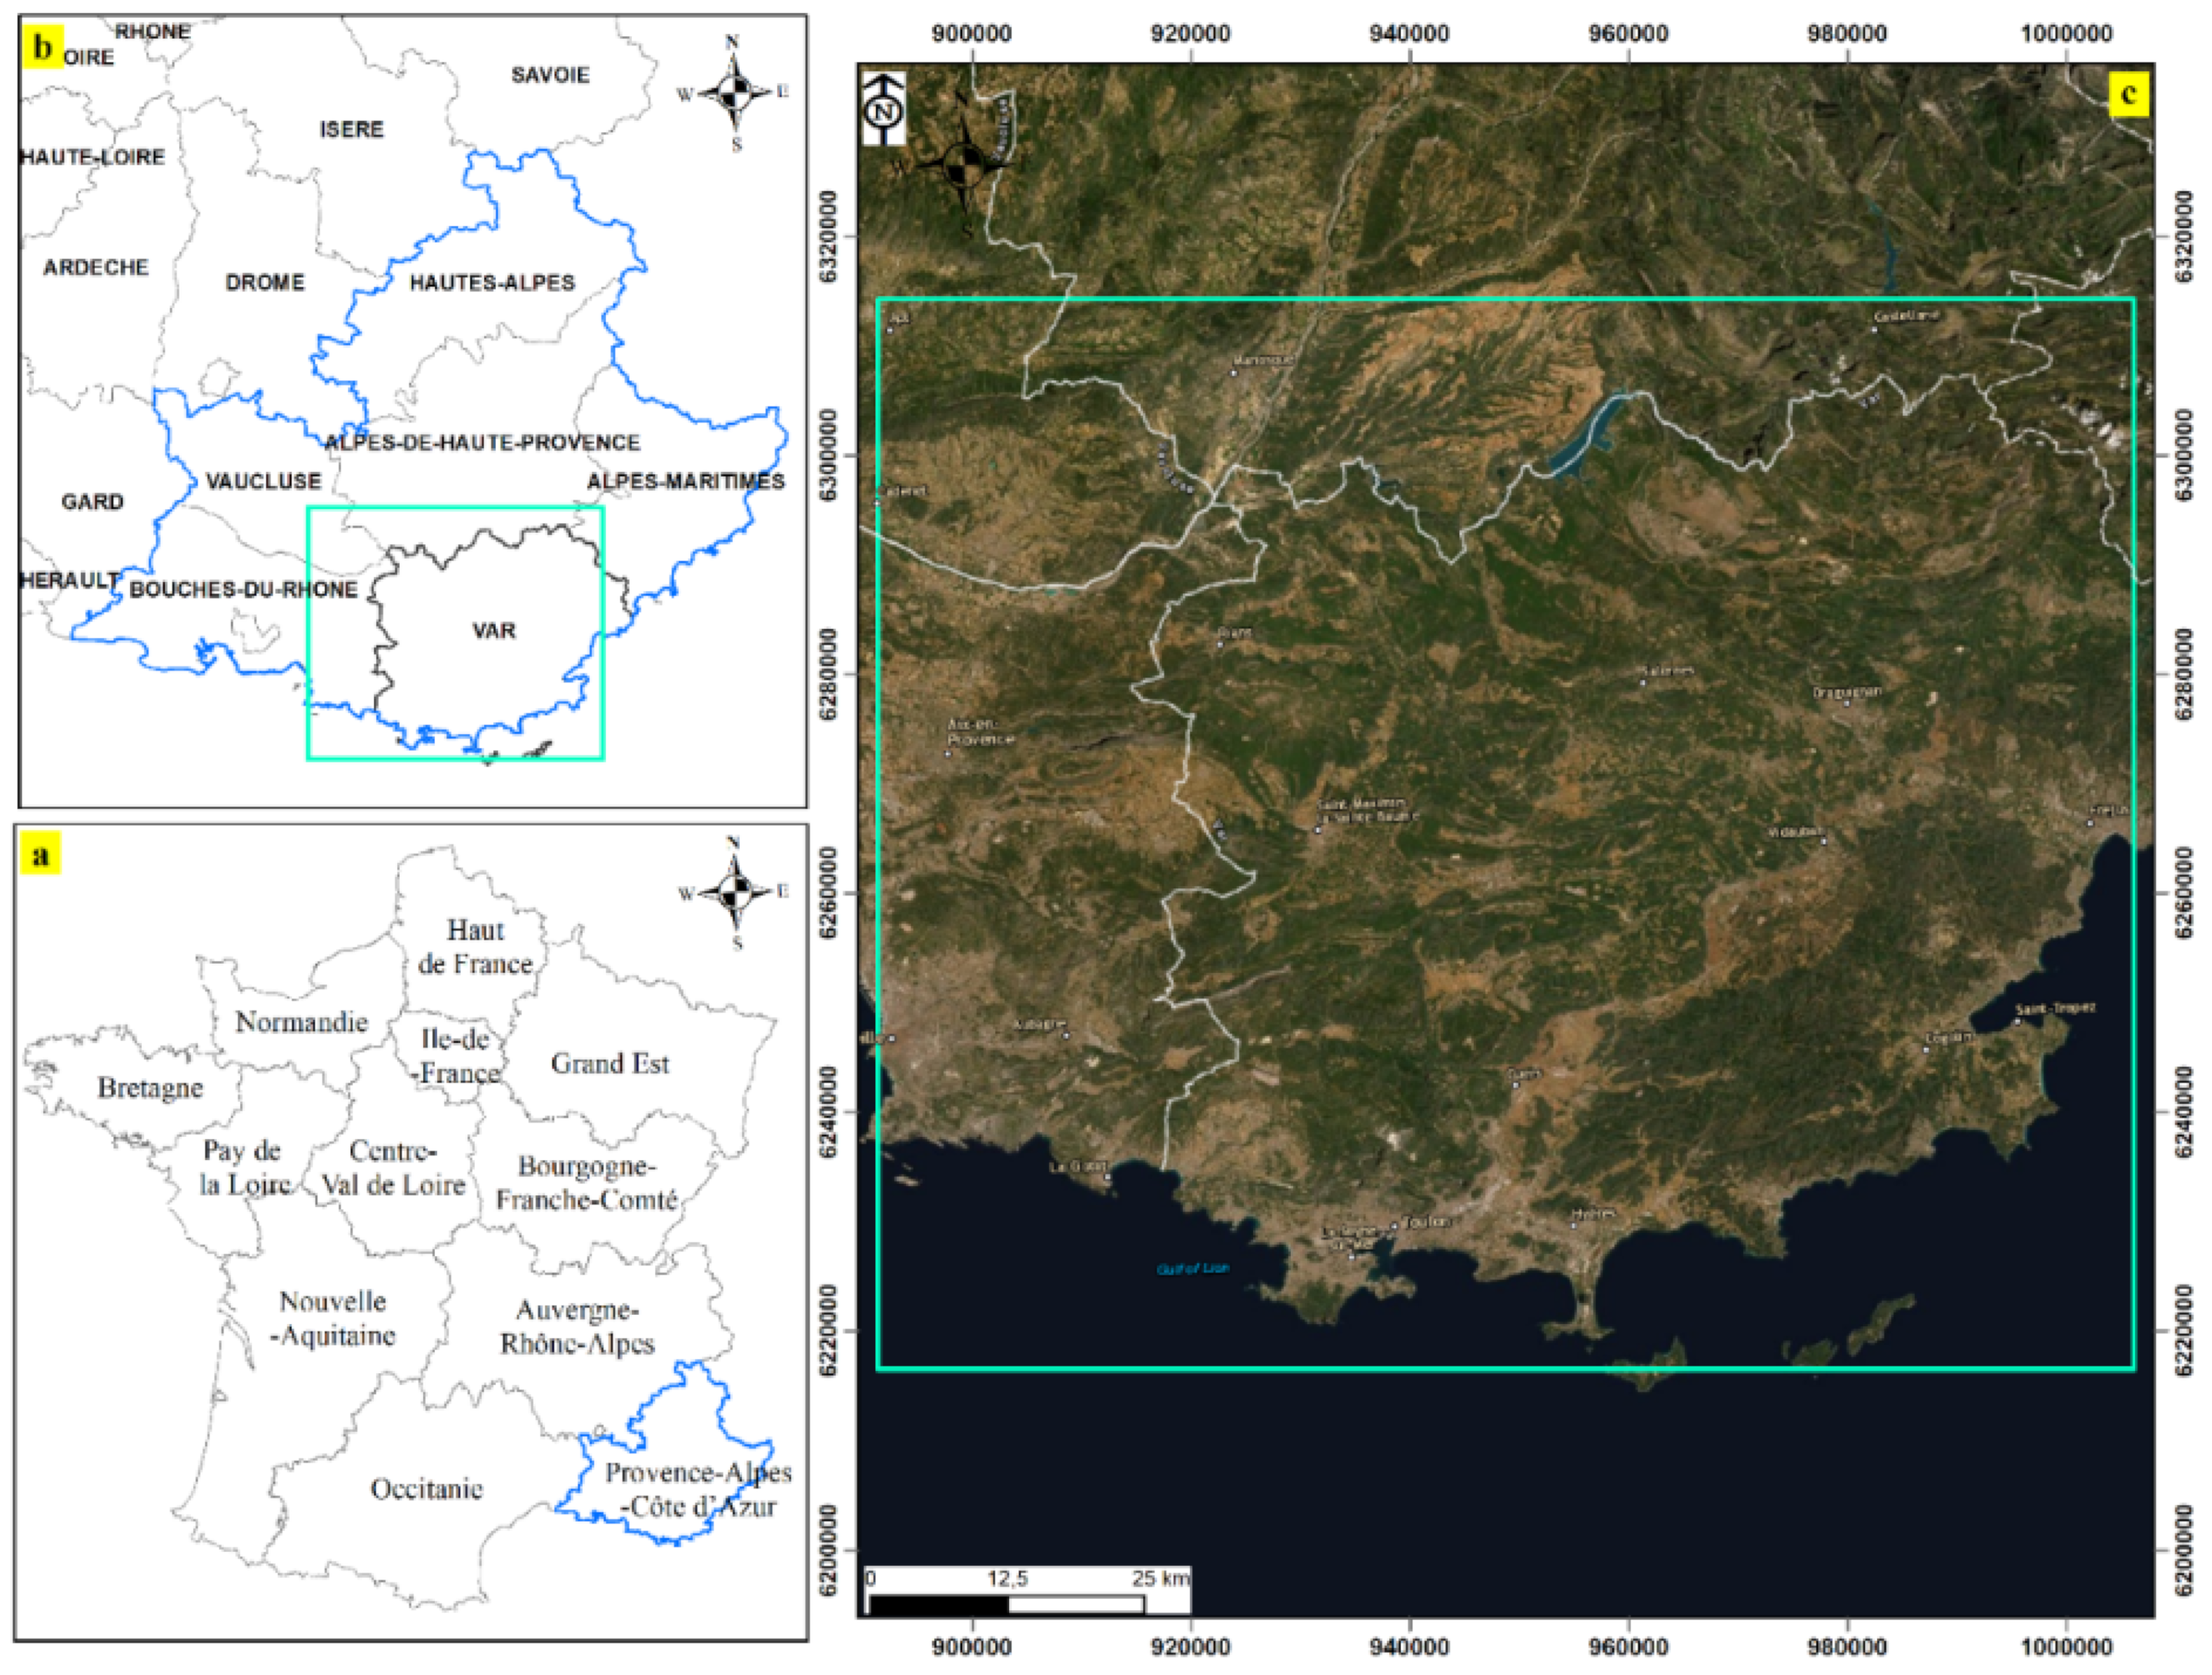
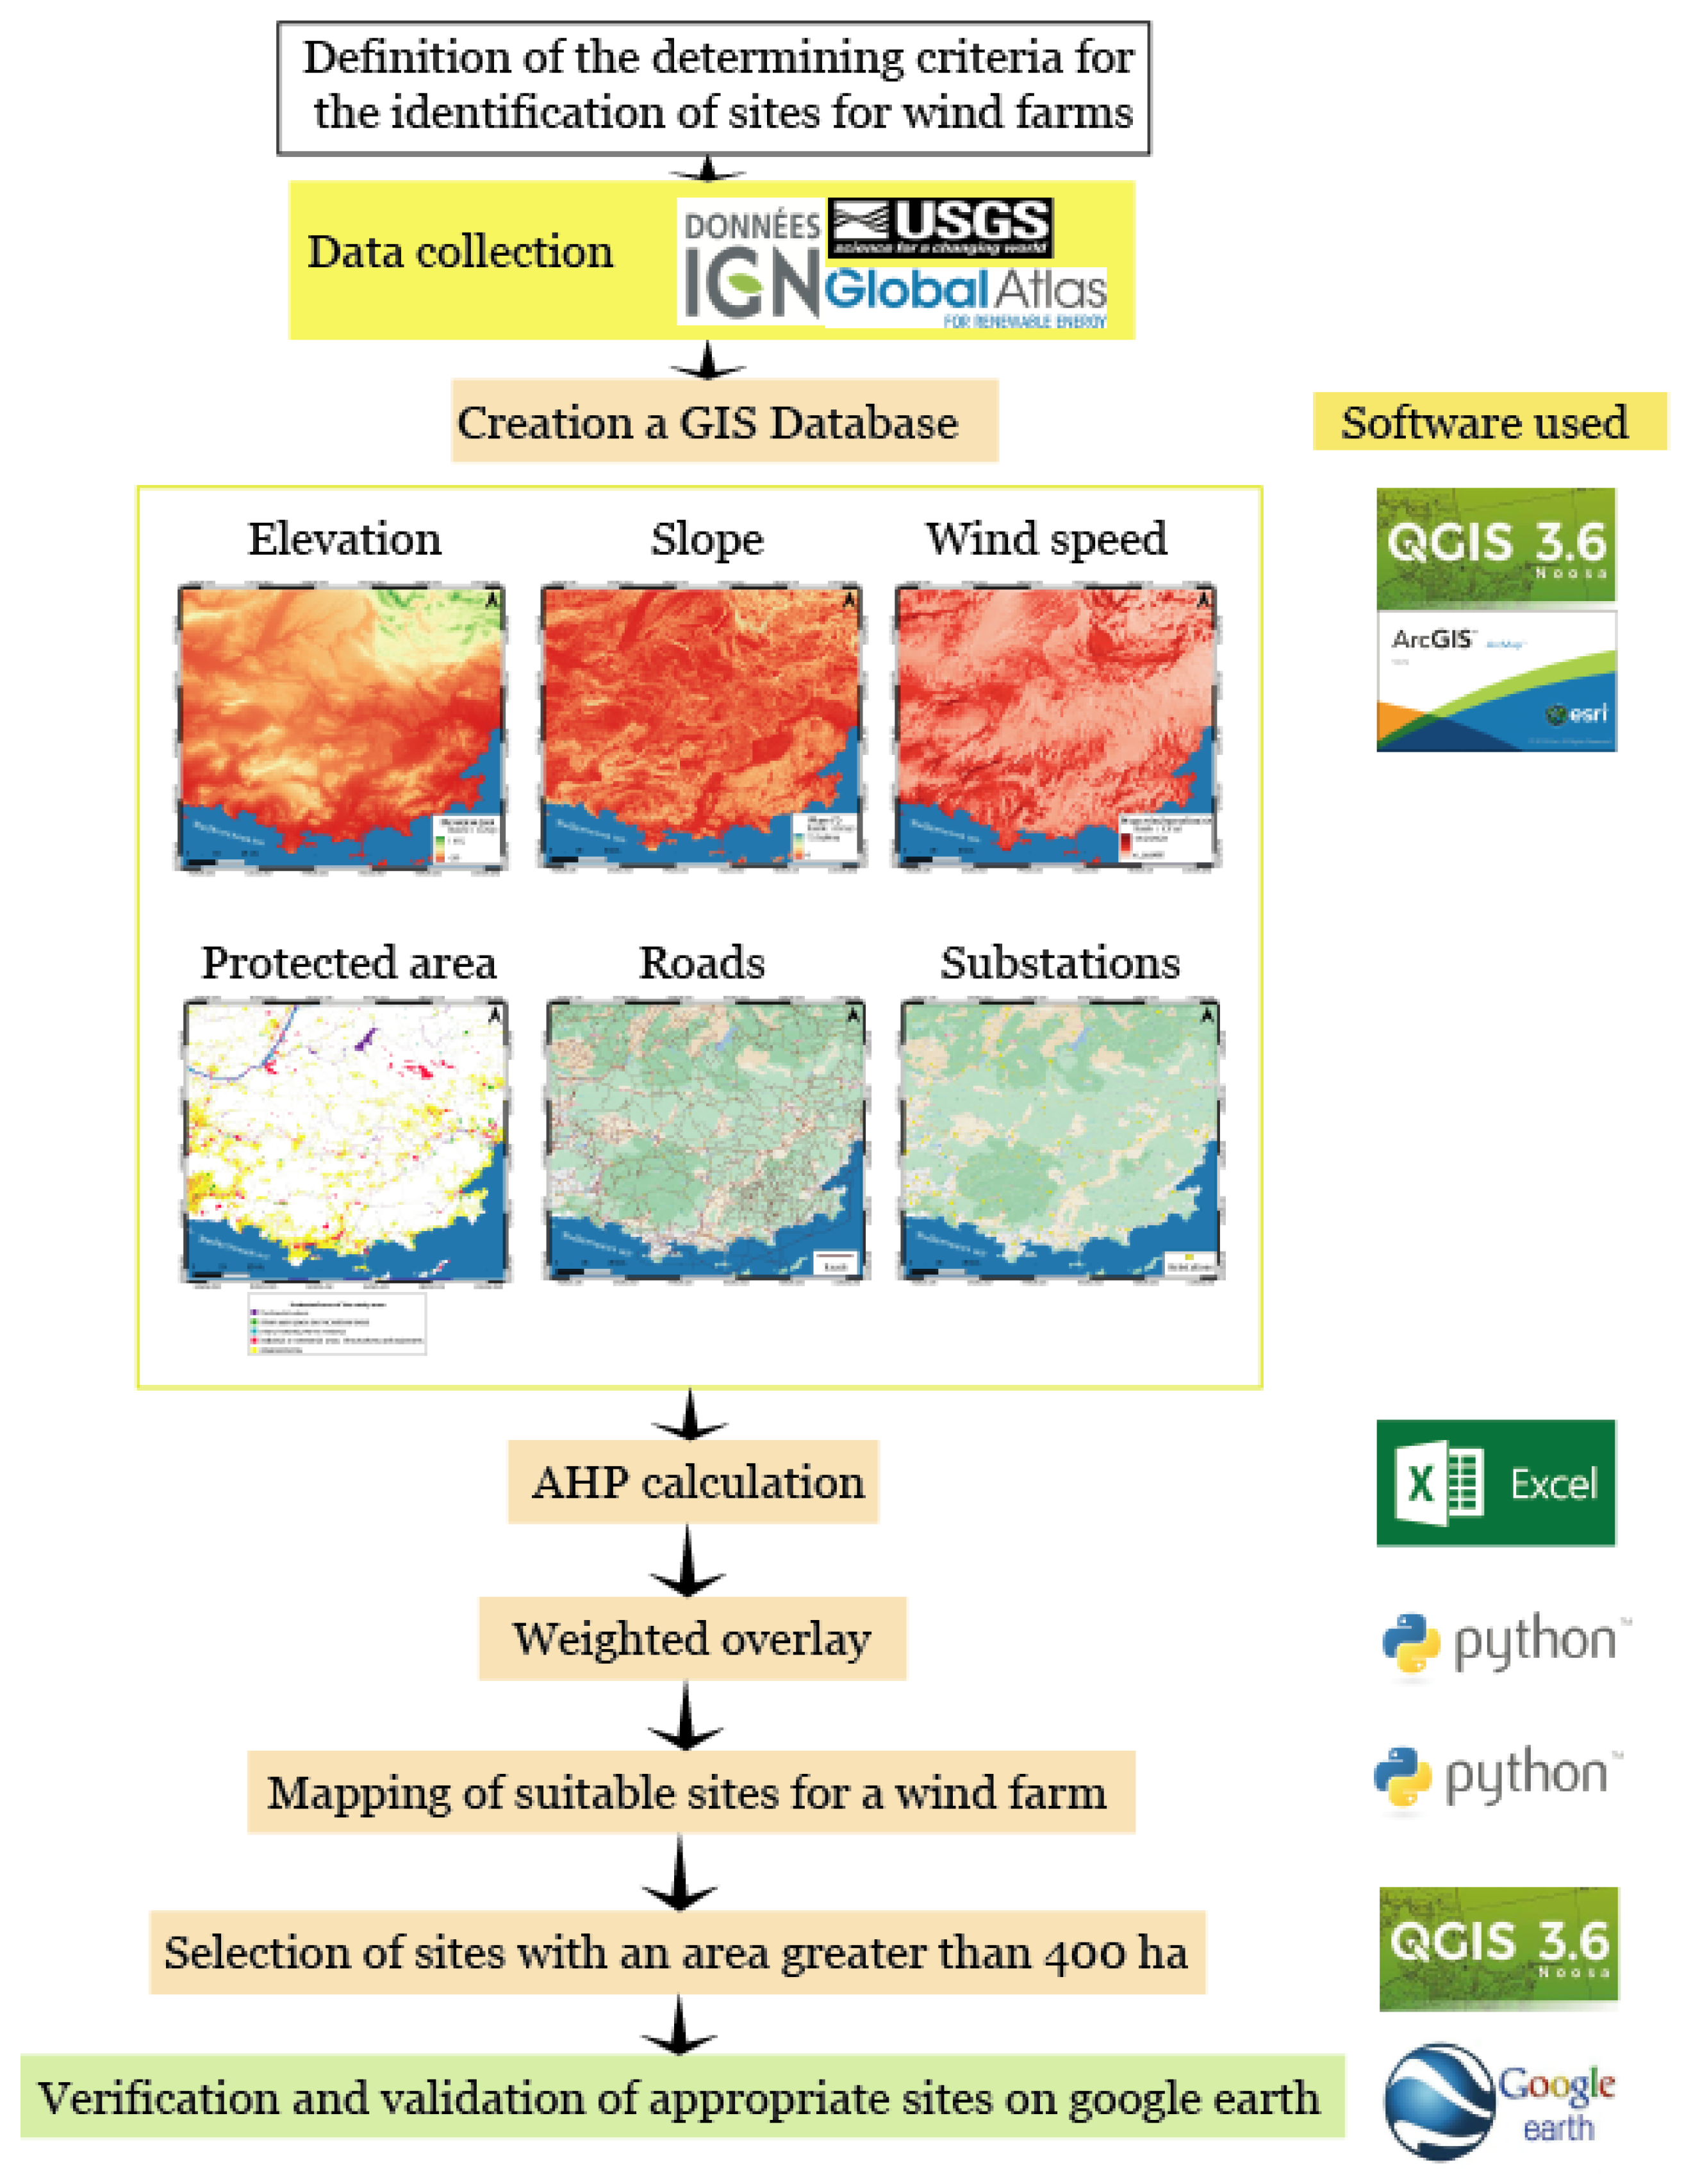
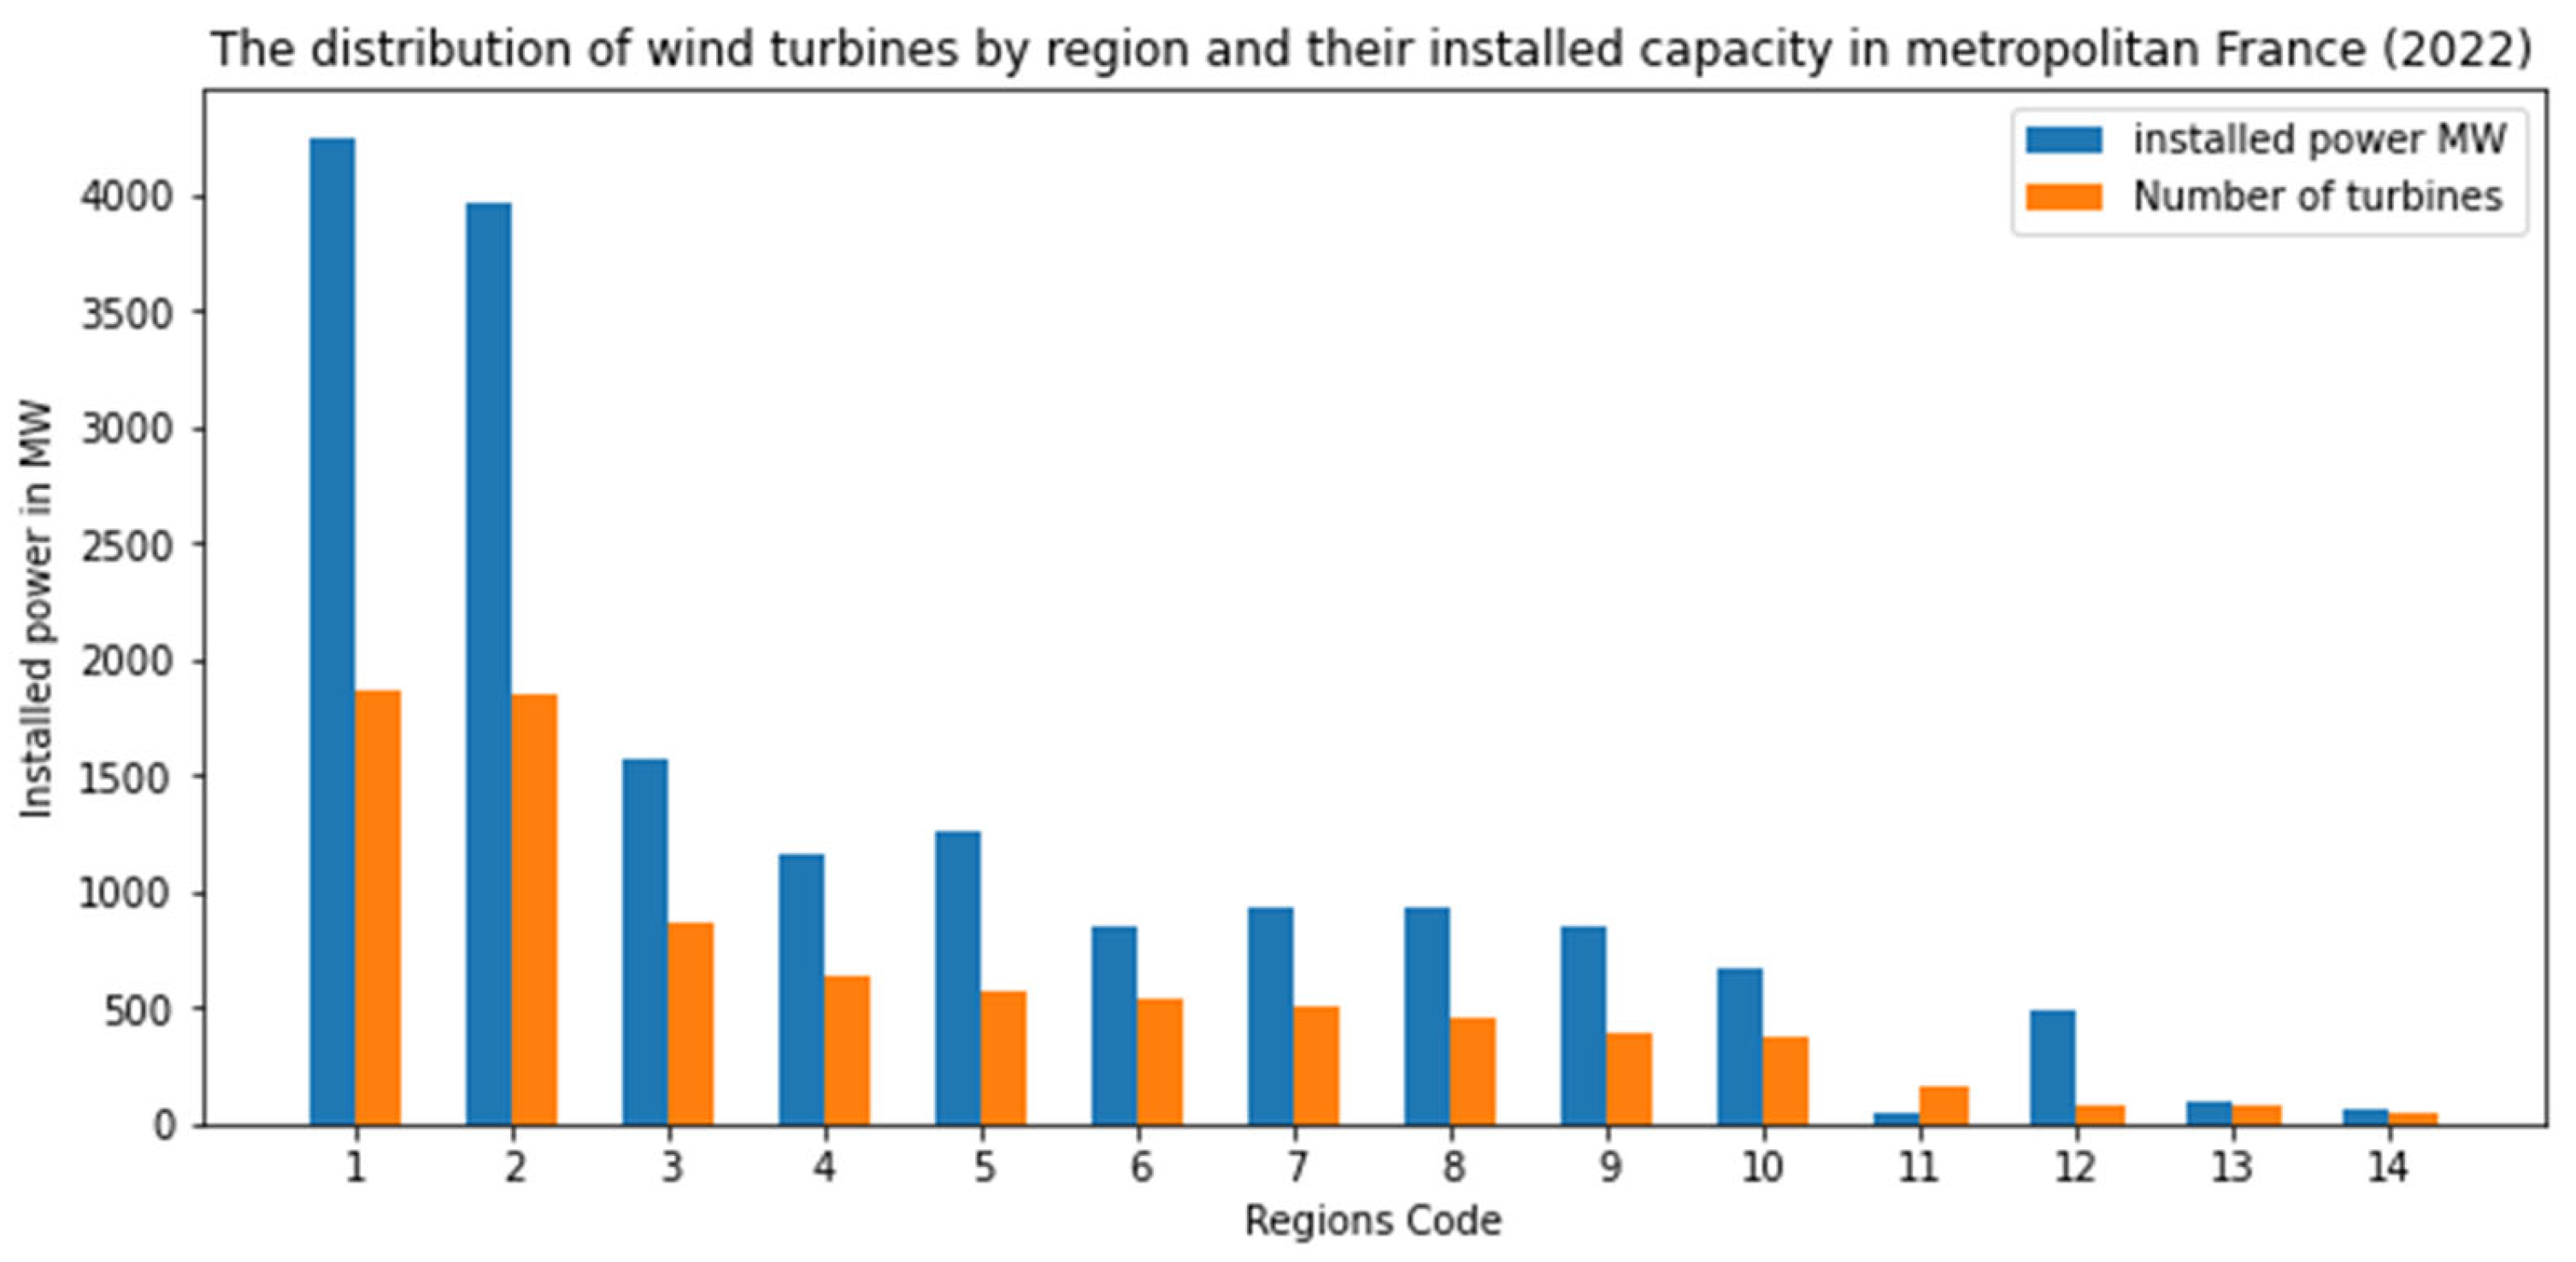
3.2. GIS-Based Spatial Database Creation

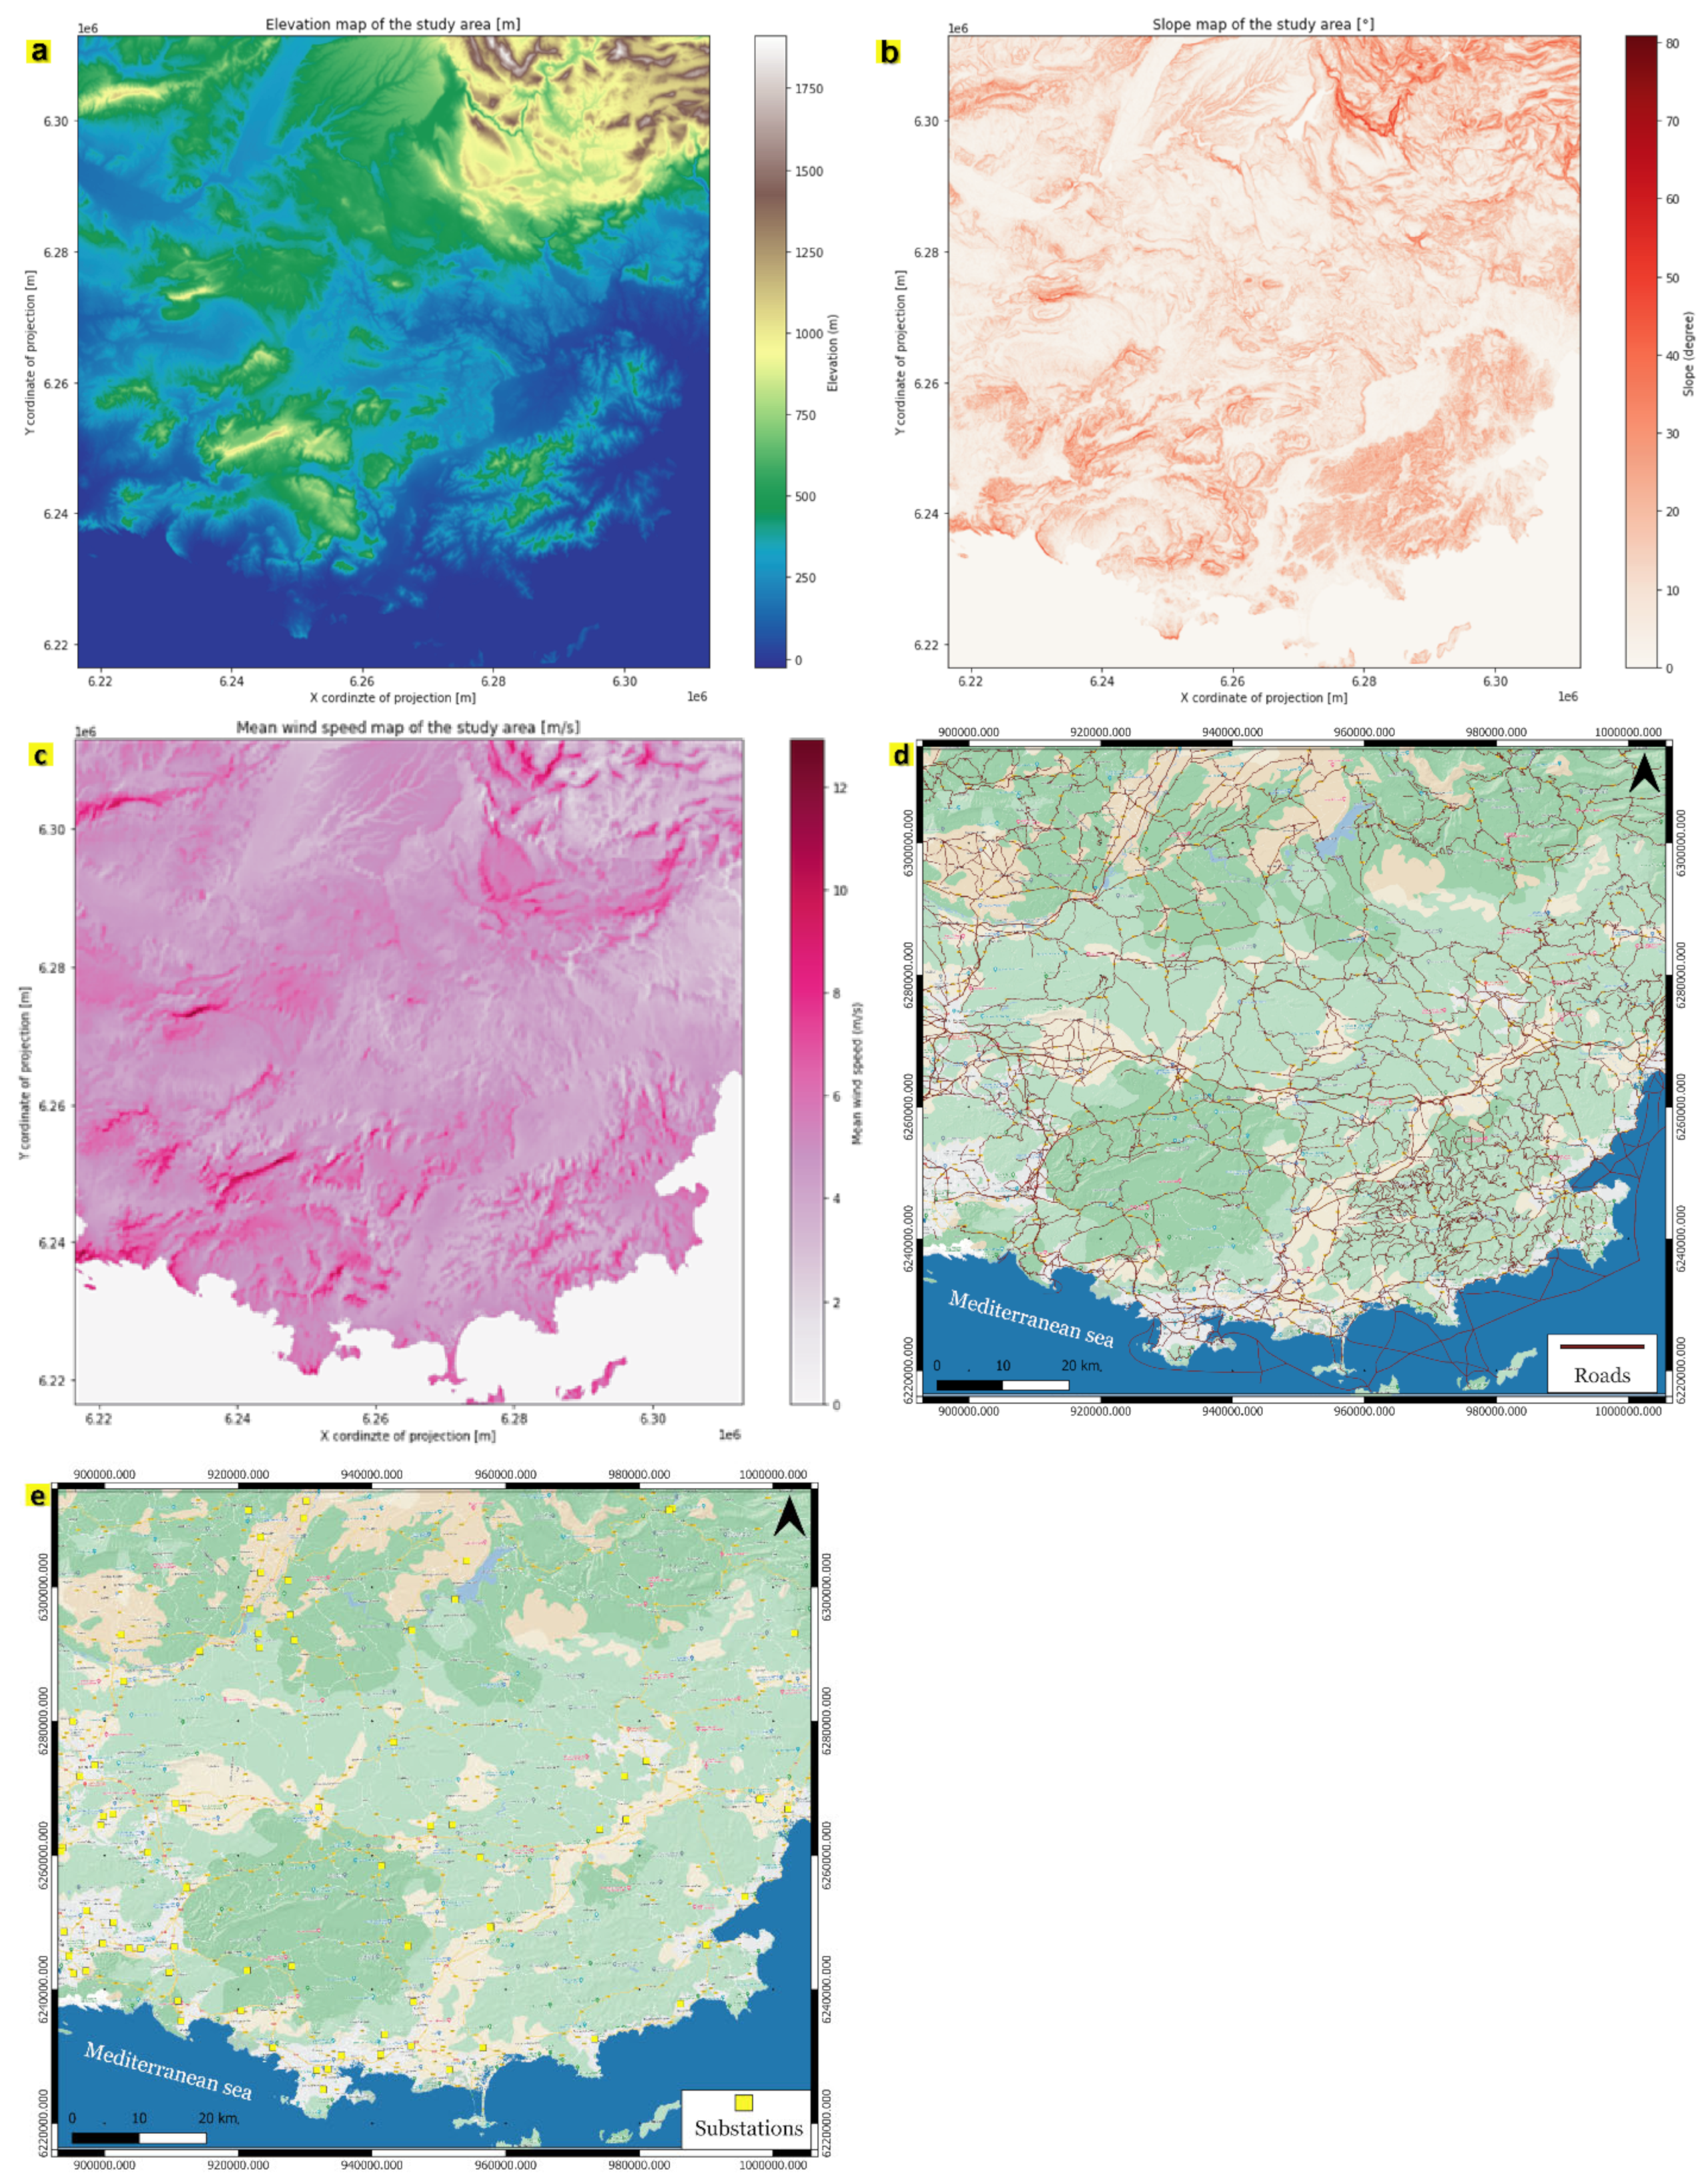
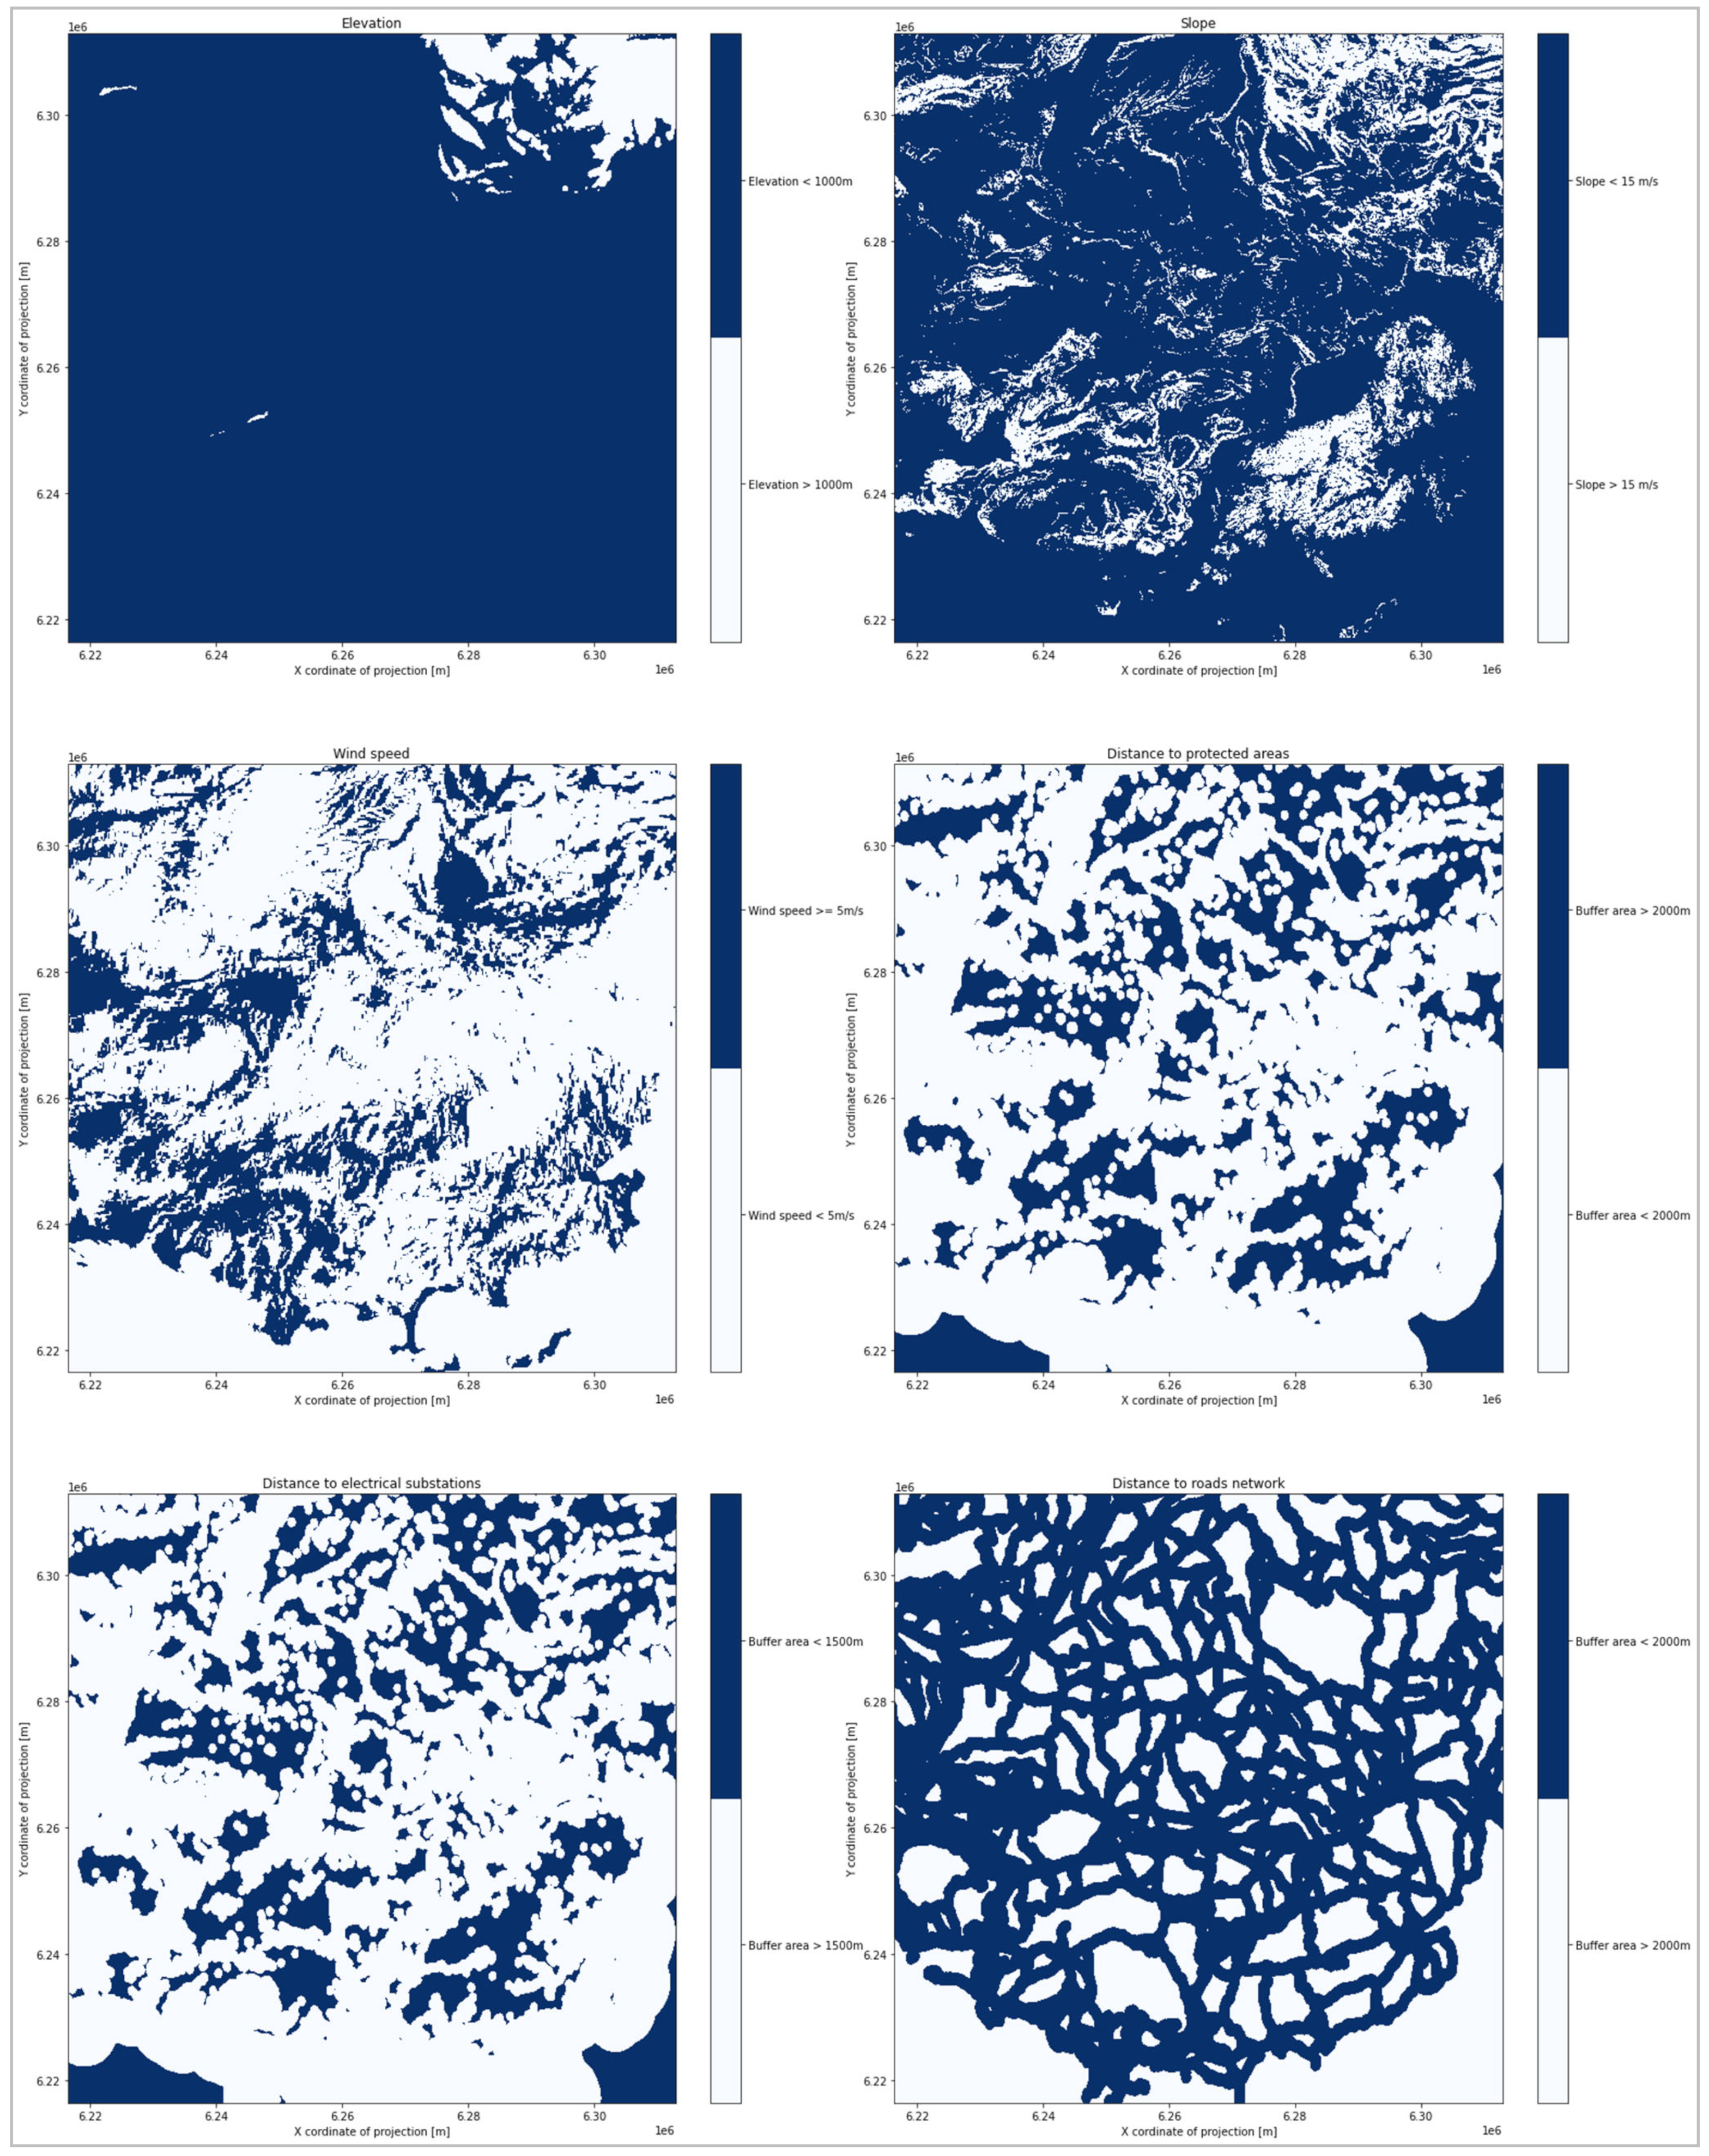
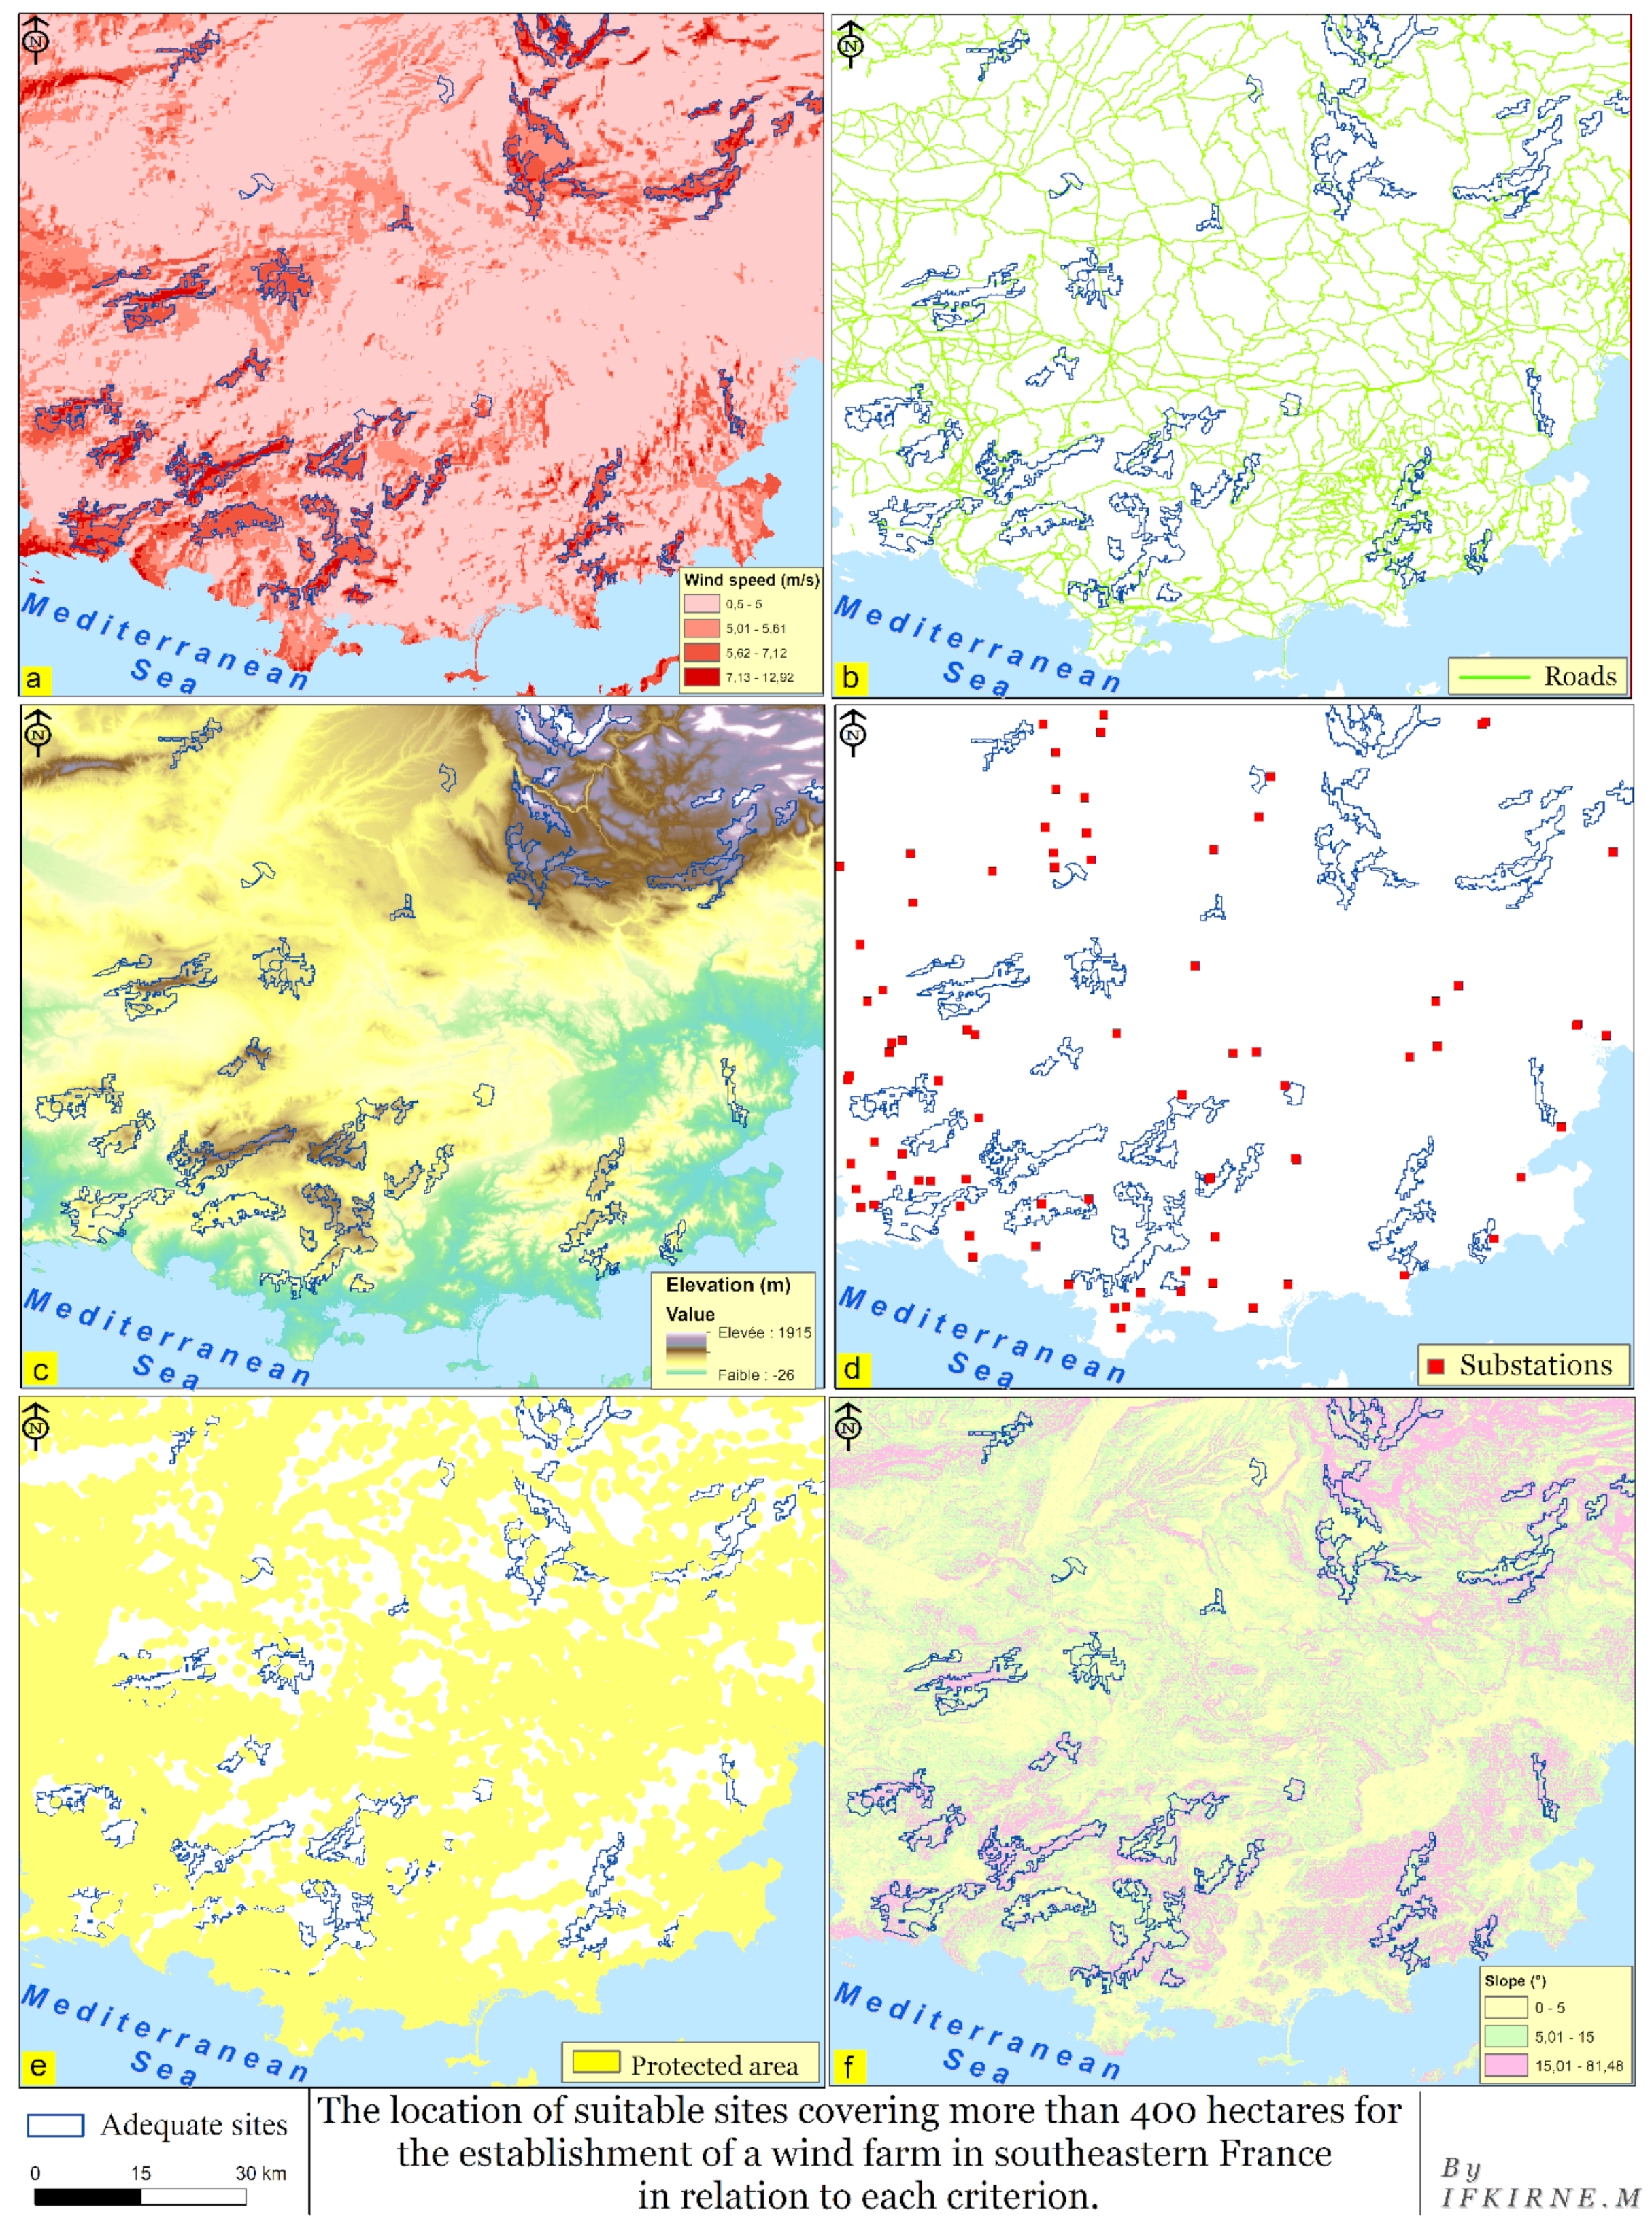
Elevation is an important criterion; however, in numerous studies, high altitudes have not been indicated for wind projects [36,37,38]. The researchers mentioned have proposed that locations below 1000 m be considered extremely appropriate for wind projects.
This is due to access issues and a lack of basic infrastructure in higher places. Thus, to reduce the high expenses connected with construction, regions lower than 1000 m in height appear to be the most efficient and appropriate. As shown in Figure 6a, elevations above 1000 m account for less than 30% of the research region’s total area.
Wind speed: Average wind speed has been the most essential and weighted parameter in wind farm location evaluation studies, as reported in most previous studies [24,28,39,40]. This parameter is directly related to the project’s profitability [41]. In our wind farm siting analysis, areas, sites having an average annual wind speed of less than 5 m/s at a height of 100 m above mean sea level were considered inappropriate for wind farm sitings, as recommended by [28,42]. Nonetheless, several studies suggest that an annual average wind speed of more than 6 m/s is required for a functional wind farm installation [43,44]. Conversely, extremely high wind speeds can damage the wind turbines and the project execution in general.
Slope: A slope map in degrees is produced by combining two SRTM rasters acquired from the USGS website. This criterion can be applied to exclude areas with steep slopes of greater than 15 degrees and high relief. These are typically inaccessible and so unsuitable for wind turbines. The highest slopes, as illustrated in Figure 6c, are in the research’s area northeast, towards the province of Alpes de Haute, and also surround the shoreline in the south.
Indeed, our choice of 15% (maximum limit of suitable slopes) has already been defined by research works [45,46]; others have adopted a constraint of 25% [47], while some [48,49] have raised the constraint threshold to 30%. In addition, some researchers have considered areas with slopes greater than 10% as infeasible areas for wind turbine installation [50,51]. Selection of land having a slope of less than 15% is planned to facilitate crane and truck accessibility to sites and to reduce installation and maintenance costs due to turbulence.
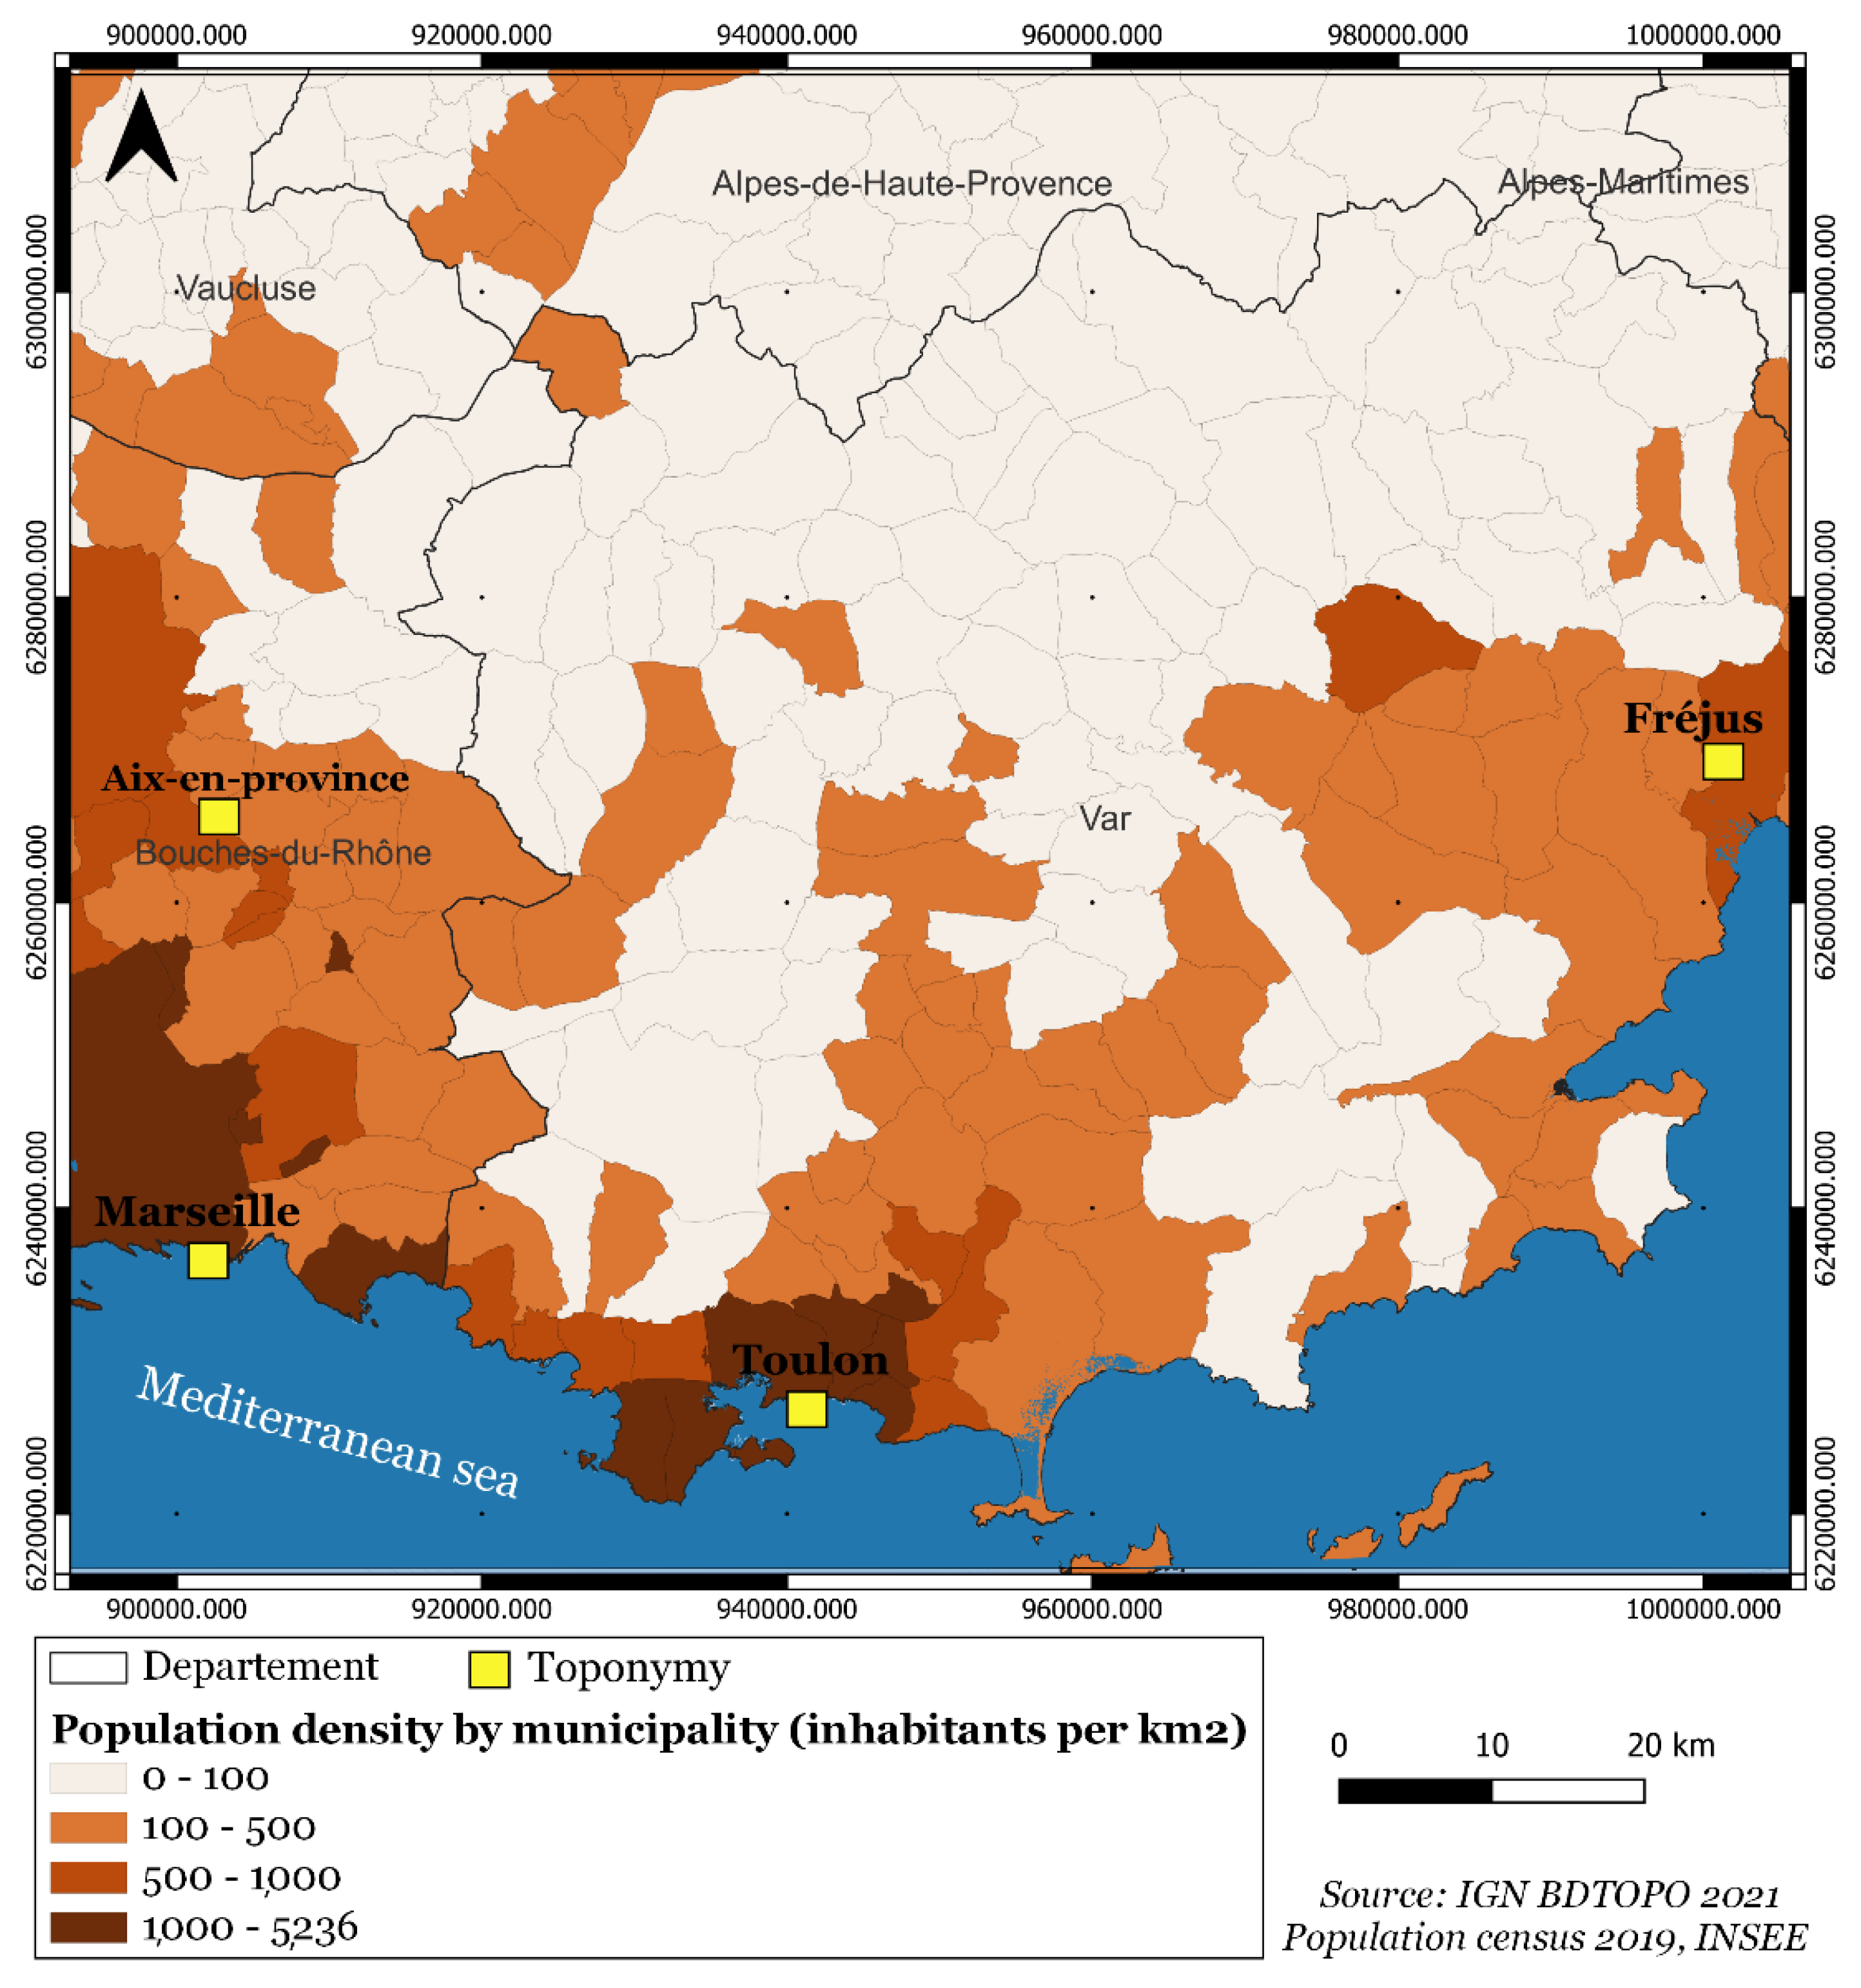
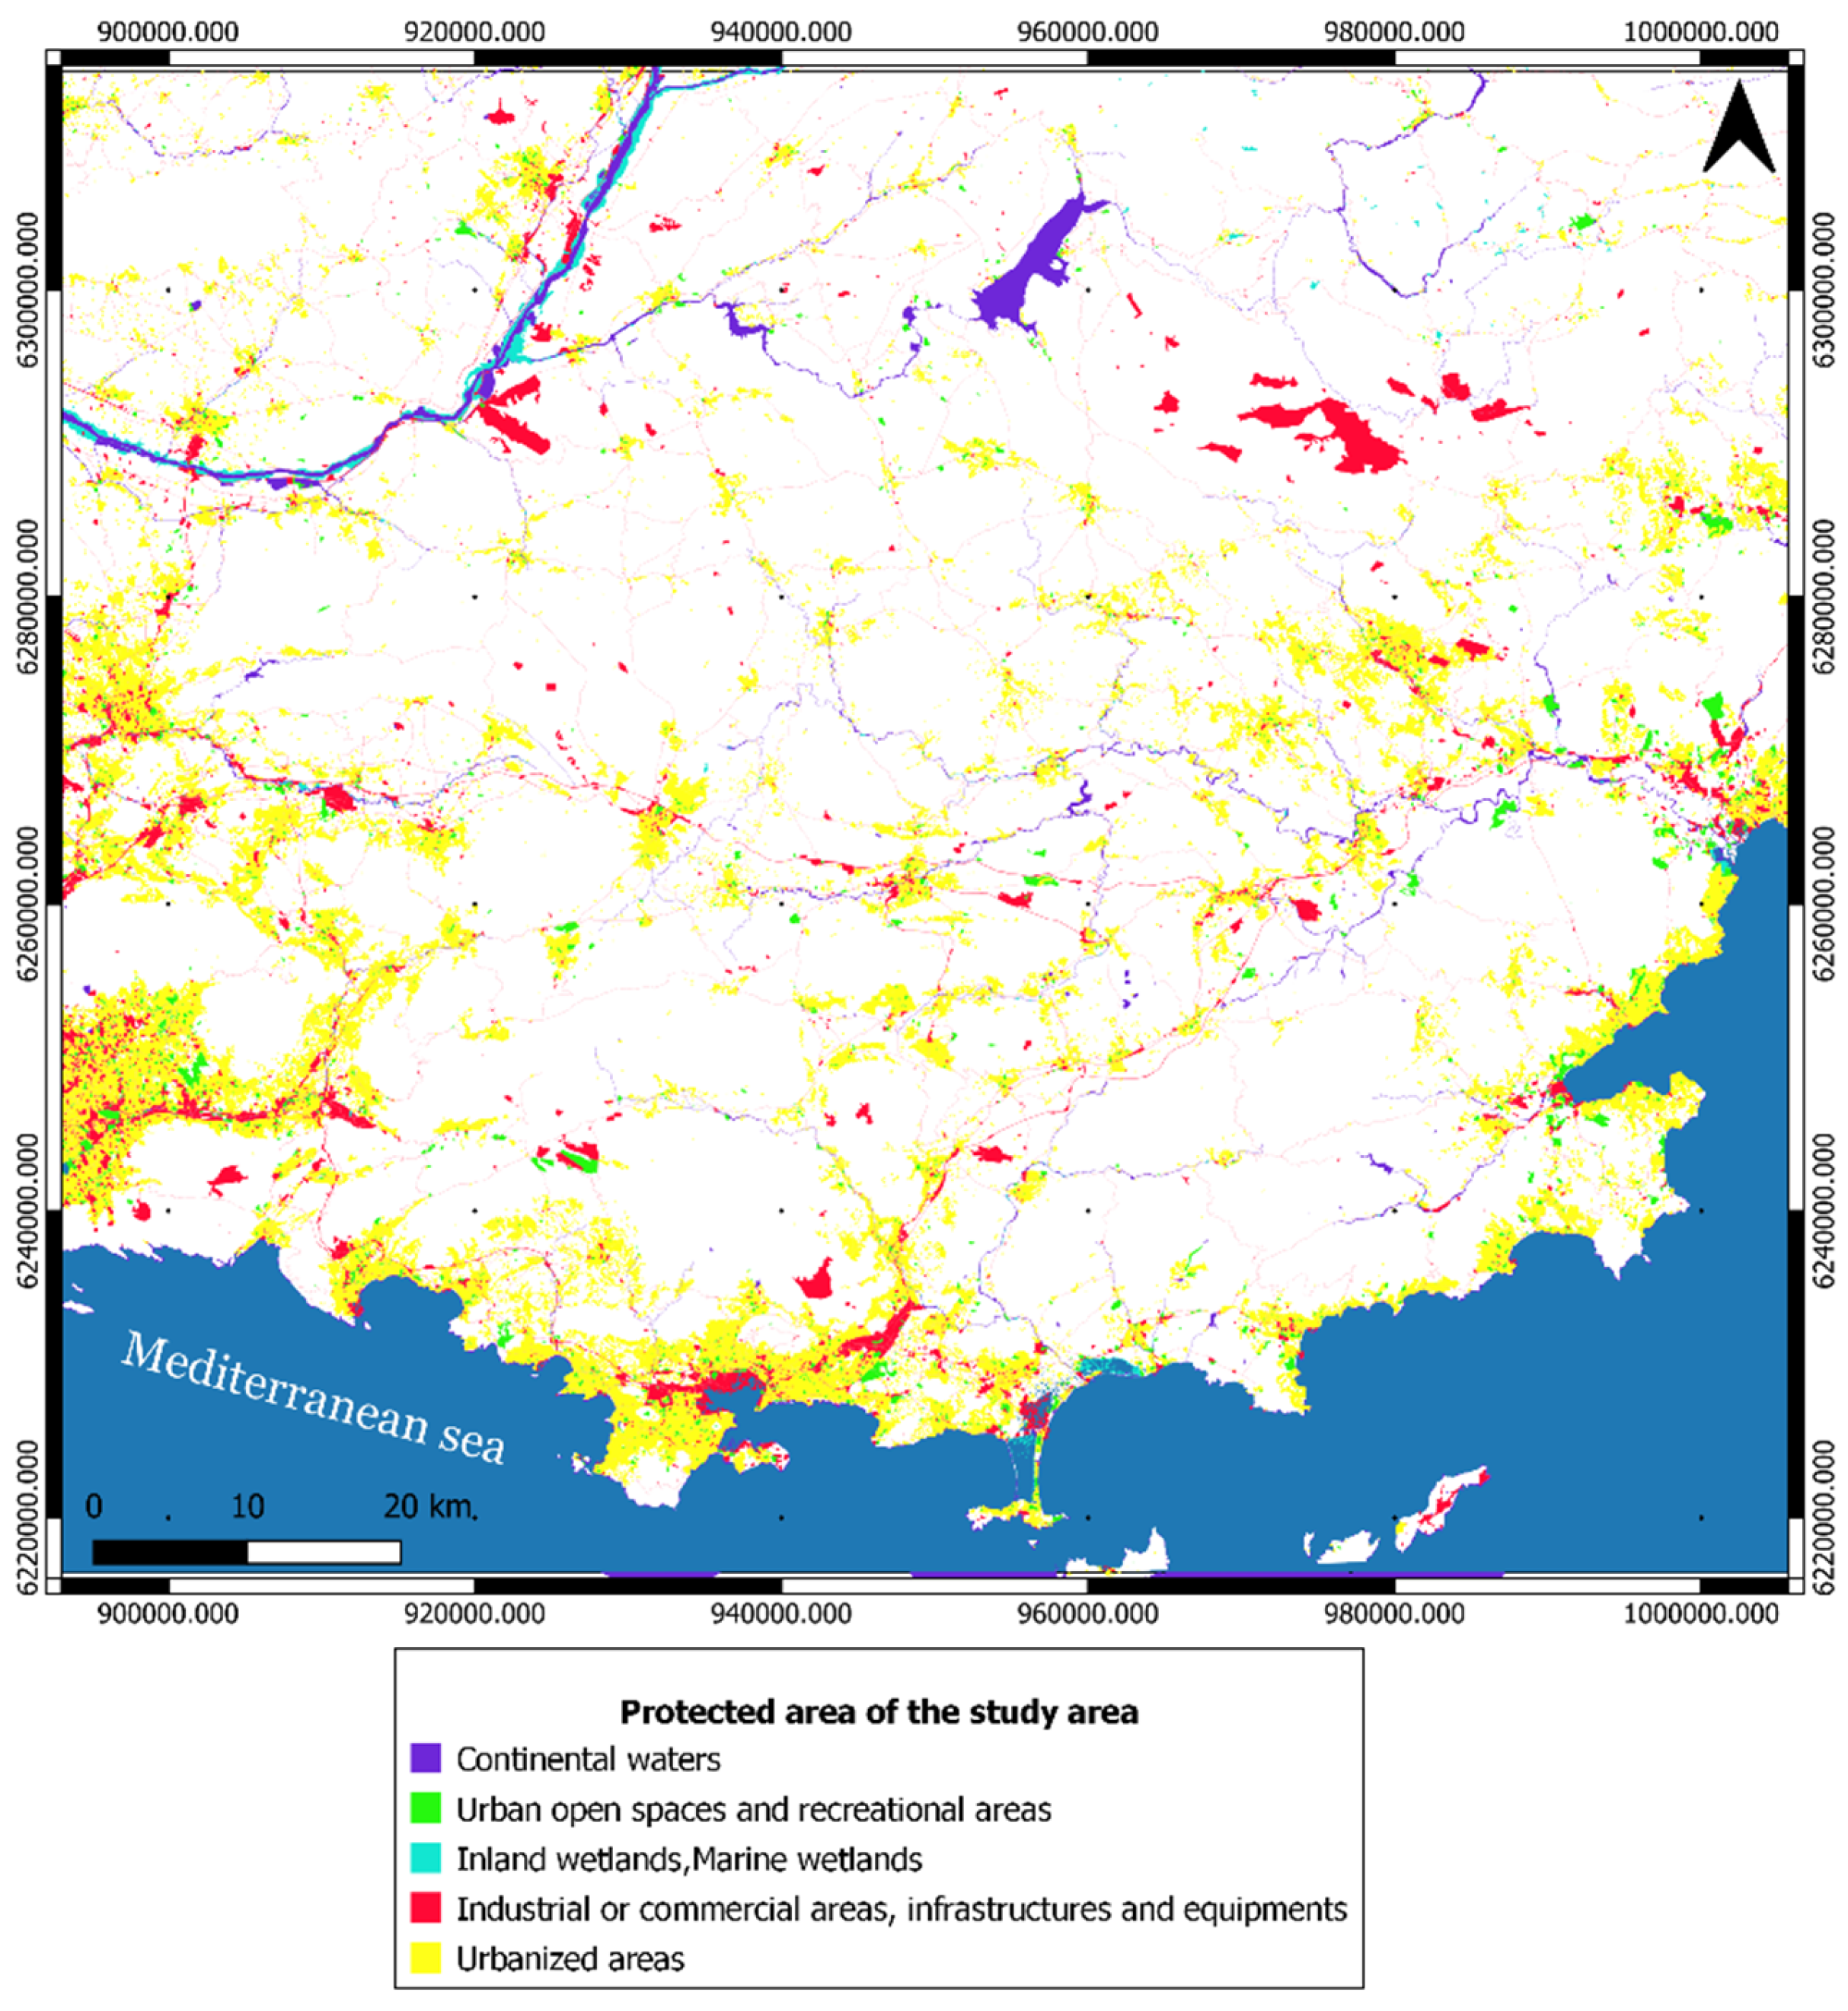
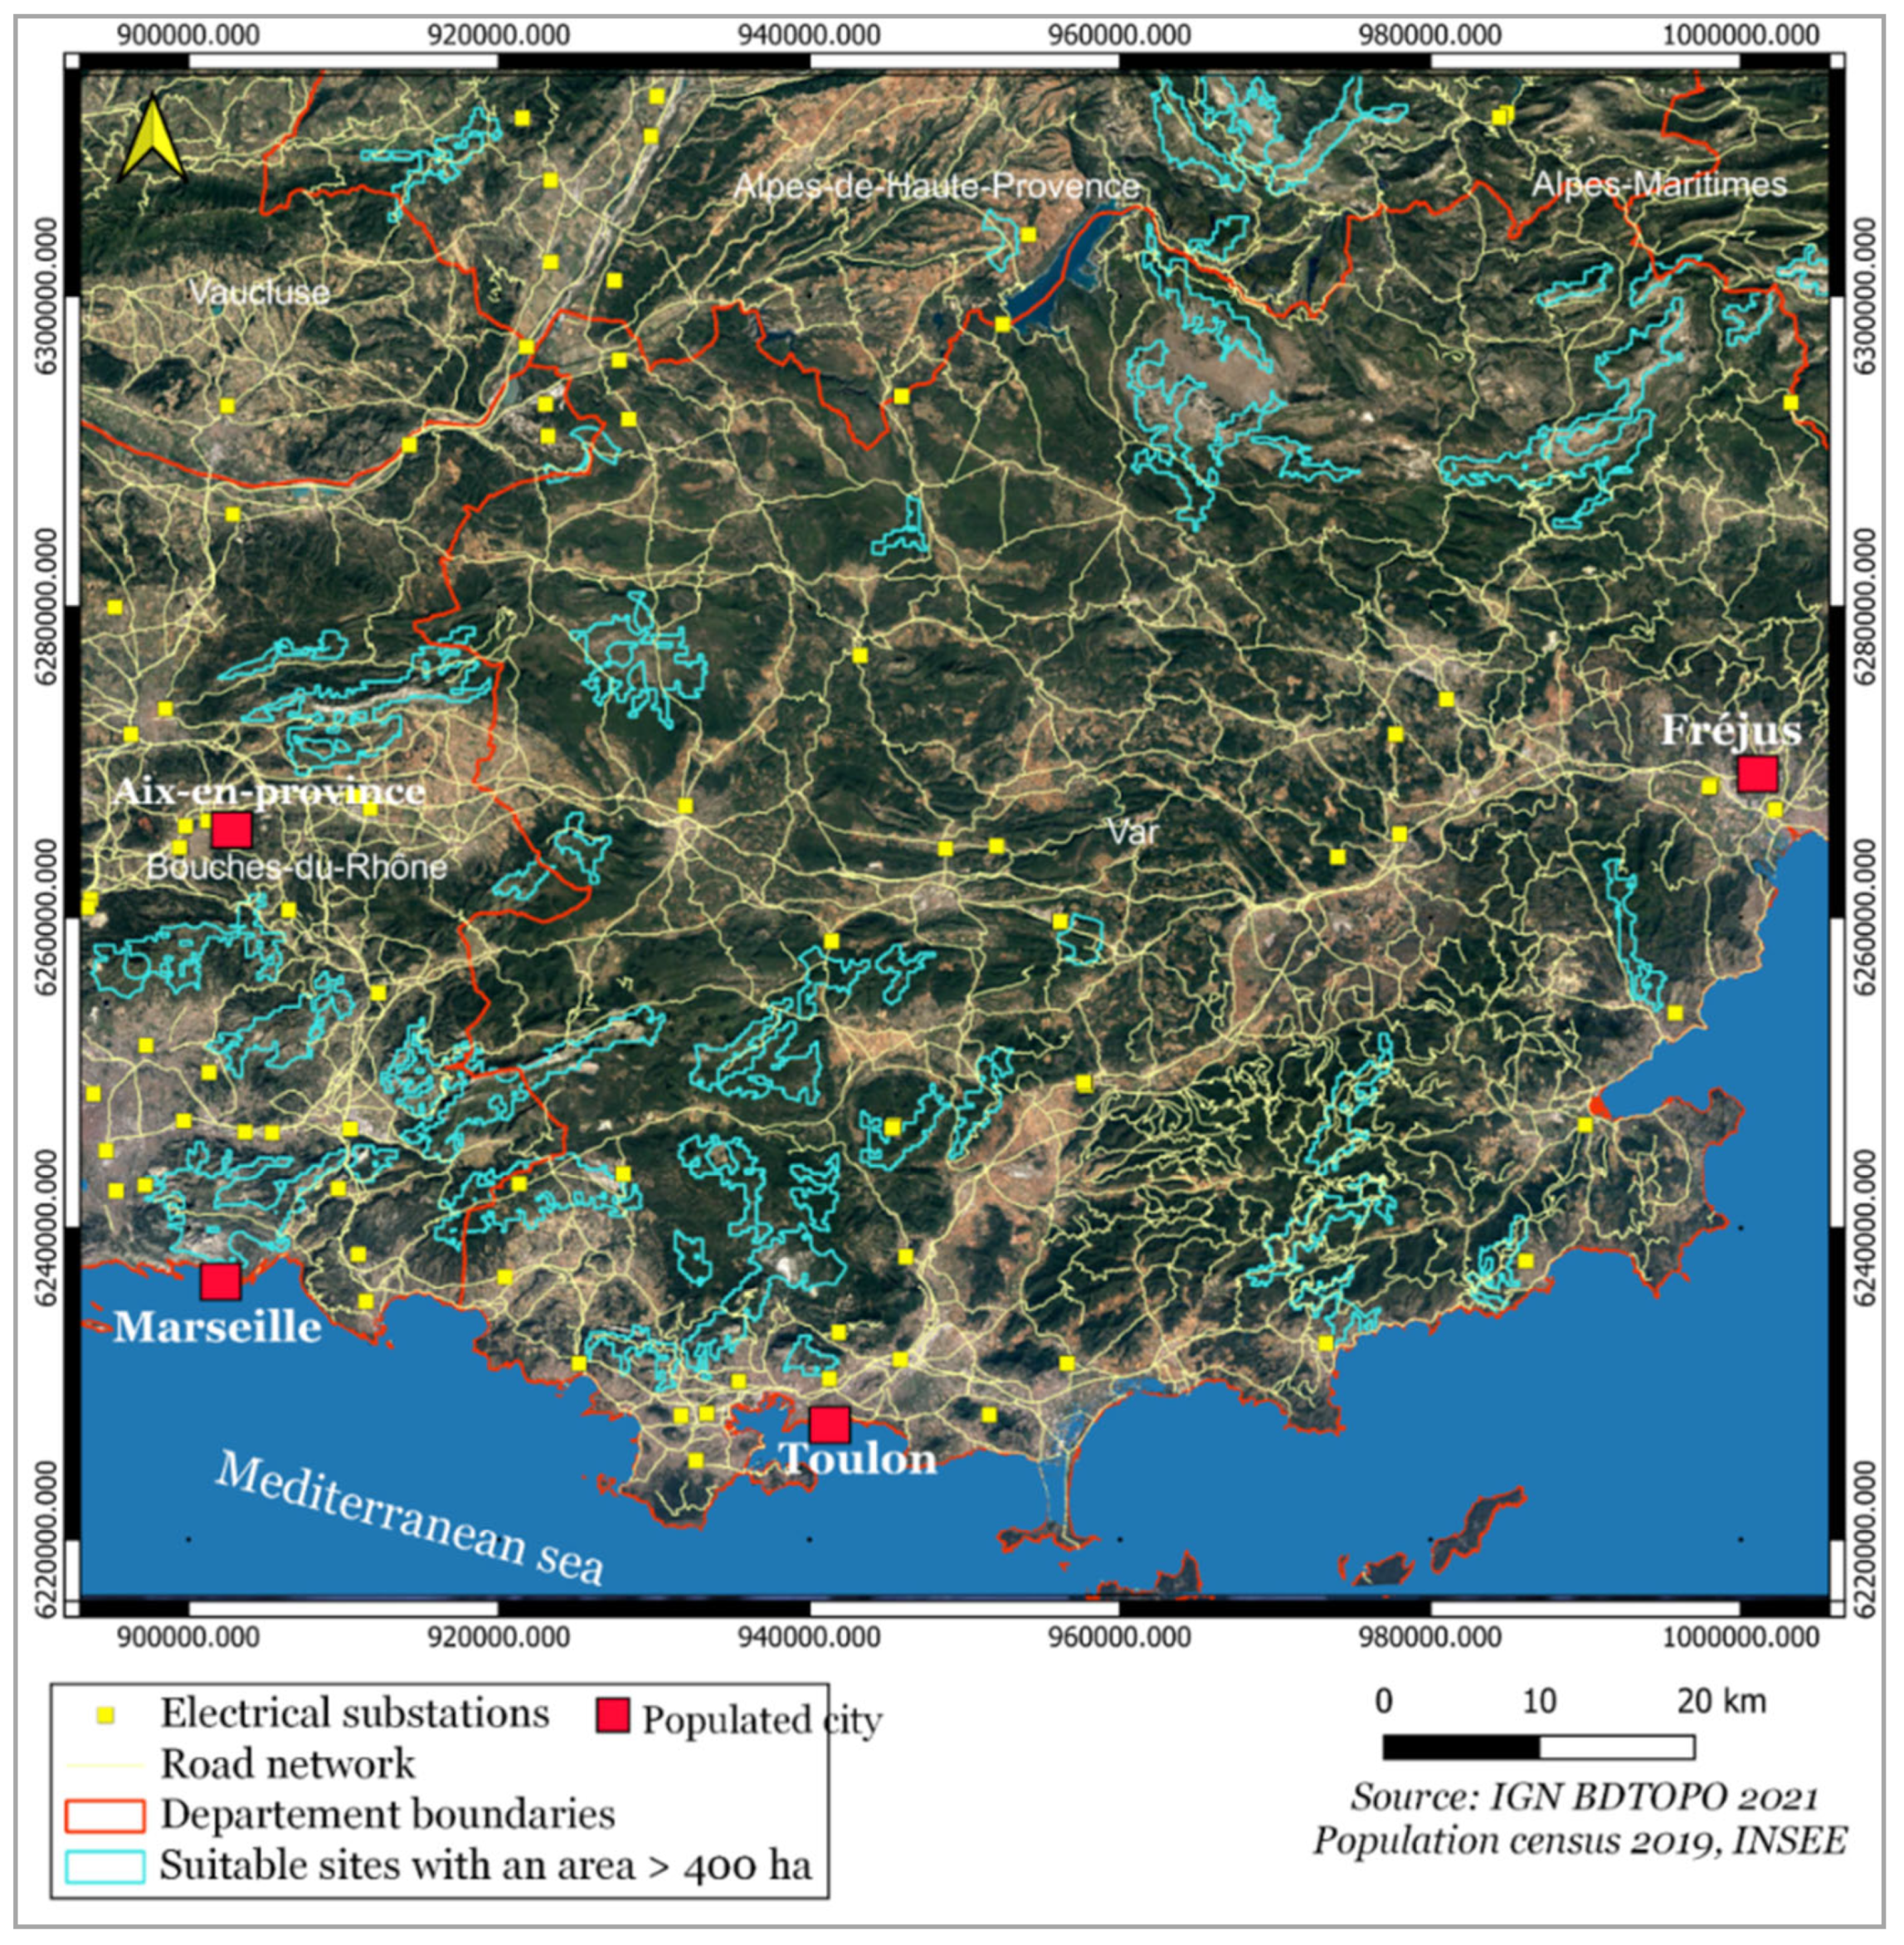
Protected area: Wind farm construction is controlled by various laws, most notably the French energy code, the urban planning code, and the environmental code. Any prospective wind project needs to evaluate its environmental impact by including parameters such as landscape impact, biodiversity, noise, and dangers to nearby inhabitants. The protected areas in this study, which include urban areas, wetlands, biodiversity parks, and water surfaces (Figure 7), were gathered from the IGN’s BD 2021.
The study area is characterized by the presence of forests, pastures, beautiful landscapes, biodiversity parks (fauna and flora), NATURA 2000 protected sites [52,53], and the most important large urban agglomerations. These areas of environmental interest were not absolutely excluded according to the literature but also according to the national legislation (the minimum distances were determined after the decision approving the environmental conditions (“DAEC”)). To avoid the destruction of these spaces and the negative impact of wind farms on the nature of these areas, a minimum distance of 2000 m is required [54,55].
Road network: This was generated using data from the IGN 2021 database (Figure 6d). The road’s proximity is a critical parameter in various studies. It is particularly relevant for studies related to the search for suitable sites for a large project implementation requiring massive equipment to keep transportation costs, as well as construction and maintenance costs, low [24,39,40,56].
Electrical substations: Close proximity to electrical substations minimizes wire costs, prevents power losses, and simplifies installation and maintenance processes [57]. Figure 6e represents electrical substations in the research area.

3.3. MCDM Using an AHP Approach

Suitable site selection for implementation of a sensitive project such as a wind farm is always difficult since it requires a combination of various parameters and criteria defining the project location. Therefore, decision-making solutions to overcome these obstacles have been developed by integrating all of these determining criteria. Generally, the multi-criteria decision-making (MCDM) approach is always applied to address problems with many stakeholders, criteria, and objectives [58]. Moreover, this approach has been widely applied in various fields, including the energy sector to plan renewable energy projects [59,60,61,62]. The analytic hierarchy process (AHP) is a well-known MCDA approach that was initially proposed by [63] and has subsequently been greatly improved.
The methods for weighting the criteria in the MCDA are diverse. Some of these methods include AHP, fuzzy measures [64], Analytic Network Process (ANP) [65], Swara [66], entropy [67], Dematel [68], and standard deviation [69]. Although these methods are quite limited, AHP is one of the most essential and widely used methods in MCDA. The AHP method is similar to Swara’s in that the expert’s opinion specifies the importance and prioritization of alternatives. As for the entropy method, there are two different views of this method. According to some studies, entropy is reliable and effective [70]. However, from another point of view, entropy results do not always take into account the importance of the indices [71]. Dematel is similar to the Swara method, except that the Dematel approach is used to solve extremely complex problems. In the Dematel decision process, the expert opinion is used to develop the pairwise comparison matrix, and it has three main characteristics. The attributes are compensatory and independent of each other. Qualitative attributes are transformed into quantitative attributes [66]. The Swara and Dematel methods have been widely used in MCDA problems, especially in the renewable energy sector [72,73,74]. In this study, the AHP method was employed to address site selection problems for several reasons:
It is commonly used for its ease of design and implementation. It is highly compatible with GIS, which is widely used for planning and spatial analysis of site selection problems. The consideration of the consistency and inconsistency of alternatives is one of the main advantages of this method [60].
AHP can be combined with other methods of multicriteria analysis, genetic algorithms, neural networks, etc. [60]. It also takes into account quantitative and qualitative criteria to interpret the problem [75].
The AHP method can apply various sensitivity analyses to the criteria. AHP facilitates the decision-making process, using pairwise comparison between criteria [60]. For site selection problems, in which the main objective is to select the best locations, simple approaches such as AHP are satisfactory, and more complex approaches such as Fuzzy-AHP do not necessarily lead to distinct results [76].
AHP is a structured decision support method that is primarily focused on sophisticated computations with matrix algebra [77,78]. Through this approach, a decomposition of a complicated decision-making issue into a top-down hierarchical structure can be carried out in most cases. In recent years, as geographic information system technologies have improved, GIS integration with MCDA approaches has become increasingly popular. This integration is adaptable and suited to the qualitative and quantitative investigation of multi-criteria issues with a geographical component.
In this research, we developed the decision process required for the usage of the AHP approach. This approach is provided in four steps, each of which requires clear problem identification or study’s objective.
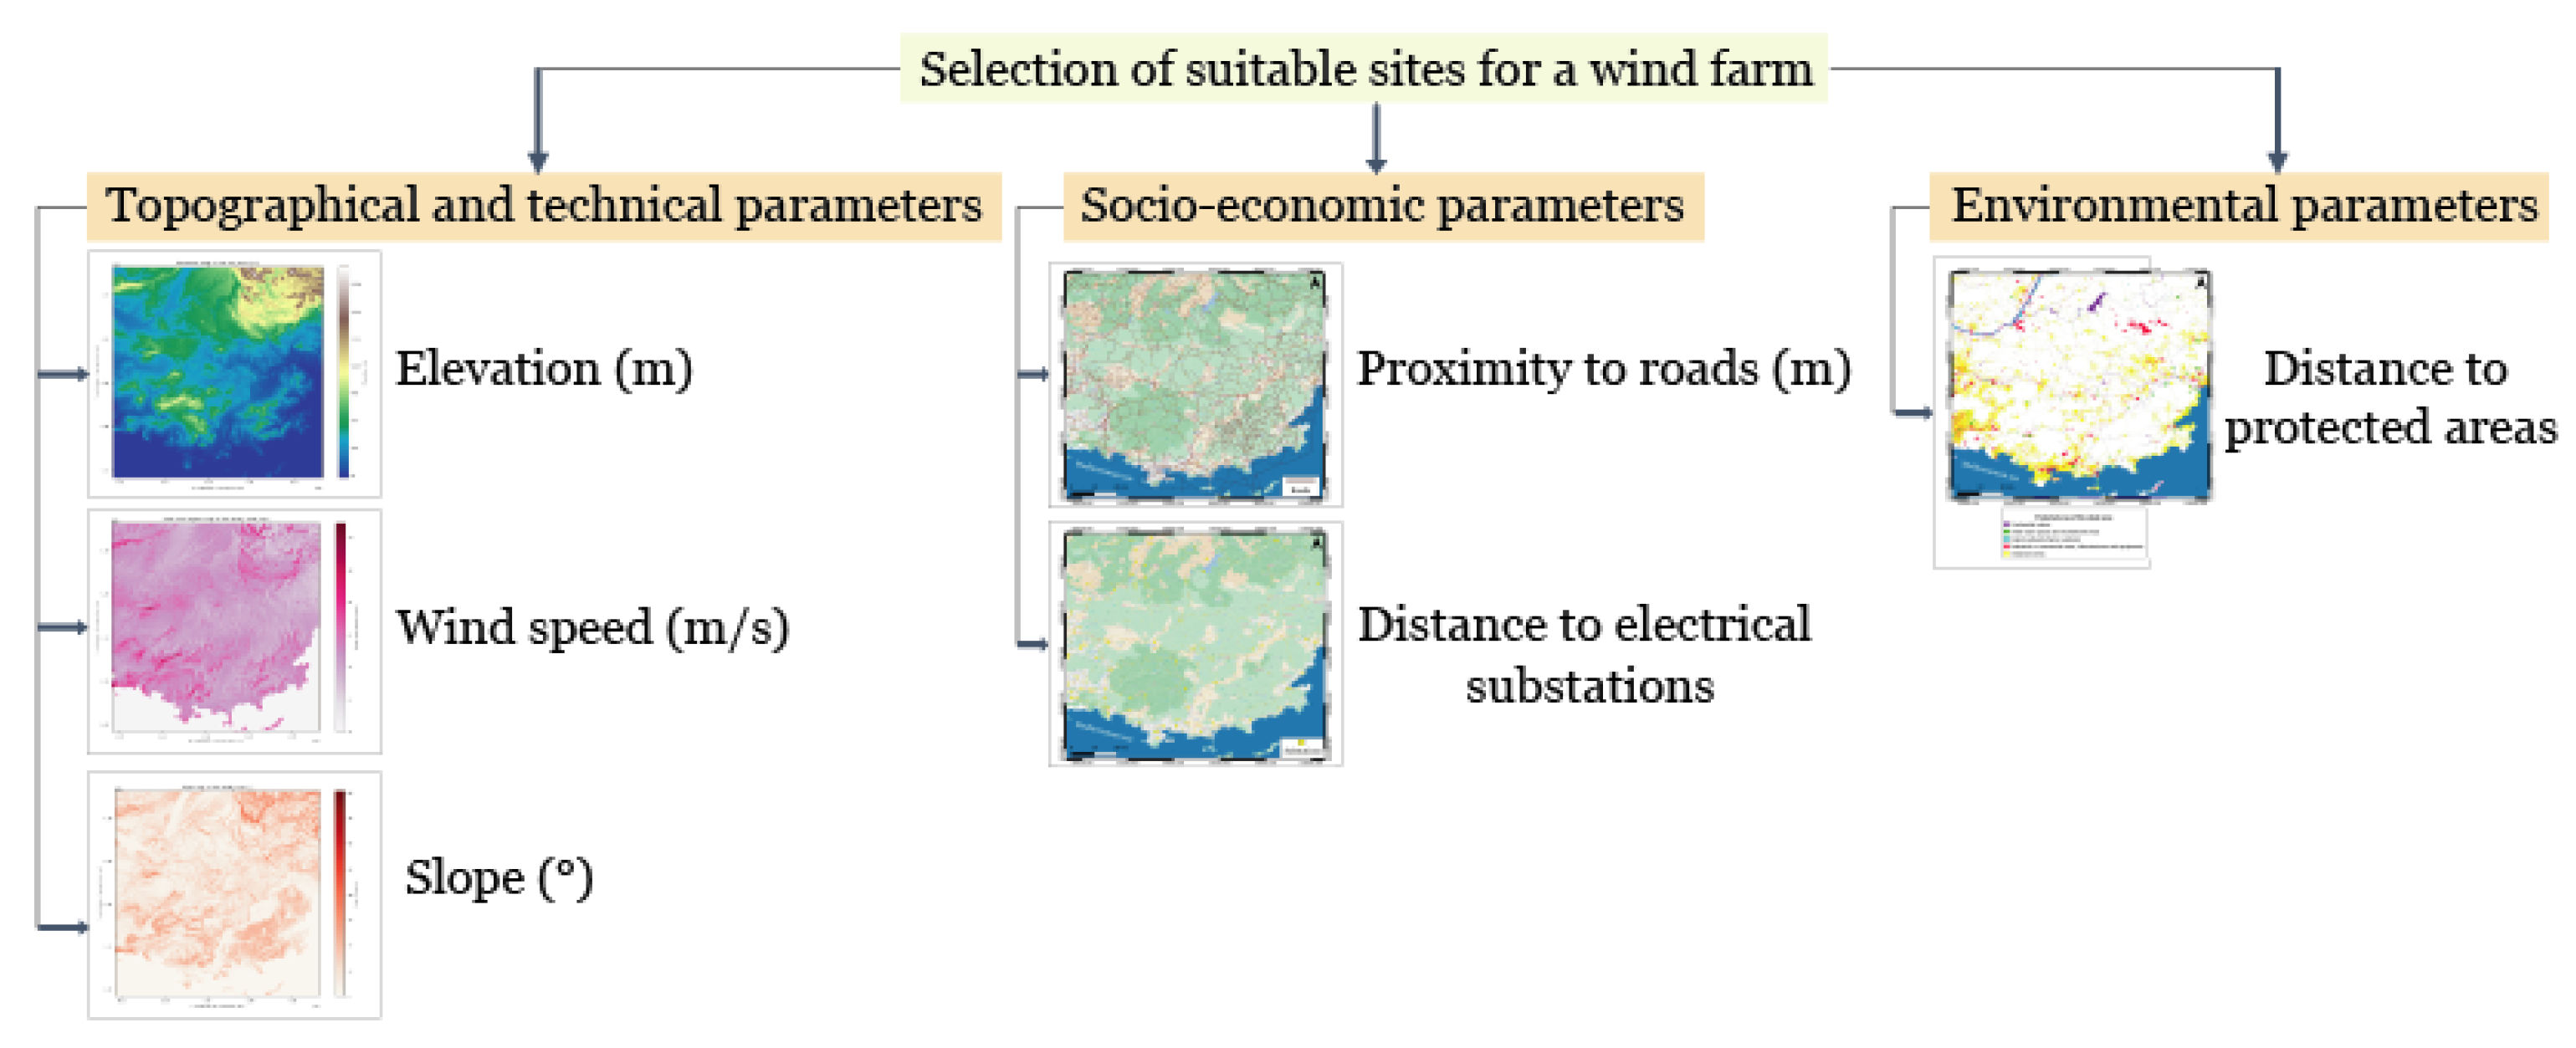
Step 1: Deconstruct the decision-making problem and explain its main characteristics or components (criteria, sub-criteria, options, etc.). Then, using a limited number of levels, create a linear hierarchy of concerns (Figure 8). Each level has a set number of selection criteria. The aim is expressed at the most fundamental level. Subsequently, the second and third layers comprise the criterion and sub-criteria. The bottom of the hierarchy is allotted to alternatives.
Step 2: Design the judgment matrix and pairwise comparison matrices for each criterion. Based on the Saaty scale (Table 2), the pairwise comparisons are grouped into a matrix using the following criteria:
A = [ aij ] = C 1 C 2 C n C 1 C 2 C n 1 a 12 a 1 n 1 a 12 1 a 2 n 1 1 / a 1 n 1 / a 2 n 1  
In relation to the comparisons of two criteria C1 and C2, we designate an important value of the evaluation element “a”. We place the “a” value in the cell column “i” and line “j” of an important criterion. Then, we need to place the value ratio “1/a” in the cell considered less important of the comparison. C1, C2, and Cn are the comparison criteria in row “i” and column “j”, which correspond to the comparison values Ci and Cj. The entries aij are often taken from the ratio scale (1/9-9) [79]. The matrix’s element semantic description is provided in Table 3.
Using the evaluations provided in the previous step, each hierarchy element’s relative relevance was determined. Furthermore, the eigenvector problem is addressed to establish each matrix’s element priority.
First, compute the sum of each jth column value as follows:
S u m i = i = 1 n a i j
Subsequently, a normalized comparison matrix n × n aij* is generated, in which each aij in the matrix is divided by the sum of its jth column, as expressed in Equation (3):
a i j = a i j s u m i
The weights’ ith criterion is then computed as follows:
W i = j = 1 1 a i j n   for   all   k = 1 ,   2 ,   3 ,   . . . ,   n
Step 3: The individual criteria weights are calculated using the eigenvalue procedure’s pairwise comparison matrices. The eigenvalue λmax is calculated by multiplying each column value by the criteria weight as follows:
a i = [   i = 1 n w i a i j ] = d i j n n
Then, using the following equation, we determine the weighted sum value Sw by adding the sum of each preceding matrix’s rows ai:
S w i = j = 1 n d i j
Eventually, for each row, the ratio between the weighted value sum Sw and the weighting criterion is calculated as follows:
R a t i o   i = S w i w i  
By averaging the ratio i we obtain the highest eigenvalue max.
Step 4: Calculate the consistency ratio CR (Equation (8)). The final criteria weights are validated using this ratio. Discrepancies in the comparison matrix are identified at this stage:
C R = C I R I
where the consistency index CI is calculated as follows:
C I = γ max n n 1
The value of the RI varies with the size of the matrix. Table 4 shows the RI values according to the number of criteria chosen.
The RC should be lower than 10% to determine that the pairwise comparison evaluations are consistent. If this is not the case, the matrix should be updated, and the element values re-evaluated.
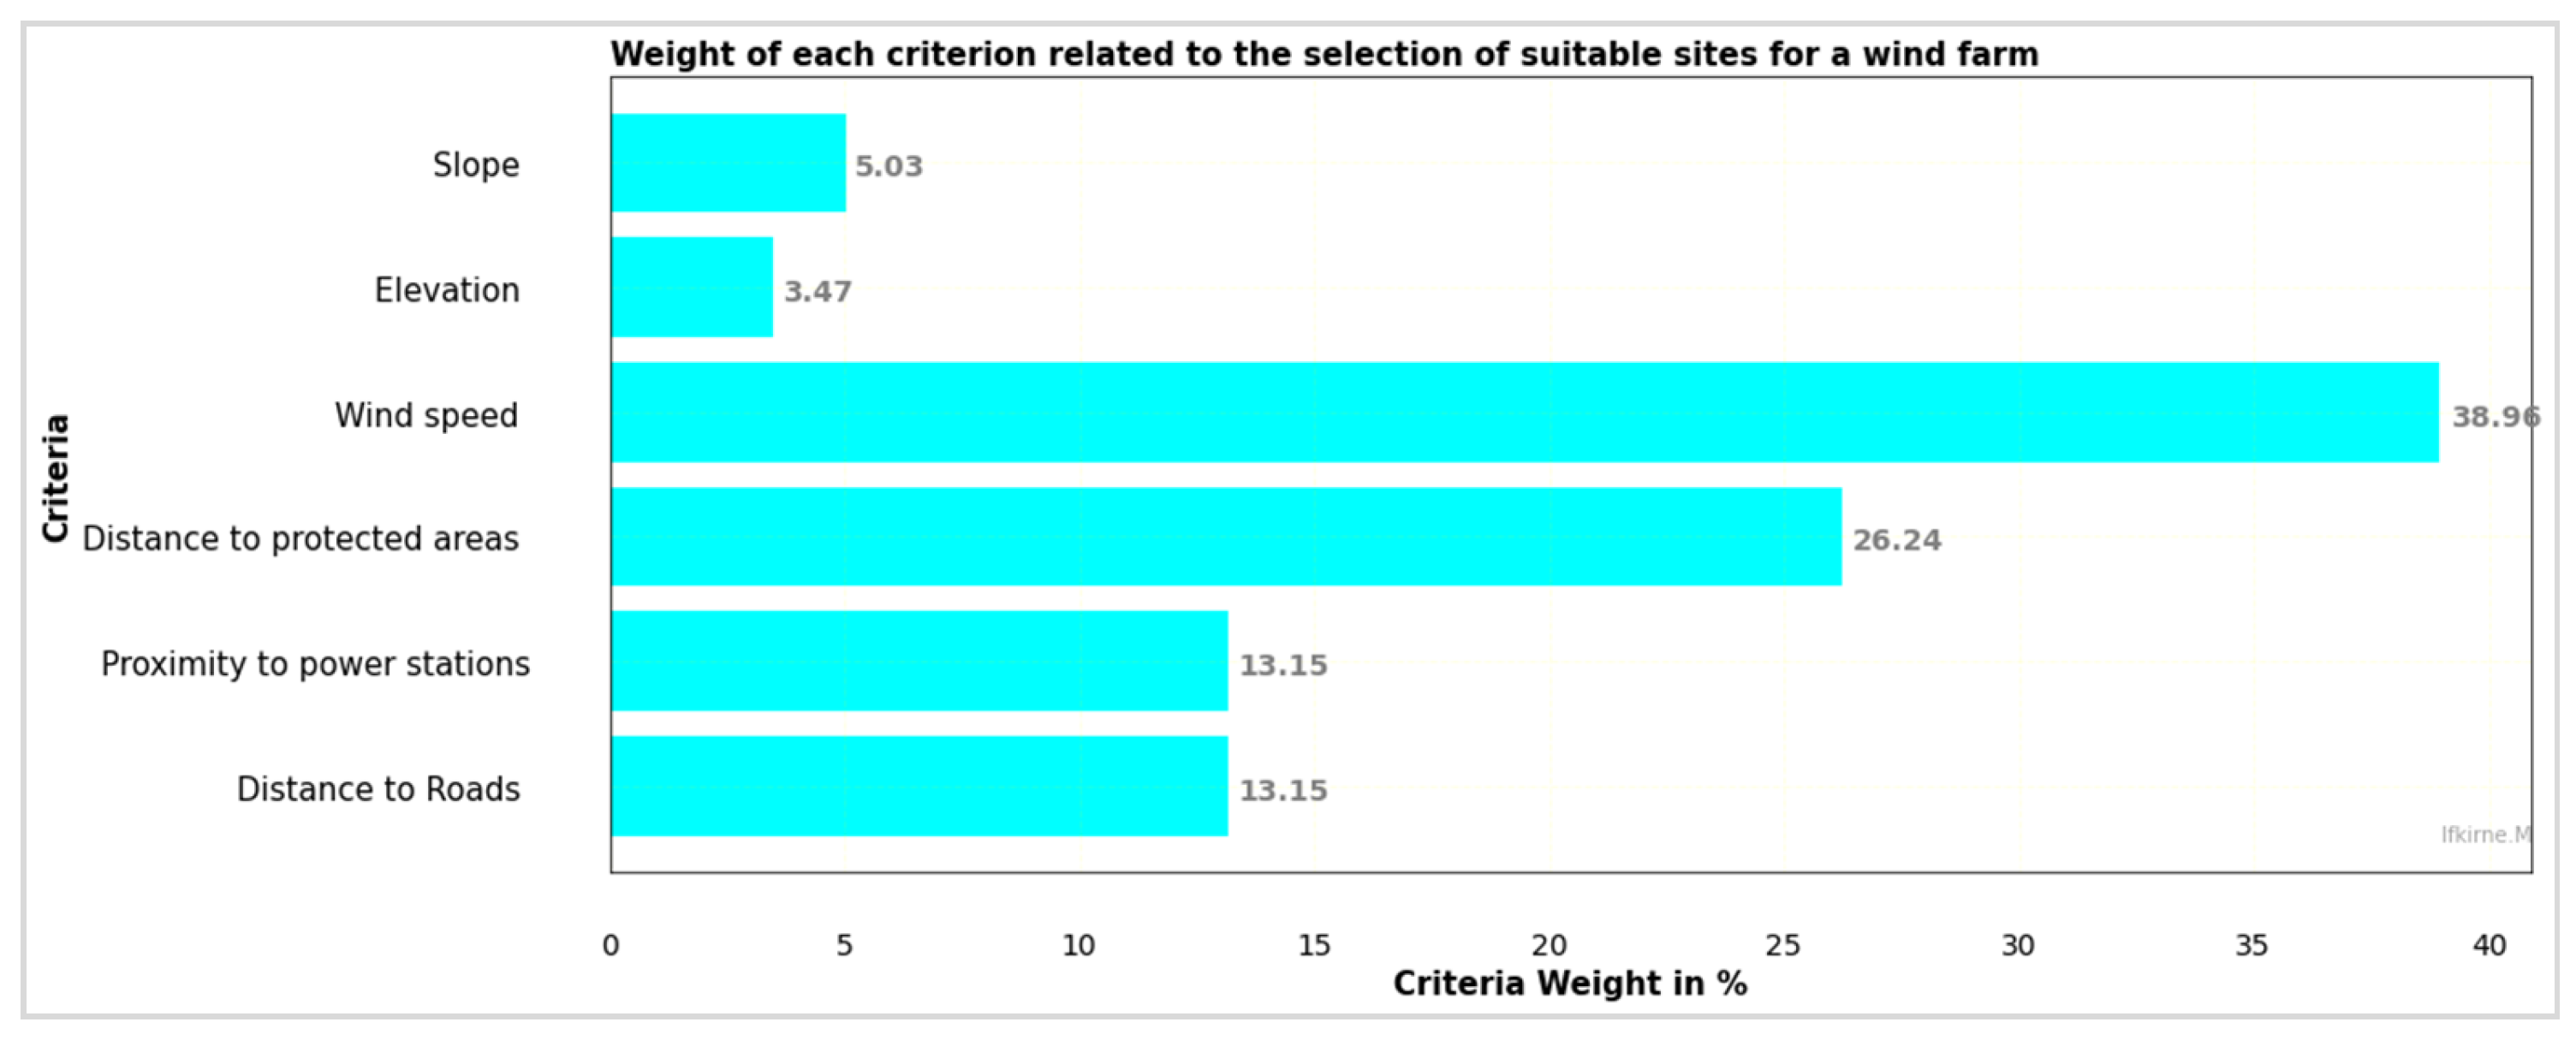
The weighted findings (Table 5) indicate the most important parameters in wind farm development. The wind’s existence is the greatest driver of wind energy, with a relative weight of 38% (Table 4), followed in second place by protected regions with a relative weight of 26%. However, distances to power plants and road networks have a significant influence, with relative weights of 13% each, while slope and elevation have the lowest relative weights of 5% and 3%, respectively. Despite their low weights, these criteria should be considered in all wind projects to avoid or minimize potential negative impacts. This weighting choice is based on our study area’s good knowledge.
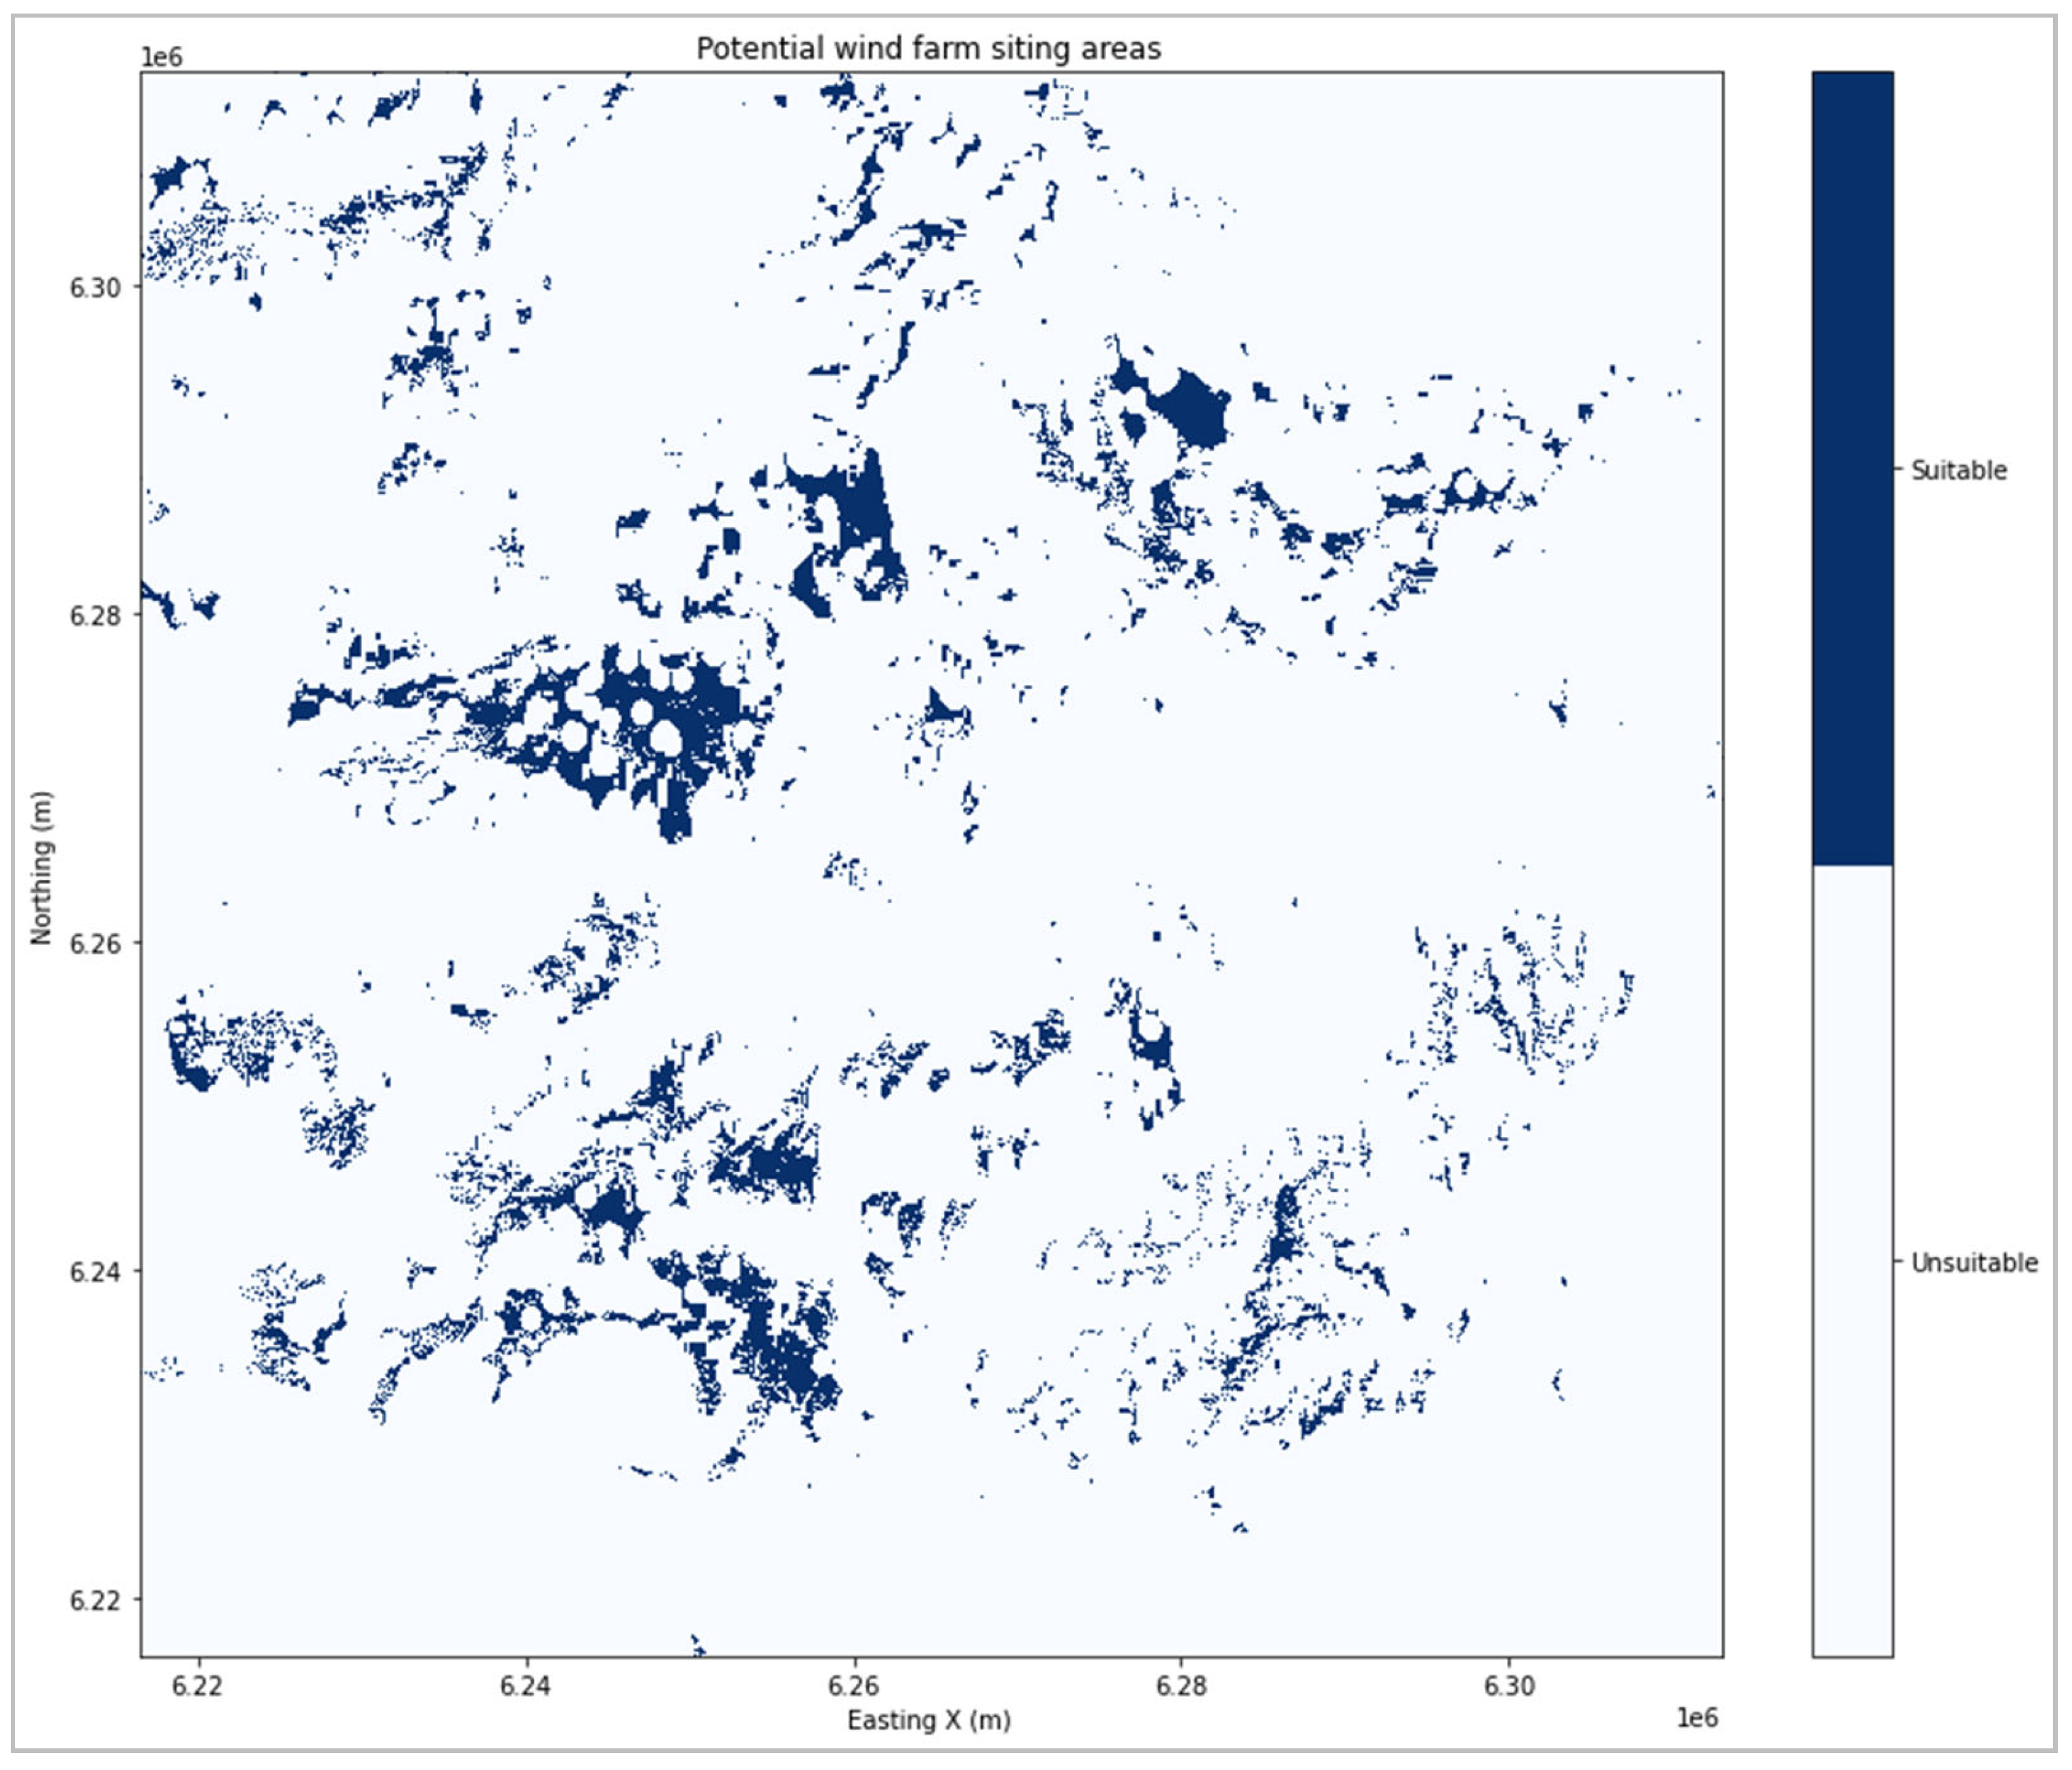
After completing all of the AHP calculation processes, the following step is to normalize the criteria (Table 6). The vector data are then converted to a raster format, and the matrices are reclassified into two groups (adequate: code 1; and inadequate: code 0).

3.4. Weighted Superposition

The weighted overlay tool is one of the most frequently used methods for solving multi-criteria problems, such as site selection and suitability models. For instance, users can use this functionality to combine several spatial layers with varied weights to produce a final result. Each raster layer is assigned a weight in the suitability analysis. The raster layer values are re-ranked on a scale (two classes in our case). In this study, the weighted overlay analysis was utilized to identify the most suitable and appropriate sites for future wind farm siting based on the AHP-derived weights assigned to each evaluated parameter. According to Equation (10), all selected criteria in raster format that have been reclassified to equal size (number of columns equal to the number of rows) (Figure 9) are combined into a single raster layer (Figure 10). Weighted overlay is defined as follows:
W O A = i = 1 n W i R i
where Wi is the weight of a specific choice criterion, Ri is the criterion’s matrix layer, and n is the number of decision criteria.
In total, 962,612 pixels define the wind turbine installation sites. The research area has a total size of 9319 km2. The detected locations cover an area of 650,725,712 m2, or 651 km2. This accounts for roughly 6.98% of the study area’s surface.

4. Results

AHP factor weights were computed using technical, environmental, and economic requirements for wind turbines in France. Factor weights used to evaluate appropriate sites for wind farm installation are shown in Figure 11. As can be seen in Figure 9, wind speed is the most important factor, with a weight of 38%. It is followed by the respect for buffer zones around protected areas (urban areas, wetlands, biodiversity parks, etc.) with a weight of 26%, and the proximity of electrical substations and the road network with a weight of 13% each. Slope and elevation are ranked last, with weights of 5% and 4%, respectively. It should be noted that the eigenvalue max (max = 6.26) is calculated after computing criteria’s weights. CI and CR values are 0.05 and 0.04, respectively. The CR value is 10%, suggesting that the research was satisfactory.
Figure 12 depicts the appropriate location distribution for planning future onshore wind farms in various research regions’ departments. Figure 10 only shows locations greater in size than 400 hectares and the road network and the electricity substation’s locations. Furthermore, calculating the eligible site’s surface shows that 74.62%, or 35,127.92 hectares, is in the Var department, which controls more than 80% of the study area’s surface. Only 10%, or 4962 hectares, of Alpes-de-Haute-Provence department is suitable for future wind farm development, compared to 13.70%, or 6449 hectares, in Bouches-de-Rhones. In the Alpes-Maritimes, however, 1.45%, or 535 hectares, is protected (Figure 13).
Figure 14 demonstrates that 1121 hectares, or 12.07% of the area suitable for future wind farm construction, have an average wind speed greater than 5 m/s, which is required for wind turbine development. Furthermore, 11.24% of the area, or 1044 hectares, is located lower than 1500 m above sea level, while just 8% is on slopes less than 15 degrees; 5.92% is next to roadways, 2.34% is near electrical substations, and 7.91%, or 735 hectares, is outside of protected areas.
On Google Earth imagery, the selected appropriate site locations for wind farm development were projected (Figure 15). Four locations were recommended, and their selection was based on their unique characteristics (area, location, elevation, slope, wind speed, accessibility, closeness to electrical substations, etc.) as well as their proximity to populous regions while respecting buffer zones relative to protected areas. Onshore wind turbines in France typically have a power range of 1.8 to 3 MW, with rotor diameters ranging from 80 to 110 m and total heights ranging from 80 to 155 m. In fact, a 2 MW wind turbine generates 4200 MWh per year, which is roughly equivalent to the average electricity consumption of over 800 French households [8]. France is classified by the International Electrotechnical Commission (IEC) as having strong winds with high average turbulence intensity. Some wind turbine types that are easily useable in the French market have been chosen in accordance with IEC design criteria. Table 7 contains detailed information about the wind turbine types and their attributes.
Theoretical wind power potential may be evaluated using Equation (11) based on wind turbine output capacity, rotor diameter, and total area of appropriate land [81,82,83].
T W P P = T A A F  
TWPP is theoretical wind power potential (MW), TA is the total area of the four appropriate locations (km2) (Figure 13), and AF is the area factor (MW/km2). Our computations were performed on wind turbines that were situated 7d × 5d apart, where d is the rotor diameter.
Based on the theoretical wind potential calculations, the four proposed sites for future wind turbine installations may generate between 182.60 and 280.20 MW of electricity. This energy benefit will suit the study region’s population demands in terms of power consumption, heating, and transportation.

5. Discussion

In 2021, the wind sector in France grew in relevance, accounting for 7% of the country’s net power generation. Furthermore, wind power now accounts for 7.7% of total consumption [32]. More than half of France’s wind farms are concentrated in two regions: Hauts-de-France and Grand Est (Figure 16), with an almost complete absence in the country’s southeast.
Wind power production (wind farms), according to the International Energy Agency, is very unevenly distributed among areas. Despite the study region possessing the country’s most populated cities, it has the lowest energy productivity (201 GWh in 2021). However, the study region (Provence-Alpes-Côte d’Azur, region code: 13) ranks second to last in terms of wind energy generation [60], with 77 wind turbines and a very low installed capacity of 99 MW, compared to demand (Figure 17).
The study area’s onshore potential is greatly limited by certain constraints, including the requirement to avoid exclusion zones imposed by environmental protection areas, historical perimeters, and the requirement to build more than 500 m from homes, as well as habitat dispersion, which reduces the percentage of territory eligible for wind power. This research was conducted for all of these reasons. In addition, it may assist various governmental agencies, policymakers, researchers, and investors in planning and developing wind energy projects in this difficult location.
Regarding criteria, the Ministers of Ecological Transition, Territorial Cohesion, and Energy Transition previously investigated a set of documents and reports on technical requirements, regulations, and environmental and urban planning issues related to wind turbine development in France, which served as the foundation for our criteria and constraints. The thresholds, on the other hand, must be closely tied to certain location characteristics. As a result, the criteria suggested in this study were used with considerable caution. They are currently being explored by wind planning professionals. Practical experience in the subject field is also advantageous for the assessment of visual findings [30].
In addition to the French regulations concerning the determining criteria for land use planning of future wind farm projects, a consultation of confidential reports and a discussion with experts and former researchers in the field of wind farm planning was carried out. The values for each criterion were selected according to French legislation. As no studies have been published on this topic in France, we also based our selection on research undertaken in Europe (e.g., Greece) as mentioned above. Other means can be used to define the important criteria, such as filling in questionnaires by experts in the field. Interviews with experts could also be an effective solution for the determination of criteria.
Furthermore, restriction criteria for onshore wind farm planning in France are well defined; only one scenario is required in this case: average wind speed greater than 5 m/s, altitude less than 1500 m, slope less than 15%, proximity to roads (2 km) and electrical substations (1.5 km), and at least 2 km from protected areas.
Unsurprisingly, as shown in Figure 18a, there is a substantial correlation between areas of high average wind speed and selected site locations as suitable for wind farms. Indeed, the project limits were previously chosen based on a wind speed map in France, which is a region where the average yearly wind speed (at least 50 m above ground level) exceeds 5 m/s. These locations are all accessible by national, regional, or occasionally freeway roads, and the majority of them are near electricity substations (Figure 18d). Furthermore, 30% of the locations are at high altitudes (over 1500 m) (Figure 18c). This is due to the high wind speed in these high-altitude areas, as well as high weight assigned to the wind parameter, and the low weight assigned to the elevation parameter. The selected sites are more than 2 km away from the protected regions (Figure 18e). Since the Southern Alps surround the northern and northwestern parts of the research region, various sites are on steep slopes. Nonetheless, we were able to choose really good locations on moderate slopes (Figure 15). Other criteria, such as acceptance of these installations by populations and associations; administrative procedures and their validation by local authorities; energy demand in these territories; and pre-existing installation replacement, can all have an impact on decisions to install wind turbines. Indeed, the criteria required for wind farm construction, namely minimum average wind speed required, minimum acreage required, closeness of highways and electrical substations, and distance from protected areas, are all gathered at the identified sites. Some research employed the same choice criteria with various limitation levels based on the area and state restrictions. For example, [30] used the same criteria but with different limitation values because the study was conducted in Spain. Nonetheless, three situations were investigated, each with distinct limitation values and weights for the criterion. This scenario-based method is useful when there is little information or rigid wind-level limitations. However, [61] conducted a study to identify viable places for developing onshore wind projects in a rural zone using only four characteristics (urban area or habitat, vegetation, slope, and wind speed). Furthermore, they investigated three scenarios. The multi-criteria analysis technique used, however, is fuzzy rather than AHP. In summary, the multi-criteria technique used in the research varied, as did the number of scenarios examined, the number of criteria addressed, and weights assigned to the criteria. According to the findings of all studies on decision making for project implementation or multi-factor problem solving using GIS-based multi-criteria analysis approaches [62,84,85], when no restriction values are well defined by the state or agreed upon by experts in the field in question, it is recommended that several alternatives be implemented.
The number and total area of suitable sites vary by region. For example, in our case, only 7% of the total area of the study area is suitable for the development of future wind projects. Even though it is a difficult location with various environmental, topographical, and urban restrictions, research and planning for wind farms in this area with great wind potential are still on hold. However, based on the theoretical wind potential calculation equation (Equation (10)), each of the sites depicted in Figure 18 produces an average of 45 MW, which is more than adequate to fulfill the demands of the local population.

6. Conclusions

This research aimed to offer a method for identifying potential sites for future wind energy projects based on geographic information systems (GIS) and multi-criteria decision-making (AHP), as well as to contribute to the literature on renewable energy planning. To the best of the author’s knowledge, this is the first research of its kind in France. Thus, this research was carried out in a region of France’s southeast that has high wind energy potential but is also the least productive. Another reason for choosing this region was to overcome the numerous constraints that limited the region’s energy output. For wind farm siting, six criteria were adopted, practically addressing in full the economic, technical, and socio-environmental challenges associated with these facilities and uses. Most of the criteria were based on worldwide literature, in addition to French wind turbine legislation.
According to the findings, many sites were identified as suitable for wind farms. Visual and manual analyses were performed on these sites to choose those with an area larger than 400 ha, a high average wind speed, accessibility by roads, proximity to electrical substations, and a distance from protected areas. Four sites with an average installed capacity of 45 MW were selected and must be confirmed by the appropriate state authorities. The decision tool provided in this article may be utilized in any part of the world by adapting it to the specific characteristics of each territory, as well as the distinct needs and policies.
Although the results presented in this paper are specific to France, the methodology presented provides an interesting reference model that can be transposed and adapted with relative ease. This assumes that the different constraints and criteria are adapted to the specific needs of energy planners and to the particularities of each study area.
Despite the quality and reliability of the IGN database used, the methodology followed (including the choice of the MCDA method), and the analysis performed in this work, certain aspects are to be recommended for future projects, such as taking into account the knowledge of the study area and the regulations put in place by the government concerned, and the relevant choice of determination (decision) criteria and their weightings, which often vary between experts’ opinions and from one country to another.
The spatial resolution of the data used is also an important element, especially for topographic data (DEM) and wind data.
In addition, a validation of the identified suitable sites could lead to a more robust and real interpretation of the results, either through aerial photography (drone) or a field visit to these sites.
Future studies could consider extending the proposed method to investigate the theoretical energy potential of wind generation in order to benefit from their complementarity and overcome the inherent intermittency of renewable energies. This study can also be the starting point for a project to install wind turbines or solar panels in the study area by simply replacing the wind variable with the temperature variable. Furthermore, this study can also contribute to the creation of new investments and, consequently, new jobs in the region.

Author Contributions

M.I.: Original project, Conceptualization, Methodology, Software, Writing—Original version, Visualization, Reviewing and Editing. H.E.B.: Conceptualization, Methodology, Software. S.A.: Formal analysis, original version, Conceptualization, Writing, Supervision, Revision. Q.B.P.: Formal analysis, original version, Conceptualization, Writing, Supervision, Revision. A.F. and N.T.T.L.: Formal analysis, Revision, Writing. All authors have read and agreed to the published version of the manuscript.

Funding

The authors have no relevant funding to acknowledge.

Data Availability Statement

The data that support the findings of this study are available upon reasonable request.

Acknowledgments

The authors would like to thank the many data authors: The National Institute of Geographic and Forestry Information (IGN) for the BD TOPO®, a current database containing the following data: Administration (boundaries and administrative units); Addresses (postal addresses); Buildings (constructions); Hydrography (water-related features); Places (place or locality with a place name and describing a natural space or inhabited place); Land use (vegetation, foreshore); Services and activities (utilities, energy storage and transport, industrial places and sites); Transportation (road, rail or air infrastructures); Regulated areas (most areas are subject to specific regulations). Transport (road, rail or air infrastructure); Restricted areas (most areas are subject to specific regulations). The National Institute of Statistics and Economic Studies (INSEE). The Global Wind Atlas 3.0, a free web-based application developed, owned, and operated by the Technical University of Denmark (DTU) in partnership with the World Bank Group, using data provided by Vortex, with funding provided by the Energy Sector Management Assistance Program (ESMAP). For more information: https://globalwindatlas.info.

Conflicts of Interest

The authors declare no conflict of interest. The authors declare that they have no known competing financial interests or personal relationships that could have appeared to influence the work reported in this paper. This manuscript has not been published or presented elsewhere in part or entirety and is not under consideration by another journal. There are no conflicts of interest to declare.

References

  1. Criqui, P.; Kouvaritakis, N. World energy projections to 2030. Int. J. Glob. Energy Issues 2000, 14, 116. [Google Scholar] [CrossRef]
  2. Foley, J.A.; DeFries, R.; Asner, G.P.; Barford, C.; Bonan, G.; Carpenter, S.R.; Chapin, F.S.; Coe, M.T.; Daily, G.C.; Gibbs, H.K.; et al. Global consequences of land use. Science 2005, 309, 570–574. [Google Scholar] [CrossRef] [PubMed] [Green Version]
  3. Ceballos, G.; Ehrlich, P.R.; Dirzo, R. Biological annihilation via the ongoing sixth mass extinction signaled by vertebrate population losses and declines. Proc. Natl. Acad. Sci. USA 2017, 114, E6089–E6096. [Google Scholar] [CrossRef] [PubMed] [Green Version]
  4. Steffen, W.; Richardson, K.; Rockström, J.; Cornell, S.E.; Fetzer, I.; Bennett, E.M.; Biggs, R.; Carpenter, S.R.; De Vries, W.; De Wit, C.A.; et al. Planetary boundaries: Guiding human development on a changing planet. Science 2015, 347, 1259855. [Google Scholar] [CrossRef] [Green Version]
  5. Giamalaki, M.; Tsoutsos, T. Sustainable siting of solar power installations in Mediterranean using a GIS/AHP approach. Renew. Energy 2019, 141, 64–75. [Google Scholar] [CrossRef]
  6. Shorabeh, S.N.; Firozjaei, M.K.; Nematollahi, O.; Firozjaei, H.K.; Jelokhani-Niaraki, M. A risk-based multi-criteria spatial decision analysis for solar power plant site selection in different climates: A case study in Iran. Renew. Energy 2019, 143, 958–973. [Google Scholar] [CrossRef]
  7. Han, Y.; Tan, S.; Zhu, C.; Liu, Y. Research on the emission reduction effects of carbon trading mechanism on power industry: Plant-level evidence from China. Int. J. Clim. Change Strateg. Manag. 2022. ahead-of-print. [Google Scholar] [CrossRef]
  8. Ministère de la Transition Écologique et de la Cohésion des Territoires et Ministère de la Transition Énergétique (MTECT & MTE). Les Énergies Renouvelables. 2022. Available online: https://www.ecologie.gouv.fr/energies-renouvelables (accessed on 10 July 2022).
  9. Hepbasli, A.; Ozgener, O. A review on the development of wind energy in Turkey. Renew. Sustain. Energy Rev. 2004, 8, 257–276. [Google Scholar] [CrossRef]
  10. Kamdar, I.; Ali, S.; Taweekun, J.; Ali, H.M. Wind Farm Site Selection Using WAsP Tool for Application in the Tropical Region. Sustainability 2021, 13, 13718. [Google Scholar] [CrossRef]
  11. Shu, Z.; Li, Q.; Chan, P.W. Statistical analysis of wind characteristics and wind energy potential in Hong Kong. Energy Convers. Manag. 2015, 101, 644–657. [Google Scholar] [CrossRef]
  12. Østergaard, P.A.; Duic, N.; Noorollahi, Y.; Kalogirou, S.A. Recent advances in renewable energy technology for the energy transition. Renew. Energy 2021, 179, 877–884. [Google Scholar] [CrossRef]
  13. Baseer, M.; Rehman, S.; Meyer, J.; Alam, M. GIS-based site suitability analysis for wind farm development in Saudi Arabia. Energy 2017, 141, 1166–1176. [Google Scholar] [CrossRef] [Green Version]
  14. Réseau de Trasnport et d’Électricité (RTE), Futurs Énergétiques 2050: Principaux Résultats. 2021. Available online: https://assets.rte-france.com/prod/public/2021-10/Futurs-Energetiques-2050-principaux-resultats_0.pdf (accessed on 10 July 2022).
  15. Réseau de Transport et D’Éléctricité (RTE) & Référentiel Éolien Terrestre National (RETN). Carte des Éoliennes en Service au Sein de la France Métropolitaine. 2021. Available online: https://www.data.gouv.fr/fr/datasets/retn-referentiel-eolien-terrestre-national-carte-des-eoliennes-en-service-au-sein-de-la-france-metropolitaine-hors-corse/ (accessed on 16 July 2022).
  16. Taoufik, M.; Fekri, A. GIS-based multi-criteria analysis of offshore wind farm development in Morocco. Energy Convers. Manag. X 2021, 11, 100103. [Google Scholar] [CrossRef]
  17. Amjad, F.; Shah, L.A. Identification and assessment of sites for solar farms development using GIS and density based clustering technique- A case of Pakistan. Renew. Energy 2020, 155, 761–769. [Google Scholar] [CrossRef]
  18. Barzehkar, M.; Parnell, K.E.; Dinan, N.M.; Brodie, G. Decision support tools for wind and solar farm site selection in Isfahan Province, Iran. Clean Technol. Environ. Policy 2020, 23, 1179–1195. [Google Scholar] [CrossRef]
  19. Elboshy, B.; Alwetaishi, M.; Aly, R.M.H.; Zalhaf, A.S. A suitability mapping for the PV solar farms in Egypt based on GIS-AHP to optimize multi-criteria feasibility. Ain Shams Eng. J. 2022, 13, 101618. [Google Scholar] [CrossRef]
  20. Tercan, E.; Eymen, A.; Urfalı, T.; Saracoglu, B.O. A sustainable framework for spatial planning of photovoltaic solar farms using GIS and multi-criteria assessment approach in Central Anatolia, Turkey. Land Use Policy 2021, 102, 105272. [Google Scholar] [CrossRef]
  21. Wilson, T.N.E.; Camille, K.M. Identification des sites favorables à l’installation des centrales solaires photovoltaïques à l’aide de l’analyse multicritères et des SIG: Cas de l’arrondissement de Bélabo, Cameroun. Int. J. Innov. Appl. Stud. 2019, 26, 938–952. Available online: https://www.proquest.com/openview/c0a8941925ffca23139ea86c22156205/1?pq-origsite=gscholar&cbl=2031961 (accessed on 17 September 2022).
  22. Koc, A.; Turk, S.; Şahin, G. Multi-criteria of wind-solar site selection problem using a GIS-AHP-based approach with an application in Igdir Province/Turkey. Environ. Sci. Pollut. Res. 2019, 26, 32298–32310. [Google Scholar] [CrossRef]
  23. Mahdy, M.; Bahaj, A.S. Multi criteria decision analysis for offshore wind energy potential in Egypt. Renew. Energy 2018, 118, 278–289. [Google Scholar] [CrossRef]
  24. Moradi, S.; Yousefi, H.; Noorollahi, Y.; Rosso, D. Multi-criteria decision support system for wind farm site selection and sensitivity analysis: Case study of Alborz Province, Iran. Energy Strat. Rev. 2020, 29, 100478. [Google Scholar] [CrossRef]
  25. Ayodele, T.; Ogunjuyigbe, A.; Odigie, O.; Munda, J. A multi-criteria GIS based model for wind farm site selection using interval type-2 fuzzy analytic hierarchy process: The case study of Nigeria. Appl. Energy 2018, 228, 1853–1869. [Google Scholar] [CrossRef]
  26. Diemuodeke, E.; Addo, A.; Oko, C.; Mulugetta, Y.; Ojapah, M. Optimal mapping of hybrid renewable energy systems for locations using multi-criteria decision-making algorithm. Renew. Energy 2018, 134, 461–477. [Google Scholar] [CrossRef]
  27. Rehman, S.; Baseer, M.; Alhems, L. GIS-based multi-criteria wind farm site selection methodology. FME Trans. 2020, 48, 855–867. [Google Scholar] [CrossRef]
  28. Spyridonidou, S.; Vagiona, D.G. A comparative analysis of decision-making methods on site suitability for on- and offshore wind farms: The case of regional unit of Euboea, Greece. Circ. Econ. Sustain. 2021, 1–14. [Google Scholar] [CrossRef]
  29. Feloni, E.; Karandinaki, E. GIS-based MCDM Approach for Wind Farm Site Selection-A Case Study. J. Energy Power Technol. 2021, 3, 39. [Google Scholar] [CrossRef]
  30. Díaz-Cuevas, P. GIS-based methodology for evaluating the wind-energy potential of territories: A case study from Anda-lusia (Spain). Energies 2018, 11, 2789. [Google Scholar] [CrossRef] [Green Version]
  31. Malczewski, J. GIS and Multicriteria Decision Analysis; John Wiley & Sons: Hoboken, NJ, USA, 1999. [Google Scholar]
  32. Wikipédia. Climat de la France. 2017. Available online: https://fr.wikipedia.org/wiki/Climat_de_la_France (accessed on 22 July 2022).
  33. NASA Prediction of Worldwide Energy Resources. The POWER Project. Available online: https://power.larc.nasa.gov/ (accessed on 15 September 2022).
  34. Denmark. The Global Wind Atlas 3.0, T.U.o. Editor, 2019.
  35. IGN. BD TOPO®. 2021. Available online: https://geoservices.ign.fr/bdtopo (accessed on 17 July 2022).
  36. Yousefi, H.; Motlagh, S.G.; Montazeri, M. Multi-Criteria Decision-Making System for Wind Farm Site-Selection Using Geographic Information System (GIS): Case Study of Semnan Province, Iran. Sustainability 2022, 14, 7640. [Google Scholar] [CrossRef]
  37. Atici, K.B.; Simsek, A.B.; Ulucan, A.; Tosun, M.U. A GIS-based Multiple Criteria Decision Analysis approach for wind power plant site selection. Util. Policy 2015, 37, 86–96. [Google Scholar] [CrossRef]
  38. Konstantinos, I.; Georgios, T.; Garyfalos, A. A Decision Support System methodology for selecting wind farm installation locations using AHP and TOPSIS: Case study in Eastern Macedonia and Thrace region, Greece. Energy Policy 2019, 132, 232–246. [Google Scholar] [CrossRef]
  39. Gorsevski, P.V.; Cathcart, S.C.; Mirzaei, G.; Jamali, M.M.; Ye, X.; Gomezdelcampo, E. A group-based spatial decision support system for wind farm site selection in Northwest Ohio. Energy Policy 2013, 55, 374–385. [Google Scholar] [CrossRef]
  40. Simao, A.; Densham, P.J.; Haklay, M.M. Web-based GIS for collaborative planning and public participation: An application to the strategic planning of wind farm sites. J. Environ. Manag. 2009, 90, 2027–2040. [Google Scholar] [CrossRef] [PubMed]
  41. Sunak, Y.; Madlener, R. The impact of wind farm visibility on property values: A spatial difference-in-differences analysis. Energy Econ. 2016, 55, 79–91. [Google Scholar] [CrossRef]
  42. Schallenberg-Rodríguez, J.; Montesdeoca, N.G. Spatial planning to estimate the offshore wind energy potential in coastal regions and islands. Practical case: The Canary Islands. Energy 2018, 143, 91–103. [Google Scholar] [CrossRef]
  43. Holland, G.B.; Provenzano, J.J. The Hydrogen Age: Empowering a Clean-Energy Future; Gibbs Smith: Layton, UT, USA, 2007. [Google Scholar]
  44. Opalek, C. Wind Power Fraud; Lulu.com: Morrisville, NV, USA, 2010. [Google Scholar]
  45. Noorollahi, Y.; Yousefi, H.; Mohammadi, M. Multi-criteria decision support system for wind farm site selection using GIS. Sustain. Energy Technol. Assess. 2016, 13, 38–50. [Google Scholar] [CrossRef]
  46. Villacreses, G.; Gaona, G.; Martínez-Gómez, J.; Jijón, D.J. Wind farms suitability location using geographical information system (GIS), based on multi-criteria decision making (MCDM) methods: The case of continental Ecua-dor. Renew. Energy 2017, 109, 275–286. [Google Scholar] [CrossRef]
  47. Latinopoulos, D.; Kechagia, K. A GIS-based multi-criteria evaluation for wind farm site selection. A regional scale application in Greece. Renew. Energy 2015, 78, 550–560. [Google Scholar] [CrossRef]
  48. Tegou, L.-I.; Polatidis, H.; Haralambopoulos, D.A. Environmental management framework for wind farm siting: Methodology and case study. J. Environ. Manag. 2010, 91, 2134–2147. [Google Scholar] [CrossRef]
  49. Höfer, T.; Sunak, Y.; Siddique, H.; Madlener, R. Wind farm siting using a spatial Analytic Hierarchy Process ap-proach: A case study of the Städteregion Aachen. Appl. Energy 2016, 163, 222–243. [Google Scholar] [CrossRef]
  50. Sotiropoulou, K.F.; Vavatsikos, A.P. Onshore wind farms GIS-Assisted suitability analysis using PROMETHEE II. Energy Policy 2021, 158, 112531. [Google Scholar] [CrossRef]
  51. Watson, J.J.; Hudson, M.D. Regional Scale wind farm and solar farm suitability assessment using GIS-assisted multi-criteria evaluation. Landsc. Urban Plan. 2015, 138, 20–31. [Google Scholar] [CrossRef]
  52. Greek Legislation. Law 4432/B; Government Gazette: Athens, Greece, 2017.
  53. European Commission. Natura 2000—Environment. Available online: https://ec.europa.eu/environment/nature/natura2000/index_en.htm (accessed on 13 September 2022).
  54. Gharaibeh, A.A.; Al-Shboul, D.A.; Al-Rawabdeh, A.M.; Jaradat, R.A. Establishing Regional Power Sustainability and Feasibility Using Wind Farm Land-Use Optimization. Land 2021, 10, 442. [Google Scholar] [CrossRef]
  55. Zahedi, R.; Ghorbani, M.; Daneshgar, S.; Gitifar, S.; Qezelbigloo, S. Measuring Iran’s western regional wind power potential using GIS. J. Clean. Prod. 2022, 330, 129883. [Google Scholar] [CrossRef]
  56. Janke, J.R. Multicriteria GIS modeling of wind and solar farms in Colorado. Renew. Energy 2010, 35, 2228–2234. [Google Scholar] [CrossRef]
  57. Gavériaux, L.; Laverrière, G.; Wang, T.; Maslov, N.; Claramunt, C. GIS-based multi-criteria analysis for offshore wind turbine deployment in Hong Kong. Ann. GIS 2019, 25, 207–218. [Google Scholar] [CrossRef]
  58. Kumar, A.; Samadder, S.R. A review on technological options of waste to energy for effective management of municipal solid waste. Waste Manag. 2017, 69, 407–422. [Google Scholar] [CrossRef]
  59. Algarín, C.R. An Analytic Hierarchy Process Based Approach for Evaluating Renewable Energy Sources. 2017. Available online: http://hdl.handle.net/11159/1258 (accessed on 9 September 2022).
  60. Nedjar, S. Répartition des Éoliennes en France: Découvrez le Classement. Hello Watt. 2022. Available online: https://www.hellowatt.fr/blog/etude-eoliennes-terrestres-france/ (accessed on 20 July 2022).
  61. Uzar, Ş.M. Suitable map analysis for wind energy projects using remote sensing and GIS: A case study in Turkey. Environ. Monit. Assess. 2019, 191, 459. [Google Scholar] [CrossRef]
  62. Abdelouhed, F.; Ahmed, A.; Abdellah, A.; Yassine, B.; Mohammed, I. Using GIS and remote sensing for the mapping of potential groundwater zones in fractured environments in the CHAOUIA-Morocco area. Remote Sens. Appl. Soc. Environ. 2021, 23, 100571. [Google Scholar] [CrossRef]
  63. Saaty, T.L. Optimization in Integers and Related External Problems; McGraw-Hill: New York, NY, USA, 1970. [Google Scholar]
  64. Ishii, K.; Sugeno, M. A model of human evaluation process using fuzzy measure. Int. J. Man-Mach. Stud. 1985, 22, 19–38. [Google Scholar] [CrossRef]
  65. Saaty, T.L.; Vargas, L.G. The Analytic Network Process. In Decision Making with the Analytic Network Process; Springer: Boston, MA, USA, 2013; pp. 1–40. Available online: https://link.springer.com/chapter/10.1007/978-1-4614-7279-7_1 (accessed on 12 September 2022).
  66. Alinezhad, A.; Khalili, J. New Methods and Applications in Multiple Attribute Decision Making (MADM); Springer: Cham, Switzerland, 2019; Volume 277, Available online: https://link.springer.com/book/10.1007/978-3-030-15009-9 (accessed on 12 September 2022).
  67. Zhu, Y.; Tian, D.; Yan, F. Effectiveness of Entropy Weight Method in Decision-Making. Mathematical Problems in Engineering. 2020. Available online: https://www.hindawi.com/journals/mpe/2020/3564835/ (accessed on 12 September 2022).
  68. Si, S.L.; Vous, X.Y.; Liu, H.C.; Zhang, P. DEMATEL Technique: Une revue systématique de la littérature de pointe sur les méthodologies et les applications. Math. Probl. Ing. 2018, 2018, 3696457. [Google Scholar]
  69. Chang, Y.S. Cartes de contrôle multivariées CUSUM et EWMA pour les populations asymétriques utilisant des écarts-types pondérés. Commun. Stat. Simul. Calcul. 2007, 36, 921–936. [Google Scholar] [CrossRef]
  70. Lu, X.; Li, L.Y.; Lei, K.; Wang, L.; Zhai, Y.; Zhai, M. Water quality assessment of Wei River, China using fuzzy synthetic evaluation. Environ. Earth Sci. 2010, 60, 1693–1699. [Google Scholar] [CrossRef]
  71. Cui, Y.; Feng, P.; Jin, J.; Liu, L. Water resources carrying capacity evaluation and diagnosis based on set pair analysis and improved the entropy weight method. Entropy 2018, 20, 359. [Google Scholar] [CrossRef] [Green Version]
  72. Ahmadi, M.H.; Hosseini Dehshiri, S.S.; Hosseini Dehshiri, S.J.; Mostafaeipour, A.; Almutairi, K.; Ao, H.X.; Rezaei, M.; Techato, K. A Thorough Economic Evaluation by Implementing Solar/Wind Energies for Hydrogen Production: A Case Study. Sustainability 2022, 14, 1177. [Google Scholar] [CrossRef]
  73. Tanackov, I.; Badi, I.; Stević, Ž.; Pamučar, D.; Zavadskas, E.K.; Bausys, R. A Novel Hybrid Interval Rough SWARA–Interval Rough ARAS Model for Evaluation Strategies of Cleaner Production. Sustainability 2022, 14, 4343. [Google Scholar] [CrossRef]
  74. Meng, R.; Zhang, L.; Zang, H.; Jin, S. Evaluation of Environmental and Economic Integrated Benefits of Photovoltaic Poverty Alleviation Technology in the Sanjiangyuan Region of Qinghai Province. Sustainability 2021, 13, 13236. [Google Scholar] [CrossRef]
  75. Koundinya, S.; Chattopadhyay, D.; Ramanathan, R. Incorporating qualitative objectives in integrated resource planning: Application of analytic hierarchy process and compromise programming. Energy Sources 1995, 17, 565–581. [Google Scholar] [CrossRef]
  76. Mosadeghi, R.; Warnken, J.; Tomlinson, R.; Mirfenderesk, H. Comparison of Fuzzy-AHP and AHP in a spatial multi-criteria decision making model for urban land-use planning. Comput. Environ. Urban Syst. 2015, 49, 54–65. [Google Scholar] [CrossRef] [Green Version]
  77. Aydi, A.; Zairi, M.; Ben Dhia, H. Minimization of environmental risk of landfill site using fuzzy logic, analytical hierarchy process, weighted linear combination methodology in a geographic information system environment. Environ. Earth Sci. 2012, 68, 1375–1389. [Google Scholar] [CrossRef]
  78. Shahabi, H.; Keihanfard, S.; Bin Ahmad, B.; Amiri, M.J.T. Evaluating Boolean, AHP and WLC methods for the selection of waste landfill sites using GIS and satellite images. Environ. Earth Sci. 2013, 71, 4221–4233. [Google Scholar] [CrossRef]
  79. Saaty, T. The Analytic Hierarchy Process (AHP) for Decision Making; Kube, Japan, 1980; pp. 1–69. Available online: http://www.cashflow88.com/decisiones/saaty1.pdf (accessed on 15 September 2022).
  80. Donegan, H.A.; Dodd, F.J. A note on Saaty’s random indexes. Math. Comput. Model. 1991, 15, 135–137. [Google Scholar] [CrossRef]
  81. Anwarzai, M.A.; Nagasaka, K. Utility-scale implementable potential of wind and solar energies for Afghanistan using GIS multi-criteria decision analysis. Renew. Sustain. Energy Rev. 2017, 71, 150–160. [Google Scholar] [CrossRef]
  82. Bina, S.M.; Jalilinasrabady, S.; Fujii, H.; Farabi-Asl, H. A comprehensive approach for wind power plant potential as-sessment, application to northwestern Iran. Energy 2018, 164, 344–358. [Google Scholar] [CrossRef]
  83. Saraswat, S.; Digalwar, A.K.; Yadav, S.; Kumar, G. MCDM and GIS based modelling technique for assessment of solar and wind farm locations in India. Renew. Energy 2021, 169, 865–884. [Google Scholar] [CrossRef]
  84. Abdelouhed, F.; Ahmed, A.; Abdellah, A.; Yassine, B.; Mohammed, I. GIS and remote sensing coupled with analytical hierarchy process (AHP) for the selection of appropriate sites for landfills: A case study in the province of Ouarzazate, Morocco. J. Eng. Appl. Sci. 2022, 69, 19. [Google Scholar] [CrossRef]
  85. Akay, H. Towards Linking the Sustainable Development Goals and a Novel Proposed Snow Avalanche Susceptibility Mapping. Water Resour. Manag. 2022, 36, 1–18. [Google Scholar] [CrossRef]
Figure 1. France’s situation in Europe (a), Wind turbine geographical distribution in France (b) [15].
Land 11 01839 g001
Figure 2. Study area’s geographical location (a), on a national scale, (b) on regional and departmental scales, and (c) on a local scale.
Land 11 01839 g002
Figure 3. Average annual variability of climate data (precipitation, temperature, and wind) in the study area over the last 20 years.
Land 11 01839 g003
Figure 4. Research area’s population density (inhabitants/km2).
Land 11 01839 g004
Figure 5. Study flowchart illustrating modeling strategy.
Land 11 01839 g005
Figure 6. (a) Elevation map (m); (b) average wind speed map (m/s); (c) slope map (°); (d) road network; (e) locations of power plants and substations in the study area.
Land 11 01839 g006
Figure 7. Protected areas of the study area.
Land 11 01839 g007
Figure 8. Hierarchical structure of wind farm-related factors and site selection criteria.
Land 11 01839 g008
Figure 9. Each weighted criterion’s reclassified rasters (in blue: appropriate, in white: inappropriate).
Land 11 01839 g009
Figure 10. Reclassified raster’s weighted overlay map.
Land 11 01839 g010
Figure 11. Decision criteria priority weights for selecting suitable sites for future wind projects.
Land 11 01839 g011
Figure 12. Maps showing potential locations for future onshore wind farms in southern France’s Provence-Alpes-Côte d’Azur region.
Land 11 01839 g012
Figure 13. Suitable site percentage distribution (%) for future wind project implementation by department.
Land 11 01839 g013
Figure 14. Representation of the percentage regions in the “appropriate = score 1” class for each criterion for potential wind farm locations.
Land 11 01839 g014
Figure 15. Example of the most suitable sites selected and their characteristics (geographical coordinates of their centroids, area in hectares, perimeter in km, average wind speed, and average altitude) for the development of onshore wind farms.
Land 11 01839 g015
Figure 16. Wind farm point density in France’s spatial distribution.
Land 11 01839 g016
Figure 17. Wind turbine distribution by region and their installed capacity in metropolitan France (1: Hauts-de-France; 2: Grand Est; 3: Occitanie; 4: Nouvelle-Aquitaine; 5: Centre-Val de Loire; 6: Bretagne; 7: Pays de la Loire 8: Bourgogne-Franche-Comté; 9: Normandie; 10: Auvergne-Rhone-Alpes; 11 Guadeloupe; 12: Auvergne-Rhone-Alpes; 13: Provence-Alpes-Cote d’Azure; 14: ile-de-France).
Land 11 01839 g017
Figure 18. Suitable site locations for future wind energy projects about each decision parameter: (a): average wind speed; (b): accessibility to roads; (c): elevation; (d): proximity to substations; (e): buffer to protected areas; (f): slope.
Land 11 01839 g018
Table 1. Data collection and their sources.
DataFile FormatSource
Wind speedGridGlobal Wind Atlas 3.0 [33,34]
Digital elevation (STRM)GridU.S. Geological Survey available at https://earthexplorer.usgs.gov, accessed on 15 July 2022
Protected areaShapefileBD TOPO IGN [35]
Road networkShapefileBD TOPO IGN [35]
Electrical SubstationShapefileBD TOPO IGN [35]
Table 2. Saaty’s comparison scale.
Rating ScaleDefinitionDescription
1Equal importanceTwo requirements are of equal values
3Moderate importance on one over anotherExperience slightly favors one requirement over another
5Essential of strong importanceExperience strongly favors one requirement over another
7Very strong importanceA requirement is strongly favored, and its dominance is demonstrated in practice
9Extreme importancethe evidence favoring one over another is of the highest possible order of affirmation
2, 4, 6, 8Intermediate values between the two adjacent judgementWhen compromise is needed
Table 3. Pairwise comparison matrix.
Criteria(1)(2)(3)(4)(5)(6)
Slope (1)121/61/51/41/4
Elevation (2)1/211/71/61/51/5
Wind speed (3)671244
Distance to protected areas (4)561/2133
Distance from power stations (5)451/41/311
Distance to Roads (6)451/41/311
Total20.5262.314.039.459.45
Table 4. Random Consistency Index (RI), [80].
n234567891011
RI00.580.901.121.241.321.411.451.491.51
Table 5. Evaluation criterion weighting.
(1)(2)(3)(4)(5)(6)Weight %
Slope (1)0.050.080.070.050.030.035.03
Elevation (2)0.020.040.060.040.020.023.47
Wind speed (3)0.290.270.430.500.420.4238.96
Distance to protected areas (4)0.240.230.220.250.320.3226.24
Distance from power stations (5)0.200.190.110.080.110.1113.15
Distance to Roads (6)0.200.190.110.080.110.1113.1
Consistency measure = 6.26, CR = 0.04, CI = 0.05.
Table 6. Standardization table for selected criteria.
CriteriaSuitable: Score 1Unsuitable: Score 0
Slope<15 degrees>15 degrees
Elevation<1000 m>1000 m
Wind speed>5 m/s<5 m/s
Distance to protected areas>2000 m<2000 m
Distance from power stations<1500 m>1500 m
Distance to roads<2000 m>2000 m
Table 7. Theoretical potential of wind energy on highly suitable land.
ManufacturerWind Turbine ModelRotor Diameter (m)Capacity (MW)7 d × 5 d
Area (Km2)
Area Factor (MW/Km2)Theoretical Wind Power Potential (MW)
VestaV110-2.01102.00.4244.72182.60
GE1.6 to 82.5 WT82.51.60.2386.72259.98
Vent Inox93 RD + 80 HH932.00.3036.60255.26
ReGen PowertechVENSYS-77771.50.2077.25280.20
Surface in km2 of the selected sites very suitable (Figure 11) = 38.67 km2.
Publisher’s Note: MDPI stays neutral with regard to jurisdictional claims in published maps and institutional affiliations.

