Article

Characterizing Temporal Dynamics of Urban Heat Island in a Rapidly Expanding City: A 39 Years Study in Zhengzhou, China

1
College of Landscape Architecture and Art, Henan Agricultural University, Zhengzhou 450002, China
2
Department of Landscape Planning and Regional Development, Institute of Landscape Architecture, Urban Planning and Garden Art, Hungarian University of Agriculture and Life Sciences, 1118 Budapest, Hungary
3
School of Resources and Environment, Henan University of Economics and Law, Zhengzhou 450046, China
4
Henan Provincial Climate Centre, Zhengzhou 450003, China
5
CMA•Henan Key Laboratory of Agrometeorological Support and Applied Technique, Zhengzhou 450003, China
*
Author to whom correspondence should be addressed.
Land 2022, 11(10), 1838; https://doi.org/10.3390/land11101838
Submission received: 21 September 2022 / Revised: 15 October 2022 / Accepted: 17 October 2022 / Published: 19 October 2022
(This article belongs to the Special Issue How Do Land–Climate Interactions Affect Urban Heat Islands?)

Abstract

:
Extreme heat wave weather phenomena have erupted worldwide in recent years. The urban heat island (UHI) effect has exacerbated urban heat waves with serious consequences for urban energy and residents’ health. Therefore, a better understanding of the dynamics of the UHI effect and the influencing factors is needed in the context of carbon neutrality and global warming. This study used long-term observation and statistical data to investigate the urban heat island intensity (UHII) over the past 39 years (1981–2019) and to analyze the temporal changes of the UHI effect and the relationship between the UHI effect and indicators of rapid urbanization in Zhengzhou, China. The results showed that Zhengzhou is warming 2.2-times faster than the global land warming trend of about +0.9 °C from 1981 to 2019. There is a clear phase characteristic of the heat island effect in Zhengzhou, and it offers a rapid upward trend after 2000 and a positive correlation with the urbanization process; it was found that the social and economic conditions of urban expansion in Zhengzhou have a significant relationship with UHII. We also found that the denser the urban built-up area, the more obvious the heat island effect. Compared with other countries, the influence of national policies on urban development is an indirect factor influencing the change of UHI specifically for Chinese cities. This research could provide a reference for understanding the temporal dynamics of UHI in an expanding large city for sustainable urban planning and mitigating urban warming and environmental problems.

1. Introduction

In the current summer of 2022, extreme weather phenomena have occurred frequently around the world, with many cities in China experiencing urban heat waves (HW) and record high temperatures, and the European region experiencing the most severe drought weather in 500 years [1]. Climate change is seriously affecting world food security and human health. The frequency of extreme weather can be attributed to global warming caused by climate change and human activities.
Human activities induced by urbanization are an important factor affecting climate change. It is predicted that, by 2050, the proportion of the world’s urban population will exceed 66% [2]. Rapid urbanization has resulted in expanding impervious urban areas and replacing the original natural vegetation. In contrast, human and production activities have altered the material and energy balance near the urban surface, and many environmental problems have arisen in cities [3]. According to studies [4,5,6], the urban heat island effect exists in most cities worldwide, regardless of their latitude, size, topography, or climatic zone. European studies showed that heat waves and heat islands are related to geographic location, with cities at higher latitudes more susceptible to heat waves [7]. Phoenix experienced a 0.47 °C per decade minimum temperature rise from 1960 to 2000. In New York, the Central Park atmospheric UHI strength increased from 2.0 °C in 1900 to 2.5 °C by 2000 [8]. In Asia, a study of large cities based on surface temperatures showed a trend toward urban warming [9]. The average heat island intensity in Seoul, South Korea, increased by 1.3 °C from 1962 to 2017 [10]. In North China, due to urbanization, the surface temperature of large cities increased by an average of 0.16 °C per decade [11]. Nevertheless, studies also found that urban heat islands are related to demographic and climatic factors [12].
Luke Howard discovered urban heat island (UHI) in 1818, which refers to the phenomenon in which cities are warmer than rural areas [13]. Studies are usually divided into surface UHI (SUHI) and atmospheric UHI, both of which can be used to measure and define the intensity of the UHI [14]. The conventional method is based on the temperature readings of urban and rural fixed weather stations, and the calculation is based on air temperature [15]. The urban canopy layer (UCL) is the portion of the near-surface layer where urban residents live, extending from the ground to treetops and roofs [15,16,17]. The UCL thermal environment is highly heterogeneous and heavily influenced by human activities. Although the surface temperature is widely used to study urban heat island research, because there are many high-rise buildings in the city, the temperature reflected by remote sensing images in the building area is often the temperature on the roof of the building, and the temperature near the surface is not available. Therefore, this paper selected weather station data, and the temperature sensor was generally about 1.5 m away from the ground surface, which represents the temperature of the urban canopy layer.
Although the era of global warming has increased temperatures in both urban and rural areas [17], urbanization has contributed more to the rise in urban temperatures [18,19,20]. China has a rapid urbanization growth [21,22] that is even denser than other western nations (US and EU). In light of this, we examined the dynamic changes in urban and rural temperatures in Zhengzhou over the past 39 years (1981–2019). Previous papers on Zhengzhou studies on heat islands were generally based on surface temperature data from remote sensing images, which do not reflect temperature trends over time [23,24,25,26,27,28]. More importantly, the variation of nighttime temperatures in urban and rural areas is unavailable through conventional remote sensing methods. This article examined two main sections: (a) utilizing long-term observation data to analyze and characterize the temporal characteristics of UHIs; (b) using statistical socio-economic development indicators to assist the investigation and interpret UHI features. We intended to answer the following research questions:
(1)
What kind of changes in urban local climate change and UHI are observed with rapid urbanization in Zhengzhou city?
(2)
What are the differences between daytime UHI and nighttime UHI?
(3)
What are the most important urban development indicators (GDP, population density, and urbanization rate) associated with the urban heat island in Zhengzhou?
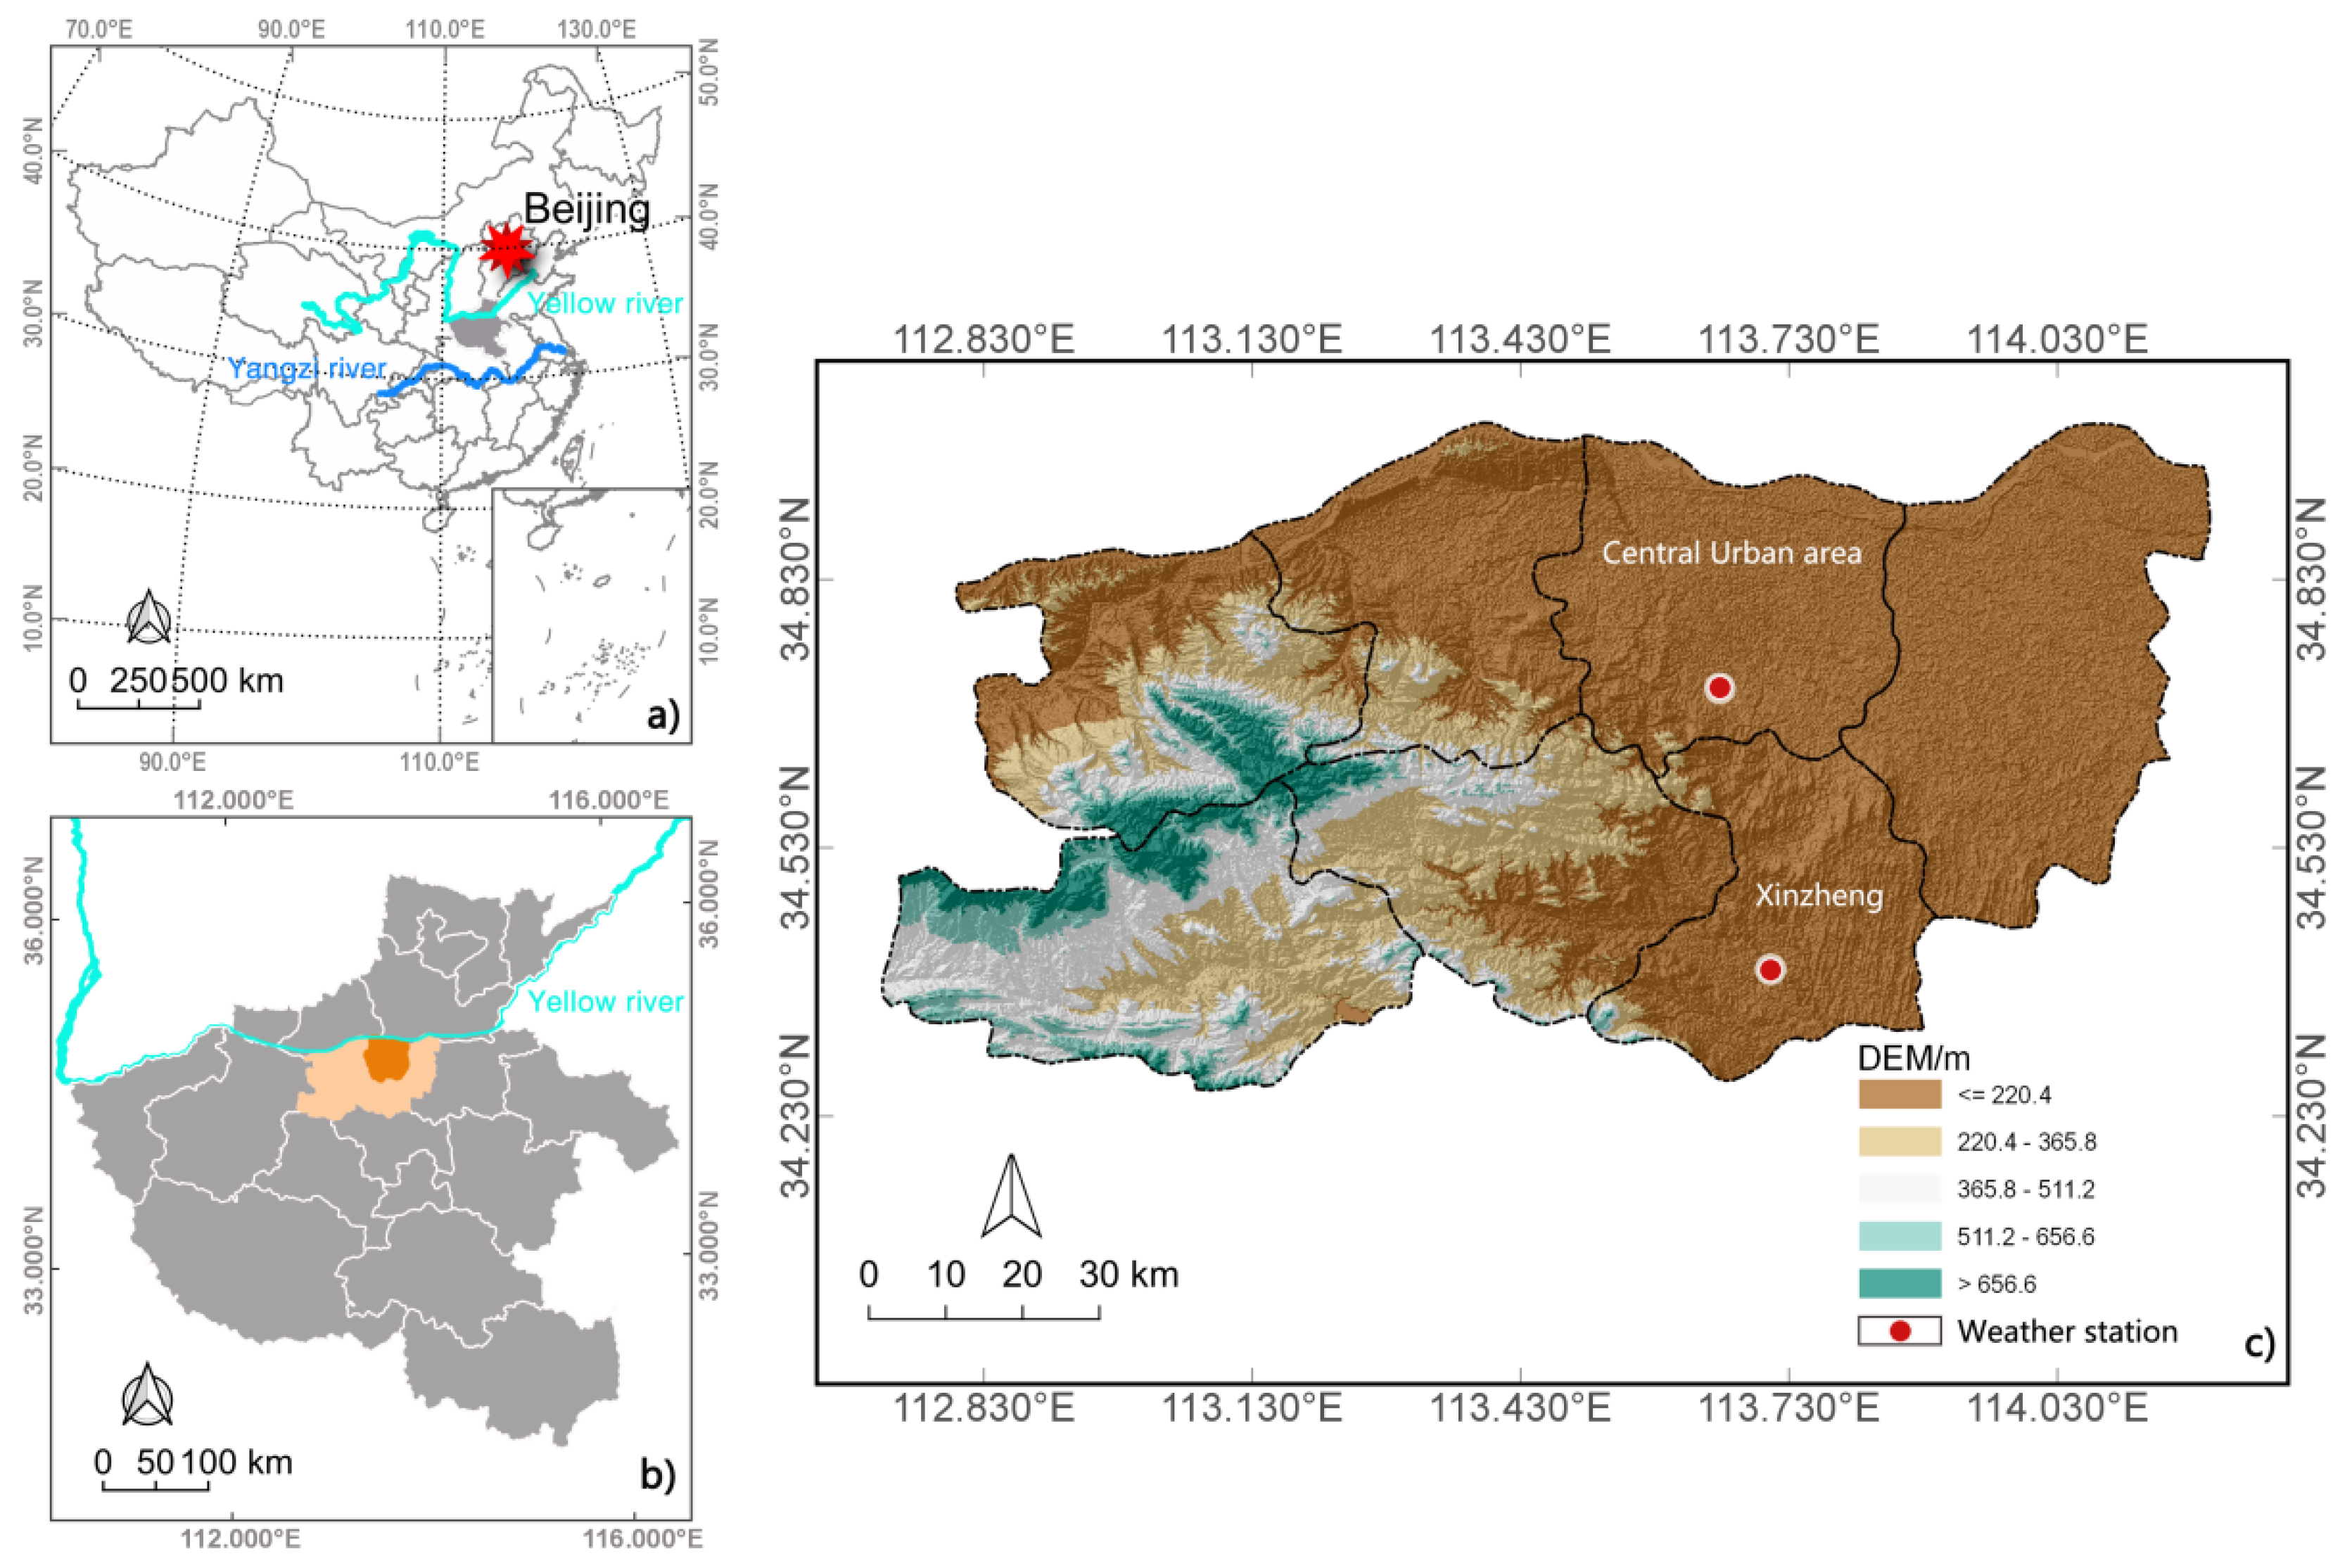
2. Study Area

Zhengzhou (34°16′–34°58′ N, 112°42ʹ–114°14′ E) is the provincial capital of central China’s Henan Province. It is situated south of the Yellow River and in the North China Plain (Figure 1). It is among China’s largest transportation hubs. According to the 2021 census (http://tjj.zhengzhou.gov.cn/, accessed on 6 June 2022), the city’s total area is 7446.2 km2, and its population is approximately 12,742,000. Zhengzhou’s central city has the second highest population density among Chinese cities. Zhengzhou is located in the northern warm temperate zone and has a warm climate; it has four distinct seasons: a dry spring (March–May) and a hot and rainy summer (June–September). The GDP in 2021 was USD 0.18 trillion.
As one of the 13 emerging megacities in China in the July 2012 Economist Intelligence Unit report, Zhengzhou has seen rapid urbanization over the past few decades. The population of Zhengzhou increased from 4.2 million in 1978 to 12.742 million in 2021. With six districts, five county-level cities, and one county within the administrative division of Zhengzhou, it is estimated that the population of Zhengzhou’s central city is 1.5-times larger than the combined population of the six surrounding cities and counties. In recent years, it has been influenced by policies. For example, the Zhengzhou metropolitan area is the core area of the Central Plains Economic Zone. In addition, the national central government officially named it the eighth national central city in 2017. This national-level policy provides a wealth of opportunities for the development of Zhengzhou. The central city is developing rapidly, but the surrounding countryside lags and is dominated by agriculture. The urban-rural dual structure is extremely unbalanced, and the central city shows a high degree of agglomeration.

3. Data Sets and Method

3.1. Air Temperature Data

To examine the long-term urban heat island (UHI) and urban local climate change, this study analyzed the temporal trends of the air temperature-based UHI using observations from fixed meteorological stations at the Henan Provincial Climate Center and Zhengzhou Meteorological Bureau. In the region of Zhengzhou, two stations (with an elevation difference of around 6.2 m) have maintained meteorological data records for almost 40 years. The urban station is located in the southern portion of the core region of Zhengzhou (34.72 N, 113.65 E; 110.4 m above sea level) and can represent the urban temperature. The other station is situated in a rural location and measures temperatures in rural areas. Approximately 35 km separates the urban station from the Xinzheng station (34.38 N, 113.72 E; 116.6 m height). Rapid urbanization has resulted in environmental changes surrounding the urban weather station. According to the classification of local climate zones (LCZs) [29,30,31], the urban station changed from LCZ D (low plants, prior to 2000) to LCZ 6 (open low-rise), LCZ 4 (open high-rise), and LCZ 1 (compact high-rise, Table A1). Xinzheng station’s LCZ classification changed from LCZ D (before 2009) to LCZ 6 and LCZ 4 (Table A2). These two stations are national meteorological stations (Figure 1), and the meteorological data are standardized for correction and processing. The statistics on temperatures range from 1981 to 2019.

3.2. Additional Data

This study gathered official secondary data, such as urbanization index: urban population, urbanization rate, etc., from the Urban Statistics Bureau (Zhengzhou Bureau of Statistics http://tjj.zhengzhou.gov.cn/, accessed on 6 June 2022) and applied these socioeconomic data to assess the correlation with UHI. The data range from 1981 to 2019 and consist of socioeconomic census statistics for each year in the research area, including urbanization rate, urban population, population density, GDP, and built-up area (Table A3).

3.3. Method

3.3.1. Urban Heat Island Intensity

The formula for calculating UHI intensity (UHII) is as follows [32]:
U H I I   = T u T r
where (a) Tu is the air temperature at the city station, and (b) Tr is the air temperature at the Xinzheng station (b). When UHII > 0, it means that the temperature of the urban area is higher than that of the rural area, and the heat island phenomenon occurs in this area. When UHII ≤ 0, the region has no urban heat island phenomenon.
The annual and seasonal variations in UHI intensity were assessed using the yearly average temperature and seasonal average temperature. The four seasons were divided into spring (March to May), summer (June to August), autumn (October to November), and winter (December to February) based on the climatic zone of the study area (December to February). Additionally, the yearly average hourly temperature was used to investigate the hourly UHI intensity at various times of the day. In terms of understanding the diurnal UHI intensity and evaluating the diurnal change of UHII in various seasonal settings, four distinct hourly data sets (2 am, 8 am, 2 pm, and 8 pm) were selected.

3.3.2. Index of Urban Growth

The urban compactness ratio (UCR) is a significant metric representing urban morphology [19,33,34] and is a significant indication of the density of built-up regions, which is calculated by Equation (2):
U C R = 2 π A P
where A is the area of urban build-up land, and P is the perimeter of the urban boundary contour. UCR ranges from 0 to 1; a higher value indicates a more compacted shape, and a value closer to 1 indicates that the urban built-up land has a higher occupation and vice versa. In general, if urban land expansion changes in an infilling way, the concavity of urban edges will decrease because the urban internal gaps are gradually filled up, and, as a result, the urban form tends to be more compact.

3.4. Analysis Methods and Tools

This study was based on long-term meteorological data and urban statistics, mainly using statistical analysis software to graph and illustrate the urban temperature change, UHII trends, and characteristics. The main methods were correlation analysis and linear regression analysis. In this way, the interactions of the relevant factors were investigated.

4. Results

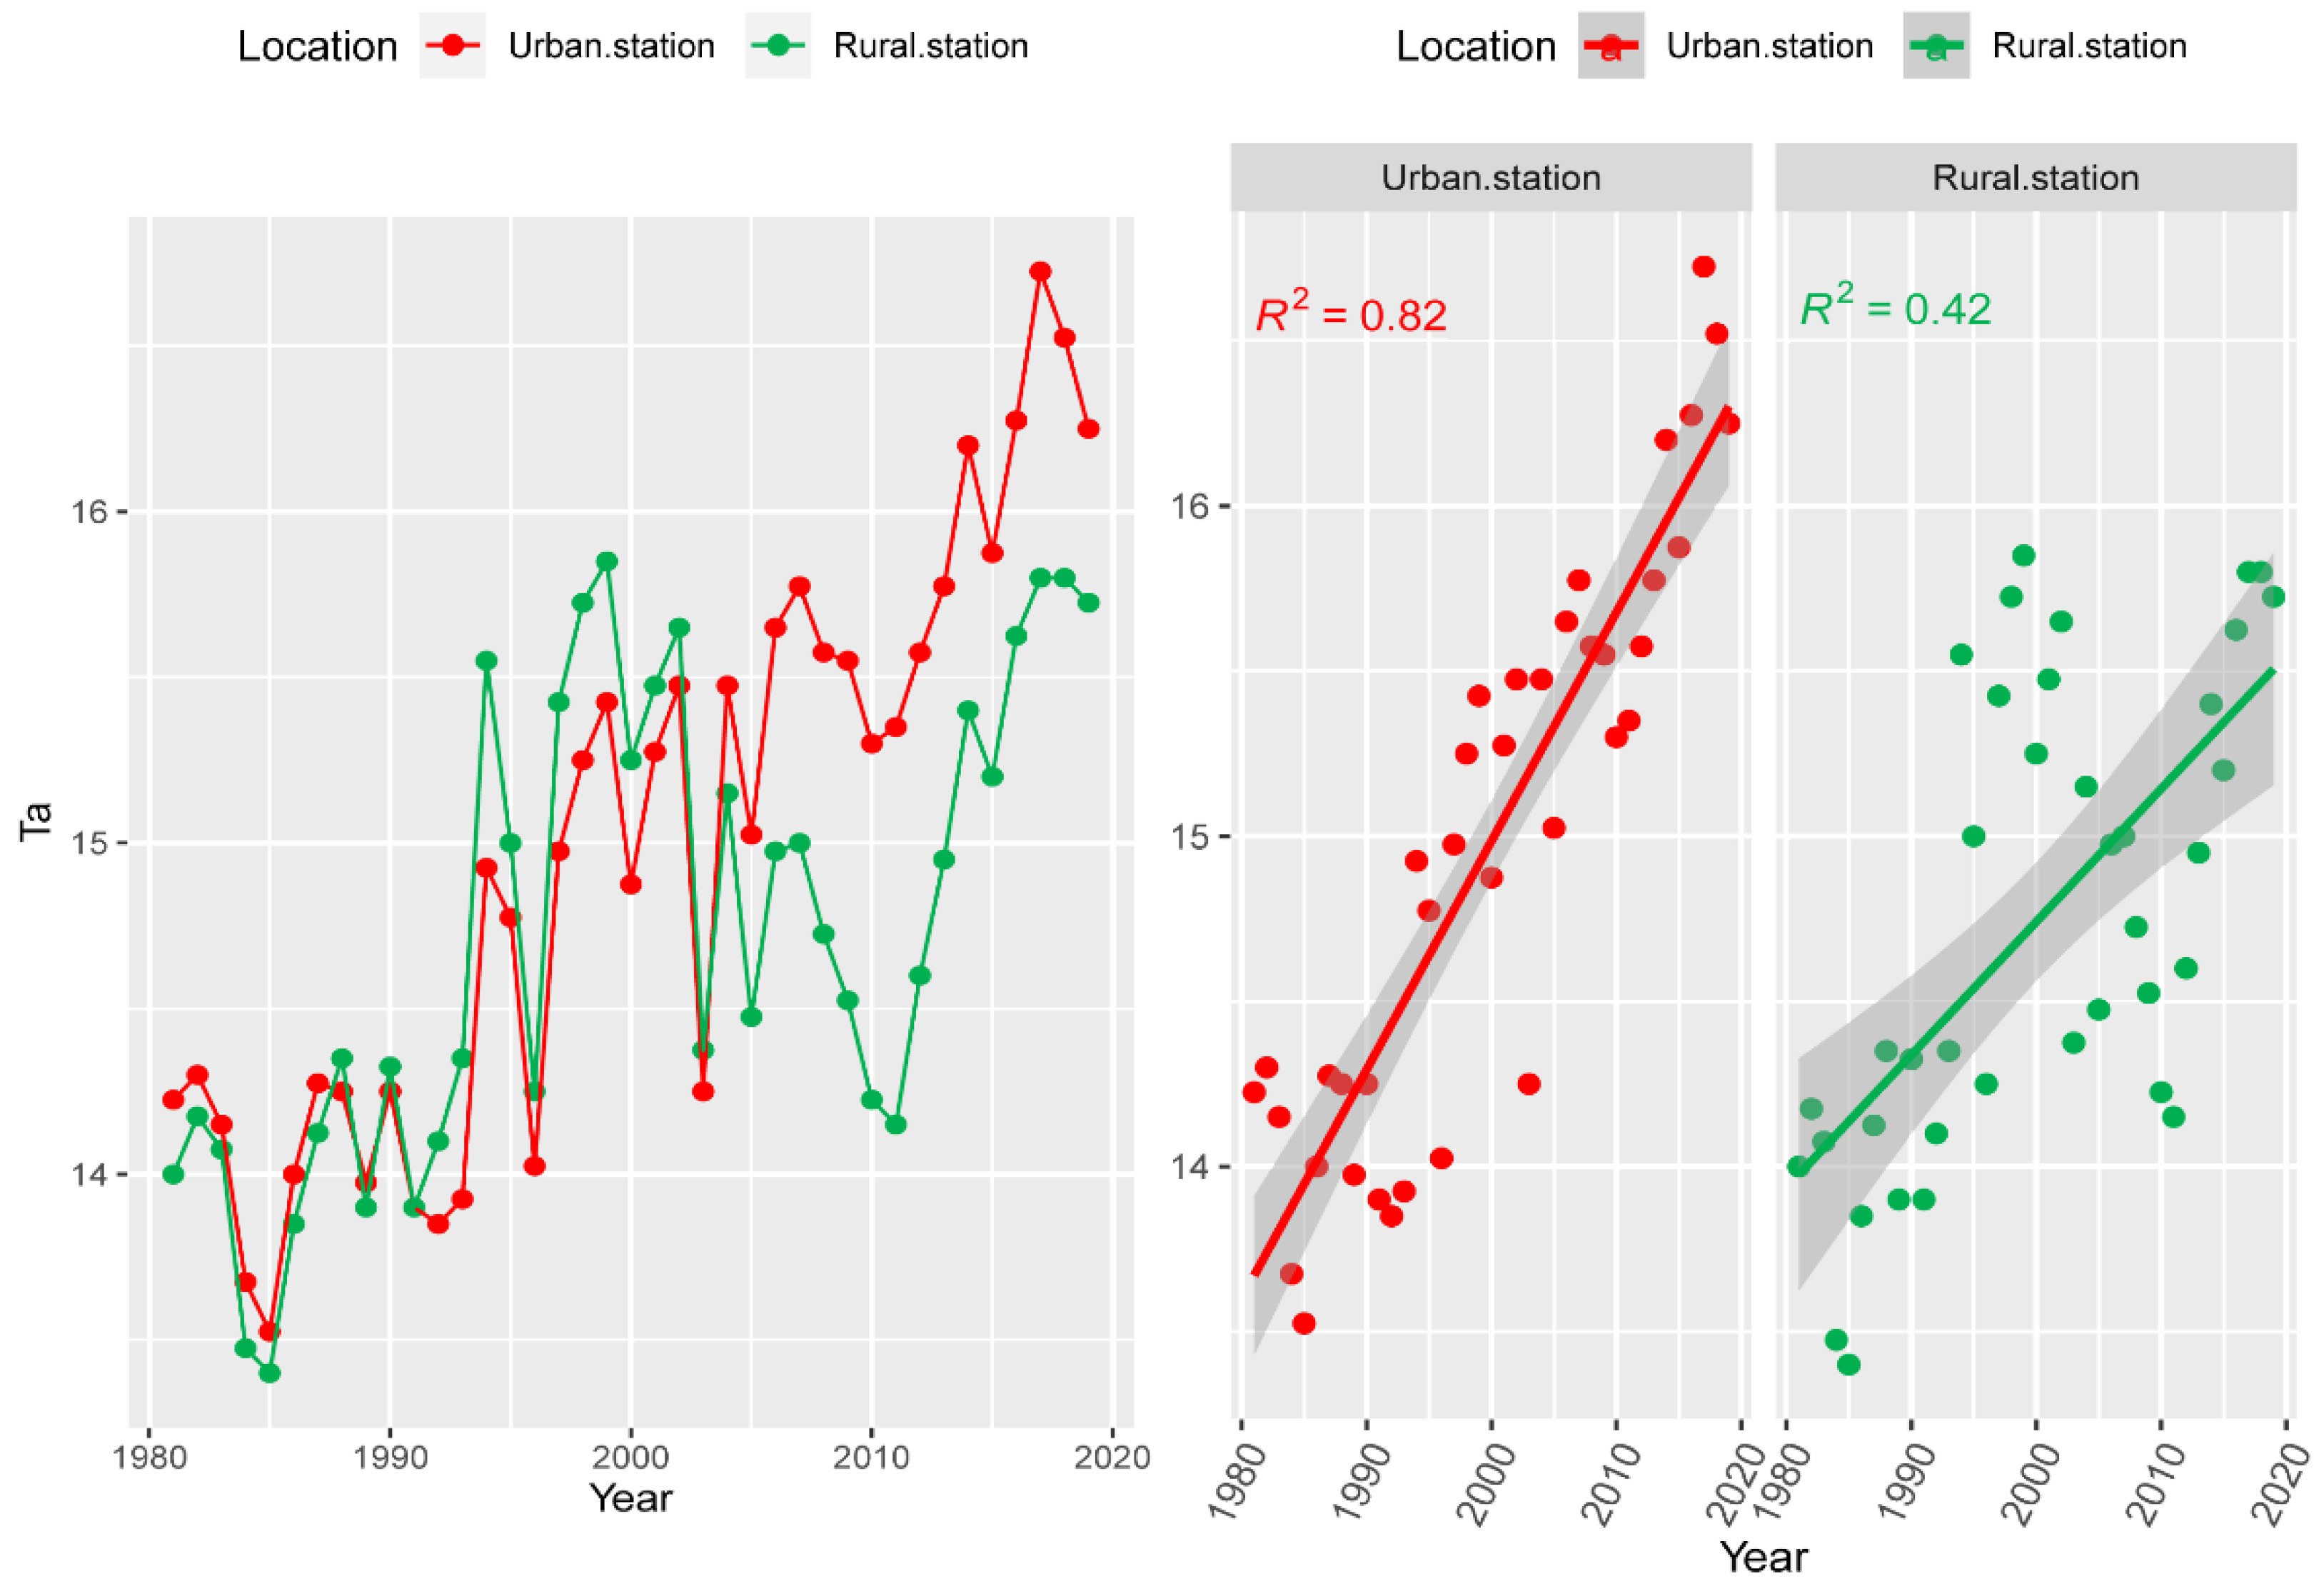
4.1. Urban Climate Change

Two weather stations’ temperature data indicated that the city is warming up quickly. Figure 2 shows that, over the past 39 years, temperatures in both urban and rural areas have increased, but the increase in urban temperatures (R2 = 0.82) has been more pronounced. The average urban temperature (Zhengzhou station) rose 0.67 °C per decade from 1981 to 2019, while the average rural temperature (Xinzheng station) rose 0.43 °C per decade. This result is consistent with a prior investigation [11]. Over forty years, the temperature raised by about 1.96 °C. In comparison to the global land warming trend of +0.9 °C [35], Zhengzhou has warmed up 2.2-times quicker between 1981 and 2019.
The vertical shift of the two lines in the left panel of Figure 2 shows that the temperature difference between urban and rural sites was insignificant until 2000. However, there is a noticeable increase in the upper curve after 2000, particularly after 2005, compared to the other lower curve, indicating that the temperature difference between urban and rural areas is growing and the intensity of the heat island is increasing. This is because, prior to 2000, both urban and rural stations had the same LCZ 4. Due to the rapid urbanization that occurred after 2000, the environment at urban stations changed (Table A1 and Table A2), and the increase in urban temperatures was greater than that in rural areas (Figure 2). Additionally, earlier research [36] demonstrated that urbanization is one of Zhengzhou’s main causes of urban warming.

4.2. Temperature-Based Temporal Dynamics of UHI Intensity

The annual mean temperatures in urban and rural areas are a direct foundation for defining Zhengzhou’s atmospheric UHI. Figure 3 depicts the air temperature-based seasonal atmospheric UHII. With the highest UHII reaching 1.2 °C (2017) and the second highest reaching 1.15 °C, it is noticeable that the urban heat island effect has significant variability, demonstrating a significant atmospheric UHI phenomenon after the turn of the century (2000). It is worth pointing out that, prior to 2000, the atmospheric UHII values were primarily negative, indicating that the annual average temperature in urban areas was lower than in rural areas and that, consequently, the absence of heat islands during this time (1981–1999) should not have had a significant impact on local climate change.
In general, the summer (mean atmospheric UHII of 0.64 °C) and spring (mean atmospheric UHII of 0.51 °C) were the strongest atmospheric UHIs of the year in Zhengzhou, with clear seasonality. Winter had the lowest UHII (mean atmospheric, at −0.11 °C). Additionally, autumn exhibited a slight heat island effect (mean atmospheric UHII of 0.1 °C). The annual average UHI mentioned earlier was consistent with the highest atmospheric UHII for the summer heat island, which was 1.7 °C (occurring in 2010 and 2011, respectively). The seasonal atmospheric UHII is now almost always above zero, even in the winter, which is significant to note. From the results, the UHI was negative in winter and autumn and positive in spring and summer, considering the effect of tree defoliation on temperature. Trees tend to cool down during the day [37,38] but keep the object warm at night due to thermal radiation. To explain this trend, further information on the change in vegetation types around urban areas is required. It can also be seen from the figure that the UHI of Zhengzhou showed a decreasing trend from 1981 to 2000, and some investigation of historical meteorological data and a comparative analysis of land cover changes are warranted in the next stage of the study.

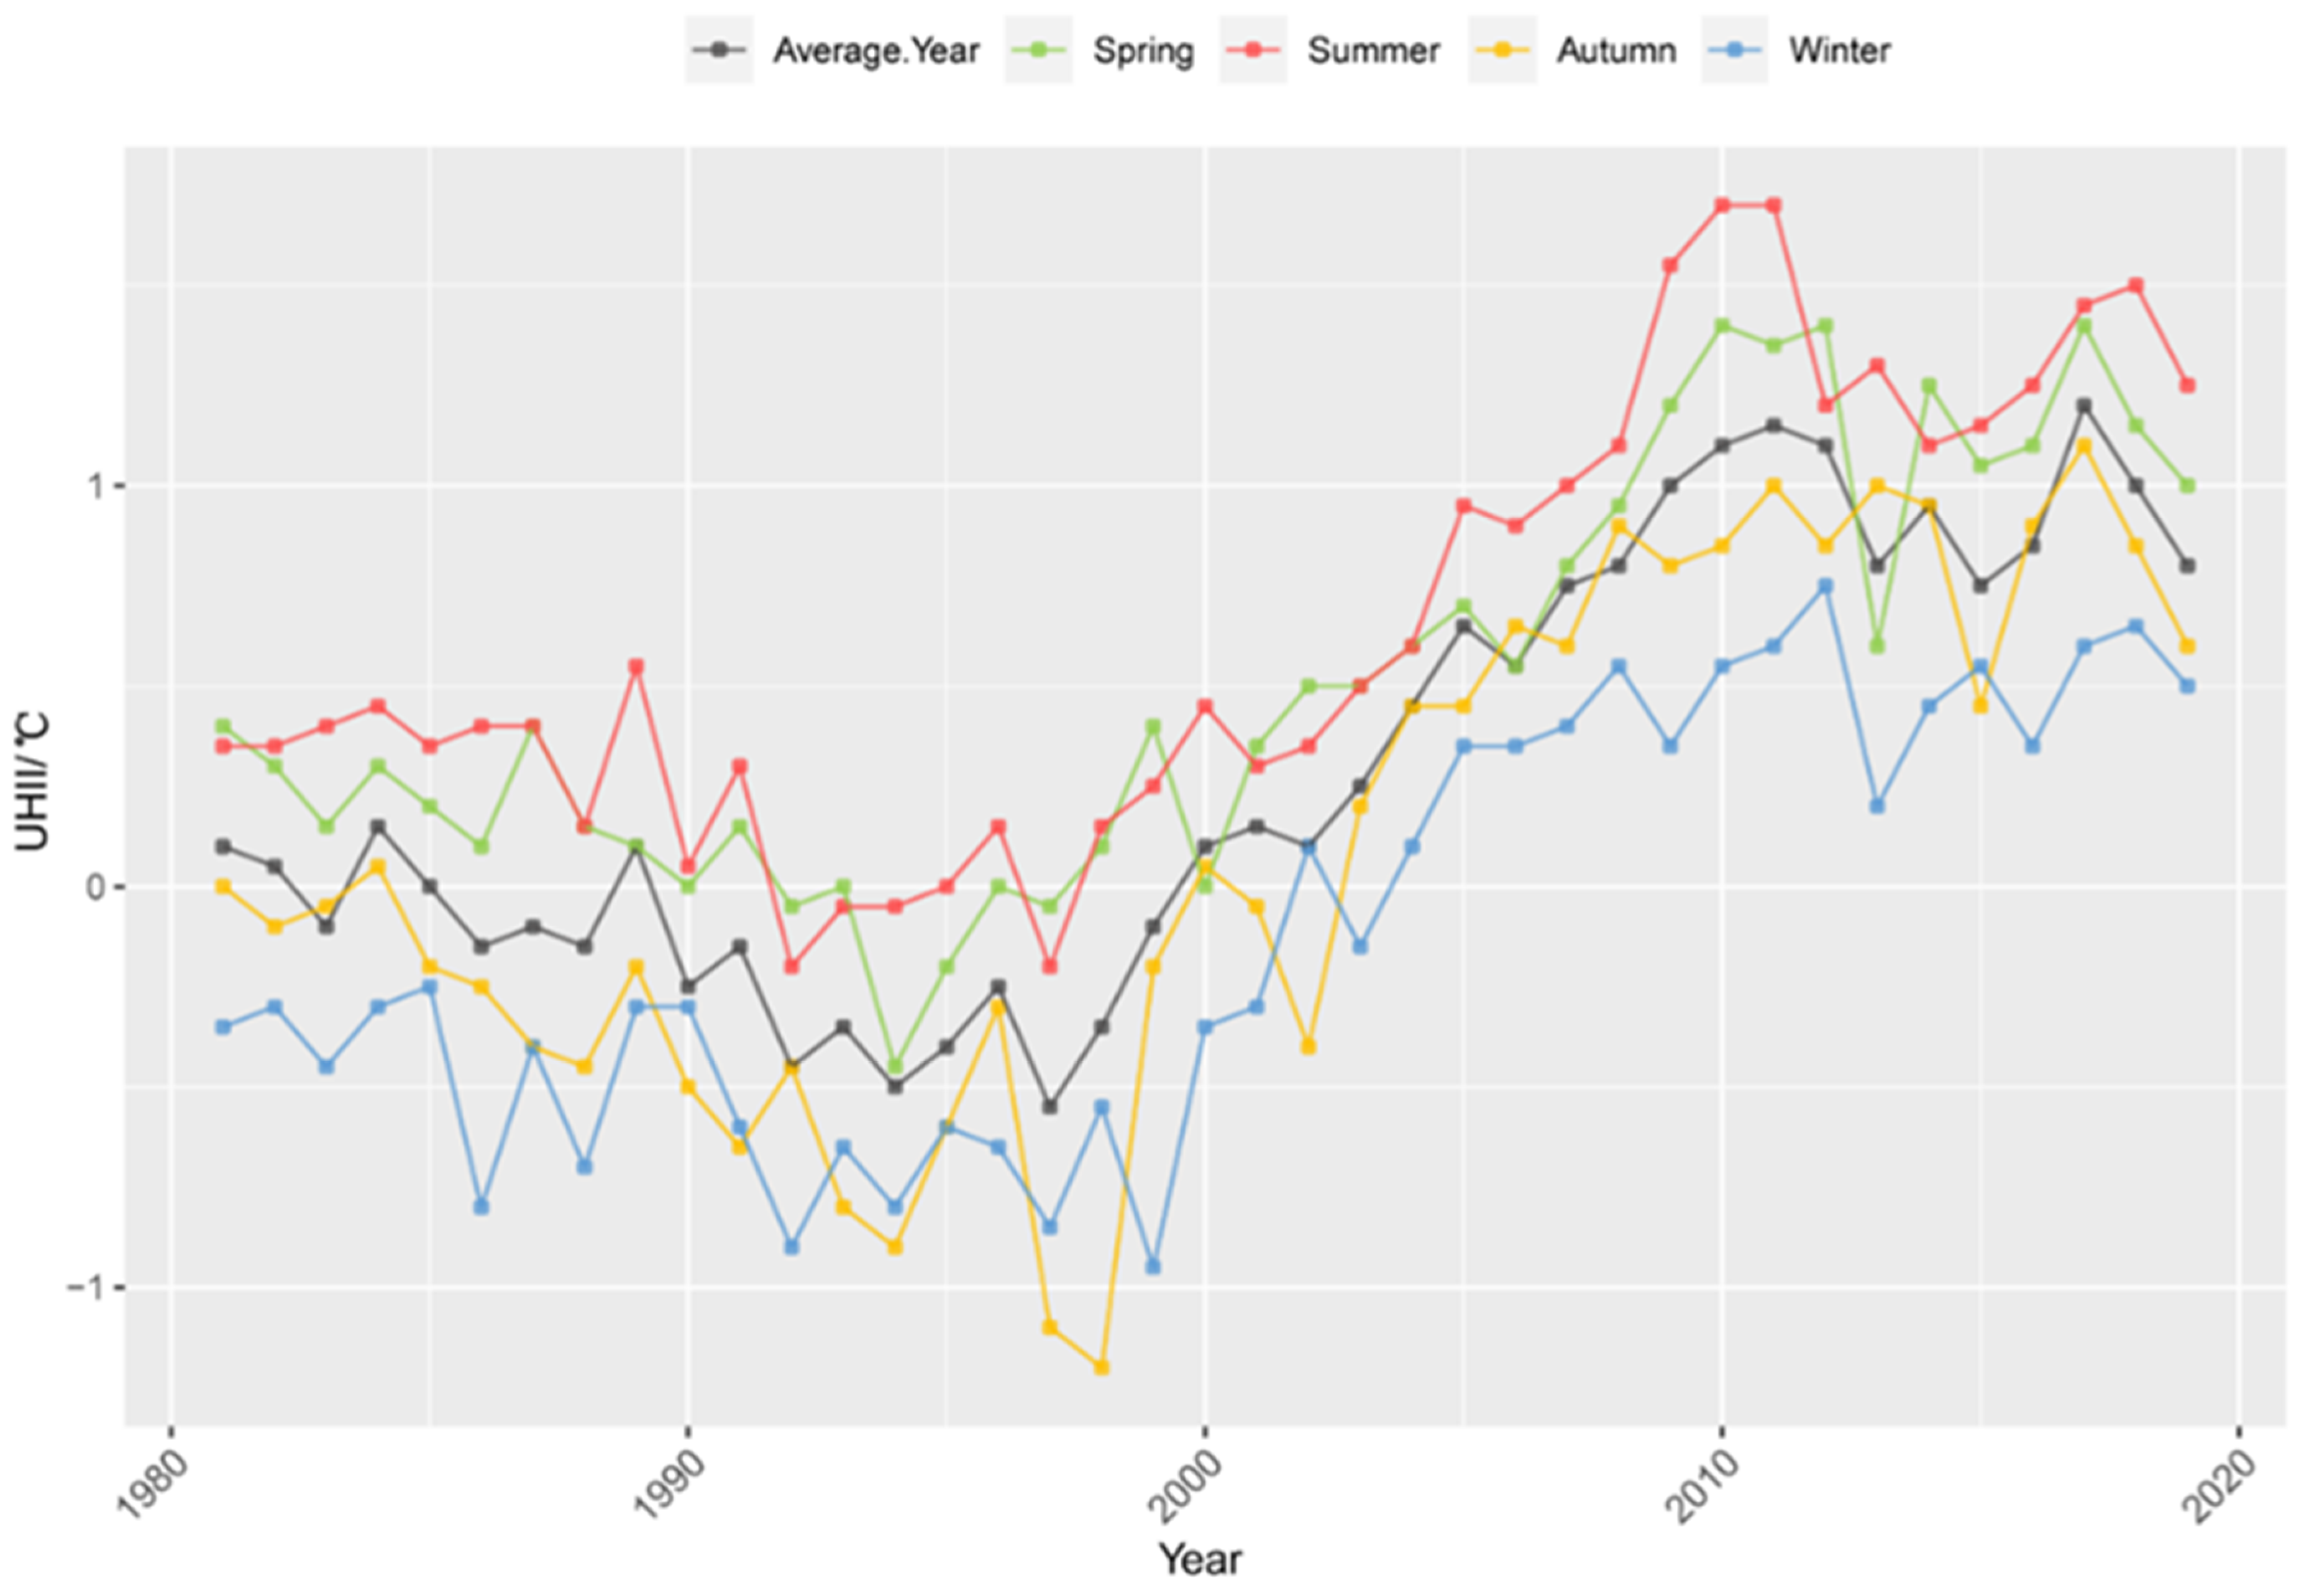
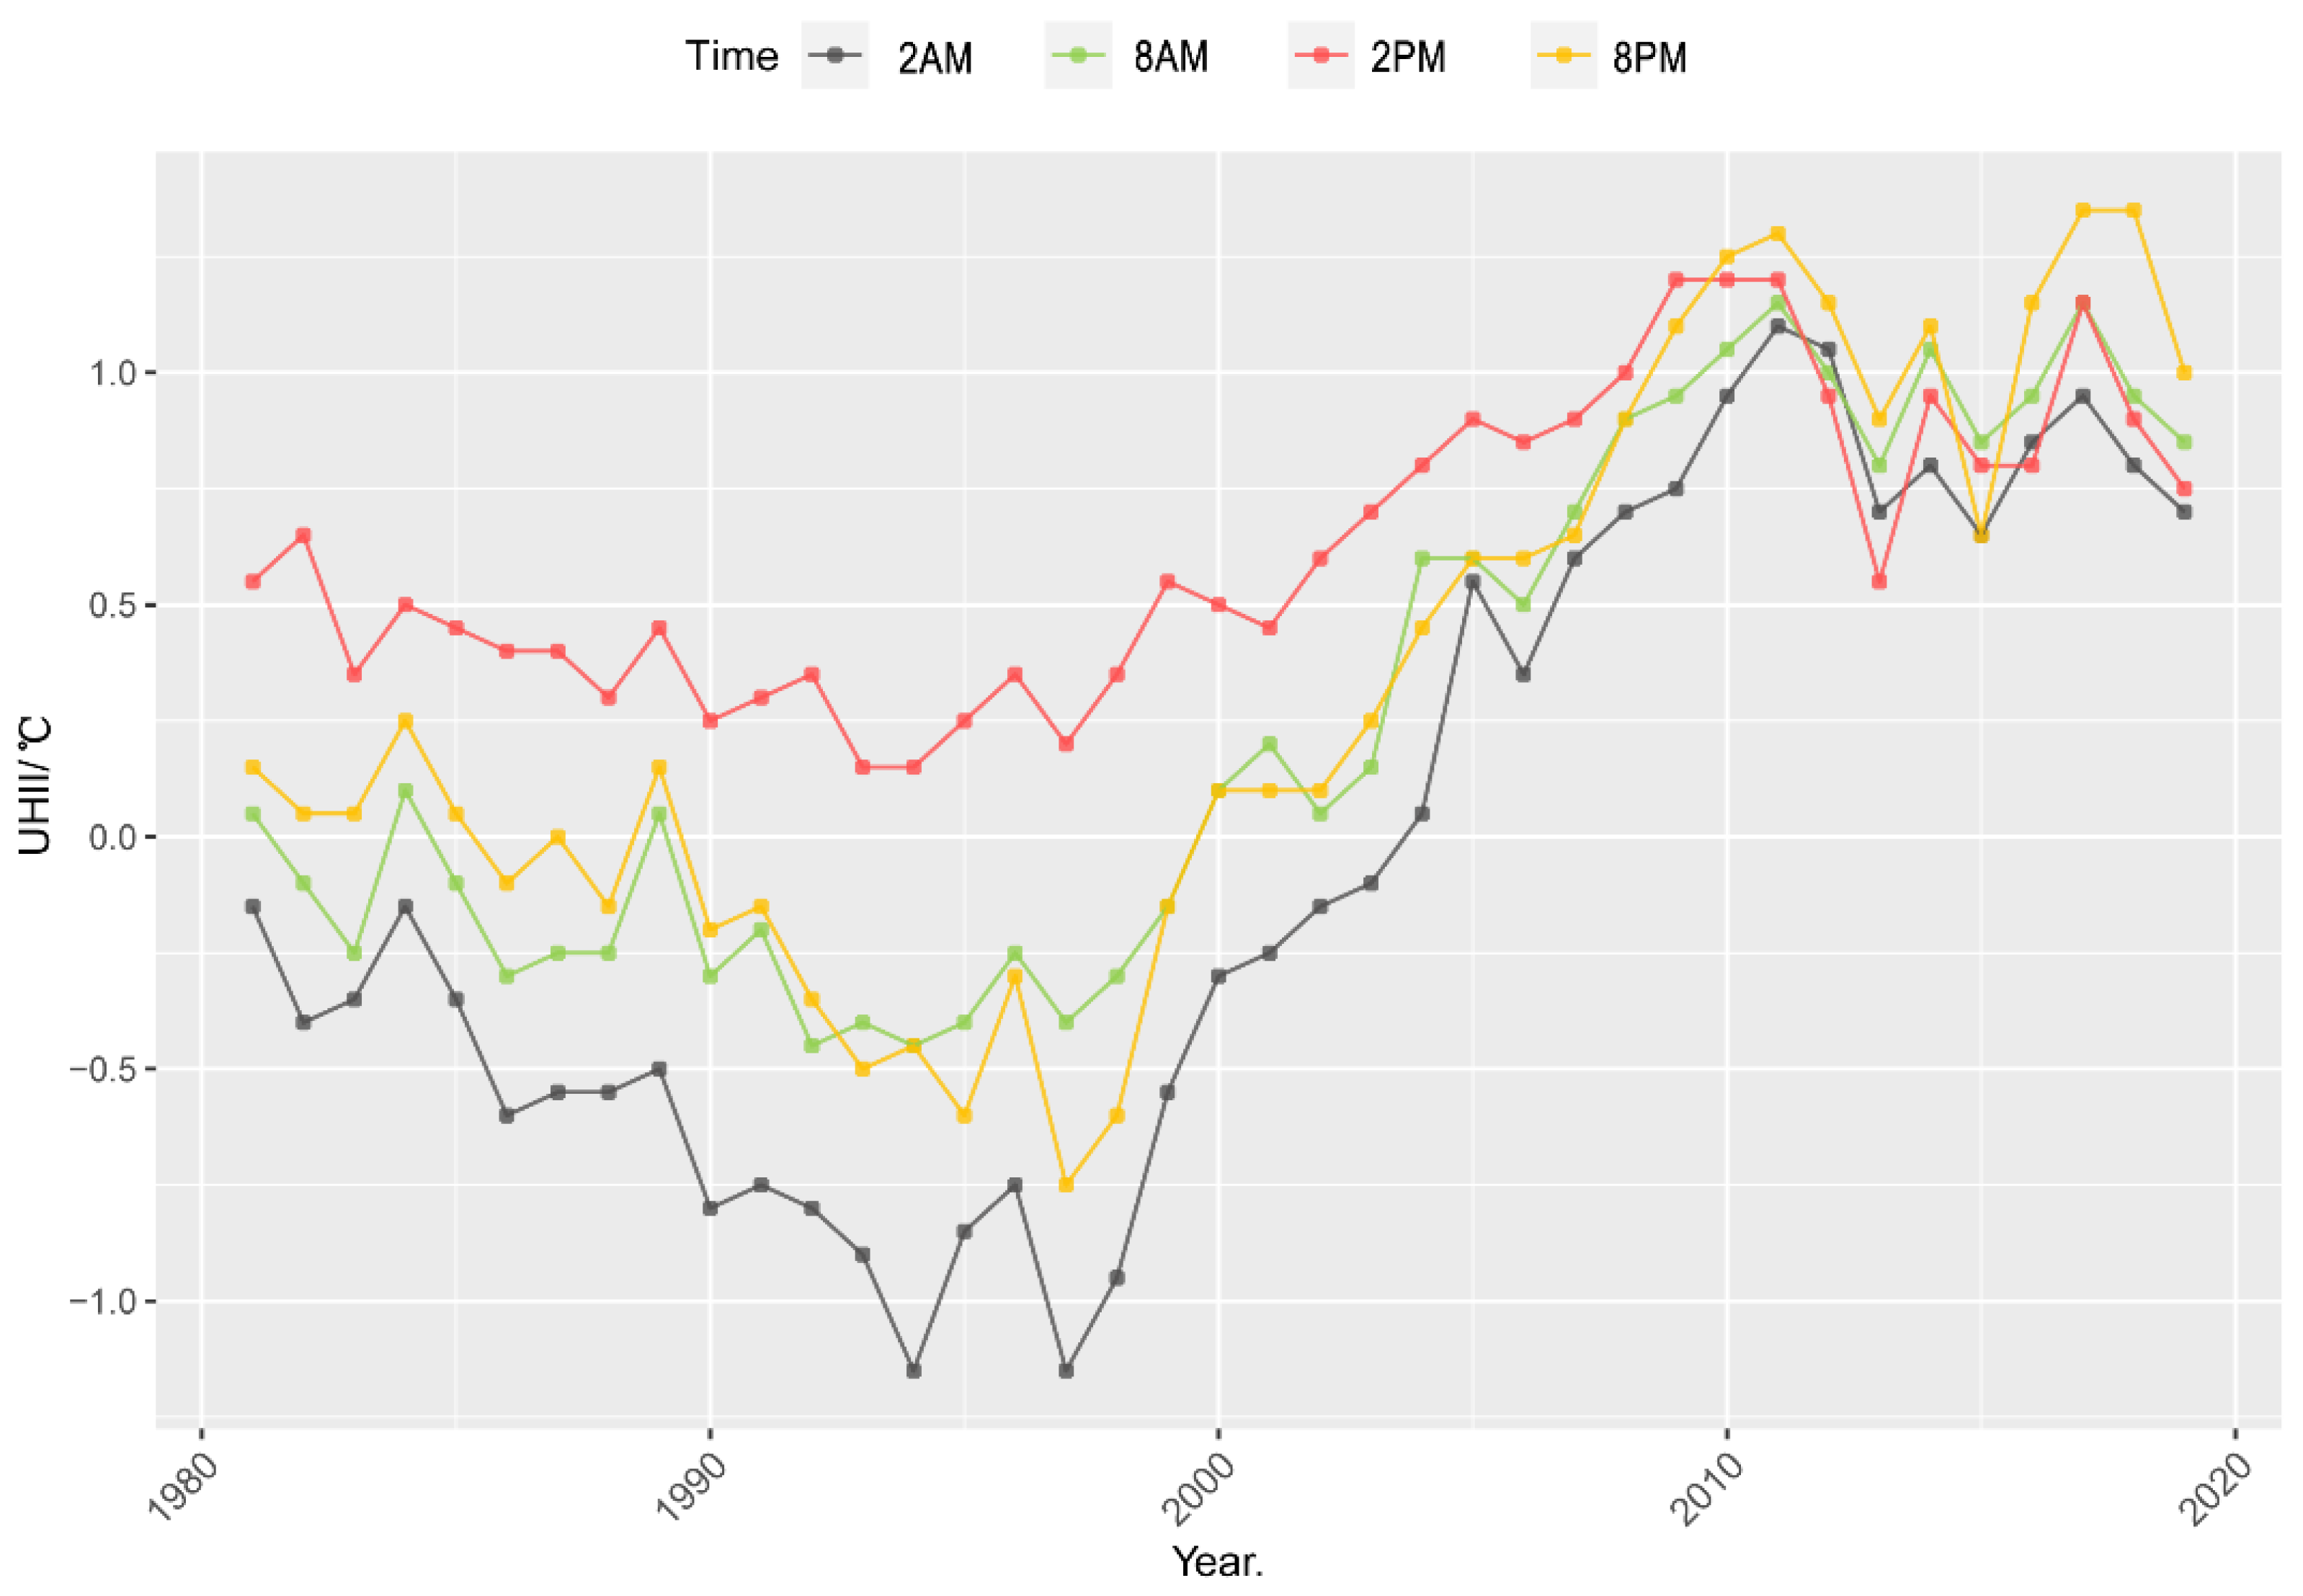
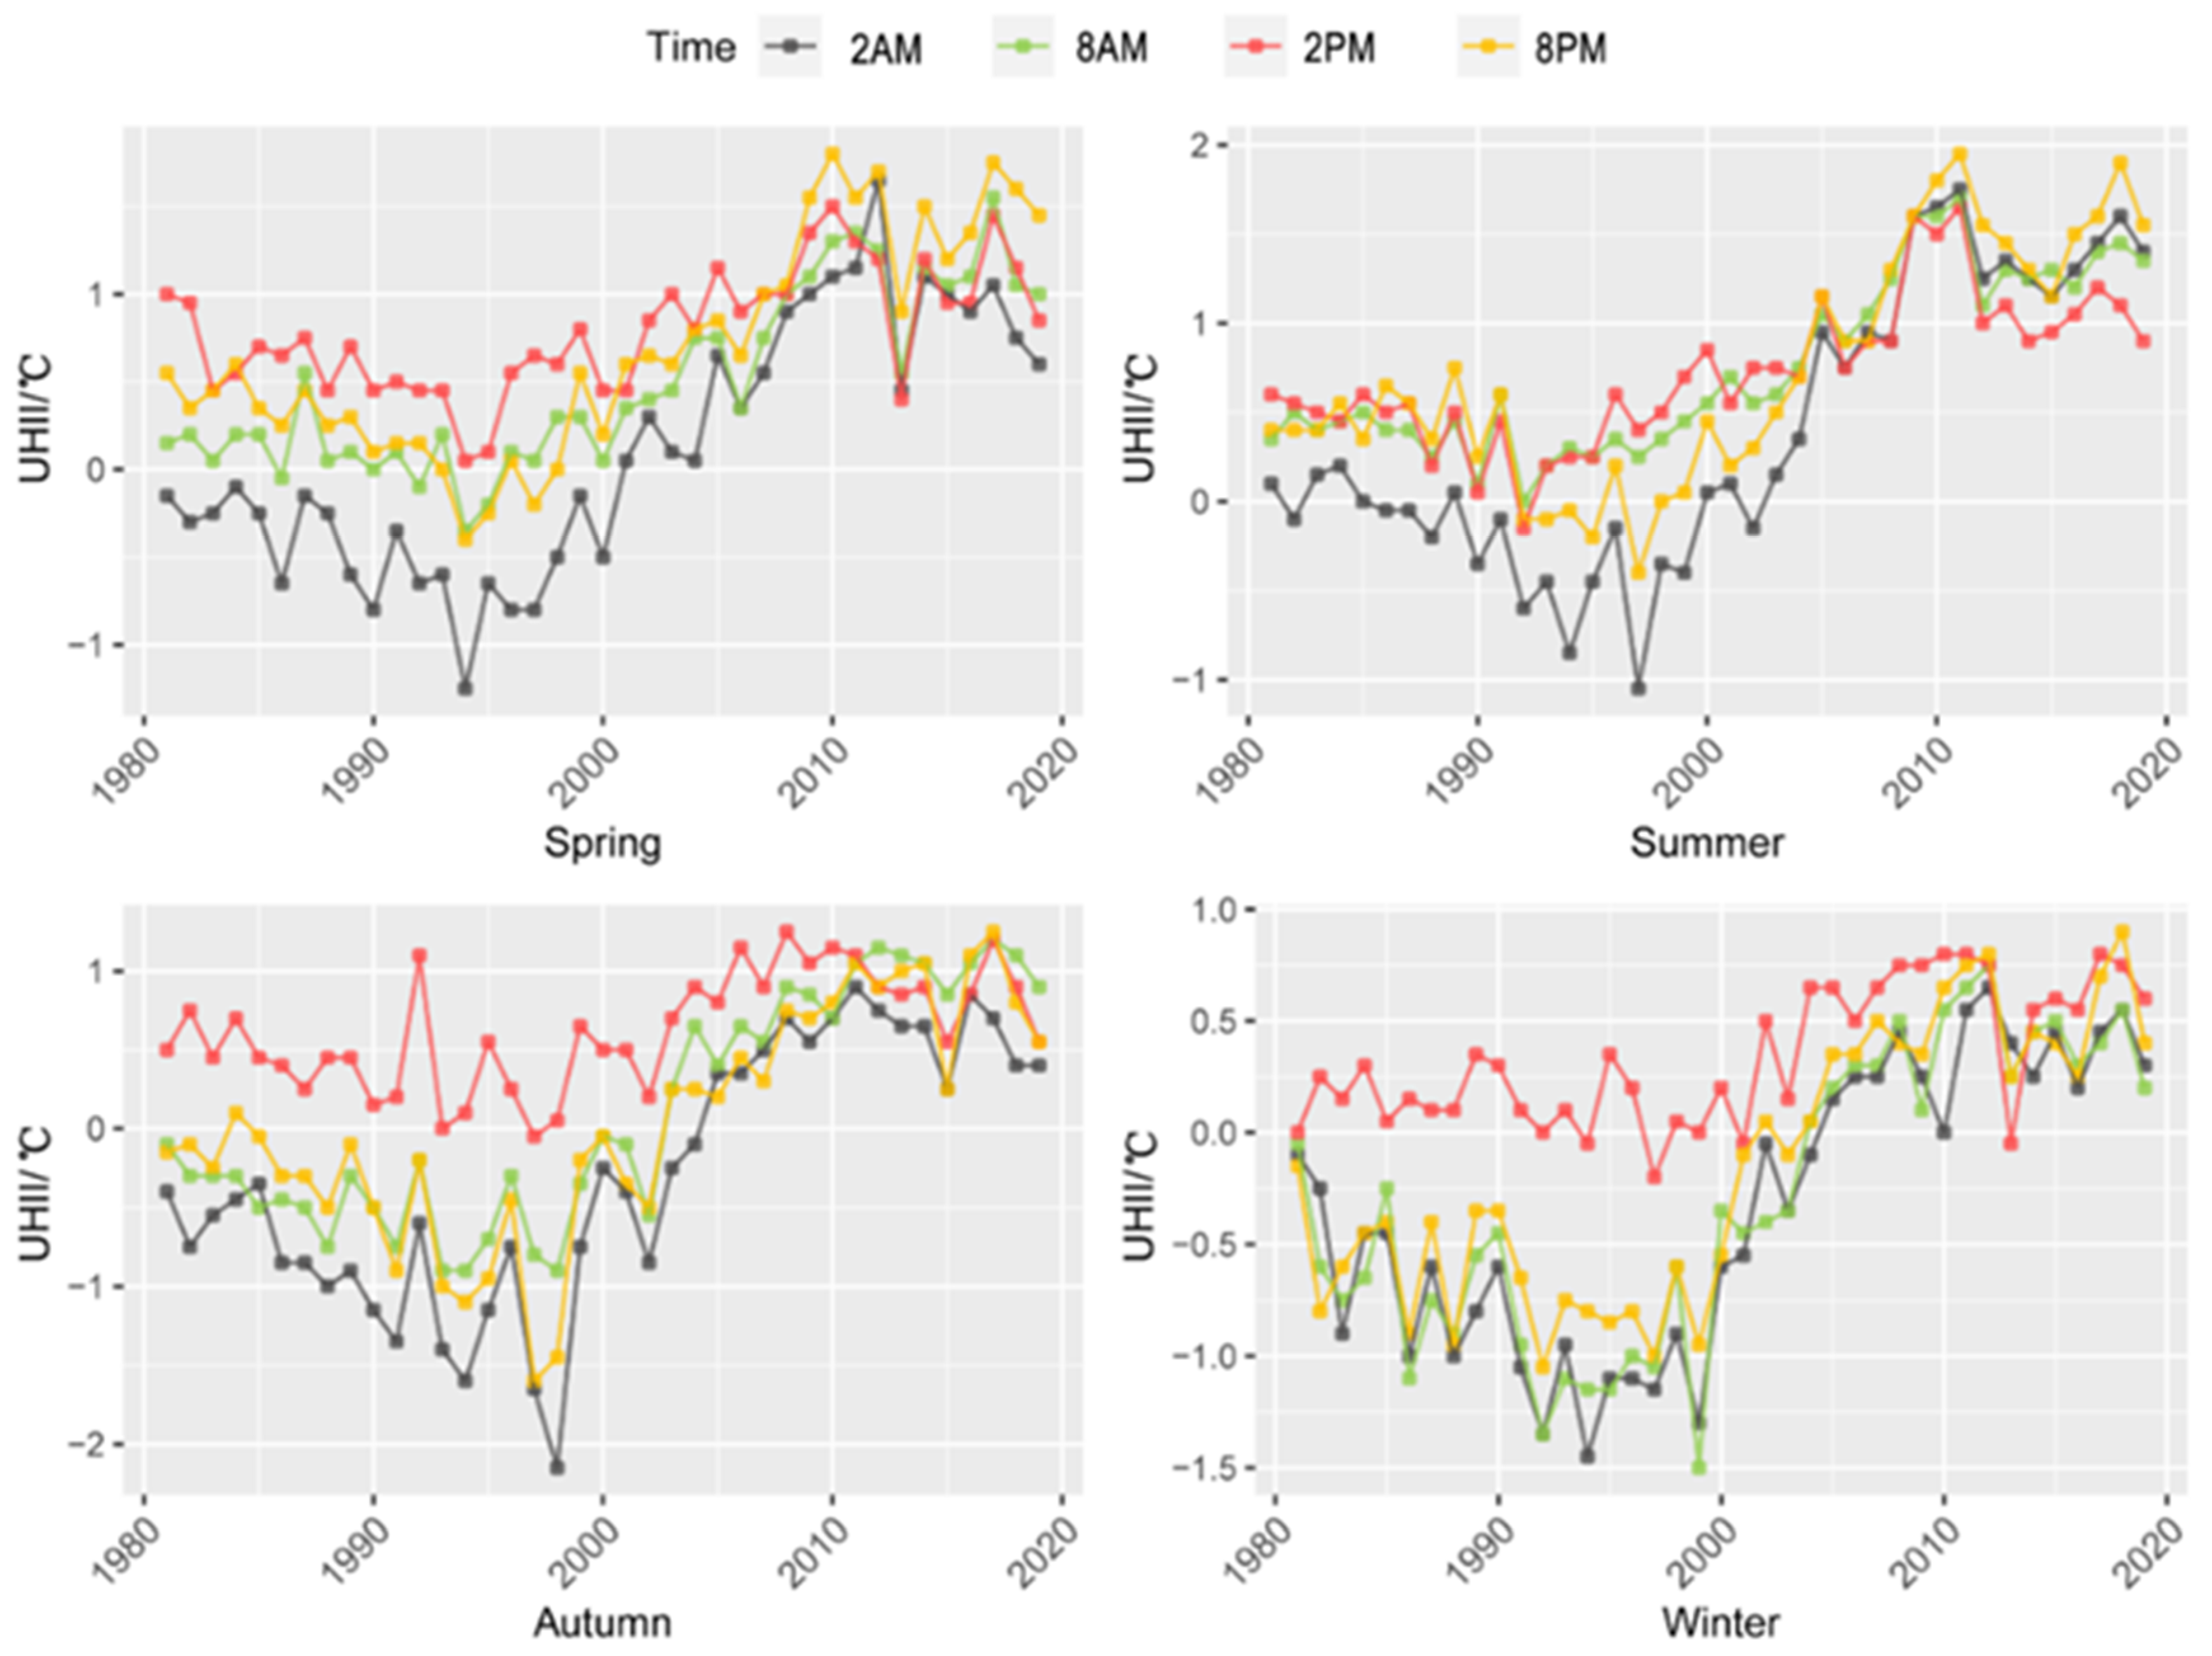
4.3. Diurnal Variations in Atmospheric UHI Intensity across the Four Seasons

The Zhengzhou atmospheric UHIs exhibited a distinct temporal characteristic. The annual average results in Figure 4 demonstrated that the atmospheric UHII exhibits temporal variations during the day and at night. Prior to 2000, however, only the atmospheric UHI during the day was positive, while the nighttime was negative. Additionally, the atmospheric UHII during the day and night exhibited a sharp increase after 2000. The strongest atmospheric UHII in 2010 occurred at 8:00 pm.
In terms of the seasonal dimension (Figure 5), over the past 39 years, the heat island effect has been present both during the day and at night in all four seasons. The heat island intensity was highest during the daytime hours of 2 pm (mean 0.616 °C) and 8 pm (mean 0.318 °C) and lowest during the early hours of 2 am (mean −0.036 °C) of the four time periods chosen for this study.
The diurnal heat island effect was also prominent in all seasons, and, in the summer and spring, the heat island intensity was greater, indicating a lower heat island effect during the day than at night. Autumn and winter experienced the opposite, but with a diminished heat island intensity. Summer is the season in which the heat island effect was most pronounced. Since the heat island effect was present in all three periods except for early morning (2 am), the average value of the four time periods during the summer was 0.65 °C, and the maximum atmospheric UHII was 1.95 °C (2011). The UHII at 2 pm was the most significant. In general, the diurnal heat island of the atmospheric UHII exhibited an upward trend over time, with urban temperatures consistently exceeding rural temperatures after the year 2000. Spring had the most pronounced diurnal heat island effect among the four seasons. The maximum UHII in the atmosphere during the spring season in 2010 was 1.8 °C, which is slightly lower than the summer season maximum. The average values for the four autumn and winter periods were 0.11 °C and −0.1 °C, respectively.

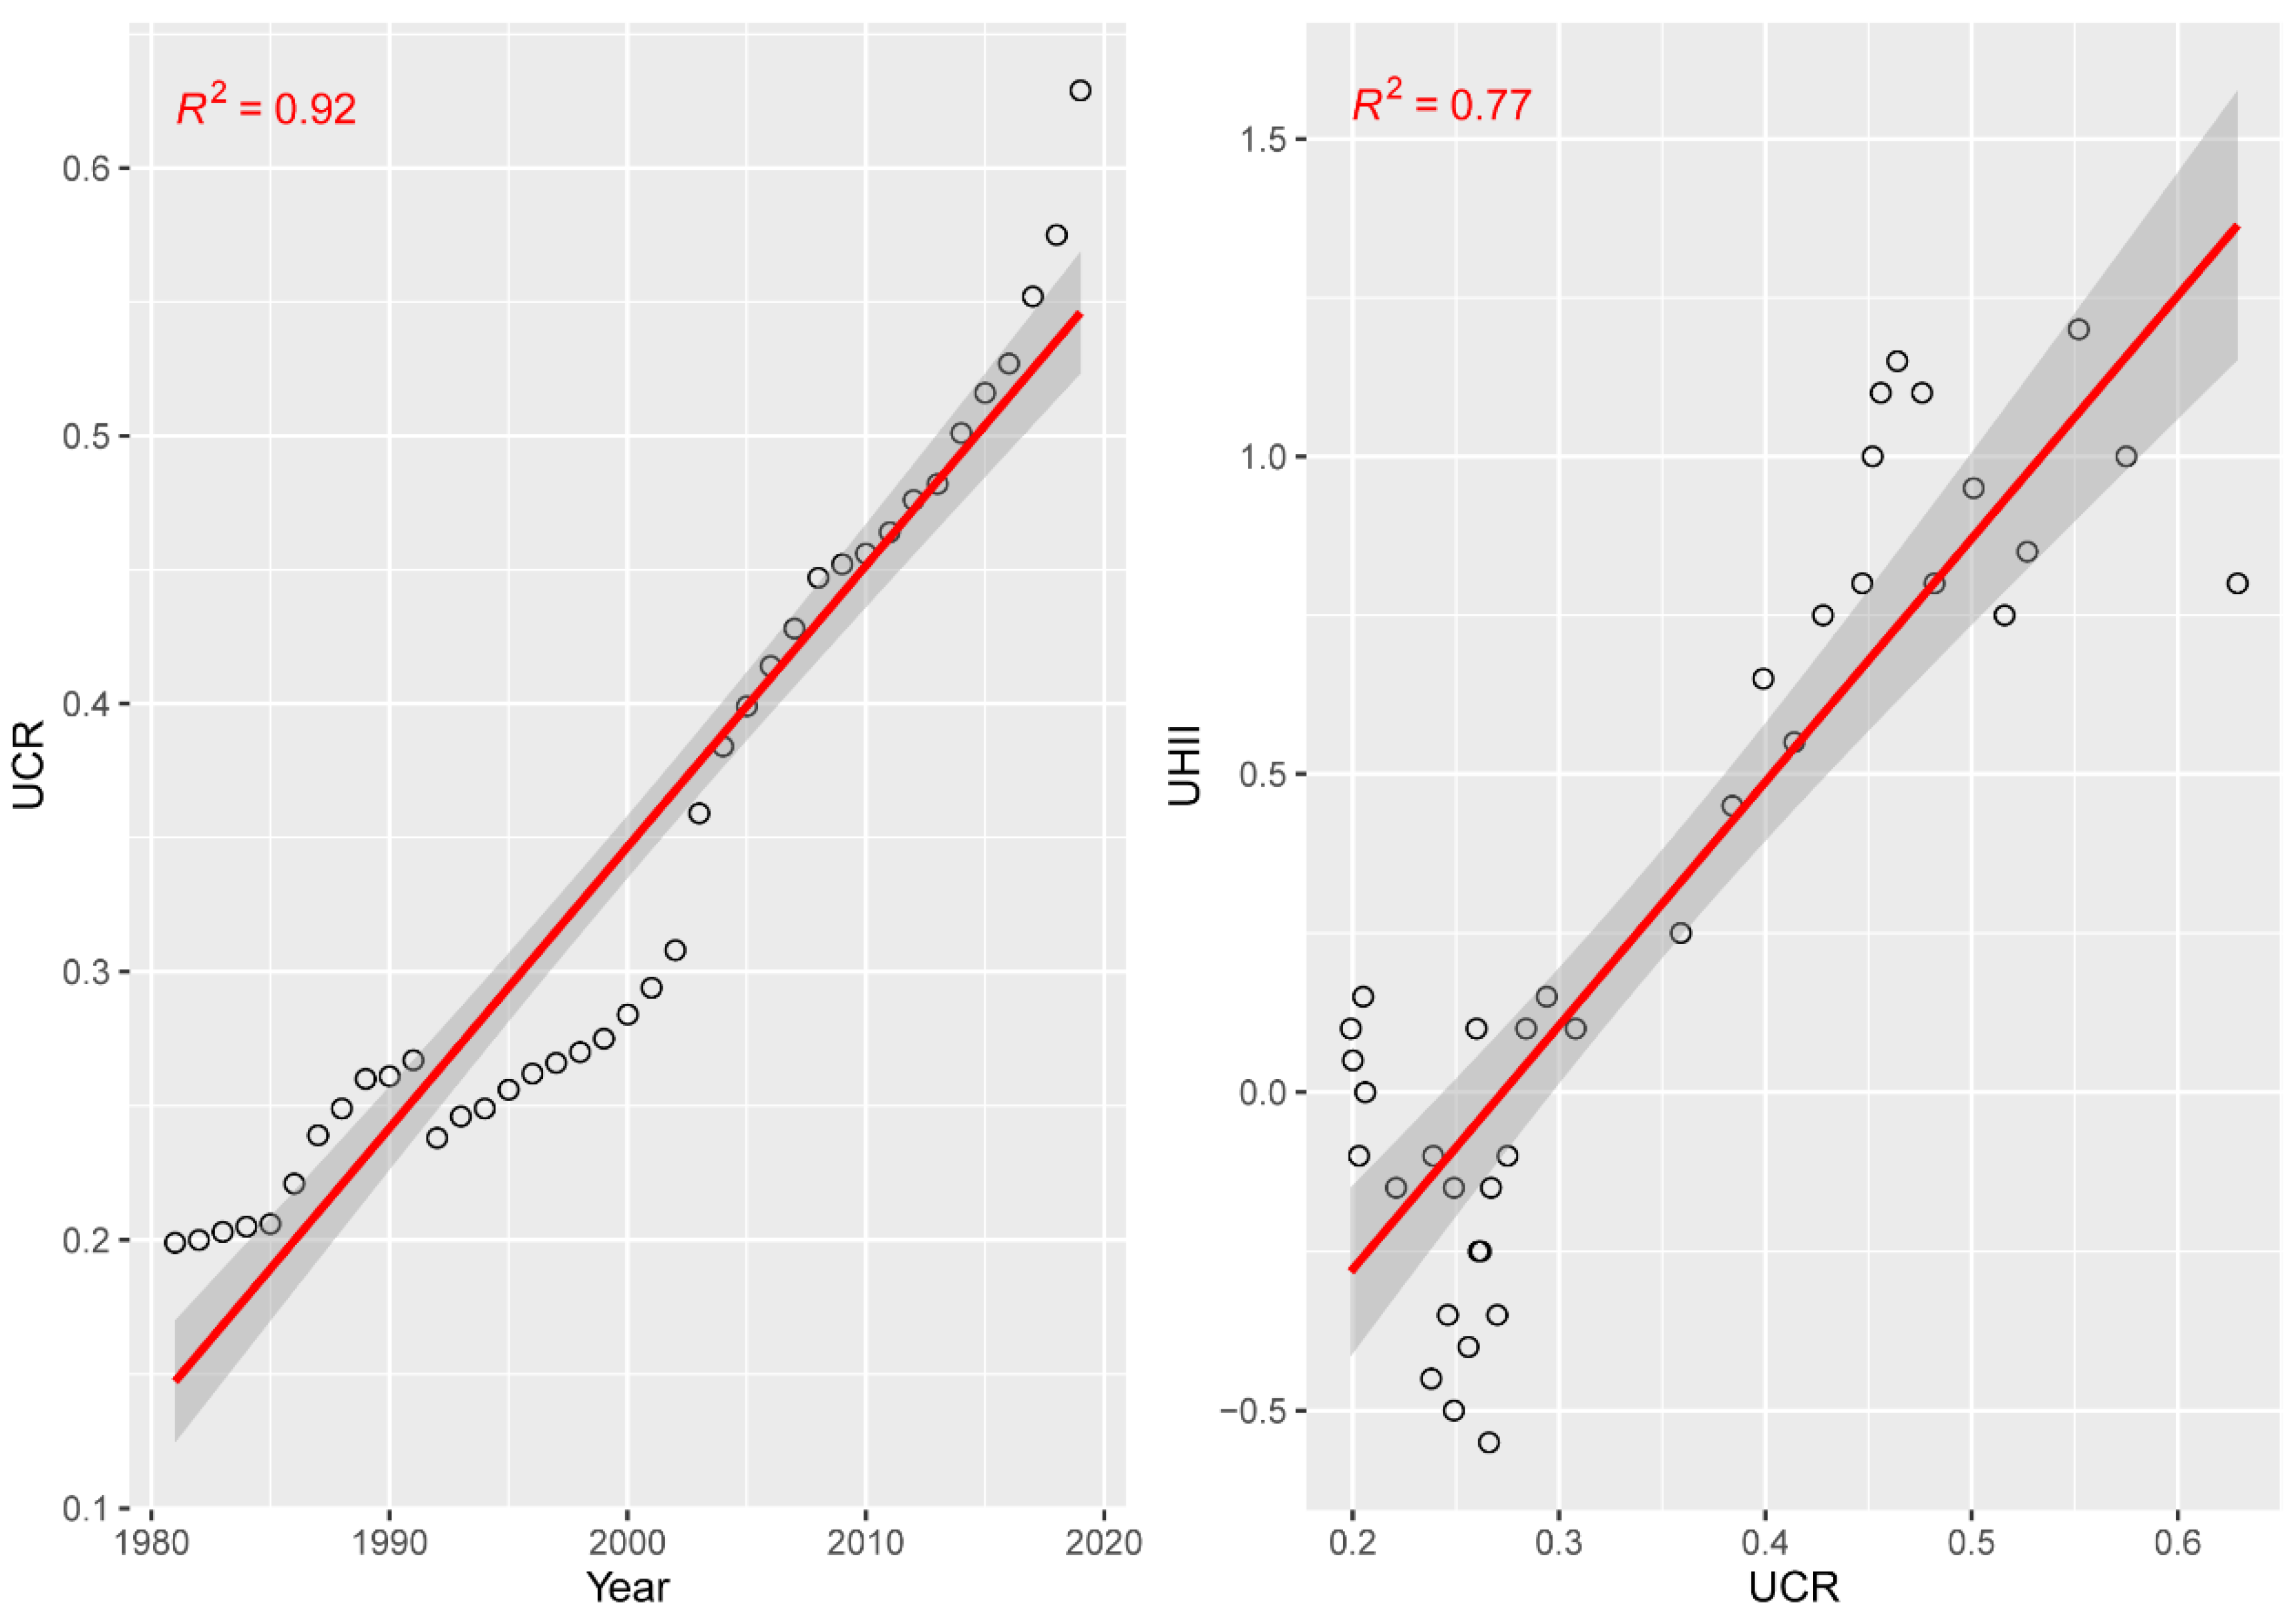
4.4. The Correlation between Atmospheric UHI Intensity and Urban Socioeconomic Growth

The correlation coefficients for urbanization data and atmospheric UHII from 1981 to 2019 were greater than 0.78 (p < 0.01), indicating a strong relationship between socioeconomic development indicators and atmospheric UHII (Table 1).
The urbanization indicators (built-up area, population, urbanization rate, population density, and GDP) were chosen for further linear regression analysis between them and UHII. The results demonstrated a significant (p < 0.01) positive linear correlation between UHII and urbanization indicators (Table 2), as indicated by a p-value less than 0.01. Therefore, it is possible to conclude that the urbanization process increased the UHI effect.
In the meantime, based on the results in Table 2, we can predict that a 100 km2 increase in the urban area of Zhengzhou will result in a 0.31 °C increase in UHII. Moreover, a one million increase in population will result in a 0.36 °C increase in UHII. The UHI intensity may increase by 1.67 °C by 2035, based on the predicted results of the population growth trend.
Studies have shown synergistic effects with heat waves [39], which are also responsible for daytime UHI peaking in summer (part 4.2), while related studies have also shown that natural factors have a more significant impact on environmental climate comfort in human settlements than anthropogenic ones, and that the great challenges of climate change, rapid urbanization, economic growth, and demographic changes could plunge China into a future struggle against urban warming [40].
The analysis results of urban growth and atmospheric UHII (Figure 6) indicate that the growth rate of urban built-up areas was relatively slow until 2000. However, the UCR index increased rapidly after 2000, indicating that the urbanized area gradually grew and replaced the non-urbanized areas. There is a significant positive correlation between UHII and UCR. This indicates that the heat island effect is more pronounced the larger the urban built-up area.

5. Discussion

5.1. Urbanization Roles in Climate Change

In this survey, the present study analyzed atmospheric UHI changes in Zhengzhou characteristics based on long-term observed meteorological data for the past 39 years. The study’s findings revealed a warming trend in urban and rural areas (Figure 2), but the increase in urban areas was noticeably greater than in rural areas (Figure 2). The results of other studies also support this urban climate trend result [35,41,42]. The causes of this could be attributed to two factors: First, as a result of global warming, both urban and rural areas worldwide are experiencing significant temperature increases and an increase in the frequency of extreme weather events. However, explained from a physical standpoint, the urbanization process replaces the surface of the original area, changing the physical properties, especially the heat capacity of the surface structure [43]. Built-up urban areas absorb more heat than undeveloped areas, increasing temperature. At the same time, built-up areas reduce the evaporation capacity of the city, and the surfaces of buildings, concrete, asphalt, etc., in built-up areas cannot evaporate compared to urban vegetated areas and water bodies, which also leads to an increase in urban temperature [44]. Additionally, the increase in anthropogenic heat in urban areas also contributes to warming. These are the primary reasons for Zhengzhou’s escalating urban climate change.
It is noteworthy that the atmospheric UHI effect in the study area had a turning point at the turn of the century (Figure 3). This is because temperatures between urban and rural areas were close during the low rate of urbanization between 1989 and 2000. Urban areas, however, rapidly warmed after 2000, and the UHII gradually rose. This is supported by the findings of the analysis between the UHII and urban expansion indicators, which show that the process of urbanization significantly contributes to the urban heat island effect. The atmospheric UHII changes correlate with socioeconomic data (Table 1), such as population, urbanization rate, population density, and GDP.
Urbanization indicators such as the increase in population are the increase of built-up areas in urban areas, and the increase of population density is also the increase in building density (residential areas of high-rise buildings). On the one hand, the heat capacity of the built-up areas produces changes, such as the influence of building materials on temperature; on the other hand, the increase of anthropogenic heat sources (air conditioning use in summer, motor vehicles, etc.), all contribute to the increase of the overall temperature of the city, thus aggravating the urban heat island effect. At the same time, some human activities in the city produce industrial pollutants (PM2.5, photochemical smog, etc.), which produce chemical reactions near the surface and also lead to changes in the thermal properties of aerosols, thus aggravating the heat island effect [45,46,47].

5.2. UHI and Urban Expansion

This study showed a positive correlation between the presence of UHI and urban sprawl, as evidenced by the analysis of urban sprawl based on the UCR indicator (Figure 6). This result is consistent with previous studies on land use/land cover (LULC) change and the heat island effect [23,26,36], which provides strong evidence that urbanization processes contribute to UHI based on surface temperature and air temperature. Previous studies in Zhengzhou have also shown that replacing permeable land (arable and forest land, etc.) with impermeable urban surfaces manifests urban sprawl [23,36]. Studies have shown that urban heat zones are generally located mostly in built-up areas, while cold islands are generally located in green and watery areas. Previous studies have also shown that the urbanization pattern of Zhengzhou is expanding from the center outward, leading to the spread of urban heat islands from the center to the urban periphery, resulting in the city being filled with built-up areas [26]. Therefore, it is also leading to higher temperatures in urban areas than in the surrounding areas. Nevertheless, the impervious surface reduces the evaporation capacity of the city [48,49], leading to higher urban temperatures. This is the same conclusion for Zhengzhou as mentioned in other urban heat island studies [50,51,52,53].

5.3. Policy-Driven Urbanization Process—Indirect Factors

The built-up area of Zhengzhou, from the original 65 km2 (1981) to 651.3 km2 (2019), is not only related to the overall socioeconomic development of China but also the urbanization policy [54,55,56]. The rapid development of Zhengzhou after 2000, with the successive national policies, for instance, in 2002, the new city construction (e.g., CBD) was started. The Central Plains Economic Zone was approved in 2012, which is the national strategy for developing the central region. The support of the Central Plains Urban Agglomeration in 2018 led to the development of the Central Plains Urban Agglomeration, with Zhengzhou as the center. The National Central City in 2018 further established Zhengzhou’s status as a driving force for the development of the surrounding area. Through these policies, from 1981–2019, Zhengzhou’s built-up area has expanded tenfold, its population has increased 2.26 times, and the scale of the city has grown rapidly, not only in the new city but also in the old town, turning it into the high-density mega-city it is today.

5.4. Countermeasures and Outlooks

Urban development has replaced much of the vegetated landscape with built structures and impervious surfaces, altering the near-surface climate and increasing temperatures. Urban warming is closely related to the influence of buildings, and studies have shown that physical variables such as building size, population density, vegetation cover, texture, and surface color significantly affect energy use [57]. The surface temperature increases with building height, and building orientation also affects temperature [58]. The results of building density on surface temperature for 21 cities in China show that the effect of building density on LST is more significant in dry climates compared to humid climates. The spatial variability of the effects [59] and the heat island effect affect building energy consumption, and studies have shown that UHI intensity can increase the sensible cooling load of residential buildings [60,61,62]. In some countries, the negative impact of urban development on the heat island effect has been fought. For example, Canada has implemented urban cooling strategies based on natural solutions to mitigate the heat island effect by implementing green roofs and increasing vegetation [63]. In Beijing, China, urban thermal environments are improved through an urban ventilation corridor program [64]. Numerous studies of urban cooling have shown that reflective and green roofs can reduce the surface temperature of roofs [65,66,67], thereby reducing the corresponding apparent atmospheric heat flux. Increasing the albedo of urban environments [68,69,70,71], using cooling materials, and expanding green spaces [72,73,74,75,76] in cities to use natural radiators to dissipate excess heat are effective ways to mitigate urban heat islands.
From the results of this study, we can see that, with urbanization, the city is becoming warmer, and the urban heat island intensity is increasing. Although partly attributed to the influence of the general context of global warming, the urban warming trend is significantly greater than the temperature increase in the suburbs, and the frequency of heat waves and extreme weather in recent years show that we must continue to take action in the construction of future cities to mitigate the urban heat island effect and urban warming trend. Combined with the study, we recommend (1) emphasizing policy guidance, and, in the construction of future cities, urban planners and policymakers should pay attention to the construction of cool cities; (2) strengthening the construction of urban blue-green infrastructure; urban blue-green infrastructure is an urban cool island, and the evapotranspiration of blue-green space plays an important role in mitigating the urban thermal environment; (3) increasing surface greenery/vegetation such as green roofs and vertical greening and increasing surface reflectivity such as cooling pavement materials or cool infrastructure, so as to change the thermal properties to mitigate and reduce the urban heat island effect.

6. Conclusions

This study applied a comprehensive approach to characterize the urban heat island. First, we examined the temporal variation of UHI intensity by applying 39 years (1981–2019) of meteorological data from the study area on annual, seasonal, daytime, and nighttime bases. During the study period, the annual mean temperature in Zhengzhou City increased by 0.67 °C per decade. The analysis of the urban compactness ratio (UCR) indicated that urbanization contributes to the warming trend in Zhengzhou. Second, the socioeconomic development indicators (population, urbanization rate, population density, and built-up area) from 1981 to 2019 were used as indirect factors to examine their correlation with UHI intensity. By using this comprehensive method in Zhengzhou city. We summarized the temporal UHI characteristics:
(1)
UHI intensity increases with time and urban expansion magnitude.
(2)
Renewed evidence shows the changing characteristics of urban heat islands in the Northern Hemisphere. Summer has the highest UHI intensity, spring is the second, and winter is the weakest. Nocturnal UHI intensity was more significant than daytime.
(3)
The urban development indicators (population, urbanization rate, population density, UCR) are all significant factors contributing to the UHI effect.
This research offers a suitable approach and evaluates the UHI intensity variation within a long-term period, which could fulfill the drawback of the remote sensing method that could not present changes in the time scale. Additionally, the long-term urban socio-economic development indicators provide an additional way to characterize the UHI phenomenon.

Author Contributions

Conceptualization, H.L., H.M., and S.J.; methodology, H.L.; software, H.L.; resources, H.M. and G.T.; writing—original draft preparation, H.L. and H.M.; writing—review and editing, H.L., Y.L., and S.J.; visualization, S.J. and H.L. All authors have read and agreed to the published version of the manuscript.

Funding

This research was funded by “Henan Province Young Talent Support Project” (2019HYTP033), Meteorological disaster risk assessment and microclimate simulation and “Henan Overseas Expertise Introduction Center for Discipline Innovation”.

Data Availability Statement

The data presented in this study are available on request from the first author.

Acknowledgments

The authors would like to thank Huawei Li’s previous Ph.D. thesis, “Characteristics, effects and mitigation of urban heat island in developing urban regions.” We thank the support of the Hungarian University of Agriculture and Life Sciences. Moreover, the authors would like to thank the support of the International Joint Laboratory of Landscape Architecture, Henan Agricultural University, for their infinite help.

Conflicts of Interest

The authors declare no conflict of interest.

Appendix A

Table A1. Zhengzhou national weather station LCZ.
YearLCZ TypeAerial Images
1988LCZ D-Agriculture landLand 11 01838 i001
2005LCZ-6 Open low-rise
Land 11 01838 i002
Land 11 01838 i003
2007LCZ-4 Open mid-rise
Land 11 01838 i004
Land 11 01838 i005
2019LCZ-1 Open high-rise
Land 11 01838 i006
Land 11 01838 i007
National
Standard
Station
model
Land 11 01838 i008
Aerial map
Land 11 01838 i009
Reference model from⟪Specifications for surface meteorological observation⟫ QX/T 61-2007 National Standard
Land 11 01838 i010
Local climate zone types (Stewart & Oke 2012)
Table A2. Xinzheng national weather station LCZ.
YearLCZ TypeAerial Images
1988LCZ D-Agriculture landLand 11 01838 i011
2009LCZ D-Agriculture land
Land 11 01838 i012
Land 11 01838 i013
2013LCZ-9 Sparsely built
Land 11 01838 i014
Land 11 01838 i015
2019LCZ-4 Open low-rise
Land 11 01838 i016
Land 11 01838 i017
Table A3. Statistics of annual data of urban development in Zhengzhou city from 1981–2019 (data source: Zhengzhou Bureau of Statistics Department).
YearBuilt-Up/km2Citizens/Million* Urbanization Rate/%Population Density/km2GDP/CNY
1981654.583561631.1
1982664.6735.862833.3
198367.84.7436.763737.5
198469.34.837.664543.3
198570.24.8538.465249.7
198680.54.9139.366053.4
198794.25.0040.167266.3
19881025.104168681.5
1989110.95.2141.970097.8
19901125.5742.7749116.4
1991117.25.6543.9759138.7
199293.15.7045.2767167.4
199399.55.8146.4781218.4
1994101.95.8847.7791287.9
1995108.36.0048.9806386.4
1996112.86.0750.1816498.2
1997116.26.1451.4826566
1998119.86.2252.6836610
1999124.56.3153.9848632.9
2000133.26.6555.1894728.4
2001142.46.7755.5909815.8
2002156.46.8756924913.9
2003212.46.97579371074.1
2004243.37.0857.99511335.2
20052627.1659.29621660.6
20062827.2460.29732007.8
20073027.3561.39882486.7
2008328.77.4362.39993012.9
2009336.77.5263.410103305.9
2010342.78.6663.611634029.3
2011354.78.8564.811894954.1
20123739.0366.312135517.1
2013382.79.1967.112346197.4
2014412.79.3768.312596777
2015437.69.5669.712857311.5
2016456.69.727113068114
2017500.89.8872.213279193.8
2018543.910.1373.4136110,670.1
2019651.310.3574.6139011,589.7
* The urbanization rate is a measure of urbanization, generally using a demographic indicator, which is the proportion of the urban population to the total population (including agricultural and non-agricultural).

References

  1. Droughts in Europe in July 2022: Almost Half of the EU + UK Territory at Risk. Available online: https://joint-research-centre.ec.europa.eu/jrc-news/droughts-europe-july-2022-almost-half-eu-uk-territory-risk-2022-07-18_en (accessed on 28 August 2022).
  2. United Nations. World Population Prospects 2019-Volume II: Demographic Profiles; UN: New York, NY, USA, 2020; ISBN 978-92-1-004643-5.
  3. Oke, T.R. Boundary Layer Climates; Taylor & Francis: Oxford, UK, 2002; ISBN 978-1-134-95133-8. [Google Scholar]
  4. Kotharkar, R.; Ramesh, A.; Bagade, A. Urban Heat Island Studies in South Asia: A Critical Review. Urban Clim. 2018, 24, 1011–1026. [Google Scholar] [CrossRef]
  5. Phelan, P.E.; Kaloush, K.; Miner, M.; Golden, J.; Phelan, B.; Silva, H.; Taylor, R.A. Urban Heat Island: Mechanisms, Implications, and Possible Remedies. Annu. Rev. Environ. Resour. 2015, 40, 285–307. [Google Scholar] [CrossRef]
  6. Deilami, K.; Kamruzzaman, M.; Liu, Y. Urban Heat Island Effect: A Systematic Review of Spatio-Temporal Factors, Data, Methods, and Mitigation Measures. Int. J. Appl. Earth Obs. Geoinf. 2018, 67, 30–42. [Google Scholar] [CrossRef]
  7. Ward, K.; Lauf, S.; Kleinschmit, B.; Endlicher, W. Heat Waves and Urban Heat Islands in Europe: A Review of Relevant Drivers. Sci. Total Environ. 2016, 569–570, 527–539. [Google Scholar] [CrossRef]
  8. Gaffin, S.R.; Rosenzweig, C.; Khanbilvardi, R.; Parshall, L.; Mahani, S.; Glickman, H.; Goldberg, R.; Blake, R.; Slosberg, R.B.; Hillel, D. Variations in New York City’s Urban Heat Island Strength over Time and Space. Theor. Appl Clim. 2008, 94, 1–11. [Google Scholar] [CrossRef]
  9. Kataoka, K.; Matsumoto, F.; Ichinose, T.; Taniguchi, M. Urban Warming Trends in Several Large Asian Cities over the Last 100 Years. Sci. Total Environ. 2009, 407, 3112–3119. [Google Scholar] [CrossRef]
  10. Hong, J.-W.; Hong, J.; Kwon, E.E.; Yoon, D.K. Temporal Dynamics of Urban Heat Island Correlated with the Socio-Economic Development over the Past Half-Century in Seoul, Korea. Environ. Pollut. 2019, 254, 112934. [Google Scholar] [CrossRef]
  11. Ren, G.; Zhou, Y.; Chu, Z.; Zhou, J.; Zhang, A.; Guo, J.; Liu, X. Urbanization Effects on Observed Surface Air Temperature Trends in North China. J. Clim. 2008, 21, 1333–1348. [Google Scholar] [CrossRef] [Green Version]
  12. Manoli, G.; Fatichi, S.; Schläpfer, M.; Yu, K.; Crowther, T.W.; Meili, N.; Burlando, P.; Katul, G.G.; Bou-Zeid, E. Magnitude of Urban Heat Islands Largely Explained by Climate and Population. Nature 2019, 573, 55–60. [Google Scholar] [CrossRef]
  13. Howard, L. The Climate of London: Deduced from Meteorological Observations; Cambridge University Press: Cambridge, UK, 2012; ISBN 978-1-108-04952-8. [Google Scholar]
  14. Unger, J. Intra-Urban Relationship between Surface Geometry and Urban Heat Island: Review and New Approach. Clim. Res. 2004, 27, 253–264. [Google Scholar] [CrossRef]
  15. Oke, T.R. The Distinction between Canopy and Boundary-layer Urban Heat Islands. Atmosphere 1976, 14, 268–277. [Google Scholar] [CrossRef] [Green Version]
  16. Oke, T.R. Street Design and Urban Canopy Layer Climate. Energy Build. 1988, 11, 103–113. [Google Scholar] [CrossRef]
  17. Ooka, R.; Sato, T.; Harayama, K.; Murakami, S.; Kawamoto, Y. Thermal Energy Balance Analysis of the Tokyo Metropolitan Area Using a Mesoscale Meteorological Model Incorporating an Urban Canopy Model. Bound.-Layer Meteorol. 2011, 138, 77–97. [Google Scholar] [CrossRef]
  18. Park, B.-J.; Kim, Y.-H.; Min, S.-K.; Kim, M.-K.; Choi, Y.; Boo, K.-O.; Shim, S. Long-Term Warming Trends in Korea and Contribution of Urbanization: An Updated Assessment: Urbanization Contribution in Korea. J. Geophys. Res. Atmos. 2017, 122, 10637–10654. [Google Scholar] [CrossRef]
  19. Xiong, Y.; Huang, S.; Chen, F.; Ye, H.; Wang, C.; Zhu, C. The Impacts of Rapid Urbanization on the Thermal Environment: A Remote Sensing Study of Guangzhou, South China. Remote Sens. 2012, 4, 2033–2056. [Google Scholar] [CrossRef] [Green Version]
  20. Chapman, S.; Watson, J.E.M.; Salazar, A.; Thatcher, M.; McAlpine, C.A. The Impact of Urbanization and Climate Change on Urban Temperatures: A Systematic Review. Landsc. Ecol. 2017, 32, 1921–1935. [Google Scholar] [CrossRef]
  21. Yu, Z.; Yao, Y.; Yang, G.; Wang, X.; Vejre, H. Spatiotemporal Patterns and Characteristics of Remotely Sensed Region Heat Islands during the Rapid Urbanization (1995–2015) of Southern China. Sci. Total Environ. 2019, 674, 242–254. [Google Scholar] [CrossRef]
  22. Sun, S. An Analysis on Planning Paradigms and the Evolution of Urban Planning in China. UPI 2019, 34, 1–7. [Google Scholar] [CrossRef]
  23. Min, M.; Zhao, H.; Miao, C. Spatio-Temporal Evolution Analysis of the Urban Heat Island: A Case Study of Zhengzhou City, China. Sustainability 2018, 10, 1992. [Google Scholar] [CrossRef] [Green Version]
  24. Zhao, H.; Zhang, H.; Miao, C.; Ye, X.; Min, M. Linking Heat Source–Sink Landscape Patterns with Analysis of Urban Heat Islands: Study on the Fast-Growing Zhengzhou City in Central China. Remote Sens. 2018, 10, 1268. [Google Scholar] [CrossRef]
  25. Zhao, H.; Ren, Z.; Tan, J. The Spatial Patterns of Land Surface Temperature and Its Impact Factors: Spatial Non-Stationarity and Scale Effects Based on a Geographically-Weighted Regression Model. Sustainability 2018, 10, 2242. [Google Scholar] [CrossRef] [Green Version]
  26. Yang, H.; Xi, C.; Zhao, X.; Mao, P.; Wang, Z.; Shi, Y.; He, T.; Li, Z. Measuring the Urban Land Surface Temperature Variations Under Zhengzhou City Expansion Using Landsat-Like Data. Remote Sens. 2020, 12, 801. [Google Scholar] [CrossRef] [Green Version]
  27. Khan, S.; Gul, S.; Li, W. Remote Sensing Evaluation of Land Surface Temperature and Urban Area Expansion in Zhengzhou City during 2013–2015. Nat. Appl. Sci. Int. J. (NASIJ) 2021, 2, 39–55. [Google Scholar] [CrossRef]
  28. Yang, Y.; Song, F.; Ma, J.; Wei, Z.; Song, L.; Cao, W. Spatial and Temporal Variation of Heat Islands in the Main Urban Area of Zhengzhou under the Two-Way Influence of Urbanization and Urban Forestry. PLoS ONE 2022, 17, e0272626. [Google Scholar] [CrossRef]
  29. Stewart, I.D.; Oke, T.R. Local Climate Zones for Urban Temperature Studies. Bull. Am. Meteorol. Soc. 2012, 93, 1879–1900. [Google Scholar] [CrossRef]
  30. Lelovics, E.; Unger, J.; Gál, T.; Gál, C. Design of an Urban Monitoring Network Based on Local Climate Zone Mapping and Temperature Pattern Modelling. Clim. Res. 2014, 60, 51–62. [Google Scholar] [CrossRef] [Green Version]
  31. Zhou, X.; Okaze, T.; Ren, C.; Cai, M.; Ishida, Y.; Watanabe, H.; Mochida, A. Evaluation of Urban Heat Islands Using Local Climate Zones and the Influence of Sea-Land Breeze. Sustain. Cities Soc. 2020, 55, 102060. [Google Scholar] [CrossRef]
  32. Dian, C.; Pongrácz, R.; Incze, D.; Bartholy, J.; Talamon, A. Analysis of the Urban Heat Island Intensity Based on Air Temperature Measurements in a Renovated Part of Budapest (Hungary). Geogr. Pannonica 2019, 23, 277–288. [Google Scholar] [CrossRef] [Green Version]
  33. Chen, Y. Derivation of the Functional Relations between Fractal Dimension of and Shape Indices of Urban Form. Comput. Environ. Urban Syst. 2011, 35, 442–451. [Google Scholar] [CrossRef]
  34. Haggett, P.; Cliff, A.D.; Frey, A. Locational Analysis in Human Geography; Arnold: London, UK, 1977; Volume 2. [Google Scholar]
  35. Hansen, J.; Ruedy, R.; Sato, M.; Lo, K. Global Surface Temperature Change. Rev. Geophys. 2010, 48, 1–29. [Google Scholar] [CrossRef]
  36. Mu, B.; Mayer, A.L.; He, R.; Tian, G. Land Use Dynamics and Policy Implications in Central China: A Case Study of Zhengzhou. Cities 2016, 58, 39–49. [Google Scholar] [CrossRef]
  37. Dimoudi, A.; Nikolopoulou, M. Vegetation in the Urban Environment: Microclimatic Analysis and Benefits. Energy Build. 2003, 35, 69–76. [Google Scholar] [CrossRef] [Green Version]
  38. Chen, J.; Jin, S.; Du, P. Roles of Horizontal and Vertical Tree Canopy Structure in Mitigating Daytime and Nighttime Urban Heat Island Effects. Int. J. Appl. Earth Obs. Geoinf. 2020, 89, 102060. [Google Scholar] [CrossRef]
  39. Zhou, C.; Zhang, D.; Cao, Y.; Wang, Y.; Zhang, G. Spatio–Temporal Evolution and Factors of Climate Comfort for Urban Human Settlements in the Guangdong–Hong Kong–Macau Greater Bay Area. Front. Environ. Sci. 2022, 10, 1001064. [Google Scholar] [CrossRef]
  40. He, B.-J.; Wang, J.; Zhu, J.; Qi, J. Beating the Urban Heat: Situation, Background, Impacts and the Way Forward in China. Renew. Sustain. Energy Rev. 2022, 161, 112350. [Google Scholar] [CrossRef]
  41. Chow, W.T.L.; Roth, M. Temporal Dynamics of the Urban Heat Island of Singapore. Int. J. Climatol. 2006, 26, 2243–2260. [Google Scholar] [CrossRef]
  42. Lee, T.-W.; Lee, J.Y.; Wang, Z.-H. Scaling of the Urban Heat Island Intensity Using Time-Dependent Energy Balance. Urban Clim. 2012, 2, 16–24. [Google Scholar] [CrossRef] [Green Version]
  43. Bowen, I.S. The Ratio of Heat Losses by Conduction and by Evaporation from Any Water Surface. Phys. Rev. 1926, 27, 779–787. [Google Scholar] [CrossRef] [Green Version]
  44. Qiu, G.; Li, H.; Zhang, Q.; Chen, W.; Liang, X.; Li, X. Effects of Evapotranspiration on Mitigation of Urban Temperature by Vegetation and Urban Agriculture. J. Integr. Agric. 2013, 12, 1307–1315. [Google Scholar] [CrossRef]
  45. Zhong, C.; Chen, C.; Liu, Y.; Gao, P.; Li, H. A Specific Study on the Impacts of PM2.5 on Urban Heat Islands with Detailed In Situ Data and Satellite Images. Sustainability 2019, 11, 7075. [Google Scholar] [CrossRef]
  46. Zhang, D.; Zhou, C.; He, B.-J. Spatial and Temporal Heterogeneity of Urban Land Area and PM2.5 Concentration in China. Urban Clim. 2022, 45, 101268. [Google Scholar] [CrossRef]
  47. Yang, J.; Xin, J.; Zhang, Y.; Xiao, X.; Xia, J.C. Contributions of Sea–Land Breeze and Local Climate Zones to Daytime and Nighttime Heat Island Intensity. npj Urban Sustain. 2022, 2, 12. [Google Scholar] [CrossRef]
  48. Stabler, L.B.; Martin, C.A.; Brazel, A.J. Microclimates in a Desert City Were Related to Land Use and Vegetation Index. Urban For. Urban Green. 2005, 3, 137–147. [Google Scholar] [CrossRef]
  49. Li, X.-X.; Liu, X. Effect of Tree Evapotranspiration and Hydrological Processes on Urban Microclimate in a Tropical City: A WRF/SLUCM Study. Urban Clim. 2021, 40, 101009. [Google Scholar] [CrossRef]
  50. Xu, H.; Ding, F.; Wen, X. Urban Expansion and Heat Island Dynamics in the Quanzhou Region, China. IEEE J. Sel. Top. Appl. Earth Obs. Remote Sens. 2009, 2, 74–79. [Google Scholar] [CrossRef]
  51. Qiao, Z.; Tian, G.; Zhang, L.; Xu, X. Influences of Urban Expansion on Urban Heat Island in Beijing during 1989–2010. Adv. Meteorol. 2014, 2014, e187169. [Google Scholar] [CrossRef] [Green Version]
  52. Li, Y.; Zhang, H.; Kainz, W. Monitoring Patterns of Urban Heat Islands of the Fast-Growing Shanghai Metropolis, China: Using Time-Series of Landsat TM/ETM+ Data. Int. J. Appl. Earth Obs. Geoinf. 2012, 19, 127–138. [Google Scholar] [CrossRef]
  53. Shen, H.; Huang, L.; Zhang, L.; Wu, P.; Zeng, C. Long-Term and Fine-Scale Satellite Monitoring of the Urban Heat Island Effect by the Fusion of Multi-Temporal and Multi-Sensor Remote Sensed Data: A 26-Year Case Study of the City of Wuhan in China. Remote Sens. Environ. 2016, 172, 109–125. [Google Scholar] [CrossRef]
  54. Kamal-Chaoui, L.; Leeman, E.; Rufei, Z. Urban Trends and Policy in China; OECD Publishing: Paris, France, 2009. [Google Scholar] [CrossRef]
  55. Wei, H.; Li, L.; Nian, M. China’s Urbanization Strategy and Policy During the 14th Five-Year Plan Period. Chin. J. Urban Environ. Stud. 2021, 9, 2150002. [Google Scholar] [CrossRef]
  56. Ding, C.; Zhao, X. Urbanization in Japan, South Korea, and China: Policy and Reality. In The Oxford Handbook of Urban Economics and Planning; Brooks, N., Donaghy, K., Knaap, G., Eds.; Oxford University Press: Oxford, UK, 2011; pp. 906–931. ISBN 978-0-19-538062-0. [Google Scholar]
  57. Faroughi, M.; Karimimoshaver, M.; Aram, F.; Solgi, E.; Mosavi, A.; Nabipour, N.; Chau, K.-W. Computational Modeling of Land Surface Temperature Using Remote Sensing Data to Investigate the Spatial Arrangement of Buildings and Energy Consumption Relationship. Eng. Appl. Comput. Fluid Mech. 2020, 14, 254–270. [Google Scholar] [CrossRef] [Green Version]
  58. Alexander, C. Influence of the Proportion, Height and Proximity of Vegetation and Buildings on Urban Land Surface Temperature. Int. J. Appl. Earth Obs. Geoinf. 2021, 95, 102265. [Google Scholar] [CrossRef]
  59. Song, J.; Chen, W.; Zhang, J.; Huang, K.; Hou, B.; Prishchepov, A.V. Effects of Building Density on Land Surface Temperature in China: Spatial Patterns and Determinants. Landsc. Urban Plan. 2020, 198, 103794. [Google Scholar] [CrossRef]
  60. Salvati, A.; Roura, H.C.; Cecere, C. Assessing the Urban Heat Island and Its Energy Impact on Residential Buildings in Mediterranean Climate: Barcelona Case Study. Energy Build. 2017, 146, 38–54. [Google Scholar] [CrossRef] [Green Version]
  61. Santamouris, M. On the Energy Impact of Urban Heat Island and Global Warming on Buildings. Energy Build. 2014, 82, 100–113. [Google Scholar] [CrossRef]
  62. Santamouris, M.; Cartalis, C.; Synnefa, A.; Kolokotsa, D. On the Impact of Urban Heat Island and Global Warming on the Power Demand and Electricity Consumption of Buildings—A Review. Energy Build. 2015, 98, 119–124. [Google Scholar] [CrossRef]
  63. Hayes, A.T.; Jandaghian, Z.; Lacasse, M.A.; Gaur, A.; Lu, H.; Laouadi, A.; Ge, H.; Wang, L. Nature-Based Solutions (NBSs) to Mitigate Urban Heat Island (UHI) Effects in Canadian Cities. Buildings 2022, 12, 925. [Google Scholar] [CrossRef]
  64. Bing, D.; Zhaoyin, Y.; Wupeng, D.; Xiaoyi, F.; Yonghong, L.; Chen, C.; Yan, L. Cooling the City with “Natural Wind”: Construction Strategy of Urban Ventilation Corridors in China. IOP Conf. Ser. Earth Environ. Sci. 2021, 657, 012009. [Google Scholar] [CrossRef]
  65. Santamouris, M. Cooling the Cities—A Review of Reflective and Green Roof Mitigation Technologies to Fight Heat Island and Improve Comfort in Urban Environments. Sol. Energy 2014, 103, 682–703. [Google Scholar] [CrossRef]
  66. Dwivedi, A.; Mohan, B.K. Impact of Green Roof on Micro Climate to Reduce Urban Heat Island. Remote Sens. Appl. Soc. Environ. 2018, 10, 56–69. [Google Scholar] [CrossRef]
  67. Shao, H.; Song, P.; Mu, B.; Tian, G.; Chen, Q.; He, R.; Kim, G. Assessing City-Scale Green Roof Development Potential Using Unmanned Aerial Vehicle (UAV) Imagery. Urban For. Urban Green. 2021, 57, 126954. [Google Scholar] [CrossRef]
  68. Bhattacharya, B.K.; Mallick, K.; Padmanabhan, N.; Patel, N.K.; Parihar, J.S. Retrieval of Land Surface Albedo and Temperature Using Data from the Indian Geostationary Satellite: A Case Study for the Winter Months. Int. J. Remote Sens. 2009, 30, 3239–3257. [Google Scholar] [CrossRef]
  69. Erell, E.; Pearlmutter, D.; Boneh, D.; Kutiel, P.B. Effect of High-Albedo Materials on Pedestrian Heat Stress in Urban Street Canyons. Urban Clim. 2014, 10, 367–386. [Google Scholar] [CrossRef]
  70. Taha, H. Urban Climates and Heat Islands: Albedo, Evapotranspiration, and Anthropogenic Heat. Energy Build. 1997, 25, 99–103. [Google Scholar] [CrossRef] [Green Version]
  71. Xu, X.; Asawa, T.; Kobayashi, H. Narrow-to-Broadband Conversion for Albedo Estimation on Urban Surfaces by UAV-Based Multispectral Camera. Remote Sens. 2020, 12, 2214. [Google Scholar] [CrossRef]
  72. Zhang, Z.; Lv, Y.; Pan, H. Cooling and Humidifying Effect of Plant Communities in Subtropical Urban Parks. Urban For. Urban Green. 2013, 12, 323–329. [Google Scholar] [CrossRef]
  73. Du, H.; Song, X.; Jiang, H.; Kan, Z.; Wang, Z.; Cai, Y. Research on the Cooling Island Effects of Water Body: A Case Study of Shanghai, China. Ecol. Indic. 2016, 67, 31–38. [Google Scholar] [CrossRef]
  74. Aram, F.; Solgi, E.; Higueras García, E.; Mosavi, A.; Várkonyi-Kóczy, A.R. The Cooling Effect of Large-Scale Urban Parks on Surrounding Area Thermal Comfort. Energies 2019, 12, 3904. [Google Scholar] [CrossRef] [Green Version]
  75. Chen, X.; Su, Y.; Li, D.; Huang, G.; Chen, W.; Chen, S. Study on the Cooling Effects of Urban Parks on Surrounding Environments Using Landsat TM Data: A Case Study in Guangzhou, Southern China. Int. J. Remote Sens. 2012, 33, 5889–5914. [Google Scholar] [CrossRef]
  76. Shen, Z.-J.; Zhang, B.-H.; Xin, R.-H.; Liu, J.-Y. Examining Supply and Demand of Cooling Effect of Blue and Green Spaces in Mitigating Urban Heat Island Effects: A Case Study of the Fujian Delta Urban Agglomeration (FDUA), China. Ecol. Indic. 2022, 142, 109187. [Google Scholar] [CrossRef]
Figure 1. Location of the study area: (a) Henan province in China, (b) Zhengzhou in Henan province, and (c) Zhengzhou DEM map and weather stations.
Land 11 01838 g001
Figure 2. Mean annual temperatures were recorded at two weather stations between 1981 and 2019.
Land 11 01838 g002
Figure 3. Averages of the atmospheric UHI intensity (UHII) in Zhengzhou from 1981 to 2019 by year and season.
Land 11 01838 g003
Figure 4. Mean atmospheric UHI intensity (UHII) each year at different daytime and nighttime hours in Zhengzhou over the past years (1981–2019).
Land 11 01838 g004
Figure 5. Characteristics of four-season hourly mean variations in atmospheric UHI intensity (1981–2019).
Land 11 01838 g005
Figure 6. The plot of the urban compactness ratio (UCR) over the past 39 years versus time (left) and linear regression analysis of UCR to UHII (right).
Land 11 01838 g006
Table 1. Analysis of the relationship between urban development indicators and UHII.
Built-UpUR 1PopulationGDPPD 2
UHIIPearson correlation0.824 **0.824 **0.857 **0.788 **0.788 **
Sig. (2-tailed)0.0000.0000.0000.0000.000
N/year (1981–2019)3939393939
1 UR is urbanization rate; 2 PD is population density; ** correlation is significant at the 0.01 level.
Table 2. Linear regression analysis of the UHII and urban development indicators.
IndicatorsRegression Model * R2CC *
Population (ten thousand)Y = 0.0036x − 0.74640.730.86
Built-up area (km2)Y = 0.0031x − 0.35050.680.82
Urbanization rate (%)Y = 0.0362x − 1.6730.630.82
Population density (per km2)Y = 0.0019x − 1.47260.670.79
GDPY = 0.0001x − 0.03580.620.78
* Y stands for UHII. CC * is the correlation coefficient.
Publisher’s Note: MDPI stays neutral with regard to jurisdictional claims in published maps and institutional affiliations.

