Article

Analysis of the Spatial Correlation between Port Areas Configuration and Alterations of the Coastal Shoreline: A Multidisciplinary Approach Using Spatiotemporal GIS Indicators

by
Salvador García-Ayllón
1,*,
Francisco Gómez
1 and
Francesco Bianco
2
1
Department of Civil Engineering, Technical University of Cartagena, 30202 Cartagena, Spain
2
Department of Earth Sciences, University of Florence, 50121 Florence, Italy
*
Author to whom correspondence should be addressed.
Land 2022, 11(10), 1800; https://doi.org/10.3390/land11101800
Submission received: 20 September 2022 / Revised: 11 October 2022 / Accepted: 11 October 2022 / Published: 14 October 2022

Abstract

:
Transformations that occur in the coastal territory often have an important link with the construction of port infrastructures, although establishing a direct correlation between causes and effects is rarely straightforward as they are phenomena that emerge over decades. Moreover, this phenomenon is fundamentally observed in developed countries, where we also find the added difficulty that a high number of variables intervene since the coast is usually an environment that is strongly anthropized by human action whilst being an important tourist asset. This study analyzes, from a different perspective than traditional coastal engineering approaches, the existing correlation between the construction of various marinas and coastal infrastructures along the southeast of the Spanish Mediterranean coast. The existing geostatistical correlation between the configuration of port areas and the coastal and socioeconomic impacts that occurred during the decades following the construction of these infrastructures was evaluated using spatiotemporal GIS indicators. The results obtained show that there are different patterns of behavior in the impact generated by port infrastructures depending on the spatial configuration of their boundary conditions, beyond the behavior of sedimentary dynamics usually studied in civil engineering.

1. Introduction

Coastal urban areas are usually the most anthropized spaces on the planet in all countries. Infrastructures located on them (ports, but also breakwaters, dredging, landfills reclaimed from the sea, etc.) have traditionally been a source of transformation of their land uses and of long-term alteration of the shoreline [1,2]. Coastal impacts such as the regression or the growth of the beach line are well-known derivatives associated with the construction of this type of infrastructure [3]. However, there is also a varied catalog of anthropic impacts, such as the generation of mud on the coast, the formation of tombolos and hemitombolos, erosion, and the development of different kinds of diffuse anthropization phenomena associated with the growth of coastal urban areas due to the effect caused by the development of a coastal infrastructure [4,5].
The analysis of anthropic impacts on the coastline has been widely studied from the point of view of the generation of port infrastructures [6,7,8]. Direct and indirect, deterministic and semi-probabilistic, etc. approaches to the dynamics of the coast are usually used [9,10]. These approaches focus their analysis of the impacts on sedimentary dynamics on models developed from climatological or endogenous variables of the design of the port infrastructure itself, such as fetch, the statistical height of the design wave, the bathymetry, or the orientation of the dikes [11].
This traditional approach from civil engineering often makes it difficult to incorporate other parameters collateral to the port infrastructure itself, with the analysis focusing primarily on the design of the port construction, even if such parameters may be relevant in certain contexts [12,13]. In addition, these usually involve theoretical–practical approaches that are difficult to contrast with reality since the effects of the construction of port infrastructures in the coastal area usually manifest themselves over several years or even decades.
This issue becomes even more relevant given the problem of climate change directly affecting the configuration of the coastline as a consequence of the issue facing coasts of rising sea levels [14]. A phenomenon which, in the geographical context of the Mediterranean Sea (where water temperatures have been increasing rapidly in recent years in the inertia of tropicalization of the climate at a local level), is particularly interesting [15,16,17].
In this sense, the urban context of analysis at a local level, the larger-scale territorial configuration of the area on which the port is located, the land–sea orographic contextualization of the infrastructure or the interrelation with other nearby coastal infrastructures are spatiotemporal parameters that usually acquire a secondary role in the traditional analysis models of anthropic impacts in sedimentary dynamics, when they are not directly ignored [18,19]. For this reason, a different evolutionary approach, multiparametric and based on georeferenced spatial indicators, which will be evaluated over time, is proposed to evaluate these impacts. This type of approach, common in other fields of knowledge [20,21]
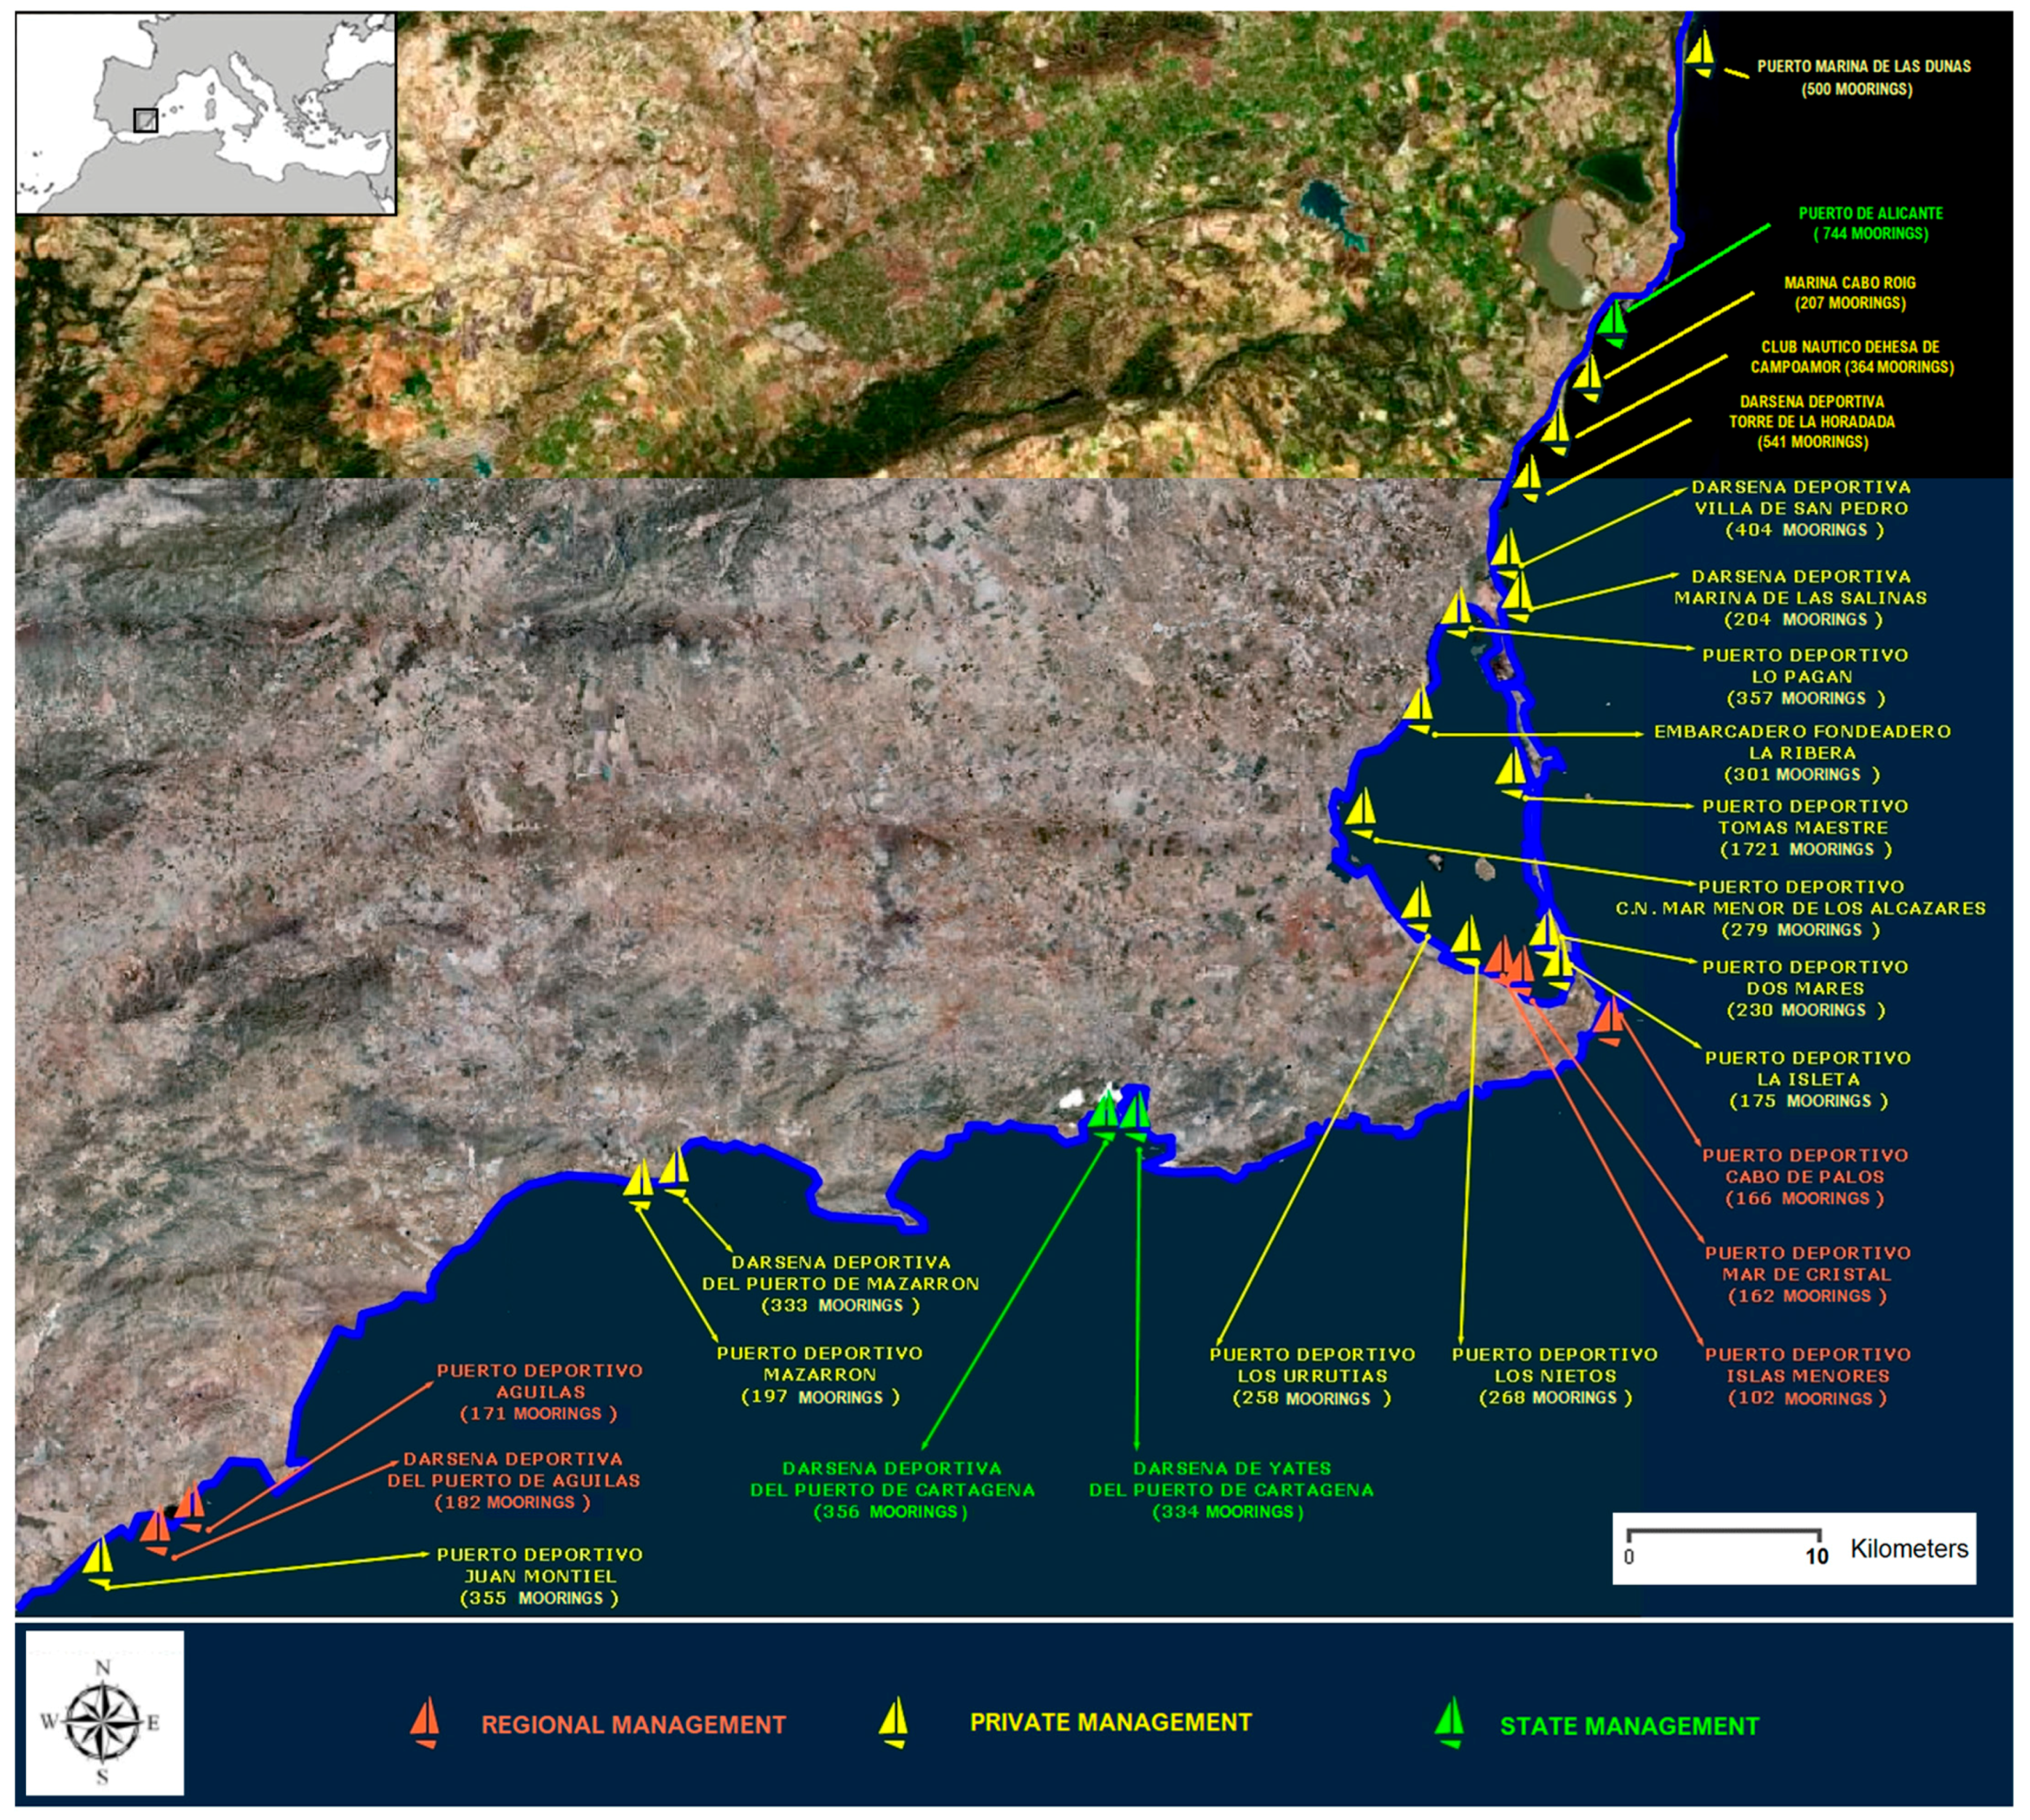
This approach based on spatiotemporal GIS indicators will enable us to carry out work that contrasts with the more direct and short-term reality. Therefore, a number of ports located on the southeast of the Spanish Mediterranean coast were analyzed. These urban port areas offer a varied catalog of boundary conditions, alternating different port construction typologies, locations, and geographical orientations, a form of insertion on the coastline or interrelation with the urban fabric. Based on the observed evolution of the littoral space over the last 50 years, the existing correlation between the different configuration parameters of the urban port areas and their effects on the surrounding coastal environment was analyzed for the south-eastern Mediterranean coast of Spain in order to determine which spatial and territorial parameters may govern these effects.

2. Study Area and Methodology

2.1. Study Area

The selected study area was the Region of Murcia, located on the southeast of the Spanish Mediterranean coast. This strip of about 300 km includes seaside areas from Alicante, Murcia, and Almería provinces with a varied catalog of different coastal configurations. This area includes the Mar Menor, a coastal lagoon of 170 km2 with an average depth of 4–5 m, and La Manga, a 20 km-long highly urbanized sandy bar that separates the Mar Menor from the Mediterranean Sea [22]. The territory has a heterogenous shoreline with a high number of areas altered by port infrastructures. The study area is this coastal strip with 25 port areas and marinas managed by public regional or state authorities or private companies through maritime concessions (Figure 1).
This territory has suffered a varied catalog of anthropic issues in its coastal area, so we could find port areas with different boundary conditions [23]. In relation to the level of insertion on the coastline, we found port infrastructures of a traditional configuration with a dike and counterdike generating a space on land reclaimed from the sea (e.g., San Pedro del Pinatar marina), ports with their dock completely integrated within the land space such as the dock in Cabo de Palos and island-type ports such as Los Nietos marina located in the marine environment (see locations in Figure 1).
With regard to the marine environment, two well-differentiated areas were analyzed: One is located in the Mediterranean Sea, where the waves are a determining element in the configuration of the port without having the impact of an oceanic climate. The other is the port areas of the Mar Menor, with nine marinas where the limited wave action is not usually the main determining element in designing their configuration. The Mar Menor coastal lagoon is especially interesting as it has become a highly urbanized area during the last decades along its coastal perimeter with a varied catalog of port configurations and coastal elements that alter sedimentary dynamics, such as dikes or dredged communication channels with the Mediterranean Sea (see Figure 2).
Regarding its anthropic interaction with other closer coastal dynamics impacts, we found ports located at the mouths of channels or rivers, such as Guardamar de Segura in Alicante; ports that have required dredging the land or a channel, such as the ports of La Isleta or Tomas Maestre; and ports generated almost naturally by a bay such as Cartagena.
Finally, regarding the existence of spatial interaction with the urban fabric, we found a wide variety in the cases analyzed. Some ports are fully integrated into urban environments, such as Lo Pagan or Águilas; some ports are partially integrated with non-urbanized areas or beach areas, such as Mazarrón; and other ports are only surrounded by non-urbanized or even environmentally protected areas, such as San Pedro del Pinatar. These four parameters served as the basis for shaping our methodological proposal.

2.2. Methodological Framework

By considering the characteristics of the study area described in the previous section, a methodological GIS-structured framework was proposed. First, the parameters mentioned before were categorized through qualitative indicators of the characteristics of the port boundary conditions.
Subsequently, some georeferenced indicators of the different effects that have been detected in the spatiotemporal analysis carried out in the study area over the last 50 years were assessed, and hypotheses regarding possible correlations were introduced.
Finally, a geostatistical analysis was carried out in which the existing spatial correlations between the different combinations of qualitative indicators and the configuration from the spatial indicators of effects in the coastal environment was established to understand from a spatiotemporal perspective which parameters govern the effects from the port infrastructures in the urban coastal environment of this study area.

2.2.1. Spatial Indicators of Port Areas Configuration

The parameters analyzed are described below:
  • Index of insertion level on the coastline ILC;
This parameter measures the level of territorial insertion of the port area on the coastline. It is quantified using the following formula:
I L C = F ( x , y ) H ( x , y )
where F ( x , y , z ) is the land surface occupied by the port dock area and H ( x , y , z ) is the total surface occupied by the port dock area both on land and at sea.
The index is classified into three levels. The high level is assigned to those port areas that are mainly generated in the land zone (ILC > 80%) with little need to gain space from the sea. The middle level is assigned to those port areas that are partially located in the land area (20% < ILC < 80%), with their dock only occupying some excavated space behind the coastline. The low level is assigned to those port areas whose dock has been generated mainly on reclaimed land beyond the coastline (ILC < 20%).
  • Marine environment ME;
This parameter analyzes the maritime variable, dividing it into two cases. On the one hand, the ports located in the Mediterranean Sea where the waves significantly condition the constructive design of the port infrastructure. On the other hand, the ports are located in the Mar Menor, where the waves scarcely influence the configuration of the port area.
  • Anthropic interaction with the closer coastal dynamics AICCD;
This index reveals the existence of nearby coastal elements that can alter the sedimentary dynamics or generate alteration synergies with the port infrastructure. Based on consultation in the scientific literature on sedimentary dynamics [25,26,27], three levels were considered: high, medium, and low. The existence of communication channels between the Mediterranean Sea and the Mar Menor, mouths of relevant riverbeds, dredging works, and the presence of other ports less than 500 m away is considered to be high interaction. The existence of groynes or other port infrastructure within a radius of 2 km or the existence of non-relevant wadis is considered medium interactions. Lastly, small dredging works or the conditioning of nearby wadis and the presence of breakwaters in a radius of more than 2 km and less than 5 km are considered to be minor interactions.
  • Spatial interaction with urban environment SIUE;
This parameter measures the degree of integration of the port structure in the neighboring coastal urban fabric in the case of ports located in urban areas. Therefore, the relationship between the connection perimeter of the port space and the rest of the urban fabric is measured in proportion to the ratio of surfaces of the land port surface with regard to the total port area (including the water surface from the port dock). Evidently, in the case of ports where there is no adjoining urban space, the value of this parameter is zero. The formula for measuring this parameter is as follows:
S I U E = L U L P × S U S P
where:
  • LU = land contact perimeter port-town (m), LP = remaining port perimeter (m);
  • SU = sum of land urbanized surfaces in the port (m2);
  • SP = sum of total port surface (m2).
For this parameter, a high level of integration is considered to be a value greater than 0.8, a medium level is a value between 0.8 and 0.2, and a low level is a value less than 0.2.

2.2.2. GIS Spatiotemporal Indicators on the Impact on Coastal Territory of Port Infrastructures

In order to analyze the effects of the different coastal infrastructures, three georeferenced spatial analysis indices were generated. These indices address the different impacts that the transformation of the coast may generate on the environment due to the construction of port infrastructures from a spatiotemporal perspective. Each of the indices is detailed below, explaining how they are measured:
  • Index of short-term sedimentary imbalance generation ST-SIG;
    This parameter measures the level of alteration that the construction of a port provokes in the coastal dynamics in the 10 years following its execution. For its quantification, the aggregate sum of erosion and accumulation phenomena in the adjacent beach line is calculated in a radius of action of 2 km around the infrastructure that has been built. It is, therefore, an analysis of the level of transformation of the coastline in the short term as a direct result of the execution of the infrastructure.
    For its quantification, three assessment thresholds were established. A low-level imbalance was established as the permanent average alterations of the beach line of up to 2 m (this may be a phenomenon of growth or of regression) in a longitudinal strip of coastline of at least 100 m. These average alterations were established as average-level imbalances under the aforementioned conditions for values between 2 and 5 m. Lastly, high-level imbalances were established as the average alterations in said conditions for values greater than 5 m or, in the case of erosive processes, when the recession of the beach line affects built-up or urbanized areas;
  • Index of deferred direct affection to the shoreline LT-SIG
    This index measures the imbalances generated in the coastline with respect to its original situation over a period of at least 30 years. For its quantification, the aggregate sum of erosion and accumulation phenomena in the adjacent beach line is calculated in a radius of action of 5 km around the built infrastructure. As it is a phenomenon studied in the long term and in a broader radius of action, it is a level of alteration motivated by transformation phenomena that may not be due solely to the port construction.
    For its quantification, three assessment thresholds were established. A low-level imbalance was established as the permanent average alterations of the beach line of up to 5 m (this may be a phenomenon of growth or recession) in a longitudinal strip of coastline of at least 100 m. These average alterations were established as average-level imbalances under the aforementioned conditions for values between 5 and 10 m. Lastly, high-level imbalances were established as the average alterations in said conditions for values greater than 10 m or, in the case of erosive processes, when the recession of the beach line affects built-up or urbanized areas;
  • Index of generation of socioeconomic imbalances GSI
    This parameter measures the socioeconomic impacts that the construction of a port causes in the coastal space in the 10 years following its execution. The index refers to negative collateral effects of an economic or social nature generated by the construction of the port. Economic alterations of the beach line are understood as leading to, for instance, erosion phenomena that reduce the space for tourist use or that affect homes. They can also be associated with environmental or social problems, such as the appearance of unwanted sludge due to stagnant water phenomena on the coastline.
    For its quantification, three levels of impact were established, including a series of cases in each of these levels following Table 1. The detected impact was established as the one reached by the most serious case.

2.2.3. Geostatistical Analysis

In order to analyze the level of spatial correlation between the two types of parameters described in the previous sections, a geostatistical analysis was carried out using ArcGIS Pro 10.5.0 (ESRI Corporation, Redlands, CA, USA) and GvSIG Desktop 2.5.1 (GvSIG Association, Valencia, Spain) software. This analysis enables us to understand from a spatial perspective what the behavior patterns of the impacts suffered by the coastal territory over time are based on the various characteristics of the creation and transformation of the port areas.
In order to achieve this, firstly, a simplification process of the representation of the GIS analysis indicators of the coastal perimeter was used. The territory shaped as a continuous element needs to be “discretized” as a structure composed of square cells of different sizes depending on the work scale to numerically evaluate the spatial correlation between port area configuration and shoreline impact indicators (see Supplementary Material). GIS indicators of shoreline impact is established by using historical GIS cartographies of land transformation for the years 1956, 1981, 1997, 2009, and 2020. The detailed cartography data are summarized in Table 2.
In order to implement this simplification, the spatial behavior of the coastal perimeter, which in reality acts as a continuous distribution phenomenon, the representation of its behavior patterns was discretized into cells. Outputs were tessellated using ArcGIS and GvSIG routines. For the geostatistical analysis performed, the tessellated polygons have a size of 100 × 100 m in the local analysis scale and 1000 × 1000 m in the territorial analysis scale to allow an understandable visualization of the results (when a tile has a surface area in two or more categories, it is assigned to the category with the most surface area present).
Once the distributions at the indices of port area configuration and spatial coastal transformations were obtained, we could evaluate the possible spatial correlation between them using geostatistical methods. This analysis enables us to assess the extent to which the transformations made by human activity on the coastal perimeter of the territory have influenced the impacts and transformations over the last decades. The spatial relationships were parameterized and assessed through the use of Global Moran’s I [28] and Anselin Local Moran’s I [29] bivariate statistics; both are geoprocessing tools from ArcGIS.
Bivariate global spatial autocorrelation enables us to assess the statistical correlation of a set of geolocated data obtained spatially and the sign of this autocorrelation (positive or negative). Bivariate Global Moran’s I statistic formula is given as I (Equation (3)):
I = n S 0 i = 1 n j = 1 n w i , j z i z j i = 1 n z i 2
where z i is the deviation of an attribute for feature i from its mean ( x i X ¯ ) , w i , j is the spatial weight between feature i and j , n is equal to the total number of features, and S 0 is the aggregate of all the spatial weights of Equation (4):
S 0 = i = 1 n j = 1 n w i , j
The z I -score for the statistic is computed as in Equation (5):
z I = I E [ I ] V [ I ]
where E [ I ] and V [ I ] can be calculated as follows:
E [ I ] = 1 / ( n 1 )  
V [ I ] = E I 2 E [ I ] 2
Global spatial GIS autocorrelation returns three values: Moran’s I Index, the z-score, and the p-value. Given a series of spatial features and an associated attribute, the bivariate Global Moran’s I statistic indicates whether the pattern expressed is clustered, dispersed, or random and its degree of statistical correlation. When the z-score or p-value indicates statistical significance, a positive Moran’s I index value indicates a trend toward clustering, whilst a negative Moran’s I index value indicates a trend toward dispersion. The z-score and p-value are measures of statistical significance which inform us whether or not to reject the null hypothesis. For this analysis, the null hypothesis states that the values associated with features have no statistical correlation.
From this information, we were able to implement, in a geolocated way, the so-called hot and cold points in the mapping through the Local Indicators of Spatial Association (LISA) from Anselin [29]. Each Anselin Local Moran’s I statistic of spatial association I is given as:
I i = x i X ¯ S i 2 j = 1 , j = i n w i , j ( x j X ¯ )
where x i is an attribute for feature i , X ¯ is the mean of the corresponding attribute, w i , j is the spatial weight between features i and j , and:
S i 2 = j = 1 , j = i n ( x j X ¯ ) 2   n 1
where n equates to the total number of features. The z I -score for the statistic is computed as:
z I = I E [ I ] V [ I i ]
where E [ I ] and V [ I ] can be calculated as follows:
E [ I ] = j = 1 , j = i n w i , j n 1  
V [ I ] = E I 2 E [ I i ] 2
For this analysis, the null hypothesis states that the correlation values of two elements are randomly distributed. Thus, the higher (or lower) the z-score is, the stronger the intensity of the clustering of these values is. A z-score near zero indicates no apparent clustering within the study area. A positive z-score indicates the clustering of high values. A negative z-score indicates the clustering of low values. This numerical evaluation will be implemented through GIS mapping to distinguish configuration patterns of high–high clusters (high levels of the configuration index associated with high levels of coastal alteration), low–low clusters (low levels of configuration impact associated with low levels of transformation), and spatial outliers, either high–low (high levels of configuration impact associated with low levels of transformation) or low–high (low levels of configuration impact associated with high levels of transformation).
Therefore, the bivariate statistical correlation analysis between the distribution of different GIS indicators helps us to understand spatially the extent to which the impact of port area configuration has affected the coastal alteration of its shoreline over the last decades in the territory analyzed.

3. Results

This section is organized into two parts. In the first part, the distribution of the different indicators in the coastal strip of the study area was presented in a spatial large-scale aggregated way, differentiating the group of port configuration indicators from the group of space-time impact analysis indicators. In the second subsection, the level of geostatistical correlation existing at the spatial level between these two groups of indicators was evaluated, previously verifying the statistical significance of their spatial distribution. Based on the results obtained, a series of general considerations were outlined at a local scale to be later analyzed in the scientific discussion section.

3.1. Analysis of GIS Indicators Distribution

3.1.1. Port Configuration Indicators

The first and last indicators, ILC and SIUE, show a rather heterogeneous distribution given that they are port design factors somewhat related to the existence of urban areas in the perimeter of the coast (see Figure 3 and Table 3).
Regarding the second parameter, ME, corresponding to the type of existing maritime configuration, the different levels of the grouping of port areas between the Mediterranean Sea and the Mar Menor should be observed, with it being much higher in the case of the Mar Menor. The density factor was, therefore, a spatial variable to consider at the local level since it is possible that the effects derived from the impacts of the port areas on the beaches are partially conditioned in this area by the proximity between ports.
Finally, the third parameter, AICCD, related to the existence of neighboring coastal infrastructures, shows a rather dispersed distribution depending on the coastal boundary conditions of each area, with a significant intensity of these elements being observed in the Mar Menor area.

3.1.2. Spatiotemporal Impact Indicators

When analyzing the distribution of impacts in the study area as a whole, it is interesting to observe how the distribution of sedimentary imbalances of the beaches in the short and long term does not generally have similar behavior patterns (Figure 4 and Table 4). Different phenomena of erosion and retraction of the coastline are observed in areas near the ports, with this aspect being especially complex in La Manga, in the Mar Menor, and in the southern area of Alicante. Additionally, it would appear that those areas that are more susceptible to sedimentary issues are those in which the nearby ports are integrated into the land area.
In general, regarding imbalances in sedimentary dynamics, a clear differentiation can be established between the results obtained in the Mar Menor and the Mediterranean Sea for homogeneous cases; the phenomena observed in the Mediterranean Sea were far more relevant than in the Mar Menor at a comparative level for similar cases (see Figure 4 and Figure 5). There was also a clear difference between the behavior patterns of the ports located in the Mar Menor and the behavior patterns of those located in the Mediterranean Sea (Figure 6). In the case of the Mediterranean Sea, the construction of the port has usually produced a process of accumulation to the north as opposed to one erosion to the south. However, in the Mar Menor, this north–south pattern does not appear, and the effect is more heterogeneous.
Another relevant issue is that, in this case, an important correlation is observed between the level of occupation of the lands reclaimed from the sea and the intensity of the impacts on the adjacent sedimentary dynamics. If we expand the scale of work, we observe that in ports created exclusively on land reclaimed from the sea, such as Campoamor or Los Nietos marinas, a high impact is observed (regardless of the type of impact observed, an issue that we will address later). In ports partially inserted into the coast, such as Tomás Maestre or Lo Pagan marinas, this impact is of a medium nature, and in ports built inland, such as Cabo de Palos or La Isleta ones, the impact is practically negligible in many cases (see Figure 5).
Finally, another interesting issue is the distribution of the socioeconomic imbalances generated. Although there is no generalized pattern in relation to most of the indicators concerning the level of cohesion of the port space with the urban fabric, this parameter does have an impact on the level of generation of problems of a socioeconomic or social nature. In island-type ports, the quadrangular configuration generates a greater tendency for the formation of tombolos and, therefore, mud than the circular or octagonal formation. Nevertheless, because of its heterogeneous casuistry, this is analyzed in greater detail in the discussion section.

3.2. Geostatistical Evaluation of GIS Indicators

3.2.1. Verification of Statistical Significance of the Phenomena

In order to verify that we are witnessing a spatial distribution of the indicators derived from a real physical phenomenon and not the consequence of a set of mostly random events, an analysis of the geostatistical autocorrelation of the spatial patterns of each of the static and dynamic indicators was carried out; the results obtained are shown in Table 5.
Although the cases are not homogeneous for all the indicators, it can be seen how all of them reach statistical significance in their distribution, to a greater or lesser extent. Low p values and medium–high z values confirm the rejection of the null hypothesis of a random distribution. Positive values for the statistic also show a global aggregative trend of all indicators. As expected, higher values are observed in the coastal impact indicators than in the port configuration indicators (except in the logical case of the maritime configuration indicator) since the distribution of the port configuration patterns does not necessarily respond to a spatial phenomenon in a territorial key, which is clearly so in the case of the distribution of the impact indicators. Therefore, the indicators focused on the analysis correspond to real distribution phenomena associated with verifiable physical phenomena.

3.2.2. LISA and OLS Analysis

Finally, to numerically assess the intensity of the spatial statistical correlation between the port area configuration and coastal impact indicators, OLS regression models based on a bivariate LISA analysis are shown in Table 6.
The results numerically corroborate at a global level several of the issues that had been observed from a spatial point of view in the previous section. From the point of view of sedimentary impacts, some correlation was observed with ILC the level of occupation of the marine space and the level of interaction with the SIUE coastal urban fabric (note that the value of this last index is analyzed in absolute value, its total value being negative in the numerical calculation obtained by the definition of the index used). However, the SIUE index of spatial interaction with the urban environment presented a much lower spatial correlation for all cases than those carried out for the ILC index of insertion level on the coastline. The maritime boundary conditions also have an influence because, although similar levels of correlation are observed in aggregate in parameter b, at a spatial level, a higher level of intensity is verified in the Mar Menor area. On the other hand, from the point of view of the impact indicators, the behavior of the indicators related exclusively to sedimentary dynamics in both cases presented a greater capacity for explanation (R2adj: 0.43/0.40) than those of the socioeconomic impact (R2adj = 0.22). These seem to be explained with apparently simpler models based on fewer variables than those related to the socioeconomic effects; these possibly respond to over-heterogeneous causes, which are more complex to address in numerical analysis. The lower values in the AIC analysis for the GIS indicators of these first two indicators (22,765.5 and 23,116.7) in relation to the third (25,325.7) corroborate this hypothesis.
On the other hand, from the point of view of spatial distribution, we can observe the repetition of certain behavior patterns at the level of statistical correlation between the port configuration indicators and the coastal impact indicators. In particular, the hypothesis of the strong statistical correlation between the port areas with the greatest occupation of the sea surface and the greatest alterations of the adjacent beaches in the short and long term is confirmed. However, we also noted interesting variants, such as the existence of a strong connection between the lack of integration with the urban fabric in cases with higher levels of impact and in a close spatial context (2 km radius of influence).
We also observed how in the cases related to the parameters of interaction of the port area with other coastal infrastructures, although in most cases alterations of the coast are not detected in the short term, an important statistical correlation is appreciated from the spatial point of view in the long term. Finally, it is interesting to see how some variables of hot and cold spots converge at the spatial level in some cases. One such example is the case of the high statistical correlation levels of ports located in the Mar Menor, with typologies of the absence of insertion in the urban fabric (and therefore high occupation of the coastal space) and generally high impact levels, as shown by the HH hot spot distributions when these three variables converge. This issue is addressed in greater detail in the scientific discussion section.

4. Discussion

The study carried out proposes an analysis of the coastal and port infrastructures from an unconventional point of view. The impact on the sedimentary dynamics of the alterations generated by the construction of dams and port structures is well known from the point of view of civil engineering, as can be verified in the specific scientific literature (see, for example, [30,31,32]). However, an issue that is not usually addressed is said the impact from the spatial point of view of the territory where it is located, considering both the territorial variable of the elements that interact on the coast with the port itself and the temporal evolution of these impacts in subsequent years, and evaluating to what extent these impacts are more or less conditioned by the different configuration parameters of the constructed port area.
The contribution of the analysis of these impacts goes beyond the discipline of the study of sedimentary dynamics ([33]) and addresses the economic field, given that the beaches are usually the main tourist asset of coastal settlements. In addition, it transcends even into the concept of social justice since they are also an element of public enjoyment that symbolizes the democratization of citizens’ access to the public resources of a country more than most resources. The outcomes of the research may therefore confirm existing conclusions of previous studies in the field (see, e.g., [34]) albeit from a different point of view. In light of the results obtained, it is important to observe how the effects generated by port infrastructures often exceed the geographical scope of the port environment itself or are significantly manifested decades after the construction of the port itself, affecting public beach spaces or private homes in a temporary context in which it is already more difficult to diagnose the cause–effect relationships of the problems evidenced, and consequently find an accurate solution.
The management of beaches usually follows non-cross-disciplinary technical criteria [35,36]. It is common to decide on the construction of marinas and port infrastructures based on environmental parameters of sedimentary dynamics and the actions of regeneration of the sand line based on geomorphological criteria [37]. The absence of a heterogeneous and multidisciplinary approach in this field of research, traditionally only focused on maritime and civil engineering, makes it difficult to implement issues such as the concept of transgenerational social justice in public spaces, traditionally in high social demand in developing countries, such as beaches. In this context, this new mixed approach developed using spatiotemporal multivariate indicators may prove very interesting when conducting a holistic analysis of the vulnerability and resilience potential of our beach areas.
Developed countries traditionally suffer from high levels of territorial anthropization on the coast, with beaches being a fragile asset of high economic value; thus, this further highlights the need for the proposed approach. The current authorization of private uses in the public space of the beaches is usually controversial, but for environmental reasons rather than for a question of social justice. The long delay in time of cause–effect relationships in this coastal kind of phenomena implies that on many occasions, criteria of social justice are not accurately applied to political decisions when altering the coastal territory. In Mediterranean countries today, it is common to find social controversies in coastal areas concerning phenomena whose current effects are the outcome of actions developed during the 1970s, 1980s, or even the 1990s.
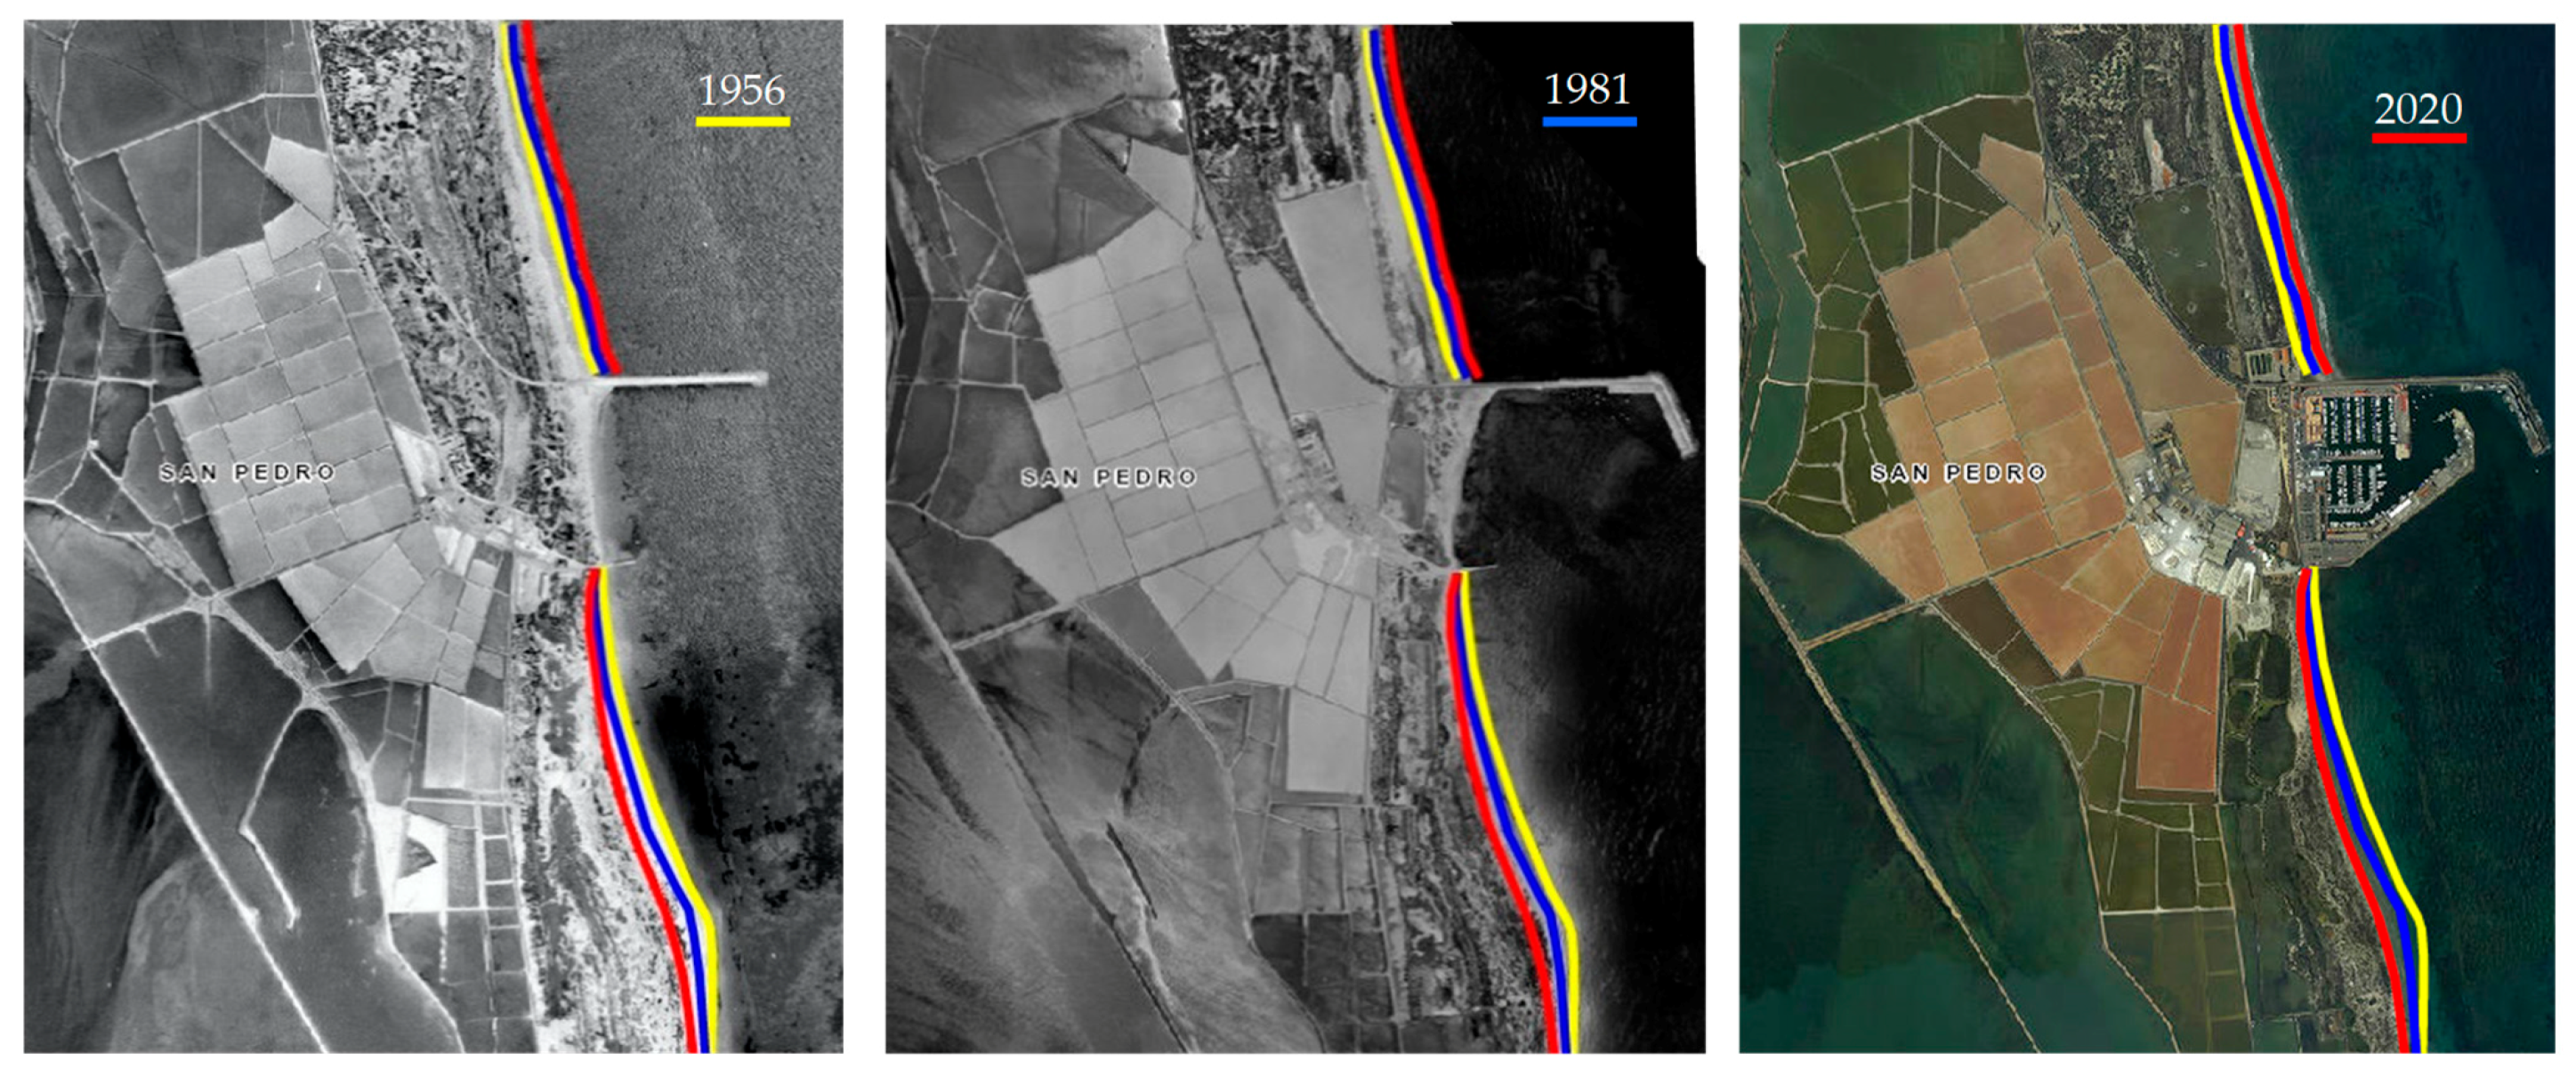
In the present study, we observed several cases in this regard. For example, in the case of the San Pedro del Pinatar marina (Figure 7), we found widespread controversy on this topic: the sedimentary imbalances generated on the nearby beaches because of the construction of a marina. The marina was built in the 1980s on land mostly reclaimed from the sea in a slightly urbanized environment, being close to a regional park with various environmental protections. This is usually the least controversial type of social case, given that the impact of the construction of the port infrastructure does not usually directly pose harm to individual users. The economic benefit produced in the tourist field during the last decades due to the construction of the port following its construction should be compared with the socioeconomic damage that the phenomenon of the retraction of the adjoining beaches has produced in the decades after its construction.
It is possible that, in this case, said value can even be considered quantitatively offset by the tourist benefit since, as a public resource, the adjoining beaches still maintain (despite their evident shrinkage) sufficient width for tourist enjoyment (another question would be whether we include in this equation the possible indirect environmental impacts that this reduction in the beach line may have at an environmental level on the nearby protected space). Nor does it directly generate private damage to third parties, as there has been no impact that devalues the value of its real estate assets since it is a barely urbanized area. Therefore, this case, despite having a similar background, is usually the most difficult to address from the point of view of the administrations because there is no type of social pressure that requires its correction or even reversal.
However, coastal infrastructure developments do not always have boundary conditions of this nature that make the impact of altered sedimentary dynamics relatively innocuous at a social or economic level. If we analyze other urban environments of our study, we can find somewhat more controversial cases. In these cases, differentiating responsibilities over time and the establishment of measures to restore social justice is usually more complex as we find ourselves in heavily anthropized coastal territories with a higher number of variables causing impacts. In such a context, a multidisciplinary approach based on multivariate spatiotemporal GIS indicators becomes even more necessary.
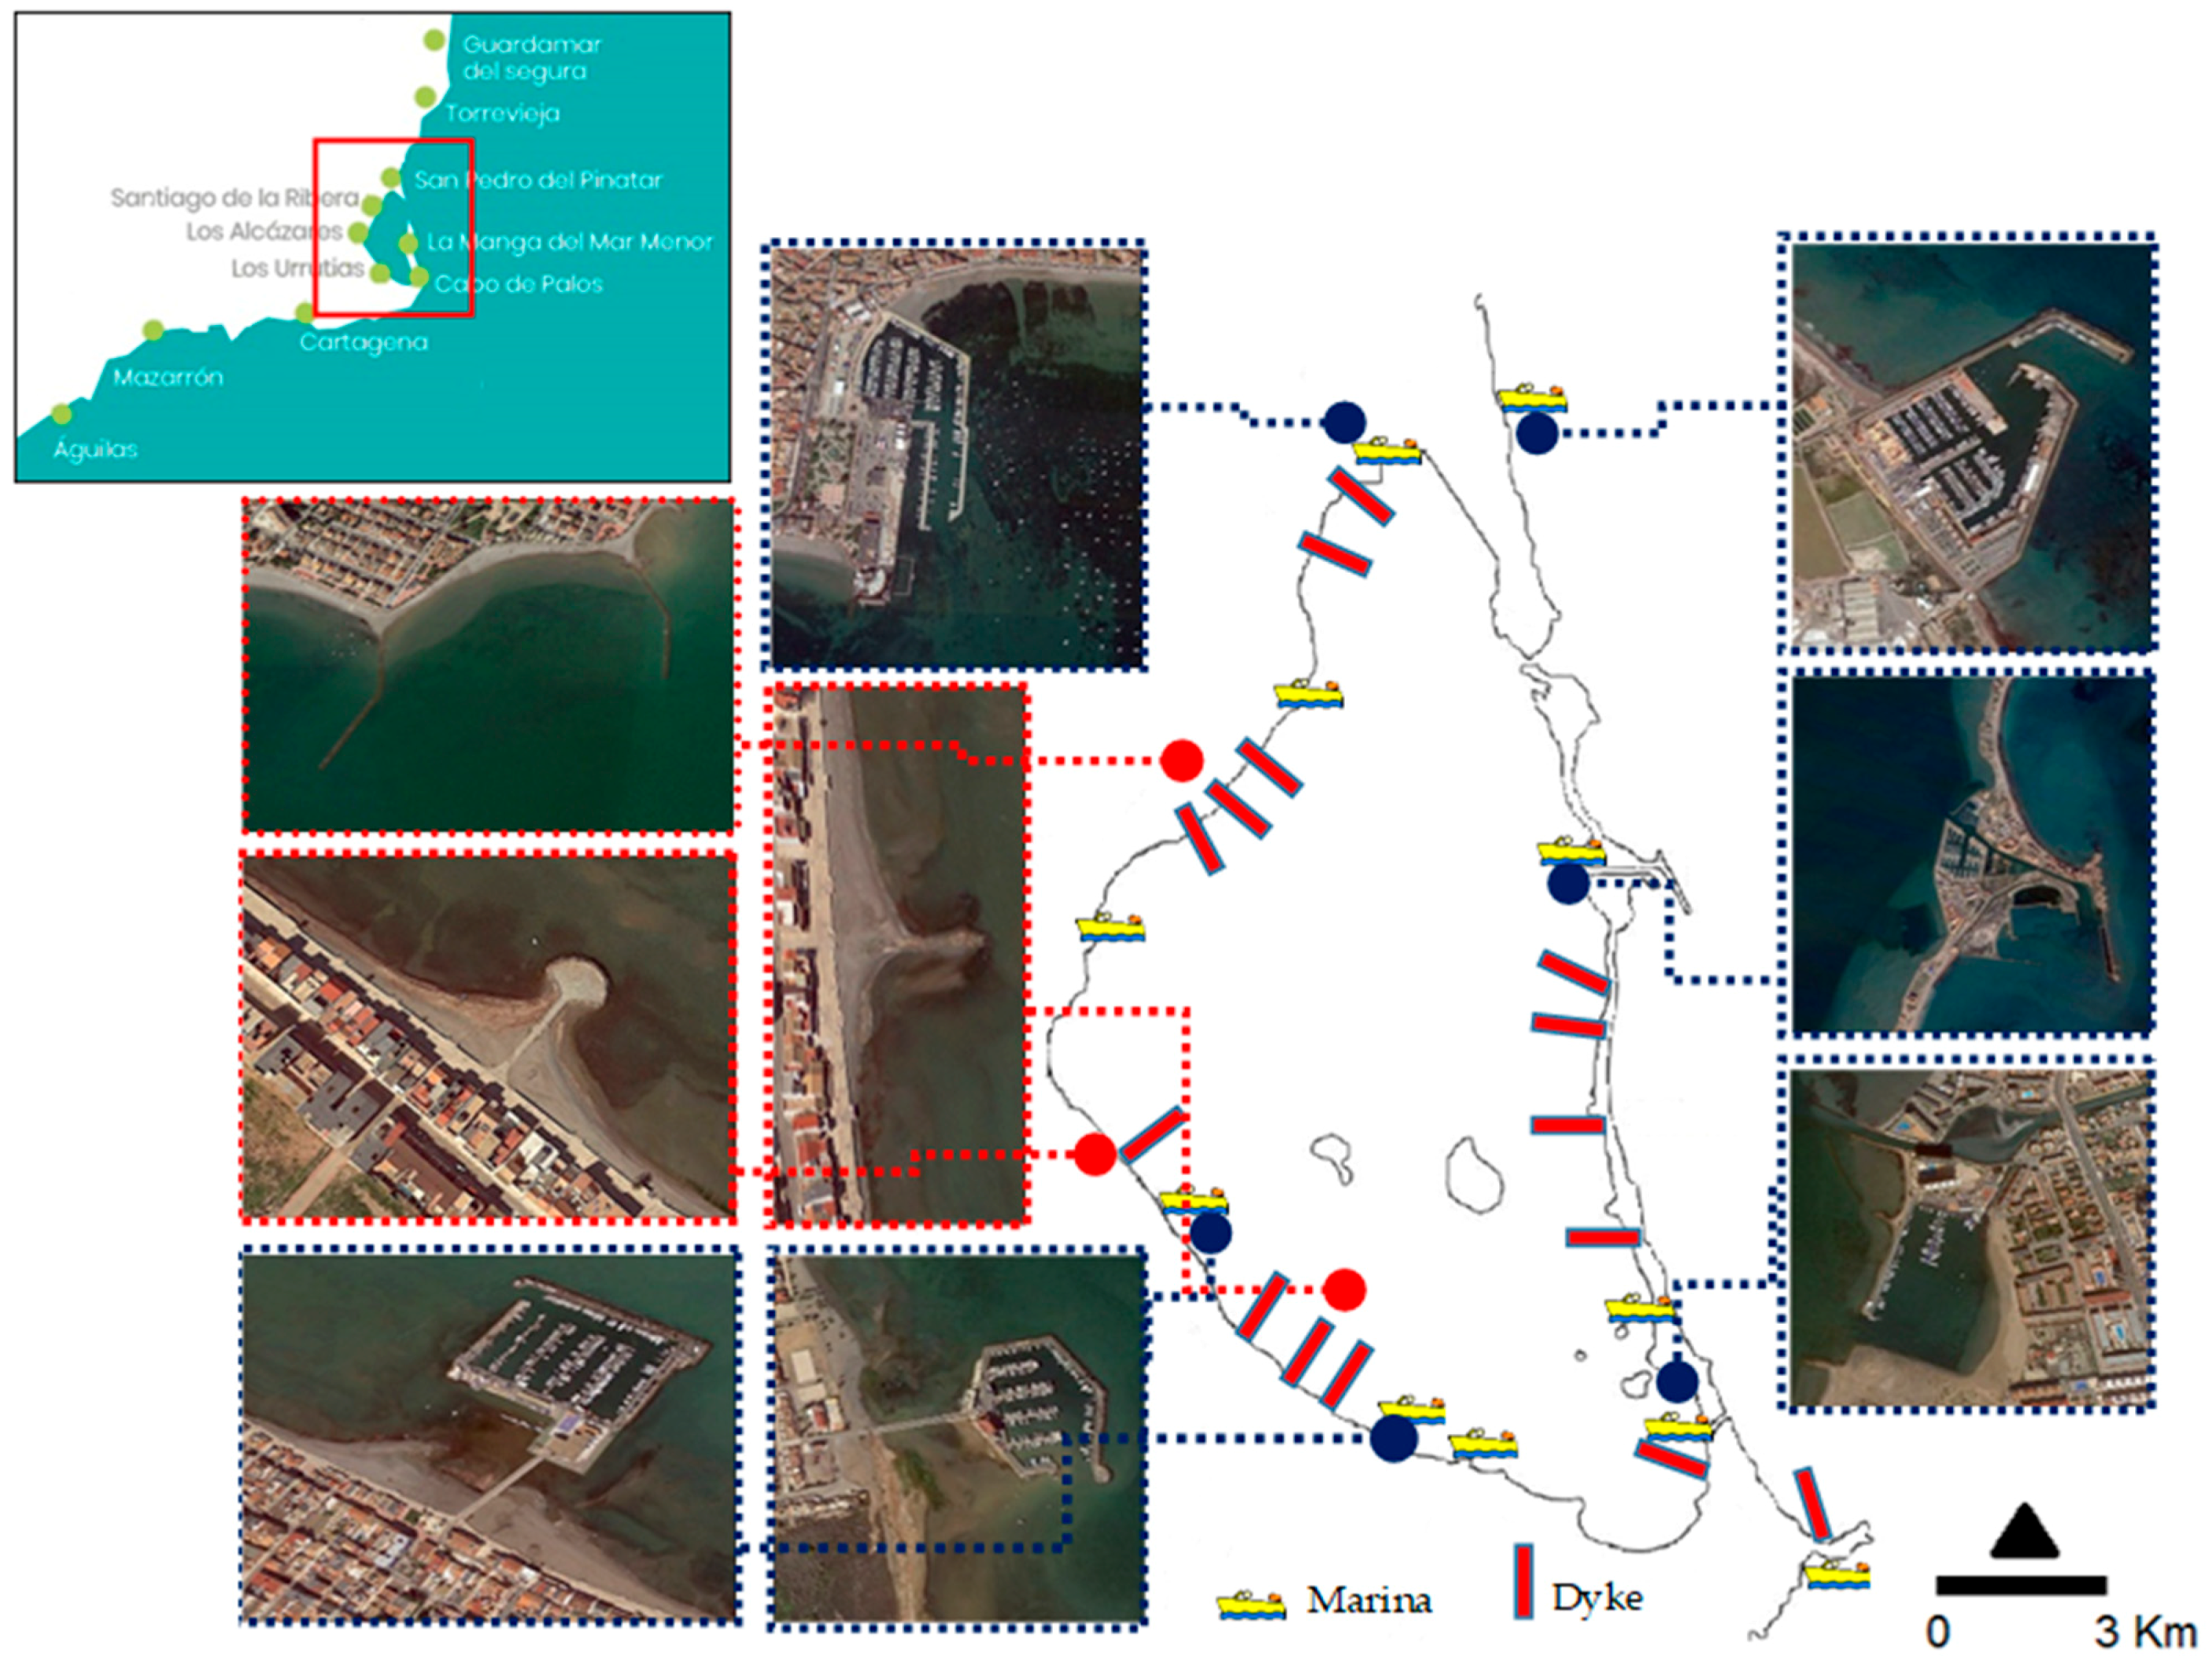
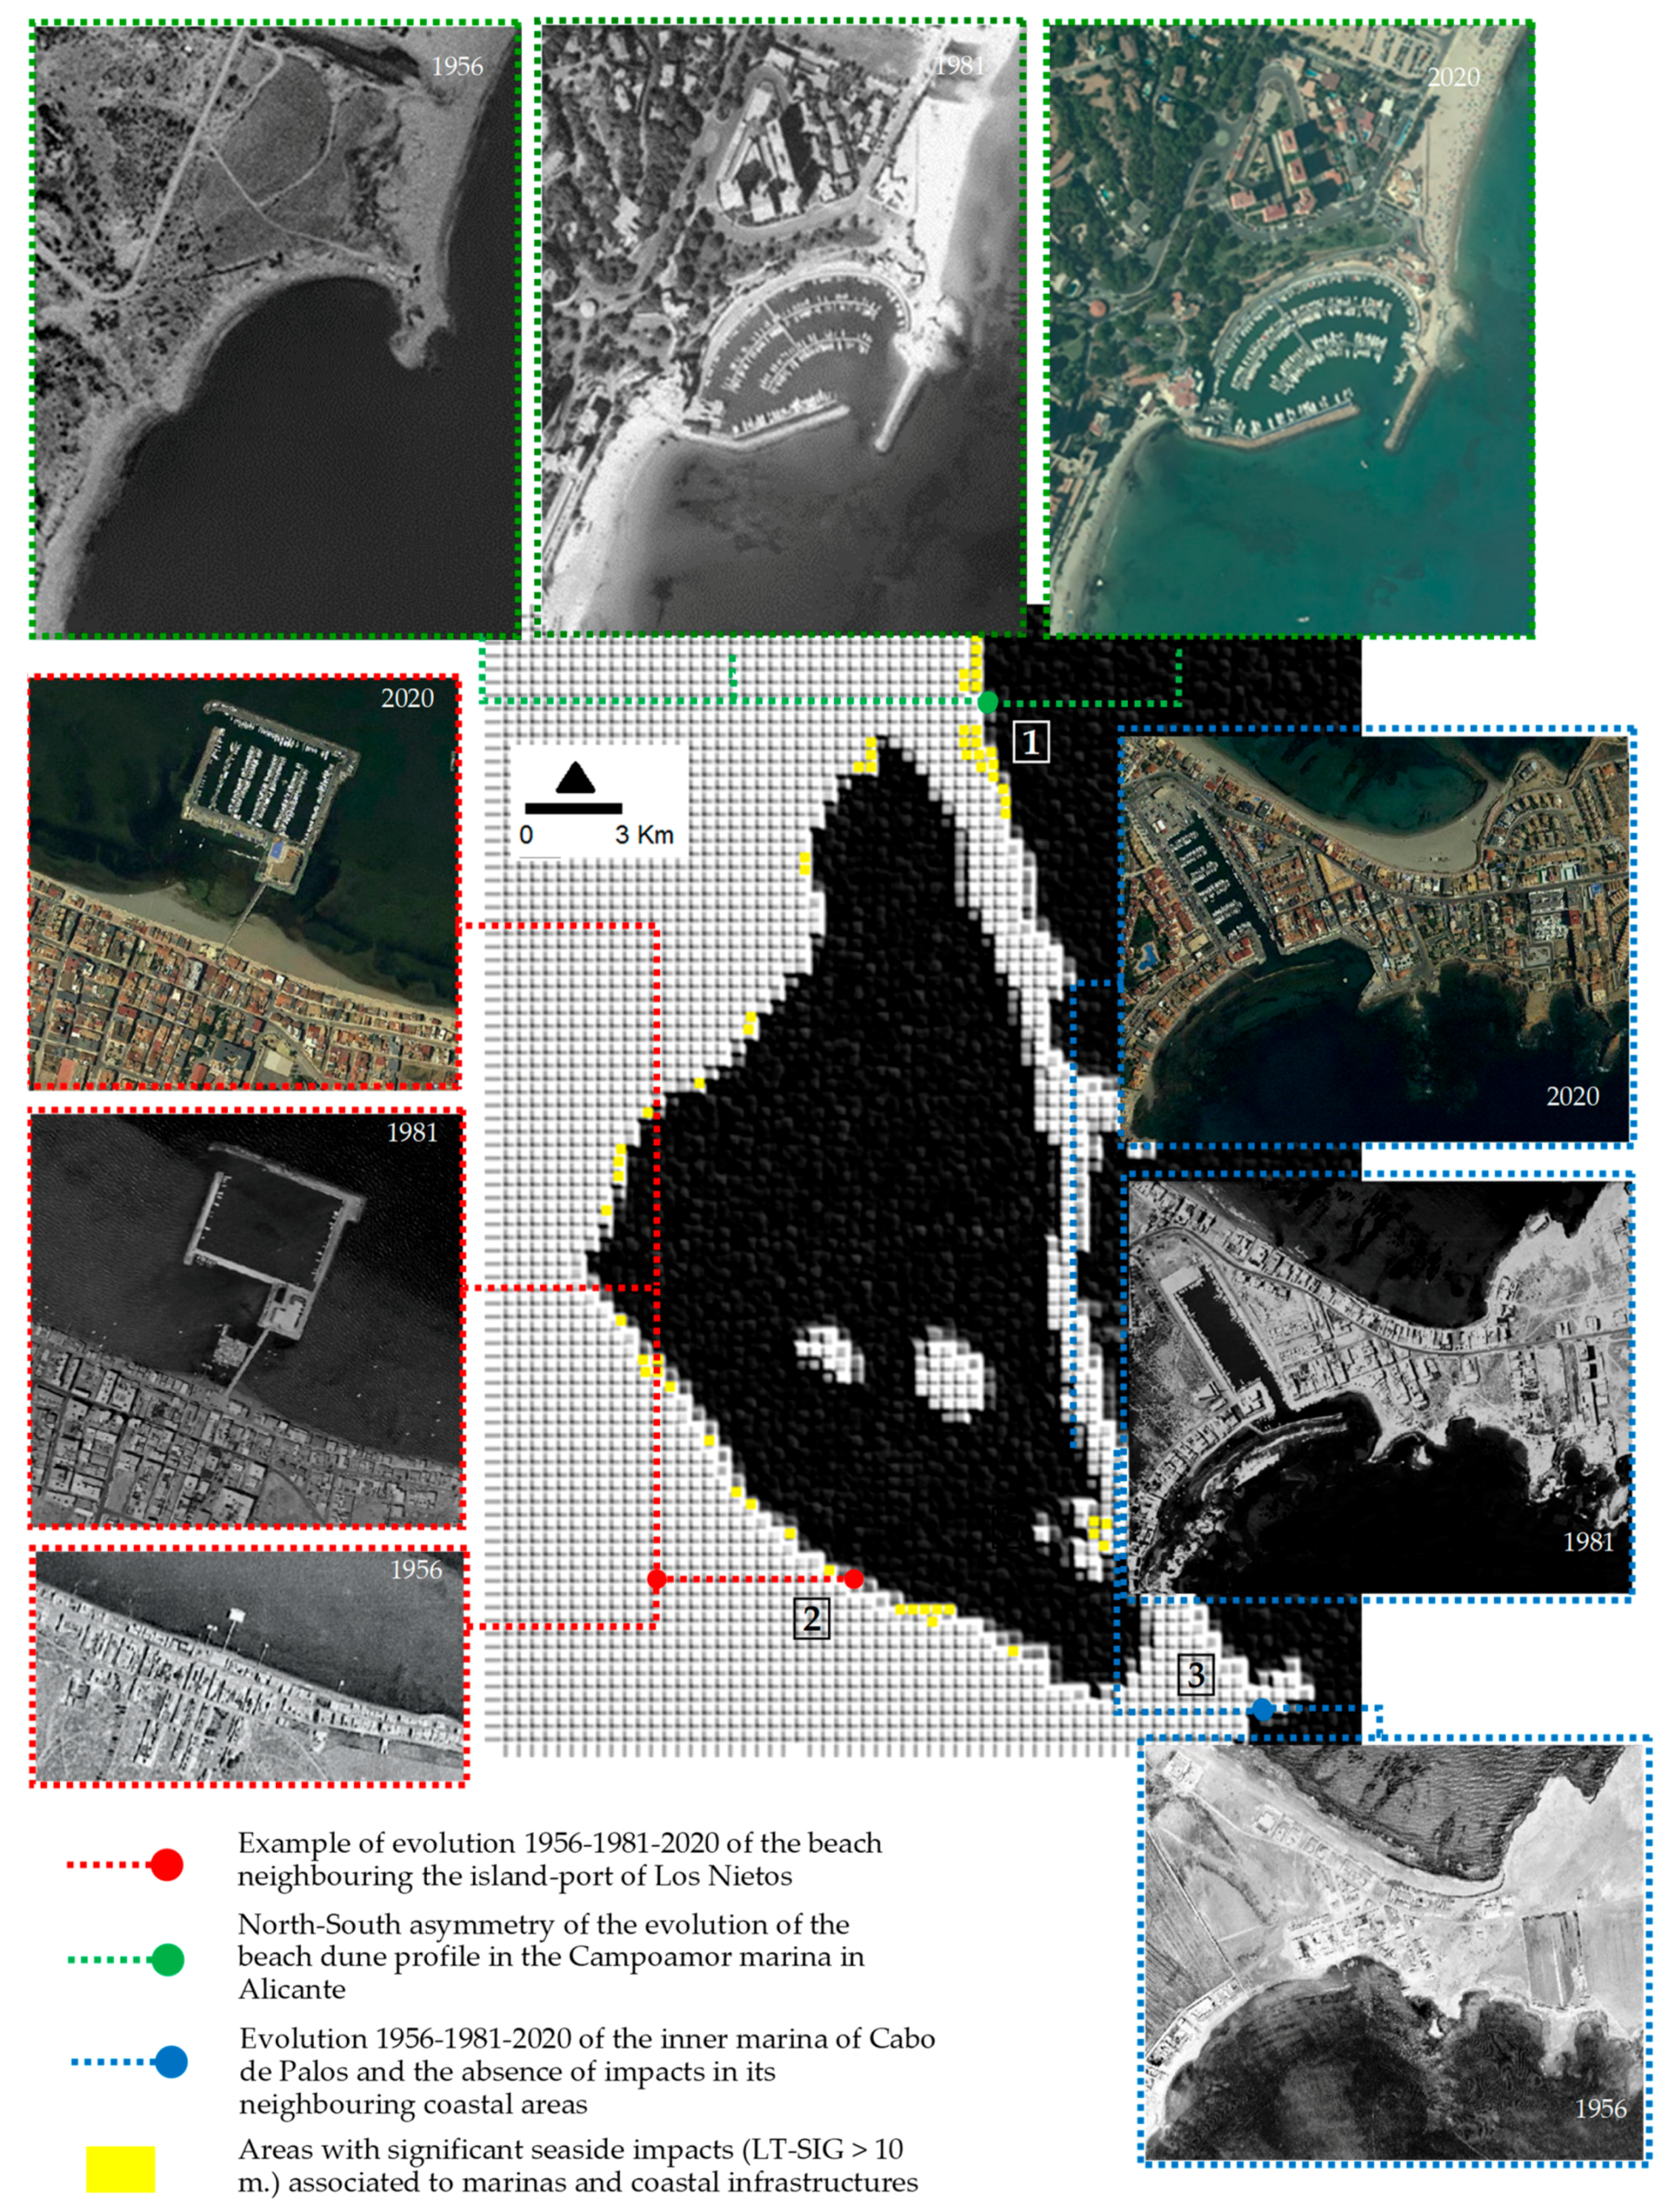
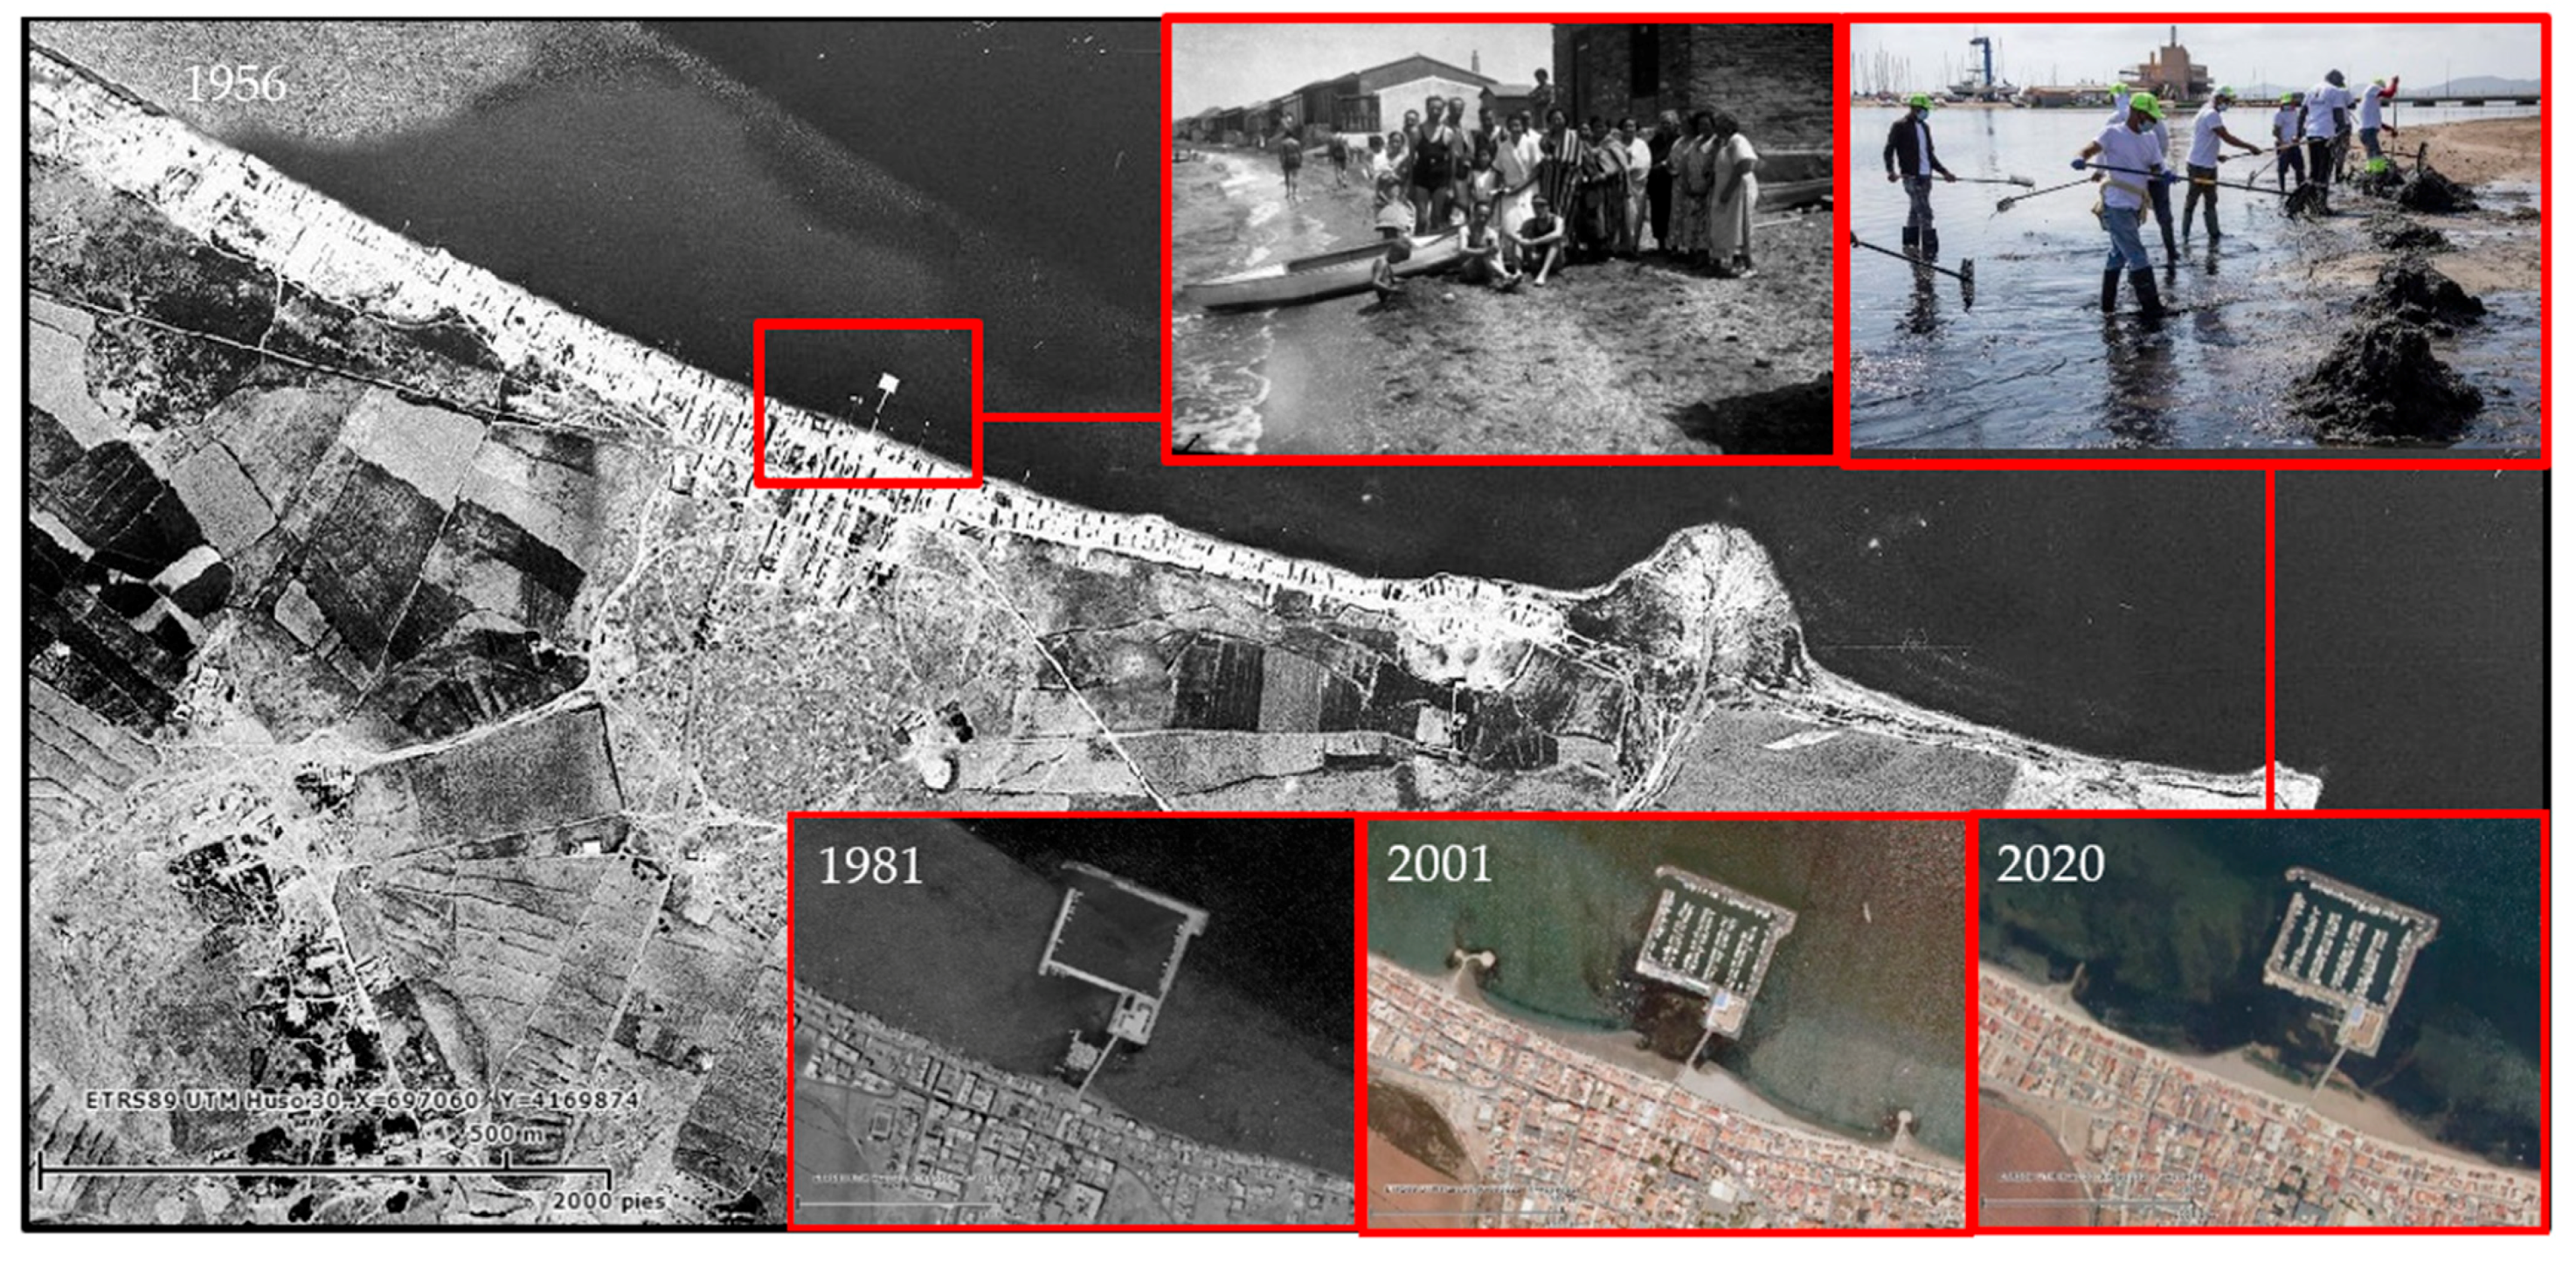
Two descriptive cases of this problem can be found in the urban settlements analyzed from the Mar Menor. The first one is Los Nietos town. The arrival of tourism in the 1970s led to the transformation of this fishing village, which had a small beach. Breakwaters were implemented to widen the beach line, and an island-type port (therefore built entirely on the surface of the sea) was built to shelter leisure boats without hindering the sedimentary dynamics of the area. Nevertheless, several decades later, the result is that the new beach has become a large accumulation of mud that generates complaints from all the people in the town, forcing the authorities to invest in actions to regenerate the beach and withdraw the sludge every year, although no clear diagnosis of the problem was established (Figure 8).
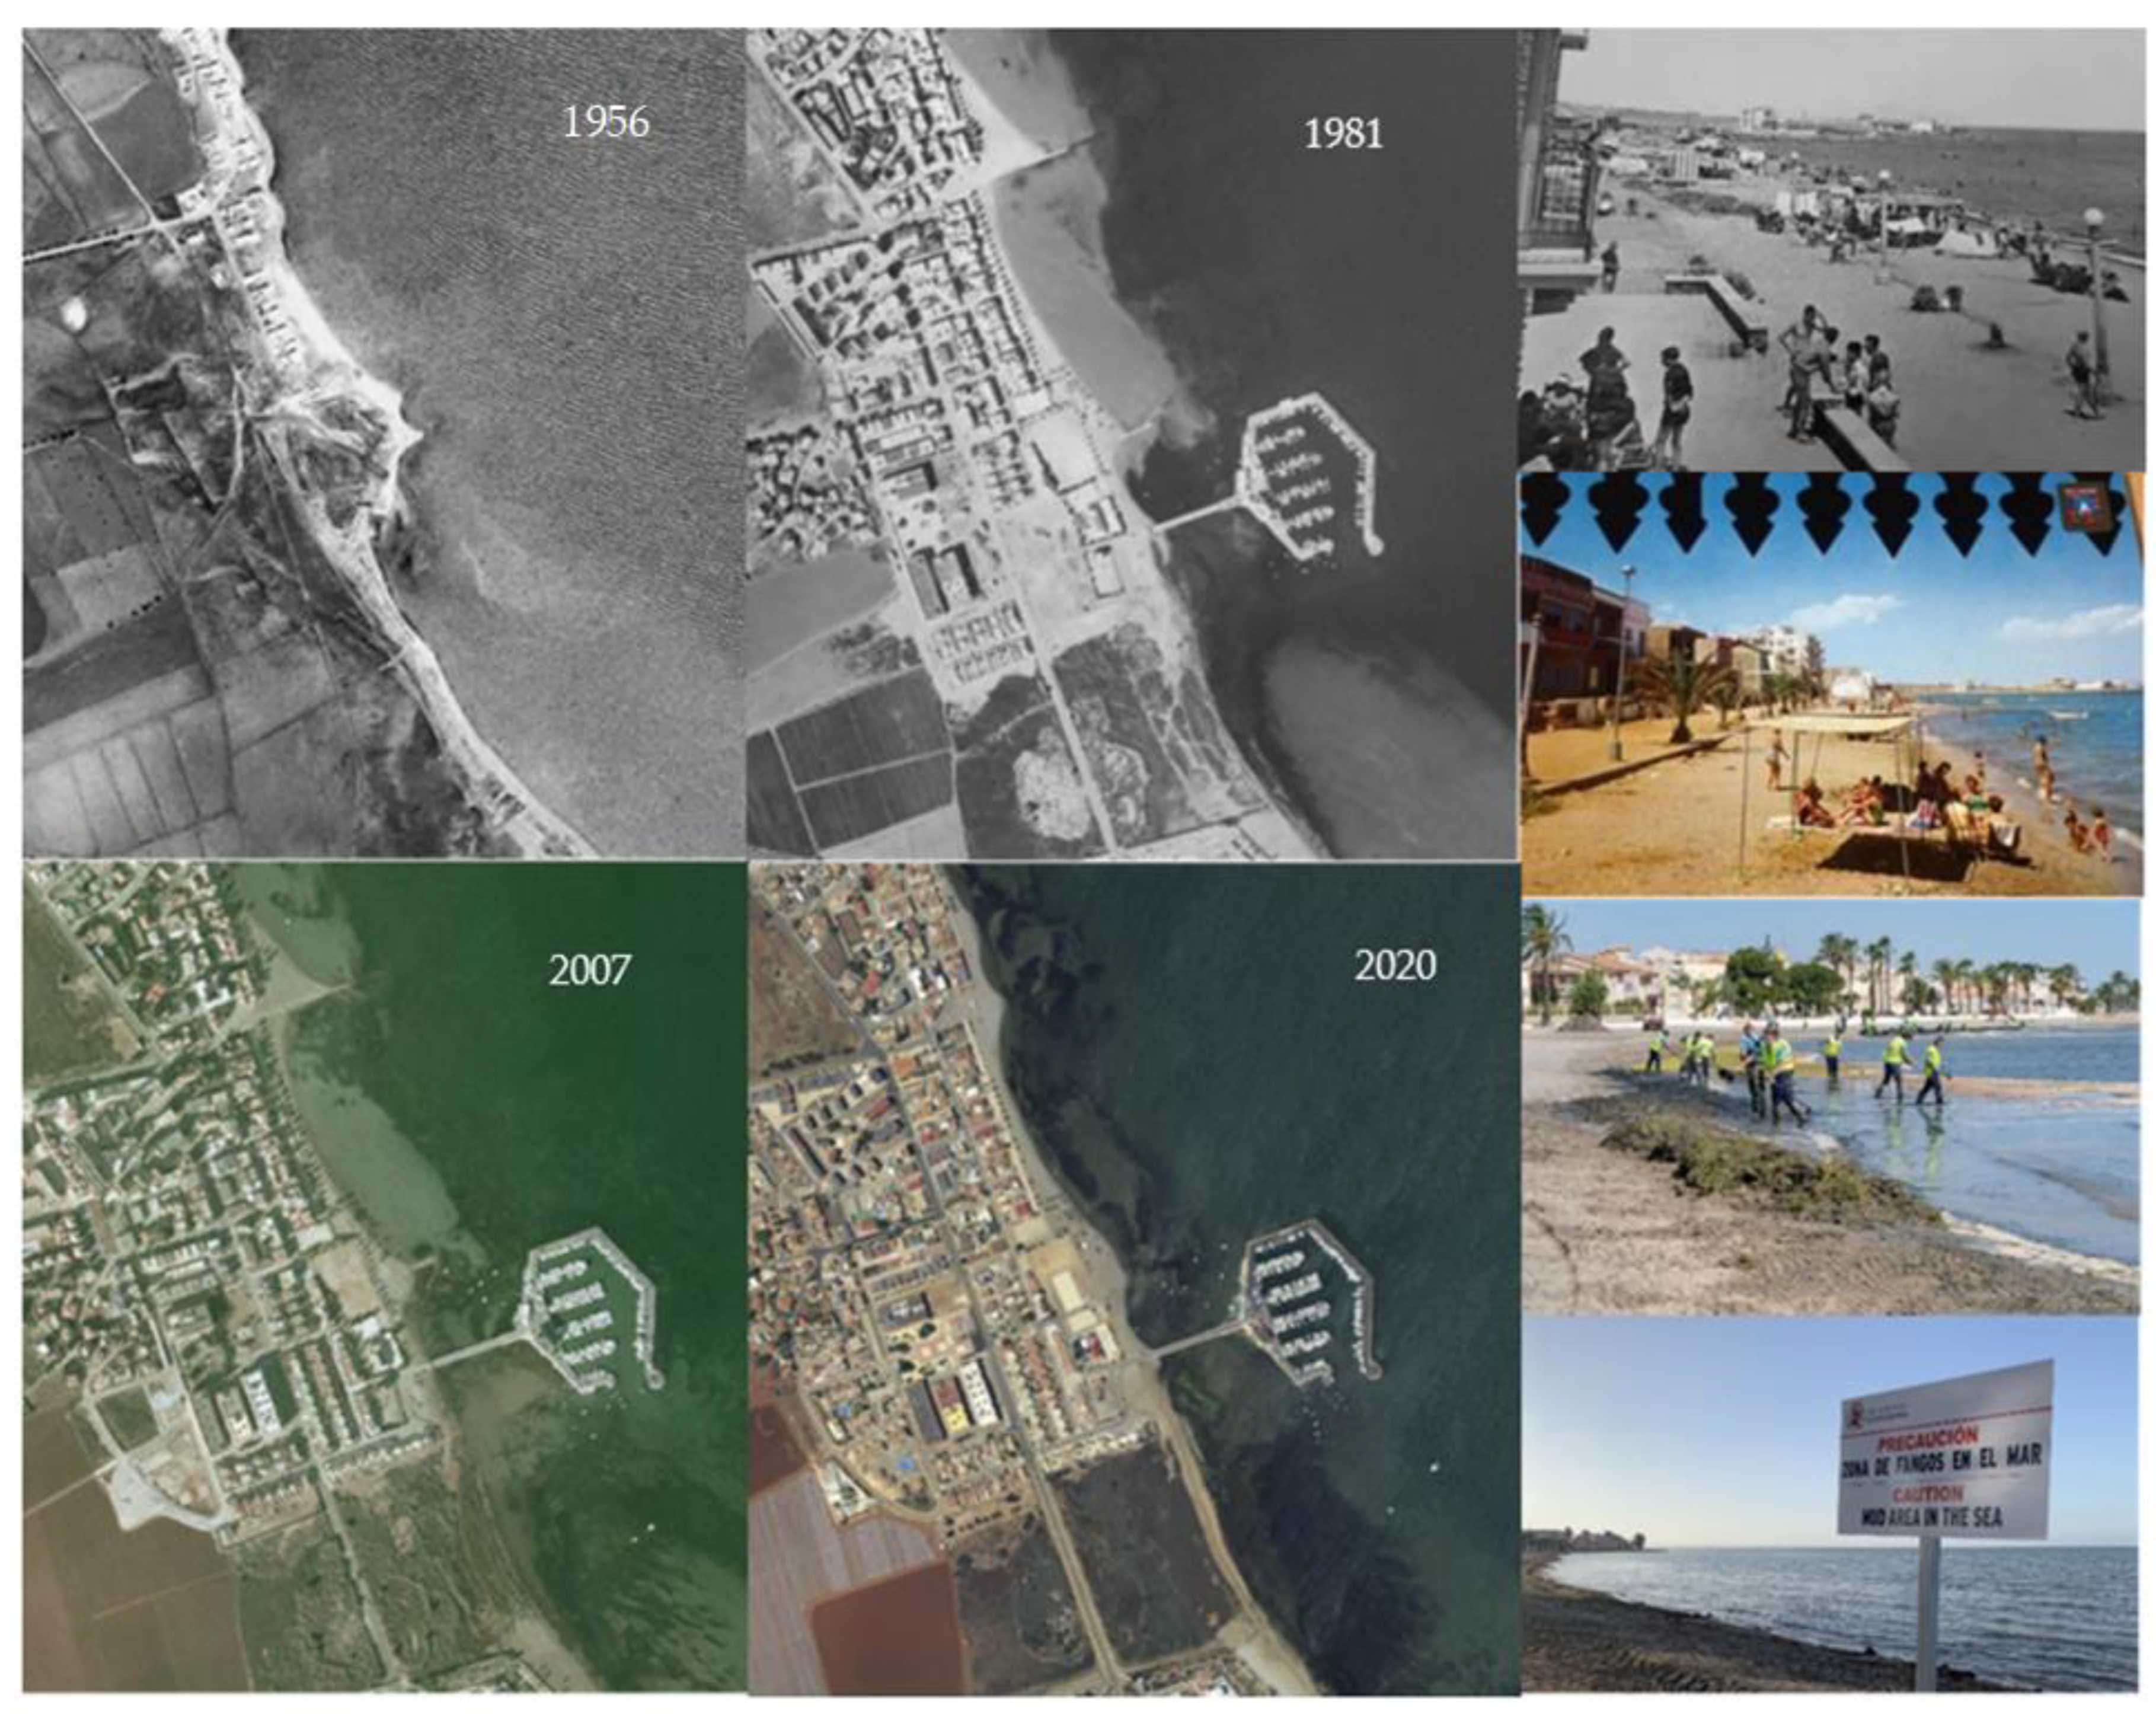
A similar case was observed in the town of Los Urrutias (Figure 9), where the construction of several dikes to gain beach space, combined with the construction of another island-type port with characteristics quite similar to the previous one, has led to the creation of a beach with a clearly unbalanced longitudinal profile over the years. This was not the only problem since, as in the previous case, there was an intense phenomenon of sludge generation that led to numerous social protests. In this case, fortunately, the elimination of the coastal dikes made it possible to recover the sedimentary balance of the beach, although the problem of the mud has not disappeared.
In both cases, there has been evident economic damage to the inhabitants of the area, which can be seen numerically, for example, through the fall in the real estate value of homes. Said value has now dropped by around 40% of its value of 15 years ago (although this may also be due to other issues such as the negative campaign that the Mar Menor is currently suffering as a whole). In any case, these are two clear examples of direct impacts both from the public point of view due to the socioeconomic damage caused by the reduction in the enjoyment of the beach, as well as from the private point of view due to the quantifiable loss of real estate value of the local houses.
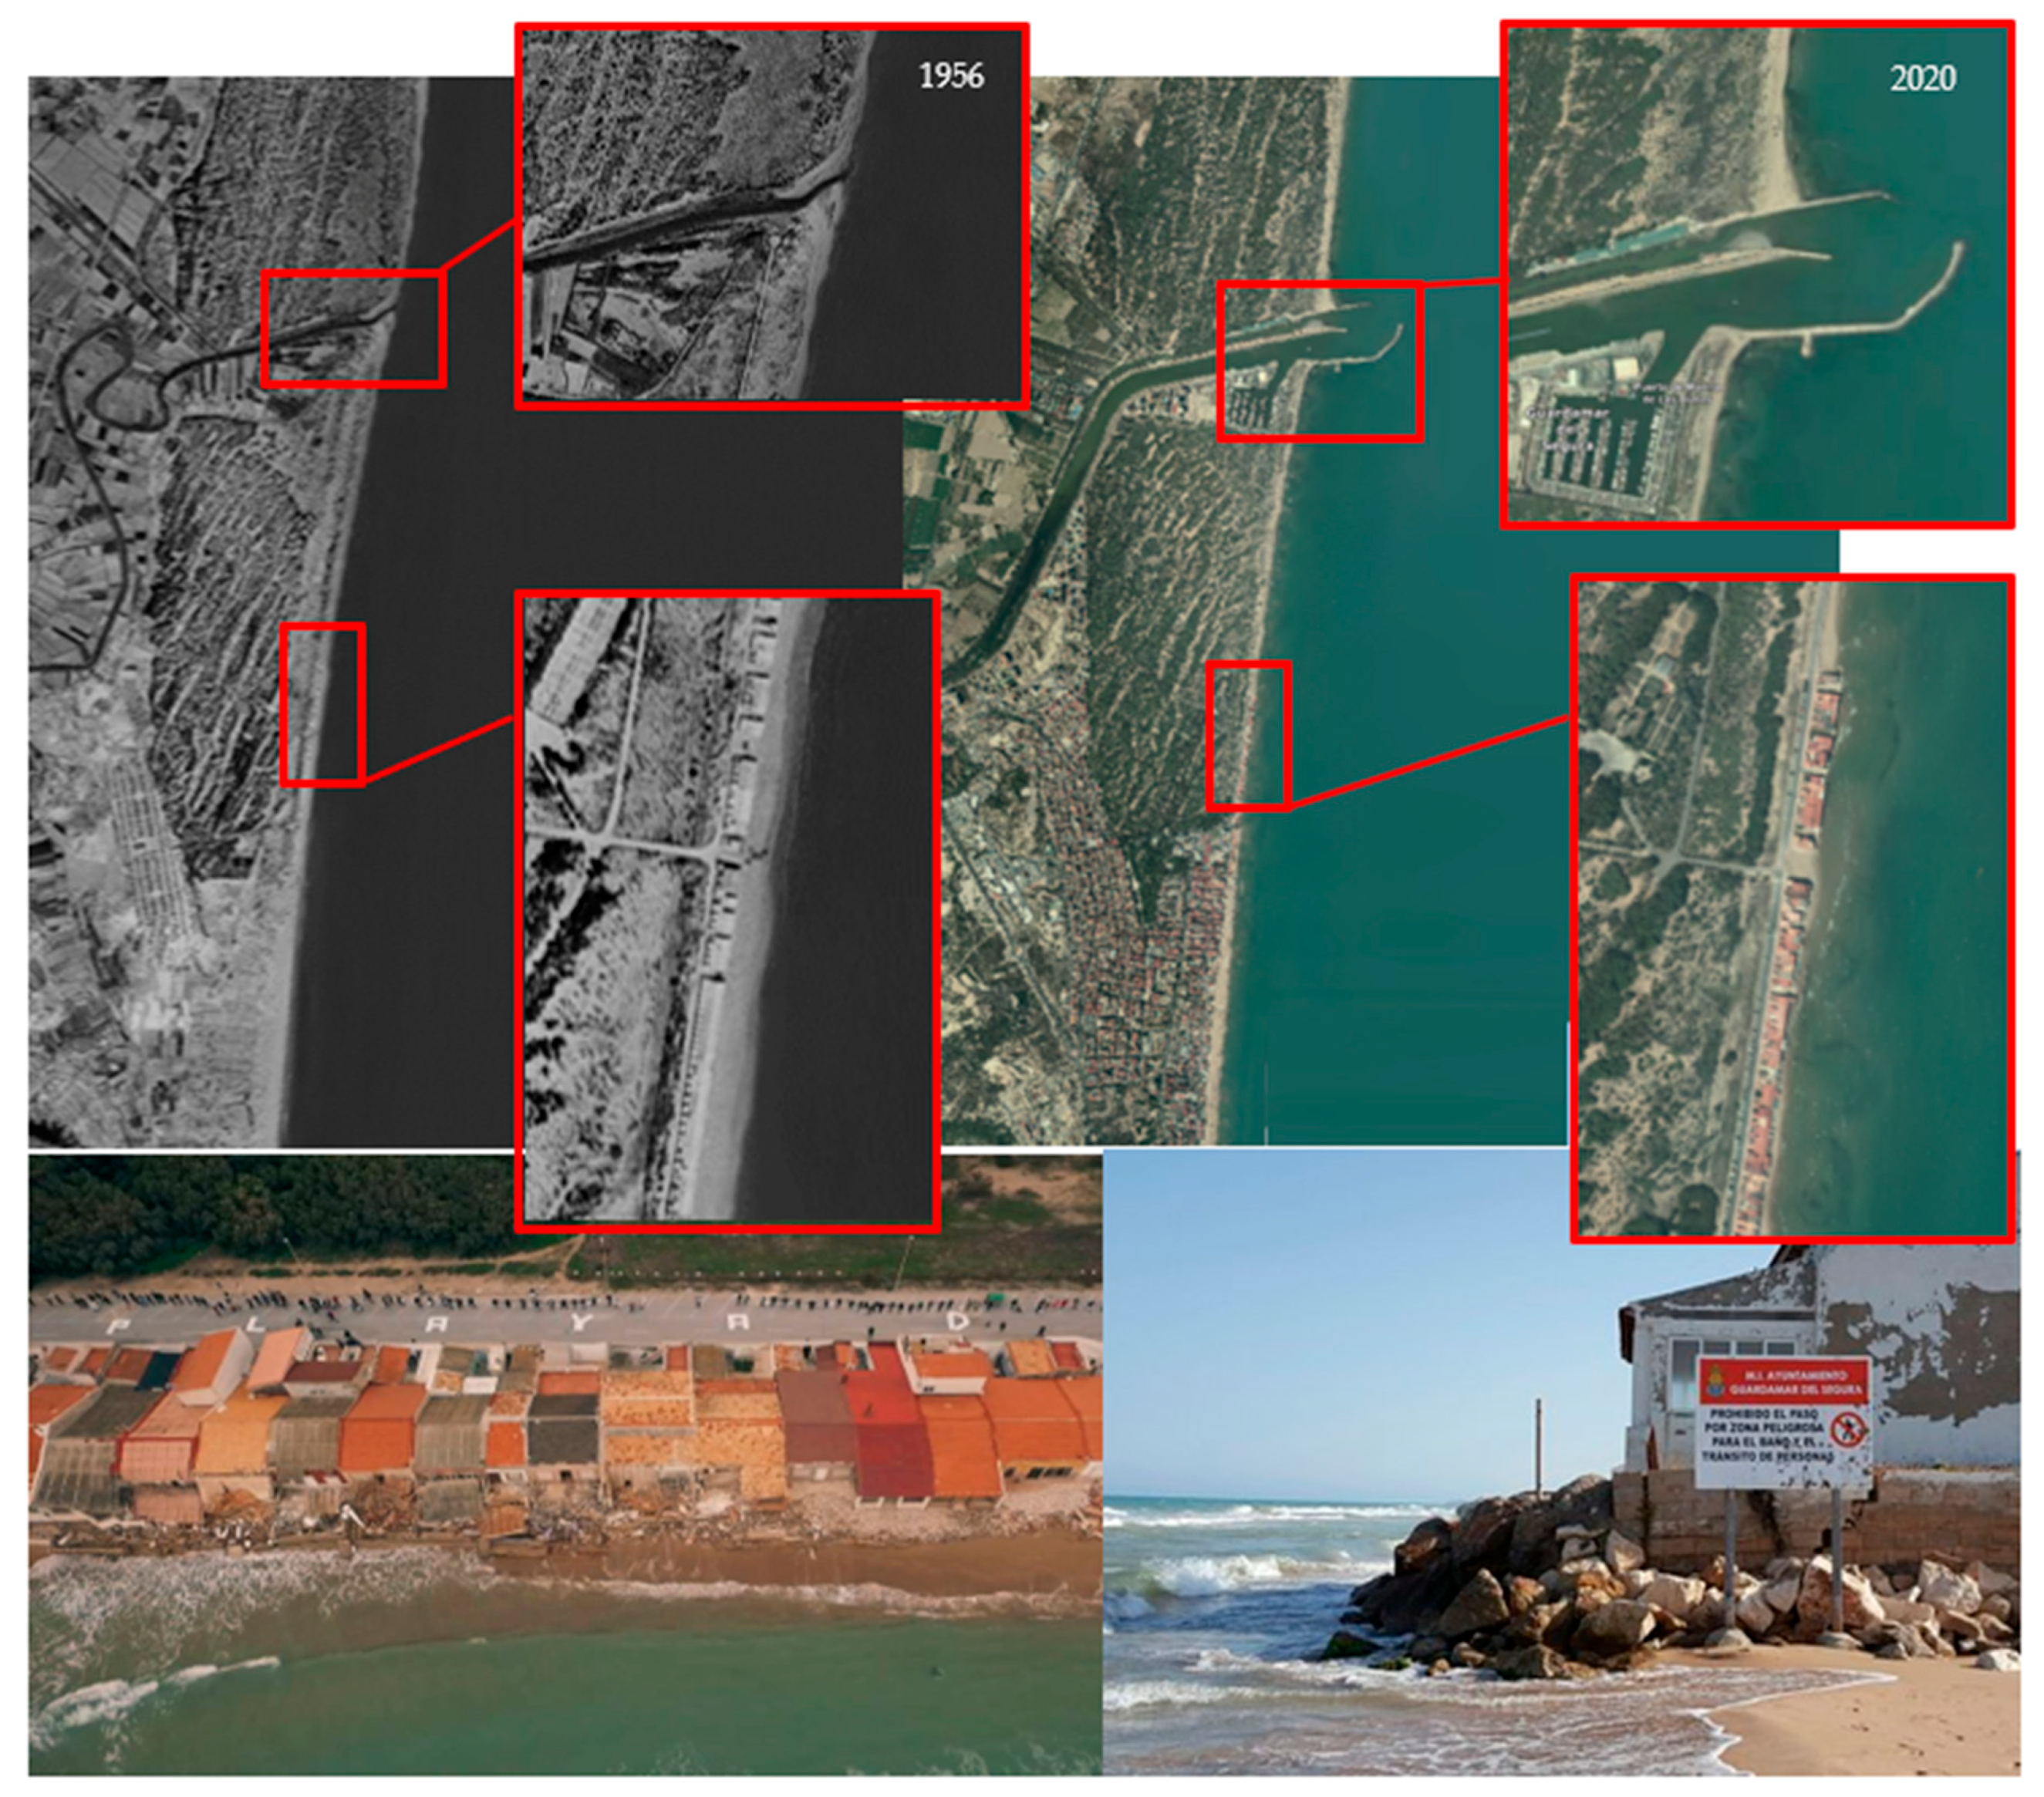
The problem of altering coastal dynamics can have extreme social implications if it reaches the point of making the beach disappear. A case with strong social consequences is that observed at the mouth of the Segura River on the Mediterranean coast of Alicante province. The dredging and widening of the river mouth in the 1980s, together with the construction of two breakwaters, created an important beach north of the mouth of the river, which is now quite visited by tourists. Nevertheless, the loss of these sedimentary contributions was made to the detriment of the southern area, where there was a coastal town built in the early 20th century. This phenomenon has caused a strong retraction of the beach line to the south in the last three decades, leaving those houses built over a hundred years ago exposed to the tide. This puts the authorities in an administratively complicated position in which there is no win–win solution given that the port and coastal infrastructures were built many years ago with the permission of public administrations, predictably forcing the demolition of homes in the near future (provoking numerous neighborhood protests, see Figure 10).
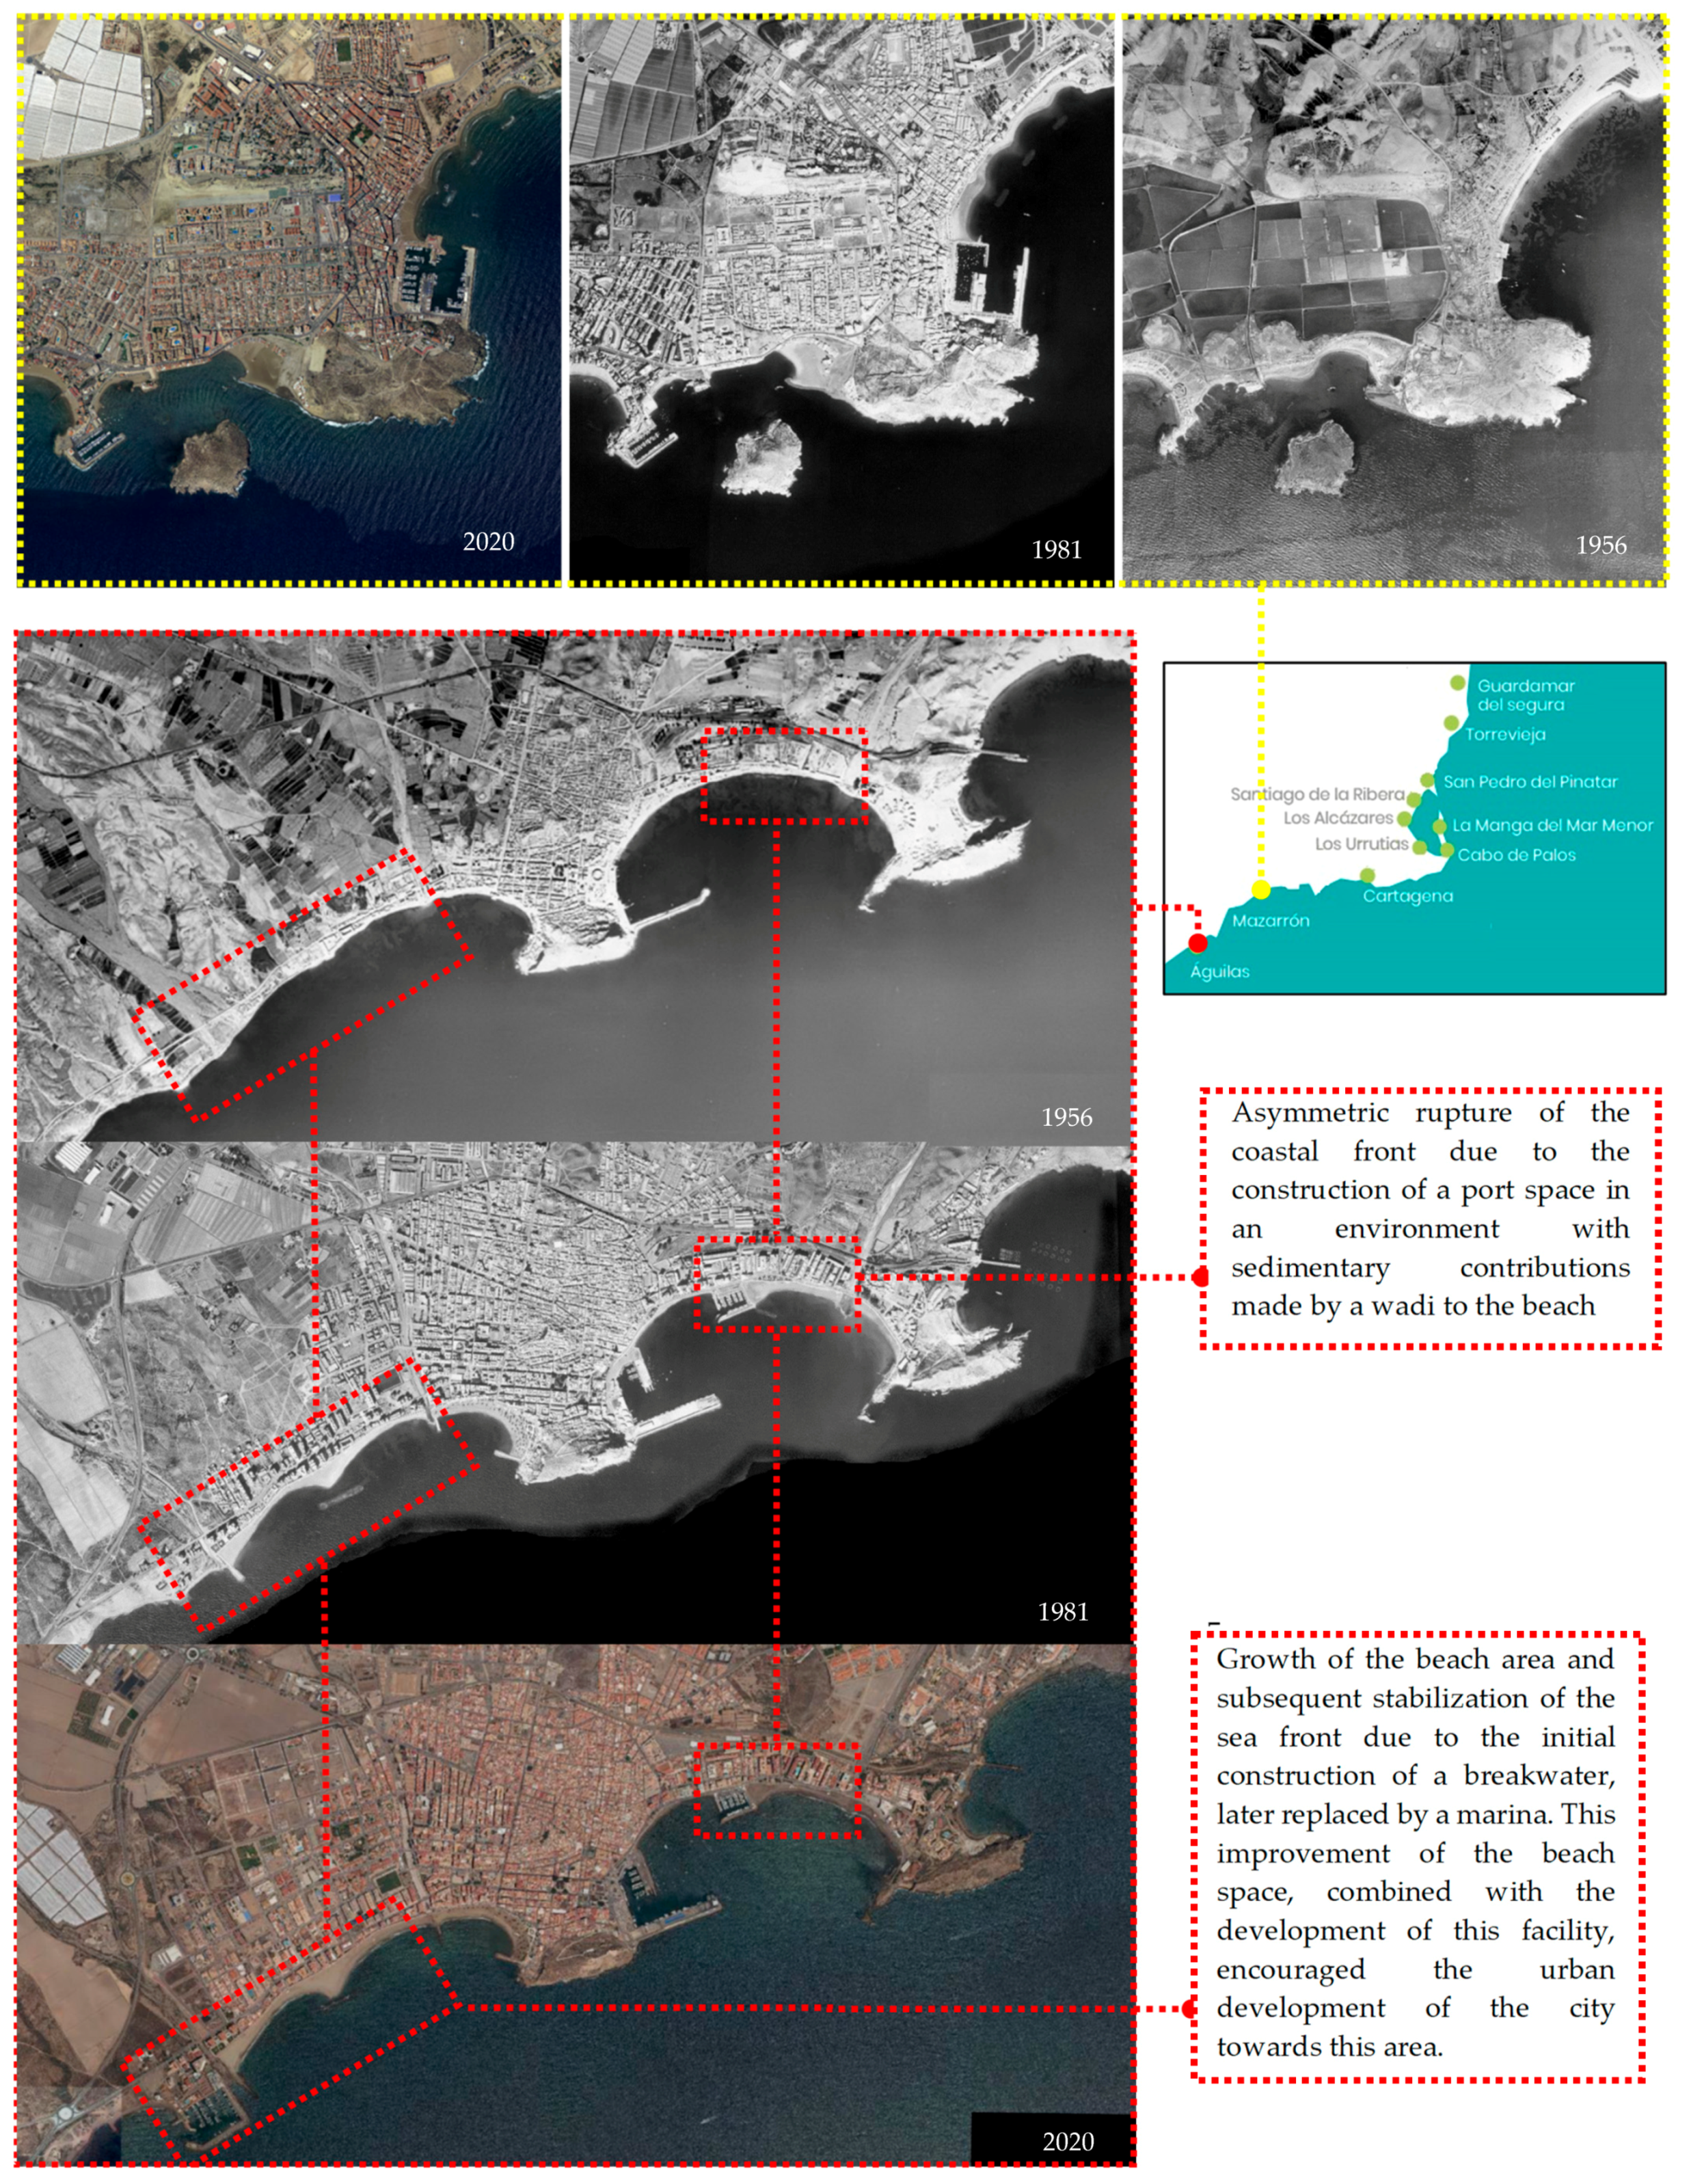
It should be stressed that not all of these impacts are always negative since examples of transformations of the beach line derived from the construction of port areas and various coastal infrastructures that have contributed to a social or economic improvement of the environment are found on numerous occasions. An example of this is the case of Mazarrón (top of Figure 11), where the development of two relatively close ports and various dikes has not only not generated sedimentary imbalances in the area but has also contributed to widening the beach space, generating a more stable beach line with a great capacity for the tourist attraction of a new urban area, improving the existing sandy slope.
Another similar case can be found on the coast of the city of Águilas (bottom of Figure 11), where the construction of three ports progressively in various stages has generated a globally positive balance. The construction of the first two ports during the 1980s in the western area of the city produced a certain imbalance in a relatively uniform beach, but not very wide. Its construction fragmented the bay into two differentiated beaches in this western area: one to the right, where the channel empties, whose contribution of sediments was expanding the beach line over the years, and another to the left that suffers a recessive process that has apparently already stabilized in the last decade. In the eastern zone, the construction of a third port in a sparsely urbanized area during the 1990s produced a “closure effect” that generated a wider beach. This transformation of the coast allowed urban development in the area, making it attractive for the city to grow towards the said port without any negative collateral effects being observed in the surrounding areas thus far.
It should be noted that the vast majority of these cases of positive effects are observed to generally occur in a short-term context. In other words, the beneficial results for the environment (whether of a social, economic, or sedimentary nature) are generally produced in a subsequent time horizon of 5 or 10 years. This may possibly respond to the fact that the construction of the port itself was part of a broader and larger-scale strategic approach, such as the reconfiguration of the coastal space from an urban point of view, unlike other cases where the sole purpose was the construction of a port area.
This diversity of situations highlights the need to determine the potential for sedimentary resilience in coastal areas such as beaches beyond merely geomorphological issues to cover social issues in the context of holistic coastal strategic planning [38]. In this sense, it has been quite interesting to observe in this study that the vulnerability of these types of areas can be parameterized by spatiotemporal indices, which can help to understand their evolutionary behavior from a multidisciplinary approach better.
With regard to possible limitations, it should be noted that the study carried out is not considered an absolute investigation from the theoretical point of view. In this sense, the results obtained cannot be interpreted as being universal for the entire Mediterranean coast. Even so, the sample used is rather significant from a statistical point of view since it reflects a physical reality demonstrated with objective parameters for the study area, so the results may possibly be validated in other areas of the Mediterranean. In any case, it is possible that the boundary conditions of other coastal contexts would possibly infer different results. Therefore, given that the results cannot be presented as universal conclusions but rather that the scientific proposal can be considered as an advance from the methodological point of view, it would be interesting to extend the sample of analysis to other coastal points scattered geographically throughout the Mediterranean Sea. A sample of 20 or 30 port areas with significant problems from all over the Mediterranean area, geographically distant from each other, could be included so as to cover the entire coastal perimeter.
Similarly, based on the results obtained in this study, the proposed methodological framework could be enriched with optimized or more sophisticated parameters to seek to generate more robust results. In some indicators, such as the level of integration of the port area in the coastline, the establishment of brackets to differentiate each one of the categories has been taken with an a priori approach. The level of the area of influence of the port areas from a spatial point of view could also be worked out in greater detail. It could also be interesting to differentiate between erosion and sand accumulation phenomena in the imbalance indicators since they are currently treated in an aggregated, undifferentiated manner. In all these types of parameters, it could be interesting to implement a sensitivity analysis to more accurately contrast which thresholds determine a clear differentiation among the different categories.
Lastly, from the point of view of the policy implications, it would be interesting to develop some form of homogenized quantification of the socioeconomic impact generated by the construction of these port infrastructures as opposed to the damage of the same nature that they cause to advance in the comparison on whether the balance is positive or negative from an absolute point of view. Some proposals on this matter can be found in the scientific literature (see [39,40]), although the topic is still in a somewhat embryonic state. In this study, different socioeconomic impact thresholds were proposed as a comparative element, in some cases even quantifying the loss of the real estate value of the properties using internet home rental and purchase portals to quantify this problem from a numerical point of view. However, to enable an analysis of the values of this impact in a more rigorous and comparative manner, it would be necessary to develop a structured methodological framework that would allow a joint evaluation of diverse problems, such as the loss of value of private real estate assets, the reduction in the use of the beach as a public space, and the possible environmental derivatives, internalized as an economical cost.

5. Conclusions

The study carried out proposes a new approach to the impact of port infrastructures on the coast. Beyond the traditional system procedures for evaluating the effects of ports on the sedimentary dynamics of beaches, a multidisciplinary analysis was proposed with a holistic view of the problem. This innovative approach was methodologically based on the use of spatiotemporal GIS indicators through a geostatistical evaluation. From a spatial point of view, the collateral effects and synergies generated are addressed, both from the point of view of the design of port spaces and from the territorial and urban context in which they are found. From a temporal point of view, the different nature of the impacts produced by port infrastructures, both in the short and the long term, was retrospectively analyzed, transcending mere environmental and sedimentary issues and addressing other economic and social implications.
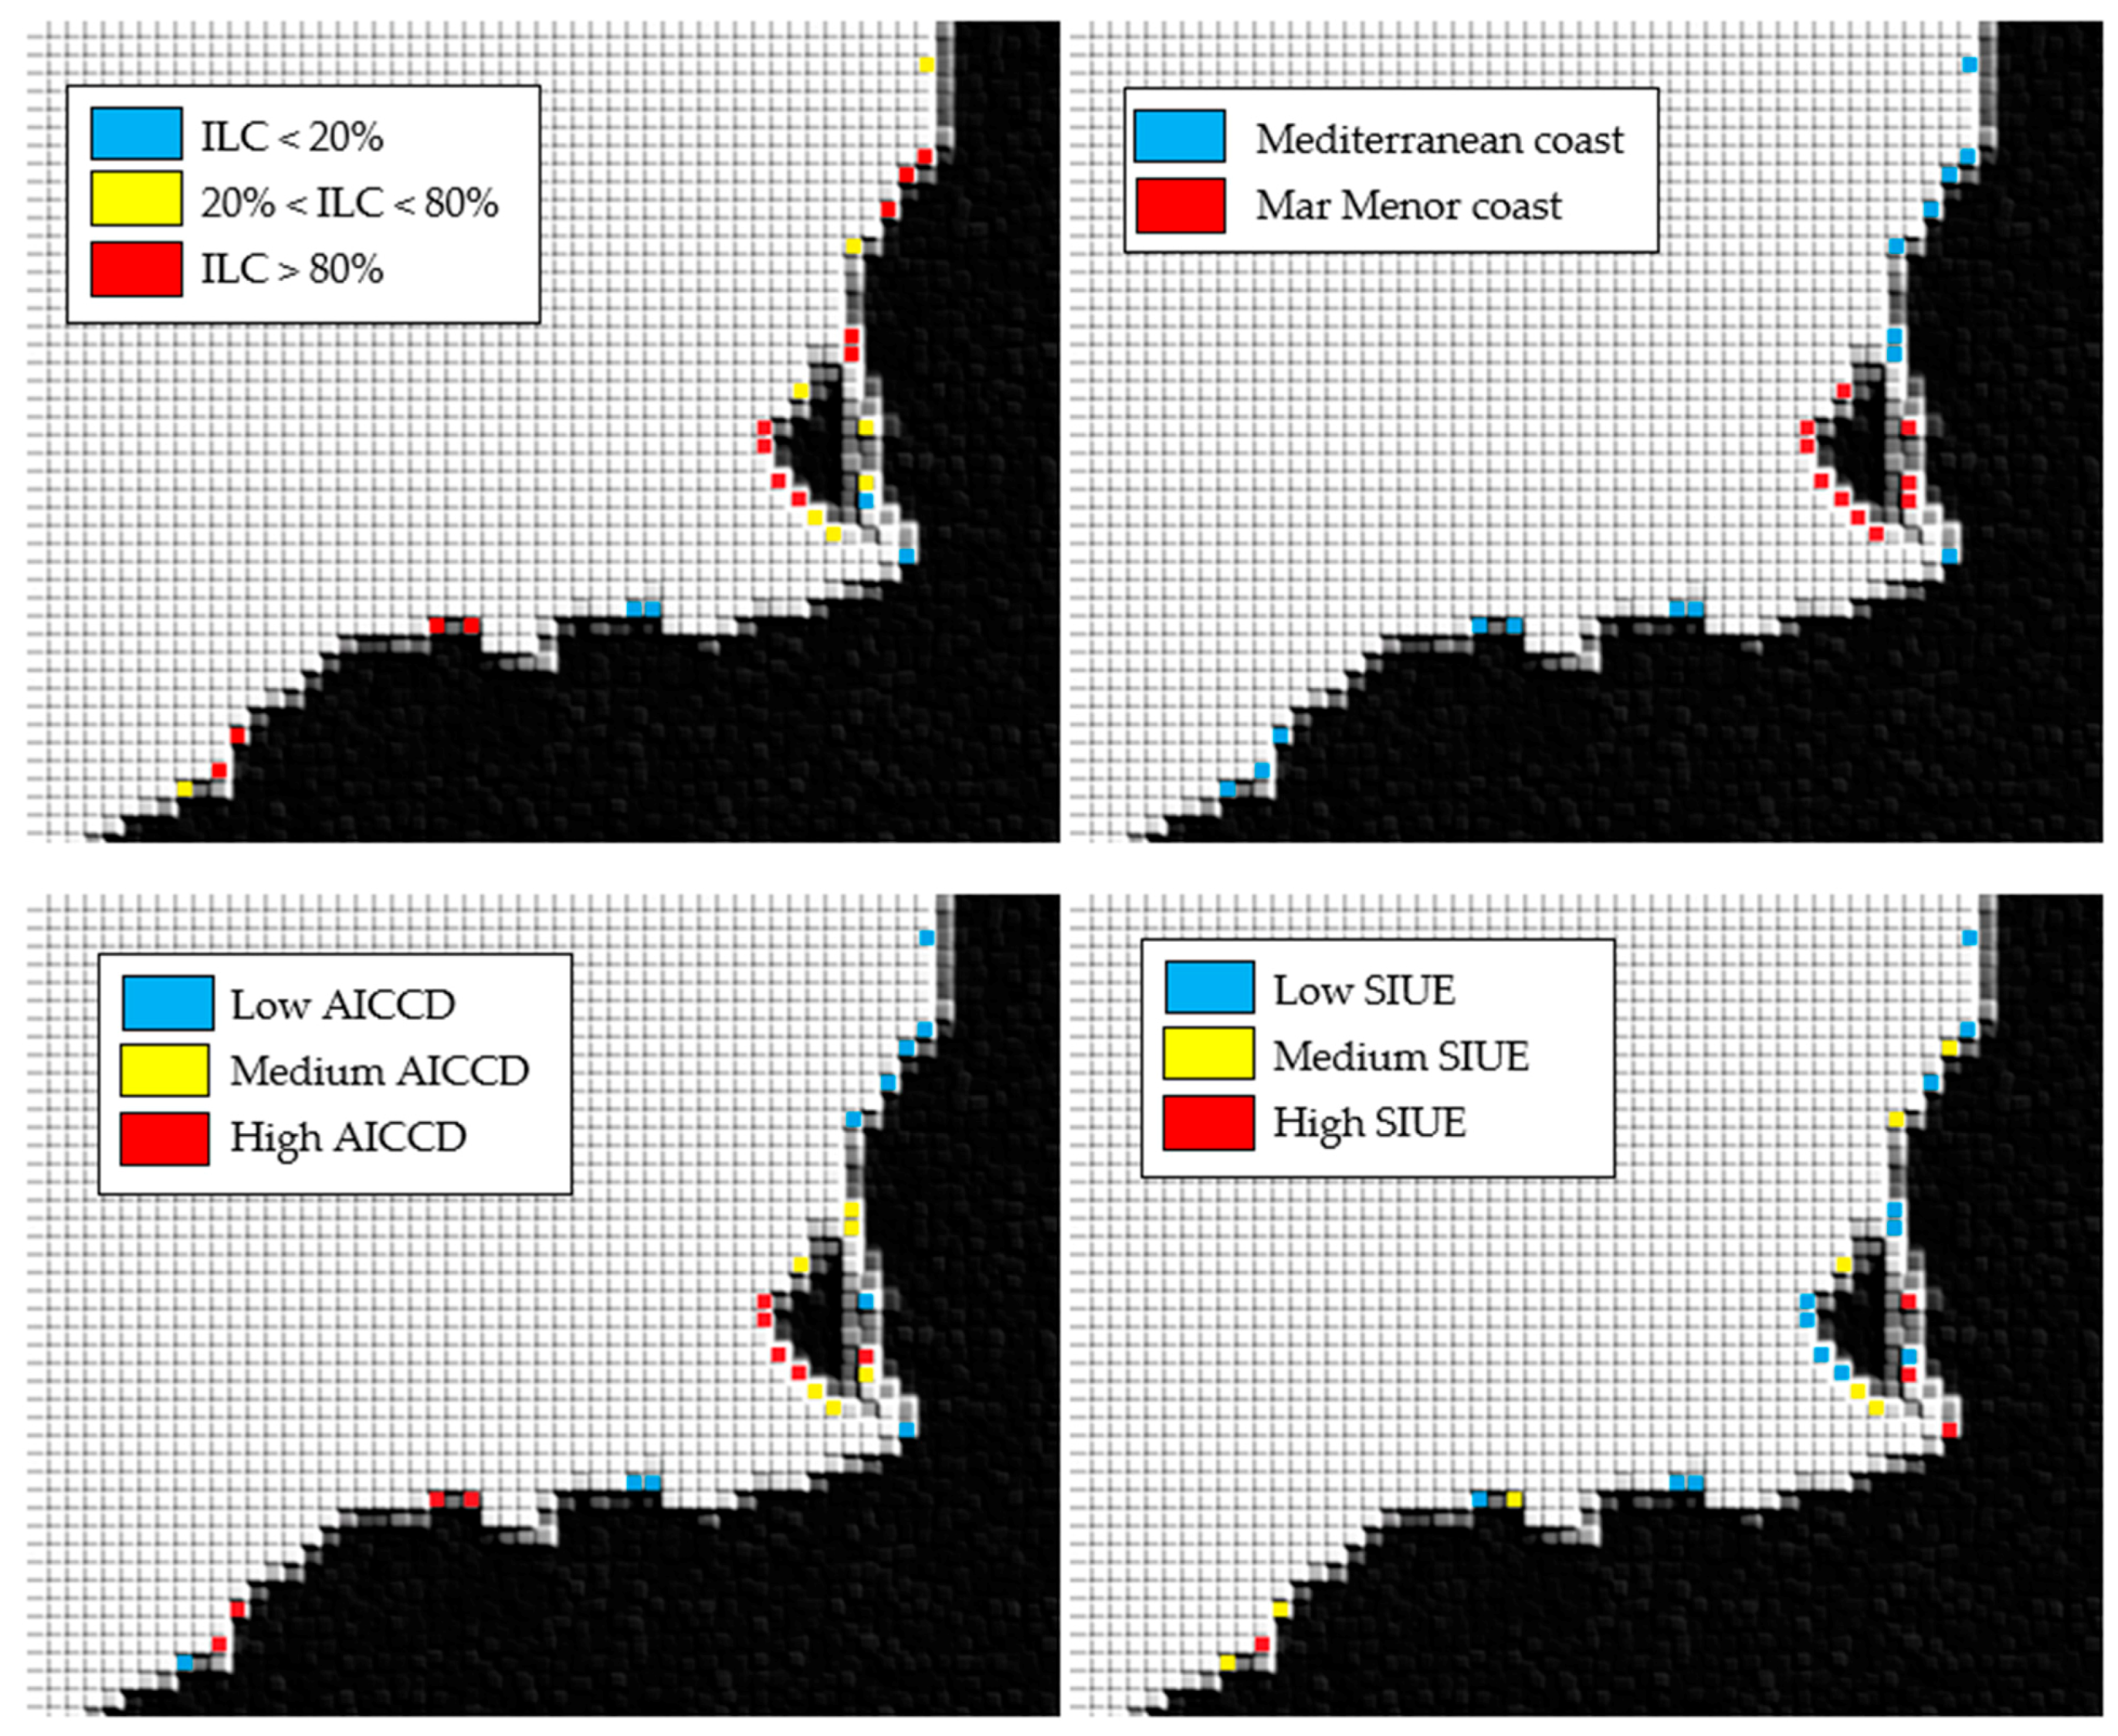
The analysis of the geostatistical correlation between the configuration parameters of the port spaces and the impacts detected was applied in a study area located on the southeast of the Spanish Mediterranean coast, obtaining interesting results. Firstly, it was observed how the sedimentary imbalances on the beaches are produced with behavioral patterns of accumulation to the north of the port and erosion to the south of the port on the Mediterranean coast; patterns that are not reproduced, however, in different maritime contexts such as the Mar Menor. Secondly, it was observed how the typology of port design, combined with other parameters and boundary conditions such as the urban environment, the maritime configuration, and the proximity of other nearby coastal infrastructures such as dikes, riverbeds, or dredging, generate effects of various kinds that can be parameterized by various categories based on the proposed indicators. Within these categories, some stand out with clear cause–effect relationships, such as the generation, in the long term, of urban environments and in maritime conditions, such as the Mar Menor, of hemitombolos in island-type ports. It was detected that these phenomena end up becoming mud and sludge that have a negative impact on tourism and generate important social controversies.
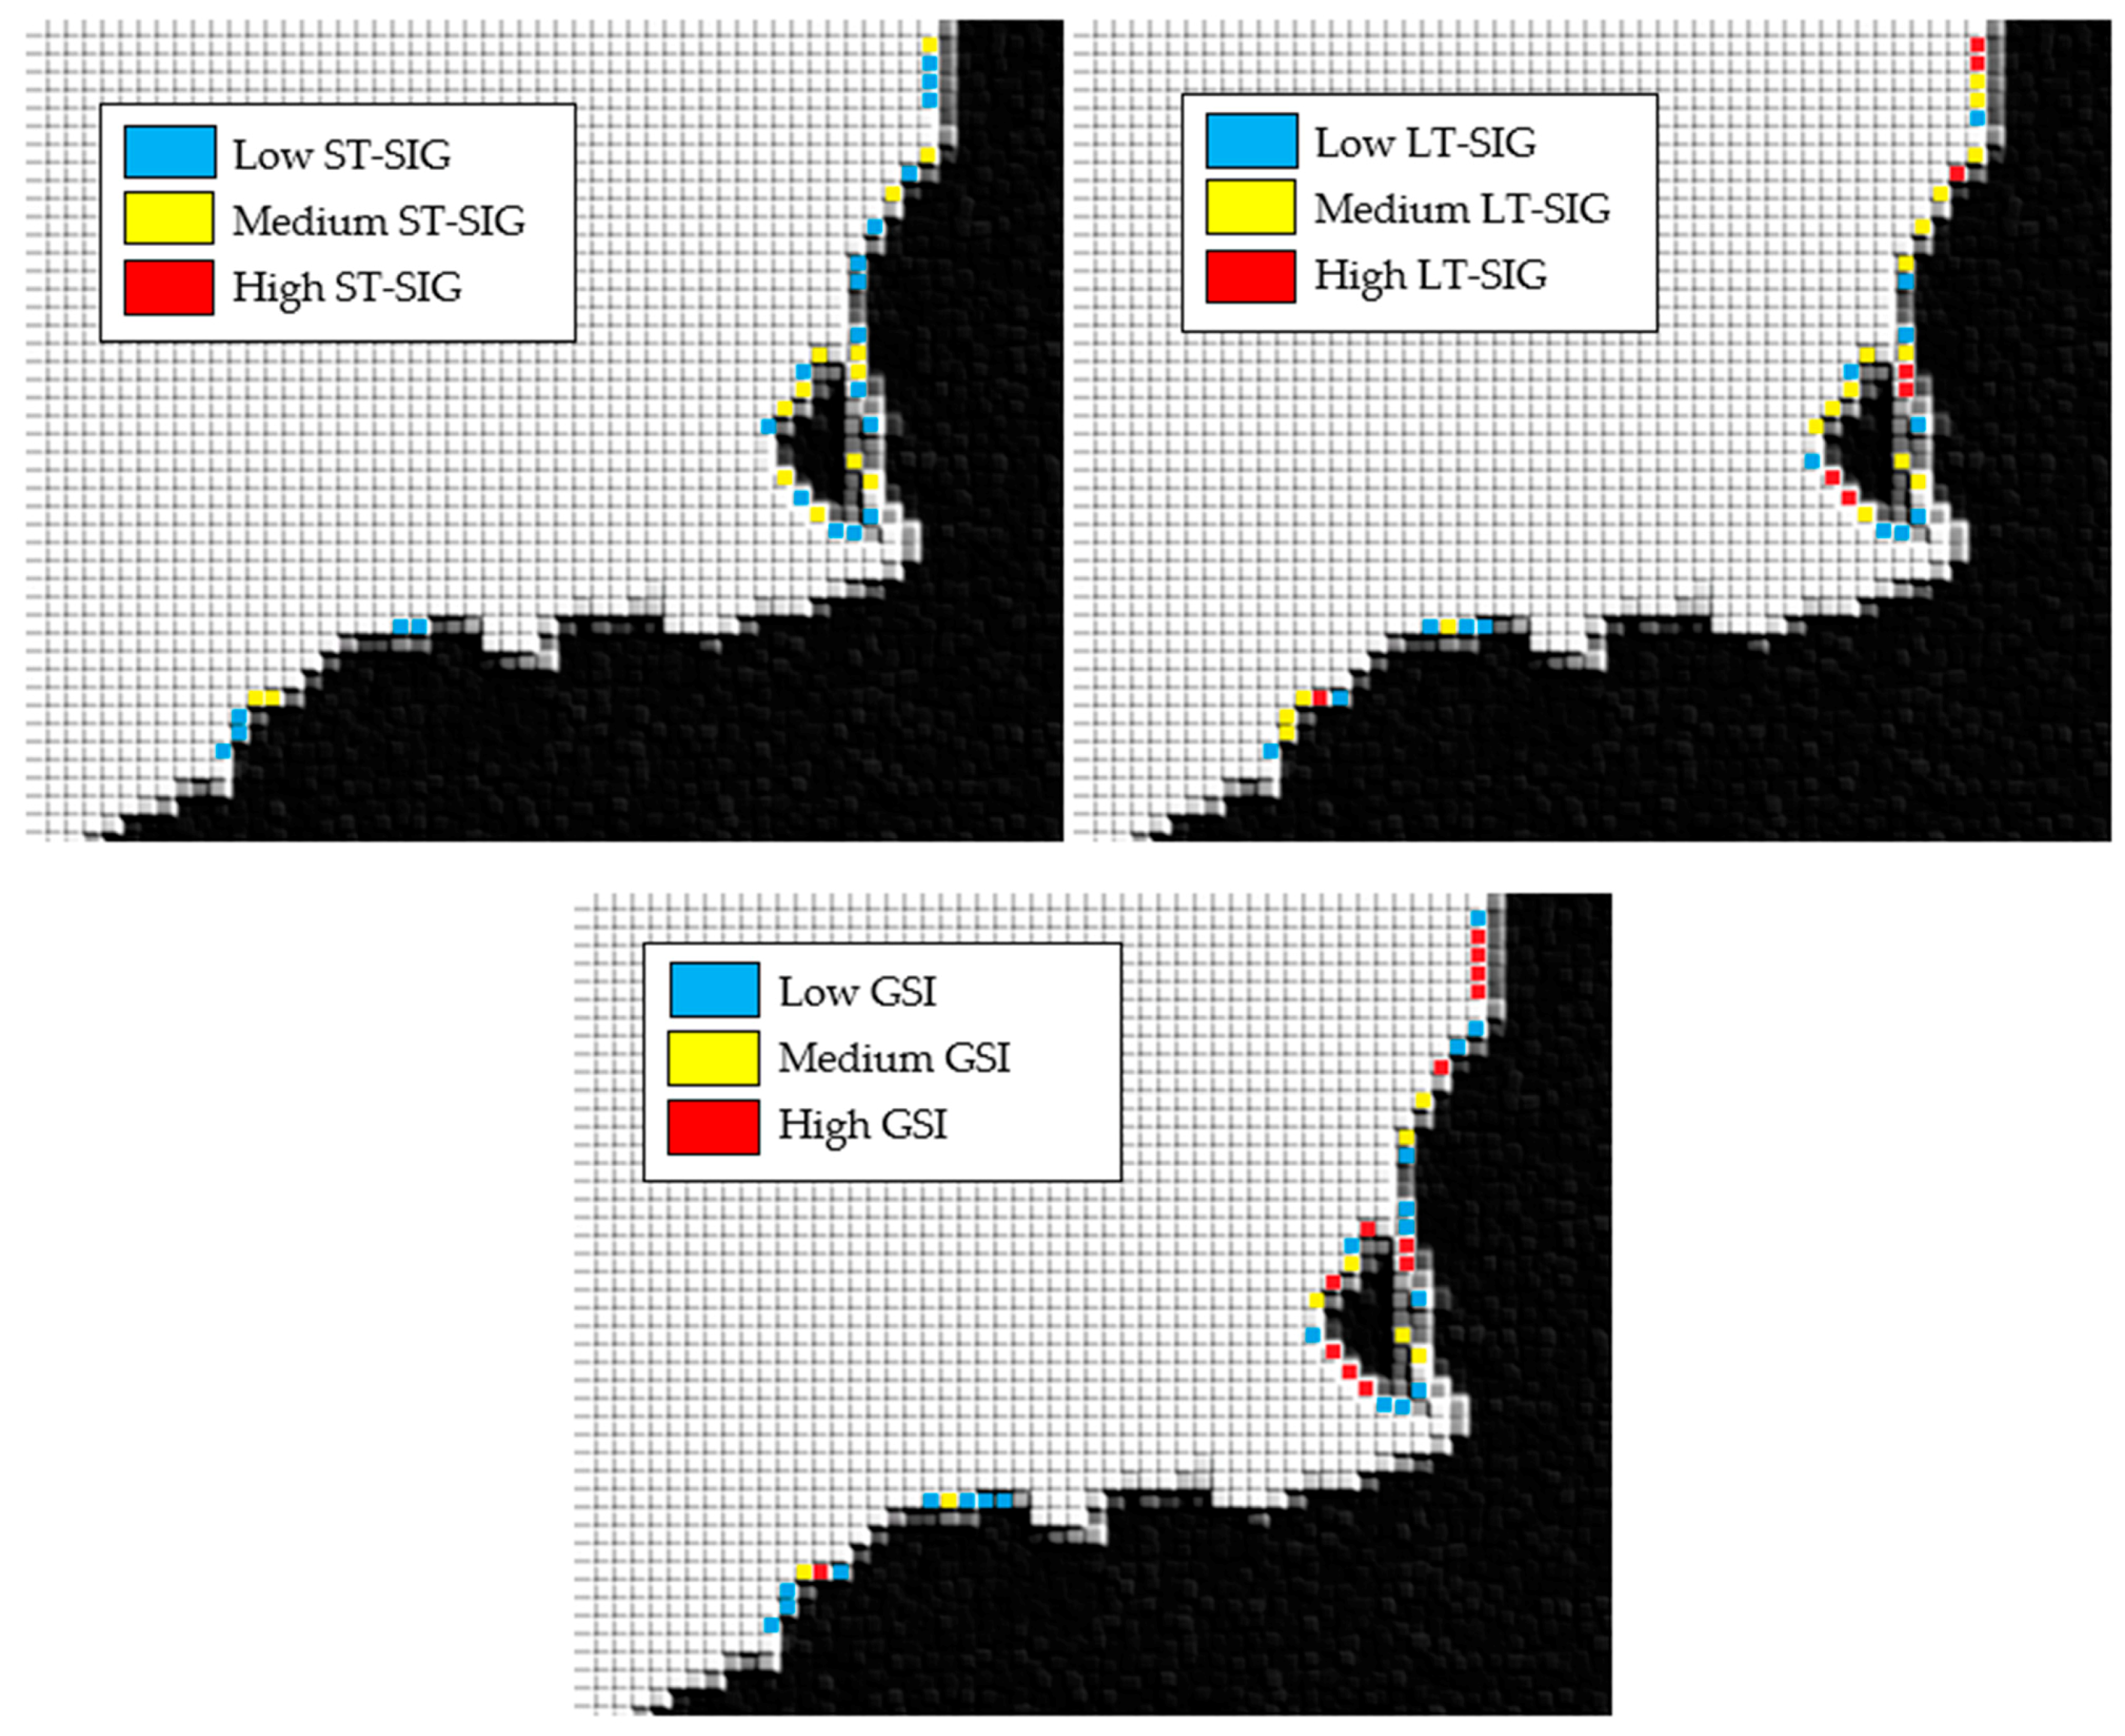
Finally, it was verified that the most negative imbalances, both from the sedimentary point of view and from the tourist point of view, generally occur in the long term (periods of more than 20 years), precisely when the number of anthropic variables is usually high. In these situations, the cause–effect relationship is much more complex to diagnose, as the coast is traditionally a space subjected to transformations of various kinds. However, it has turned out to be a context in which the proposed approach provides a competitive advantage over traditional systems of analysis of civil and coastal engineering since it enables the implementation of a multidisciplinary analysis of the problems, thereby allowing a better understanding of the behavior patterns in several cases analyzed.

Supplementary Materials

The following supporting information can be downloaded at: https://www.mdpi.com/article/10.3390/land11101800/s1, File S1: The GIS file of the study area.

Author Contributions

Conceptualization, S.G.-A.; methodology, S.G.-A. and F.B.; software, F.G.; validation, S.G.-A.; formal analysis, S.G.-A.; investigation, F.G. and F.B.; resources, F.G. and F.B.; data curation, F.G. and F.B.; writing—original draft preparation, S.G.-A. and F.G.; writing—review and editing, S.G.-A.; supervision, S.G.-A.; project administration, S.G.-A. All authors have read and agreed to the published version of the manuscript.

Funding

This research received no external funding.

Data Availability Statement

The data provided can be consulted in the sources indicated in the text.

Conflicts of Interest

The authors declare no conflict of interest.

References

  1. Pagán, J.I.; López, I.; Aragonés, L.; Garcia-Barba, J. The effects of the anthropic actions on the sandy beaches of Guardamar del Segura, Spain. Sci. Total Environ. 2017, 601–602, 1364–1377. [Google Scholar] [CrossRef] [PubMed] [Green Version]
  2. Kantamaneni, K.; Phillips, M.; Thomas, T.; Jenkins, R. Assessing coastal vulnerability: Development of a combined physical and economic index. Ocean Coast. Manag. 2018, 158, 164–175. [Google Scholar] [CrossRef]
  3. Chapapría, V.E.; Peris, J.S. Vulnerability of Coastal Areas Due to Infrastructure: The Case of Valencia Port (Spain). Land 2021, 10, 1344. [Google Scholar] [CrossRef]
  4. Bianco, F.; Conti, P.; García-Ayllon, S.; Pranzini, E. An Integrated Approach to Analyze Sedimentary Stock and Coastal Erosion in Vulnerable Areas: Resilience Assessment of San Vicenzo’s Coast (Italy). Water 2020, 12, 805. [Google Scholar] [CrossRef] [Green Version]
  5. Garcia-Ayllon, S. Long-term GIS analysis of seaside impacts associated to infrastructures and urbanization and spatial correlation with coastal vulnerability in a mediterranean area. Water 2018, 10, 1642. [Google Scholar] [CrossRef] [Green Version]
  6. Liu, P.; Wang, C.; Xie, J.; Mu, D.; Lim, M.K. Towards green port-hinterland transportation: Coordinating railway and road infrastructure in Shandong Province, China. Transp. Res. Part D Transp. Environ. 2021, 94, 102806. [Google Scholar] [CrossRef]
  7. Chapapría, V.E.; Peris, J.S.; González-Escrivá, J.A. Coastal Monitoring Using Unmanned Aerial Vehicles (UAVs) for the Management of the Spanish Mediterranean Coast: The Case of Almenara-Sagunto. Int. J. Environ. Res. Public Health 2022, 19, 5457. [Google Scholar] [CrossRef]
  8. Pagán, J.I.; López, M.; López, I.; Tenza-Abril, A.J.; Aragonés, L. Causes of the different behaviour of the shoreline on beaches with similar characteristics. Study case of the San Juan and Guardamar del Segura beaches, Spain. Sci. Total Environ. 2018, 634, 739–748. [Google Scholar] [CrossRef]
  9. Newton, A.; Weichselgartner, J. Hotspots of coastal vulnerability: A DPSIR analysis to find societal pathways and responses. Estuar. Coast. Shelf Sci. 2014, 140, 123–133. [Google Scholar] [CrossRef]
  10. Camus, P.; Mendez, F.J.; Medina, R.; Tomas, A.; Izaguirre, C. High resolution downscaled ocean waves (DOW) reanalysis in coastal areas. Coast. Eng. 2013, 72, 56–68. [Google Scholar] [CrossRef]
  11. Marrero-Rodríguez, N.; Peña-Alonso, C.; García-Romero, L.; Sánchez-García, M.J.; Pérez-Chacón Espino, E. Historical social relevance of ecosystem services related to long term land uses in a coastal arid aeolian sedimentary system in Lanzarote (Canary Islands, Spain). Ocean Coast. Manag. 2021, 210, 105715. [Google Scholar] [CrossRef]
  12. Palanques, A.; Guillén, J.; Puig, P.; Durán, R. Effects of long-lasting massive dumping of dredged material on bottom sediment and water turbidity during port expansion works. Ocean Coast. Manag. 2022, 223, 106113. [Google Scholar] [CrossRef]
  13. Dufresne, C.; Duffa, C.; Rey, V.; Verney, R. Hydro-sedimentary model as a post-accidental management tool: Application to radionuclide marine dispersion in the Bay of Toulon (France). Ocean Coast. Manag. 2018, 153, 176–192. [Google Scholar] [CrossRef]
  14. Bagheri, M.; Ibrahim, Z.Z.; Akhir, M.F.; Oryani, B.; Rezania, S.; Wolf, I.D.; Pour, A.B.; Talaat, W.I. Impacts of Future Sea-Level Rise under Global Warming Assessed from Tide Gauge Records: A Case Study of the East Coast Economic Region of Peninsular Malaysia. Land 2021, 10, 1382. [Google Scholar] [CrossRef]
  15. Pytharoulis, I. Analysis of a Mediterranean tropical-like cyclone and its sensitivity to the sea surface temperatures. Atmos. Res. 2018, 208, 167–179. [Google Scholar] [CrossRef]
  16. Nastos, P.T.; Karavana Papadimou, K.; Matsangouras, I.T. Mediterranean tropical-like cyclones: Impacts and composite daily means and anomalies of synoptic patterns. Atmos. Res. 2018, 208, 156–166. [Google Scholar] [CrossRef]
  17. Romera, R.; Gaertner, M.Á.; Sánchez, E.; Domínguez, M.; González-Alemán, J.J.; Miglietta, M.M. Climate change projections of medicanes with a large multi-model ensemble of regional climate models. Glob. Planet. Change 2017, 151, 134–143. [Google Scholar] [CrossRef]
  18. Huguet, J.-R.; Brenon, I.; Coulombier, T.; Hamani, V. Dynamics and management of siltation in a macro-tidal marina: The case of La rochelle marina, France. Ocean Coast. Manag. 2020, 198, 105371. [Google Scholar] [CrossRef]
  19. Pavón, D.; Gabarda-Mallorquí, A.; Ribas, A. What Governance? The Role of Public and Private Stakeholders in Water Supply Management in Mediterranean Coastal Tourist Destinations: The Case of the Costa Brava. Water 2018, 10, 1758. [Google Scholar] [CrossRef] [Green Version]
  20. Ródenas, J.; García-Ayllón, S.; Tomás, A. Estimation of the Buildings Seismic Vulnerability: A Methodological Proposal for Planning Ante-Earthquake Scenarios in Urban Areas. Appl. Sci. 2018, 8, 1208. [Google Scholar] [CrossRef]
  21. Garcia-Ayllon, S.; Radke, J. Diffuse Anthropization Impacts in Vulnerable Protected Areas: Comparative Analysis of the Spatial Correlation between Land Transformation and Ecological Deterioration of Three Wetlands in Spain. ISPRS Int. J. Geo-Inf. 2021, 10, 630. [Google Scholar] [CrossRef]
  22. Garcia-Ayllon, S.; Radke, J. Geostatistical analysis of the spatial correlation between territorial anthropization and flooding vulnerability: Application to the DANA phenomenon in a mediterranean watershed. Appl. Sci. 2021, 11, 809. [Google Scholar] [CrossRef]
  23. García-Ayllón, S.; Miralles, J.L. The environmental impacts of land transformation in the coastal perimeter of the mar menor lagoon (SPAIN). Int. J. Des. Nat. Ecodynamics 2014, 9, 109–128. [Google Scholar] [CrossRef] [Green Version]
  24. Region de Murcia SIT Murcia: Visor del Sistema de Informacion Territorial. Available online: http://sitmurcia.es/visor/? (accessed on 14 August 2018).
  25. Susilowati, Y.; Nur, W.H.; Sulaiman, A.; Kumoro, Y. Yunarto Study of dynamics of coastal sediment cell boundary in Cirebon coastal area based on integrated shoreline Montecarlo model and remote sensing data. Reg. Stud. Mar. Sci. 2022, 52, 102268. [Google Scholar] [CrossRef]
  26. Franzen, M.O.; Fernandes, E.H.L.; Siegle, E. Impacts of coastal structures on hydro-morphodynamic patterns and guidelines towards sustainable coastal development: A case studies review. Reg. Stud. Mar. Sci. 2021, 44, 101800. [Google Scholar] [CrossRef]
  27. Agboola, J.I.; Uchimiya, M.; Kudo, I.; Kido, K.; Osawa, M. Dynamics of pelagic variables in two contrasting coastal systems in the western Hokkaido coast off Otaru port, Japan. Estuar. Coast. Shelf Sci. 2010, 86, 477–484. [Google Scholar] [CrossRef]
  28. Wu, C. Handbook of Applied Spatial Analysis: Software Tools, Methods and Applications edited by Manfred M. Fischer and Arthur Getis. J. Reg. Sci. 2012, 52, 386–388. [Google Scholar] [CrossRef]
  29. Anselin, L. Local Indicators of Spatial Association—LISA. Geogr. Anal. 1995, 27, 93–115. [Google Scholar] [CrossRef]
  30. Petropoulos, A.; Kapsimalis, V.; Evelpidou, N.; Karkani, A.; Giannikopoulou, K. Simulation of the Nearshore Sediment Transport Pattern and Beach Morphodynamics in the Semi-Enclosed Bay of Myrtos, Cephalonia Island, Ionian Sea. J. Mar. Sci. Eng. 2022, 10, 1015. [Google Scholar] [CrossRef]
  31. Kroon, A.; de Schipper, M.; de Vries, S.; Aarninkhof, S. Subaqueous and Subaerial Beach Changes after Implementation of a Mega Nourishment in Front of a Sea Dike. J. Mar. Sci. Eng. 2022, 10, 1152. [Google Scholar] [CrossRef]
  32. Monge-Ganuzas, M.; Cearreta, A.; Evans, G. Morphodynamic consequences of dredging and dumping activities along the lower Oka estuary (Urdaibai Biosphere Reserve, southeastern Bay of Biscay, Spain). Ocean Coast. Manag. 2013, 77, 40–49. [Google Scholar] [CrossRef]
  33. Cappucci, S.; Scarcella, D.; Rossi, L.; Taramelli, A. Integrated coastal zone management at Marina di Carrara Harbor: Sediment management and policy making. Ocean Coast. Manag. 2011, 54, 277–289. [Google Scholar] [CrossRef]
  34. Bianco, F.; García-Ayllón, S. Coastal resilience potential as an indicator of social and morphological vulnerability to beach management. Estuar. Coast. Shelf Sci. 2021, 253, 107290. [Google Scholar] [CrossRef]
  35. Romero, F.; Gomez, J.; Rangel, T.; Vassallo, J.M. Impact of restrictions to tackle high pollution episodes in Madrid: Modal share change in commuting corridors. Transp. Res. Part D Transp. Environ. 2019, 77, 77–91. [Google Scholar] [CrossRef]
  36. Thomas, T.; Williams, A.; Rangel-Buitrago, N.; Phillips, M.; Anfuso, G. Assessing Embayed Equilibrium State, Beach Rotation and Environmental Forcing Influences; Tenby Southwest Wales, UK. J. Mar. Sci. Eng. 2016, 4, 30. [Google Scholar] [CrossRef] [Green Version]
  37. Pranzini, E.; Anfuso, G.; Botero, C.-M.; Cabrera, A.; Apin Campos, Y.; Casas Martinez, G.; Williams, A.T. Sand colour at Cuba and its influence on beach nourishment and management. Ocean Coast. Manag. 2016, 126, 51–60. [Google Scholar] [CrossRef]
  38. Pagán, J.I.; Bañón, L.; López, I.; Bañón, C.; Aragonés, L. Monitoring the dune-beach system of Guardamar del Segura (Spain) using UAV, SfM and GIS techniques. Sci. Total Environ. 2019, 687, 1034–1045. [Google Scholar] [CrossRef]
  39. Pranzini, E. Shore protection in Italy: From hard to soft engineering … and back. Ocean Coast. Manag. 2018, 156, 43–57. [Google Scholar] [CrossRef]
  40. Pereira, C.I.; Madrid, D.A.; Correa, I.D.; Pranzini, E.; Botero, C.M. An evaluation of human interventions in the anthropogenically disturbed Caribbean Coast of Colombia. Anthropocene 2019, 27, 100215. [Google Scholar] [CrossRef]
Figure 1. Marinas and urban port areas analyzed in the study area.
Land 11 01800 g001
Figure 2. Main coastal towns of the study area (top left) and marinas and coastal infrastructures built in the Mar Menor coastal lagoon since the 1950s (data source: SITmurcia [24]).
Land 11 01800 g002
Figure 3. Aggregated tessellated large-scale distribution of port configuration indicators in the study area.
Land 11 01800 g003
Figure 4. Aggregated tessellated large-scale distribution of port areas impact indicators in the study area.
Land 11 01800 g004
Figure 5. Local-scale tessellation of significant impacts and evolution in the Mar Menor area between 1956 and 2020: (1) Campoamor marina, (2) Los Nietos marina and (3) Cabo de Palos marina.
Land 11 01800 g005
Figure 6. Hot- and cold-spot LISA analysis for spatial statistical correlation between port areas configuration and coastal impacts indicators.
Land 11 01800 g006
Figure 7. Differences between north and south side asymmetric evolution in the San Pedro del Pinatar marina in relation to the port building impact on the sand line between 1956 and 2020.
Land 11 01800 g007
Figure 8. Los Nietos island harbor’s evolution from 1956 to 2020. Source: Sistema de Información Territorial de la Región de Murcia.
Land 11 01800 g008
Figure 9. Los Urrutias island harbor’s evolution from 1956 to 2020. Source: Sistema de Información Territorial de la Región de Murcia and data from authors.
Land 11 01800 g009
Figure 10. Transformation of the mouth of the Segura River and the beach line between 1956 and 2020 (above). Neighborhood protests for the destruction of centuries-old houses by waves and storms due to the disappearance of the beach (below). Source: Insituto Geográfico Nacional de España, and Plataforma vecinal Playa Babilonia.
Land 11 01800 g010
Figure 11. Mazarron (up) and Aguilas (bottom) harbor’s evolution from 1956 to 2020. Source: SITMurcia and data from authors.
Land 11 01800 g011
Table 1. Criteria to establish the impact level for different cases in the GSI index.
Minor ImpactAverage ImpactRelevant Impact
Coastal shoreline usepermanent and visually contrasted retraction of the beach linepartial loss of tourist uses due to relevant erosion phenomena on the beachdisappearance or complete loss of tourist use of the beach
Tourist demandGeneration of negative publicityDrop in real estate values > 20%Drop in real estate values > 40%
Private propertiesPartial loss of use of private plotsRelevant loss of use of private plots or minor damages in housesRelevant damages or loss of houses
Social problemsIndividual protests from affected usersWidespread periodic protestsPermanent neighborhood protests and demonstrations
Environmental damageMinor impact on protected natural areas or more relevant in non-protected onesPartial impact on protected natural areasRelevant damages in natural protected areas
Table 2. Technical characteristics of georeferenced data used.
Mapping Data YearsPixel Size Projected on the GSD Ground (cm)Planimetric Accuracy (X,Y) Mean Squared Error (m)Altimetric accuracy (Z) Mean Squared Error (m)Mesh Step
FlightOrthophoto
195690100<2.00<2.005 × 5
19814550<2.00<2.005 × 5
1990–20044550<1.00<2.005 × 5
2005–20202225<0.50<1.005 × 5
Table 3. Some examples of values for port areas configuration indicators.
Port AreaLocationPort Configuration TypeILCAICCDSIUE
Guardamar del SeguraMediterraneanInner port on land reclaimed from the sea0.43High0.16
San Pedro del PinatarMediterraneanPort on land reclaimed from the sea0.92High0.32
Los Nietos Mar MenorIsland-type port0.99High0.46
Lo Pagan MarinaMar MenorPort on land reclaimed from the sea0.35Medium0.34
Aguilas sport MarinaMediterraneanPort on land mainly reclaimed from the sea0.81High0.82
Table 4. Some examples of values for spatiotemporal impact indicators.
Port AreaLocationAverage Wide Variations 1956–2020ST-SIGLT-SIGGSI
Guardamar del SeguraMediterranean+13.22 m. (north)/−14.34 m. (south)13.4327.56High
San Pedro del PinatarMediterranean+51.67 m. (north)/−84.42 m. (south)44.68136.09High
Los Nietos (island type marina)Mar Menor+59.17 (max)/0 (min)/−10.12 (average)7.9269.29High
Lo Pagan MarinaMar Menor+14.27 m. (north)/+20.97 m. (south)2.576.60Medium
Aguilas sport MarinaMediterranean+17.17 m. (max)/−7.64 m. (min)15.8524.81High
Table 5. Global Moran’s I statistic for port configuration and coastal impacts indicators in the study area.
Port Areas IndicatorsILCMEAICCDSIUE
Global Moran’s Index0.330.520.310.32
z-score27.344.831.729.4
p-value0.010.010.010.01
Coastal Impact IndicatorsST-SIGLT-SIGGSI
Global Moran’s Index0.310.330.34
z-score22.828.531.3
p-value0.010.010.01
Table 6. Detailed multiple regression models (OLS) for LISA analysis of the different levels of spatial correlation between port area configuration and coastal impact indicators in the study area.
GIS IndicatorsShort-Term Imbalance (ST-SIG)Long-Term Imbalance (LT-SIG)
BStd. ErrortSign.BStd. ErrortSign.
  I L C   0.1670.0033.0730.000 *0.2440.0032.0260.000 *
  M E   0.1350.0022.1420.000 *0.3100.0031.9320.000 *
A I C C D   0.1380.0084.8780.000 *0.2610.0073.7490.000 *
S I U E   −0.1020.009−4.5100.000 *−0.2790.010−4.1830.000 *
Akaike’s information criterion (AIC): 22,325.6AIC: 22,896.3
Multiple R-squared: 0.23Multiple R-squared: 0.22
Adjusted R-squared: 0.22Adjusted R-squared: 0.22
F-statistic: 135.74 Prob (>F) (3,3) degrees of freedom: 0F-statistic: 141.92 Prob (>F) (3,3) DF: 0
GIS IndicatorsSocioeconomic Imbalance (GSI)
BStd. ErrortSign.
  I L C   0.1270.0042.0040.000 *
  M E   0.2860.0071.3380.000 *
A I C C D   0.2920.0111.7640.000 *
S I U E   −0.2730.012−2.8110.000 *
Akaike’s information criterion (AIC): 22,061.2
Multiple R-squared: 0.19
Adjusted R-squared: 0.18
F-statistic: 152.30 Prob (>F) (3,3) degrees of freedom: 0
* Significant at 0.01 level.
Publisher’s Note: MDPI stays neutral with regard to jurisdictional claims in published maps and institutional affiliations.

