Article

Resilience Assessment of Traffic Networks in Coastal Cities under Climate Change: A Case Study of One City with Unique Land Use Characteristics

School of Architecture and Urban Planning, Nanjing University, Nanjing 210093, China
*
Author to whom correspondence should be addressed.
Land 2022, 11(10), 1834; https://doi.org/10.3390/land11101834
Submission received: 10 September 2022 / Revised: 8 October 2022 / Accepted: 11 October 2022 / Published: 18 October 2022

Abstract

:
How to assess the risk of flood disasters and improve the resilience of coastal cities has become a scientific problem that must be solved urgently. This paper aims to construct a resilience assessment model for transport systems in the context of climate change based on an analysis of the spatial characteristics of regional transport networks and complex network theory, using the Pudong New Area in Shanghai, China as the empirical object. Other objectives of the developed model are to establish a system of homogeneity, efficiency, and stability indicators and to assess the impact of flood depth (up to 7 m) on the resilience of transport networks in terms of static network structure and dynamic network performance by designing flood inundation disturbance scenarios. Finally, the characteristics, change trends, and conceptual connotations of the resilience of transport networks in coastal cities are condensed. The results of this study provide a solid scientific basis for future flood disaster risk management in global coastal cities.

1. Introduction

Since the 1990s, global warming has become increasingly prominent; natural disasters such as storm surges, typhoons, rainstorms, and floods have intensified; extreme disaster events have occurred frequently [1]; and the risk of climate change has attracted great attention from the scientific community [2]. Coastal areas are commonly sensitive to climate change and are incredibly vulnerable to coastal flooding. China is a large maritime country, with about 18,000 km of continental coastline and 14,000 km of island coastline. More than 70% of large cities and 50% of the population are concentrated in the eastern and southern coastal areas. Coastal areas play a crucial role in China’s economic strategic layout. Maintaining sustainable development of resources and the environment in coastal areas is a key strategic demand for the future development of the country. Transport networks are crucial to the sustainable development of the region, therefore, in addition to actively addressing climate change, one of the main objectives of transport policymakers is to understand the resilience of coastal area transport networks to extreme events and climate change. At present, a large number of investigations have been carried out at home and abroad to examine the resilience of coastal transportation networks to global or local climate change disasters by developing databases, method models, and analysis tools [3,4,5,6,7,8].
The concept of resilience was first proposed by C.S. Holling in ecological research in the 1970s and then applied to engineering, society, economy, and other disciplines [9]. Resilience is defined in different conceptual terms as characterising the resilience of a system in a single steady state (e.g., the physical performance of disaster preparedness and loss reduction) and emphasising the ability of a system to remain stable after a major disturbance (e.g., considering a disaster disturbance as a learning opportunity for the system). Holling, therefore, makes a distinction between resilience, which is divided into engineering resilience and ecological resilience [10]. From the beginning of this century, with the frequent occurrence of extreme climate and catastrophic events, researchers from various disciplines around the world have paid considerable attention to research works pertinent to resilient cities [11,12]. At present, the general understanding of the definition of resilience is that the system (or network) solves key situations in the system through initiative and adaptation to harsh environments so as to maintain the operability and stability of relevant functions [13,14]. In the field of transportation, the concept of resilience has been widely used in research into the urban system’s adaptive strategy in the face of future unpredictable, massive and uncertain climate change; due to its dynamic, coevolutionary method, wherein “system performance recovers to a state better than the initial value after disaster”, this has become the focus of the research on transportation network resilience [15,16,17]. At present, some national institutions, such as the National Infrastructure Advisory Council (NIAC), defined the resilience of an infrastructure system as its ability to predict, absorb, adapt and quickly recover from destructive events such as natural disasters [16], and some scholars define the resilience of transportation networks as the inherent ability of a system to change its functions in the face of unexpected changes [18]. With the deepening of research, the time and cost of disaster recovery for transportation systems are also included in the comprehensive consideration of resilience [19,20]. In summary, there are three key points in the definition of resilience in the field of transportation: (1) a term describing the inherent capabilities of a system or network; (2) it is used to describe the performance of a destroyed system (e.g., resistance, absorption and maintenance); and (3) can be regarded as the ability of the system to persist in one stable state or to transfer from one equilibrium state to another equilibrium state after encountering damage. However, through the review, we also find that there is no clear definition of traffic network resilience in the history of climate change, and analyzing the impact of climate change on traffic network resilience is a current research hotspot.
The high uncertainty caused by climate change means that resilience must be established against a wider range of disturbances [21]. Therefore, the existing research methodologies of resilience accounting for climate impacts are mostly divided into two aspects. One is the state-based resilience assessment, which refers to the quantitative evaluation of a system’s static state using indicators to describe the system’s ability to cope with a disturbance “at a certain stage”. The results can provide a reference benchmark for resilience building and are also referred to as “baseline resilience”. For example, it can measure the degree of change in performance before and after a disaster, and the recovery time after a disaster [22]. On the other hand, it is a process-based resilience assessment, which focuses on measuring the factors that can be tracked and monitored, such as the elastic curve model proposed by Bruneau [23], and the economic resilience curve model proposed by Simmie and Hallegate, which adds a variety of economic factors to improve the simulation of reality [24,25]. In most of the above-mentioned research methods, resilience assessment often takes the time of extreme disasters caused by climate change as the fault driver. If the transportation network has certain adaptability to extreme weather events, it means that the most critical parts can be protected from floods or other climate events so that they can maintain normal operation in the event of extreme events such as unprecedented rainfall [26]. Therefore, the resilience of a transportation system is multi-dimensional and determined by many factors. It depends on some structural factors, such as the survivability of the key parts of the system and the efficiency of the system, and also depends on some natural factors, such as climate and geography. If a flexible resilience assessment framework model can be proposed, it will be an important tool for detecting and explaining the differences in transportation systems and proposing appropriate measures.
The basic principle of this paper is to establish a framework for assessing the resilience of transportation systems in the context of climate change. The purpose of this paper is to evaluate the resilience level of the Pudong New Area in Shanghai, China, and provide scientific basis and technical support for coastal cities to cope with climate change and prepare for resilient urban planning. Based on the complex network theory, we have established a measurement model of urban traffic network resilience. By designing the flood disaster inundation disturbance scenario, we have established an index system of uniformity, efficiency, and stability. From the perspective of static network structure and dynamic network performance, we have measured the impact of a flooding depth of 0–7 m on traffic network resilience. The resilience assessment framework proposed in this paper enables analysts and policy makers to accurately identify the most critical parts of the transport network. It serves as a basis for policy recommendations on specific defensive and preventive actions. At the same time, this paper identifies the characteristics and resilience pattern trends of coastal urban transport networks at different flood depths. Accordingly, we propose conceptual connotations of resilience and resilience enhancement strategies for coastal urban transport networks. This paper concludes that urban and rural areas that are functionally compact, multi-purpose, and proactively adaptive have a high resilience capacity.
The development of this argument is as follows: in the next section, we introduce the reasons for selecting the research area, the research technology route, the model indicators, and the scenario construction. In the third part, we conduct an empirical study on the traffic network in the study area, describing the characteristic changes of network resilience under different inundation scenarios from the static structure and dynamic performance of the network. In the fourth part, we discuss the most important findings of this paper. In the last section, we put forward the final conclusion of this paper on the above-mentioned goals and put forward suggestions for future research.

2. Study Area and Methods

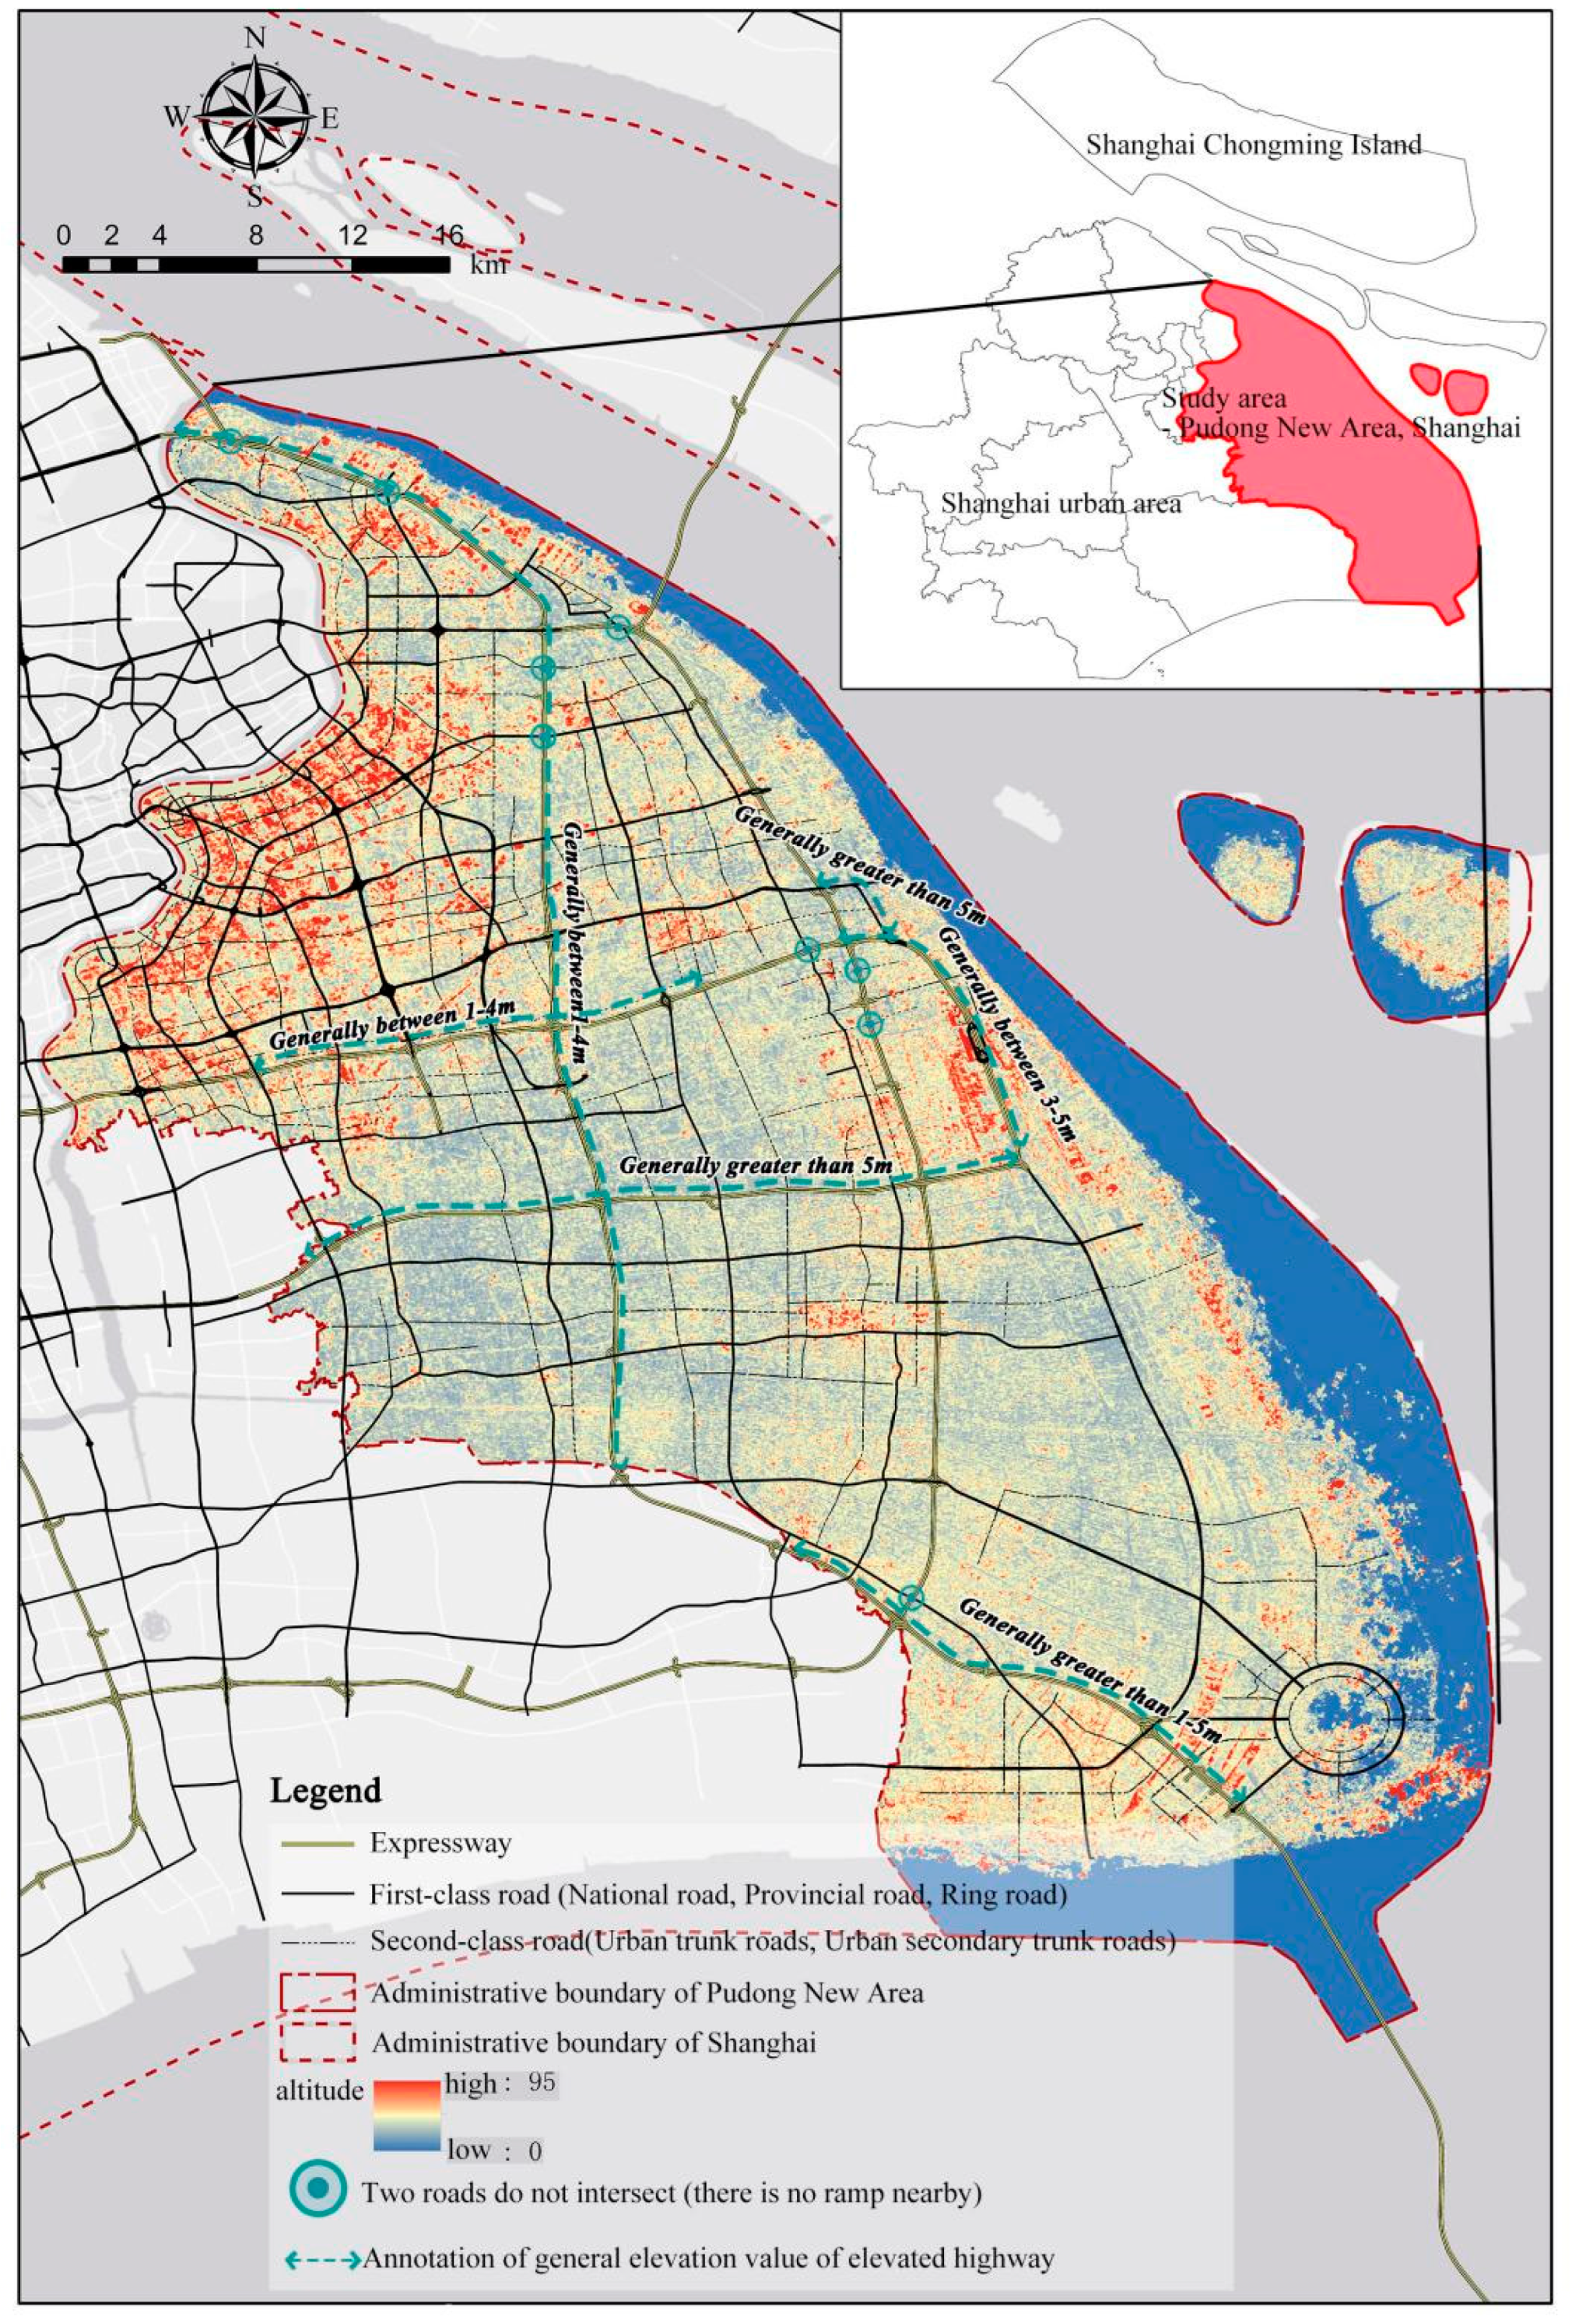
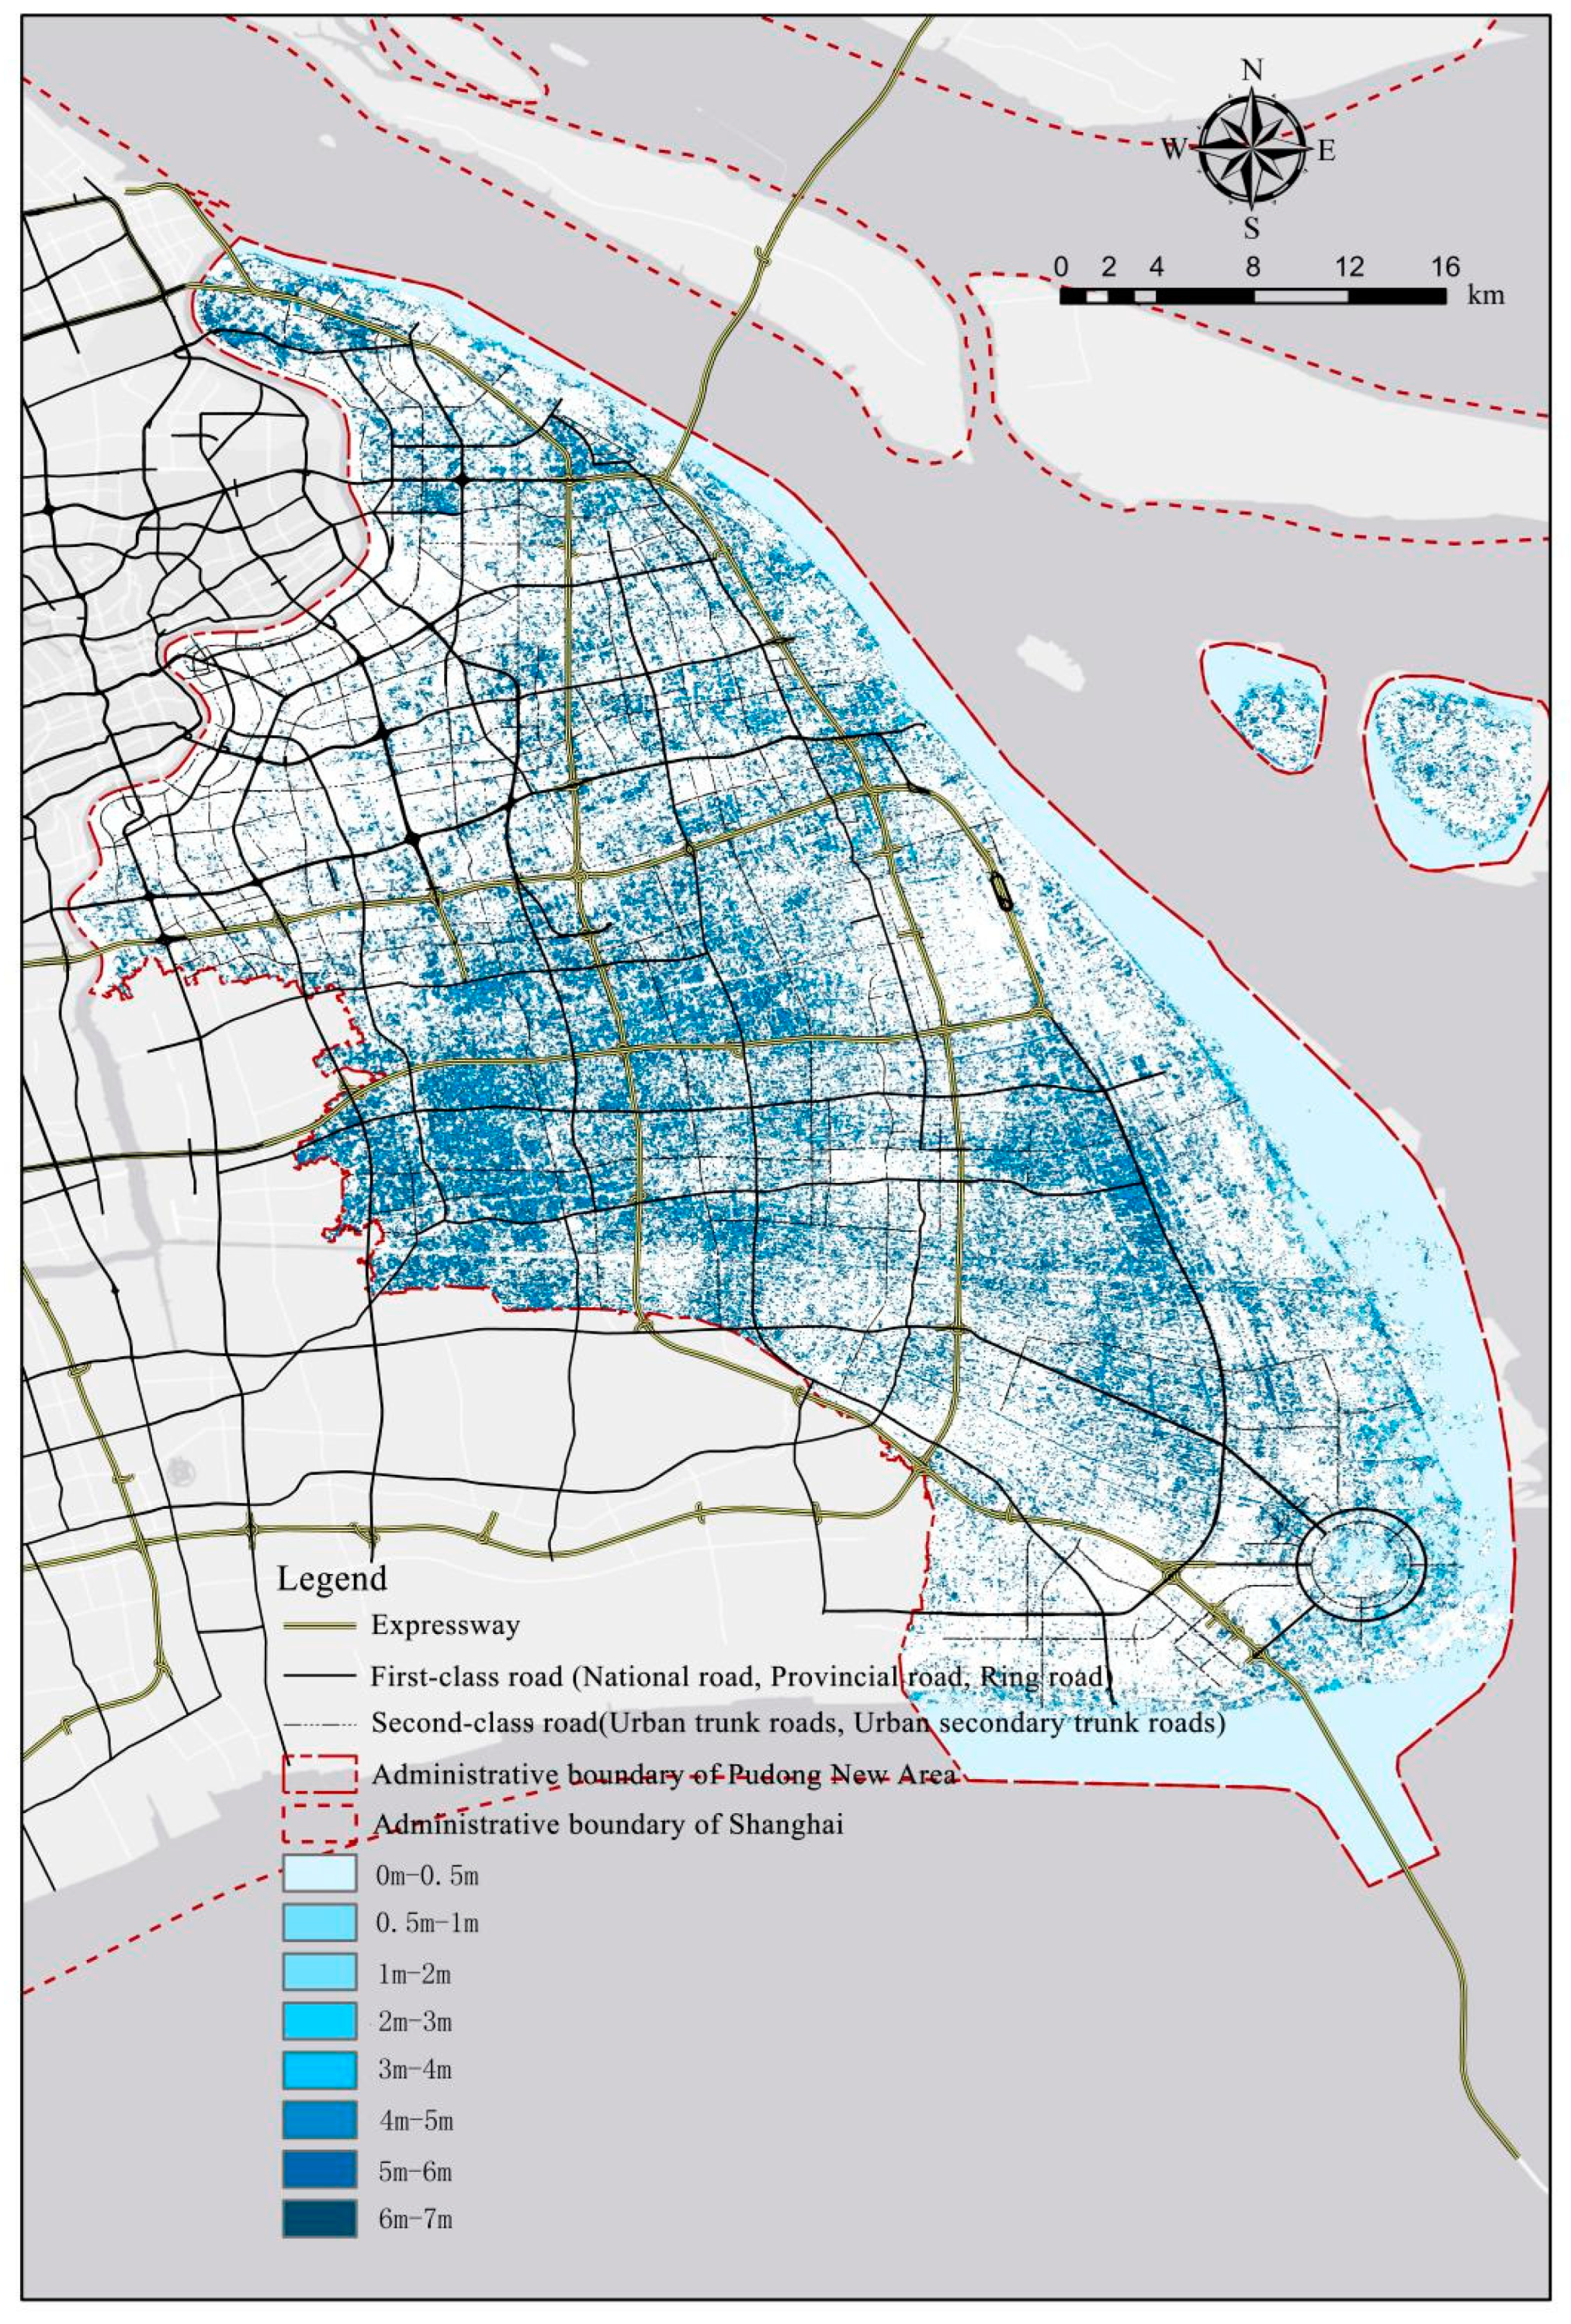
2.1. Overview of the Study Area

As an international trade centre and a world-class high-tech industrial cluster base, PNA is located in the eastern coastal area of Shanghai, China, facing the threat of sea-level rise. As the central city of the Yangtze River Delta (YRD) urban agglomeration, and with the continuous promotion and implementation of national strategic plans, such as the integration of the YRD and the YR economic belt, it is anticipated that its industrial density and service industry will maintain stable growth in the future. Shanghai is positioned in the subtropical monsoon region. In recent years, extreme events such as typhoons, rainstorms, strong convection, and storm surges have demonstrated a great influence on urban disaster prevention and reduction. With the action of climate change due to global warming, the future rainfall variation trend is very complicated. The increases in the frequency and intensity of extreme typhoon storm surges and the frequency of extreme convective weather events in the future will aggravate the risk of severe coastal flood and waterlogging in PNA and hinder the socio-economic development of coastal megacities. This study selects PNA (Figure 1) as the study area based on the following considerations. First, the selected zone covers an area of 1210.41 square kilometres, with a permanent population of 5,681,500 in 2021. It is the most populous administrative region and economically active district in Shanghai, and its geographical position is significant as well [27]. Second, PNA is adjacent to the East China Sea in the east and Hangzhou Bay in the south, both of which are vulnerable to floods due to rising sea levels. Over the past 30 years, Shanghai has been repeatedly hit by severe floods, with massive annual flood losses, especially in PNA.

2.2. Research and Analysis Process

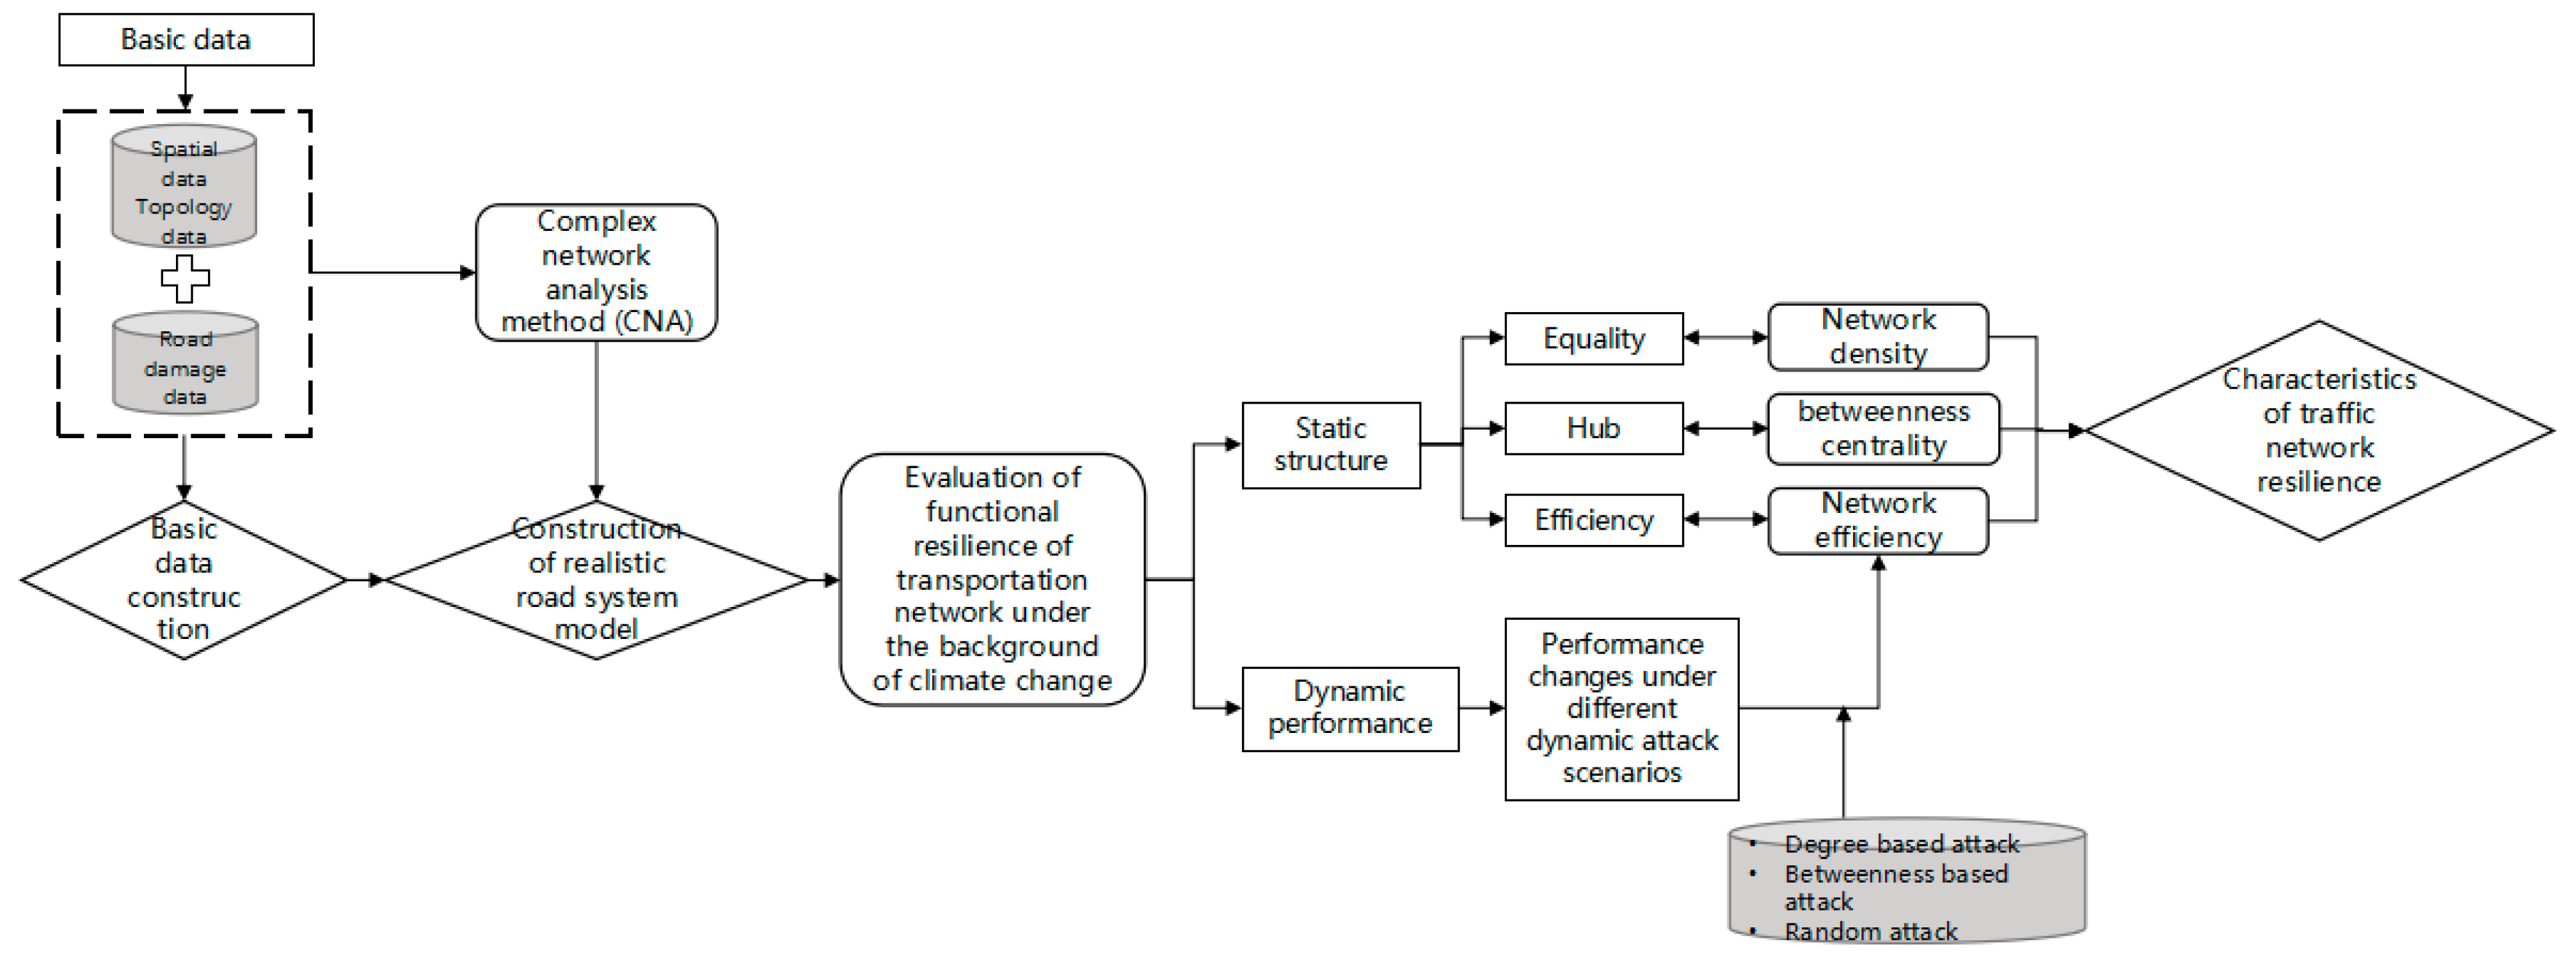
2.2.1. Research Ideas and Technical Route

Based on the current situation of the traffic system in the PNA, the scientific problem of “traffic network resilience law” is condensed, the complex mechanism of the traffic system is sought, and the complex network model of the traffic system is then constructed. Starting from the core problem of “change of resilience characteristics”, the influential factors are examined, and the obtained results are presented.
With the rapid development of computer, information, and control technologies, real-world networks are becoming increasingly interconnected and characterised by interdependencies and interactions. Thanks to a deep understanding of this trend, modelling real-world transport infrastructure systems as complex networks for analysis has become a popular topic [28]. The complexity and resilience of urban transport networks, an area of research at the intersection of transport engineering and systems science, is an excellent example of the application of complex network theory to advance engineering science, and a deeper understanding of this research can help provide a new perspective on the analysis of urban resilience [29,30].
Urban infrastructure resilience has always been a research hotspot in urban security. At present, infrastructure mainly refers to the facilities that ensure the normal operation of urban functions such as disaster prevention and mitigation, transportation, communication, electric power, and food supply. It focuses mainly on analysing the relationship between urban resilience and physical characteristics, layout modes, and the facility network management of infrastructure [31]. Its primary goals are to enhance the key functions, as well as the structure and performance of a city [32]; additionally, it aims to reduce the risk, pressure, scope, intensity, and frequency of induced damage (i.e., that caused by the system failure) to a city so as to improve the city’s resilience.
Therefore, the overall research technical route initiated from the analysis of network functional resilience is used to evaluate static structure characteristics and dynamic network performance (see Figure 2). First, the complex network theory and methods for building the road complex network model are employed. Next, the resilience evaluation index system of the road traffic system is built and the climate change flooding scenario is simulated and constructed by implementing GIS technology. Then, the static structure characteristics and dynamic network performance of the traffic network for various scenarios are assessed and appropriate comparative analysis is conducted. Finally, the characteristics of the traffic network resilience are properly condensed, and the obtained results are presented.

2.2.2. Semantic Model Construction and Index Selection
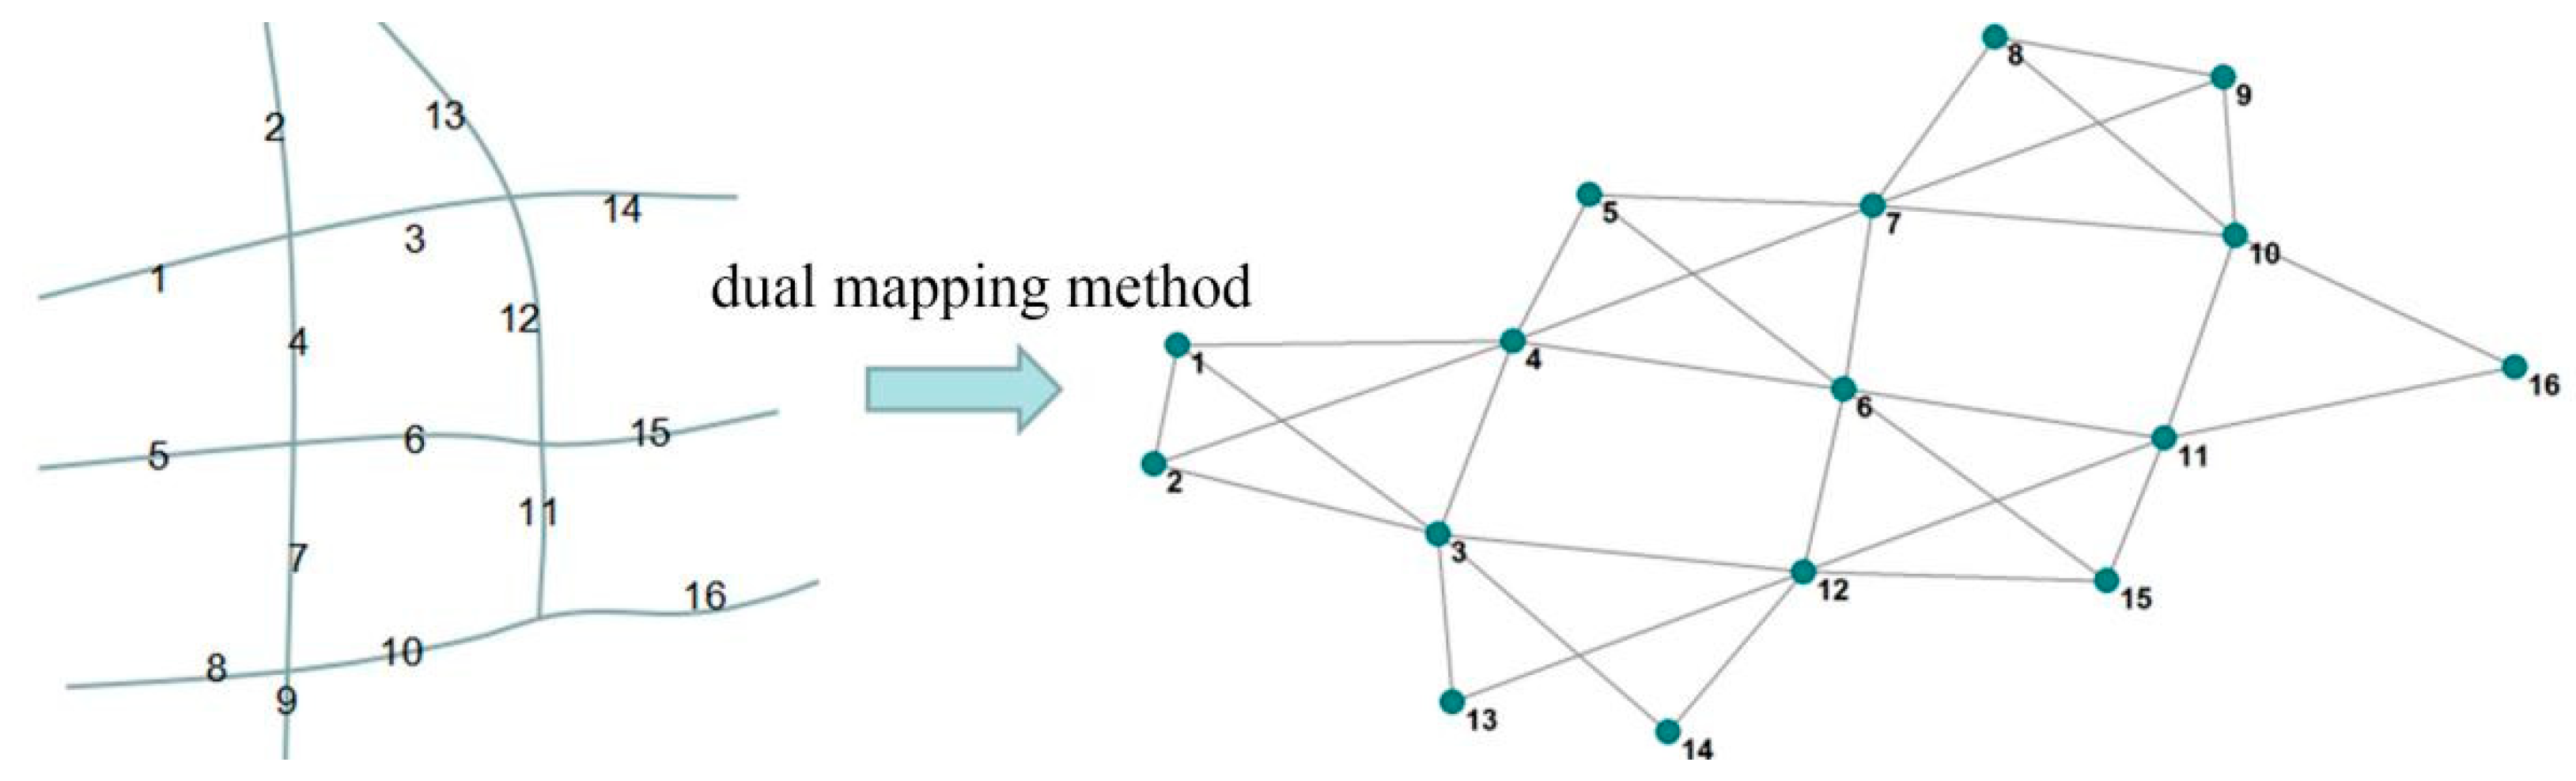
  • Model construction
If the characteristics of a regional highway system are examined by using topology or complex network theory, the highway system should first be abstracted into a topological network diagram composed of points and their corresponding connections. At present, the construction methods of traffic networks mainly include primitive and dual mapping methods [33]. The original mapping method refers to modelling according to the actual situation. The intersections represent the points of the network, and the road section denotes the edge of the network. This method is suitable for small networks; in the case of large networks, it is unable to provide a similar analysis. In the dual mapping method, the road section is considered as a point and the intersection is taken as the edge of the network. This approach may be suitable for analyzing complex networks, and its actual length can be ignored, which can reflect the topology characteristics of the network. Due to the complexity of the traffic network in the PNA (Shanghai) and the need to measure its topological structure characteristics, the dual mapping method is used for modelling (see Figure 3). The semantic transformation of the road reality system is carried out, and road intersections or town and village points are appropriately numbered. Further, the existing nodes in the connection network are recorded as 1, while the non-existent links are recorded as 0. In order to make the network more closely resemble the real system, based on the industrial standard of the people’s Republic of China technical standard for Highway Engineering (jtgb01-2014), three key design indicators of road traffic are chosen. These factors include the volume design, design speed, and number of lanes. The lowest value of the index range is then subjected to further analysis. According to the criteria importance through the inter-criteria correlation (CRITIC) method [34], the weights of the expressway, first-class road, and second-class road are calculated as 2.1, 1.6, and 1, respectively. By connecting various grades of sections, the weight of the connection can be accumulated. For instance, when the expressway is connected with a first-class road, the weight of the connection is set equal to 3.7. In view of this, an empirical regional real system traffic network model is established, as demonstrated in Figure 4.
2.
Index selection
① Equality
Equality represents the degree of perfection of the node connection in the network. If the network is more complete, the networks are more closely connected to each other, and there are more choices between various nodes and others within the network. The equality index selects the “network density” index in the complex network for display.
The network density factor ( d ) is the ratio of the actual number of edges ( M ) in the network to the maximum possible number of edges in the network, which can be calculated as follows:
d = M / [ n ( n 1 ) / 2 ]
where n denotes the number of nodes within the network. The network density parameter is commonly employed to describe the perfection of the connection between nodes in the network. The greater the network density, the more perfect the connection between nodes in the network.
② Hub
Hub is used to characterize the ability of spatial nodes to control the interconnection between other nodes, which can be measured by the betweenness centrality index based on the complex network theory:
C = i = 1 n ( C R B m a x C R B i ) n 1
in which CRBmax represents the theoretical maximum of the absolute middle centrality of the point, CRBi(i) denotes the absolute middle centrality of the point, and C is the relative middle centrality of the point.
③ Efficiency
For the transportation network, the efficient connectivity is measured by the connectivity efficiency of the whole network. In complex network theory, the efficiency between any two nodes vi and vj in the network is the reciprocal of the distance dij between them, which is expressed by εij (Formula (3)):
ε i j = 1 d i j
The efficiency of the whole network is the average value of the efficiency of all nodes in the network. The higher the efficiency of the whole network, the stronger the efficient connectivity. E is used to represent the efficiency of the whole network (Formula (4)):
E = 1 n ( n 1 ) i j ε i j = 1 n ( n 1 ) i j 1 d i j

2.3. Scenario Simulation Construction

2.3.1. Relative Sea-Level Rise in Sea Areas near Shanghai

The regional relative sea-level rise rate could be much higher than the global absolute sea-level rise rate [2,35]. Thus, it is necessary to focus on the relative sea-level rise in the sea areas around Shanghai. Using the historical sea level data of several tidal stations in Shanghai and the statistical model, some investigators have estimated that the sea level rose in the YR Estuary 86.6, 185.6, and 433.1 mm within the time intervals of 1997–2030, 1997–2050, and 1997–2000, respectively [36].
  • The disaster effects of storm surges superimposed with sea-level rise
The rising sea levels will directly lead to an increase in storm surge water, which will worsen the flood disasters caused by storm surges. For instance, according to statistical data from the China marine disaster bulletin 2021 [37], from 2011 to 2020, the direct economic losses caused by marine disasters were 87.6 billion yuan; 497 people died, and 90% of the total losses were attributable to storm surge disasters.
Some scholars predict that the water increase from storm surges in 2080 will be about 10–20 cm higher than that at the present [38]. Additionally, it is estimated that the sea level of the 50-year return period storm surge in the east bank of Denmark in 2100 will be 40–60 cm higher than the current one. Meanwhile, the once-in-a-century storm surge may occur more frequently with the rise of the sea level [39]. In recent years, the typhoon 1526 “Super Typhoon In-fa” has caused huge losses for Shanghai (see Table 1), and the maximum water increase has reached 320 cm.
2.
The catastrophic effects of extreme weather events superimposed with sea-level rise
Global climate change and sea-level rise has led to an increase in short-term heavy rainfall in cities, the rise in frequency and intensity of coastal storm surges, and a combination of factors including a rapid rise in downstream high tide levels, which will aggravate the frequency of waterlogging disasters. This means that water is more likely to accumulate in the urban areas of coastal cities and not drain smoothly. Since the middle of the last century, the highest tide level in Suzhou Estuary of Huangpu River has been rising continuously, 4.65 m in the 1950s and the 1960s, 5.22 m in the 1970s and 1980s, and 5.72 m (warning water level is 4.55 m) under the influence of typhoon 11 in 1997, which is 2.5 m higher than the Bund ground. The flood control wall in the urban area of Shanghai is designed according to the standard of once-in-a-thousand years. If the sea level rises by 50 cm, the high tide level of once-in-a-thousand years will reach 6.36 m.

2.3.2. Scenario Construction and Water-Level Setting

The risk of sea-level rise is related to the depth of flooding. As mentioned above, the lowest water level in the sea area near Shanghai has risen by 1.3 m, and the highest level is 5.72 m. Through prediction, the high tide level of the 1–1000 year return period will reach 6.36 m. In order to more closely align the research results with reality and provide a basis for disaster prevention and reduction in the PNA of Shanghai, this study is conducted based on the historical data of climate disasters in Shanghai and the prediction data of relevant models. In combination with the technical guidelines for the risk assessment of storm surge disasters and zoning, and those for the risk analysis of the sea-level rise and zoning published by the State Oceanic Administration, the depth of flooding varies from 1 to 7 m at an increment rate of 1 m.
Additionally, GIS is employed to simulate the risk scenario under the influence of sea level rise. Due to the complexity of the actual flood inundation process, it is not only related to high water levels but also to wave height, water increase time, and surface drainage. Leon et al. [40] pointed out that most of the sea-level rise impact assessments using bathtub models were easily implemented. In the present work, the interpolated digital elevation model (DEM) and sea level height data of Shanghai are used to delimit flood areas.

3. Empirical Research Results

The impacts of various inundation depths on the study area and traffic network structure are presented in Figure 5 and Figure 6, respectively. The traffic network generation is directly realized through the Pajek software platform, but the section pairs and weights need to be set. When the flooding depth destroys the section pairs, the corresponding section pairs can be deleted (the source file is shown in Table 2). In the case of a sea level growth of 0–3 m, the network is less affected, and the inundation is mainly in the marginal road network. However, when it exceeds 3 m, more traffic islands are produced in the network, and the network shape changes significantly. With the increase in inundation depth, the traffic network in the study area changes from “block” to “branch”.

3.1. Network Structure Analysis

3.1.1. Equality Analysis

The results of the equality analysis are shown in Figure 7. With the increase in flooding depth, the overall equality of the network gradually decreases, the change is relatively slow in 0–3 m, and the decline rate begins to accelerate in 3–4 m. From a numerical point of view, the equality of the transportation network in the study area is not high, and there is still room for further improvement.

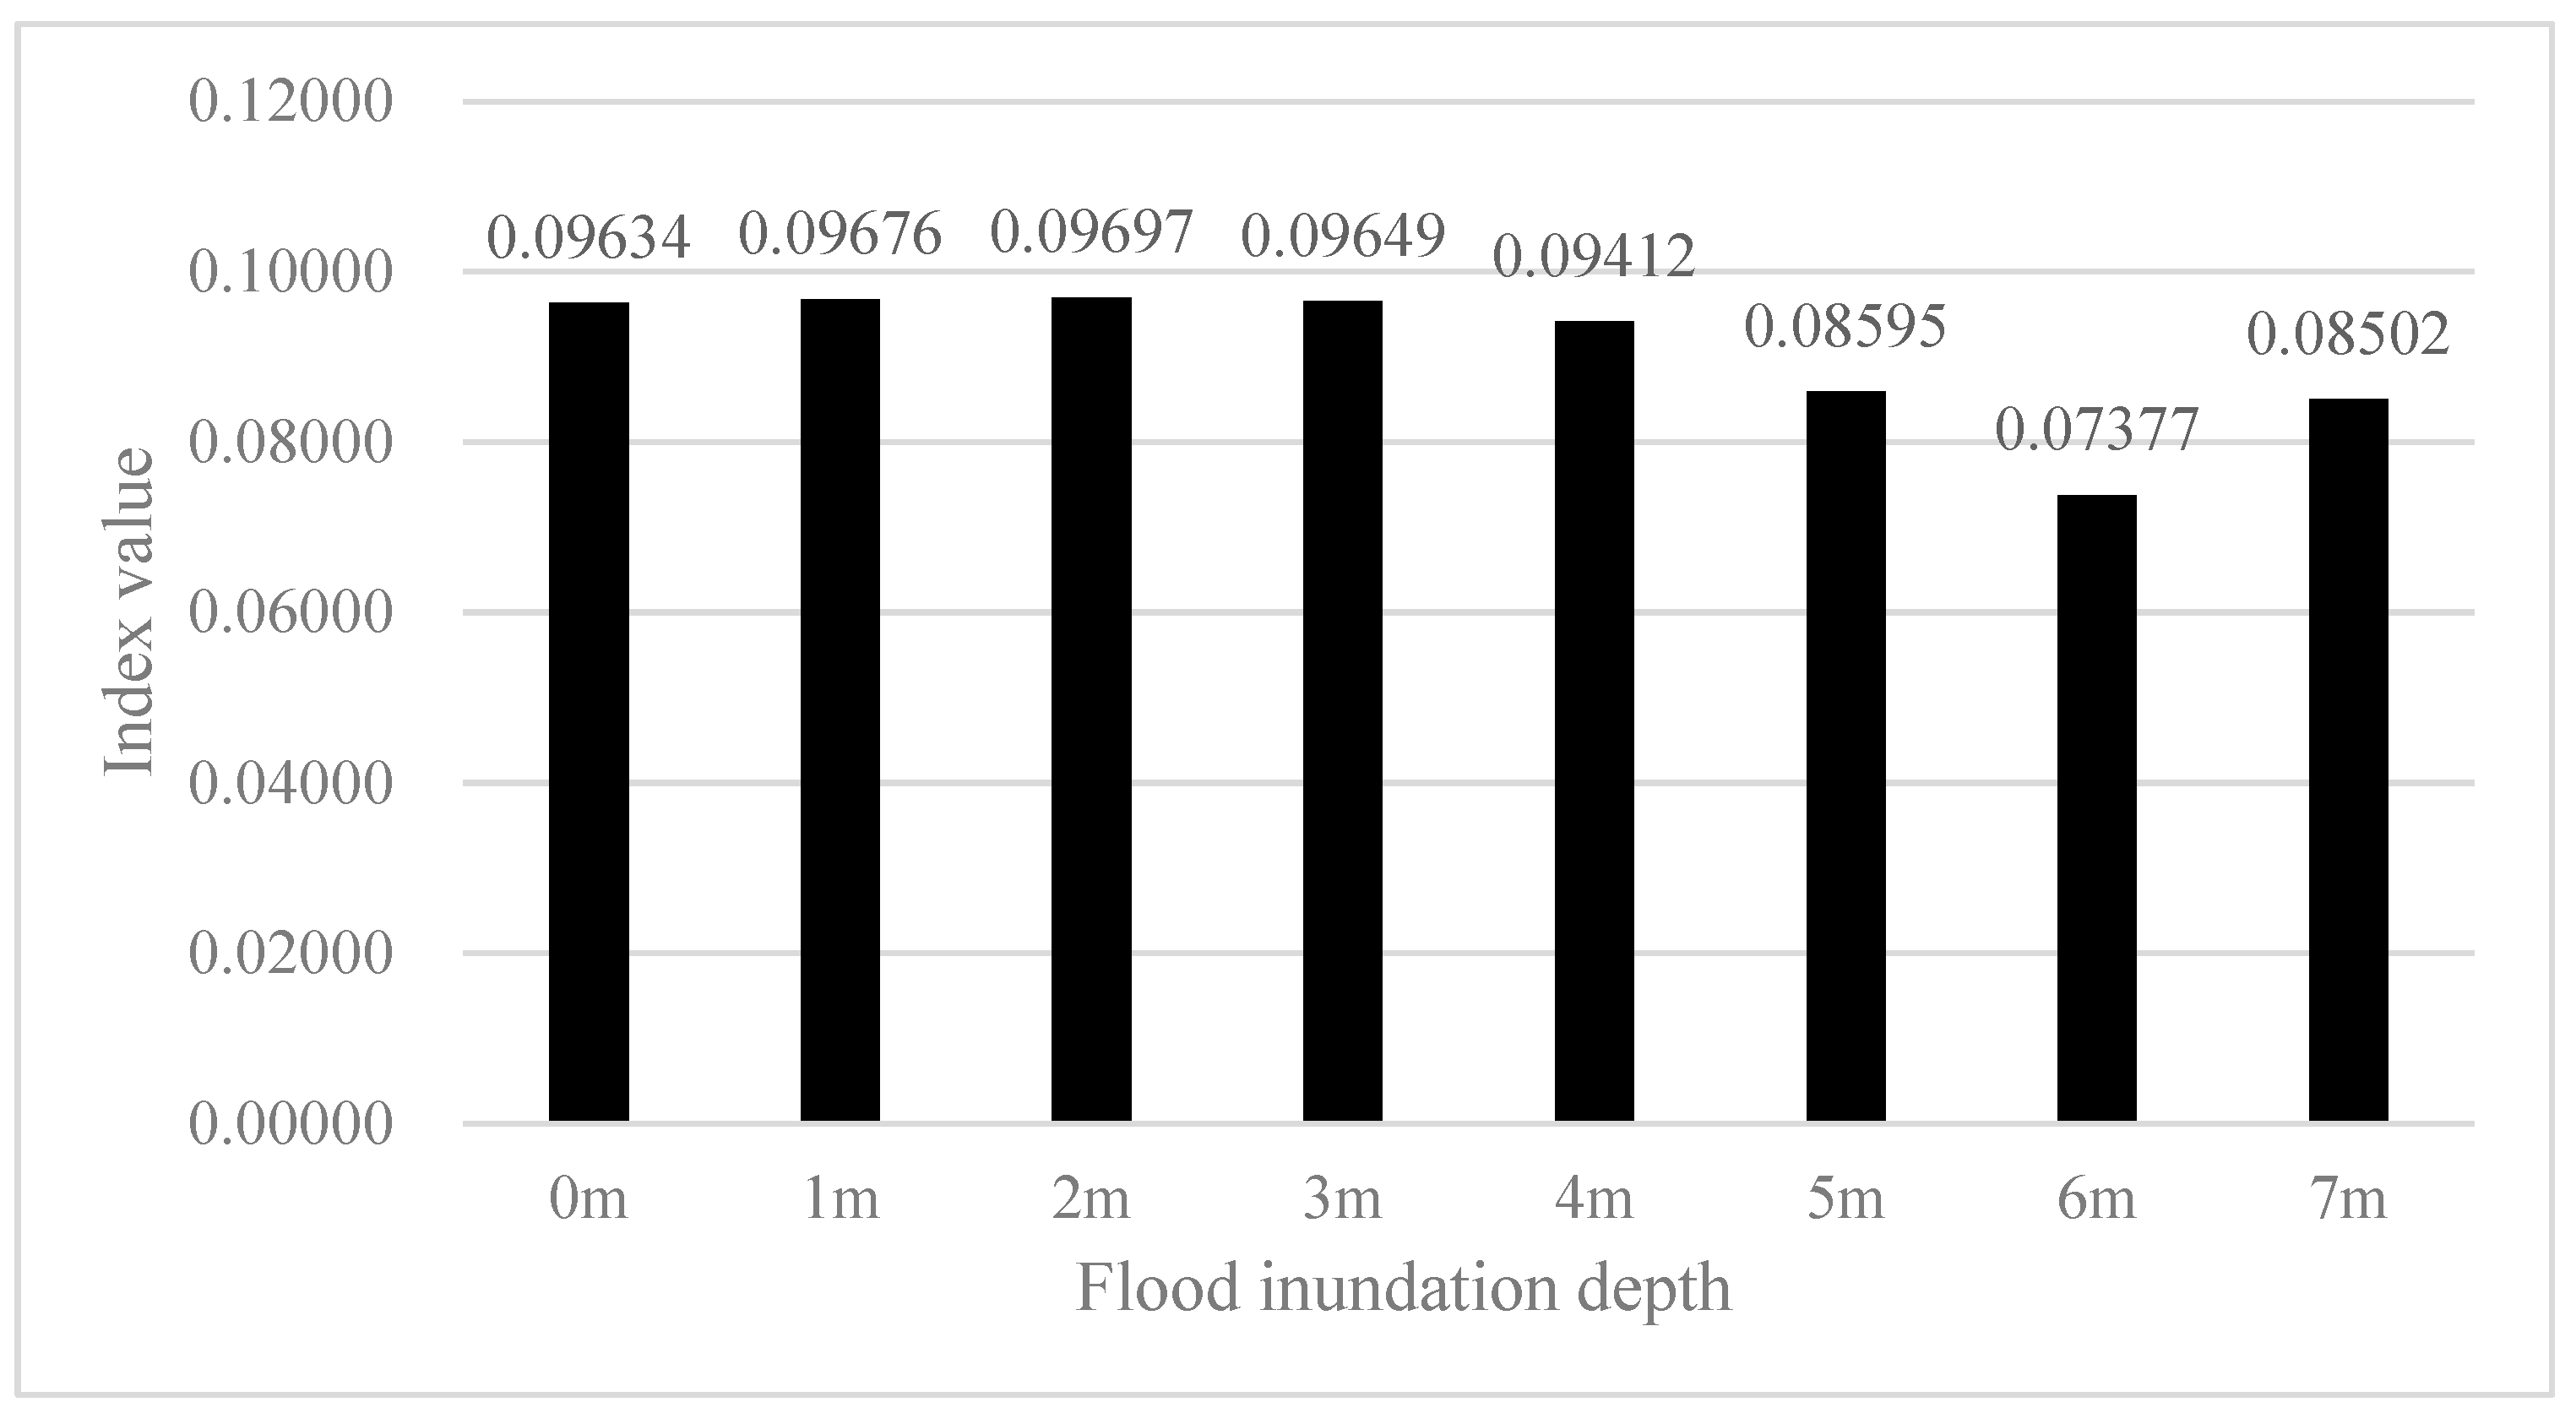
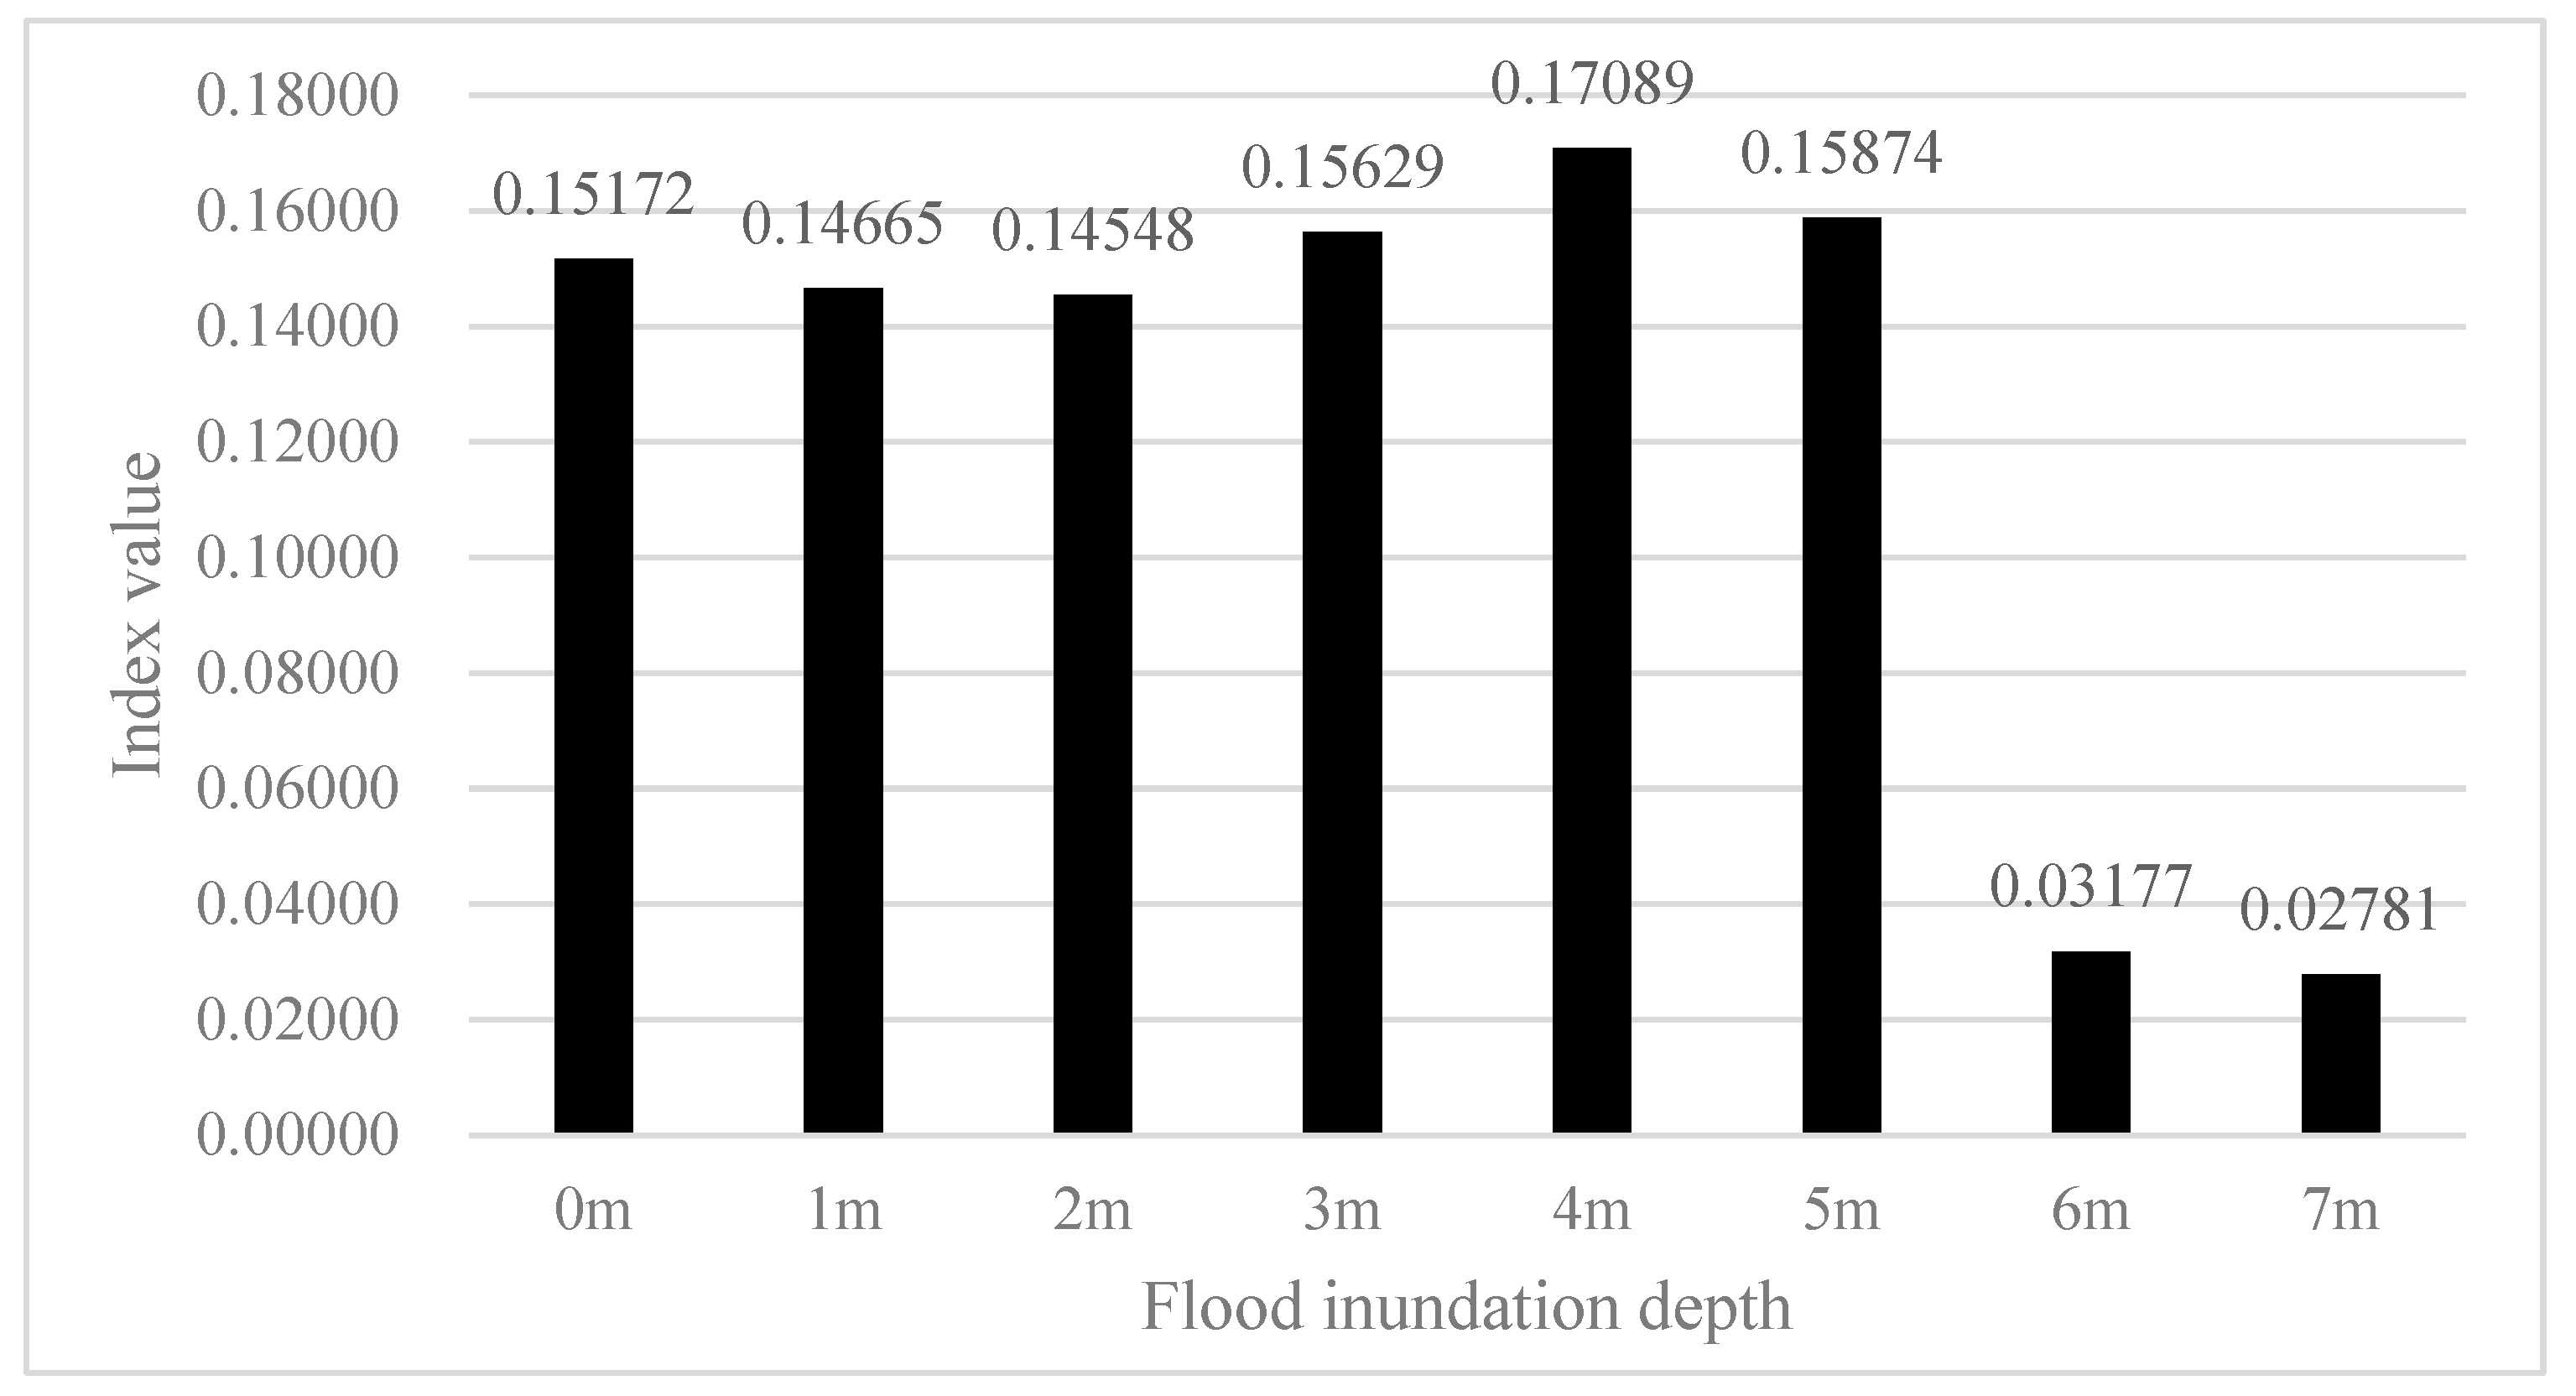
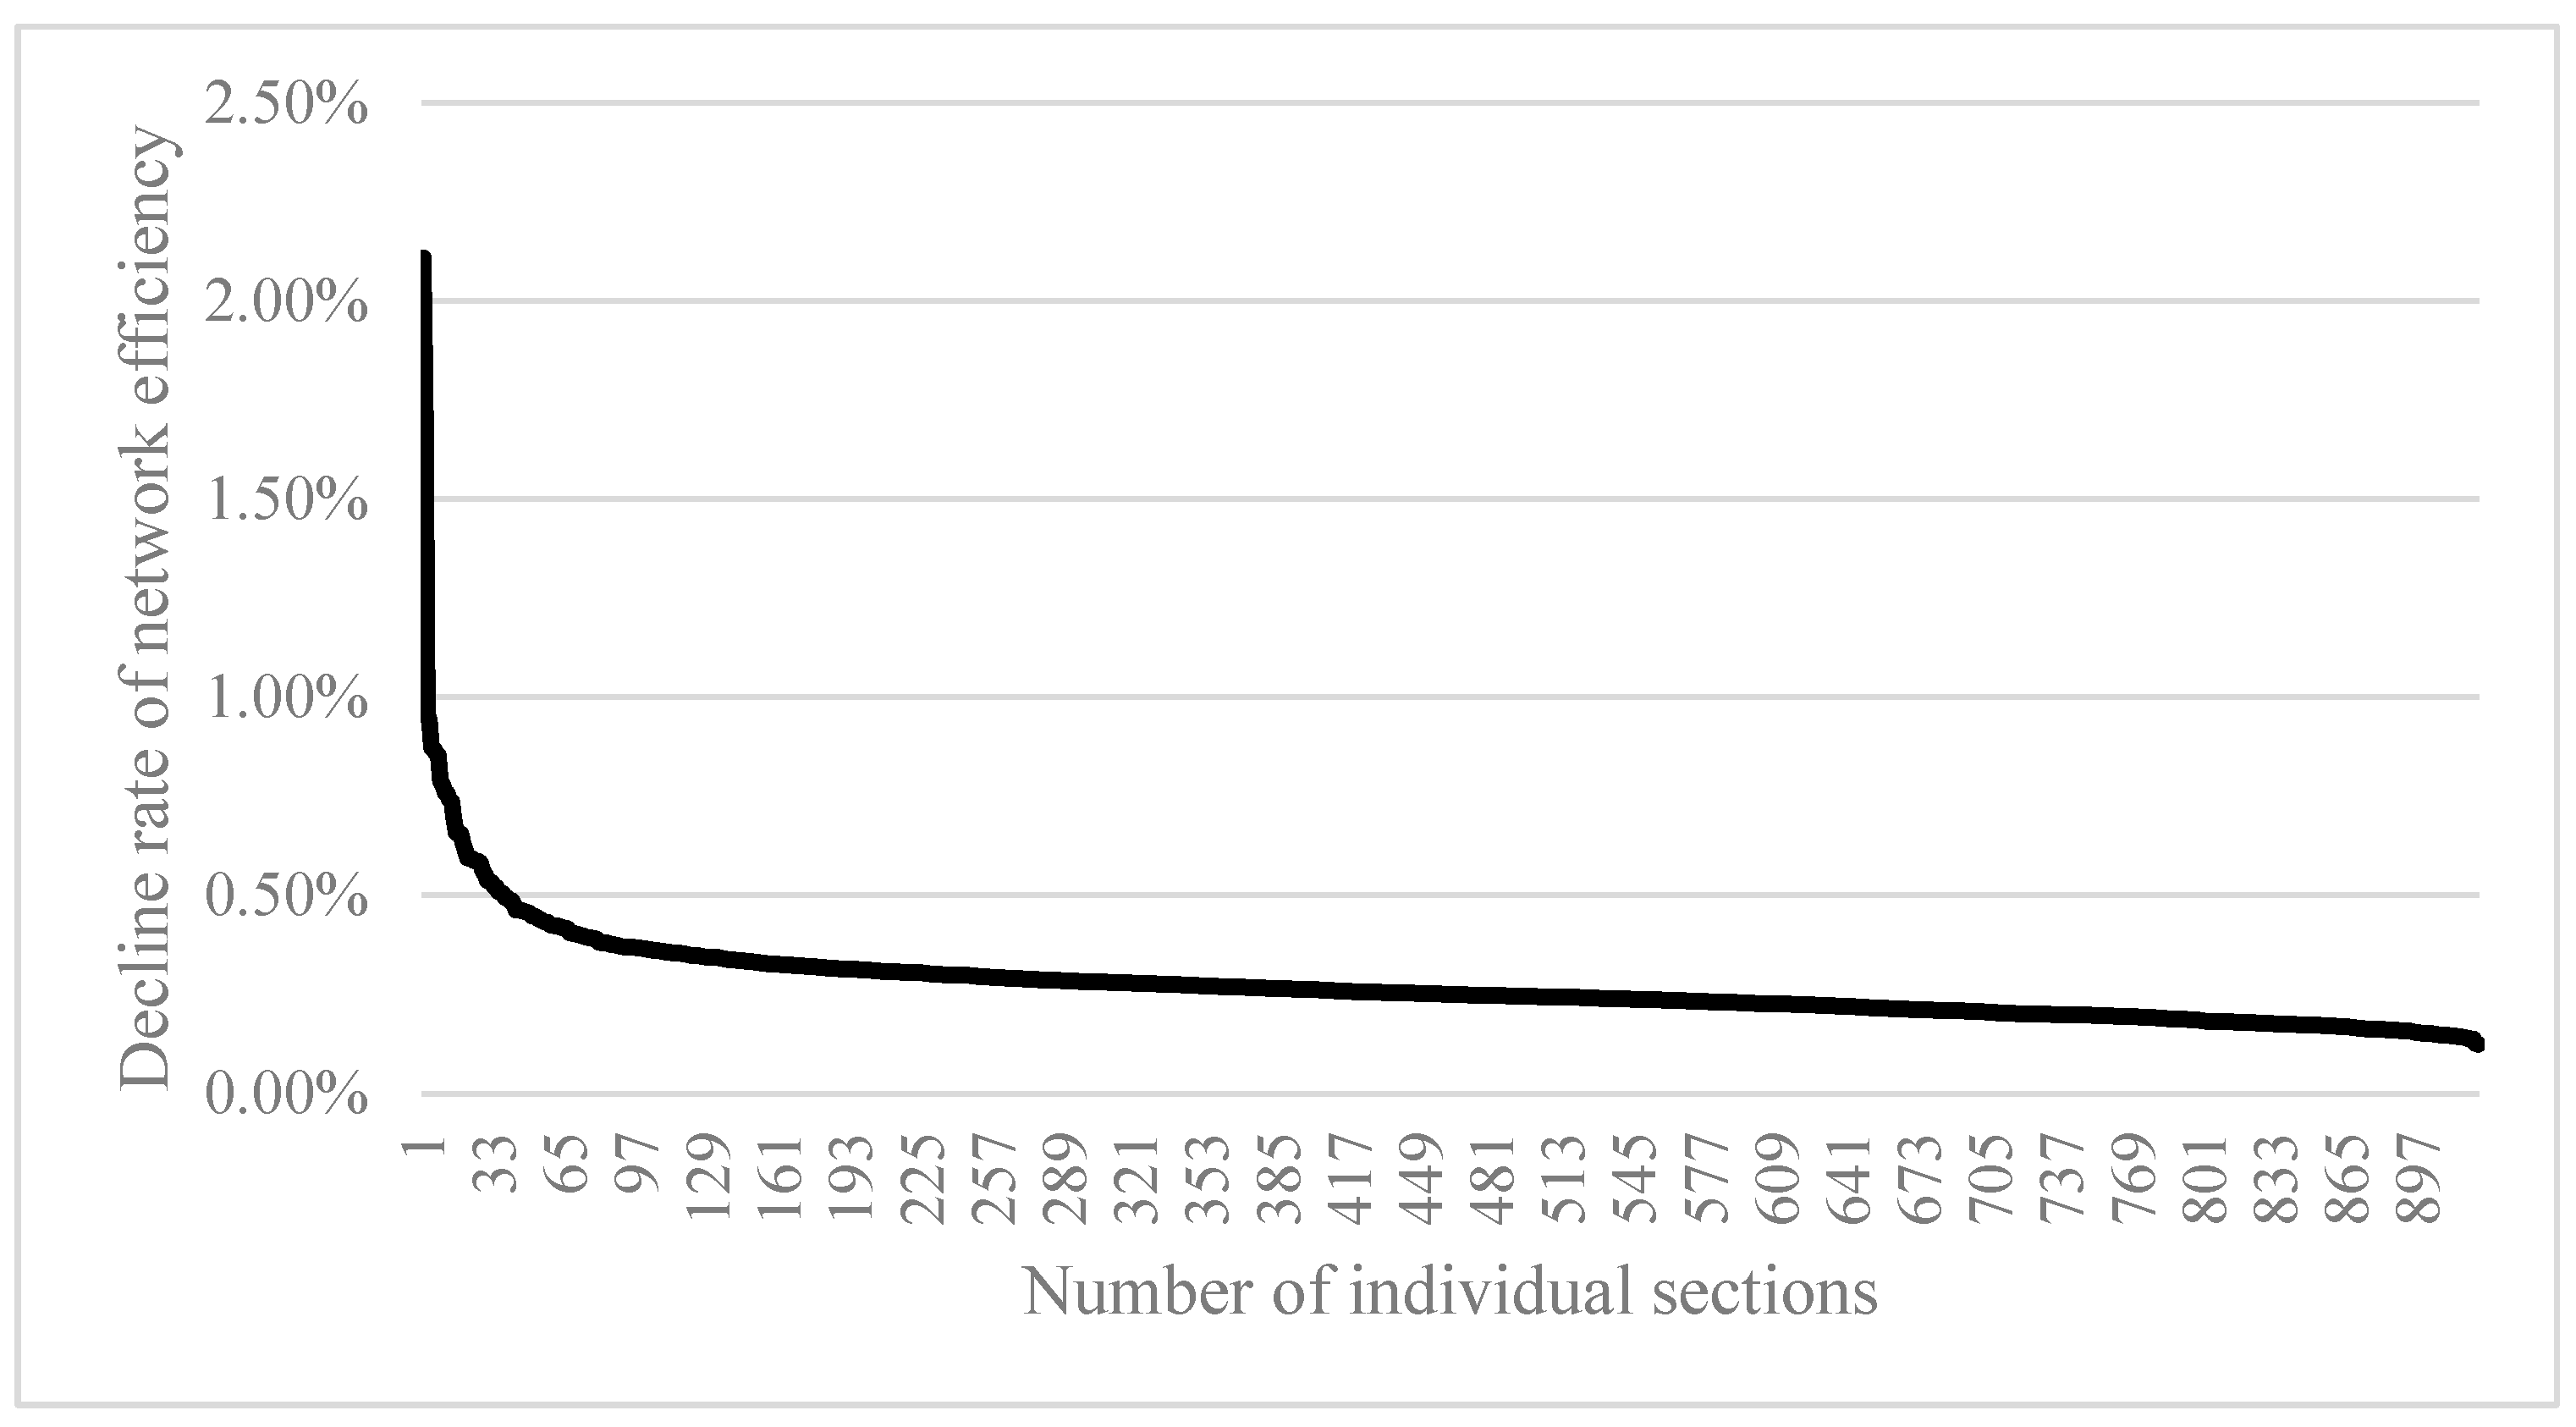
3.1.2. Efficiency Analysis

Figure 8 presents the index value of the efficiency of the road network in terms of the flood inundation depth. The results demonstrate that the traffic network efficiency decreases rapidly as the flooding depth reaches about 4 m. It is worth mentioning that the traffic network efficiency rises with the flooding depth within the interval of 0–2 m. The main reason is that most of the flooded sections at 0–2 m are marginal sections of the traffic network, which leads to an increase in the overall propagation rate of the network. At the same time, the network efficiency is remarkably improved at 6–7 m, with an increase of 18.24%. The reason is that after the flooding depth reaches 7 m, the traffic network becomes lumpy. In other words, a large number of edge sections are submerged, resulting in a close association between sections and growing the connectivity of the remaining traffic network.

3.1.3. Hub Analysis

Through the hub analysis (Figure 9), the hub of the transportation network continues to decline with the increase in flooding depth. For the inundation depth interval of 0–5 m, the hub associated with the interval of 0–1 m decreases rapidly, and that of the interval 1–5 m decreases gradually. Among them, the hub pertinent to the 3–4 m network increases slightly. After the inundation depth reaches 5 m, it decreases significantly, with a declining rate of 79.99%. By examining the plotted results in Figure 7, Figure 8 and Figure 9, we found that after the inundation depth reaches 5 m the remaining road network forms a mass road network. This indicates that the data points are closely connected and some road networks no longer play an intermediary role in the network. This fact also reveals that there are some crucial road sections connecting each other in the road network structure of the study area, although its terrain is moderately flat.

3.2. Network Dynamic Performance Analysis

To measure the performance of the network and identify some key sections, different network interference modes are set up, the network efficiency is taken as the analysis index, and the cumulative attack scheme based on the intermediate number is implemented (the intermediate number refers to the value of this node’s intermediary role in the network, and the attack method represents a way to sort the sections according to the intermediate value and failing in order from high to low). The variation of the network performance is evaluated by using the attack method, degree of cumulative attack, and attack scheme of random cumulative attack (degree refers to how many nodes are connected to a node, and the attack method indicates a way to sort the road sections according to the degree value and failing sequentially from high to low). The predicted results are presented in Figure 10. The plotted results reveal that in the early stage, for example, before the cumulative attack reaches 146 sections (accounting for about 15.8%), the network performance under the degree cumulative attack and random cumulative attack declines slowly and is basically the same. When there are more than 146 cumulative attacks, the degree of the cumulative attack makes a considerable reduction in the network performance and gradually becomes closer to the scenario pertaining to the intermediate cumulative attack. Simultaneously, the intermediate cumulative attack mode will make the network performance decay more rapidly. As shown in Figure 10, the reduction of the network performance relatively follows a lower rate before destroying 155 road sections (accounting for 16.77%). However, when it exceeds 155, the network sharply reduces in the form of a band and the predicted graph exhibits a cliff-like lessening, whereby more than 207 road sections are destroyed (accounting for 22.4%).

4. Discussion

4.1. Resilience Characteristics and Current Situation of the Traffic Network in the Study Area

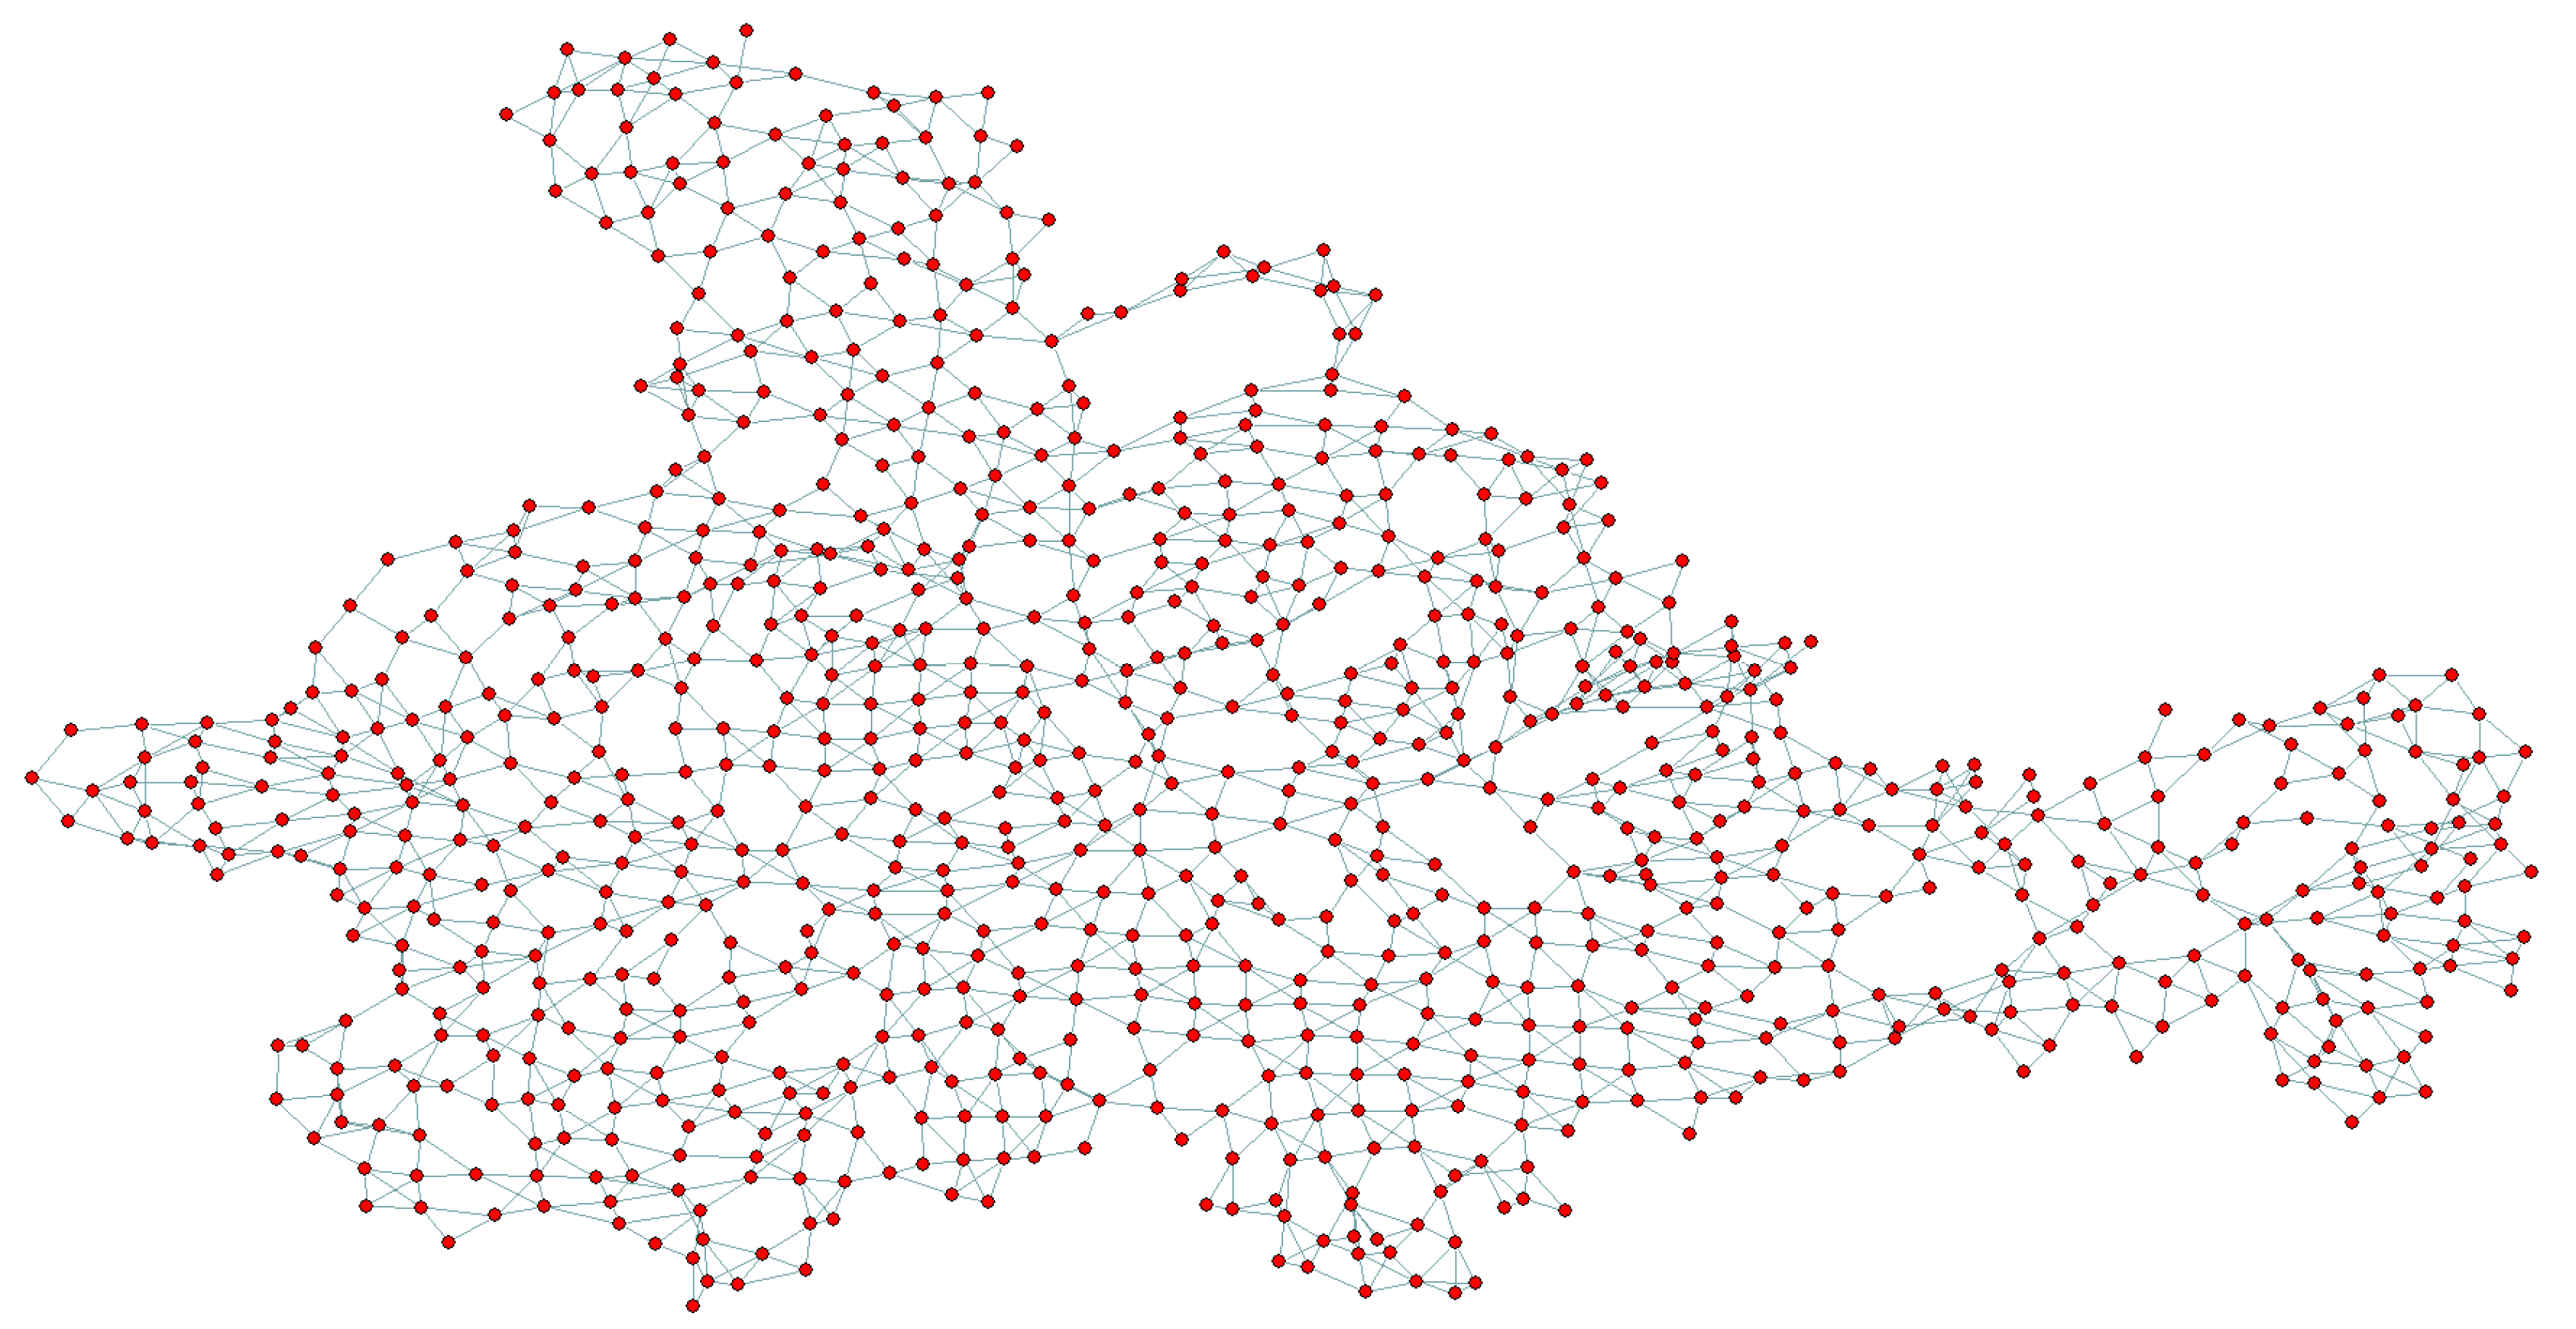
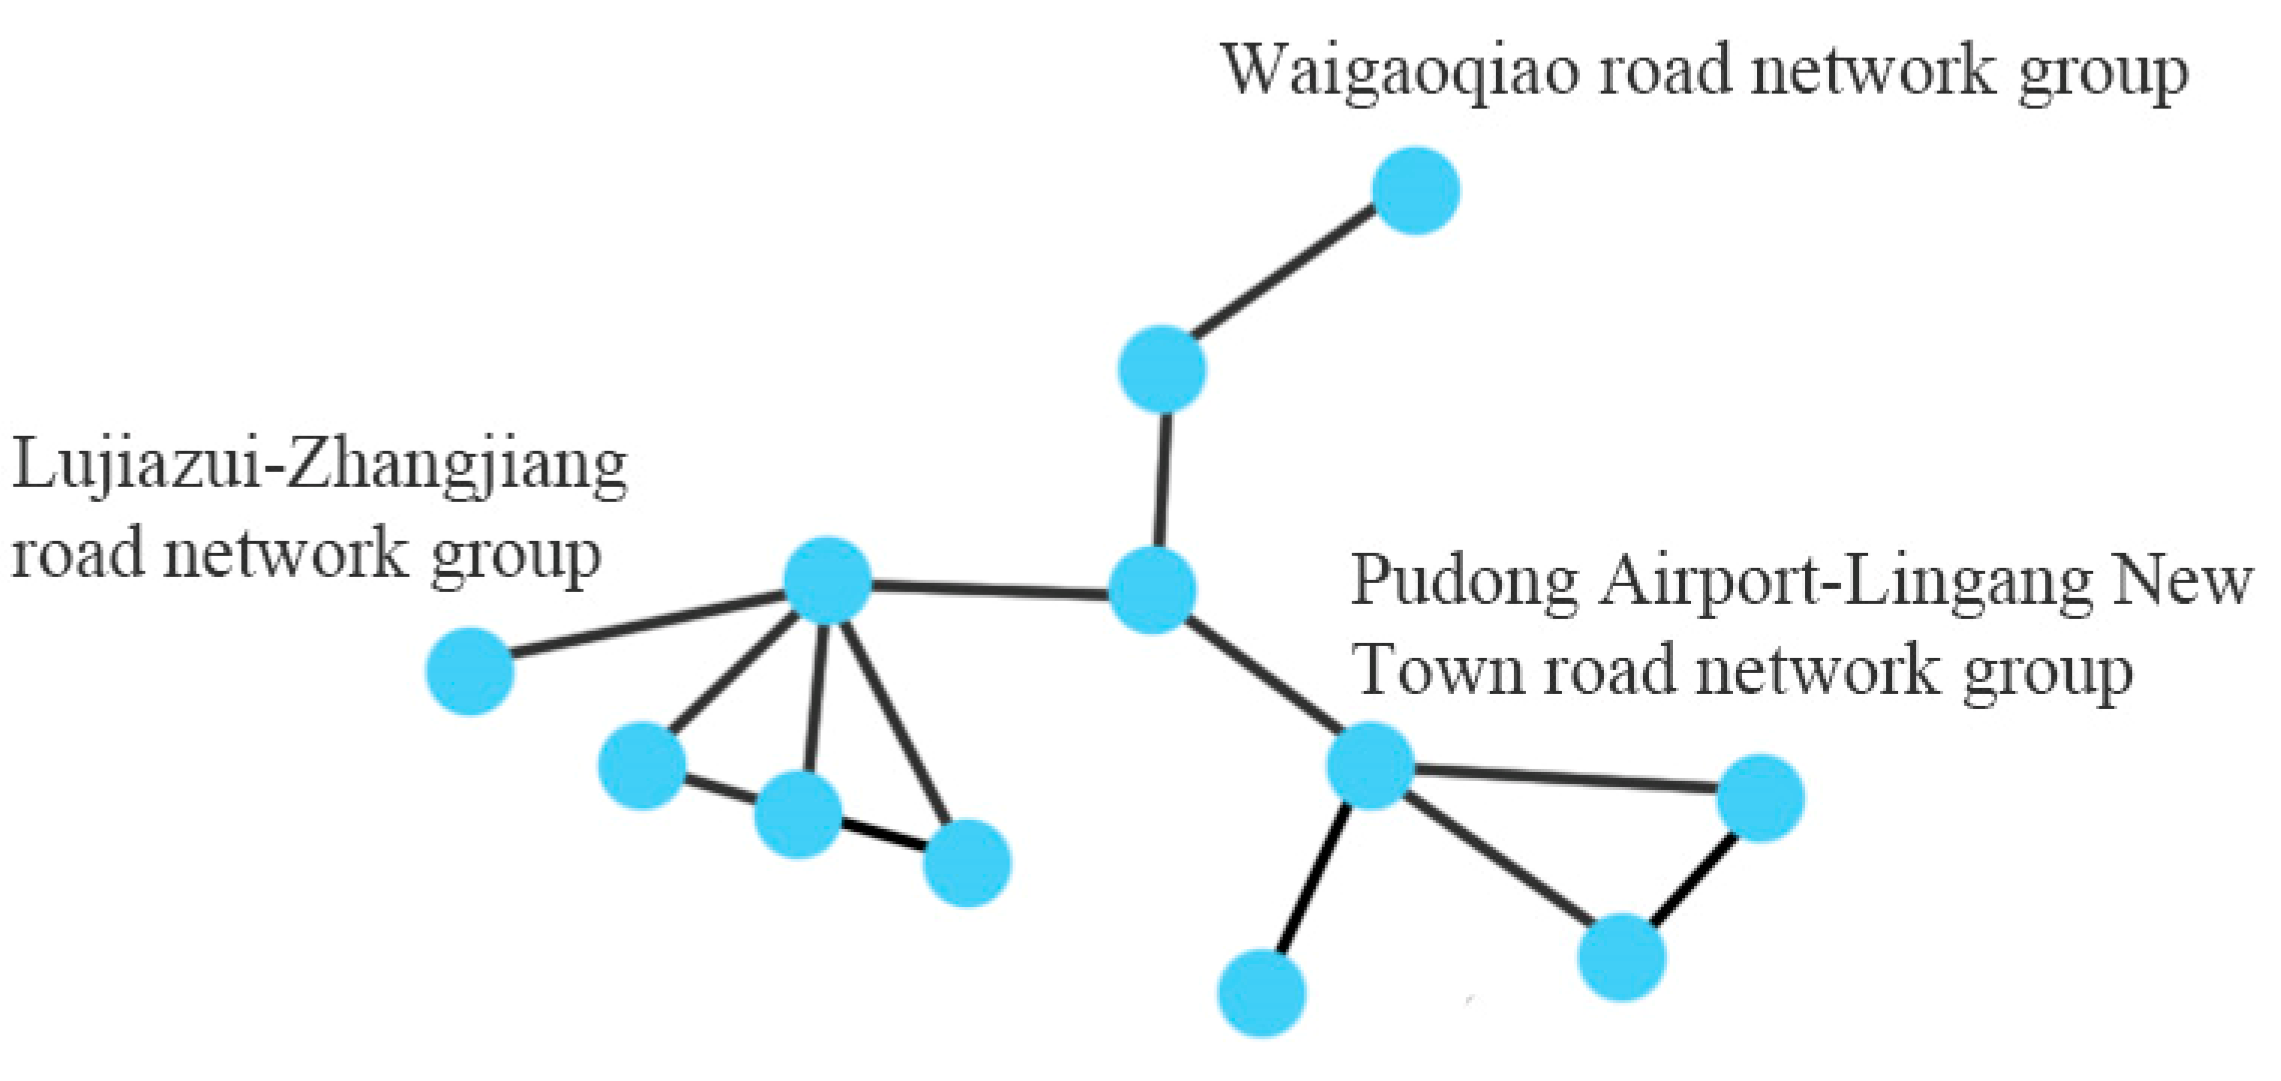
4.1.1. The Road Network Structure in the Study Area Presents the Characteristics of “Centralized Decentralized Combination”

The above analysis indicates that the road network structure of the study area presents the characteristics of a “centralized decentralized combination”. It implies that there are multiple group style “Island Road Networks” which are incorporated in the real road network as the “Lujiazui Zhangjiang High Tech”, “Waigaoqiao”, and “Lingang New City” groups, and these “Island Road Networks” are connected by some important trunk roads. Their corresponding abstract expression has been schematically presented in Figure 11. On the other hand, it also reveals that the vast hinterland of PNA still has a large development space and low road network density. This issue is of remarkable significance for the structural design of the road network in coastal areas (such as the grade design of trunk roads).

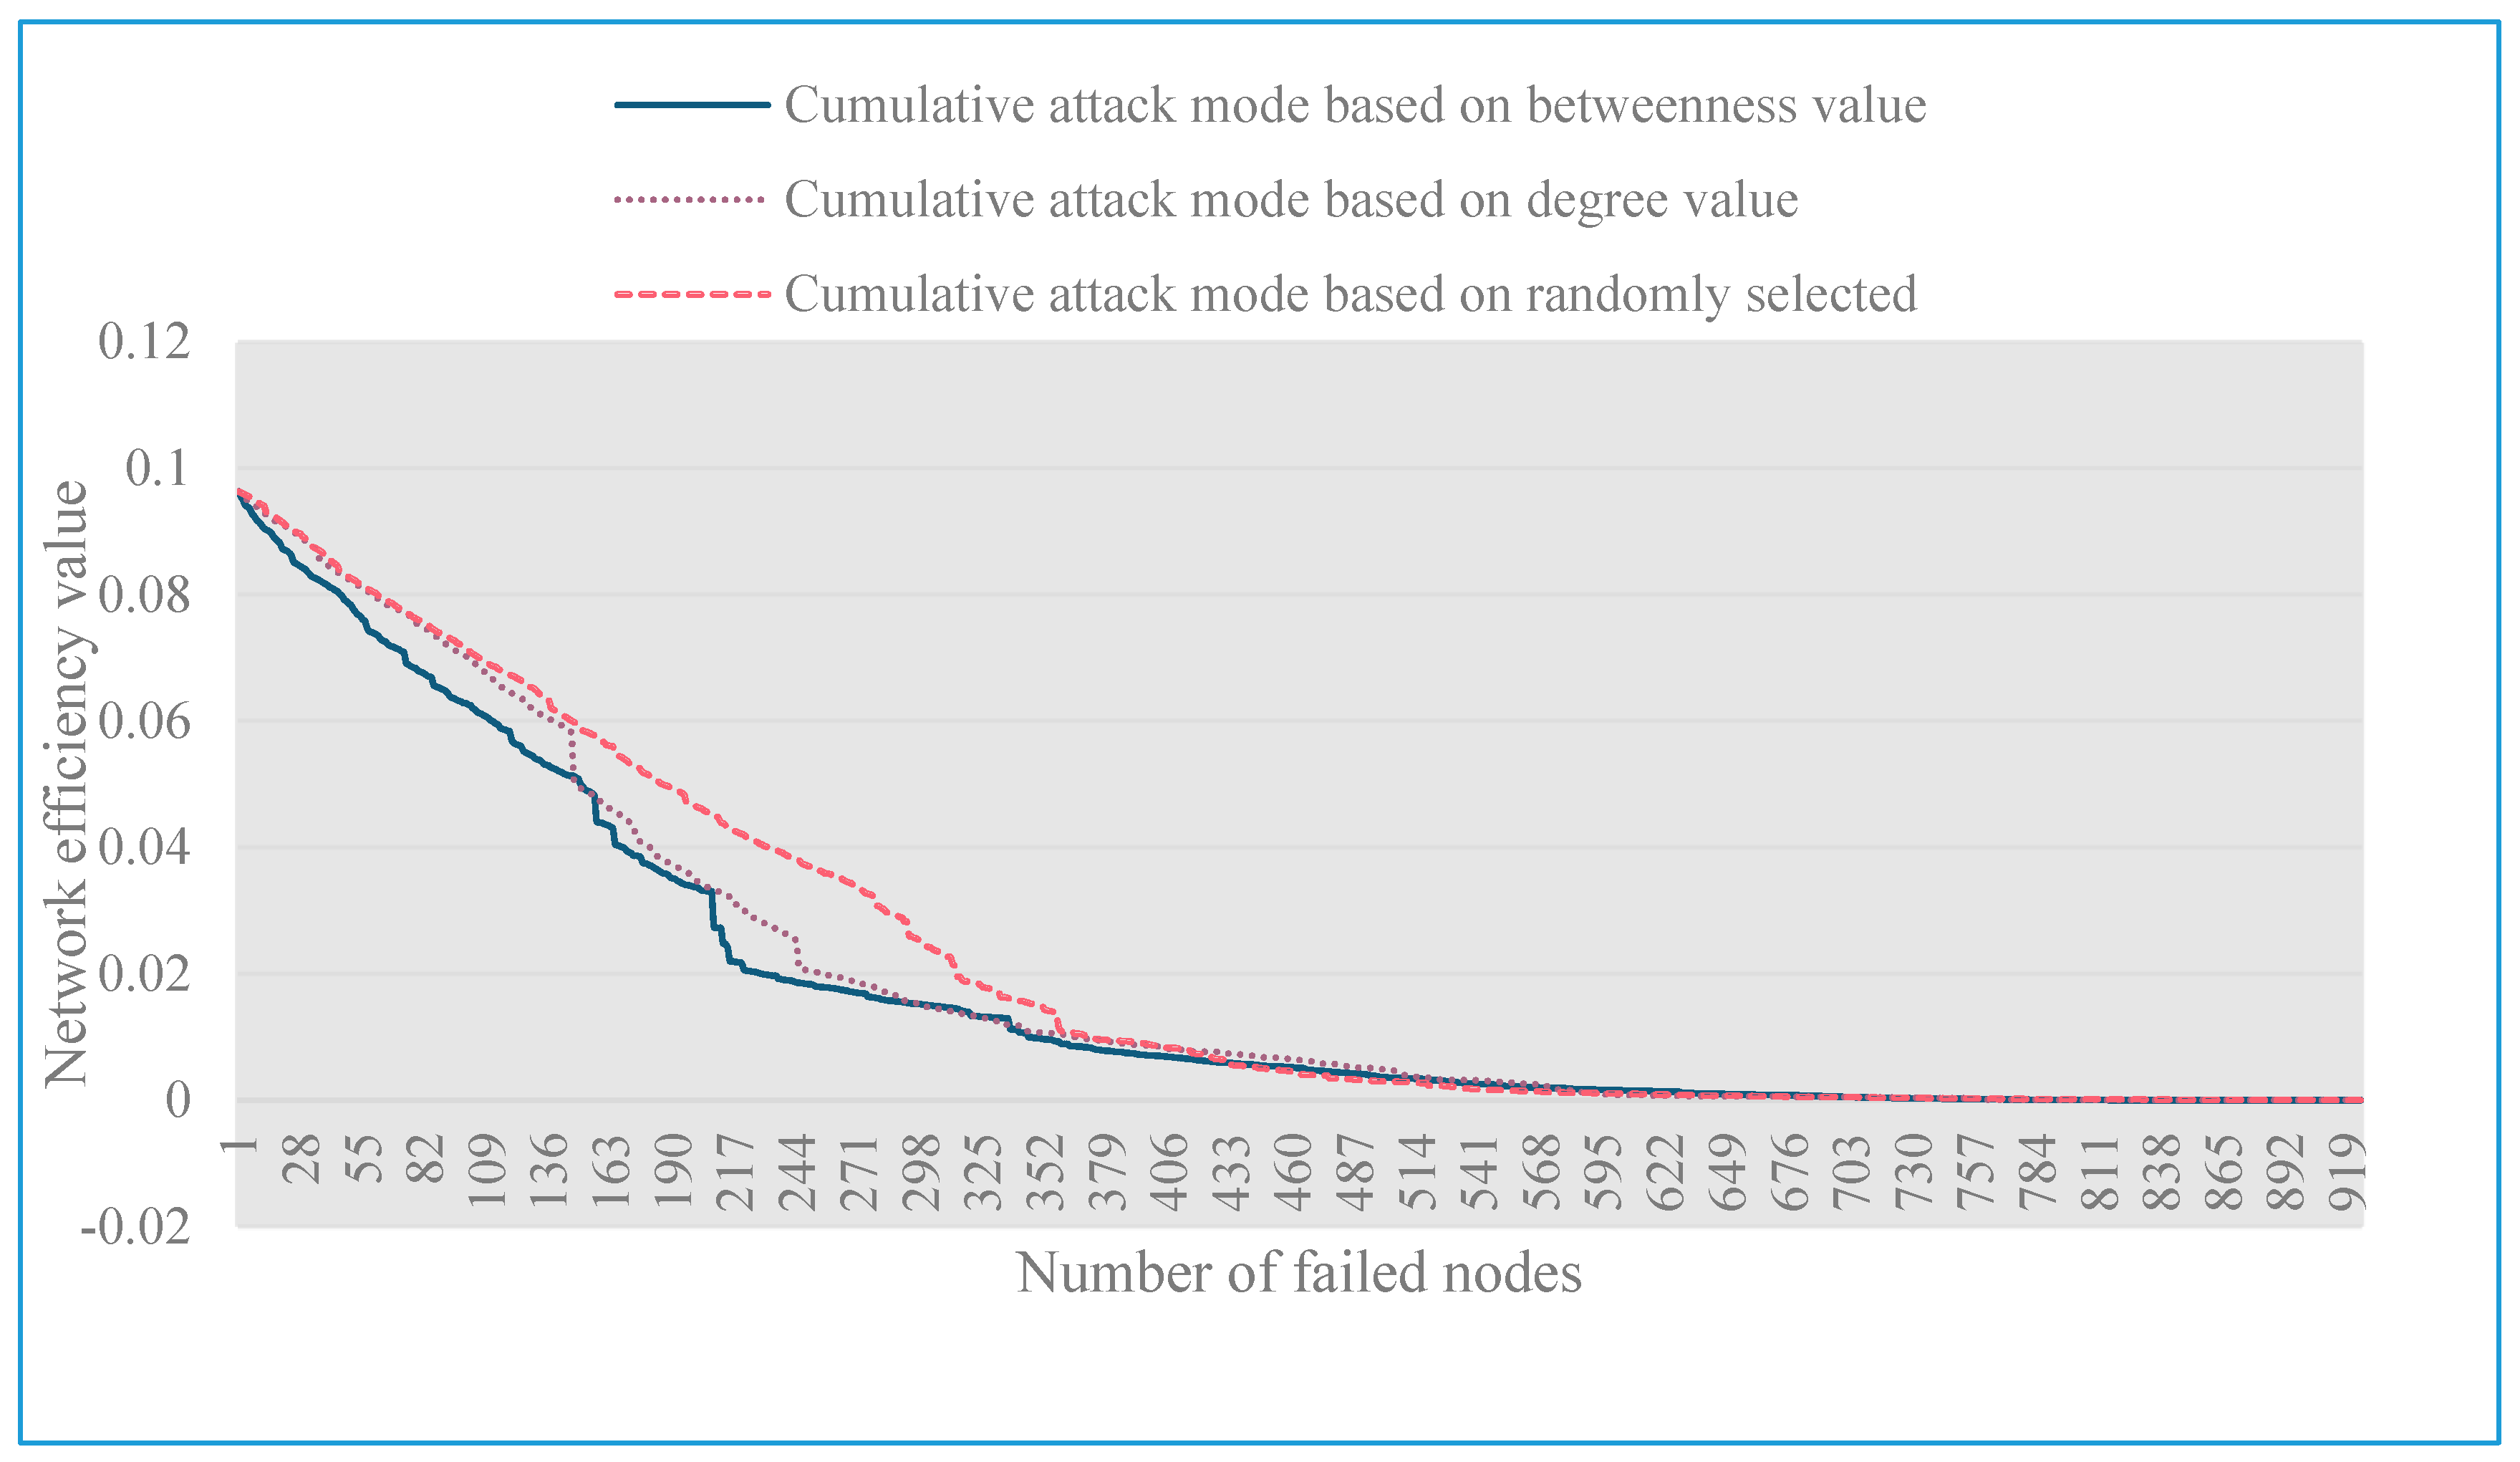
4.1.2. The Road Network in the Study Area Has Certain Survivability, but It Is Vulnerable to Selective Attacks

On the one hand, as shown in Figure 7, the average performance decline of 0–3 m is only 1% per meter, but the performance decline of 3–4 m reaches 8.9%. It can be seen that the traffic network in the study area has certain damage resistance within 3 m of flooding depth. On the other hand, the performed research shows that under different attack strategies, the road network of the study area has high resistance to random attacks, indicating the high survivability and strong transmission ability of the network data. The interference intensity of the selective attack on the network is higher than that of a random attack, showing the high vulnerability and poor ability of network information transmission. It is worth mentioning that the impact of the degree-based attack strategy on the network performance is consistent with the random-based attack strategy in the early stages and the medium-based attack strategy in the later stages. This observation indicates the adjustment ability of the road section between other sections, that is, a high controllability index of the road section can easily influence the resilience of the road network. Therefore, the purpose of enhancing the resilience of the traffic network in the study area can be achieved by strengthening the medium traffic nodes. This issue is also of great significance for improving the design of road networks in coastal areas, reasonably allocating network resources, and enhancing its anti-interference ability.

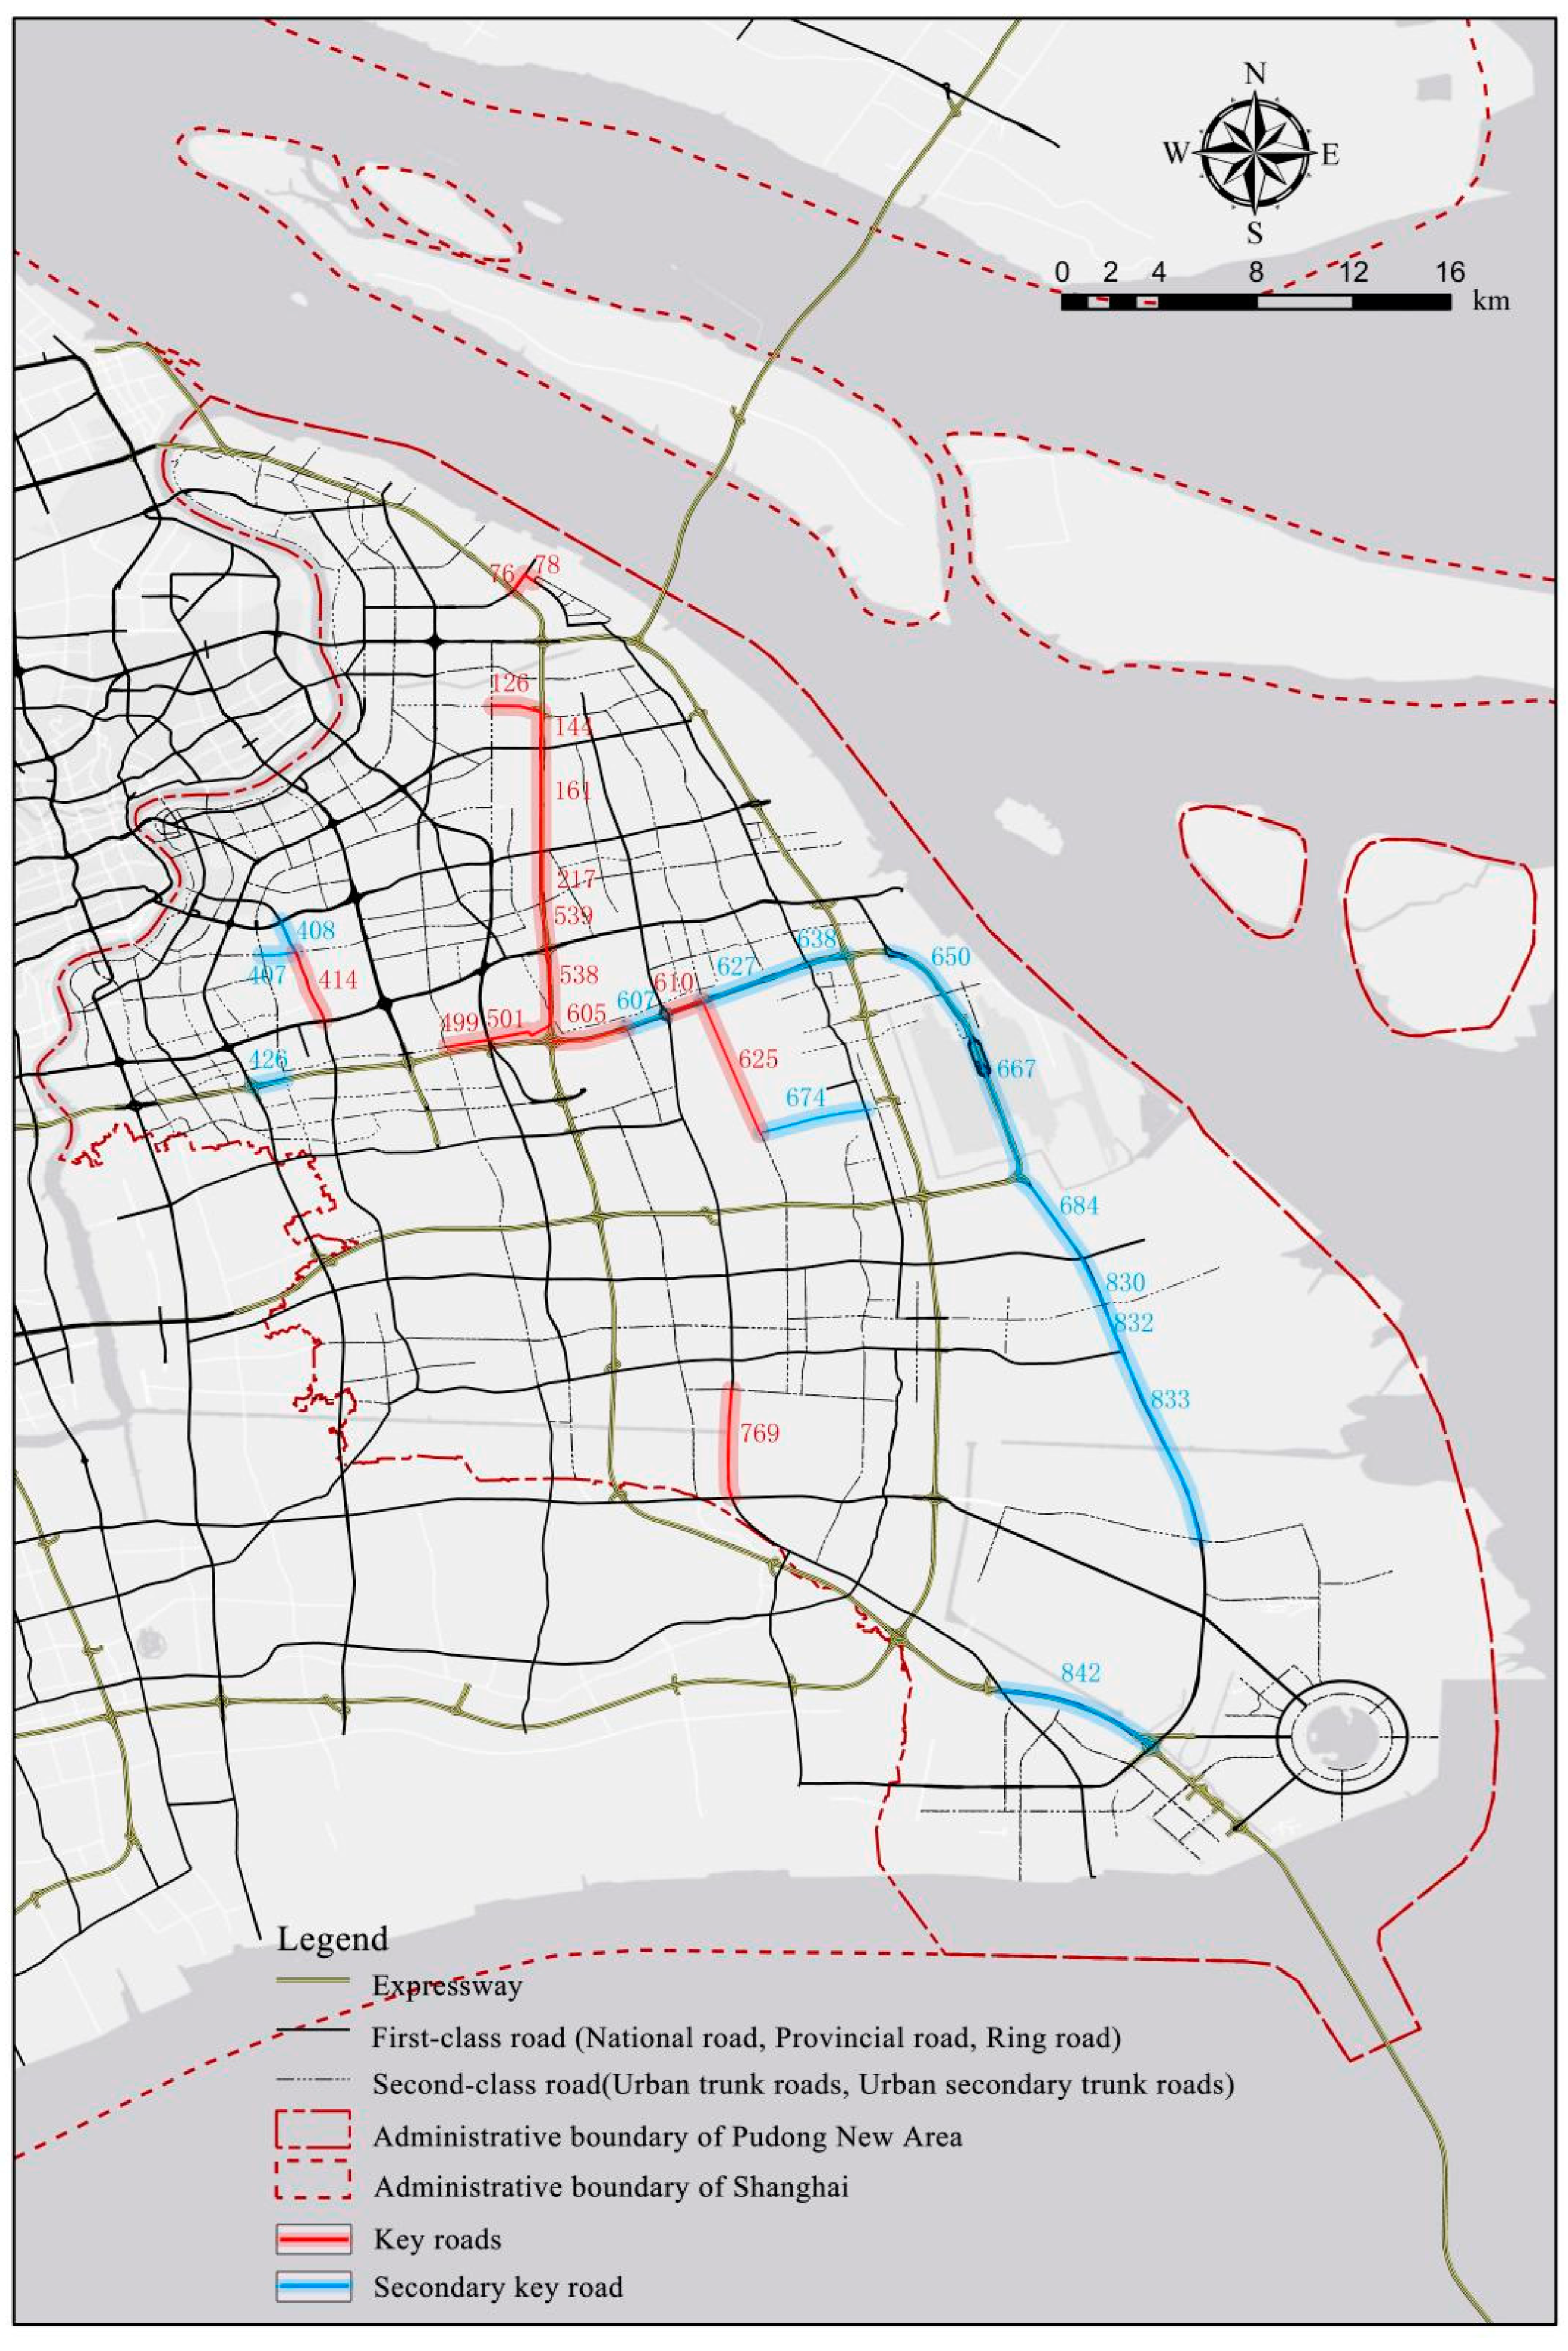
4.1.3. The Spatial Distribution of Key Road Sections of the Research Road Network with Hierarchy and Aggregation

The extensive research also displays that the road network in the study area is subjected to uncertainty and dynamicity under the interference situation, and there are some influencing key nodes as well. The failure of key nodes will instantly lead to network paralysis. By ranking the impact of various road sections on network performance (Figure 12), we found that the impact of damage to a single road section on the network performance varies from 0.13% to 2.11%. Based on the results of network performance analysis, the road network nodes are then divided into high-level key sections, secondary key sections, and other level sections according to the amount of reduction. In particular, if the lessening rate of network performance after damage exceeds 0.8%, it is a high-level key section. If the aforementioned rate is between 0.55% and 0.8%, it represents a secondary key section. As shown in Figure 13, the obtained results reveal that the road network in the study area has a special hierarchical structure, and these key road sections in space are close to each other and exhibit aggregation. According to this law, the measures related to disaster prevention or rescue can be provided.

4.2. Resilience Characteristics and Change Trend of Traffic Network in the Study Area

Coastal areas are typically positioned downstream of rivers. In the downstream areas, alluvial plains are formed. Climate change in coastal cities not only exhibits a powerful impact on climate fluctuations compared with interior cities, but also results in major problems such as rapid sea level rise, frequent and severe climate events, massive losses from marine disasters, and grave impacts of meteorological disasters. With the continuous development of the economy and technology, the links between coastal urban agglomerations will become closer, the urbanization effect will become more apparent, and the impact of disasters on the whole region will be prolonged. Therefore, it is necessary to summarize the process of changing the flood characteristics of the coastal urban road network in order to guide future planning. Through the above research and analysis, the flooding process of the traffic network in the study area has particular characteristic changes as follows: the edge flooding stage, traffic island stage, dendritic flooding stage, and scattered flooding stage. These stages are displayed in some detail as follows:
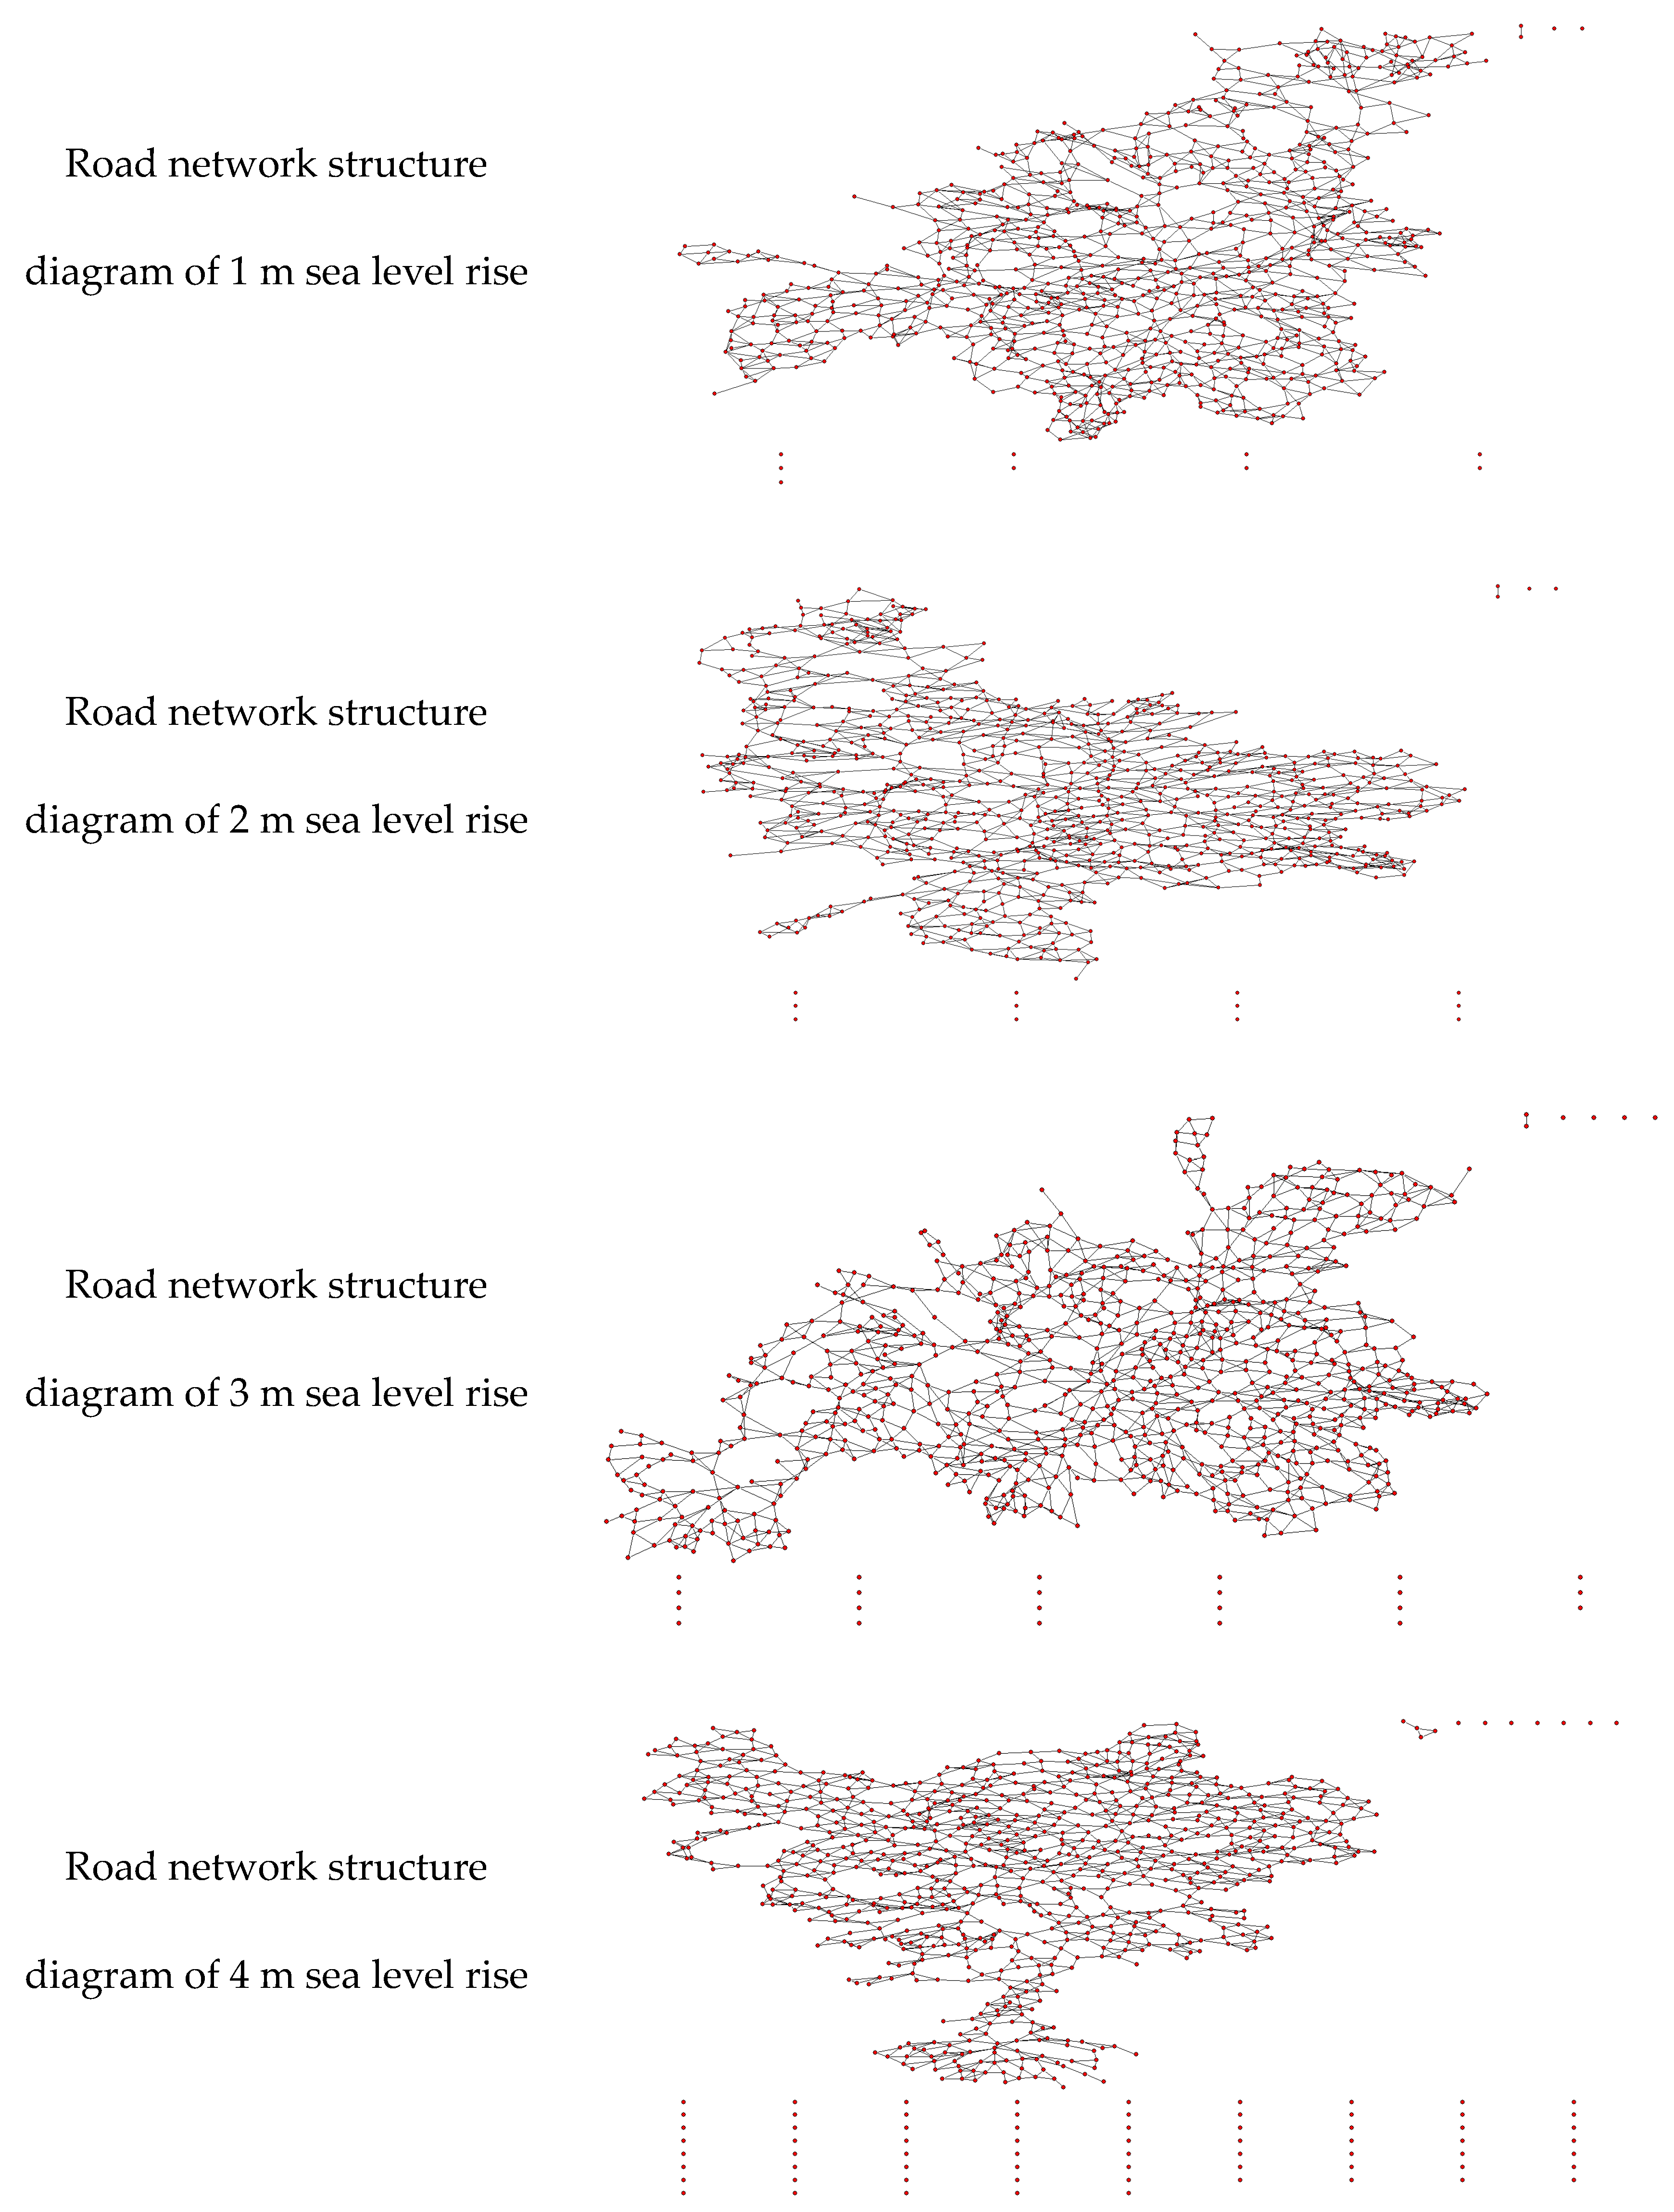
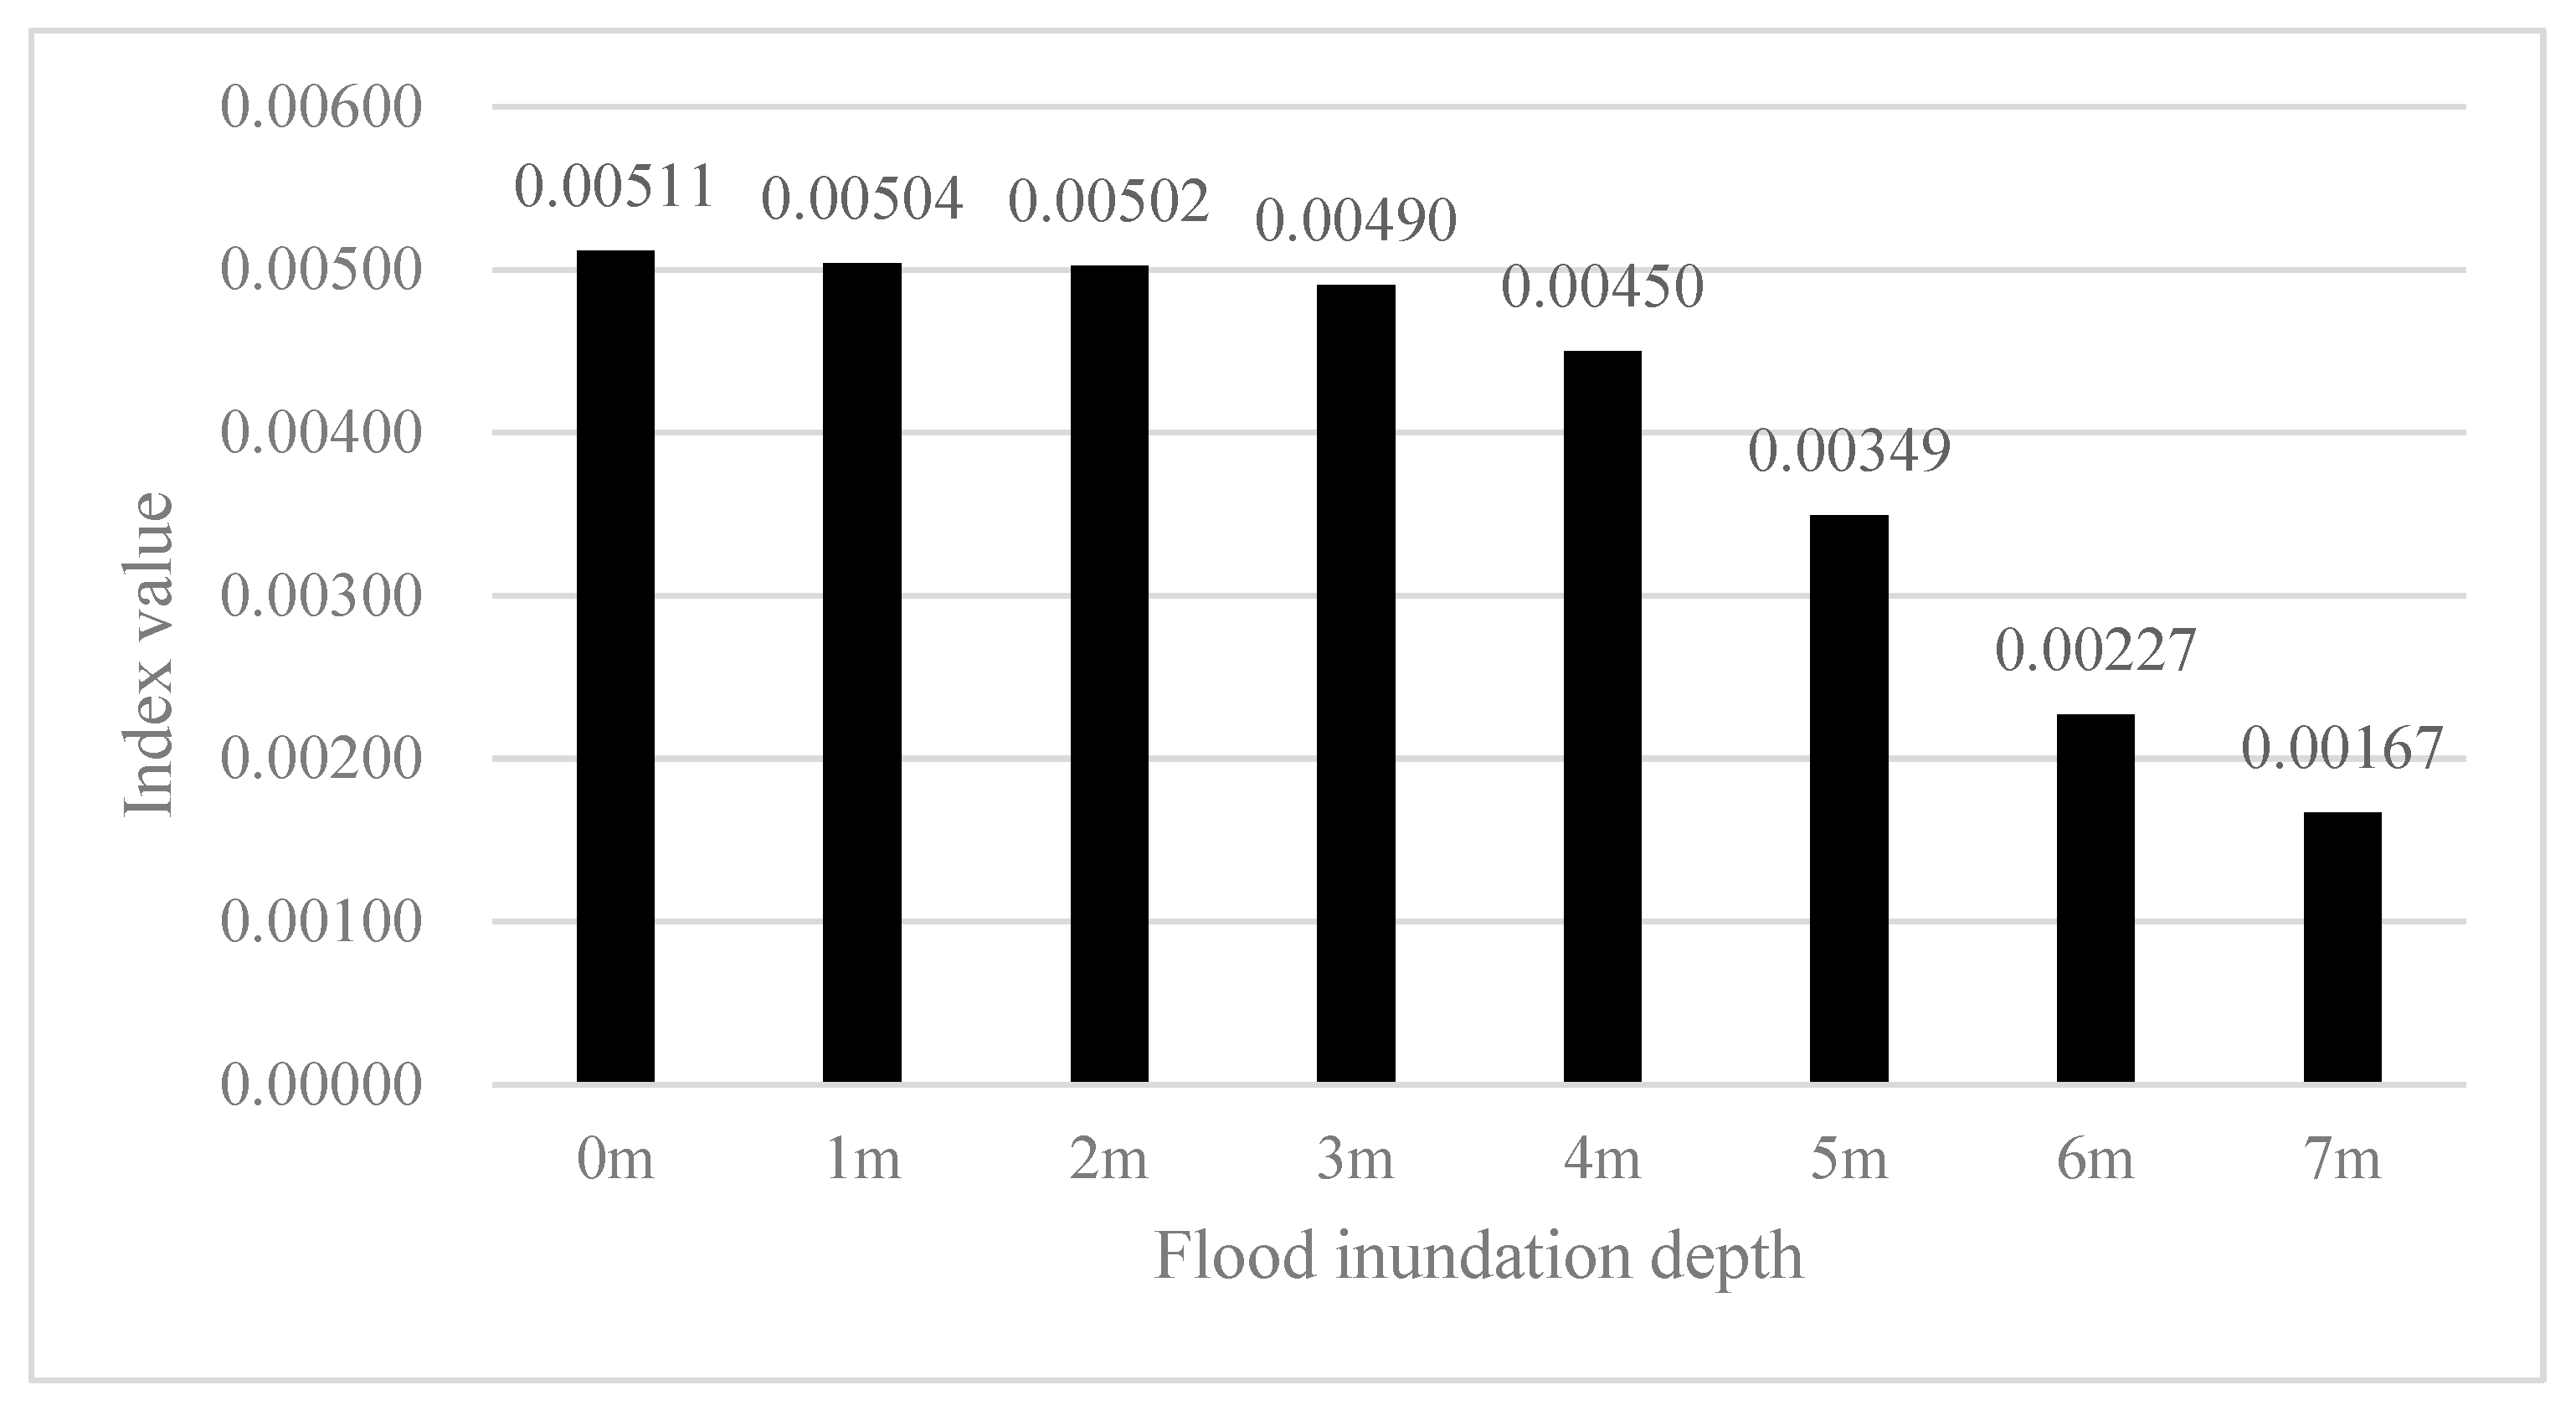
  • In the stage of edge flooding (i.e., in the process of rising the depth of flooding by 0–3 m), the traffic network in the study area still retains the shape of a square block road network with Chinese features, and most of the inundated sections are non-core areas of the traffic system and land reclamation areas.
  • In the stage of the traffic island (i.e., after increasing the flooding depth to more than 3 m), the traffic island appears in the traffic system of the study area. In other words, multiple large and small connected subgraphs are generated, and the roads in some areas can still pass, but due to the flood disaster, traffic is no longer connected to the outside world.
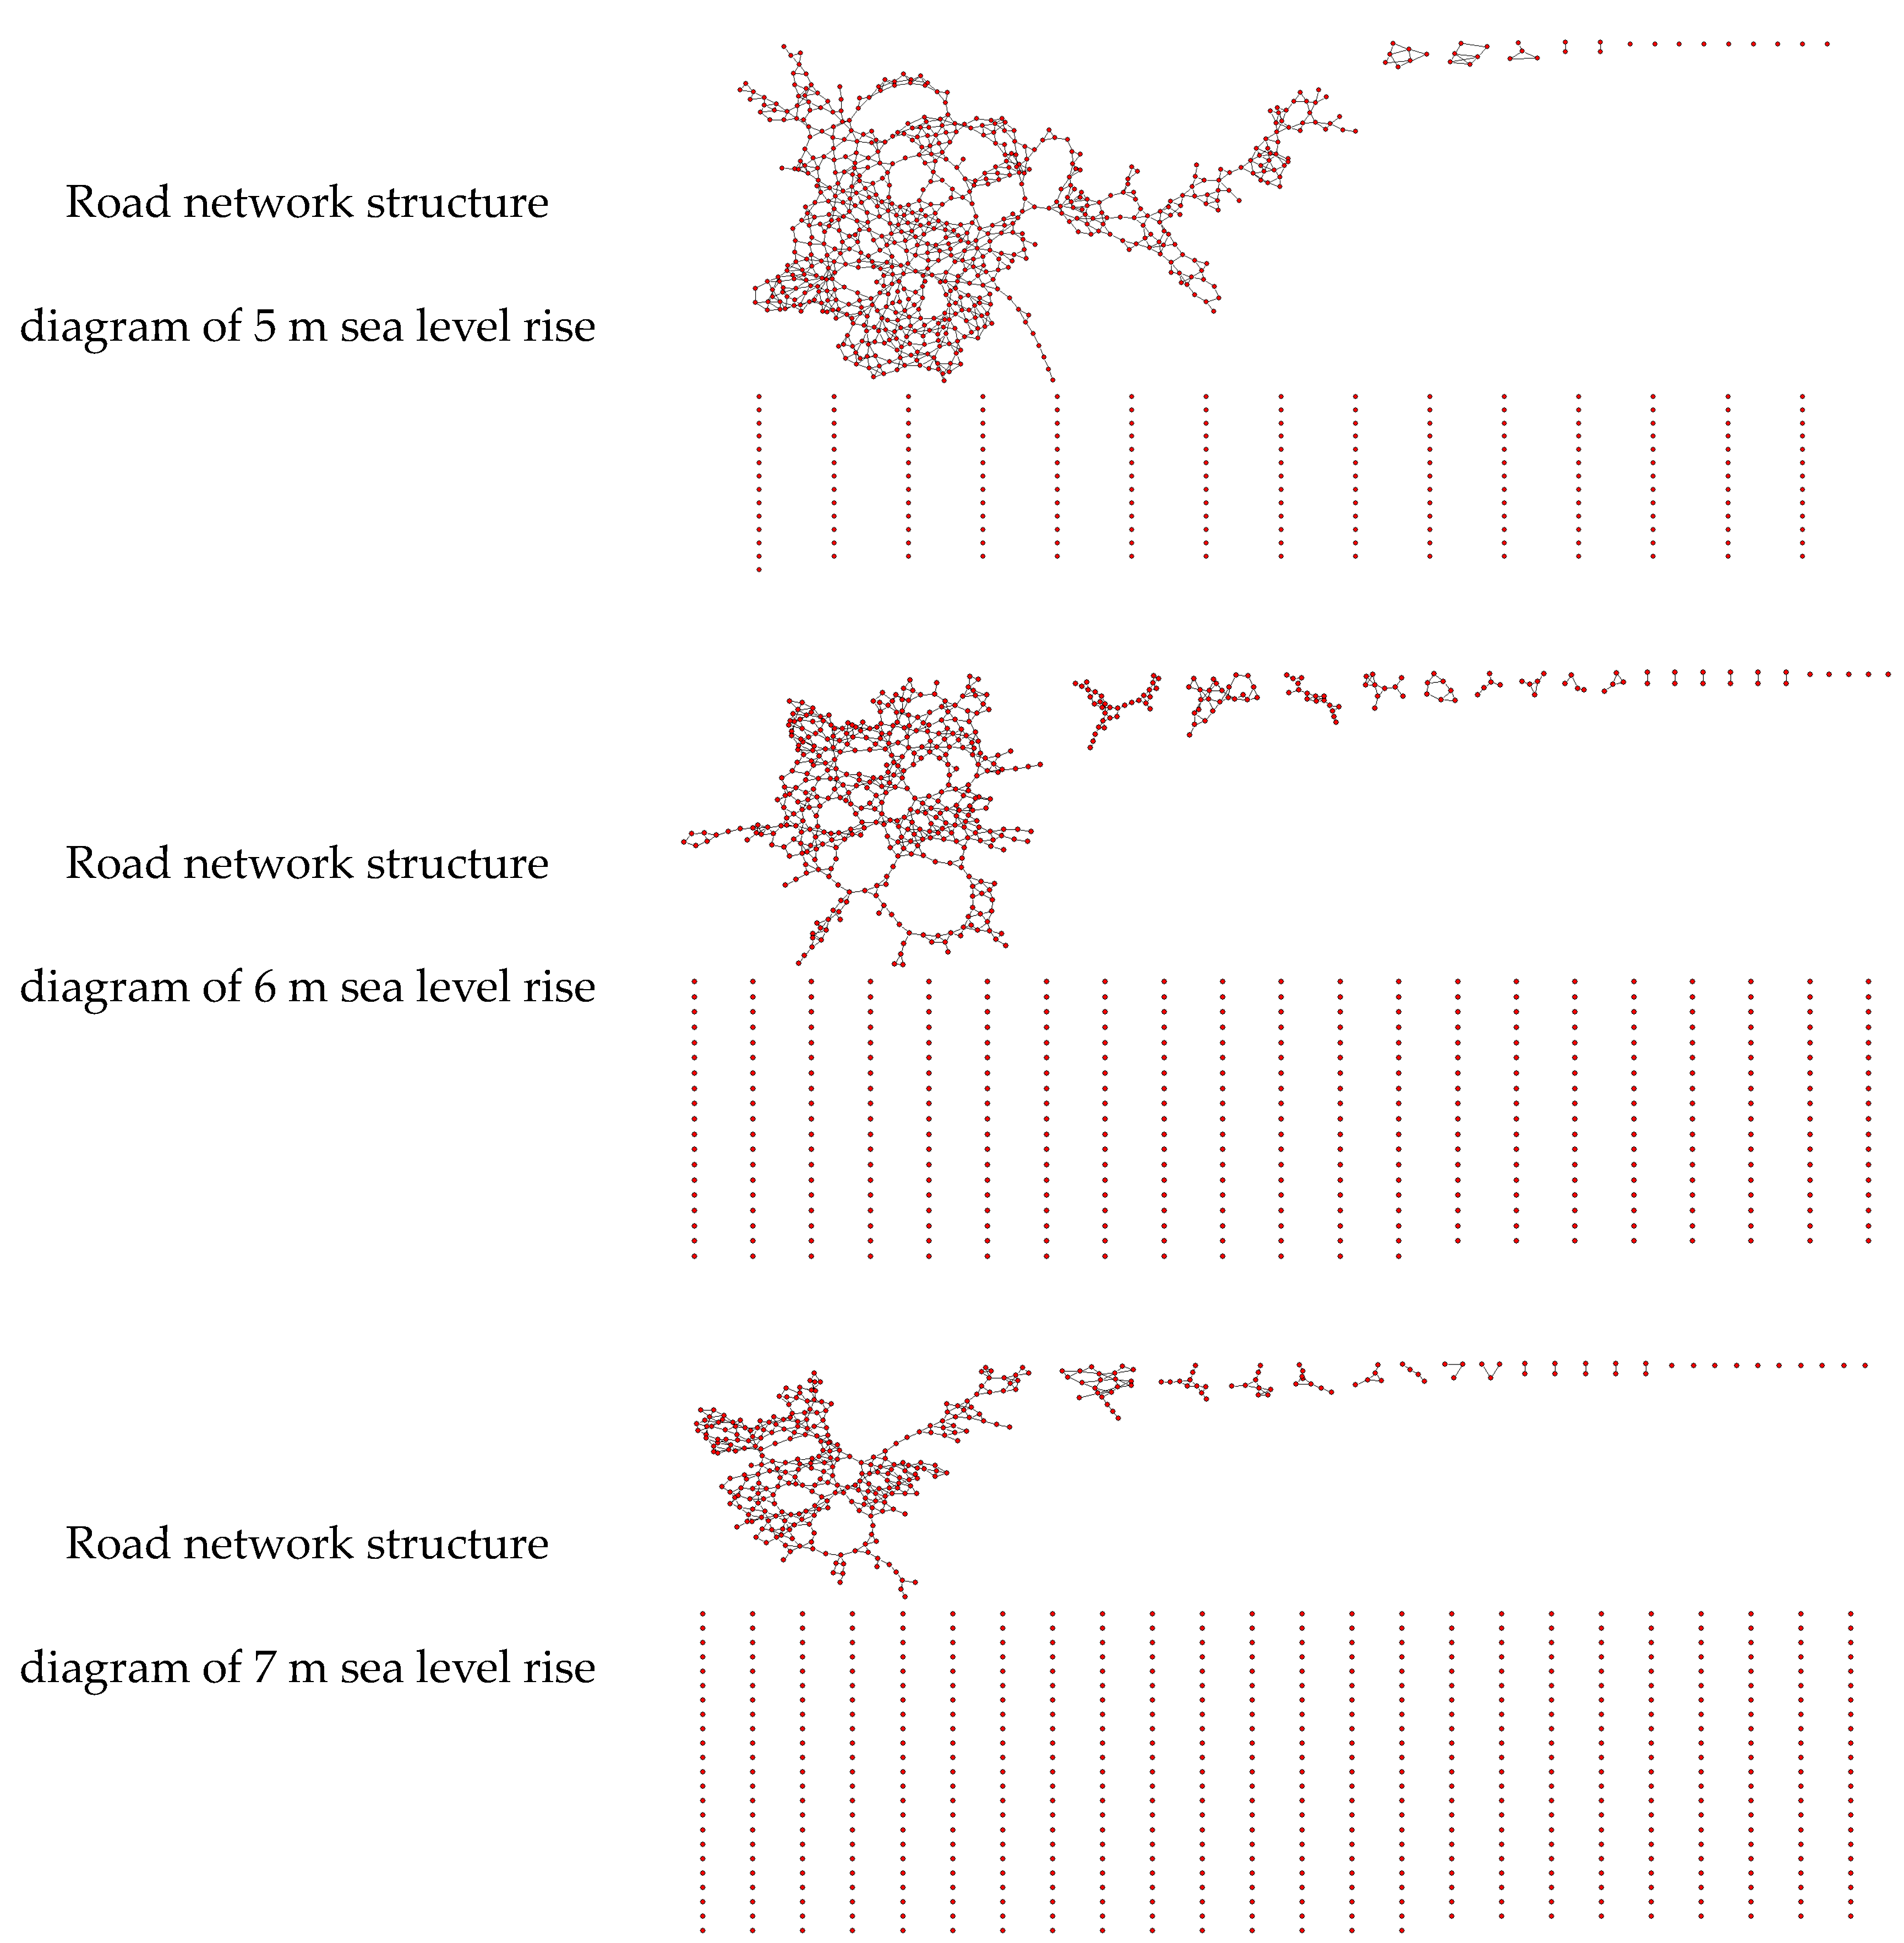
  • In the dendritic inundation stage (i.e., after the flood depth rises to 5 m), the traffic system in the study area demonstrates a regional inundation trend. It implies that there is a patchy inundation area which leads to the formation of a road network from the block to the dendritic road network. At this stage, the shape of the road network in the coastal alluvial plain becomes similar to a mountainous disaster area.
  • In the phase of the scattered flooding stage, with the continuous increase of flood depth, the transportation system in the study area begins to gradually paralyze and form a scattered and distributed road network. The size of each traffic group is essentially the same, and there is no longer a large traffic connection subgraph with the dominant power.

4.3. Concept and Connotation of the Resilience of Coastal Urban Transportation System under the Background of Climate Change

The increasing frequency of flood disasters caused by climate change challenges the planning, design, construction, and operation management of coastal transportation infrastructure. The definition of the concept of coastal city resilience in previous studies is not very specific, and relatively little research has been conducted, resulting in relatively weak operationalization of measures proposed by urban policymakers to enhance the resilience of coastal cities [23,41]. Therefore, this paper attempts to define the concept and connotation of the resilience of traffic networks in coastal cities in the context of climate change in order to improve resilience. It is defined as follows:
(1)
Redundancy
Through the analysis of network equality, it can be seen that the higher the road network equality is, the more complete the road network structure is. In other words, the more sections are connected, the easier it is to rapidly identify effective and replaceable sections in case of disasters, such as low-grade sections near some high-grade sections, which play the same important role as high-grade sections in the system. Therefore, the transportation system of coastal cities should have a variety of transportation facilities with similar functions in order to accommodate failure in one place and offer timely supplementation in the other. This paper interprets the connotation of this concept as redundancy.
(2)
Dynamic
Through the analysis of the network hub and the dynamic performance of the network, it can be seen that the key sections and the performance of the road network will exhibit various performance characteristics in the presence of different disaster states. If the status quo is maintained, the coastal transportation system may be vulnerable to disasters. Therefore, a sustainable system should be formed. There should be different coping strategies during peacetime and disaster (even catastrophic events of varying severity), and the coping strategies should be adjusted in time based on the impact of climate change, the risk level of the area, and the daily travel needs of residents. Herein, the connotation of this concept is interpreted as dynamic.
(3)
Accessibility
Through the analysis of network efficiency, it can be seen that flood areas caused by climate change have a flood-time series. It implies that due to the influence of elevation and other factors, some areas are less affected by the disaster’s interference. In order to make full use of this fact, the daily travel needs of residents are considered, the distances of residents to these areas and key infrastructure are reduced as much as possible, and the convenience and friendliness of travel are realized as well. In the current analysis, the connotation of this concept is called accessibility.
(4)
Intelligence
According to the above analysis, if the data and satisfactory management of the transportation system can be comprehended through intelligent means such as artificial intelligence and big data technology for various natural disaster conditions, such as dredging traffic flow in real-time during the occurrence of the disaster and closing some vulnerable sections in time to reduce traffic congestion, it can greatly improve active adaptation during the disaster and rapid recovery after the disaster. The connotation of such a concept is called intelligence.

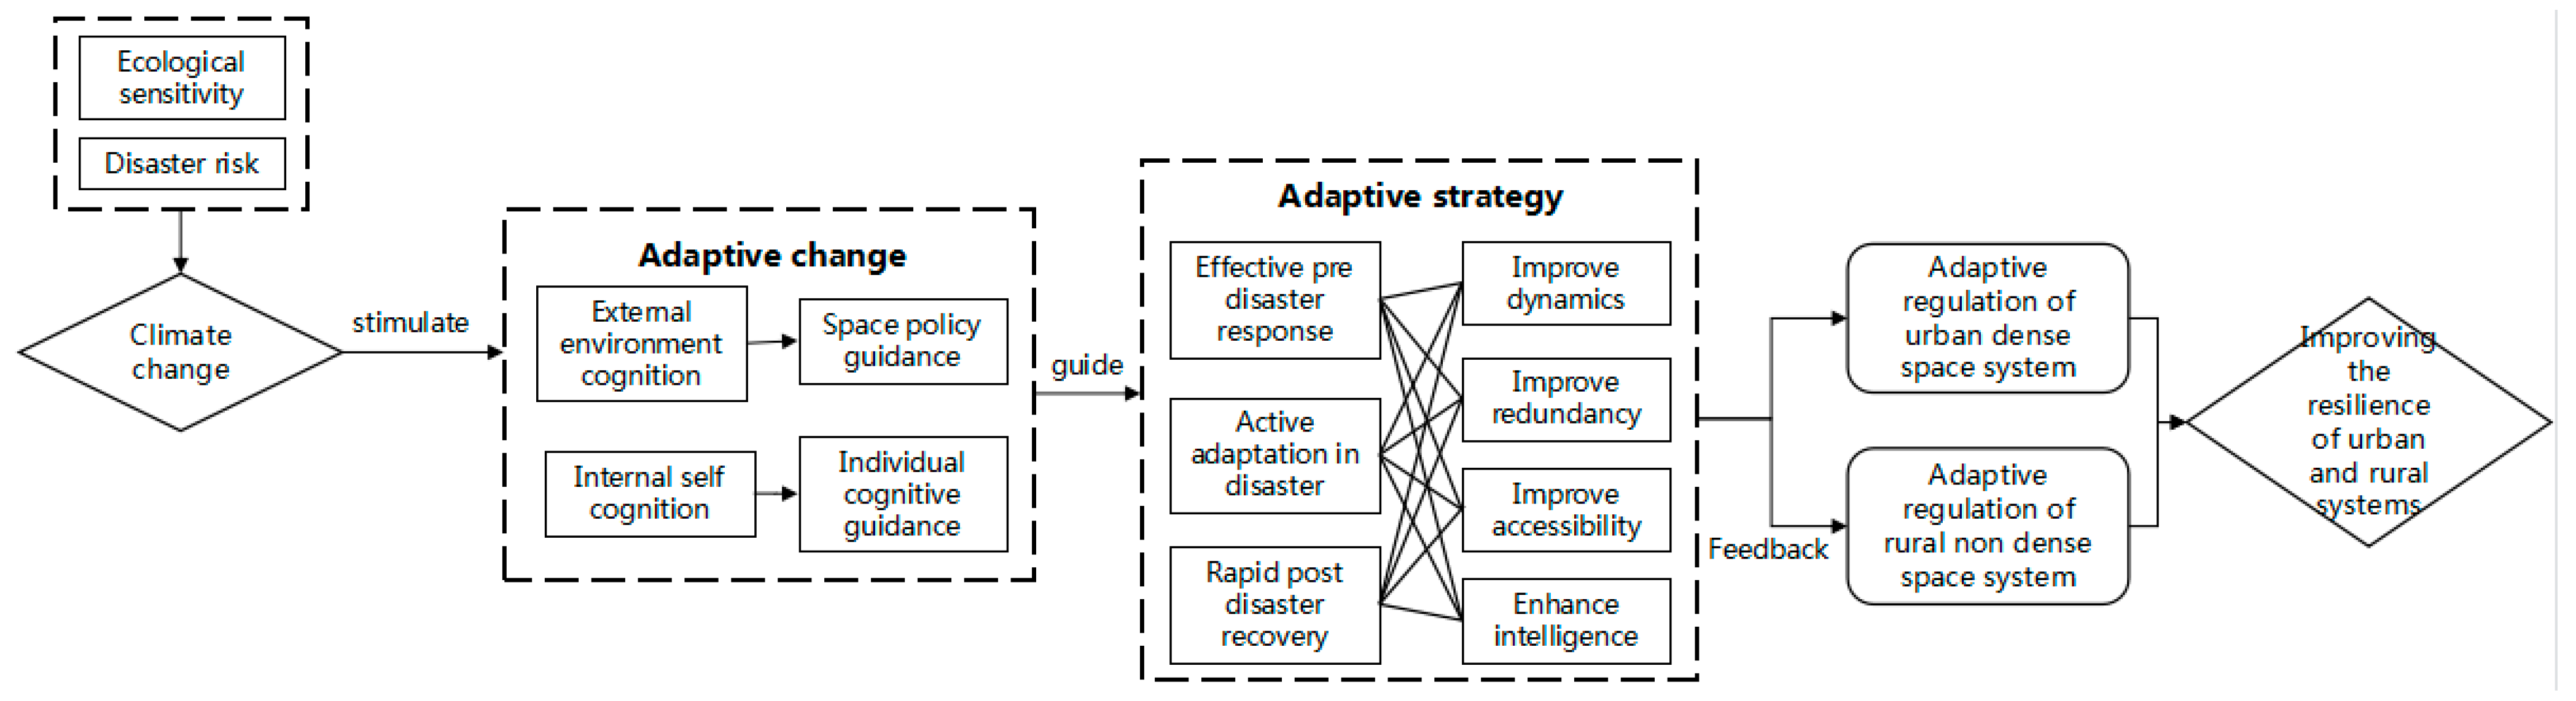
4.4. Strategies to Improve the Resilience of Coastal Urban Transportation System under the Background of Climate Change

Climate change is mainly responsible for rising sea levels, the warming of cold areas in winter, and an increase in the frequency of extreme weather, which poses challenges to the planning, design, construction, and operation management of transportation infrastructure. Thus, it is necessary to re-evaluate adaptive strategies according to the actual situation. The primary purpose of formulating these strategies is to make the transportation infrastructure more adaptive to climate change, which is particularly important for developing countries (regions), especially those located in coastal areas. These countries often lack the financial resources to build complete transportation infrastructure, so they are more vulnerable to severe weather and rising sea levels compared with developed countries (regions).
In the above simulation analysis, we find that we can obtain some system characteristics and system laws by simulating disaster attacks on the system in advance, which means that it is possible to predict disasters in advance or let the system adapt in advance. In the social ecosystem, the collective behaviour of the system subjects will gradually extend to the local level and then affect individual choices and behaviours. Therefore, if we can constantly simulate and stimulate the system and continue to modify it, we can guide and influence local behaviours through space via policy, thus improving internal self-awareness and affecting the choices and behaviours of drivers, managers, and other individuals in the transportation system and ultimately improving the overall performance of the system. Therefore, when building disaster prevention and mitigation plans for disaster-prone areas, we can build adaptive feedback mechanisms, trigger adaptive changes through constant external stimulation, propose adaptive strategies, constantly modify the performance of the system in all aspects, offer feedback to urban-intensive and rural nonintensive spatial systems, achieve natural adaptation cooperation in both urban and rural spaces, and effectively improve the system’s resilience (Figure 14).

5. Conclusions

The research of this paper reveals that the traffic network in PNA of Shanghai has a particular resilience against flooding disasters resulting from the rising sea level, but its critical point is about 3 m. Once the flooding depth exceeds this level, the structure and performance of the traffic network will be substantially affected. In this paper, a complex network model and GIS model are utilized to assess the change characteristics of road network resilience in the study area under various flood disaster scenarios. The main objective of the current investigation is to provide adequate data and suggestions for designing the transportation network of coastal cities to prevent future disasters. Finally, various crucial items are discussed, including the current situation of resilience characteristics of the traffic network in the study area, the variation trend of resilience characteristics of the traffic network in the study area, the concept connotations of the resilience of traffic networks in coastal cities accounting for climate change, and the resilience improvement strategy of coastal city traffic systems in the presence of climate change.
This paper has developed a methodology to assess the resilience characteristics of transport networks in coastal cities. Some of the results are shown in graphs: Figure 6 clearly shows the structural changes in the regional transport network under different flooding scenarios and Figure 13 highlights the most critical parts of the system. Based on the spatial distribution of the key sections and the structural characteristics of the road network obtained from the study, decision-makers can establish a risk prevention system based on the land use planning of the Shanghai Pudong New Area and the Shanghai Emergency Shelter Design Code, taking into account the land use, inundation areas, and critical sections.
From the current state of resilience characteristics and conceptual connotations derived from this paper, it can be concluded that urban resilience can be effectively enhanced if the components of a coastal urban transport network are highly substitutable (meaning that some of the functions are redundant and some of the facilities are connected more efficiently and can still be reached by shorter paths after a disaster), if critical components are identified, and if remedial measures are taken on time when a disaster occurs.
However, the study of the resilience of transport networks in coastal cities in the context of climate change is a complex issue that is influenced by a variety of natural, economic, and social factors, many of which are not examined in this paper, such as the impact of ground subsidence and global warming on flooding. Therefore, it is recommended that further studies consider more dimensions, such as the level of economic resilience of the study area and the cascading effects of transport networks so that the findings can be better applied to natural systems. Finally, transferring these empirical studies from other countries to other regions can be a significant challenge, as each region, and especially each country, has its own unique geographical, cultural, and socio-economic characteristics, all requiring bespoke individual design strategies and measures. Nevertheless, this is a first step towards increasing the resilience of coastal cities worldwide.

Author Contributions

All authors contributed to the study’s conception and design. Material preparation, data collection and analysis were performed by M.W., J.X. and Y.W. The first draft of the manuscript was written by M.W., and all authors commented on previous versions of the manuscript. All authors have read and agreed to the published version of the manuscript.

Funding

This work was supported by the National Natural Science Foundation of China (52178043) and the National Natural Science Foundation of China (51778278). The authors declare that no funds, grants, or other support were received during the preparation of this manuscript.

Data Availability Statement

Relevant empirical research data has been obtained from the following sources: (i) ArcGIS map and Google map (no offset) data; (ii) DEM data from the geospatial data cloud (website: http://www.gscloud.cn/, accessed on 1 February 2022), and the corresponding data accuracy is about 30 m (see Figure 1); (iii) Technical guidelines for storm surge disaster risk assessment and zoning, technical guidelines for sea-level rise risk assessment and zoning, the China marine disaster bulletin and China Sea-level bulletin are prepared from the State Oceanic Administration and online sources http://www.nmdis.org.cn/hygb/zghyzhgb/, accessed on 1 February 2022, and the original data on the integration of the YRD and local planning projects of Shanghai was gathered by the investigators. At the same time, the relevant disaster data can be obtained from the book “Earthquake relief records of Wenchuan earthquake” which was organized and prepared by the Chinese government, for details on this set of books, please refer to the website: https://www.sc.gov.cn/10462/10464/10797/2018/5/7/10450303.shtml, accessed on 1 February 2022. Unfortunately, there is no electronic version of this series of books. If necessary, readers can buy this series of books on all Chinese book-buying websites. Since the traffic capacity of the main roads is stronger and more affected by disasters, the transportation systems involved in this paper include expressways, national roads, provincial and county roads, urban medium express roads, main roads, and secondary roads (i.e., other types of roads, such as urban streets and rural roads, have not been considered temporarily).

Conflicts of Interest

Author Meng Wei, Jiangang Xu, and Yiwen Wang declare they have no financial interest.

References

  1. Trenberth, K.E.; Fasullo, J.T.; Shepherd, T.G. Attribution of climate extreme events. Nat. Clim. Chang. 2015, 5, 725–730. [Google Scholar] [CrossRef]
  2. IPCC TCWT. Climate Change 2022: Mitigation of Climate Change. 2022. Available online: https://www.ipcc.ch/ (accessed on 1 February 2022).
  3. Dong, S.; Malecha, M.; Farahmand, H.; Mostafavi, A.; Woodruff, S.C. Integrated infrastructure-plan analysis for resilience enhancement of post-hazards access to critical facilities. Cities 2021, 117, 103318. [Google Scholar] [CrossRef]
  4. Li, L.; Uyttenhove, P.; Vaneetvelde, V. Planning green infrastructure to mitigate urban surface water flooding risk—A methodology to identify priority areas applied in the city of Ghent. Landsc. Urban Plan 2020, 194, 103703. [Google Scholar] [CrossRef]
  5. Kim, K.; Francis, O.; Yamashita, E. Learning to Build Resilience into Transportation Systems. Transp. Res. Rec. 2018, 2672, 30–42. [Google Scholar] [CrossRef] [Green Version]
  6. Zhang, X.; Miller-Hooks, E.; Denny, K. Assessing the role of network topology in transportation network resilience. J. Transp. Geogr. 2015, 46, 35–45. [Google Scholar] [CrossRef] [Green Version]
  7. Martello, M.V.; Whittle, A.J.; Keenan, J.M.; Salvucci, F.P. Evaluation of climate change resilience for Boston’s rail rapid transit network. Transp. Res. Part D Transp. Environ. 2021, 97, 102908. [Google Scholar] [CrossRef]
  8. Serre, D.; Heinzlef, C. Assessing and mapping urban resilience to floods with respect to cascading effects through critical infrastructure networks. Int. J. Disaster Risk Reduct. 2018, 30, 235–243. [Google Scholar] [CrossRef]
  9. Holling, C.S. Engineering Resilience versus Ecological Resilience. Environ. Sci. 1996, 31, 32. [Google Scholar]
  10. Holling, C.S. Resilience and Stability of Ecological Systems; Annual Review of Ecology and Systematics: San Mateo, CA, USA, 1973. [Google Scholar]
  11. Pickett, S.; Cadenasso, M.L.; Grove, J.M. Resilient cities: Meaning, models, and metaphor for integrating the ecological, socio-economic, and planning realms. Landsc. Urban Plan. 2004, 69, 369–384. [Google Scholar] [CrossRef]
  12. Maru, Y.T. Resilient Regions: Clarity of Concepts and Challenges to Systemic Measurement. In Socio-Economics and the Environment in Discussion (SEED) Working Paper Series; CSIRO Sustainable Ecosystems: Atherton, QLD, Australia, 2010. [Google Scholar]
  13. Sharifi, A. Co-benefits and synergies between urban climate change mitigation and adaptation measures: A literature review. Sci. Total Environ. 2021, 750, 141642. [Google Scholar] [CrossRef]
  14. Langemeyer, J.; Madrid-Lopez, C.; Beltran, A.M.; Mendez, G.V. Urban agriculture? A necessary pathway towards urban resilience and global sustainability? Landsc. Urban Plan 2021, 210, 104055. [Google Scholar] [CrossRef]
  15. Wang, H.; Peng, Z.; Wang, D.; Meng, Y.; Wu, T.; Sun, W.; Lu, Q. Evaluation and prediction of transportation resilience under extreme weather events: A diffusion graph convolutional approach. Transp. Res. Part C Emerg. Technol. 2020, 115, 102619. [Google Scholar] [CrossRef]
  16. Wan, C.; Yang, Z.; Zhang, D.; Yan, X.; Fan, S. Resilience in transportation systems: A systematic review and future directions. Transp. Rev. 2018, 38, 479–498. [Google Scholar] [CrossRef]
  17. Liao, T.; Hu, T.; Ko, Y. A resilience optimization model for transportation networks under disasters. Nat. Hazards 2018, 93, 469–489. [Google Scholar] [CrossRef]
  18. Hosseini, S.; Barker, K.; Ramirez-Marquez, J.E. A review of definitions and measures of system resilience. Reliab. Eng. Syst. Safe 2016, 145, 47–61. [Google Scholar] [CrossRef]
  19. Baroud, H.; Barker, K.; Ramirez-Marquez, J.E.; Rocco, S. CM Importance measures for inland waterway network resilience. Transp. Res. Part E Logist. Transp. Rev. 2014, 62, 55–67. [Google Scholar]
  20. Henry, D.; Ramirez-Marquez, J.E. Generic metrics and quantitative approaches for system resilience as a function of time. Reliab. Eng. Syst. Safe 2012, 99, 114–122. [Google Scholar] [CrossRef]
  21. Carpenter, S.R.; Arrow, K.J.; Barrett, S.; Biggs, R.; Brock, W.A.; Crepin, A.; Engstrom, G.; Folke, C.; Hughes, T.P.; Kautsky, N.; et al. General Resilience to Cope with Extreme Events. Sustainability 2012, 4, 3248–3259. [Google Scholar] [CrossRef] [Green Version]
  22. Serre, D.; Barroca, B.; Balsells, M.; Becue, V. Contributing to urban resilience to floods with neighbourhood design: The case of Am Sandtorkai/Dalmannkai in Hamburg. J. Flood Risk Manag. 2018, 111, S69–S83. [Google Scholar] [CrossRef]
  23. Bruneau, M.; Reinhorn, A. Exploring the concept of seismic resilience for acute care facilities. Earthq. Spectra 2007, 23, 41–62. [Google Scholar] [CrossRef] [Green Version]
  24. Simmie, J.; Martin, R. The economic resilience of regions: Towrds an evolutionary approach. Cambr. J. Reg. Econ. Soc. 2010, 3, 27–43. [Google Scholar] [CrossRef] [Green Version]
  25. Hallegatte, S. Economic resilience: Definition and measurement. Soc. Sci. Electron. Publ. 2014, a2, 291–299. [Google Scholar]
  26. Serdar, M.Z.; Koc, M.; Al-Ghamdi, S.G. Urban Transportation Networks Resilience: Indicators, Disturbances, and Assessment Methods. Sustain. Cities Soc. 2022, 76, 103452. [Google Scholar] [CrossRef]
  27. People’s Government of Pudong New Area SC: Shanghai Pudong New Area Master Plan and Land Use Master Plan (2017–2035). 2018. Available online: https://www.pudong.gov.cn/ (accessed on 9 September 2022).
  28. Xu, Z.; Chopra, S.S.; Lee, H. Resilient Urban Public Transportation Infrastructure: A Comparison of Five Flow-Weighted Metro Networks in Terms of the Resilience Cycle Framework. IEEE Trans. Intell. Transp. 2021, 23, 12688–12699. [Google Scholar] [CrossRef]
  29. Zhang, L.; Lu, J.; Fu, B.; Li, S. A Review and Prospect for the Complexity and Resilience of Urban Public Transit Network Based on Complex Network Theory. Complexity 2018, 2018, 2156309. [Google Scholar] [CrossRef] [Green Version]
  30. Serre, D. Advanced methodology for risk and vulnerability assessment of interdependency of critical infrastructure in respect to urban floods. 3rd Eur. Conf. Flood Risk Manag. 2016, 7, 07002. [Google Scholar] [CrossRef] [Green Version]
  31. Maliszewski, P.J.; Perrings, C. Factors in the resilience of electrical power distribution infrastructures. Appl. Geogr. 2012, 32, 668–679. [Google Scholar] [CrossRef]
  32. Rehak, D.; Senovsky, P.; Hromada, M.; Lovecek, T. Complex Approach to Assessing Resilience of Critical Infrastructure Elements. Int. J. Crit. Infrastrct. Prot. 2019, 25, 125–138. [Google Scholar] [CrossRef]
  33. Porta, S.; Crucitti, P.; Latora, V. The network analysis of urban streets: A primal approach. Environ. Plan. B Plan. Des. 2006, 33. [Google Scholar] [CrossRef] [Green Version]
  34. Koperski, K.; Hah, J. Discovery of Spatial Association Rules in Geographic Information Databases; Springer: Berlin/Heidelberg, Germany, 2002. [Google Scholar]
  35. Meehl, G.A.; Washington, W.M.; Santer, B.D.; Collins, W.D.; Arblaster, J.M.; Hu, A.; Lawrence, D.M.; Teng, H.; Buja, L.E.; Strand, W.G. Climate Change Projections for the Twenty-First Century and Climate Change Commitment in the CCSM3. J. Clim. 2006, 19, 2597–2616. [Google Scholar] [CrossRef] [Green Version]
  36. Wang, J.; Gao, W.; Xu, S.; Yu, L. Evaluation of the combined risk of sea level rise, land subsidence, and storm surges on the coastal areas of Shanghai, China. Clim. Chang. 2012, 115, 537–558. [Google Scholar] [CrossRef]
  37. China MONR: 2021 China Marine Disaster Bulletin. 2021. Available online: http://gi.mnr.gov.cn/202205/t20220507_2735508.html (accessed on 9 September 2022).
  38. Woth, K.; Weisse, R.; Storch, H.V. Climate change and North Sea storm surge extremes: An ensemble study of storm surge extremes expected in a changed climate projected by four different regional climate models. Ocean Dyn. 2006, 56, 3–15. [Google Scholar] [CrossRef]
  39. Meier, H. Baltic Sea climate in the late twenty-first century: A dynamical downscaling approach using two global models and two emission scenarios. Clim. Dyn. 2006, 27, 39–68. [Google Scholar] [CrossRef]
  40. Leon, J.X.; Heuvelink, G.B.M.; Phinn, S.R. Incorporating DEM Uncertainty in Coastal Inundation Mapping. PLoS ONE 2014, 9, e1087279. [Google Scholar] [CrossRef]
  41. Lhomme, S.; Serre, D.; Diab, Y.; Laganier, R. Analyzing resilience of urban networks: A preliminary step towards more flood resilient cities. Nat. Hazards Earth Syst. 2013, 13, 221–230. [Google Scholar] [CrossRef]
Figure 1. The study area and elevation map (Source: self-drawn by the author, map from the following link: http://www.gscloud.cn/, accessed on 1 February 2022).
Land 11 01834 g001
Figure 2. Technical procedure route (Source: self-drawn by the author).
Land 11 01834 g002
Figure 3. Example of dual modelling method (Source: self-drawn by the author).
Land 11 01834 g003
Figure 4. Traffic network in the study area (Source: self-drawn by the author).
Land 11 01834 g004
Figure 5. Spatial distribution of the flood inundation depth subjected under different inundation scenarios (Source: self-drawn by the author).
Land 11 01834 g005
Figure 6. Traffic network structure of the study area under different inundation scenarios (Source: self-drawn by the author).
Land 11 01834 g006aLand 11 01834 g006b
Figure 7. Analysis results of the road network equalization for the study area (Source: self-drawn by the author).
Land 11 01834 g007
Figure 8. Analysis results of the road network efficiency for the study area (Source: self-drawn by the author).
Land 11 01834 g008
Figure 9. Analysis results of the road network hub for the study area (Source: self-drawn by the author).
Land 11 01834 g009
Figure 10. Analysis results of the road network efficiency from various attack modes for the study area (Source: self-drawn by the author).
Land 11 01834 g010
Figure 11. The abstract diagram of “centralized decentralized combination” road network structure in the study area (Source: self-drawn by the author).
Land 11 01834 g011
Figure 12. Impact of the single road section damage on the network performance. (Source: self-drawn by the author).
Land 11 01834 g012
Figure 13. Spatial distribution of the key sections and secondary key sections. (Source: self-drawn by the author).
Land 11 01834 g013
Figure 14. The adaptive planning strategy (Source: self-drawn by the author).
Land 11 01834 g014
Table 1. Storm surge and maximum water increase affecting Shanghai in recent years (cm).
Date of
Occurrence
NameMaximum Water
Increase (cm)
2021.7In-fa300
2015.7Chan-hom130
2012.8Sea anemone323
2011.8Plum blossom159
2005.8Matsa241
2005.9Card slave320
2002.9Senlac219
2000.8Prapiroon260
2000.9Saomai170
Source: compiled by the author.
Table 2. Section pair number, weight, and schematic diagram of the flood-damaged sections.
Number of Section Pair 1Number of Section Pair 2Weight
144.2
124.2
234.2
193.1
244.2

363

381

3.2
No. of damaged road section with submergence depth of 1 m: 853, 880, 886, 881, 882, 887, 888, 889, 890, 892, 893, 894, 915
No. of damaged road section with submergence depth of 2 m: 879, 891
No. of damaged road section with submergence depth of 3 m: 641, 643, 646, 758, 93, 832, 833, 920, 904, 647, 649, 634, 657
………
Source: compiled by the author.
Publisher’s Note: MDPI stays neutral with regard to jurisdictional claims in published maps and institutional affiliations.

