Article

An Inverse Relationship between Farm Size and Rice Harvest Loss: Evidence from China

1
Center for Price Cost Investigation, National Development and Reform Commission, Beijing 100045, China
2
Institute of Economics, Hunan Academy of Social Sciences, Changsha 410003, China
3
Department of Agricultural and Resource Economics, University of Tokyo, Tokyo 1138657, Japan
4
College of Economics and Management, China Agricultural University, Beijing 100083, China
*
Author to whom correspondence should be addressed.
Land 2022, 11(10), 1760; https://doi.org/10.3390/land11101760
Submission received: 6 September 2022 / Revised: 5 October 2022 / Accepted: 7 October 2022 / Published: 10 October 2022
(This article belongs to the Special Issue Agricultural Land Use and Food Security)

Abstract

:
Reducing food losses has become an important means of conserving resources and protecting food security. Based on nationwide survey data from 1526 households in 17 provinces in China, we evaluated Chinese rice harvest losses and used a fractional logit model to analyze the impact of farm size on these losses. The results show that, on average, 3.45% of total rice was lost during the harvest stage, representing a serious waste of resources. In addition, farm size was significantly negatively correlated with rice harvest losses, indicating an inverse relationship between farm size and rice harvest losses. As farms expand in size, farmers are more likely to adopt agricultural machinery services, which have been proven to reduce harvest losses. Our findings show that the government should encourage farm size expansion and promote better agricultural machinery services to reduce harvest losses.

1. Introduction

A vast population and limited farmland are fundamental realities in China [1]. With rapid economic development and improvements in the standard of living, the structure of family food consumption is continuously being upgraded and optimized, which drives the consumption of grains [2]. However, due to constraints on natural resources, such as water and soil, grain production in China is close to reaching its “ceiling” [3]. Hence, with the consistent growth in food demand, China’s food security is facing challenges [4].
Food security can be ensured in two ways: by increasing production and by reducing postharvest losses and waste [5]. Under the conditions of limited land and water resources, continued growth in food production for China is unrealistic. Thus, reducing postharvest losses and waste must play an important role in ensuring food security [6].
Due to technical limitations, insufficient social awareness and other reasons, such as income increases, food losses and waste, are more serious in China than in developed countries [7]. The postharvest loss rate of China’s staple food is 7.9%, which is approximately twice the average level of developed countries [8]. These losses also reflect the meaningless consumption of input resources. Hence, reducing postharvest losses and waste can increase the domestic food supply, save agricultural production factors, and improve the ecological environment.
The food system includes several stages, such as harvesting, storage, transportation, and consumption [9]. Harvesting is an important stage, and losses at this stage are directly related to grain outputs [10]. Most of the literature on grain harvest losses has focused on South Asia and Sub-Saharan Africa. Maize farmers in eastern Tanzania reported that 11.7% of their harvest was lost in the system, and approximately one-third of this loss occurred during harvesting [11]. Harvest losses in South Asia seem to be lower than those in Africa, and the harvesting loss rates of rice (including harvesting, threshing, grain cleaning, and transportation) in India and Bangladesh are 1.62% and 1.75%, respectively [12,13].
Harvest losses in China are different from losses in Africa and South Asia. Researchers found that most farmers who were interviewed believed that rice harvest losses were 4% or lower in China, although there were differences between regions [10]. Liu et al. (2013) comprehensively reviewed the available information concerning food losses and waste in China. Their results reveal that the food loss rate (FLR) of grains in the entire supply chain was 19.0% ± 5.8% in China, and the harvest stage had the third largest FLR in the supply chain, with estimated losses of 3.5% (±2.6%) [7].
Although substantial time and effort have been invested in these studies, differences in scope and research methods have led to large gaps in the research results. In particular, due to small sample sizes or small-scale surveys, studies on grain harvest losses in China only reflect the circumstances in certain areas. These studies have not yielded a sufficient understanding of the current situation in China. In addition, several analyses have been based on second-hand data, which are easily prone to statistical bias. Moreover, many studies have only examined the level of grain harvest losses; in-depth analyses of the determinants of harvest losses, according to which one might propose targeted reduction methods, have not been conducted.
Based on previous studies, compared with manual harvesting, mechanical harvesting is rough and can easily lead to crop damage and omissions; thus, farmers who use mechanical harvesting methods have higher harvest losses than those who harvest manually [14,15]. Poor work attitudes or labor shortages have also been shown to lead to higher losses; studies have also demonstrated that farmers who have received agricultural technology training have relatively low harvest losses [16,17]. Additionally, weather conditions during the harvest period are an important factor that affects harvest losses. Bad weather, such as strong winds and rainfall, increases harvest losses; moreover, bad weather conditions increase the moisture content of grains, which can easily lead to mildew and serious storage losses [18].
Few studies have considered the impact of farm size on harvest losses. In China, more than 500 million people still live in rural areas, and family-based smallholder production continues to be the main way for Chinese farmers to make a living [19]. To ensure fairness, land distribution under the household contract responsibility system adopts the principle of equality. Due to the large population, for each household, the land area is limited [20], which prevents large-scale operations, decreases operating efficiency, increases management costs, and is not conducive to mechanization [21].
With the continuous outflow of the rural population, the Chinese government has gradually introduced policies and laws that encourage land transfer, and the scale of certain farms has expanded [22]. In 2018, the land transfer area exceeded 530 million mu (35.33 million ha), which means that more than 30% of arable land has been involved in land transfer 1. Through land transfer, land can be reallocated from low-efficiency farmers to high-efficiency farmers, thereby improving factor allocation and production efficiency and significantly affecting agricultural production and social and economic development [23].
Numerous detailed analyses of the impacts of expanding the size of farms, especially the effects on grain production, have been conducted. However, these studies have failed to identify the relationship between farm size and harvest losses, and thus, the mechanism by which farm size affects harvest losses is unknown.
Based on survey data from 1526 rice growers in 21 provinces in China, we measured rice harvest losses and the implications for natural resources and the environment and then analyzed the relationship between farm size and rice harvest losses. Rice is one of the three major grains and an important staple food in China. In 2021, the rice output in China reached 212.84 million tons, and the rice sowing area reached 29.92 million hectares, accounting for 31% of China’s total grain output and 25% of the total grain sowing area 2. In 2020, China’s rice output was the highest in the world and accounted for 28% of global rice output 3.
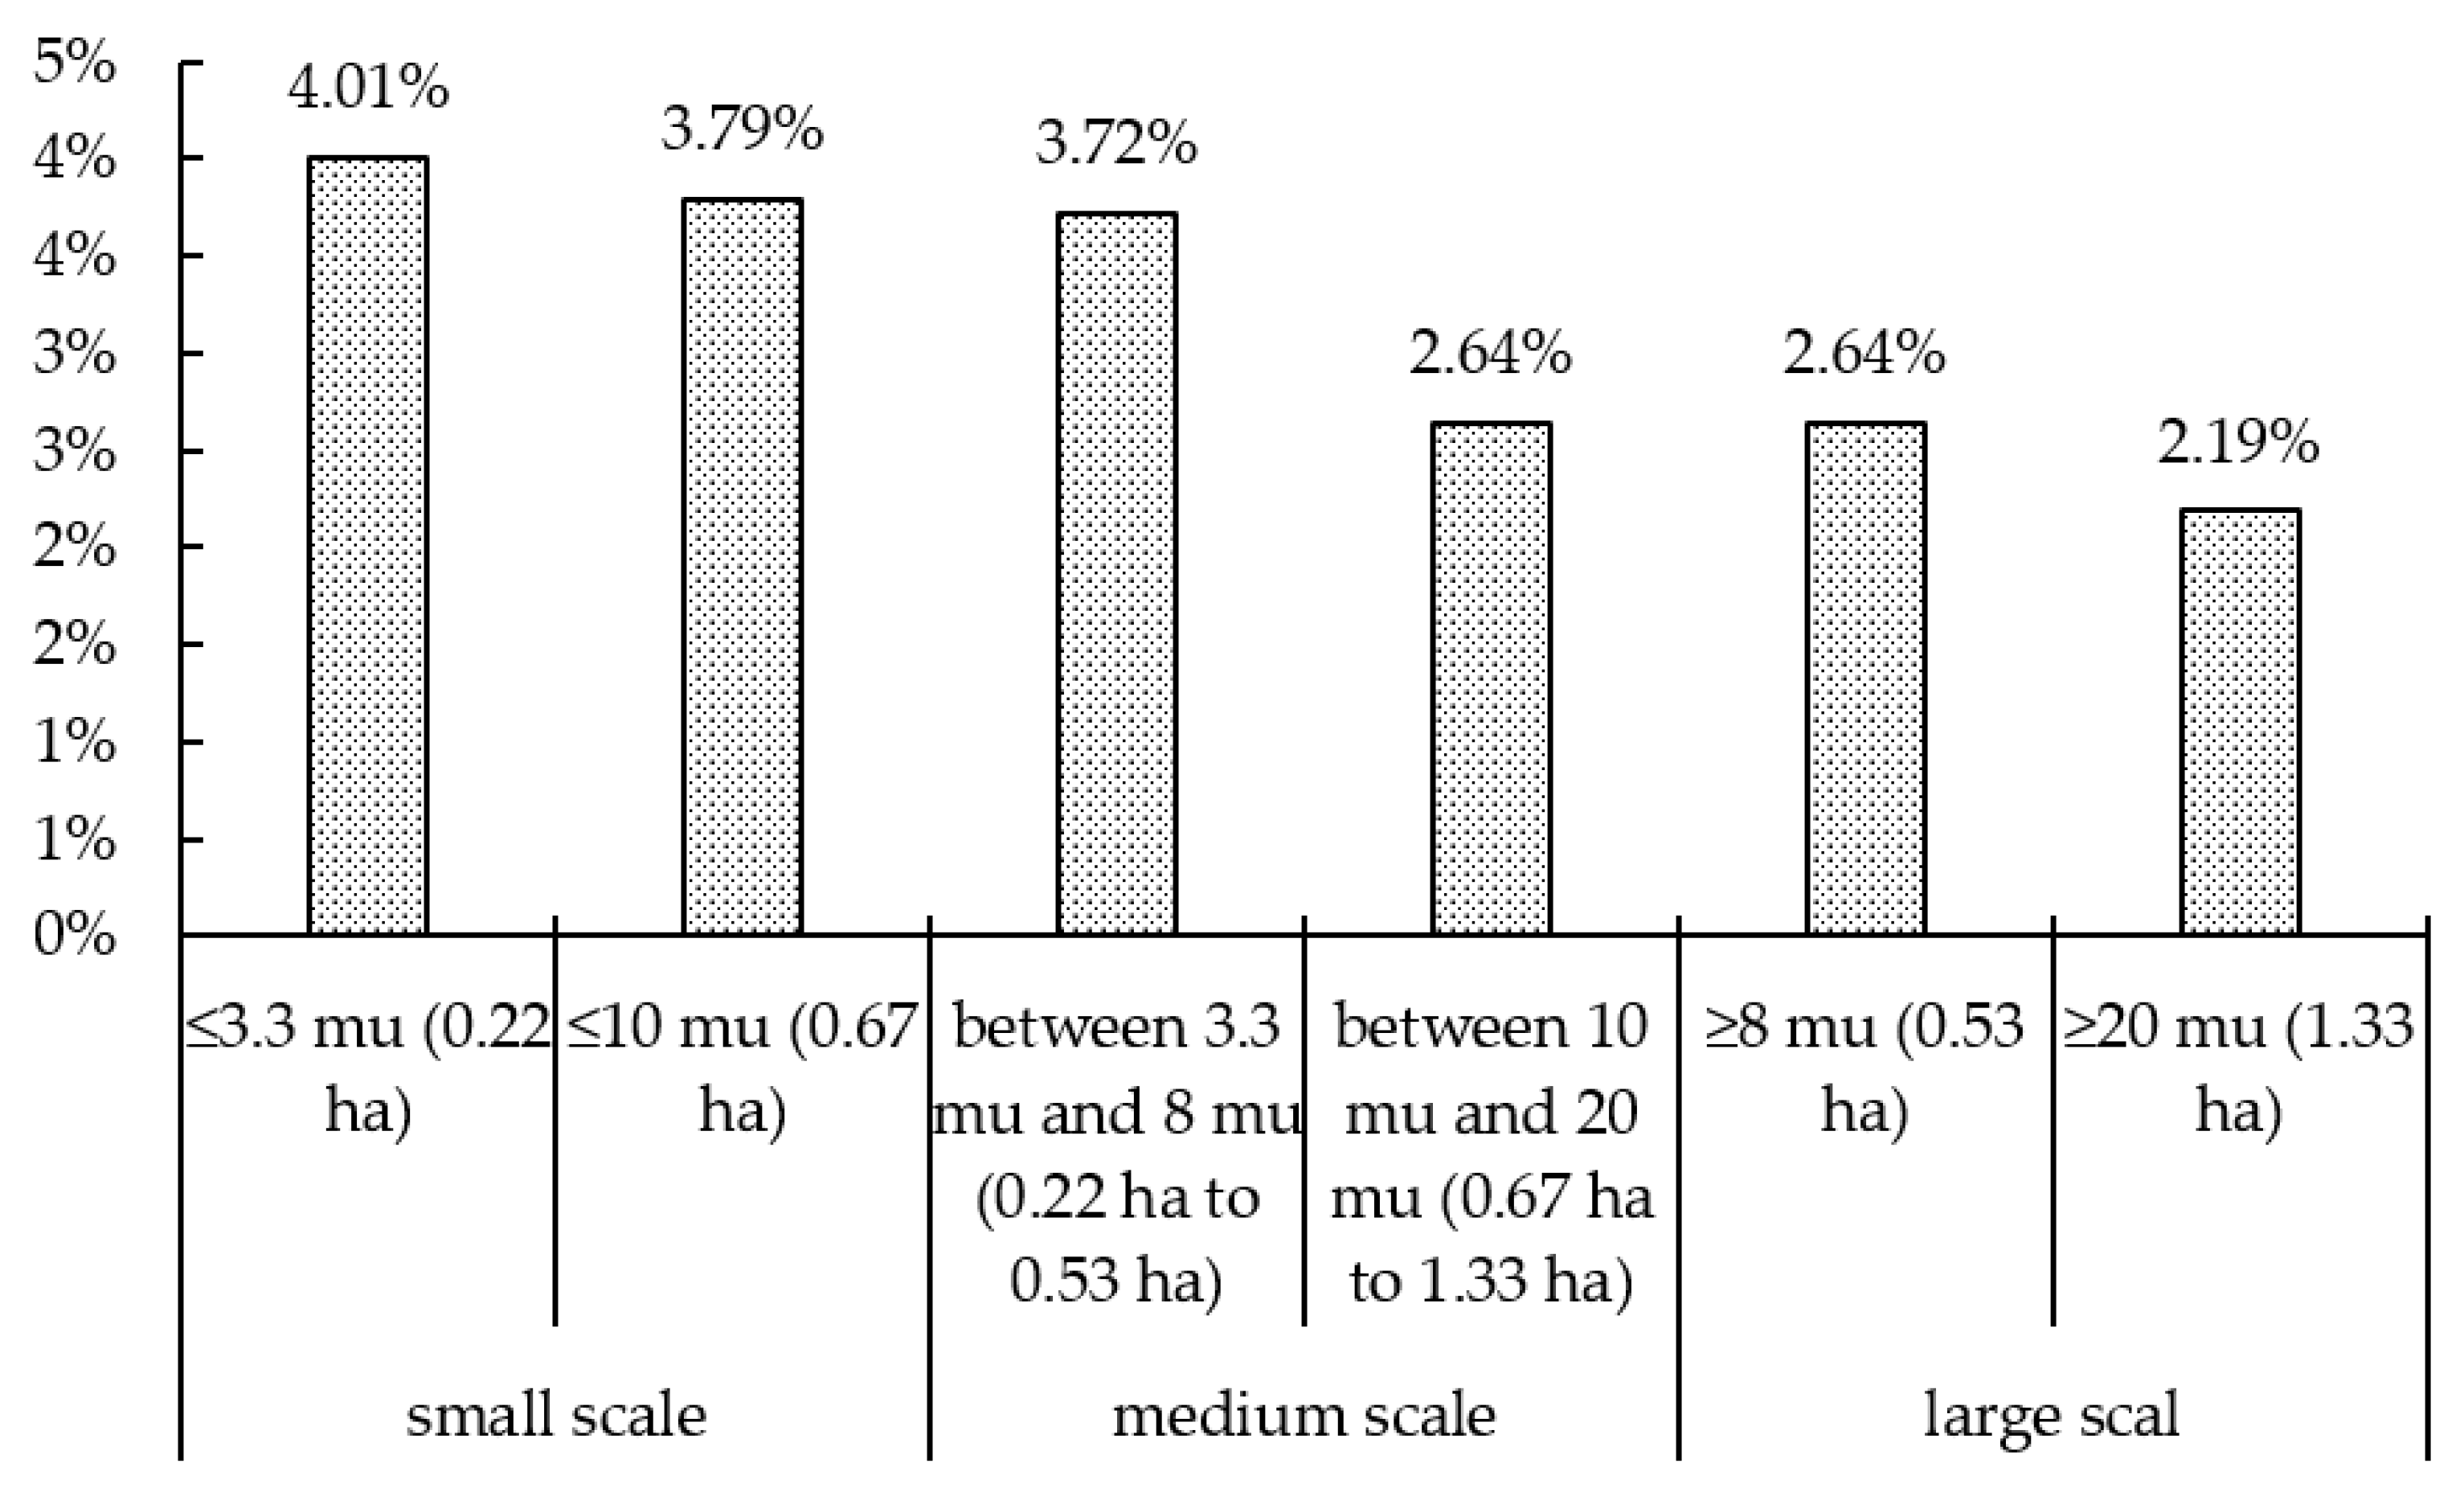
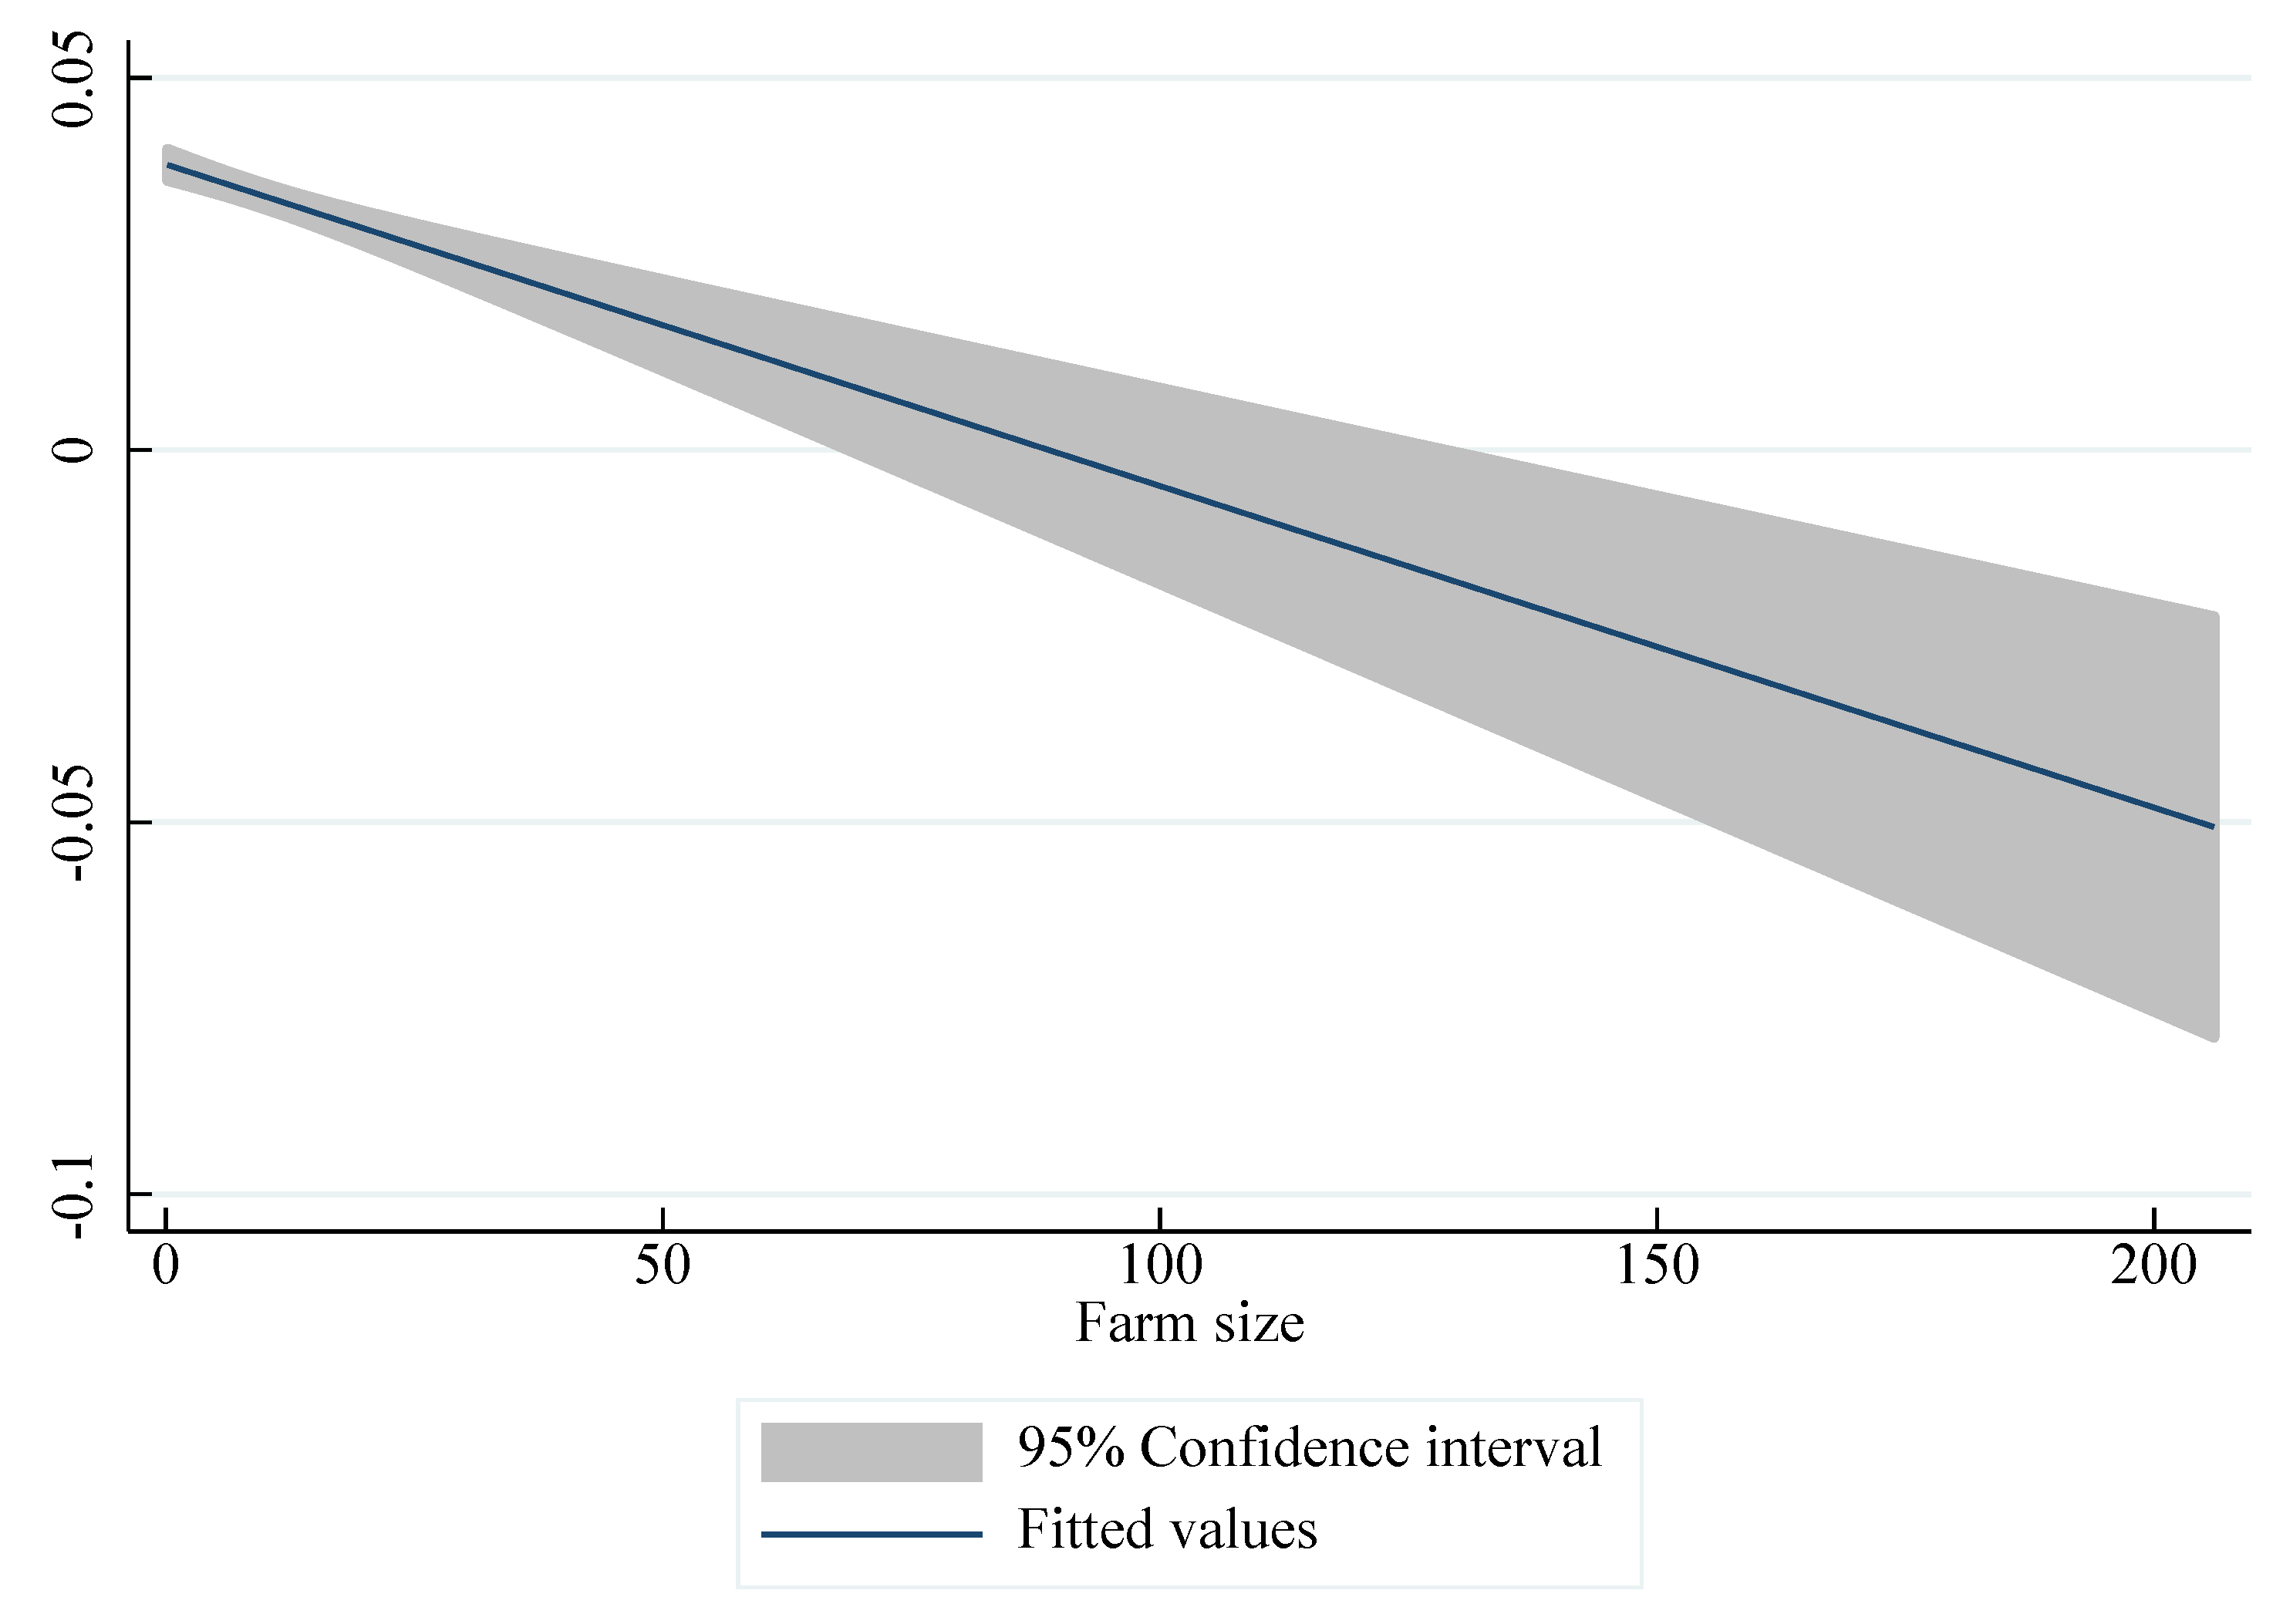
Our results show that, on average, 98.69 kg of rice was lost for each household during the harvest stage, equal to 3.45% of the total harvest lost at this stage. These losses reflect a massive meaningless consumption of inputs. Based on our measurements, the total rice harvest loss was 7.31 million tons in China, which could meet the food needs of 16.26 million people for one year, resulting in the wasted use of 1.01 million ha of land and 95.17 billion m3 of water. Meanwhile, empirical results show that there is an inverse relationship between farm size and rice harvest losses, which means that expanding the size of farms can help reduce rice harvest losses. We found that large-scale farmers are more inclined to use agricultural machinery services during the harvest stage, which has been proven to decrease losses.
The results of this study supplement the findings in the literature and contribute to an accurate understanding of changes in harvest losses during the transformation period of China’s agriculture. Thus, this study is of substantial significance to national food security and food policies. The structure of the article is as follows: the second section presents the data collection process and descriptive statistics, the third section describes the methodology, the fourth section presents the results and the robustness test, and the fifth section provides the conclusion.

2. Data and Methodology

2.1. Data Sources and Descriptive Statistics

2.1.1. Survey Design and Data Collection

In July 2016, we conducted a nationwide survey on food losses and waste in 28 provinces (municipalities and autonomous zones) by collaborating with the Rural Fixed Observatory Point Office (RFOPO) of the Ministry of Agriculture and Rural Affairs of China (MARA). The RFOPO is a rural survey system established in 1986. Currently, 23,000 farmers in 31 provinces are continuously tracked through this system. The information tracked and investigated by the RFOPO each year includes the characteristics of household members, land use, family income, and fixed assets. We designed a questionnaire on postharvest losses based on the literature and expert suggestions and selected survey locations from the RFOPO system. Then, professional investigators from the RFOPO interviewed the farmers and recorded their responses. Before starting the formal survey, we conducted a preliminary survey to identify (and subsequently revise) questions that were difficult for farmers to understand. To ensure the quality of the collected information, we also conducted two intensive training sessions for the investigators in April and May 2016 and provided them with a questionnaire operation manual. Using the unique identification code of each household (province code + village code + household code), we merged the data obtained in this survey with the existing RFOPO data to form the final database.
The postharvest loss survey covered eight types of grain and oil varieties—wheat, rice, maize, soybean, rapeseed, peanut, potato, and sweet potato—and collected the loss of each variety in the harvest and storage stages. Food waste information on 1600 households was also investigated. Sample households were selected based on the following procedure. First, we allocated sample households to each province (municipalities and autonomous zones) by their grain output share. Second, in each province, we randomly selected two counties for one crop from the top ten output counties of this crop in the province. Third, we randomly selected two towns from each county and two villages from each town. Finally, 10~30 sample farmers were selected randomly in each village.
The rice harvest data were collected from 21 provinces (municipalities and autonomous zones) (Tianjin, Liaoning, Jilin, Heilongjiang, Jiangsu, Anhui, Fujian, Jiangxi, Hubei, Hunan, Guangdong, Guangxi, Sichuan, Guizhou, Yunnan, and Chongqing) in China. The survey covered China’s three major rice-producing areas (the Northeast Plain, the Yangtze River Basin, and the Southeast Coast). In 2015, more than 95% of China’s total rice output came from the surveyed area. In total, we collected 1526 samples (Table 1). Notably, certain farmers grow more than one crop, as in the major maize-producing areas, where both maize and rice are grown. We also considered these farmers in our research.
We collected self-reported information on harvest losses and other household characteristics from the previous harvesting season. Family decision makers reported their rice outputs and harvest losses in kilograms. In the interviews, we divided the harvest stage into four processes: harvesting, threshing, field transportation (i.e., transportation from the field to the barn), and grain cleaning. Farmers reported the losses of each process individually.
However, self-reported data are subjective and may lead to bias. Kaminski and Christiaensen (2014) proposed that self-reported data can be used to reveal losses that smallholders deem important [24]. In our samples, rice was the main crop grown by the farmers, and their estimates were credible. Moreover, the estimation of farmers may be biased, but in the case of a large sample, self-reported data are random and can accurately reflect the situation [25].

2.1.2. Rice Harvest Losses in China

Table 2 shows the descriptive statistics on rice harvest losses in China. On average, 98.69 kg of rice was lost for each household during the harvest stage, equal to 3.45% of the total harvest lost at this stage. The most serious losses occurred in the harvesting process, and the total loss during this process was 62.52 kg of rice. The second-highest losses occurred in the cleaning process, during which 24.15 kg of rice was lost. Meanwhile, on average, 4.35 kg and 7.27 kg of rice were lost in the field transportation and cleaning processes, respectively.
These losses reflect a meaningless consumption of resources (Table 3). Based on our measurements, the total rice loss was 7.32 million tons in 2015. This loss, which could meet the food needs of 16.26 million people for one year, resulted in the wasted use of 1.01 million ha of land, 34.33 ten thousand tons of fertilizer, and 95.17 billion m3 of water and increased carbon emissions by 2.71 million tons.
Due to the country’s large size, climatic conditions and economic development levels vary greatly between regions in China, which may lead to differences in the rice harvest losses in different regions. Figure 1 shows that the most serious rice harvest losses occurred in the Central South, with 4.02% of the total harvest lost during the harvest stage. Comparatively, the rice harvest losses in Northeast and North China were low, with rice harvest losses in these two regions of 2.33% and 1.96%, respectively. The reasons for these regional differences in rice harvest losses are as follows. The agricultural infrastructure and technical conditions in Northeast and North China are mature. In addition, compared with the plains topography of Northeast or North China, the geomorphological forms in Western or South China are complex and not conducive to harvesting operations.
In addition, we divided the farms into three groups: large scale, medium scale and small scale. The results show that as the scale increased, the rice harvest loss exhibited a downwards trend (Figure 2).
The harvest losses could be different depending on the type of harvesting method. We continued to examine the harvest losses for different harvest methods. Our study defined three different types of harvest methods: manual, mechanical, and partially mechanical. “Manual harvest” refers to farmers not using mechanical operations in any harvest process (including harvesting, threshing, and grain cleaning); “mechanical (or machine) harvest” and “partially mechanical” refer to farmers using mechanical operations in all or some harvesting processes, respectively. The results showed that mechanical harvesting resulted in higher losses (Figure 3), consistent with previous studies [14,15]. However, manual harvesting is less efficient than mechanical harvesting. With the transformation of China’s agriculture, the use of machinery in production has become mainstream, which has led to a decrease in the number of farmers using manual harvesting. In our survey, only 12% of farmers used the manual harvest method in the harvest stage.

2.1.3. Descriptive Statistics of the Main Variables

Table 4 shows the definitions and descriptive statistics of the variables used in this study. All the information of these variables was from this national food losses and waste survey which was conducted in July 2016. On average, each household had 8.98 mu (0.60 ha) arable land for rice production. At present, land transfer is accelerating in China. Certain farmers have expanded the scale of their farms through transfers, while others have transferred out of farming and moved to cities for employment. Hence, large differences in farm size in the interviewed households were observed, and the standard deviation of farm size was 11.71 mu (0.78 ha).
Due to the ageing of the agricultural population and the rapid advancement of agricultural mechanization, an increasing number of farmers are adopting machinery to replace manpower when harvesting. Only 12% of the surveyed households relied on manpower for harvesting without the use of any machinery, 29% used machinery in part of the harvest processing, and 59% used machinery in all harvesting stages.
Other production and harvest characteristics are described as follows. Certain crop varieties have excellent lodging resistance, which can reduce harvest losses. As no specific crop variety information was collected in the survey, we used the yield per unit area to distinguish among different varieties. On average, the rice yield per unit of the interviewed households was 515.13 kg per mu (7726.95 kg per ha).
The duration of days required by the farmers to complete their harvesting was used to measure the length of harvesting. On average, the interviewed households required 3.25 days to complete the harvesting process. As there are many part-time farmers in China, we also investigated the labor force and working attitude at harvest. We used categorical variables (1, 2, 3) to express the degree of labor sufficiency and the work attitude of farmers. A value of 1 indicates that a household has an insufficient labor force or a poor working attitude at harvest. A value of 3 indicates that a household has a sufficient labor force or a good working attitude at harvest. The statistical results indicate that the households believed that there was a slight labor force shortage (1.93) at harvest, but their working attitude showed a higher level (2.11).
We used dummy variables related to bad weather, such as rainfall during harvest and the presence of pests during harvest, as the display variables of weather and pests during harvest, respectively. Sixteen percent of the farmers suffered bad weather during harvest, and 24% reported pests during harvest.
Of the household decision makers, 83% were male, and the average age and years of schooling for them were 53.50 and 6.99, respectively. Only 10% of the households had participated in agricultural training programmes. The annual net income and family house value of each household were 7.16 and 8.22 ten thousand yuan, respectively.

2.2. Analysis of the Mechanism by Which Farm Size Impacts Rice Harvest Losses

Generally, the decisions of smallholders are based on multiple objectives, including profit maximization, risk minimization, and labor input minimization. However, with economic development and the expansion of scale, farms are more likely to become enterprises. In most studies, researchers assume that people are economically rational and that farmers make production decisions with the goal of profit maximization. Hence, when other conditions remain unchanged, the current loss is the optimal loss [25].
As the scale expands, household income mainly comes from agricultural production. Thus, harvest losses represent a direct economic loss for these farmers. When farmers try to change their production conditions to reduce losses, costs are incurred. If the increased income from these behaviors is lower than the cost of investment, the income decreases [10]. Therefore, farmers must weigh the costs and benefits. If there is strong economic motivation, farmers will invest in their target objectives [11].
The impact of expanding the size of a farm on rice harvest losses may conform to the following paths (Figure 4). First, as the scale expands, farmers participate in more agricultural training programs to improve production techniques and then reduce losses. Second, large-scale farmers are more likely to purchase advanced machinery, which can directly reduce losses. Third, as the scale expands, farmers reduce losses by investing in infrastructure, such as levelling the land. To examine the impact of farm size on rice harvest losses, we used an empirical model to conduct an in-depth analysis to investigate potential impact mechanisms.

2.3. Empirical Model and Empirical Strategy

C i is assumed to be the additional cost to household i to reduce losses, and it is affected by the following factors:
C i = β X i + ε i
where X i is the vector of factors affecting the cost of loss reduction, β is the vector of coefficients to be estimated, and ε i is the random disturbance term. However, accurately measuring the cost to farmers is difficult. We used rice harvest loss y i as a substitute variable for cost, and the corresponding equation can be expressed as
y i = β X i + ε i y i = β X i + ε i
where y i is the proportion of the total harvest amount. Therefore, the outcome variable is a fraction between 0 and 1, inclusive. Traditional linear estimation methods, such as ordinary least squares (OLS), are not suitable for estimating fractional dependent variables. Papke and Wooldridge (1996) advised researchers to use a fractional response model (FRM) to handle this problem [30]. This method works for the case in which the dependent variable is (0, 1) and the extreme case in which the explained variable takes the values 0 and 1.
For conditional expectations of fractional dependent variables, Papke and Wooldridge (1996) proposed the following model:
E ( y i | x i ) = G ( x i β )
where y i represents the dependent variable, with a value in the range of [0,1]; x i denotes the explanatory variables for sample i; and G ( · ) is a known function, G ( · ) [ 0 , 1 ] . This expression is a cumulative distribution function and most likely a logistic distribution ( z ) exp ( z ) / [ 1 + exp ( z ) ] that can be estimated directly by nonlinear techniques.
Based on the Bernoulli loglikelihood function, the quasi-maximum likelihood (QML) method can be used for estimation as follows:
L L i = y i log [ G ( x i b ) ] + ( 1 y i ) log [ 1 G ( x i b ) ]
This method is consistent and robust and can be used to estimate and infer model parameters under general linear model conditions.
For the empirical analysis, we used the preceding method to estimate the following model:
h l r i = α 1 + α 2 L a n d i + α 3 H a r v e s t i + α 4 P r o d u c t i o n i + α 4 H o u s e h o l d i + α 4 R e g i o n i + ε i
where h l r i is the explained variable, which represents the rice harvest losses (as a proportion of the total harvest) of farmer i. L a n d i is the farm size of household i. H a r v e s t i is the harvesting method of household i, including manual harvesting, mechanical harvesting and partial mechanical harvesting, which are represented by dummy variables in the model. P r o d u c t i o n i represents the other characteristics of production and harvest, including variety, labor force, working attitude, and weather and pests during the harvest period. H o u s e h o l d i is the vector of family characteristics, including the characteristics of the decision makers, the family income and the value of the house.

3. Results

3.1. Impact of Farm Size on Rice Harvest Losses

The estimation results are shown in Table 5. The results show that farm size is significantly negatively correlated with rice harvest losses. Based on the results, we drew a fitted line graph to show the relationship between farm size and rice harvest loss (Figure A1). Therefore, farm size and rice harvest losses are inversely related, which means that when other conditions remain unchanged, expanding the farm area will help reduce rice harvest losses.
Compared with manual harvesting, mechanized harvesting significantly increases rice harvest losses. During manual harvesting, which is more delicate, the grain left in the field can be collected. The efficiency of mechanical harvesting is higher, but the machinery easily causes crop damage and leaves grain behind [31]. Meanwhile, working attitude is significantly negatively correlated with rice harvest losses. A meticulous working attitude can reduce the probability of loss and enable effective measures to be taken in time to recover lost grain [32].
Bad weather and pests during harvesting are significantly correlated with higher rice harvest losses by 39.13 and 34.86 percentage points compared to sunny weather and no pests, respectively. If the weather during harvesting is rainy, the moisture content of the rice is likely to be high, causing rot and fungal growth [18]. Moreover, pests directly cause rice losses.
Household income is significantly positively correlated with rice harvest losses. Households with a high annual income may have a weaker awareness of saving [33], and members of these households may be engaged in other industries. To complete the harvest as soon as possible, their working attitudes are less careful, and their labor may be insufficient [34].

3.2. Influencing Mechanism of Farm Size on Rice Harvest Losses

Since the onset of the reform and opening up, mechanization has been developing rapidly in China. The scale of Chinese farms is generally small. Hence, with the substitution of machinery for labor, a novel service model known as agricultural machine services is gaining popularity. The new service model enables farmers to outsource agricultural processes to specialized mechanization service providers. These service providers charge fees for completing the harvesting work using their own machinery. The providers are skilled operators, and their harvesting machines are advanced, which leads to lower losses [35]. As a result, large-scale farmers are more likely to purchase agricultural machinery services for harvesting (Table 6) because of their larger land area and lower loss tolerance, which is an important reason for the lower losses of large-scale farmers.
In the second step, we only include the samples that adopted agricultural machinery services and re-estimate the model (Table 7). The results confirm that for the farmers who adopted agricultural machinery services, farm size remained significantly negatively correlated with rice harvest losses. The influencing mechanism of farm size on rice harvest losses was verified in this study. That is, large-scale farmers are more inclined to adopt agricultural machinery services, which can reduce losses.

3.3. Robustness Test

We replaced the key variables and used robust regression to re-estimate the model to verify that the conclusions of our study are robust and reliable (Table 8). First, we replaced the key dependent variable of rice harvest losses (rice harvest losses as a portion of the total harvest) with rice harvest losses per unit area, while the key independent variable (farm size) remained the same in the model (Column [1]). Second, we changed the key independent variable (farm size) into logarithmic form, while the key dependent variable (rice harvest losses as a portion of the total harvest) remained the same in the model (Column [2]). Third, we replaced the key dependent and independent variables with rice harvest losses per unit area and farm size (logarithmic form) (Column [3]). In the three re-estimations, farm size remained negatively correlated with rice harvest losses, which proves that our results are robust and credible.

4. Conclusions

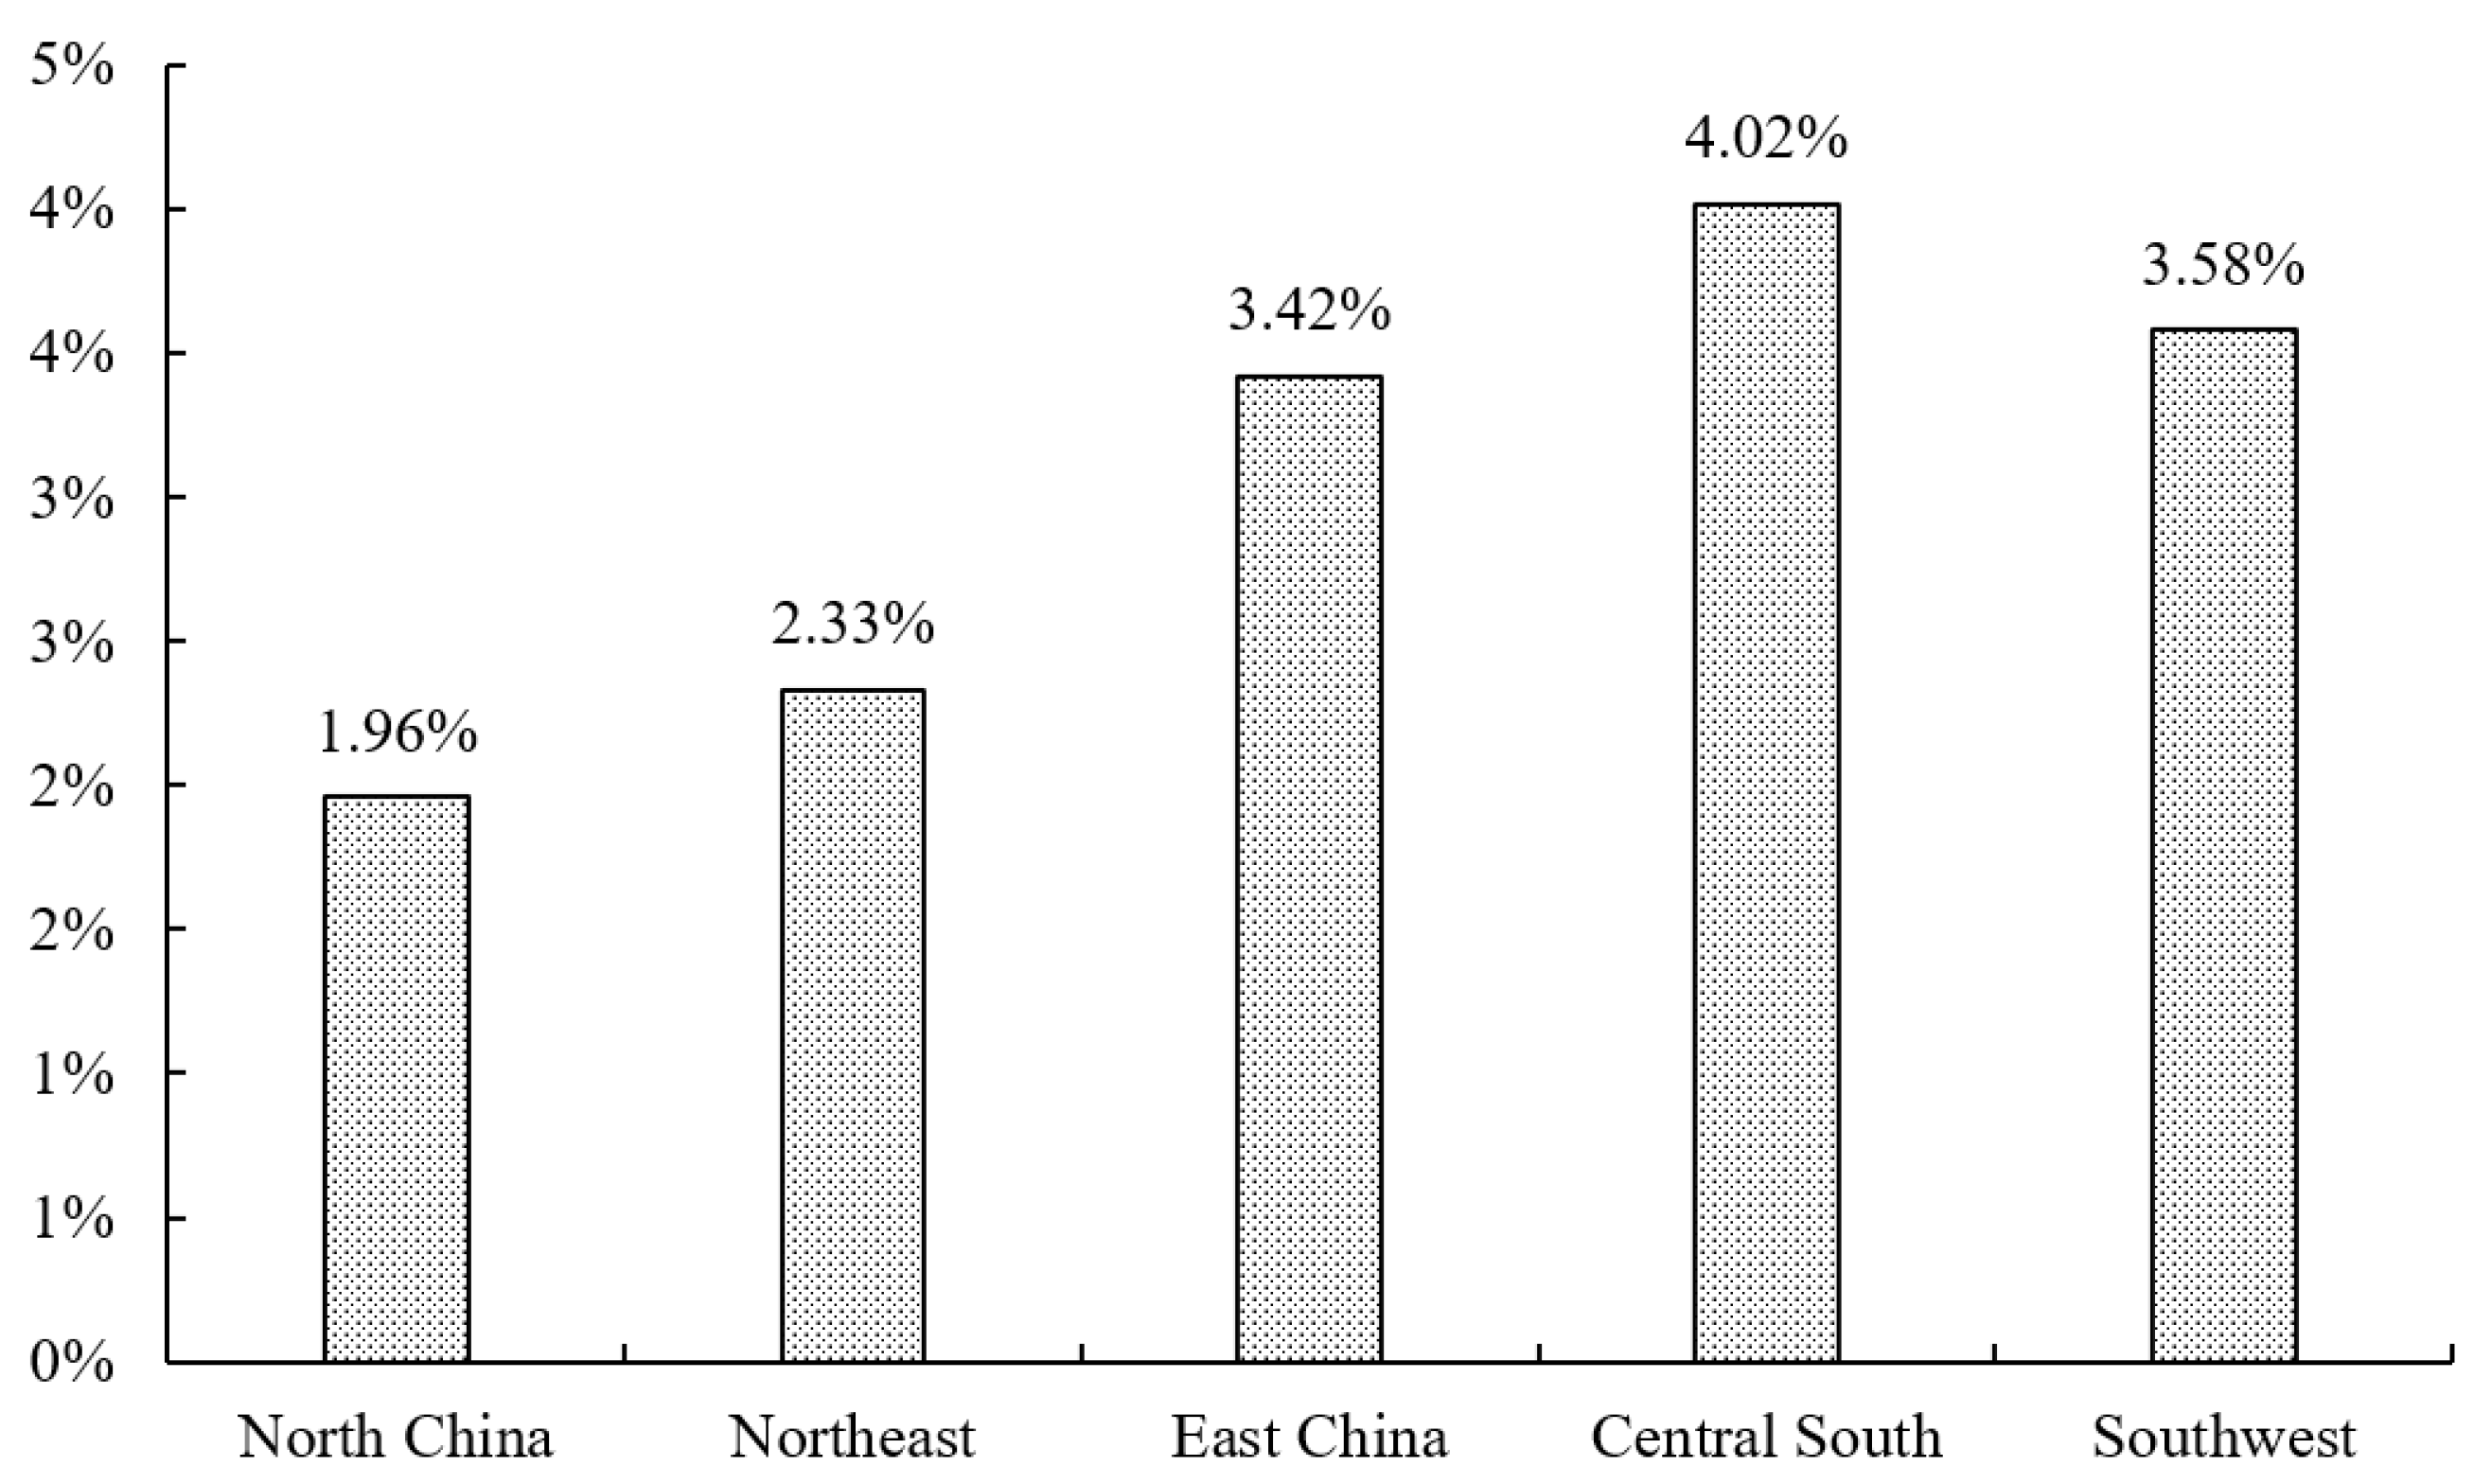
Based on survey data from 1526 households in 17 provinces in China, we evaluated rice harvest losses and then used a fractional logit model to analyze the impact of farm size on rice harvest losses. The results show that, on average, 98.69 kg of rice was lost for each household during the harvest stage, equal to 3.45% of the total harvest. The most serious rice harvest losses occurred in Northwest China, with 5.53% of the total harvest lost during the harvest stage. This result implies that rice harvest losses in economically developing and humid regions are more serious than those in economically developed and dry regions.
Harvest losses result in the meaningless consumption of inputs and have a substantial impact on the environment. Based on our measurements, the total rice harvest loss reached 7.32 million tons in China. This loss of rice, which could meet the food needs of 16.26 million people for one year, resulted in the waste of 1.01 million ha of land, 34.33 ten thousand tons of fertilizer, and 95.17 billion m3 of water, and increased carbon emissions by 2.71 million tons.
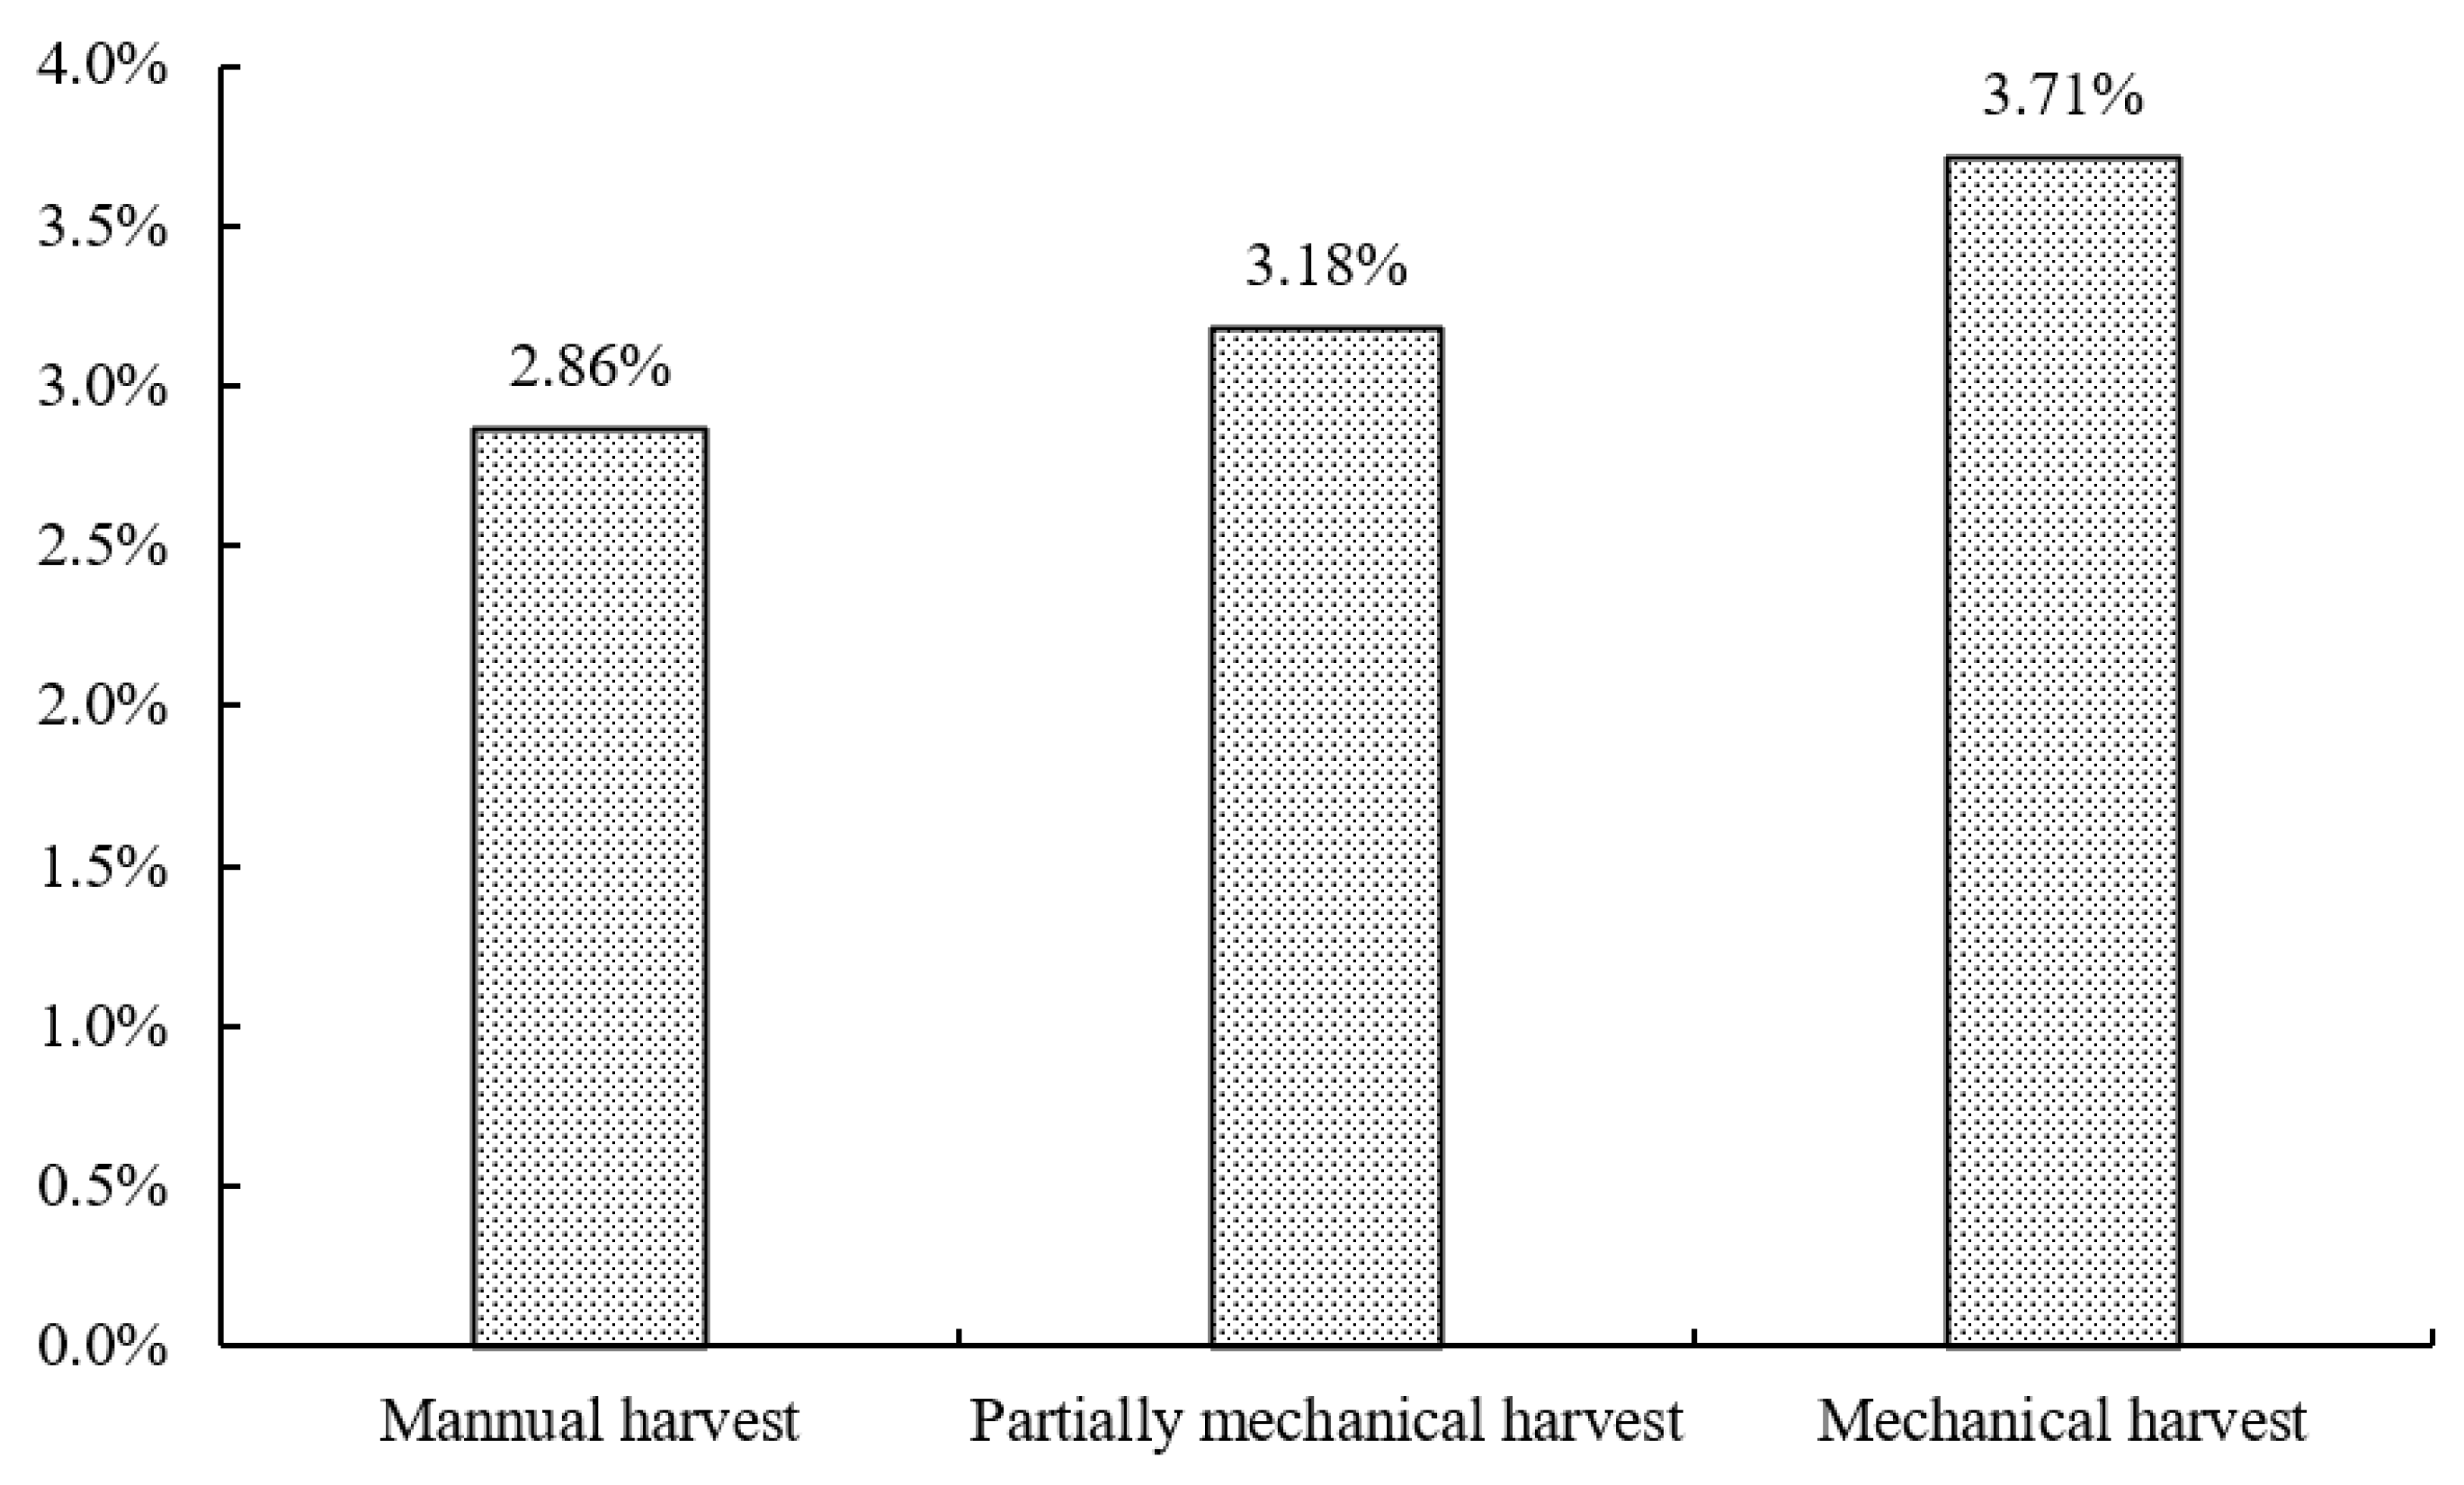
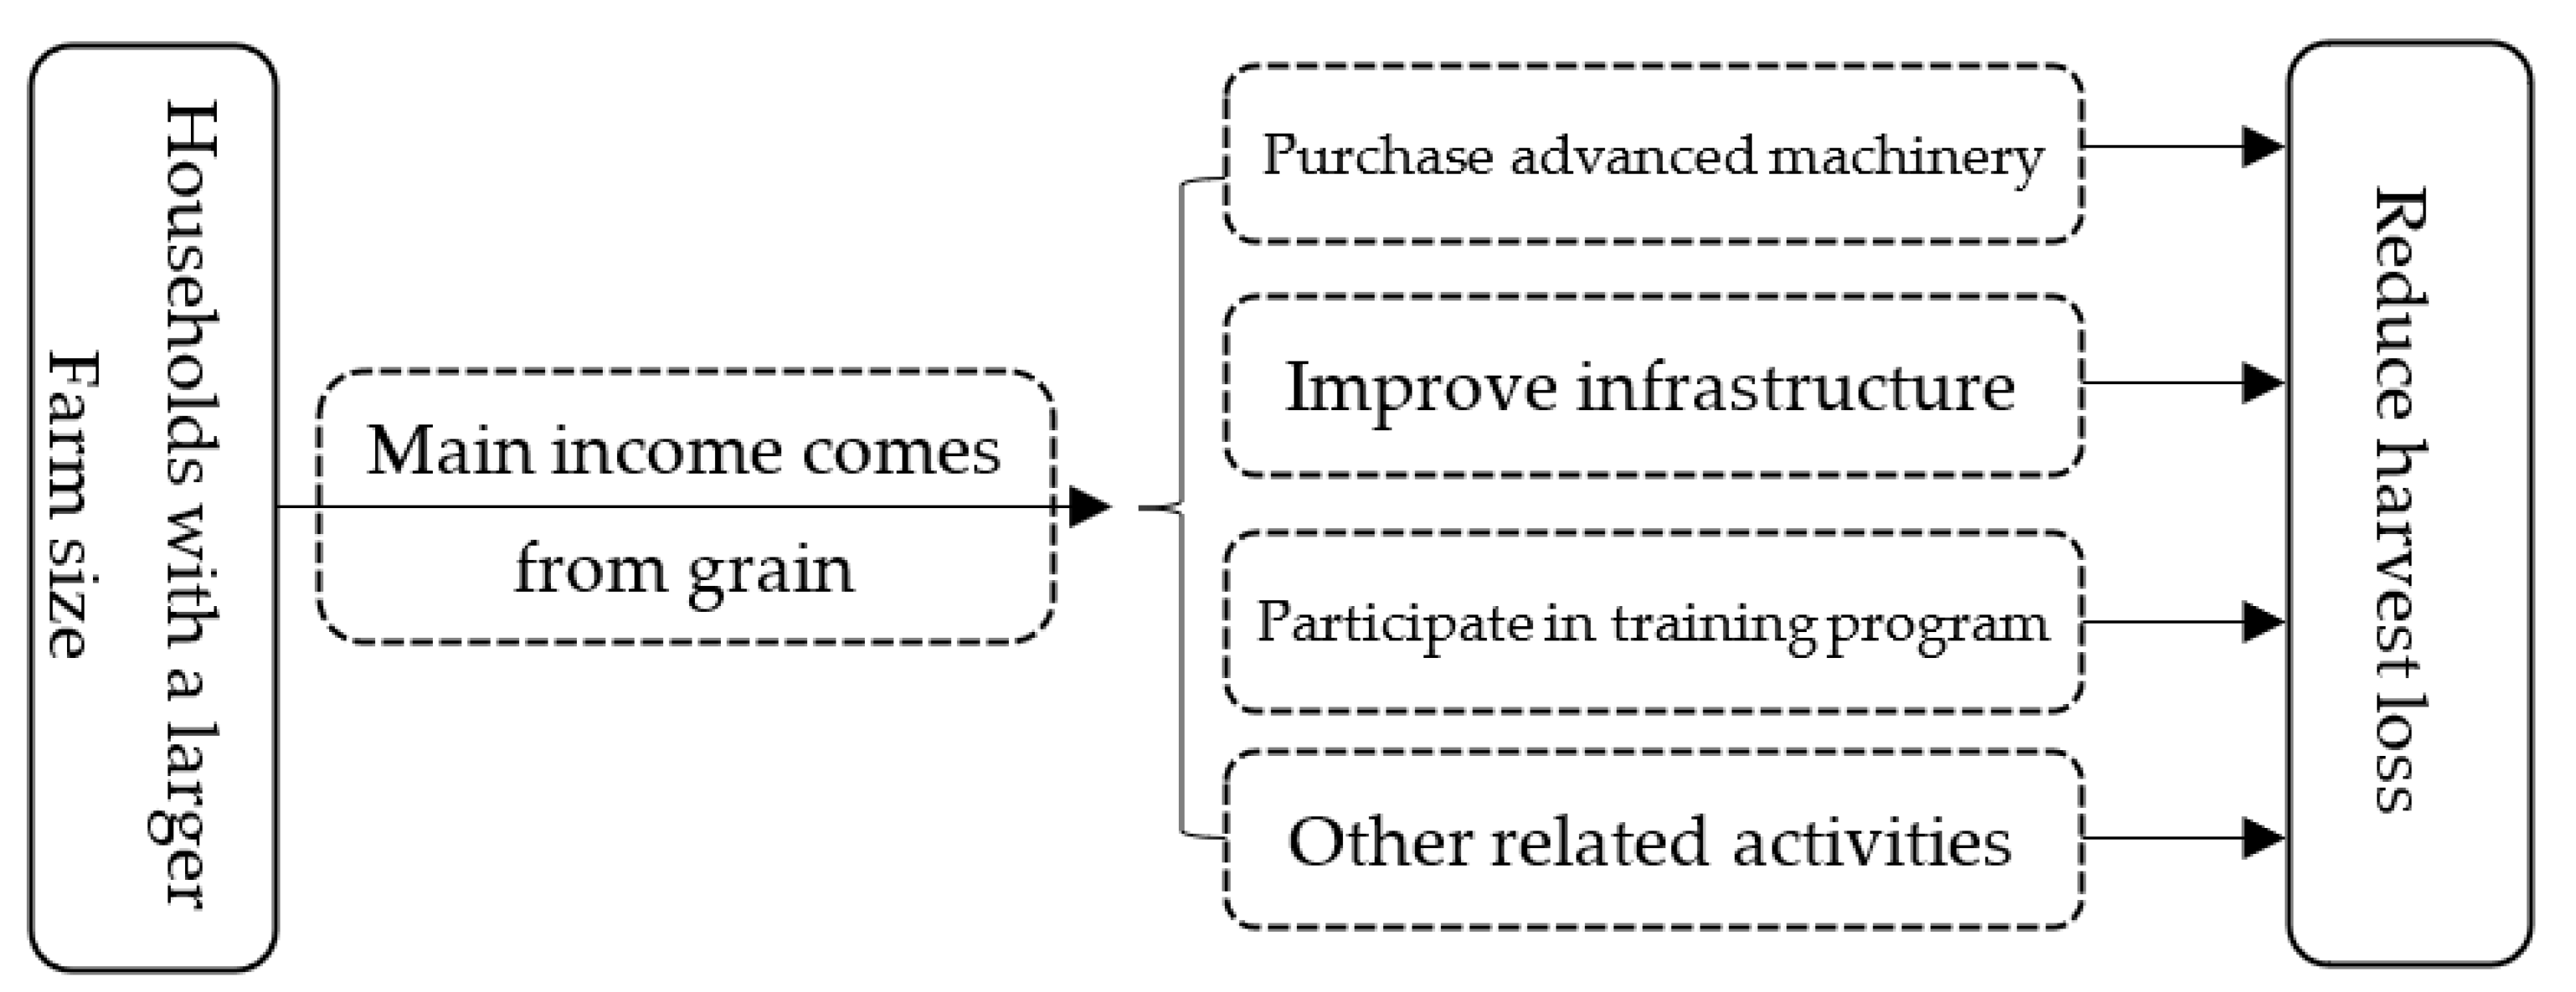
The study also found that mechanical harvesting results in higher losses than the manual harvest method. However, because of the large efficiency gap, farmers will inevitably continue to adopt mechanical methods as agriculture develops. Thus, the government will be required to introduce policies, such as providing subsidies, to encourage farmers to use more advanced machines to reduce such losses. Moreover, the empirical results reveal an inverse relationship between farm size and rice harvest loss rate, which seems to be a contradiction. In our perceptions, large-scale farmers often prefer mechanical harvesting, which will increase losses. However, our study found that large-scale farmers are more likely to adopt agricultural machinery services, and these professional harvesting teams can reduce losses. In China, providers of agricultural machinery services use more advanced machinery, and they regularly maintain and upgrade their machines. Furthermore, the government also provides training programs for machinery operators from agricultural machinery services companies, which makes them more skilled. These operators adapt their machinery operations to the specific conditions of the harvested plot and crop growth, which can reduce losses. When we replaced the key variables and re-estimated the model, the relevant conclusions remained valid, which indicates that expanding the size of farms can reduce rice harvest losses. As China’s rice harvest losses are higher than those in developed countries and regions, it may be necessary to encourage the use of more efficient agricultural machinery services for harvesting and to promote other harvesting practices used on large-scale farms to better protect national food security.
This study used representative agricultural information from China, a country undergoing agricultural transition, to confirm the impact of farm scale and agricultural machinery services on harvest losses. Our findings have important implications for improving world food policies, especially for countries in Africa and South Asia that are—similar to China—also in the stage of transformation development. Of course, other factors, such as region, labor, and variety, may also have a significant impact on harvest losses. However, it is not possible to cover all relevant factors in a single study. Hence, we urge future researchers to extend our discussion, such as by examining the impacts of varieties on harvest losses.

Author Contributions

Conceptualization and methodology, Y.L.; software, D.H.; formal analysis and investigation, Y.L., D.H. and X.Q.; writing—original draft preparation, Y.L.; writing—review and editing, L.W. All authors have read and agreed to the published version of the manuscript.

Funding

This research was funded by the National Natural Science Foundation of China, grant number 72241009 and 72241010.

Data Availability Statement

Not applicable.

Acknowledgments

We thank the district authorities in the study area and all those who were involved in data collection and analysis and report compilation.

Conflicts of Interest

The authors declare no conflict of interest.

Appendix A

Figure A1. The relationship between farm size and rice harvest loss (fitted line).
Land 11 01760 g0a1

Notes

1.
Data source: http://www.gov.cn/xinwen/2019-08/05/content_5418684.htm (accessed on 5 July 2022).
2.
Data source: National Bureau of Statistics of China, https://data.stats.gov.cn (accessed on 4 August 2022).
3.
Data source: FAOSTAT, https://www.fao.org/faostat/en/#data (accessed on 1 September 2022).

References

  1. Liu, Y.S.; Li, J.T.; Yang, Y.Y. Strategic adjustment of land use policy under the economic transformation. Land Use Policy 2018, 74, 5–14. [Google Scholar] [CrossRef]
  2. He, C.Y.; Liu, Z.F.; Xu, M.; Ma, Q.; Dou, Y.Y. Urban expansion brought stress to food security in China: Evidence from decreased cropland net primary productivity. Sci. Total Environ. 2016, 576, 660–670. [Google Scholar] [CrossRef]
  3. Jiao, X.Q.; Mongol, N.; Zhang, F.S. The transformation of agriculture in China: Looking back and looking forward. J. Integr. Agric. 2018, 17, 755–764. [Google Scholar] [CrossRef] [Green Version]
  4. Huang, J.K.; Wang, X.B.; Rozelle, S. The subsidization of farming households in China’s agriculture. Food Policy 2013, 41, 124–132. [Google Scholar] [CrossRef]
  5. Luo, Y.; Huang, D.; Li, D.Y.; Wu, L.P. On farm storage, storage losses and the effects of loss reduction in China. Resour. Conserv. Recycl. 2020, 162, 105062. [Google Scholar] [CrossRef]
  6. Xu, Z.G.; Zhang, Z.L.; Liu, H.Y.; Zhong, F.N.; Bai, J.F.; Cheng, S.K. Food-away-from home plate waste in China: Preference for variety and quantity. Food Policy 2020, 97, 101918. [Google Scholar] [CrossRef]
  7. Liu, J.; Lundqvist, J.; Weinberg, J.; Gustafsson, J. Food loss and waste in China and their implication for water and land. Environ. Sci. Technol. 2013, 47, 10137–10151. [Google Scholar] [CrossRef]
  8. Gao, L.W.; Xu, S.W.; Li, Z.M.; Cheng, S.K.; Wen, Y.; Zhang, Y.E.; Li, D.H.; Wang, Y.; Wu, C. Main grain crop postharvest losses and its reducing potential in China. Trans. Chin. Soc. Agric. Eng. 2016, 32, 1–11. [Google Scholar]
  9. Abass, A.B.; Ndunguru, G.; Mamiro, P.; Alenkhe, B.; Mlingi, N.; Bekunda, M. Post-harvest food losses in a maize-based farming system of semi-arid savannah area of Tanzania. J. Stored Prod. Res. 2014, 57, 49–57. [Google Scholar] [CrossRef] [Green Version]
  10. Wu, L.H.; Hu, Q.P.; Wang, J.H.; Zhu, D. Empirical analysis of the main factors influencing rice harvest losses based on sampling survey data of ten provinces in China. China Agric. Econ. Rev. 2017, 9, 287–302. [Google Scholar] [CrossRef]
  11. Chegere, M.J. Post-harvest losses reduction by small-scale maize farmers: The role of handling practices. Food Policy 2018, 77, 103–115. [Google Scholar] [CrossRef]
  12. Basavaraja, H.; Mahajanashetti, S.B.; Udagatti, N.C. Economic analysis of post-harvest losses in food grains in India: A case study of Karnataka. Agric. Econ. Res. Rev. 2007, 20, 581–593. [Google Scholar]
  13. Bala, B.K. Post-Harvest Loss and Technical Efficiency of Rice, Wheat and Maize Production System: Assessment and Measures for Strengthening Food Security; National Food Policy Capacity Strengthening Programme: Dhaka, Bangladesh, 2010. [Google Scholar]
  14. Kantor, L.S.; Lipton, K.; Manchester, A.; Oliveira, V. Estimating and addressing America’s food losses. Food Rev. 1997, 20, 2–12. [Google Scholar]
  15. Parfitt, J.; Barthel, M.; Macnaughton, S. Food waste within food supply chains: Quantification and potential for change to 2050. Philos. Trans. R. Soc. B Biol. Sci. 2010, 365, 3065–3081. [Google Scholar] [CrossRef] [Green Version]
  16. Martins, A.G.; Goldsmith, P.; Moura, A. Managerial factors affecting postharvest loss: The case of Mato Grosso Brazil. Int. J. Agric. Manag. 2014, 3, 200–209. [Google Scholar]
  17. Bokusheva, R.; Finger, R.; Fischler, M.; Berlin, R.; Marín, Y.; Pérez, F.; Paiz, F. Factors determining the adoption and impact of a postharvest storage technology. Food Secur. 2012, 4, 279–293. [Google Scholar] [CrossRef] [Green Version]
  18. Hodges, R.J.; Buzby, J.C.; Bennett, B. Postharvest losses and waste in developed and less developed countries: Opportunities to improve resource use. J. Agric. Sci. 2011, 149, 37–45. [Google Scholar] [CrossRef] [Green Version]
  19. Cui, Z.L.; Zhang, H.Y.; Chen, X.P.; Zhang, C.C.; Ma, W.Q.; Huang, C.D.; Zhang, W.F.; Mi, G.H.; Miao, Y.X.; Li, X.L.; et al. Pursuing sustainable productivity with millions of smallholder farmers. Nature 2018, 555, 363–366. [Google Scholar] [CrossRef]
  20. Tan, S.H.; Heerink, N.; Qu, F.T. Land fragmentation and its driving forces in China. Land Use Policy 2006, 23, 272–285. [Google Scholar] [CrossRef]
  21. Jia, L.L.; Petrick, M. How does land fragmentation affect off-farm labor supply: Panel data evidence from China. Agric. Econ. 2014, 45, 369–380. [Google Scholar] [CrossRef] [Green Version]
  22. Peng, K.L.; Yang, C.; Chen, Y. Land transfer in rural China: Incentives, influencing factors and income effects. Appl. Econ. 2020, 52, 5477–5490. [Google Scholar] [CrossRef]
  23. Ren, C.C.; Liu, S.; Grinsven, H.; Reis, S.; Jin, S.Q.; Liu, H.B.; Gu, B.J. The impact of farm size on agricultural sustainability. J. Clean. Prod. 2019, 220, 357–367. [Google Scholar] [CrossRef]
  24. Kaminski, J.; Christiaensen, L. Post-harvest loss in sub-Saharan Africa—What do farmers say? Glob. Food Secur. 2014, 3, 149–158. [Google Scholar] [CrossRef] [Green Version]
  25. Sheahan, M.; Barrett, C.B. Review: Food loss and waste in Sub-Saharan Africa. Food Policy 2017, 70, 1–12. [Google Scholar] [CrossRef]
  26. Cao, F.F.; Zhu, J.F.; Guo, Y.; Liu, J.L.; Wu, L.P. Wheat harvest loss in China: Based on experiments and surveys in 5 cities of 4 provinces. J. Arid Land Resour. Environ. 2018, 32, 7–14. (In Chinese) [Google Scholar]
  27. National Development and Reform Commission. Cost-Benefit Data of Agricultural Products (2017); China Statistics Press: Beijing, China, 2018. (In Chinese) [Google Scholar]
  28. Cheng, K.; Yan, M.; Nayak, D.; Pan, G.X.; Smith, P.; Zheng, J.F.; Zheng, J.W. Carbon footprint of crop production in China: An analysis of national statistics data. J. Agric. Sci. 2015, 153, 422–431. [Google Scholar] [CrossRef] [Green Version]
  29. Sun, S.K.; Wang, Y.B.; Liu, J.; Wu, P.T. Quantification and evaluation of water footprint of major grain crops in China. J. Hydraul. Eng. 2016, 47, 1115–1124. (In Chinese) [Google Scholar]
  30. Papke, L.E.; Wooldridge, J.M. Econometric methods for fractional response variables with an application to 401(k) plan participation rates. J. Appl. Econom. 1996, 11, 619–632. [Google Scholar] [CrossRef]
  31. Qu, X.; Kojima, D.; Nishihara, Y.; Wu, L.P.; Ando, M. Impact of rice harvest loss by mechanization or outsourcing: Comparison of specialized and part-time farmers. Agric. Econ. Zemed. Ekon. 2020, 66, 542–549. [Google Scholar] [CrossRef]
  32. Cao, F.F.; Huang, D.; Zhu, J.F.; Wu, L.P. The Wheat Harvest Loss and its Main Determinants in China: An Empirical Analysis Based on Survey Data from 1135 Households. China Rural. Surv. 2018, 2, 75–87. (In Chinese) [Google Scholar]
  33. Luo, Y.; Wu, L.P.; Huang, D.; Zhu, J.F. Household food waste in rural China: A noteworthy reality and a systematic analysis. Waste Manag. Res. 2021, 39, 1389–1395. [Google Scholar] [CrossRef] [PubMed]
  34. Luo, Y.; Huang, D.; Wu, L.P.; Zhu, J.F. The impact of metal silos on rice storage and storage losses in China. Food Secur. 2022, 14, 81–92. [Google Scholar] [CrossRef]
  35. Qu, X.; Kojima, D.; Nishihara, Y.; Wu, L.P.; Ando, M. Can harvest outsourcing services reduce field harvest losses of rice in China? J. Integr. Agric. 2021, 20, 1396–1406. [Google Scholar] [CrossRef]
Figure 1. Rice harvest losses in different regions of China. Note: The loss rate of each region is the arithmetic average of the harvest loss rate of all farmers in this region.
Land 11 01760 g001
Figure 2. Rice harvest losses for different farm sizes. Note: Small-scale farm: farm size less than 3.3 mu (0.22 ha), 501 households in our database; farm size less than 10 mu (0.67 ha), 1136 households in our database. Medium-scale farm: farm size between 3.3 mu and 8 mu (0.22 ha to 0.53 ha), 512 households in our database; farm size between 10 mu and 20 mu (0.67 ha to 1.33 ha), 233 households in our database. Large-scale farm: farm size larger than 8 mu (0.53 ha), 513 households in our database; farm size larger than 20 mu (1.33 ha), 157 households in our database.
Land 11 01760 g002
Figure 3. Rice harvest losses for different harvest methods.
Land 11 01760 g003
Figure 4. Model of the mechanism by which farm size impacts harvest losses.
Land 11 01760 g004
Table 1. Sample distribution.
RegionProvinceSamples
North ChinaTianjin, Shandong45
NortheastLiaoning, Jilin, Heilongjiang212
East ChinaJiangsu, Anhui, Fujian, Jiangxi511
Central SouthHubei, Hunan, Guangdong, Guangxi501
SouthwestSichuan, Guizhou, Yunnan, Chongqing257
Total 1526
Table 2. Descriptive statistics on rice harvest losses.
ProcessLoss (kg)
Harvesting62.81
Field transportation4.39
Threshing24.27
Cleaning7.21
Total harvest loss98.69
Harvest loss (%) a3.45
Note: a harvest loss (%) = total loss/(loss + output), the harvest loss (%) is the arithmetic average of the harvest loss rate of all households.
Table 3. Impact of rice harvest losses on natural resources and the environment.
TermValue
Average harvest loss (%)3.45
Rice output in 2015 (10,000 t)21,214.19
Total rice loss (10,000 t)731.89
Number of people who can be fed per year (million people)16.26
Land (10,000 ha)101.09
Fertilizer (converted into purification) (10,000 t)34.33
Carbon emissions (million t)2.71
Water (billion m3)95.17
Note: The average harvest loss is the arithmetic mean of the losses from all sample farmers; currently, the annual food consumption of a Chinese citizen is equivalent to 450 kg of raw grains [26], and we set the ratio of each crop to raw grain at 1:1. The conversion coefficients of land and fertilizer originated from “Agricultural Product Cost Benefit Data (2017)” (in Chinese) [27]. The coefficient of carbon emissions was drawn from Cheng et al. (2015), “Carbon footprint of crop production in China: an analysis of National Statistics data” [28]. The coefficient of water was drawn from Sun et al. (2016), “Quantification and evaluation of water footprint of major grain crops in China” (in Chinese) [29].
Table 4. Variable definitions and descriptive statistics.
VariablesMin.Std. Dev.MinMax
Dependent variable: rice harvest loss as portion of total harvest (%)3.453.37046.81
Farm size: area of land for rice (mu 1)8.9811.710.2206
Harvest method2
Manual (yes = 1)0.120.3201
Part of the harvesting process by machines (yes = 1)0.290.4601
Harvest by machines (yes = 1)0.590.4901
Characteristics of production and harvest
Breed: yield per unit area (kg/mu)515.13130.21304.60800
Harvest period: time required to complete the harvest (days)3.253.630.528
Whether labor force is sufficient (not enough = 1, nearly = 2, sufficient = 3)1.930.6713
Working attitude at harvest (poor = 1, normal = 2, fine = 3)2.110.5513
Whether there was bad weather such as rainfall during harvest (yes = 1)0.160.3701
Whether there were pests during harvest (yes = 1)0.240.4201
Characteristics of decision maker or family
Gender of family decision maker (male = 1)0.830.3801
Age of family decision maker (years)53.5010.971977
Years of schooling of decision maker (years)6.992.59016
Whether participated in agricultural training (yes = 1)0.100.2901
Annual net income of the family (ten thousand yuan 3)7.168.220.3863.52
Family assets: family house value (ten thousand yuan 3)8.2210.140.4150
Notes: 1. mu is the unit of area in China; 1 ha = 15 mu; 2. “Manual harvest” is defined as farmers not using mechanical operations in any harvest process (including harvesting, threshing and grain cleaning); “harvest by machines” means that farmers use mechanical operations in all harvesting stages; the remaining farmers perform part of the harvesting process by machines. 3. The yuan is the Chinese currency unit, 1 USD = 6.1207 yuan (June 2015). The same applies below.
Table 5. Estimation results of the impact of farm size on rice harvest losses.
Dependent Variable: Rice Harvest Loss as a Portion of Total Harvest (%)
Coefficientz Value
Farm size: area of land for rice (mu)−0.0089 ***−3.44
Harvest method
Part of the harvesting process by machines (yes = 1)0.06840.79
Harvest by machines (yes = 1)0.2688 ***3.29
Characteristics of production and harvest
Breed: yield per unit area (kg/mu)−0.0001−0.73
Harvest time: time taken to complete the harvest (days)−0.0056−0.72
Labor force is nearly sufficient (yes = 1)−0.0620−1.06
Labor force is sufficient (yes = 1)−0.0818−1.08
Working attitude at harvest is normal (yes = 1)−0.2749 ***−3.25
Working attitude at harvest is fine (yes = 1)−0.3916 ***−4.03
Whether there was bad weather such as rainfall during harvest (yes = 1)0.3913 ***5.53
Whether there were pests during harvest (yes = 1)0.3486 ***5.88
Characteristics of decision maker or family
Gender of family decision maker (male = 1)0.09111.38
Age of family decision maker (years)0.0047 *1.92
Years of schooling of decision maker (years)0.00800.77
Whether participated in agricultural training (yes = 1)−0.0889−0.97
Annual net income of the family (ten thousand yuan)0.1037 **2.46
Family assets: family house value (ten thousand yuan)0.01730.73
_cons−3.6840 ***−15.25
Regional dummyControlled
Obs.1526
Note: * p < 0.1, ** p < 0.05, *** p < 0.01.
Table 6. Impact of farm size on the adoption of agricultural machinery services.
Dependent Variable: Whether Agricultural Machinery Services were Purchased during the Harvest Stage (yes = 1)
VariablesCoefficientz ValueCoefficientz Value
Farm size: area of land for rice (mu)0.0074 ***2.640.0082 **2.18
Harvest method-Controlled
Characteristics of production and harvest-Controlled
Characteristics of decision maker or family-Controlled
Regional dummy-Controlled
Obs.15261526
Note: ** p < 0.05, *** p < 0.01.
Table 7. Estimation results of the impact of farm size on rice harvest losses (i.e., farmers who adopted agricultural machinery services).
Dependent Variable: Rice Harvest Loss as a Portion of Total Harvest (%)
CoefficientZ Value
Farm size: area of land for rice (mu)−0.0125 ***−3.64
Harvest methodControlled
Characteristics of production and harvestControlled
Characteristics of decision maker or familyControlled
Regional dummyControlled
Obs.1051
Note: *** p < 0.01.
Table 8. Estimation results of the robustness test.
Dependent Variable: Rice Harvest Loss per Unit Area
[1][2][3]
CoefficientZ ValueCoefficientz ValueCoefficientz Value
Farm size: area of land for rice (mu)−0.03 ***−3.44−1.34 ***−12.46−0.25 ***−6.23
Harvest methodControlledControlledControlled
Characteristics of production and harvestControlledControlledControlled
Characteristics of decision maker or familyControlledControlledControlled
Regional dummyControlledControlledControlled
Note: *** p < 0.01.
Publisher’s Note: MDPI stays neutral with regard to jurisdictional claims in published maps and institutional affiliations.

