Article

Remote Sensing Monitoring and Analytical Evaluation of Grasslands in the Muli Region of Qinghai, China from 2000 to 2021

1
School of Environment and Spatial Informatics, China University of Mining and Technology, Xuzhou 221116, China
2
Qinghai Natural Resources Comprehensive Survey and Monitoring Institute, Xining 810001, China
*
Authors to whom correspondence should be addressed.
Land 2022, 11(10), 1733; https://doi.org/10.3390/land11101733
Submission received: 11 August 2022 / Revised: 30 September 2022 / Accepted: 2 October 2022 / Published: 7 October 2022

Abstract

:
The mining area in the Muli region, Qinghai Province, China, is an important source of water and an ecological security barrier in the Qilian Mountains region and has a very important ecological status. A series of ecological problems such as vegetation degradation and loss of biodiversity caused by mining have attracted widespread attention. In this paper, we used Landsat secondary data from 2000 to 2021 from the Muli region to obtain the spatial and temporal distribution characteristics of the vegetation in the Muli region by inversion of the fractional vegetation cover, above-ground biomass and the land surface phenology to comprehensively analyze the ecological changes in the vegetation in the Muli region. The results showed the following: (1) the above-ground biomass and cover of grassland in the Muli region showed a decreasing trend between 2000 and 2021, with a particularly pronounced decrease in grassland cover between 2009 and 2016; (2) the start of the vegetation growth cycle, i.e., the beginning of the vegetation growing season (SOG) became more advanced, the end of the vegetation growing season (EOG) was delayed, and the length of the growing cycle (LOG) became longer for most of the vegetation in the Muli region; (3) the results of this comprehensive analysis showed that the grassland in the Muli region showed dynamic changes with complex characteristics from 2000 to 2021, and anthropogenic disturbances had some influence on ecological indicators such as fractional vegetation cover and biomass. The extension of the vegetation growing season might be related to climate change. Based on the results of this paper, it is recommended to utilize biomass and fractional vegetation cover as indicators to assess the grass growth status of mining sites. This study analyzed the spatial and temporal characteristics of grasslands in the Muli area with several indicators, which will help relevant departments continue to improve and optimize ecological restoration measures. In addition, this study provides a reference for achieving comprehensive restoration of the ecological environment and ecological functions in mining areas.

1. Introduction

Grasslands are not only the material basis for Tibetan livestock production, but also an important part of the ecosystem, playing a role in nourishing water sources and maintaining soil and water. The Muli region in Qinghai Province is the birthplace of the Daitong River [1], an important tributary of the upper reaches of the Yellow River, and is also an important part of the Qilian Mountains’ water-conserving area and ecological security barrier, with extremely important ecological status [2,3,4]. As a result of years of coal mining activities, water, land, vegetation and other resources in the area have been damaged to varying degrees [5], resulting in a series of ecological and environmental problems, such as the degradation of grasslands and a decline in the water-covering function of the ecosystem, which urgently need to be remediated and restored [6]. The impact of coal mining on the surrounding environment is not only an ecological issue that needs to be studied but is also a major issue that affects the lives of herders [7]. In 2014, the state issued important instructions to stop all pre-construction projects and mining practices at Muli mine and to actively carry out comprehensive ecological and environmental remediation work [1,8]. In 2020, a comprehensive ecological and environmental remediation group was established to scientifically implement ecological restoration of the Muli mine [9]. Therefore, there is an urgent need to establish environmental monitoring of the grassland in and around the Muli mine area to explain the temporal and spatial changes in the condition of the grassland over a long period of time.
The fractional vegetation cover (FVC) reflects the occupation of the vegetation area within an area, and grassland biomass is an important indicator of grassland growth status and ecological environment evaluation [10]. These data reflect the growth status of grassland in mining areas. Since the 1980s, scholars at home and abroad have conducted extensive research to estimate grassland cover, biomass and phenological information using remote sensing data [5]. Models for estimating above-ground biomass (AGB) of grasslands, used at home and abroad, include a remote sensing statistical model, crop growth model, grassland growth model and light energy utilization model, etc. [11]. Large-scale grassland above-ground biomass studies use regression statistical models to show the relationship between grassland above-ground biomass and remotely sensed data. For example, Eisfelder et al. [12] estimated biomass in semi-arid areas using optical and radar data, increasing the stability of a linear model constructed between indices of remotely sensed products and measured biomass. This type of statistical method is simple to operate and is reliable in terms of accuracy [13] but requires that remotely sensed data be synchronized with measured data and that factors such as ground grass type are fully considered. For the past three decades, Landsat images have been widely used in above-ground biomass calculations [14]. This is due to the advantages of their free downloadability, wide time range and high ground resolution. Zhao et al. [15] used a gray scale coevolution matrix (GLCM) to develop AGB estimation models for different scenes based on a stepwise regression analysis of Landsat spectral features and textures. Furthermore, grassland vegetation cover is one of the most commonly used remote sensing monitoring indicators to assess the ecological environment of grassland in mining areas. There are three types of methods to estimate FVC by remote sensing means [16]: (1) methods based on regression models [17]; (2) methods based on pure vegetation indices; and (3) methods based on image element decomposition models [18]. The pixel dichotomy method [19] has demonstrated good accuracy and high efficiency, and is widely used at different scales. Land surface phenology (LSP) is an important indicator of the change of phenology and the natural environment [20], and the application of remote sensing as a means to obtain grassland phenology information is beneficial to achieve large scale extraction [21]. At present, there are six commonly used methods [22]: sliding average method, threshold method, fitting method, maximum slope method, principal component analysis method and cumulative frequency method. Moderate-resolution imaging spectro-radiometer (MODIS) are mounted on Terra and Aqua satellites, which have good temporal resolution but low spatial resolution, and according to research data MODIS is the most commonly used sensor in LSP research. In addition to MODIS images, other spectral images such as SPOT, Landsat and Sentinel satellites are also widely used. Moreover, many studies have used radar satellites such as the advanced land observing satellite (ALOS) and ENVISAT-1 satellites; these images can be used directly for estimation and monitoring or can be added to models to improve accuracy. With the development of high-resolution satellite technology, remote sensing analysis technology has become more rapid, accurate and convenient for calculating the growth conditions of grasslands in mining and surrounding areas [23]. Globally, there are a large number of excellent results from its application.
Coal mining areas are the most typical degraded ecosystems in the terrestrial ecological biosphere. Mines and their associated landscapes take up areas that otherwise would be grassland and also contribute to areas of unhealthy grassland. In addition, the flow of water and the discharge of wastewater resulting from water usage in coal mining processes exacerbate environmental problems [24]. Furthermore, poor surface soil quality, low soil fertility and inadequate groundwater supply in mining subsidence areas may affect the phenological period of vegetation [25].
To this end, this study used Landsat secondary remote sensing data from 2000 to 2021 in the Muli region to comprehensively evaluate and analyze the ecological changes in vegetation in the study area over a long period of time by inversion of information on FVC, AGB and LSP indicators around the Muli mining area, aiming to promote and improve the development of ecological restoration theory in mining areas, provide monitoring methods for other grassland mining areas, and also provide technical support and a scientific basis for biodiversity conservation and management in the reclaimed land of fragile grassland ecological zones.

2. Materials and Methods

2.1. Overview of the Study Area and Data Source

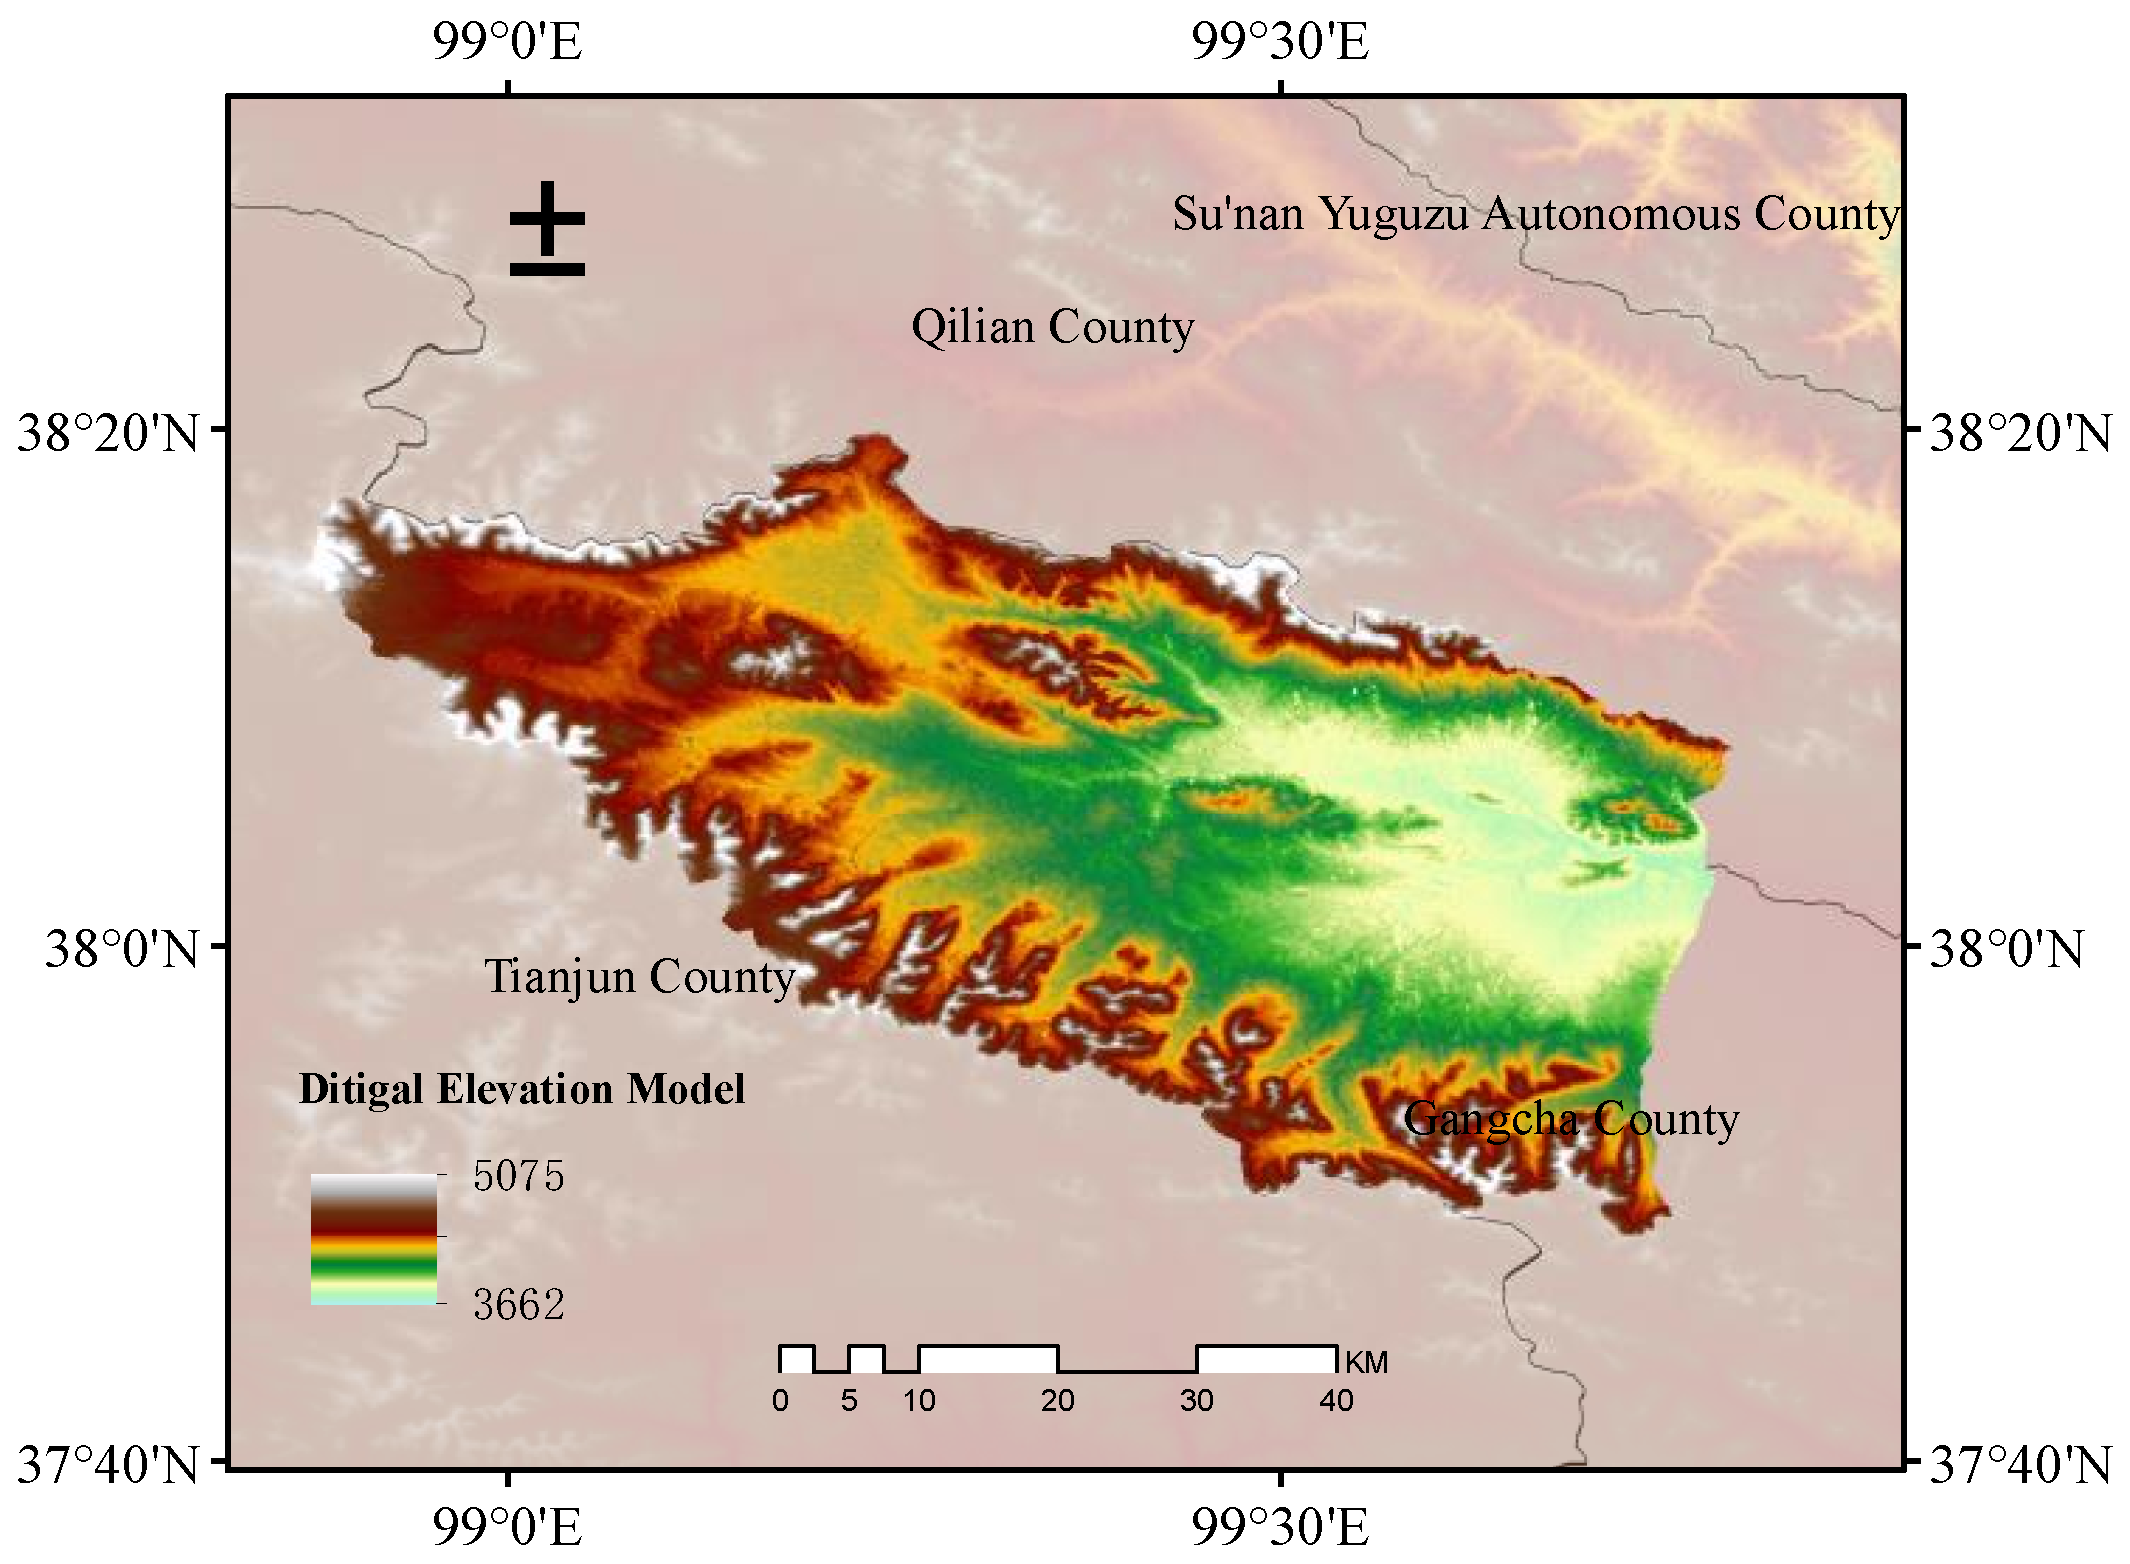
2.1.1. Overview of the Study Area

The study area was located in the Haixi Mongolian and Tibetan Autonomous Prefecture and Haibei Tibetan Autonomous Prefecture, Qinghai Province, China, which belongs to the headwaters of the Daitong River system. The administrative area of the study area spans Tianjun, Gangcha and Qilian counties, including the Muli mining area and a part of the Qinghai area at the southern foot of the Qilian Mountains. It had a total area of 2453.56 km2 and the geographical location was between 98°53′ and 99°47′ E longitude and 37°49′ and 38°19′ N latitude. The Muli mining area is the key monitoring area in this study [26]. It is the largest coal mining area in Qinghai Province and the only coking coal resource exploration area in Northwest China [1].
The Muli region has typical plateau alpine climate characteristics. The region is located in the alpine zone with an average altitude of 4000m (as shown in Figure 1) and is dominated by the plateau ice margin landform type. The vegetation in the Muli region is perennial grasses and rhizomatous mosses with cold and drought tolerance as the dominant population, which is a typical alpine vegetation type in the Tibetan Plateau, but the community structure is simple and the resistance to human activities is weak [5].

2.1.2. Overview of the Data Source

The data required for this study include both satellite remote sensing data and ground-truthing data. The remote sensing data were obtained using the secondary products of Landsat 8, Landsat 7 and Landsat 5 with 30 m spatial resolution provided by the USGS (https://earthexplorer.usgs.gov (accessed on 3 July 2022)). The surface reflectance was obtained by atmospheric correction based on the top-of-atmosphere reflectance product for this level of data. The acquisition time and related parameters of Landsat remote sensing images are shown in Table 1. A mechanical failure in the Landsat 7 scan line corrector caused the image data of this satellite to show missing strips, and the strips needed to be repaired by inserting landsat_gapfill during pre-processing. Given that the vegetation growth in Qinghai Province is at its peak in summer [27], July–September was chosen as the acquisition period for the remote sensing images in this study. Remote sensing data were obtained from the study area using pre-processing techniques such as cropping and mosaicking. The ground truth data were obtained from the monitoring information of 13 stations of the Qinghai Province Natural Resources Comprehensive Survey and Monitoring Institute. The ground monitoring data was based on different mine locations, treatment measures and topography to select representative artificial grasslands with large areas that were capable of continuous grass restoration effectiveness tracking and monitoring. The total vegetation cover was measured using a multispectral cover meter, and the sub-total cover was measured using the pinprick method and expressed as a percentage. Biomass was measured using a 1m×1m sample method with three replicates per sample site. Herb yield measurement samples were set up at the prescribed points, mowed flush with the ground according to plant species and weighed separately. The monitoring date was July 2021, and the monitoring included above-ground biomass dry weight and fresh weight, etc. Precipitation and temperature data were from the rp5.ru weather data network (https://rp5.ru/ (accessed on 3 July 2022)), for the station Tianjun County (37°11′, 102°48′), in the time period 2005–2021. The details of the data are shown in Table 1.

2.2. Methods

Based on the reflectance spectral characteristics of surface vegetation, vegetation information is usually extracted using the reflectance of vegetation in the red and near-infrared bands and other factors. Moreover, the surface vegetation index is obtained by combining these bands, which usually contain more than 90% of the information about the vegetation. Among them, the normalized difference vegetation index (NDVI) [28] is considered to be the best indicator for monitoring vegetation growth status and vegetation cover. The NDVI can partially eliminate images of changing radiometric conditions related to solar altitude angle, satellite observations, topography, clouds, shadows and atmospheric conditions after ratio processing. The index is more sensitive to changes in the soil background, which improves the sensitivity of monitoring and is an important indicator of vegetation condition, vegetation cover and other information. The NDVI is calculated by the following formula.
N D V I = ρ N I R ρ R E D ρ N I R + ρ R E D
where ρNIR and ρRED are the reflectance in the near-infrared and red bands, respectively. NDVI data for the study area were obtained in the ENVI software using the band calculation or NDVI calculation module.

2.2.1. The Fractional Vegetation Cover

The FVC is usually defined as the ratio of the vertical projection area of plants in a certain territory to the area of that territory, and is an indicator of the occupation of vegetation area or the richness of vegetation resources and the degree of greening achieved in an area. Among the methods for estimating surface vegetation cover based on remote sensing technology, the image dichotomy method is a common method [29].
The image element dichotomous model assumes that the image element consists of only two components: the vegetated ground surface and the unvegetated ground surface. The spectral information obtained is linearly synthesized from these two component factors, and the proportion of their respective areas in the image element is the weight of each factor, where the percentage of the vegetated surface in the image element is the weight of each factor, and where the percentage of the vegetated surface in the image element is the vegetation cover of the image element. This model can be used to estimate the grass cover. The expression for vegetation cover is:
F V C = N D V I N D V I S O I L N D V I V E G N D V I S O I L
where FVC is the fractional vegetation cover, NDVISOIL is the minimum NDVI value among all image elements of the image, i.e., the NDVI value of bare soil, and NDVIVEG is the maximum NDVI value among all image elements, i.e., the NDVI value of the pure vegetation image elements.
Referring to a study by Wu et al. [30], the value of 0.5% cumulative frequency of NDVI was taken as the reference value of NDVISOIL, and the value of 99.5% cumulative frequency was taken as the reference value of NDVIVEG and brought into the equation to estimate the vegetation cover of the mining area of the Muli coalfield. The value domain interval was [0, 1], and the closer the value was to 1, the higher the vegetation cover was. Vegetation cover 0–0.2 was classified as bare soil, 0.2–0.5 was classified as a low vegetation-cover area, 0.5–0.75 was classified as a medium vegetation-cover area, and 0.75–1.0 was classified as a high vegetation-cover area.

2.2.2. Biomass Estimation

The AGB of grassland is a key indicator of the growth of grassland, used to evaluate the regenerative capacity of ecosystems, the health of grassland ecosystems and the sustainable use of grassland resources [31]. Remote sensing modeling was used to estimate the grassland biomass in the project area using the measured data from sample sites and remote sensing data obtained from the survey. Exponential, linear, logarithmic and polynomial calculation models were developed using the vegetation index NDVI with the actual measured data of the grassland in the Muli mine area [32,33]. The accuracy of the model estimation depends on the quality of ground sampling data. The collected data need to be checked and standardized before modeling, and the abnormal data in the sample data need to be removed according to the actual grassland characteristics to ensure the accuracy and reliability of the data. The accuracy of the AGB inversion model was verified by cross-validation method, and the validation coefficients of the model included correlation coefficient R, coefficient of determination R2, root mean square error (RMSEP), etc. Finally, the optimal and most accurate model was selected to estimate the above-ground biomass of grassland in the Muli mining area using the following equation:
y = 6015.89 x + 3934.75
where y is the AGB of the grass in kg/hm2 and x is the NDVI value corresponding to it.

2.2.3. Land Surface Phenology Estimation

Land surface phenology (LSP) is the study of seasonal patterns in plant phenophases based on time series from vegetation indices (VI) or biophysical variables derived from satellite data [34]. It has played an essential role in monitoring the response of terrestrial ecosystems to environmental changes and has been used on local to global scales [35]. In order to comprehensively estimate the interannual variability of grassland phenology within the mine area since ecological restoration, a phenology inversion method based on remote sensing data was used [36]. Since the growth cycle of grassland plants in the mine area is generally short, the temporal resolution of remote sensing images should have a significant impact on the theoretical accuracy of the inversion, therefore, the 250 m resolution, daily averaged MODIS/MOD09GQ ground reflectance products were used as the main data in this study [37]. The NDVI for the period 2014–2021 was first calculated. The NDVI time series were smoothed and fit based on a logistic regression model using an annual unit [38,39]. Finally, the curvature rate of change method was used to determine the start of the growing season (SOG), the end of the growing season (EOG) and the length of the growing season (LOG) for each image element. The variation patterns of these parameters were evaluated using a linear regression model.

2.2.4. Methodology for Trend Change Analysis

One-dimensional linear regression analysis modelled trends in the maximum vegetation cover for each year from 2000 to 2021 on a per image element basis, calculated as
θ s l o p e = n × i = 1 n i × C i i = 1 n i i = 1 n C i n × i = 1 n i 2 ( i = 1 n i )
where θslope is the trend slope, n is the number of years in the monitoring time period and Ci is the annual maximum vegetation cover in year i. A negative slope indicates a decrease in FVC, while the opposite indicates an increase in FVC.

3. Results

3.1. Change in Coverage

Since 2003, a number of enterprises had gradually exploited mineral resources in a large area in the Muli coalfield, and in 2010, the Qinghai provincial government responded to the national policy to comprehensively regulate and rectify the Muli coalfield. A comparative analysis of the change in coverage from 2000 to 2021 is presented in Figure 2 which shows the change in FVC of the Muli region.
Figure 2 shows the change in land cover every two to three years from 2000 to 2021, and the analysis examines the change in FVC classes in the region over 20 years. The percentages of vegetation cover area for each class are shown in Table 2. From Figure 2 and Table 1, it can be seen that from 2000 to 2006, the bare soil area increased, the percentage of medium vegetation-cover area decreased, and the bare soil around the mine area was more obvious; from 2006 to 2009, the bare soil area decreased slightly and the high vegetation-cover area decreased; from 2009 to 2016, the bare soil and low vegetation-cover area increased sharply, with bare soil area increasing by 1.5 percentage points, the low vegetation-cover area increasing by 2.9 percentage points, and high vegetation-cover area clearly trending downward, decreasing by 7.1 percentage points; from 2016 to 2021, the bare soil area decreased significantly, while planted cover and high vegetation cover trended upward.
Overall, the area of bare soil and low vegetation cover before 2016 is on the rise, and the area of medium to high vegetation cover continues to decline. The situation changes by 2021, the mine area shows a more obvious effect from the implementation of vegetation restoration after 2020, and the ecological environment of the Muli region has improved.
As can be seen in Figure 3, the decline in FVC is more pronounced close to the mine site. Since 2003, mining has led to significant degradation of the vegetation area. The areas of declining and rising vegetation cover trends are comparable throughout the study area, with slightly more declining trends. The red areas should focus on vegetation growth in the context of field conditions. According to Table 2, the grassland area changed significantly between about 2009 and 2016, with a sharp increase in mining damage. Therefore, further analysis of land cover trends from 2009 to 2016 (Figure 4), compared to Figure 3, shows a significant increase in the slope of FVC change, with a larger area of red areas with a decline of −0.019–−0.004, which is consistent with the change in FVC as reflected in Table 2.

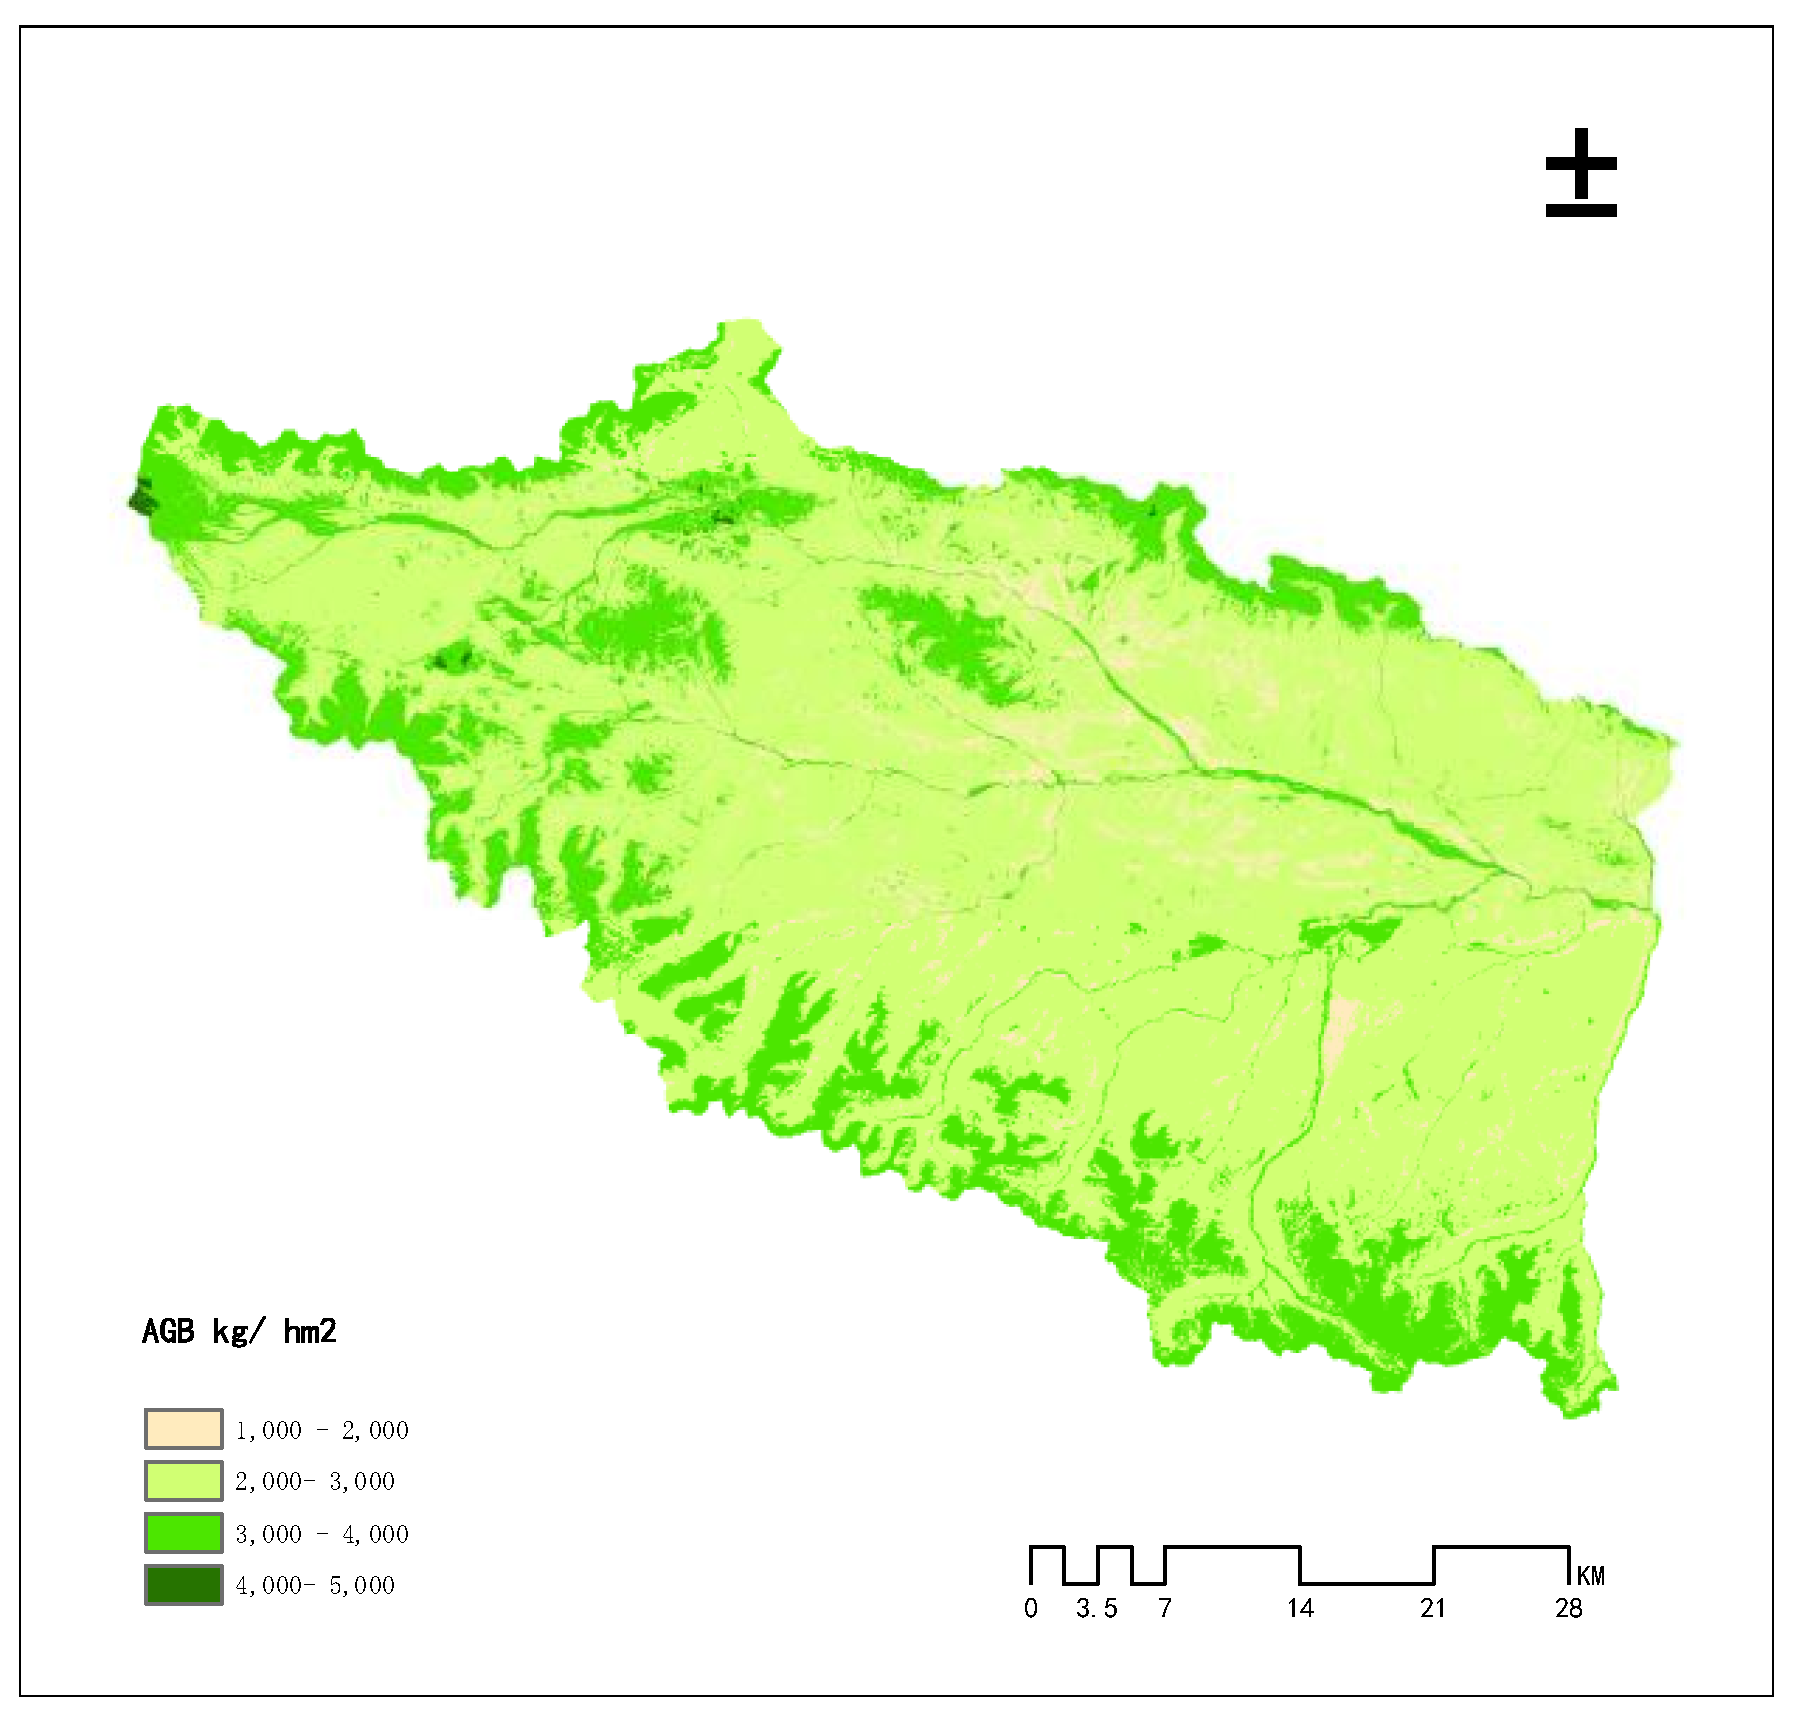
3.2. Changes in Biomass

In this study, based on the ground-measured data and Landsat data in 2021, various statistical models (exponential, linear, logarithmic, polynomial, etc.) were selected for the integration of the vegetation index NDVI with the ground-measured grassland, and the accuracy of the above-ground biomass inversion model was verified by cross-validation methods. The verification coefficients included correlation coefficient, coefficient of determination, root mean square error, etc. Finally, the optimal exact model was selected to calculate the above-ground biomass of the grassland in the Muli region. The annual mean change of above-ground biomass of the grassland in the Muli region of Qinghai province from 2000–2021 is shown in Figure 5.
The scatter plot (Figure 5) shows a slow trend in the annual mean above-ground biomass of the Murray mine site, with an overall increase and then decrease from 2000 to 2010, with a slight ebb and flow after 2010 and an overall slow decrease. Between 2000 and 2005, biomass decreased and then increased, with an increase from 2019 to 2020.
The growing season average precipitation and temperature data for Tianjun County from 2005 to 2021 were plotted. According to information from meteorological stations, the trend of biomass change (Figure 5) is similar to the trend of precipitation (blue curve) and does not match or even oppose the trend of temperature change (red curve.) From 2010 to 2012, biomass increased with higher rainfall and decreased with lower rainfall after 2020.
The spatial pattern of above-ground biomass of grassland in the Muli region is shown in Figure 6, with the highest fresh grass yield of 4494 kg/hm2 and the lowest of 1240 kg/hm2. A total of 73.9% of the grassland area was within 2000–3000 kg/hm2, which was the highest yield range in the area. Grassland with fresh grass yield in the range of 3000– 4000 kg/hm2 accounted for 23.2% of the area, and grassland with fresh grass yield in the range of 1000–2000 kg/hm2 accounted for 2.8% of the area. Grassland with fresh grass yield in the range of 4000–5000 kg/hm2 accounted for only 0.01% of the area. As can be seen from Figure 7, biomass increased significantly around the mine area between 2000 and 2021, while biomass generally decreased in other areas.

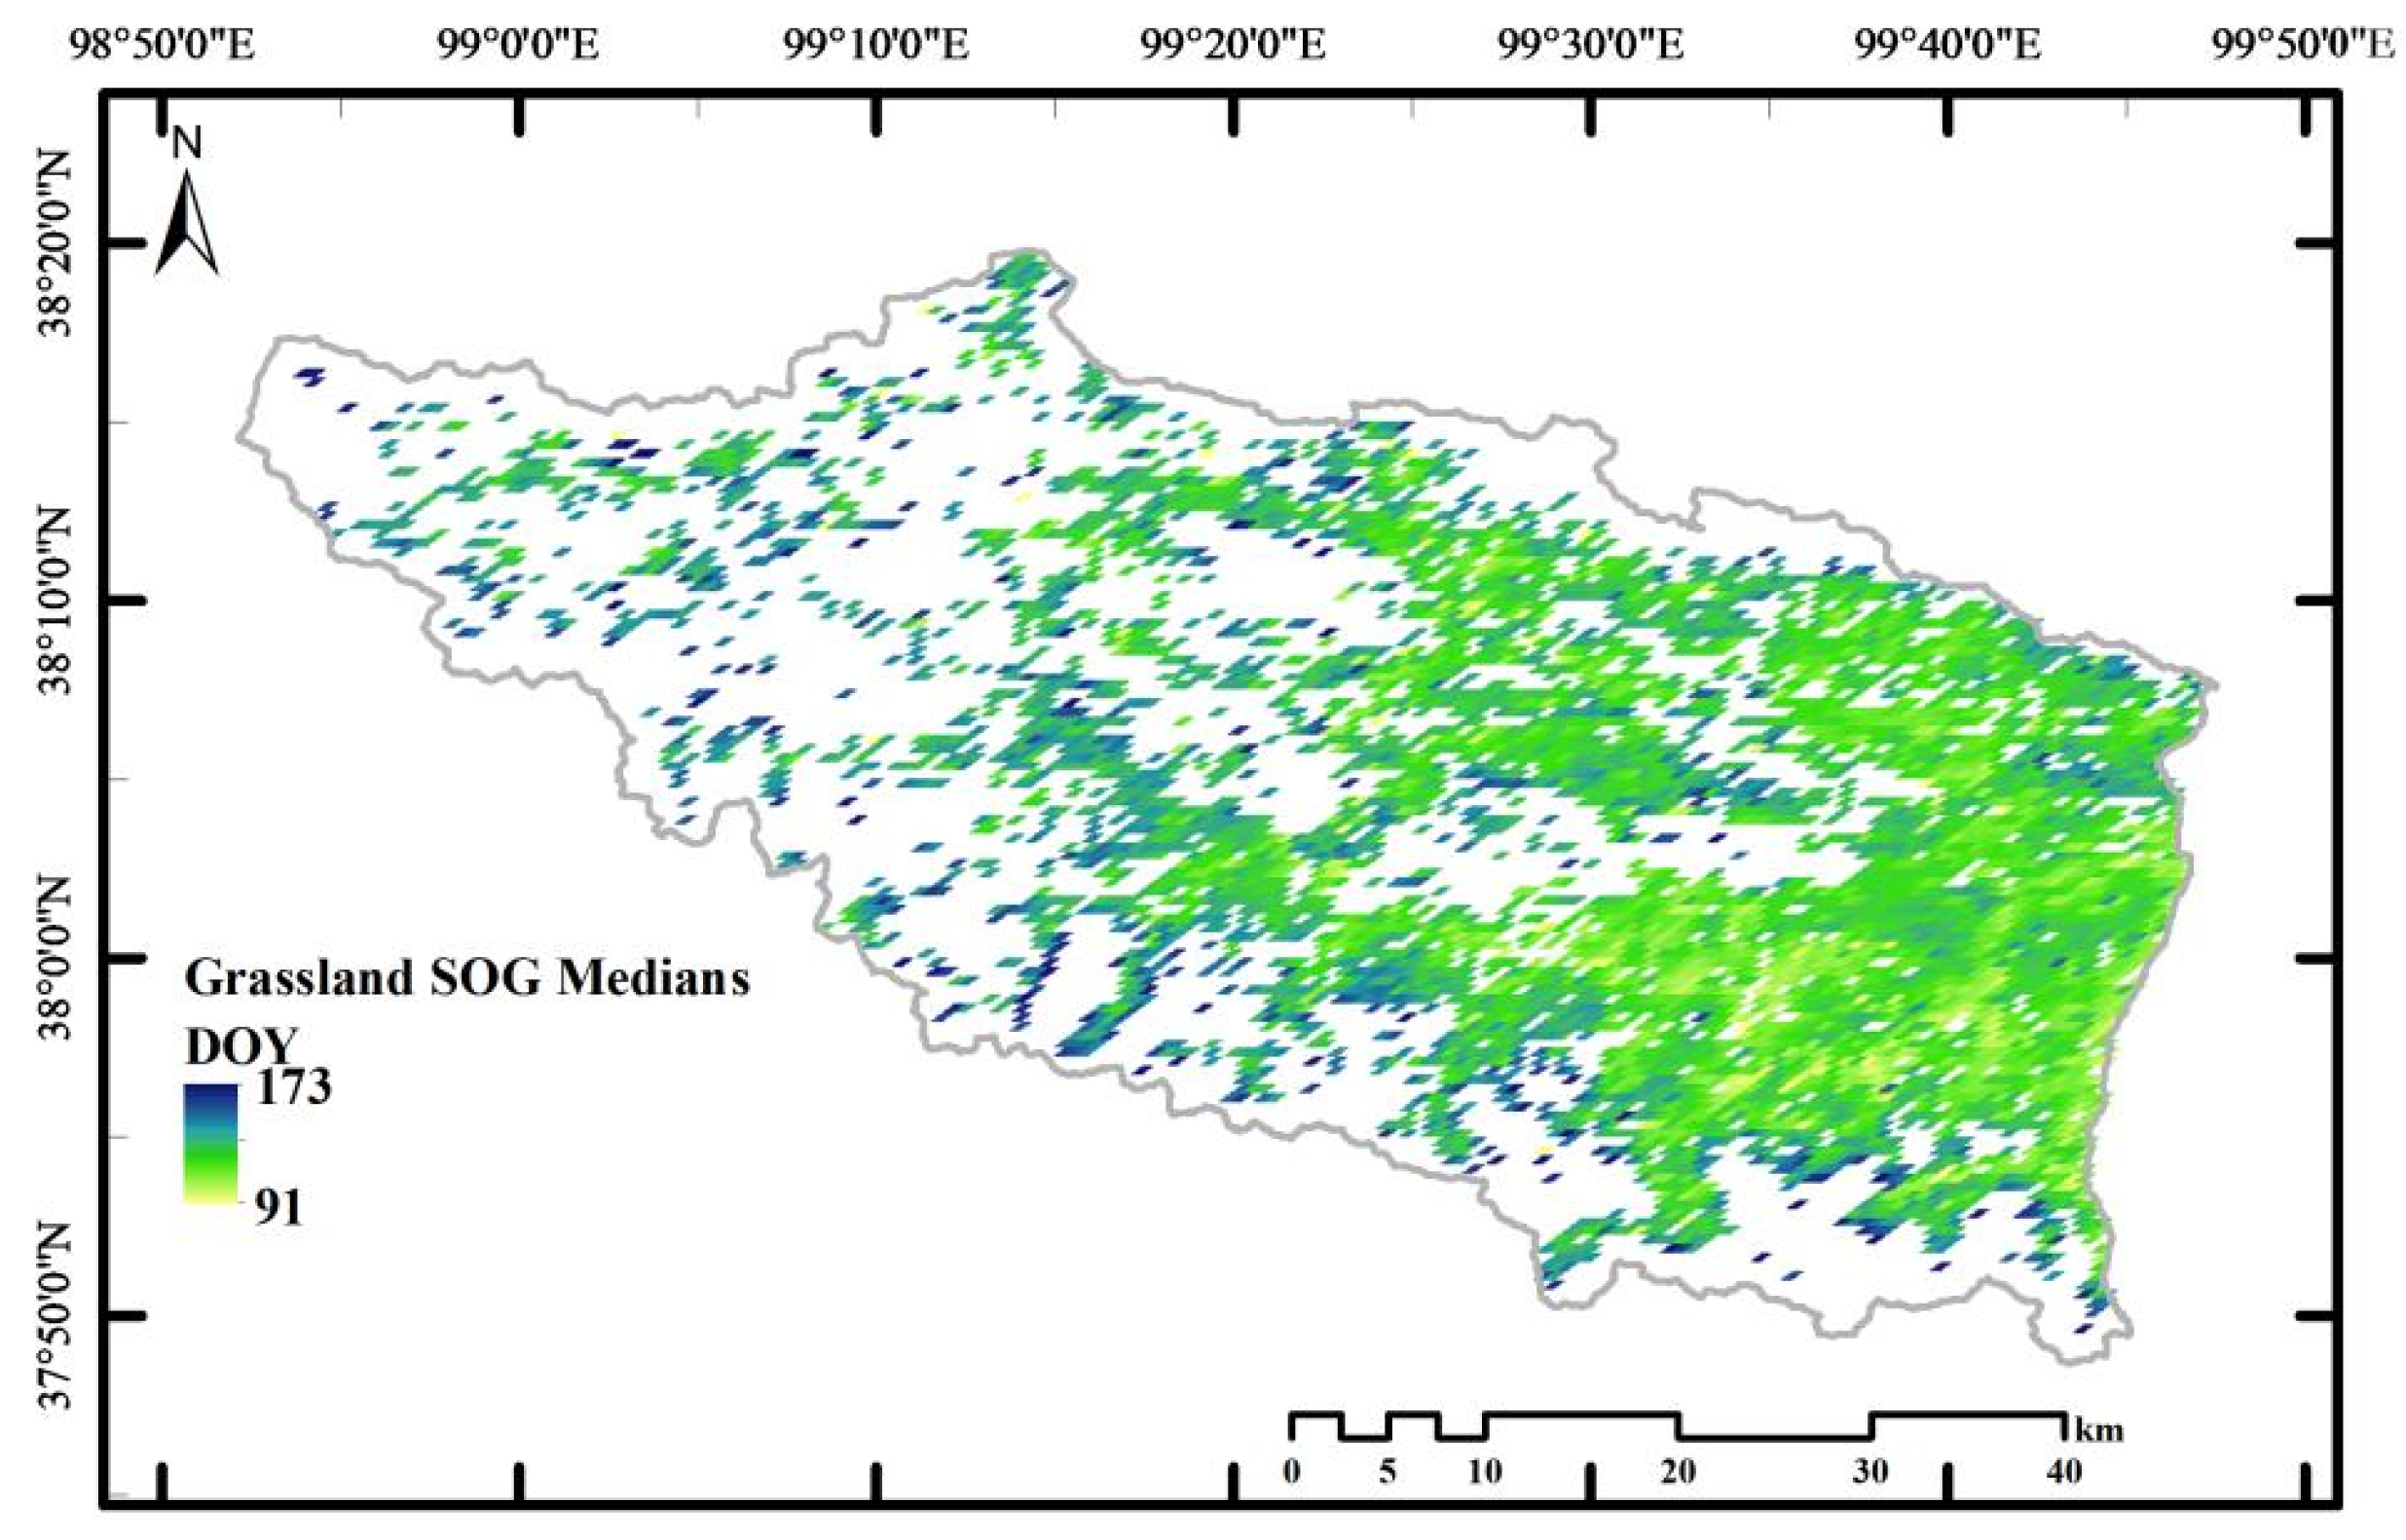
3.3. Phenology Changes

Figure 8 shows the spatial distribution of mean SOG (expressed as daily ordinate DOY) in the Muli region from 2014 to 2021 and the annual SOG change rate in the Murray mine area from 2014 to 2021. The figure shows that about 60% of the grassland SOG occurred in April and May (91–148 DOY), and about 40% of the grassland vegetation only started to grow in June. In terms of spatial distribution, the SOG was generally earlier in the southeast region than in the west and northwest. As shown in Figure 9, 75.5% of the regional vegetation showed an early start to the growth cycle, with large spatial variability in the rate of change of advancement, with most of the regions’ rate of change lying between 0 and 10 days/year.
Figure 10 shows a plot of the mean vegetation EOG (expressed as daily ordinate DOY) from 2014 to 2021 in the Muli region, and Figure 11 shows the annual rate of change in vegetation EOG from 2014 to 2021 for the Murray Mine. Approximately 20% of the vegetation growth cycle on the mine site ended before mid-October (< 279 DOY), with the earliest even ending growth in mid-July. Most grassland vegetation ends its growth activity in mid to late October (280 < EOG < 294). In terms of spatial distribution, grassland vegetation that ended growth later was scattered and concentrated on the southeastern side of the mine. The annual rate of change shows that 73.7% of the grassland area vegetation had a trend of delayed EOG, with interannual rates of change concentrated between −10–5 days/year.
Figure 12 shows the distribution of mean LOG values from 2014 to 2021 for the Muli region, and Figure 13 shows the annual rate of change of LOG from 2014 to 2021 for the Muli region. The mean vegetation LOG values in the study area ranged from 71–161 days, with longer grass growth cycles in the east and south. Comparing the trends in SOG and EOG, it is clear that most (~80%) of the grassland vegetation within the mine area has become longer in LOG as a result of the overall trend of delayed EOG and earlier SOG. The lengthening rates were concentrated between 0–10 days/year.

4. Discussion

In this paper, a long time series of remote sensing monitoring of grass cover, biomass and phenological parameters was analyzed to investigate the ecological changes in the grass since the mining and remediation of the Muli region in Qinghai Province. Using the advantages of easy access to remote sensing data, short time period and low labor cost, remote sensing images of grassland from 2000 to 2021 were obtained by using the image dichotomy method, establishing regression models and the curvature rate of change method. Annual, average rate of change maps were obtained using slope analysis [40,41]. For the data processing, the workload of downloading and processing the remote sensing data for the long time series was large, therefore, programming batch processing saved time and greatly improved the processing efficiency.
In modeling above-ground biomass estimation in grasslands, using Landsat’s NDVI products with ground monitoring data to construct biomass estimation models can reasonably invert surface vegetation conditions to some extent [42], however, increasing the area and number of stations is required to improve the accuracy and reliability of the estimation results [43].
Except for a more pronounced decline in biomass from 2009 to 2016, the overall declining trend is slow, which is related to the longer growing period of the grassland. Studies globally have shown that temperature and growing period are significantly, positively correlated [44]. The main environmental impacts caused by mining are changes in soil stratification, reduction in biodiversity and changes in ecosystem structure and function [45]. Such impacts are not significant in the results of this study. In order to distinguish the role of anthropogenic and natural factors on grassland ecosystems, meteorological factors, elevation, slope and population density should also be taken into account for a comprehensive analysis of the dominant factors [46]. Therefore, the changes in grassland cover and biomass due to mining in Qinghai are not comprehensive or rigorous.

5. Conclusions

The long-term growth of grassland in the Muli region and the restoration of the mine vegetation were monitored comprehensively by remote sensing monitoring and other technical means. The ecological damage caused by mining production and exploitation in the Muli region in Qinghai Province from 2000 to 2021 resulted in a slow decline in the overall above-ground biomass of the grassland, which rebounded in 2021 after the ecological restoration work was carried out. The analysis of meteorological data indicated that biomass in the Muli region was more influenced by precipitation and less by temperature. The land cover of the Muli region declined significantly from 2009 to 2016. Combined with the timing of mining, the production activities in the mine area from 2009 to 2016 caused particularly serious damage to grassland vegetation, with a sharp increase in the area of bare soil and low vegetation cover, and a clear, decreasing trend in the area of high-vegetation cover. The grassland in and around the mine area showed complex dynamic changes in characteristics from 2000 to 2021, and the impact of anthropogenic disturbances on ecological indicators such as cover, and biomass cannot be ignored. In conclusion, FVC is an important indicator of ecological degradation or restoration in mining areas and can effectively assess the condition and quality of ecological environment in the region. The soil in the open pit mine has a low ability to retain water and soil and lacks microorganisms and organic matter, which is not conducive to plant growth. Furthermore, AGB is also an effective factor for assessing the restoration status of a mine [47]. LSP has a more complex response relationship to the mine compared with the above two indicators, and it is difficult to obtain the impact of the mine on the ecology of grassland directly.
On the basis of the first results of ecological restoration measures, if subsequent ecological restoration measures are optimized and supervision is increased, it is expected that the ecological environment and ecological functions of the mine area will be restored and that the vulnerability of the ecological environment of the Muli region will be reduced.

Author Contributions

Conceptualization, L.J. and T.C.; methodology, L.J.; software, L.J.; validation, L.J., T.C., Y.X. and H.L.; formal analysis, L.J. and Y.X.; investigation, L.J. and T.C.; resources, H.L.; data curation, L.J.; writing—original draft preparation, L.J.; writing—review and editing, L.J and Y.X.; visualization, L.J.; supervision, T.C.; project administration, H.L.; funding acquisition, Y.X. All authors have read and agreed to the published version of the manuscript.

Funding

This work was supported in part by the National Natural Science Foundation of China (NSFC) under Grant 41871260.

Institutional Review Board Statement

Not applicable.

Informed Consent Statement

Not applicable.

Data Availability Statement

Not applicable.

Conflicts of Interest

The authors declare no conflict of interest.

References

  1. Qian, D.; Yan, C.; Xing, Z.; Xiu, L. Monitoring coal mine changes and their impact on landscape patterns in an alpine region: A case study of the muli coal mine in the Qinghai-Tibet plateau. Environ. Monit. Assess. 2017, 189, 559. [Google Scholar] [CrossRef]
  2. Meng, B.; Gao, J.; Liang, T.; Cui, X.; Ge, J.; Yin, J.; Feng, Q.; Xie, H. Modeling of alpine grassland cover based on unmanned aerial vehicle technology and multi-factor methods: A case study in the east of Tibetan plateau, China. Remote Sens. 2018, 10, 320. [Google Scholar] [CrossRef] [Green Version]
  3. Cui, B.-L.; Li, X.-Y. Characteristics of stable isotopes and hydrochemistry of river water in the qinghai lake basin, northeast Qinghai-Tibet plateau, China. Environ. Earch Sci. 2015, 73, 4251–4263. [Google Scholar] [CrossRef]
  4. Li, S.; Xia, X.; Zhou, B.; Zhang, S.; Zhang, L.; Mou, X. Chemical balance of the yellow river source region, the northeastern Qinghai-Tibetan plateau: Insights about critical zone reactivity. Appl. Geochem. 2018, 90, 1–12. [Google Scholar] [CrossRef]
  5. Yuan, D.; Hu, Z.; Yang, K.; Guo, J.; Li, P.; Li, G.; Fu, Y. Assessment of the ecological impacts of coal mining and restoration in alpine areas: A case study of the muli coalfield on the Qinghai-Tibet plateau. IEEE ACCESS 2021, 9, 162919–162934. [Google Scholar] [CrossRef]
  6. Ge, J.; Meng, B.; Liang, T.; Feng, Q.; Gao, J.; Yang, S.; Huang, X.; Xie, H. Modeling alpine grassland cover based on modis data and support vector machine regression in the headwater region of the Huanghe river, China. Remote Sens. Environ. 2018, 218, 162–173. [Google Scholar] [CrossRef]
  7. Wang, Z.X.; Li, X.Q.; Hou, X.W. Hydrogeochemistry of river water in the upper reaches of the datong river basin, china: Implications of anthropogenic inputs and chemical weathering. Acta Geol. Sin. 2021, 95, 962–975. [Google Scholar] [CrossRef]
  8. Wang, H.W.; Qi, Y.; Zhang, J.; Zhang, J.L.; Yang, R.; Guo, J.Y.; Luo, D.L.; Wu, J.C.; Zhou, S.M. Influence of open-pit coal mining on ground surface deformation of permafrost in the muli region in the Qinghai-Tibet plateau, China. Remote Sens. 2022, 14, 2352. [Google Scholar] [CrossRef]
  9. Yang, Y.; Tang, J.; Zhang, Y.; Zhang, S.; Zhou, Y.; Hou, H.; Liu, R. Reforestation improves vegetation coverage and biomass, but not spatial structure, on semi-arid mine dumps. Ecol. Eng. 2022, 175, 106508. [Google Scholar] [CrossRef]
  10. Ma, A.; Liu, B.; Destech Publicat, I. Estimation of forest above-ground biomass using spot-5 image in mountain areas. In Proceedings of the 4th International Conference on Energy and Environmental Protection (ICEEP 2015), Shenzhen, China, 2–4 June 2015. [Google Scholar]
  11. Xie, Y.; Sha, Z.; Yu, M.; Bai, Y.; Zhang, L. A comparison of two models with landsat data for estimating above ground grassland biomass in Inner Mongolia, China. Ecol. Model. 2009, 220, 1810–1818. [Google Scholar] [CrossRef]
  12. Eisfelder, C.; Kuenzer, C.; Dech, S. Derivation of biomass information for semi-arid areas using remote-sensing data. Int. J. Remote Sens. 2012, 33, 2937–2984. [Google Scholar] [CrossRef]
  13. Weisbin, C.R.; Lincoln, W.; Saatchi, S. A systems engineering approach to estimating uncertainty in above-ground biomass (agb) derived from remote-sensing data. Syst. Eng. 2014, 17, 361–373. [Google Scholar] [CrossRef]
  14. Lu, D.; Chen, Q.; Wang, G.; Liu, L.; Li, G.; Moran, E. A survey of remote sensing-based aboveground biomass estimation methods in forest ecosystems. Int. J. Digit. Earth 2016, 9, 63–105. [Google Scholar] [CrossRef]
  15. Zhao, P.; Lu, D.; Wang, G.; Wu, C.; Huang, Y.; Yu, S. Examining Spectral Reflectance Saturation in Landsat Imagery and Corresponding Solutions to Improve Forest Aboveground Biomass Estimation. Remote Sens. 2016, 8, 469. [Google Scholar] [CrossRef] [Green Version]
  16. Ali, I.; Cawkwell, F.; Dwyer, E.; Barrett, B.; Green, S. Satellite remote sensing of grasslands: From observation to management. J. Plant Ecol. 2016, 9, 649–671. [Google Scholar] [CrossRef] [Green Version]
  17. Gitelson, A.A.; Kaufman, Y.J.; Stark, R.; Rundquist, D. Novel algorithms for remote estimation of vegetation fraction. Remote Sens. Environ. 2002, 80, 76–87. [Google Scholar] [CrossRef] [Green Version]
  18. Li, F.; Chen, W.; Zeng, Y.; Zhao, Q.; Wu, B. Improving estimates of grassland fractional vegetation cover based on a pixel dichotomy model: A case study in Inner Mongolia, China. Remote Sens. 2014, 6, 4705. [Google Scholar] [CrossRef] [Green Version]
  19. Yue, J.; Guo, W.; Yang, G.; Zhou, C.; Feng, H.; Qiao, H. Method for accurate multi-growth-stage estimation of fractional vegetation cover using unmanned aerial vehicle remote sensing. Plant Methods 2021, 17, 51. [Google Scholar] [CrossRef]
  20. Rihan, W.; Zhao, J.; Zhang, H.; Guo, X. Preseason drought controls on patterns of spring phenology in grasslands of the Mongolian plateau. Sci. Total Environ. 2022, 838, 156018. [Google Scholar] [CrossRef]
  21. Zhang, X.Y.; Friedl, M.A.; Schaaf, C.B.; Strahler, A.H.; Hodges, J.C.F.; Gao, F.; Reed, B.C.; Huete, A. Monitoring vegetation phenology using modis. Remote Sens. Environ. 2003, 84, 471–475. [Google Scholar] [CrossRef]
  22. Dronova, I.; Taddeo, S. Remote sensing of phenology: Towards the comprehensive indicators of plant community dynamics from species to regional scales. J. Ecol. 2022, 110, 1460–1484. [Google Scholar] [CrossRef]
  23. Bao, N.; Li, W.; Gu, X.; Liu, Y. Biomass estimation for semiarid vegetation and mine rehabilitation using worldview-3 and sentinel-1 sar imagery. Remote Sens. 2019, 11, 2855. [Google Scholar] [CrossRef] [Green Version]
  24. Wu, Z.; Lei, S.; Lu, Q.; Bian, Z. Impacts of large-scale open-pit coal base on the landscape ecological health of semi-arid grasslands. Remote Sens. 2019, 11, 1820. [Google Scholar] [CrossRef] [Green Version]
  25. Wang, Y.; Fang, S.; Zhao, L.; Huang, X.; Jiang, X. Parcel-based summer maize mapping and phenology estimation combined using sentinel-2 and time series sentinel-1 data. Int. J. Appl. Earth Obs. 2022, 108, 102720. [Google Scholar] [CrossRef]
  26. Cao, W.; Sheng, Y.; Qin, Y.; Li, J.; Wu, J. Grey relation projection model for evaluating permafrost environment in the muli coal mining area, China. Int. J. Min. Reclam. Environ. 2010, 24, 363–374. [Google Scholar] [CrossRef]
  27. Wu, D.; Wu, H.; Zhao, X.; Zhou, T.; Tang, B.; Zhao, W.; Jia, K. Evaluation of spatiotemporal variations of global fractional vegetation cover based on gimms ndvi data from 1982 to 2011. Remote Sens. 2014, 6, 4217–4239. [Google Scholar] [CrossRef] [Green Version]
  28. Peterson, D.L.; Aber, J.D.; Matson, P.A.; Card, D.H.; Swanberg, N.; Wessman, C.; Spanner, M. Remote sensing of forest canopy and leaf biochemical contents. Remote Sens. Environ. 1988, 24, 85–108. [Google Scholar] [CrossRef]
  29. Gao, L.; Wang, X.; Johnson, B.A.; Tian, Q.; Wang, Y.; Verrelst, J.; Mu, X.; Gu, X. Remote sensing algorithms for estimation of fractional vegetation cover using pure vegetation index values: A review. ISPRS J. Photogramm. 2020, 159, 364–377. [Google Scholar] [CrossRef]
  30. Wu, C.Q.; Zhang, X.B.; Wang, Y.; Li, R.Z. Analysis of Vegetation Coverage Extraction and Time-space Change in Muli Coalfield Based on Landsat Image. Geomat. Spat. Inf. Technol. 2020, 43, 67–72. [Google Scholar] [CrossRef]
  31. Fremout, T.; Cobian-De Vinatea, J.; Thomas, E.; Huaman-Zambrano, W.; Salazar-Villegas, M.; Limache-De La Fuente, D.; Bernardino, P.N.; Atkinson, R.; Csaplovics, E.; Muys, B. Site-specific scaling of remote sensing-based estimates of woody cover and aboveground biomass for mapping long-term tropical dry forest degradation status. Remote Sens. Environ. 2022, 276, 113040. [Google Scholar] [CrossRef]
  32. Song, W.; Mu, X.; Ruan, G.; Gao, Z.; Li, L.; Yan, G. Estimating fractional vegetation cover and the vegetation index of bare soil and highly dense vegetation with a physically based method. Int. J. Appl. Earth Obs. 2017, 58, 168–176. [Google Scholar] [CrossRef]
  33. Han, X.; Han, L. Estimating fractional vegetation cover of oasis in tarim basin, china, using dimidiate fractional cover model. In Proceedings of the International Conference on Intelligent Earth Observing and Applications, Guilin, China, 23–24 October 2015; Volume 9808. [Google Scholar] [CrossRef]
  34. Caparros-Santiago, J.A.; Rodriguez-Galiano, V.; Dash, J. Land surface phenology as indicator of global terrestrial ecosystem dynamics: A systematic review. ISPRS J. Photogramm. 2021, 171, 330–347. [Google Scholar] [CrossRef]
  35. Liu, F.; Wang, C.K.; Wang, X.C. application of near-surface remote sensing in monitoring the dynamics of forest canopy phenology. Ying Yong Sheng Tai Xue Bao J. Appl. Ecol. 2018, 29, 1768–1778. [Google Scholar] [CrossRef]
  36. Gonsamo, A.; Chen, J.M.; Wu, C.; Dragoni, D. Predicting deciduous forest carbon uptake phenology by upscaling fluxnet measurements using remote sensing data. Agric. For. Meteorol. 2012, 165, 127–135. [Google Scholar] [CrossRef]
  37. Hill, A.C.; Vazquez-Lule, A.; Vargas, R. Linking vegetation spectral reflectance with ecosystem carbon phenology in a temperate salt marsh. Agric. For. Meteorol. 2021, 307, 108481. [Google Scholar] [CrossRef]
  38. Deng, L.; Chen, Y.; Zhao, Y.; Zhu, L.; Gong, H.-L.; Guo, L.-J.; Zou, H.-Y. An approach for reflectance anisotropy retrieval from uav-based oblique photogrammetry hyperspectral imagery. Int. J. Appl. Earth Obs. 2021, 102, 102442. [Google Scholar] [CrossRef]
  39. Gumma, M.K.; Thenkabail, P.S.; Nelson, A. Mapping irrigated areas using modis 250 m time-series data: A study on Krishna river basin (India). Water 2011, 3, 113–131. [Google Scholar] [CrossRef] [Green Version]
  40. Yan, K.; Gao, S.; Chi, H.; Qi, J.; Song, W.; Tong, Y.; Mu, X.; Yan, G. Evaluation of the vegetation-index-based dimidiate pixel model for fractional vegetation cover estimation. IEEE Trans. Geosci. Remote Sens. 2022, 60. [Google Scholar] [CrossRef]
  41. Li, Y.; Zhang, X.; Cao, Z.; Liu, Z.; Lu, Z.; Liu, Y. Towards the progress of ecological restoration and economic development in China’s loess plateau and strategy for more sustainable development. Sci. Total Environ. 2021, 756. [Google Scholar] [CrossRef]
  42. Olofsson, P.; Foody, G.M.; Herold, M.; Stehman, S.V.; Woodcock, C.E.; Wulder, M.A. Good practices for estimating area and assessing accuracy of land change. Remote Sens. Environ. 2014, 148, 42–57. [Google Scholar] [CrossRef]
  43. Kong, B.; Yu, H.; Du, R.; Wang, Q. Quantitative estimation of biomass of alpine grasslands using hyperspectral remote sensing. Rangel. Ecol. Manag. 2019, 72, 336–346. [Google Scholar] [CrossRef]
  44. Kang, X.; Hao, Y.; Cui, X.; Chen, H.; Huang, S.; Du, Y.; Li, W.; Kardol, P.; Xiao, X.; Cui, L. Variability and changes in climate, phenology, and gross primary production of an alpine wetland ecosystem. Remote Sens. 2016, 8, 391. [Google Scholar] [CrossRef] [Green Version]
  45. Chen, L.; Zhang, H.; Zhang, X.; Liu, P.; Zhang, W.; Ma, X. Vegetation changes in coal mining areas: Naturally or anthropogenically driven? Catena 2022, 208, 105712. [Google Scholar] [CrossRef]
  46. Tripathi, N.; Singh, R.S.; Hills, C.D. Soil carbon development in rejuvenated indian coal mine spoil. Ecol. Eng. 2016, 90, 482–490. [Google Scholar] [CrossRef]
  47. Karan, S.K.; Samadder, S.R.; Maiti, S.K. Assessment of the capability of remote sensing and gis techniques for monitoring reclamation success in coal mine degraded lands. J. Environ. Manag. 2016, 182, 272–283. [Google Scholar] [CrossRef] [PubMed]
Figure 1. Digital elevation model (DEM) image map of the Muli region.
Land 11 01733 g001
Figure 2. Changes in the coverage of the Muli region between 2000 and 2021.
Land 11 01733 g002
Figure 3. Slope of FVC in the Muli region from 2000–2021.
Land 11 01733 g003
Figure 4. Slope of FVC in the Muli region from 2010–2016.
Land 11 01733 g004
Figure 5. 2000–2021 Annual average scatter diagram of AGB in the Muli region.
Land 11 01733 g005
Figure 6. Average value of AGB in grassland in the Muli region from 2000 to 2021.
Land 11 01733 g006
Figure 7. Trends in AGB in the Muli region from 2000 to 2021.
Land 11 01733 g007
Figure 8. SOG average in the Muli region from 2014 to 2021.
Land 11 01733 g008
Figure 9. (a) SOG annual rate of change; (b) change rates of grassland SOG in the Muli region from 2014 to 2021.
Land 11 01733 g009
Figure 10. EOG average in the Muli region from 2014 to 2021.
Land 11 01733 g010
Figure 11. (a) EOG annual rate of change; (b) change rates of grassland EOG in the Muli region from 2014 to 2021.
Land 11 01733 g011
Figure 12. LOG average in the Muli region from 2014 to 2021.
Land 11 01733 g012
Figure 13. (a) LOG annual rate of change; (b) change rates of grassland LOG in the Muli region from 2014 to 2021.
Land 11 01733 g013
Table 1. Information on the data used in the study.
Data TypeTime of DataWavelengths Used
Landat5-TM2000–2012 (July–September)B3: 0.630–0.690 μm
B4: 0.760–0.900 μm
Landsat 7-ETM+2013 (July–September)B3: 0.630–0.690 μm
B4: 0.775–0.900 μm
Landsat8-OLI2014–2021 (July
–September)
B4: 0.630–0.680 μm
B5: 0.845–0.885 μm
MOD09GQ2014–2021B4: 0.620–0.670 μm
B5: 0.841–0.876 μm
Data typeDataSources
Meteorological DataPrecipitation from 2005–2021https://rp5.ru/
(accessed on 3 July 2022)
Meteorological DataTemperature from 2005–2021https://rp5.ru/
(accessed on 3 July 2022)
Table 2. Percentage area statistics of vegetation cover at all levels from 2000 to 2021.
YearBare SoilLow Vegetation CoverageMedium Vegetation CoverageHigh Vegetation Coverage
20000.1690.1280.2050.498
20060.1750.1270.1750.522
20090.1560.1300.2710.443
20160.1710.1590.2990.372
20210.0900.1490.3020.398
Publisher’s Note: MDPI stays neutral with regard to jurisdictional claims in published maps and institutional affiliations.

