1. Introduction
In the process of global rapid urbanization, many cities still have the problem of urban traffic congestion and land shortage, and the TOD model can coordinate land use planning and urban transportation planning to solve this contradiction. The Transit-Oriented-Development (TOD) model is a land development model based on the interrelationship between urban rail transit and land development, and the mixed space of office, commercial, culture, education, and residential within 400–800 m around the station.
Urban rail transit plays a very critical role in adjusting urban spatial layout, reducing traffic congestion, and accelerating economic development. It has the advantages of high capacity, high speed, and time saving, which makes the intensive use of land resources more efficient while enhancing accessibility. Its high accessibility is mainly reflected in reducing the transportation cost and travel time of residents, reducing urban traffic congestion, and promoting the development and utilization of land around the stations, changing the trend of increasing land value along the rail transit line.
China’s urban rail transit construction has progressed over these years, and according to the China Urban Rail Transit Association, by the end of 2019, China opened 208 operational lines with a line length of 6730.27 km, and as many as 47 cities in China had opened rail transits by 1 May 2020. Despite the rapid development of urban rail transit construction in China and the gradual increase of line network density, among which Shanghai has a rail transit line density greater than 0.7 km/km2 and Beijing is close to 0.6 km/km2, the density of urban rail transit line network in China is still at a relatively low level compared with international cities such as New York (1.26 km/km2), Berlin (1.06 km/km2), and Tokyo (0.96 km/km2).
Domestic and foreign scholars have always paid close attention to the impact of rail transit on urban planning and intensive land use, not only qualitatively analyzing the impact of rail transit on land use, but also quantitatively analyzing the scope and intensity of the impact of rail transit on residential prices using classical econometric models.
Ratner and Goetz (2013) and Calvo et al. (2013) show that the construction of rail transit enhances land use intensity around stations [
1,
2], and Yang et al. (2020) and Liu et al. (2020) demonstrate that the accessibility of rail transit stations promotes residential price appreciation [
3,
4]. Most of the existing studies focus on the impact of rail transit on the intensity of land development around stations, but there is a lack of research on the externalities of the TOD model on residential prices, which fails to explore the relationship between the TOD model and urban residential price patterns, and how rail transit affects the spatial differentiation of residential prices.
Xu and Zhang (2016), Sharma and Newman (2018), and Yang et al. (2020) show that the impact of rail transit on residential prices usually ranges from 0.5 km to 2 km [
3,
5,
6]. Mathur and Ferrell (2013), Seo et al. (2014) and Wang et al. (2019) generally use the hedonic price model to study the impact of rail transit on residential prices around stations [
7,
8,
9], while the SEM model (Ibeas et al., 2012), MNL model (Zhao and Shen, 2019), the DEA model (Khare et al., 2021), and the DID model (Lee, 2022) are used relatively little [
10,
11,
12,
13]. Although the hedonic price model can explain the impact of influencing factors on residential prices, it cannot well analyze the impact of the TOD model on the spatial differentiation characteristics of residential prices.
Besides, China is influenced by the traditional flat and simplistic planning and layout mindset, which makes it difficult to create a rich and active urban environment and it is prone to tidal traffic problems. Existing studies also show that the construction of rail transit in Beijing is not clearly integrated with land use, and that land use is more fragmented in the core area of the station (within 1.5 km) than in the periphery (1.5–3 km) [
14]. Moreover, the separation of work and residence in Beijing is serious, and the average daily commute time of residents is 47 min each way.
Therefore, it is necessary for this study to address the limitations of the application of the hedonic price model by exploring the spatial differentiation of rail transit on residential prices, analyzing the spatial differentiation of rail transit on residential prices, and calculating the value-added effects, taking Beijing as an example. It also needs to confirm that in the future, against the background of the continuous development of the TOD model, most cities can promote the diversified development of urban land nature by forming a small-scale road network, gradually achieve a balance between work and residence using mixed land development and reduce residents’ cross-regional travel.
The purpose of this study is to study the impact of the TOD model on the spatial differentiation of residential prices in Beijing based on the study of the TOD land development model, combined with the spatial analysis method of residential price pattern, and to verify whether the spatial effect of the impact of rail transit on residential prices in different districts in Beijing is the same, further analyze the spillover effect of rail transit on residential prices, and explore the impact of the TOD model on the distribution of urban residential patterns.
This study takes Beijing Metro Line 10 and Line 13 as examples. By collecting transaction data of residences along these two lines, using ArcGIS to establish a residential spatial database, based on semi-logarithmic characteristic price model, selecting four architectural characteristic variables (population density, community environment, community-built time, community grade), four neighborhood characteristic variables (living environment, education level, living convenience, medical convenience) and two location characteristic variables (short distance travel, long distance travel), and using SPSS to analyze the spatial effect of these two lines on residential prices, we compare the similarities and differences of the effects of price influencing factors, explore the value-added effect of rail transit on residential prices in Beijing, study how to reasonably use the external value-added benefits brought by rail transit, and provide relevant policy advice for government departments.
On the one hand, the research results reflect the influence relationship between the TOD model and urban residential price pattern, provide understanding of the degree of impact of different influencing factors on residential prices, and provide policy suggestions for strengthening the combination of the TOD model and the layout of residential land. On the other hand, it plays an important role in the development and utilization of land around rail transit stations and the preparation of land use planning and provides theoretical basis and guidance for urban spatial planning, optimization of residential pattern, evaluation of residential prices around stations, and improvement of spatial balance of jobs and residences.
The innovation of this study is that, on the one hand, it combines the TOD land development model and the quantitative analysis method of studying residential price pattern, and studies the impact of rail transit on the spatial differentiation of residential prices from two location perspectives: residential price pattern of the city and the city’s own ring division, focusing on the influence of location characteristics. On the other hand, new location characteristic variables are added at a unit distance of 200 m to verify whether the spatial effects of rail transit on residential prices in different locations are the same, to further analyze the spillover effects on residential prices around stations, to find out the most significant range of impact of rail transit on residential prices, and to explore the effects of the TOD model on the distribution of urban residential patterns.
The research limitations of this study are that, on the one hand, when building the semi-logarithmic characteristic price model, the selected characteristic variables are relatively few, especially the location characteristic variables are only two, which should be appropriately increased to perfect the model establishment. On the other hand, only the 2 km range along the rail transit line was studied, and the data of residential unit transactions were relatively small, which failed to clarify the maximum influence range of Metro Line 10 and Metro Line 13 on residential prices, and the maximum degree and intensity of the influence of rail transit on residential prices need to be further studied.
2. Literature Review
The focus of this study is the impact of rail transit on the spatial differentiation of residential prices. The studies related to this paper mainly involve the relationship between rail transit and land use, the relationship between the TOD model and residential prices, and the analysis of the factors influencing residential prices along the rail transit. Therefore, the combing of the current situation of domestic and foreign research is summarized from four aspects: the impact of rail transit on land use, the external impact of the TOD model on residential prices, the scope and degree of the impact of rail transit on residential prices, and the methods of quantitative study on the impact of rail transit on residential prices, and the results and progress of related research are the basis of this study.
2.1. Impact of TOD Model on Land Use
Domestic and foreign scholars have focused on the impact of the TOD model on urban development and its influence on land use, amongst other aspects. Although the integration of land use and transportation does not guarantee the sustainability of social development and the promotion of compact urban forms around transportation nodes does not guarantee improved station accessibility, rapidly developing cities need to consider enhanced land use and transportation integration [
15].
Firstly, the TOD model has an impact on land use efficiency.
The TOD model not only accelerates the economic development of cities, but also optimizes their spatial layout. Although institutional barriers to urban development have affected the implementation of the TOD in China, value capture can replace local governments’ urban governance model that relies on land lease revenues and better combine rail transit and land development and utilization [
16].
Secondly, the TOD model affects land use patterns.
On the one hand, the introduction of rail transit promotes the development and utilization of land around the station. Although the Sunderland area in northern England does not have favorable location economic advantages and physical conditions, its rail transit does not bring significant opportunities for land development and use [
17]. However, Denver in the United States has actively expanded its rail transit system to promote the high-density development and the multi-use development of the land in its station areas [
1].
On the other hand, the construction of rail transit also has a beneficial impact on land use and population growth around stations. Calvo et al. (2013) found that residential development intensity and population growth rates near new rail transit stations in the peripheral areas of Madrid, Spain, were greater than those in the city center and satellite cities of Madrid [
2]. Capitalization of rail transit proximity is weaker where land supply is more elastic [
18].
In addition, scholars have combined and improved the node-place model to classify the TOD types based on the relationship between rail transit stations and land use by introducing orientation dimensions and design indices.
The introduction of the orientation dimension was used to quantify the degree of mutual orientation of rail transit and urban development, and cluster analysis was used to classify TOD sites in Beijing into six types [
19]. The inclusion of the guidance feature also classified the TOD types in Shanghai into four types, and their TOD index values decreased significantly from urban centers to urban suburbs [
20].
A design index was introduced to reflect the design conditions affecting station accessibility, and in Lisbon, Portugal, the average node index for stations was higher than the location index, with a large variation in design indices [
21]. The degree of TOD impact varied by city, but the urban spatial pattern generally showed a decreasing trend from the central city to the suburbs [
22].
2.2. External Impact of TOD Model on Residential Prices
Firstly, the externalities of the TOD model are reflected in the layout of residential land use.
In 1980, Seoul proposed the “Rosario” concept of subway-oriented public transportation and high-density land use, which planned to increase housing and population density near stations to address the lack of housing and transportation connections in the city [
23]. The growth of commercial land use around rail transit in downtown Denver from 2000 to 2010 was significantly higher than away from rail transit, while residential land use did not grow significantly, but this change in land use was not necessarily related to rail transit construction and operation [
24].
Secondly, the externalities of the TOD model are reflected in the housing conditions.
The TOD model contributes to improved living standards and residential satisfaction of residents. Households in California save
$1232 per year in transportation costs by living in TOD communities [
25]. In mid-sized cities, represented by Kitchener Waterloo, Canada, 37% of young households expect to purchase a residence within 800 m of the station [
26]. Over time, TOD has changed the way Brisbane, Australia, residents are satisfied with the land use patterns in the communities where their homes are located [
27].
In addition, the externalities of the TOD model are reflected in the value-added of residential prices.
The construction of rail transit increases residential prices around stations. The accessibility and density of rail transit from southern to western Tokyo has a significant effect on residential land prices [
28]. In Calgary, Canada, proximity to light rail and better neighborhood walkability increases the value of residential properties, and when proximity to light rail and high walkability are combined, residential prices increase further [
29]. Besides, transfer stations have a greater impact on surrounding residential prices than regular stations, and the accessibility of rail transit has a greater impact on residential prices in suburban areas than in urban areas [
3].
Optimizing planning conditions enhances the premium effect of the TOD model on residential prices. The C-TOD conceptual framework is able to link corridor interactions between individual TOD nodes, combining economic, social, and environmental indicators with planning attributes to maximize station premiums and accessibility [
4]. Besides, higher residential premiums for transit proximity are more likely to occur where there is more mixed land use [
30].
2.3. Scope and Degree of the Impact of Rail Transit on Residential Prices
Firstly, the degree and scope of impact of rail transit lines on residential prices around stations varies greatly from city to city.
Debrezion et al. (2007) found that commercial prices within 1/4 mile of the subway station are 12.2% higher than residential prices [
31]. Residential prices within 300 m of the BRT station in Seoul, Korea, increased by up to 10% [
32]. In the suburbs of San Jose, California, the average residential price increased by 3.2% for every 50% decrease in the distance to the TOD [
7]. Within 700 m of influence, the residential price premium along Wuhan Metro Line 1 is 318.14 yuan/m
2 [
5]. The degree and scope of impact of transfer stations on residential prices in Beijing is greater than that of non-transfer stations, and the difference between transfer stations and non-transfer stations is greater in suburban areas than in urban areas [
33].
The opening of the metro station is beneficial to increase the value of the land around the station. The construction of the Bangalore Metro Line has led to a significant increase in land prices, with an impact scope of over 500 m [
6]. In Wuhan, residential prices around the newly opened stations rose 13.9% [
34]. The impact of Shenzhen metro stations on land development extends to 1250 m, the stations and land supply have a synergistic effect, and the distance from the stations moderates the impact of land supply on land development intensity [
35]. The average residential prices within 800 m of the BRT system in Auckland, New Zealand, increased by about 3.69% [
36]. The closer the distance of residences to the railroad in rural northeast Slovenia, the stronger the impact, with its intensity decreasing from 500 km to 6 km [
37].
Secondly, the impact of rail transit on residential prices includes both positive and negative effects.
Dziauddin et al. (2015) argued that the light rail transit system in Kuala Lumpur, Malaysia, has both positive and negative effects on residential prices [
38]. By contrast, Gadziński and Radzimski (2016) considered that rail transit has little impact on residential prices by studying Polish rail transit Poznan Express Tram [
39]. Montreal metro line had little impact on residential prices before its operation; after its operation, the residential prices increased [
40]. The impact on residential prices before the construction of the Sydney metro line was negative, and positive during the construction phase [
41].
In addition, the impact of rail transit on the increase in residential prices varies with time.
Trojanek and Gluszak (2018) found that rail transit positively affected residential prices before it was built, with a gradual increase in the degree of impact after completion [
42]. The light rail transit system in Queensland, Australia, began to affect the increase in residential price after construction was announced, with large price increases and slow residential price growth during the construction and operation periods [
43]. Ke and Gkritza (2019) found that the announcement of construction of the LRT in North Carolina led to a gradual increase in residential prices as the distance between residences and stations decreased [
44].
2.4. Methods of Quantitative Study on the Impact of Rail Transit on Residential Prices
Apart from qualitative studies on the impact of rail transit on residential prices, domestic and foreign scholars have used econometric methods to conduct quantitative studies, and establish the hedonic price model (HPM), the geographically weighted regression (GWR) model, the structural equation model (SEM), the multinomial logit (MNL) model, the data envelopment analysis (DEA) model, and the difference-in-difference (DID) model for empirical analysis.
Seo et al. (2014) used the hedonic price model to determine the positive and negative relationship between residential prices and proximity to light rail and freeways in Phoenix, Arizona, with an “inverted U” shaped distance band coefficient [
8]. Sharma and Newman (2018) used the hedonic price model to analyze the increase in land value by 4.5% after the operation of the Bangalore metro [
5]. This model effectively analyzed the impact of rail transit on residential prices. Mathur and Ferrell (2013) and Wang et al. (2019) have also used the model [
7,
9]. Combining the t-test method and the hedonic price model confirms that the rental prices of TOD housing in Beijing, Shanghai, Shenzhen, Hangzhou, and Wuhan are significantly higher than those of non-TOD, and that the synergistic relationship between metro stations and neighborhood characteristics plays an important role [
45].
The GWR model effectively shows the marginal prices of residential price influencing factors, and the degree of positive impact of plot ratio on residential prices is more significant in highly developed regions [
46]. Mulley et al. (2018) used the GWR model to find that Sydney’s Inner West Light Rail has a greater impact on areas outside of the downtown area [
47]. The impact of residential price factors on residential prices is time-non-stationary as calculated by the GWR model [
48].
The SEM, MNL, DEA, and DID models are used less frequently than hedonic price models and geographically weighted regression models. Ibeas et al. (2012) obtained through SEM model analysis that each additional line in the residential area of Santander urban area in Spain increases its price by 1.8% [
10]. The impact of urban rail transit systems on urban land-use changes can be quantified based on the MNL model and land use allocation model, which can provide a reference for urban planners to visualize future land use planning maps [
11]. Khare et al. (2021) used DEA model to quantitatively evaluate the coordination between the rail transit system and land use in the city of Bhopal, India, under the TOD model [
12]. The spatial autoregressive difference model (SAR-DID) was developed and it was found that the development of Seoul Subway Line 9 in Korea provided greater proximity and economic benefits for residential and commercial land uses [
13].
3. Material and Methods
3.1. Study Area
Beijing is the first city in China to open a subway. According to the China Urban Rail Transit Association, as of 31 December 2020, Beijing’s subway covers 727 km, the second in China, operating along 24 lines and serving 428 stations. There are 16 municipal districts and 8 existing and planned ring roads in Beijing. According to Beijing’s August 2018 transit travel statistics, of the daily transit travelers, 50% of the passengers only took ground transit, 30% only took rail transit, and 20% used the combination of these. Beijing subway plays a significant role in optimizing the spatial layout of the city. It relieves the population pressure in the central city and promotes economic development of Beijing. The GDP of Beijing in 2020 was 3610.26 billion yuan, and the investment in real estate development increased by 2.6% compared to that in 2019.
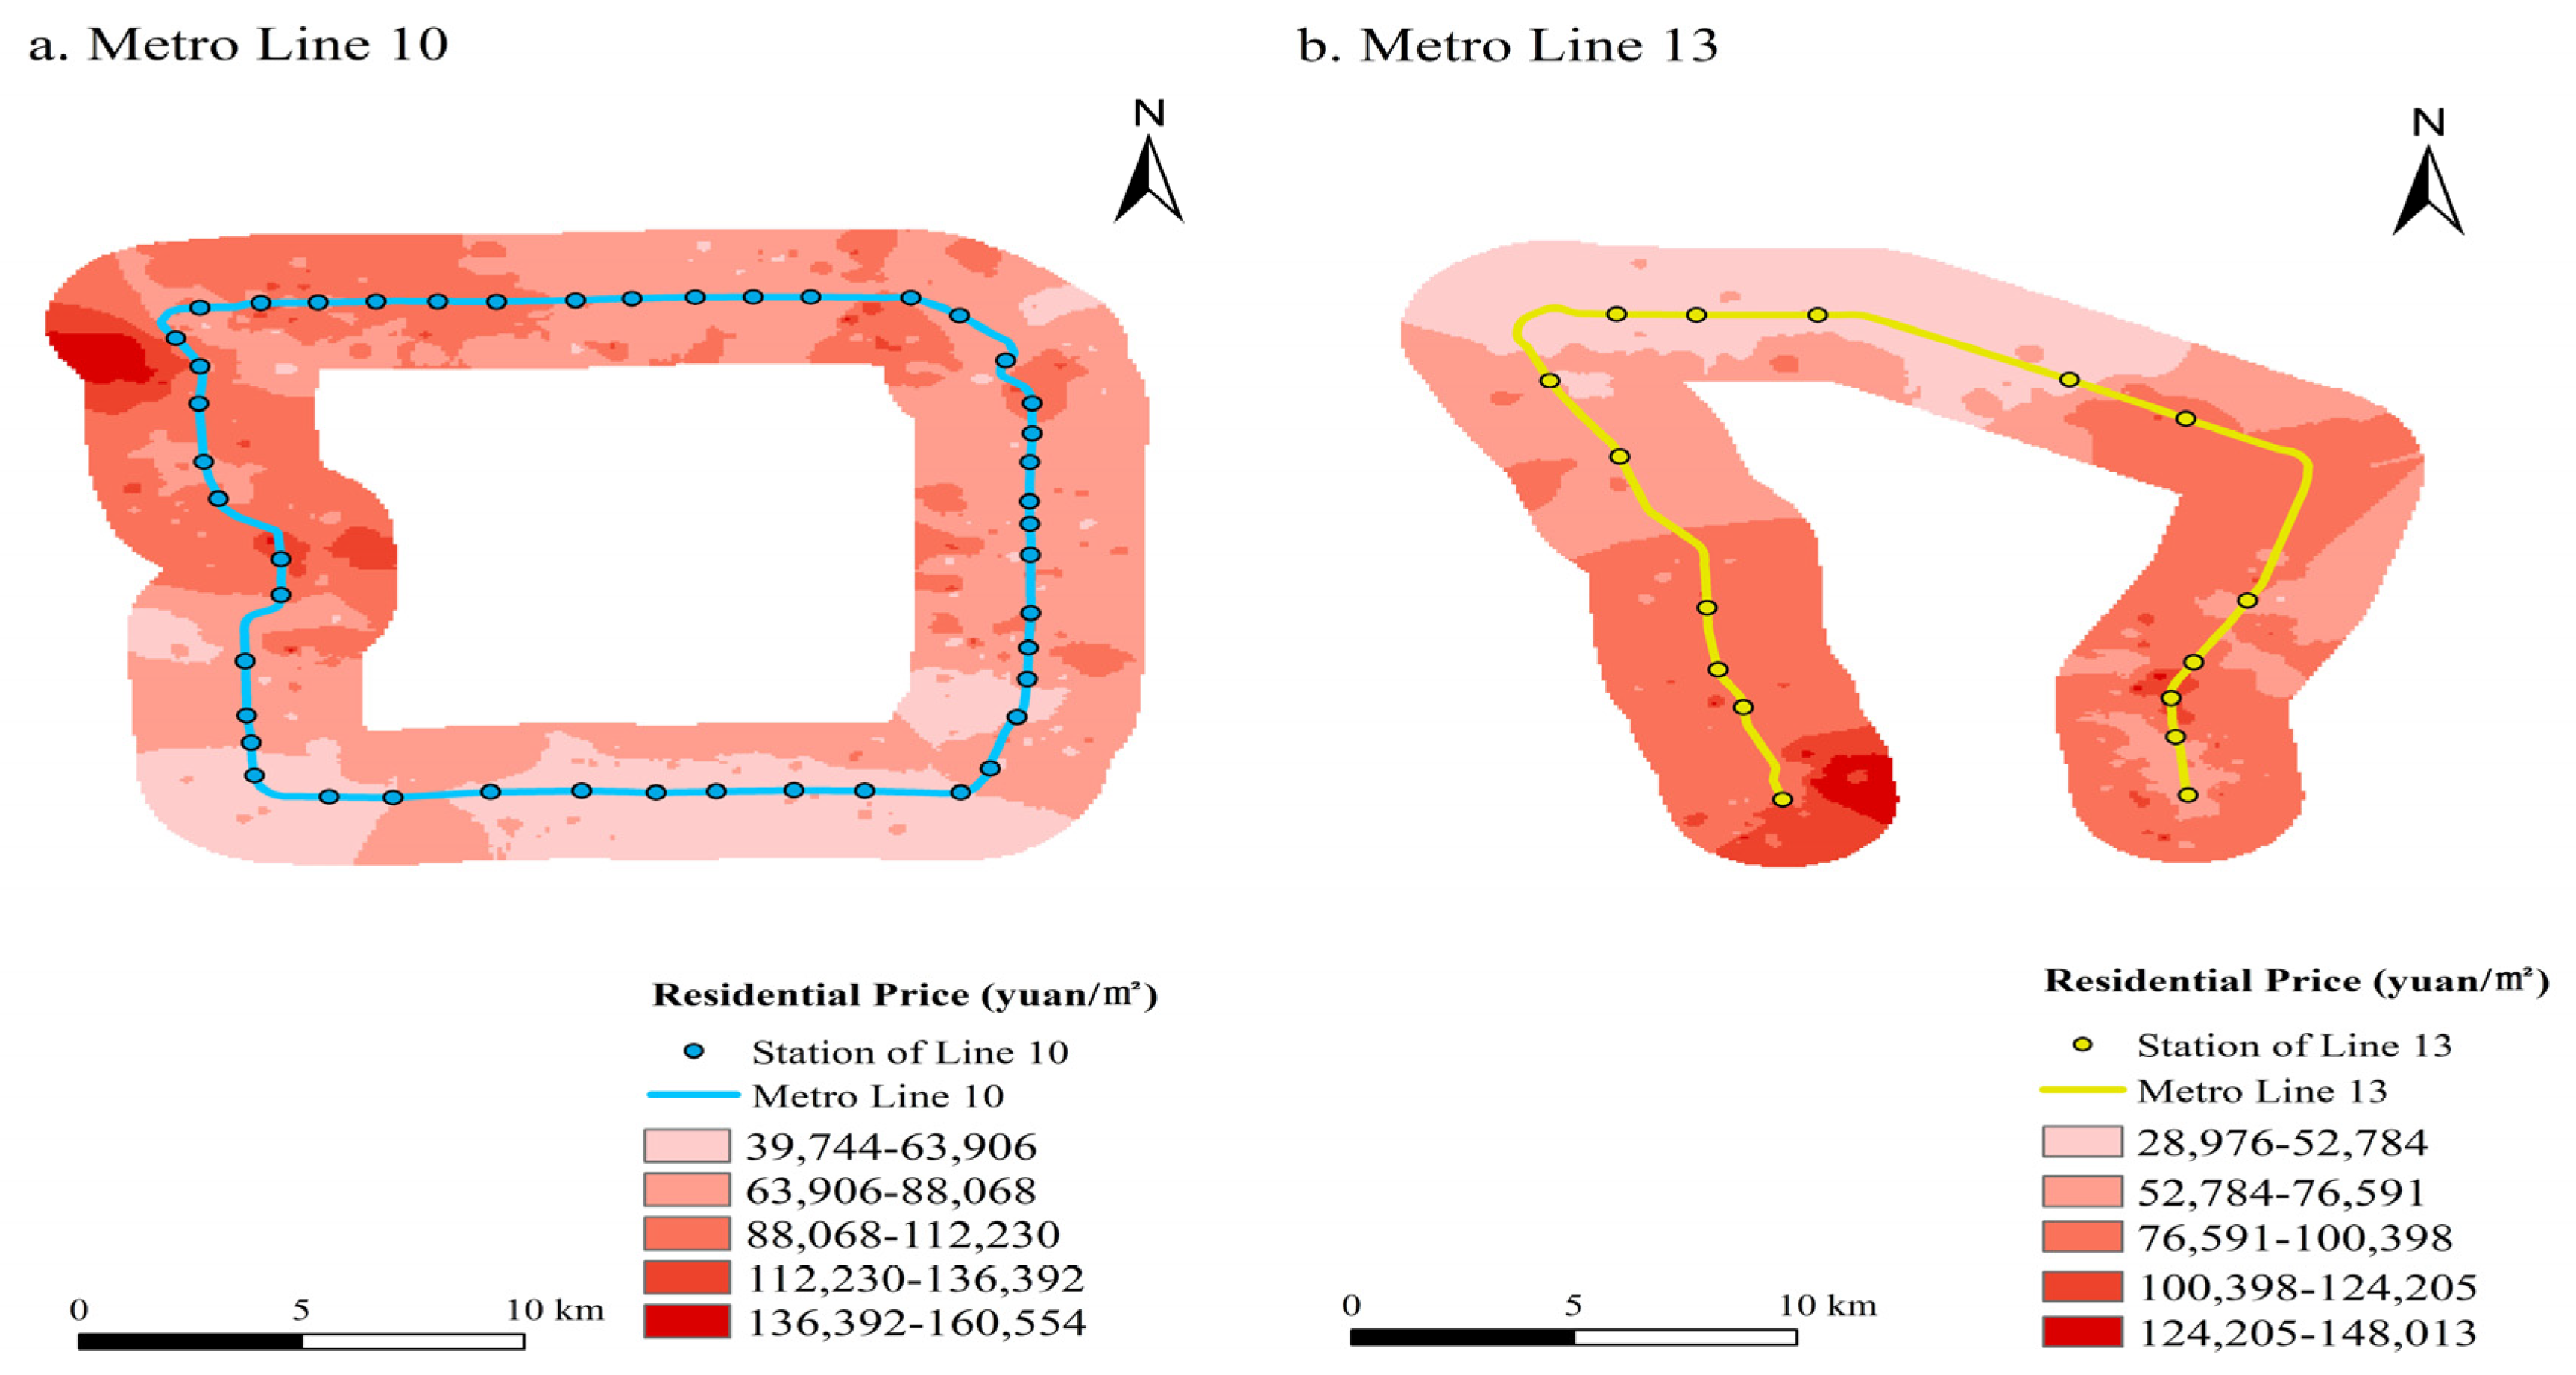
Metro Line 10 is the second circular metro line operated in Beijing. Its construction started on 27 December 2003, and its official operation began on 19 July 2008. The total length of Metro Line 10 is 57 km, and the operating time of one loop is 104 min. The line serves 45 stations, 17 of which are transfer stations. Metro Line 10 passes through the third and fourth rings, and its major function is connecting the northwest and southeast directions of the central city.
Beijing Metro Line 13, which runs in a circular path from west to east, starting at Xizhimen Station and ending at Dongzhimen Station, opened for operation on 28 September 2002. This line is 40.9 km, with 17 stations, all of which are built above ground, except for the Dongzhimen Station. Metro Line 13 passes through the third, fourth, and fifth rings, and it connects the northern part of Beijing with the central city and enhances the attractiveness of the north area.
3.2. Data Source
To establish a spatial GIS database of residences along Metro Line 10 and Metro Line 13, this study collected Beijing subway station and line data, Beijing facility POI data, and 2017 Beijing residential unit transaction data from Sofang.com (
http://bj.sofang.com) accessed on 1 January 2018. The Beijing facility POI data included bus stops, parks, shopping malls, schools, and hospitals data. The Beijing residential unit transaction data included communities, prices, addresses, completion times, property fees, greening rates, and plot ratios data. The collected information was vectorized in ArcGIS for raster data and the map projection coordinates were modified in a uniform manner.
In the suburbs of Beijing, 75% of the new residential developments are located within 2 km of the station [
49]. The influence of Beijing Metro Line 5 is limited to 2 km, and residential prices decrease exponentially as the distance from the station increases [
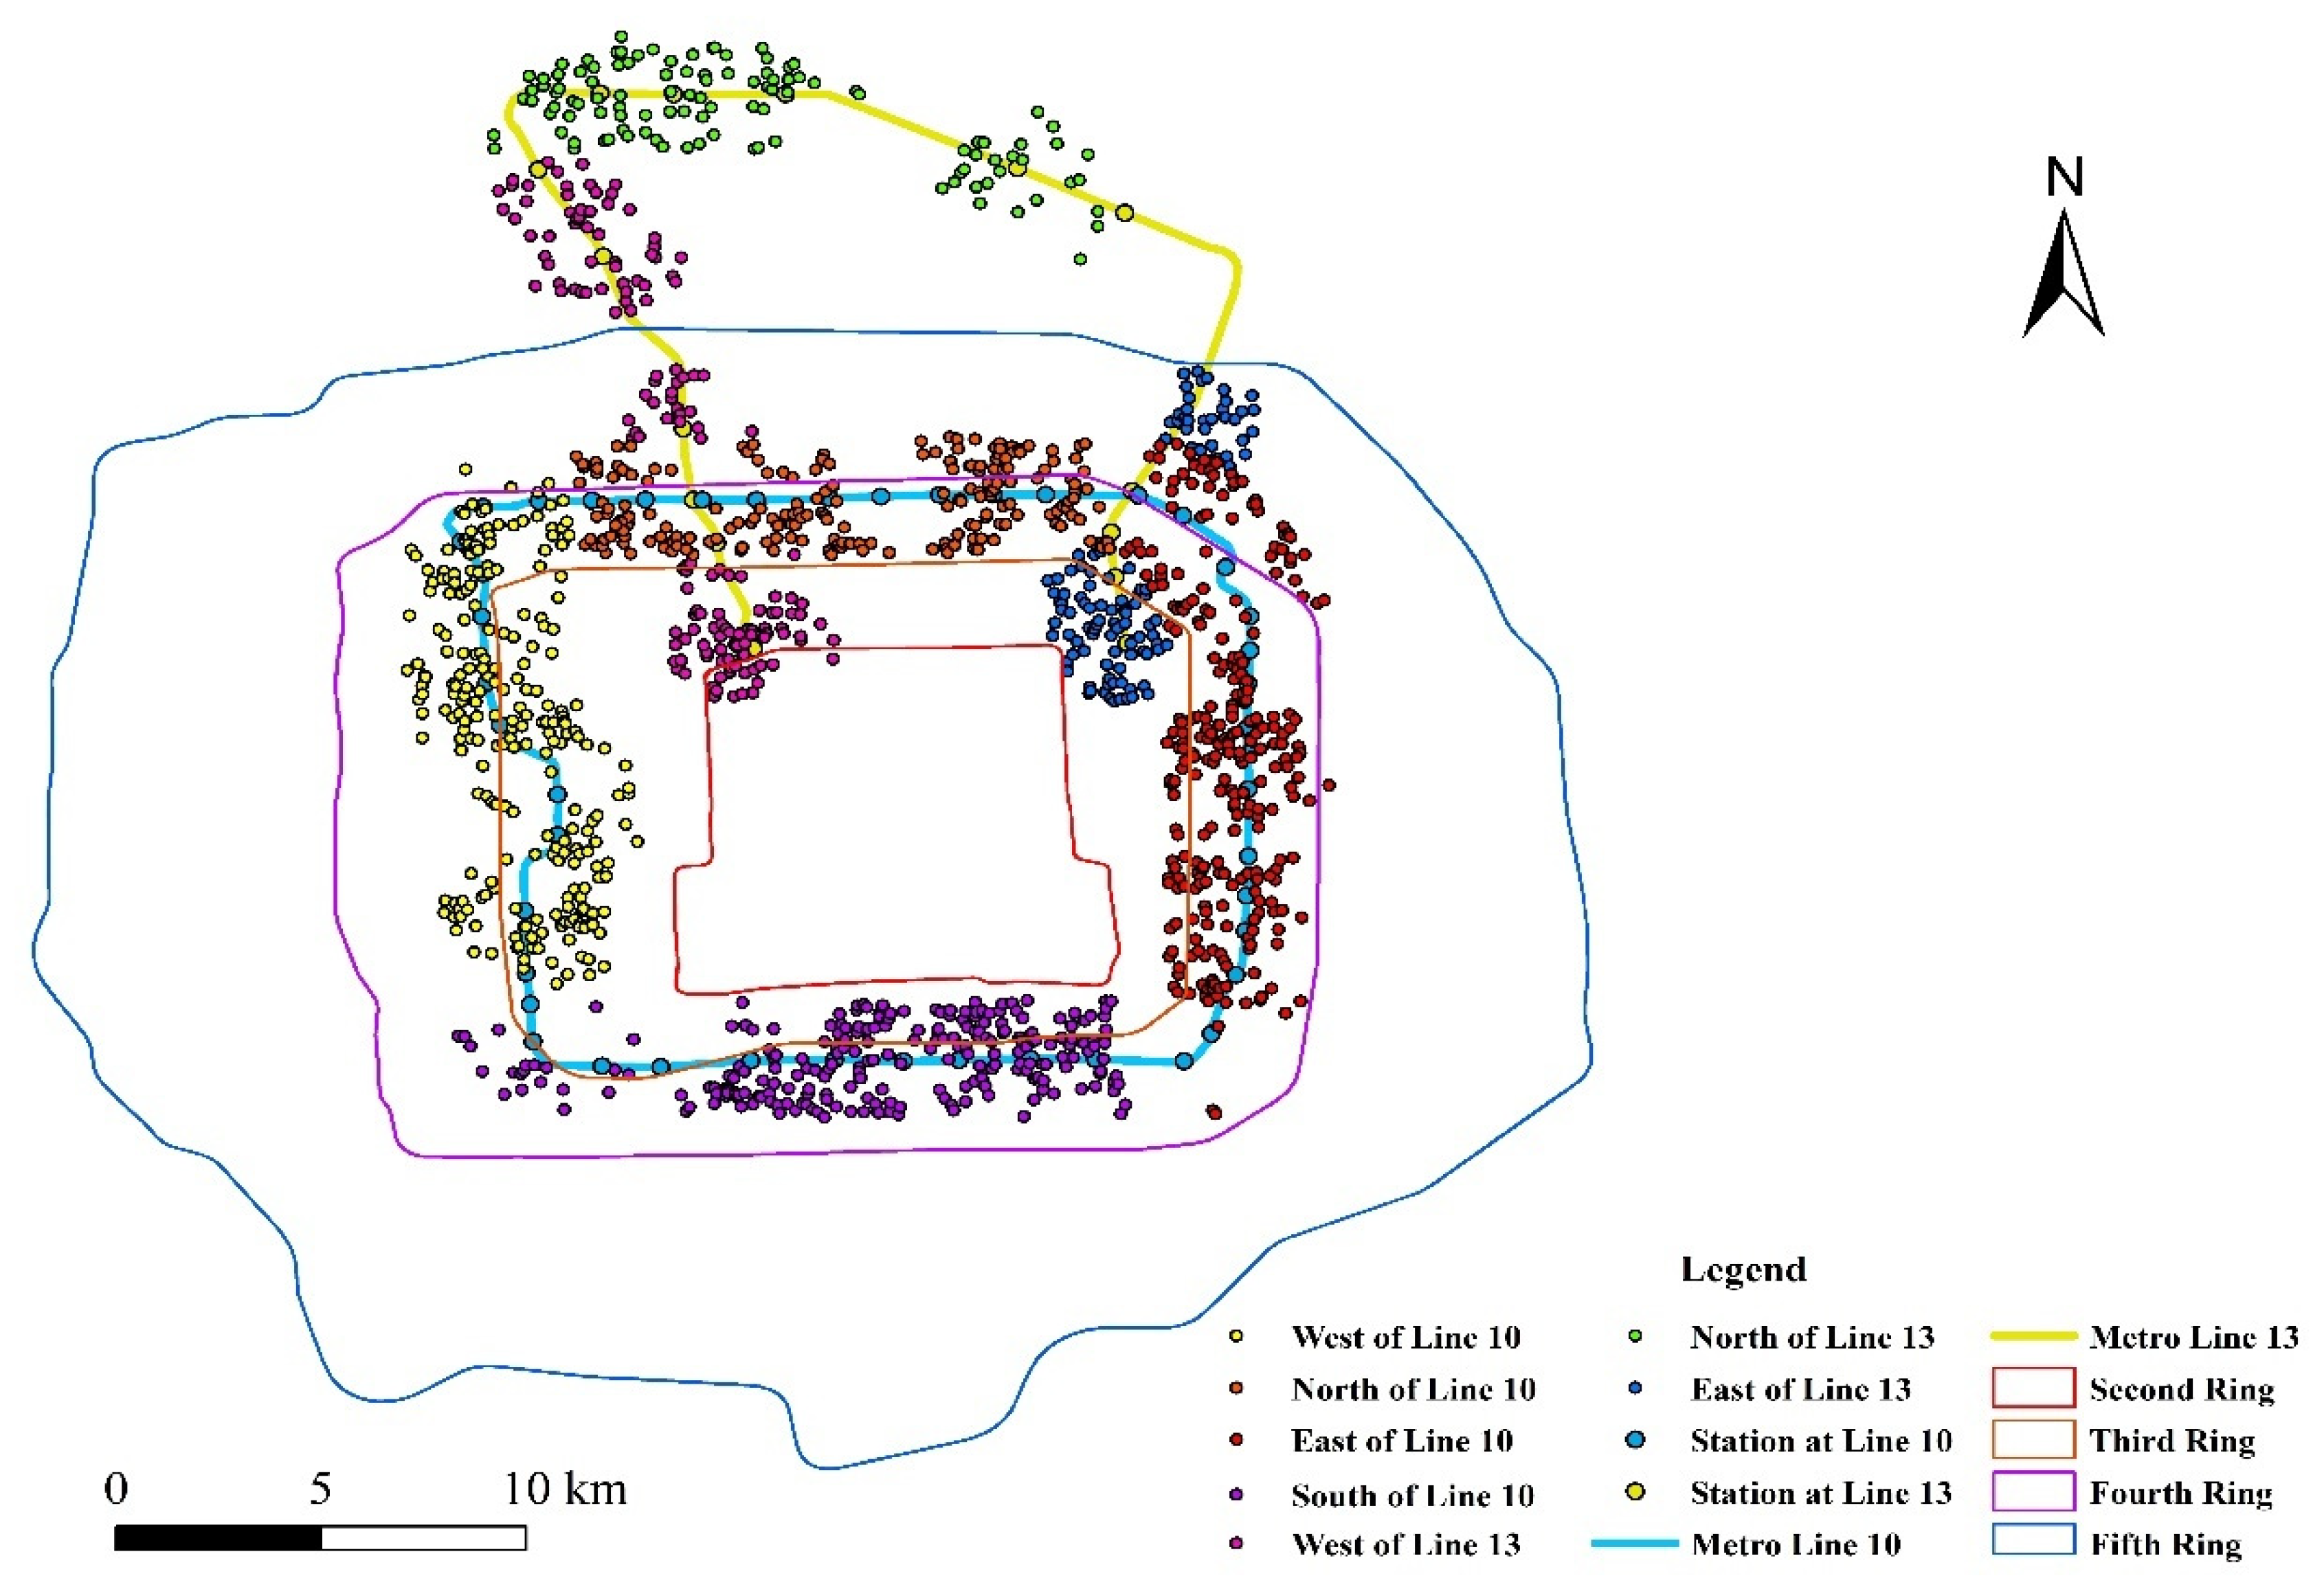
50]. Therefore, the buffer zone was established in the 2 km range along the transit, and the residential samples were selected from this zone first. The residential sample data were filtered and excluded using tools such as buffer zone and intersection, combined with the feature variables selected for the study. Finally, 928 and 484 valid samples for Metro Line 10 and Metro Line 13, respectively, were obtained (
Figure 1), and a sample spatial database was constructed.
3.3. Method
The hedonic price model (Seo et al., 2014) was mainly used to analyze the degree of influence of various factors on residential prices [
8]. It is a combination of theories such as demand function theory, equilibrium theory, utility function theory, and implied characteristic price theory. The hedonic price model treats residence as consisting of many characteristic variables, and the price difference between residences is due to the different number and types of each characteristic variable of the residence, and when a characteristic variable of the residence changes, its price will also change accordingly. Taking the partial derivatives of each characteristic variable of the residential price function separately can reveal the extent to which changes in each variable affects residential prices.
The basic principle of the hedonic price model is to split the price of a residence to reflect the implied price of each characteristic, to ensure that the characteristics of the residence remain unchanged, to decompose the different types of characteristic variables, to gradually exclude the effect of characteristic changes in the total change in price, and finally to obtain the effect of supply and demand on price changes alone.
The steps of this method are to establish the regression equation of characteristic prices through a certain number of residential data and the selection of relevant characteristic variables, and to derive the implied prices of the characteristic variables according to the specific parameters of the characteristic variables and the results of significance determination, and to analyze the quantitative influence of the variable of rail transportation on the residential prices along the line separately from it, so as to determine the scope and intensity of the influence of rail transit on the residential prices along the line in Beijing. The advantage of this method is that it can consider many factors influencing residential prices and use reliable residential data for price assessment, which can more accurately reflect the market value of residential properties.
The semi-logarithmic function form is a modification of the logarithmic function form, which can avoid the case of zero data of the characteristic variables to a certain extent. Moreover, the semi-logarithmic function form can include issues such as the unit variability of the characteristic variables and the quantitative impact of the characteristic variables. Therefore, based on the semi-logarithmic hedonic price model, this study combined the influencing factors of residential prices along rail transit lines, and quantitatively analyzed the scope and intensity of impact of rail transit on residential prices by selecting characteristic variables, establishing an indicator system, and correlation tests of the model. The semi-logarithmic expression is:
where
is the residential price,
is the characteristic variable,
is the constant term,
is the parameter coefficient to be estimated,
is the error term.
3.4. Selection of Characteristic Variables
Factors influencing the residential price include inherent as well as external factors; the former comprise location, physical factors, and equity factors, while the latter refer to demographic, economic, social, and other factors. The influencing factors of residential price along the rail transit line include the distance to the station, location, and the layout of the route. For the residences along the rail transit line investigated in this study, the price-affecting factors generally included architectural factors, environmental factors, and location factors; considering these in combination with location theory and land rent theory, three types of variables (architectural characteristics, neighborhood characteristics, and location characteristics) were selected. The selection process of each characteristic variable is as follows.
The residential price is often closely tied to the residence’s architecture itself, and if the residence has architectural features that enhance homebuyer satisfaction, then the residence will command a higher price. Drawing on the research results of scholars such as Mulley et al. (2018), the architectural characteristics of residences generally include residential area, greening rate, plot ratio, number of floors, etc. Among many factors affecting residential prices, plot ratio and age of residence are two significant factors. Greening rate and property fees of the residential community have a great impact on residential prices. Therefore, four architectural characteristics variables: plot ratio, greening rate, age of residence, and property fees, were selected for this study.
Neighborhood characteristics generally include socio-economic variables (e.g., neighborhood social status, occupational background, etc.), municipal public service facilities (e.g., shopping malls, hospitals, etc.), and externality effects (e.g., external environment, traffic noise, etc.) (Seo et al., 2014). As neighborhood characteristics have a significant effect on residential prices, living environment conditions and living standards depend on neighborhood factors. Combined with the collected POI data of Beijing facilities, four neighborhood characteristic variables, parks, schools, shopping malls, and hospitals, were selected.
The location characteristics of residence are generally considered for the entire urban area, usually quantifying accessibility. Whichever method is used to measure accessibility will have an impact on residential prices. The location characteristic variables generally refer to the geographic location of the residence, whether there is a subway station around the residence, distance to the station, distance to the city center, and whether there is a bus stop within 1 km of the residence (Chen et al., 2019). Combined with the collected POI data of Beijing facilities, two location characteristic variables, distance to the nearest subway station and bus conditions, were selected.
The influencing factors of residential prices and the collected data were combined while comprehensively considering the degree of impact of various factors on the residential samples along with the rail transit. A hedonic price model with ten characteristic variables was built, and the selected characteristic variables were quantified (
Table 1).
5. Discussion
Firstly, the results of this study reflect that residential prices along rail transit lines are influenced by both the location conditions and residential patterns of the city. In addition to Metro Line 10 and 13, other rail transit lines in Beijing have a similar pattern of influence on residential prices. On the one hand, residential prices in Beijing show a pattern of higher prices in the north than in the south, higher in the east than in the west, and decreasing from the second ring to the sixth ring outward. On the other hand, as the western and eastern parts of Beijing’s fourth ring have better education, shopping convenience, and community environment, the residential prices along the rail transit line in this location are relatively higher. The residential prices along the rail transit line outside the fourth ring are relatively lower due to the poor conditions of community grade and medical convenience.
Secondly, the results of this study demonstrate that the impact of rail transit on residential prices is more significant when located in suburban areas. Gu and Zheng (2010) showed that residential prices within 1 km of the stations of Line 13 in suburban areas were nearly 20% higher than that 1 km away [
49], while this impact was not significant in urban areas, and the results of this study confirm the accuracy of this result. The willingness of residents to purchase homes near the subway increased after Beijing realized its traffic restriction policy (Xu et al., 2015) [
51], suggesting that the construction of rail transit also has a beneficial impact on land use and population growth around stations.
Furthermore, the results of this study indicate that the degree and range of influence of interchange stations on residential prices is greater than that of non-interchange stations. In cities with a high number of subways, there is some overlap in the effect on residential prices between different subway lines in urban areas, and an increase in the number of subway lines belonging to the same station (interchange) enhances the agglomeration effect around that station, leading to relatively higher residential prices along it, the results of this study being the same as those of Dai et al. (2016) [
33]. The suburban subway lines are relatively independent of each other and have less impact on each other. Furthermore, the residential prices along rail transit lines are generally influenced by a single line, resulting in relatively low residential prices.
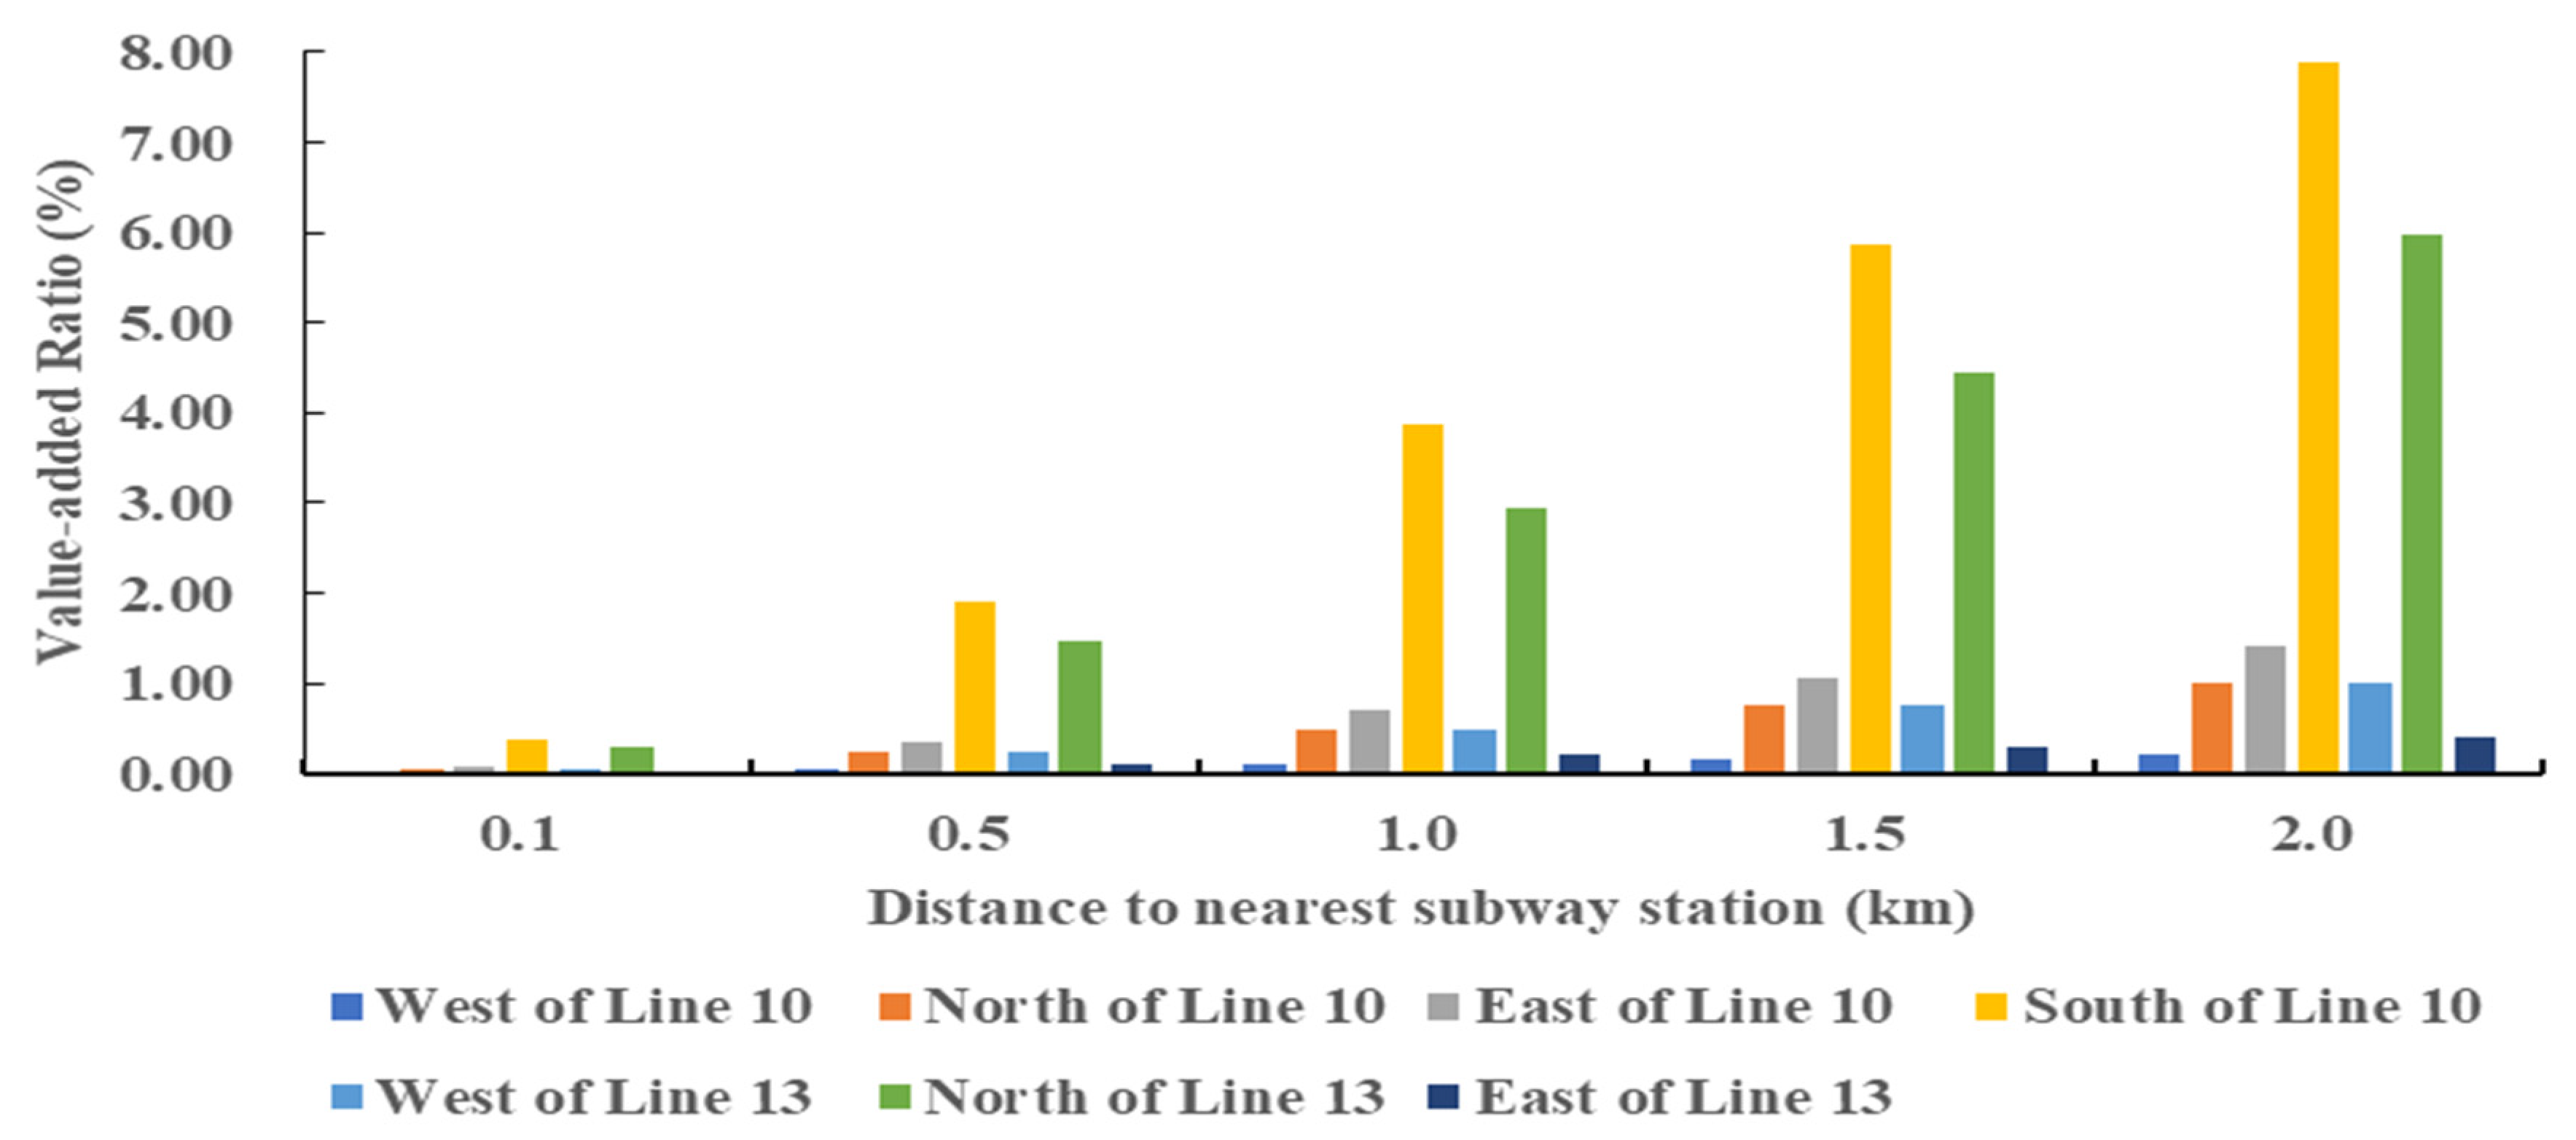
Existing studies such as Xu and Zhang (2016), Sharma and Newman (2018) and Yang et al. (2020) showed that the impact of rail transit on residential prices usually ranges from 0.5–2 km [
3,
5,
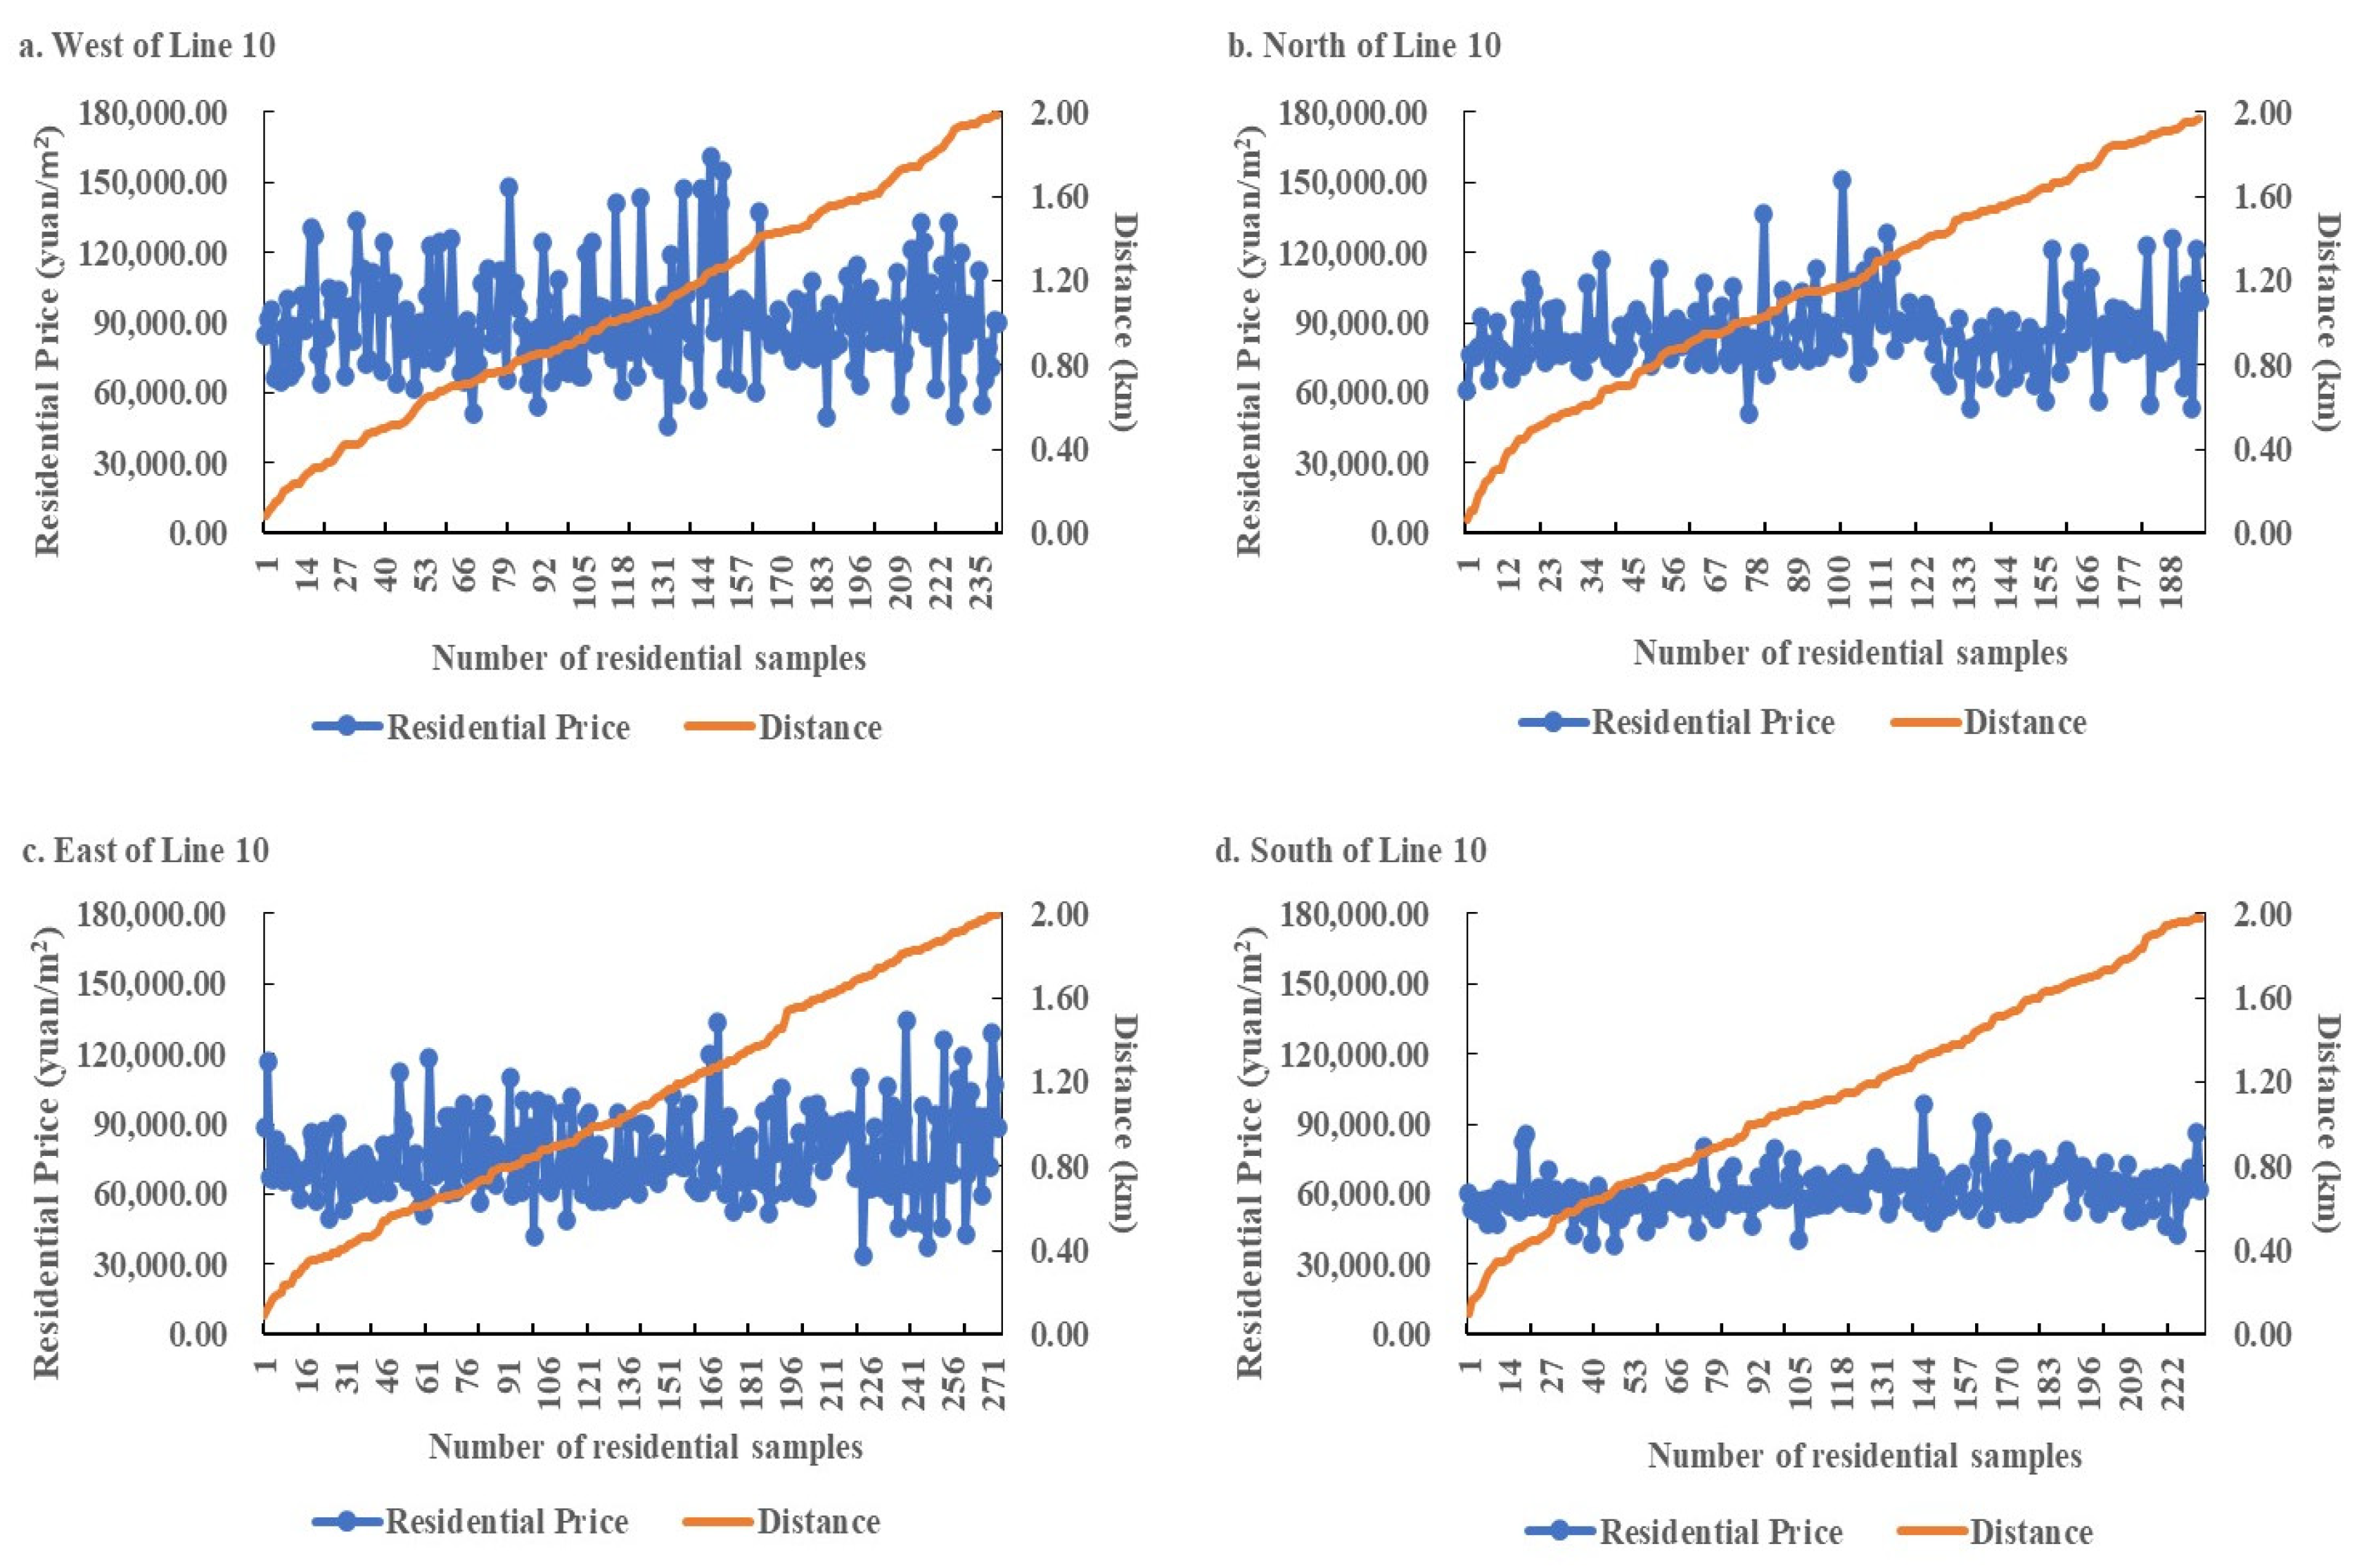
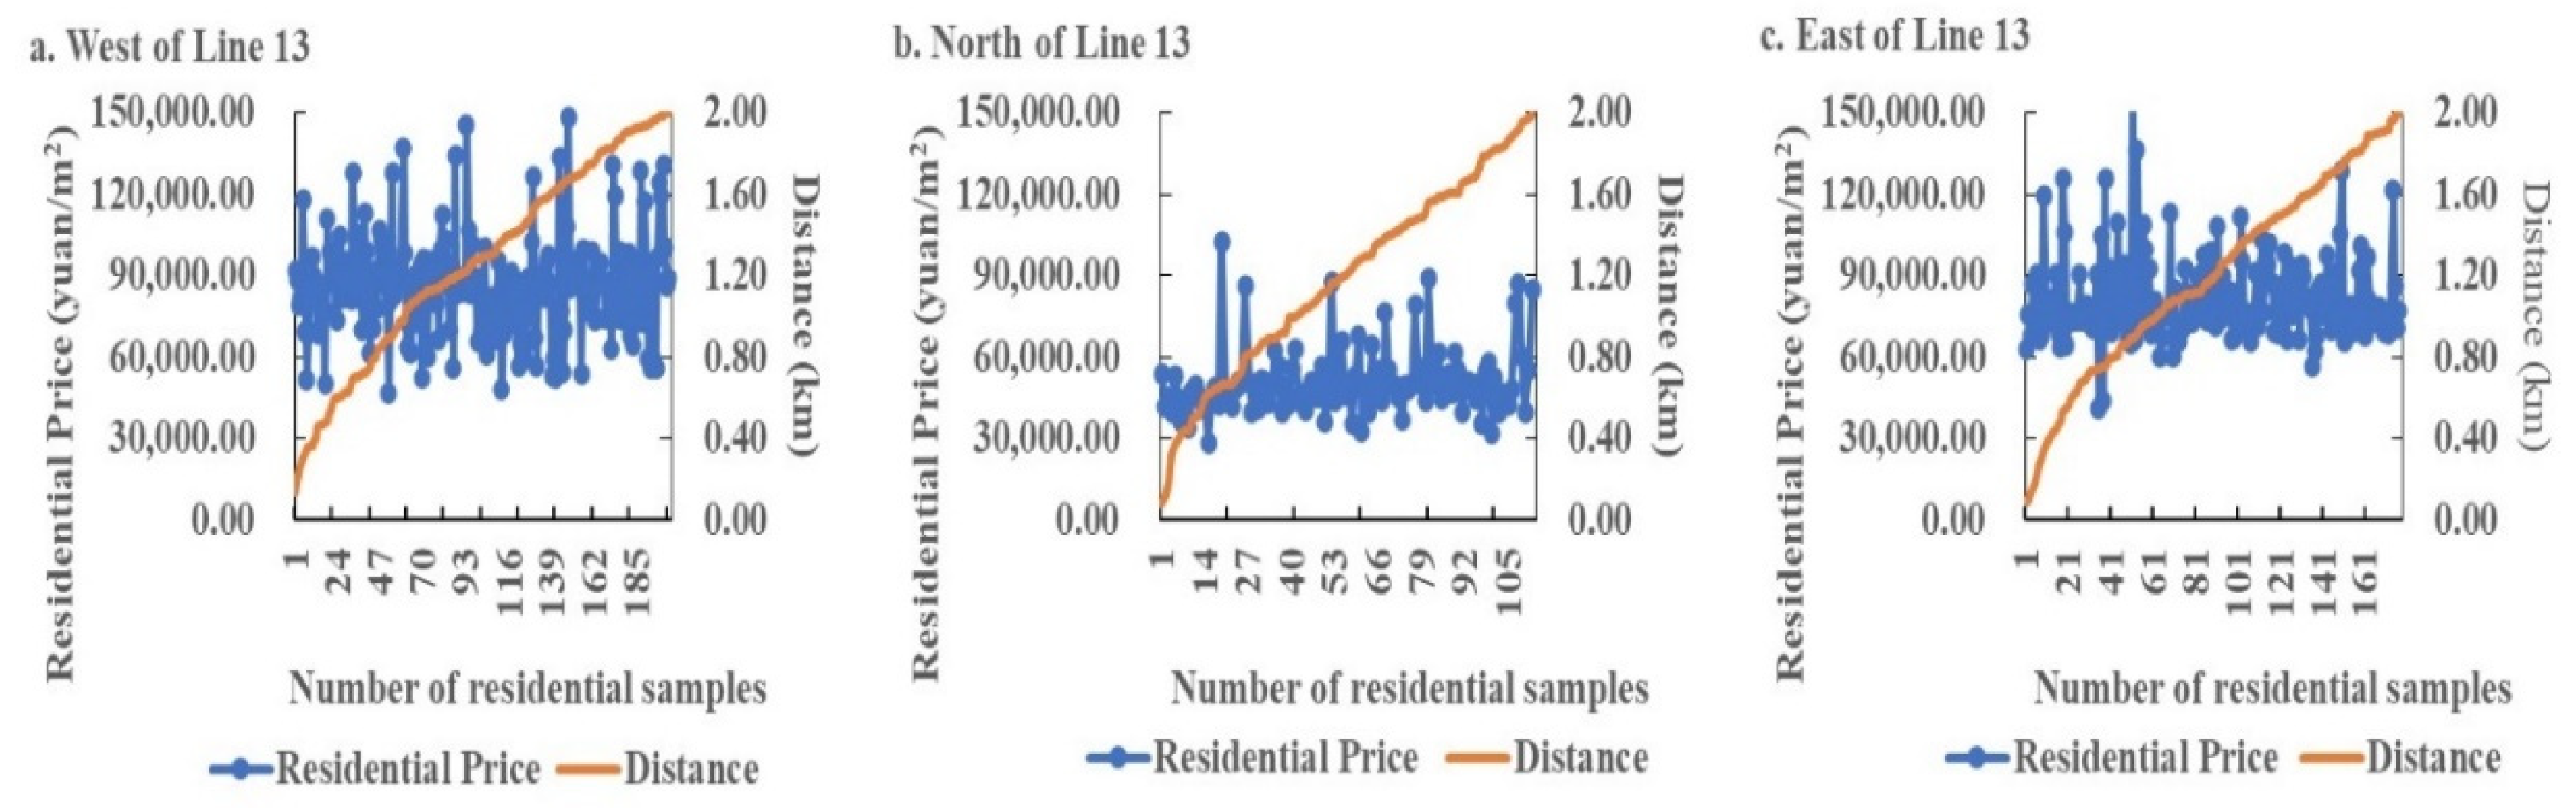
6]. This study confirms that it can reach 2 km and analyzes the impact of rail transit on residential prices in Beijing within the second to third, third to fourth, fourth to fifth, and fifth to sixth rings, based on the distribution location of the residential sample located in the ring line. In addition, this study not only groups the residential samples according to their location in the distribution of the ring line, but also divides the 0–2000 m study area by 200 m unit distance, confirming that the impact of rail transit on residential prices includes both positive and negative impact, similar to the results of Dziauddin et al. (2015) [
38].
Finally, for the circular subway lines within the same city, it is more appropriate to segment them separately according to their location and then use the hedonic price model to study the impact of different orientations of the same rail transit line on residential prices. Because the number and operation of rail transit varies from city to city, this study is unable to find the most significant impact scope of rail transit on residential prices in most cities. However, by gradually narrowing or expanding the study area and combining the methods used in this study, it is possible to determine the maximum impact scope of rail transit on residential prices in the study area.
6. Conclusions
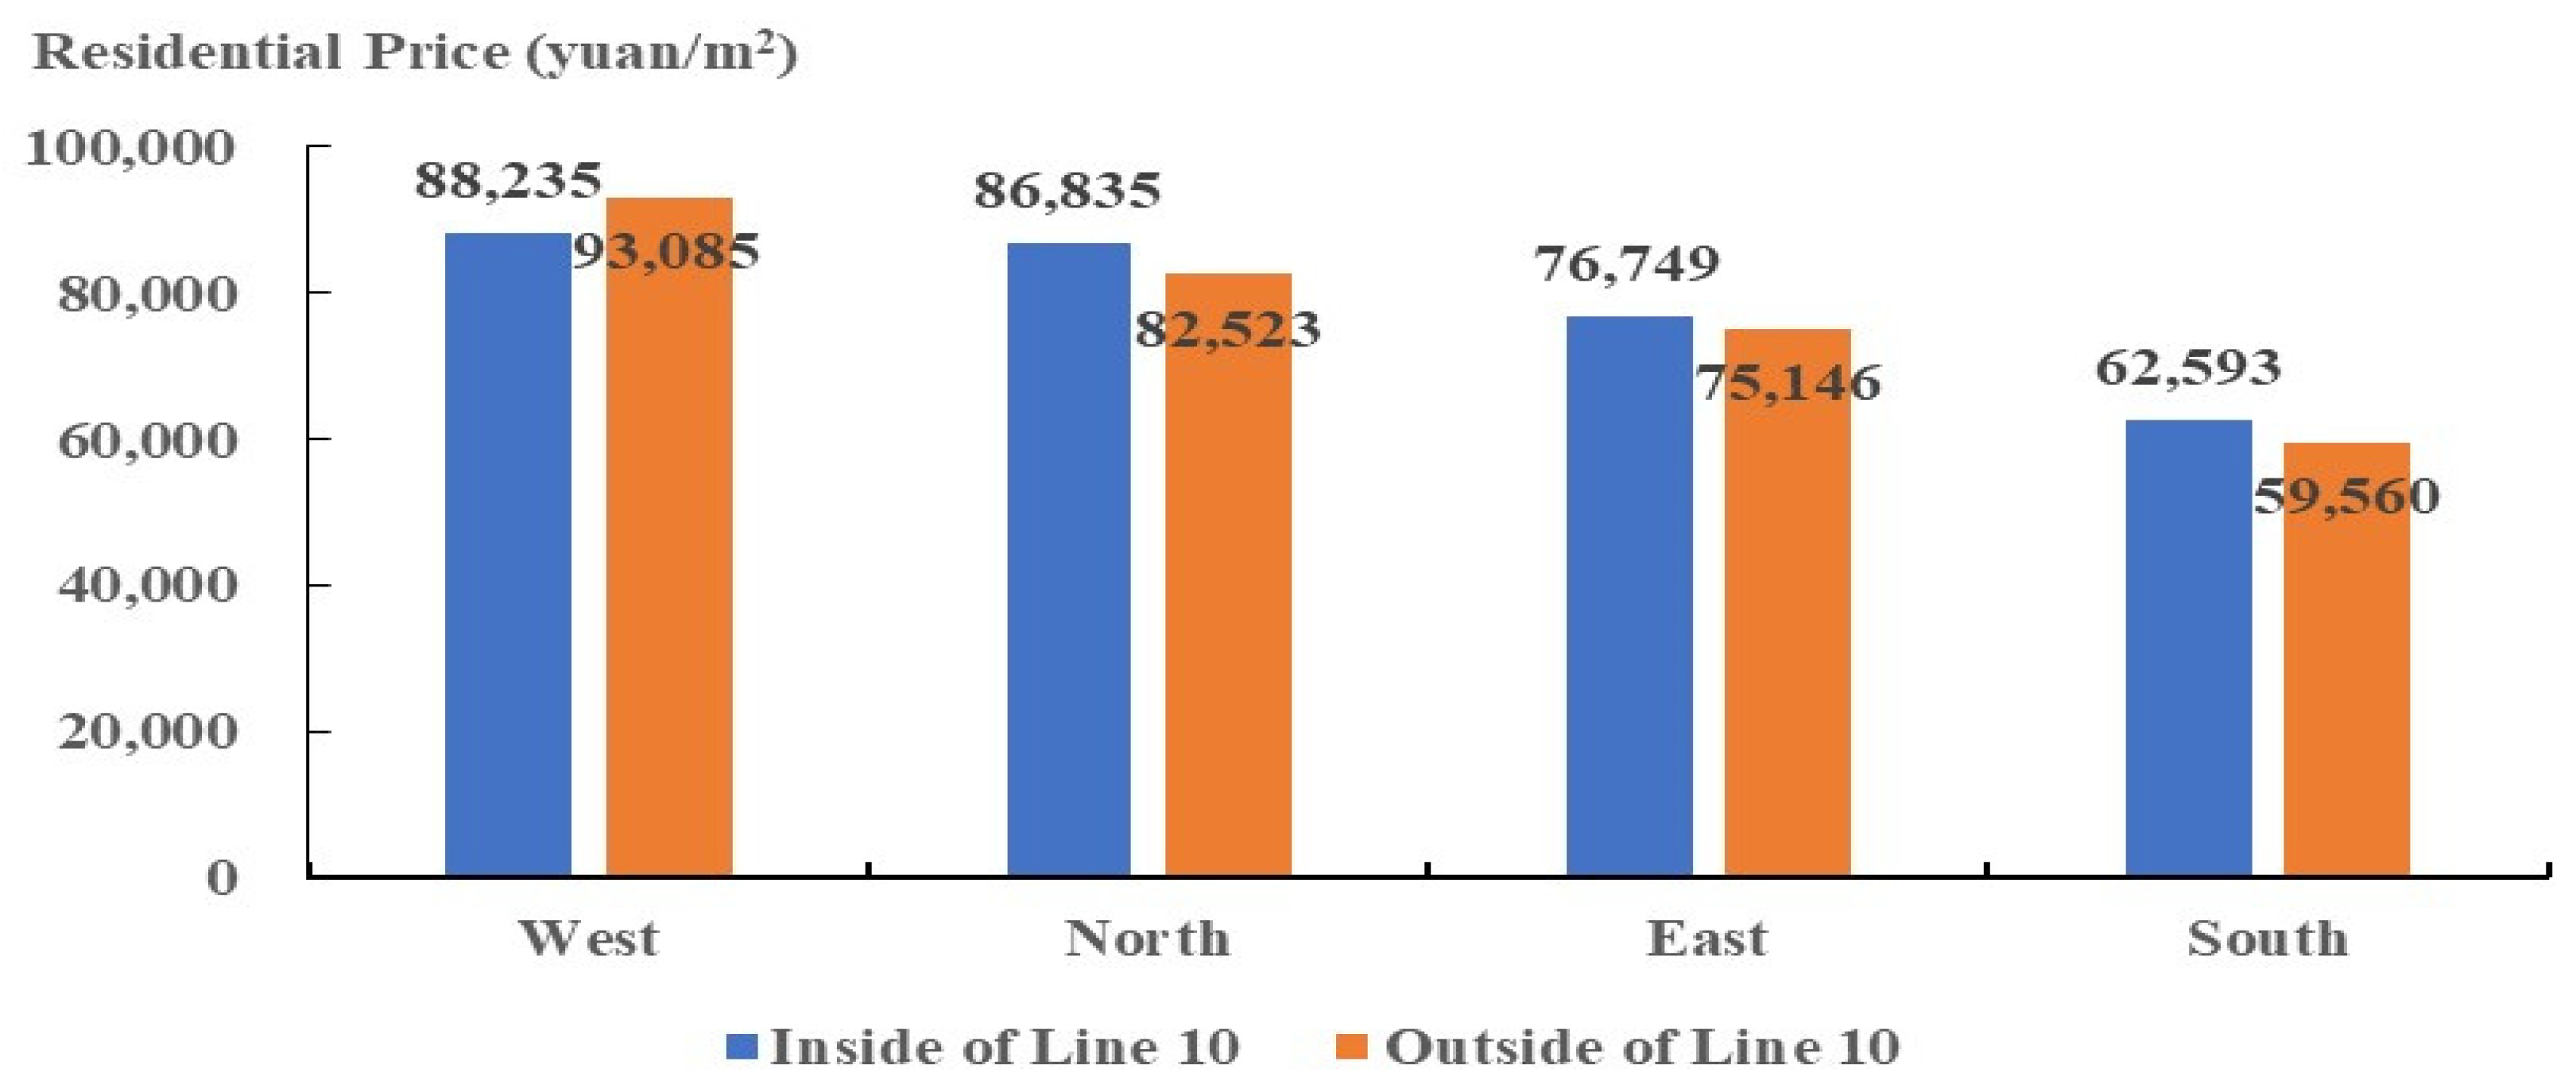
This study considered Beijing Metro Line 10 and Metro Line 13 as examples, based on the established spatial database of residential samples and the semi-logarithmic hedonic price model. Combined with the residential data within 2 km along both lines and the POI data of Beijing facilities, the spatial and value-added effects of rail transit on residential prices in Beijing were empirically analyzed. Following conclusions can be drawn from this study: (1) Within the urban area of a single-center city, the average residential price on the inner side of the rail line adjacent to the city center is higher than on the outer side. (2) Location characteristics are key factors in the impact of rail transit on residential prices, neighborhood characteristics are main factors influencing residential prices along rail transit lines in urban areas, and the architectural and neighborhood characteristics have equally significant impact on residential prices along suburban rail transit lines. (3) Residential prices along rail transit lines are related to the city’s own residential price patterns. Rail transit in urban areas has a lesser value-added effect on areas with higher residential prices along its route, while rail transit in suburban areas has a larger value-added effect on areas with lower residential prices along its route.
This study confirms that location conditions are an important factor for rail transit to influence residential prices along the rail transit line and points out that the residential pattern of the city also affects residential prices along the rail transit line. In the context of a monocentric city pattern, the value-added pattern of residential prices along the rail transit lines is basically the same as the residential price pattern of the city itself; while for cities with a polycentric pattern, the residential prices along the rail transit lines have obvious distribution characteristics, and the planning and construction of rail transit can change the residential price pattern of the city to a certain extent.
The innovation of this study is to combine the TOD land development model and the quantitative analysis method of residential price pattern, and to study the effect of rail transit on the spatial differentiation of residential price from two location perspectives: the residential price pattern of the city and the city’s own ring division. Moreover, new location characteristics variables are added at a unit distance of 200 m to verify whether the spatial effects of rail transit on residential prices in different locations are the same, and to find out the most significant range of rail transit’s impact on residential prices.
This study takes two rail transit lines in the same city as examples to confirm that the spatial impact of rail transit on residential prices in different locations of the same city is not the same. The results of this study are also applicable to cities with similar urban patterns and location conditions as Beijing, where government departments can make full use of the economic benefits brought by rail transit, and scientifically plan the construction and extension of subway lines in conjunction with their own planning goals, which is important for accelerating the balanced development of economy and residential prices among different locations within the city.


