


The Non-Agriculturalization of Cultivated Land in Karst Mountainous Areas in China
Abstract
:1. Introduction
2. Materials and Methods
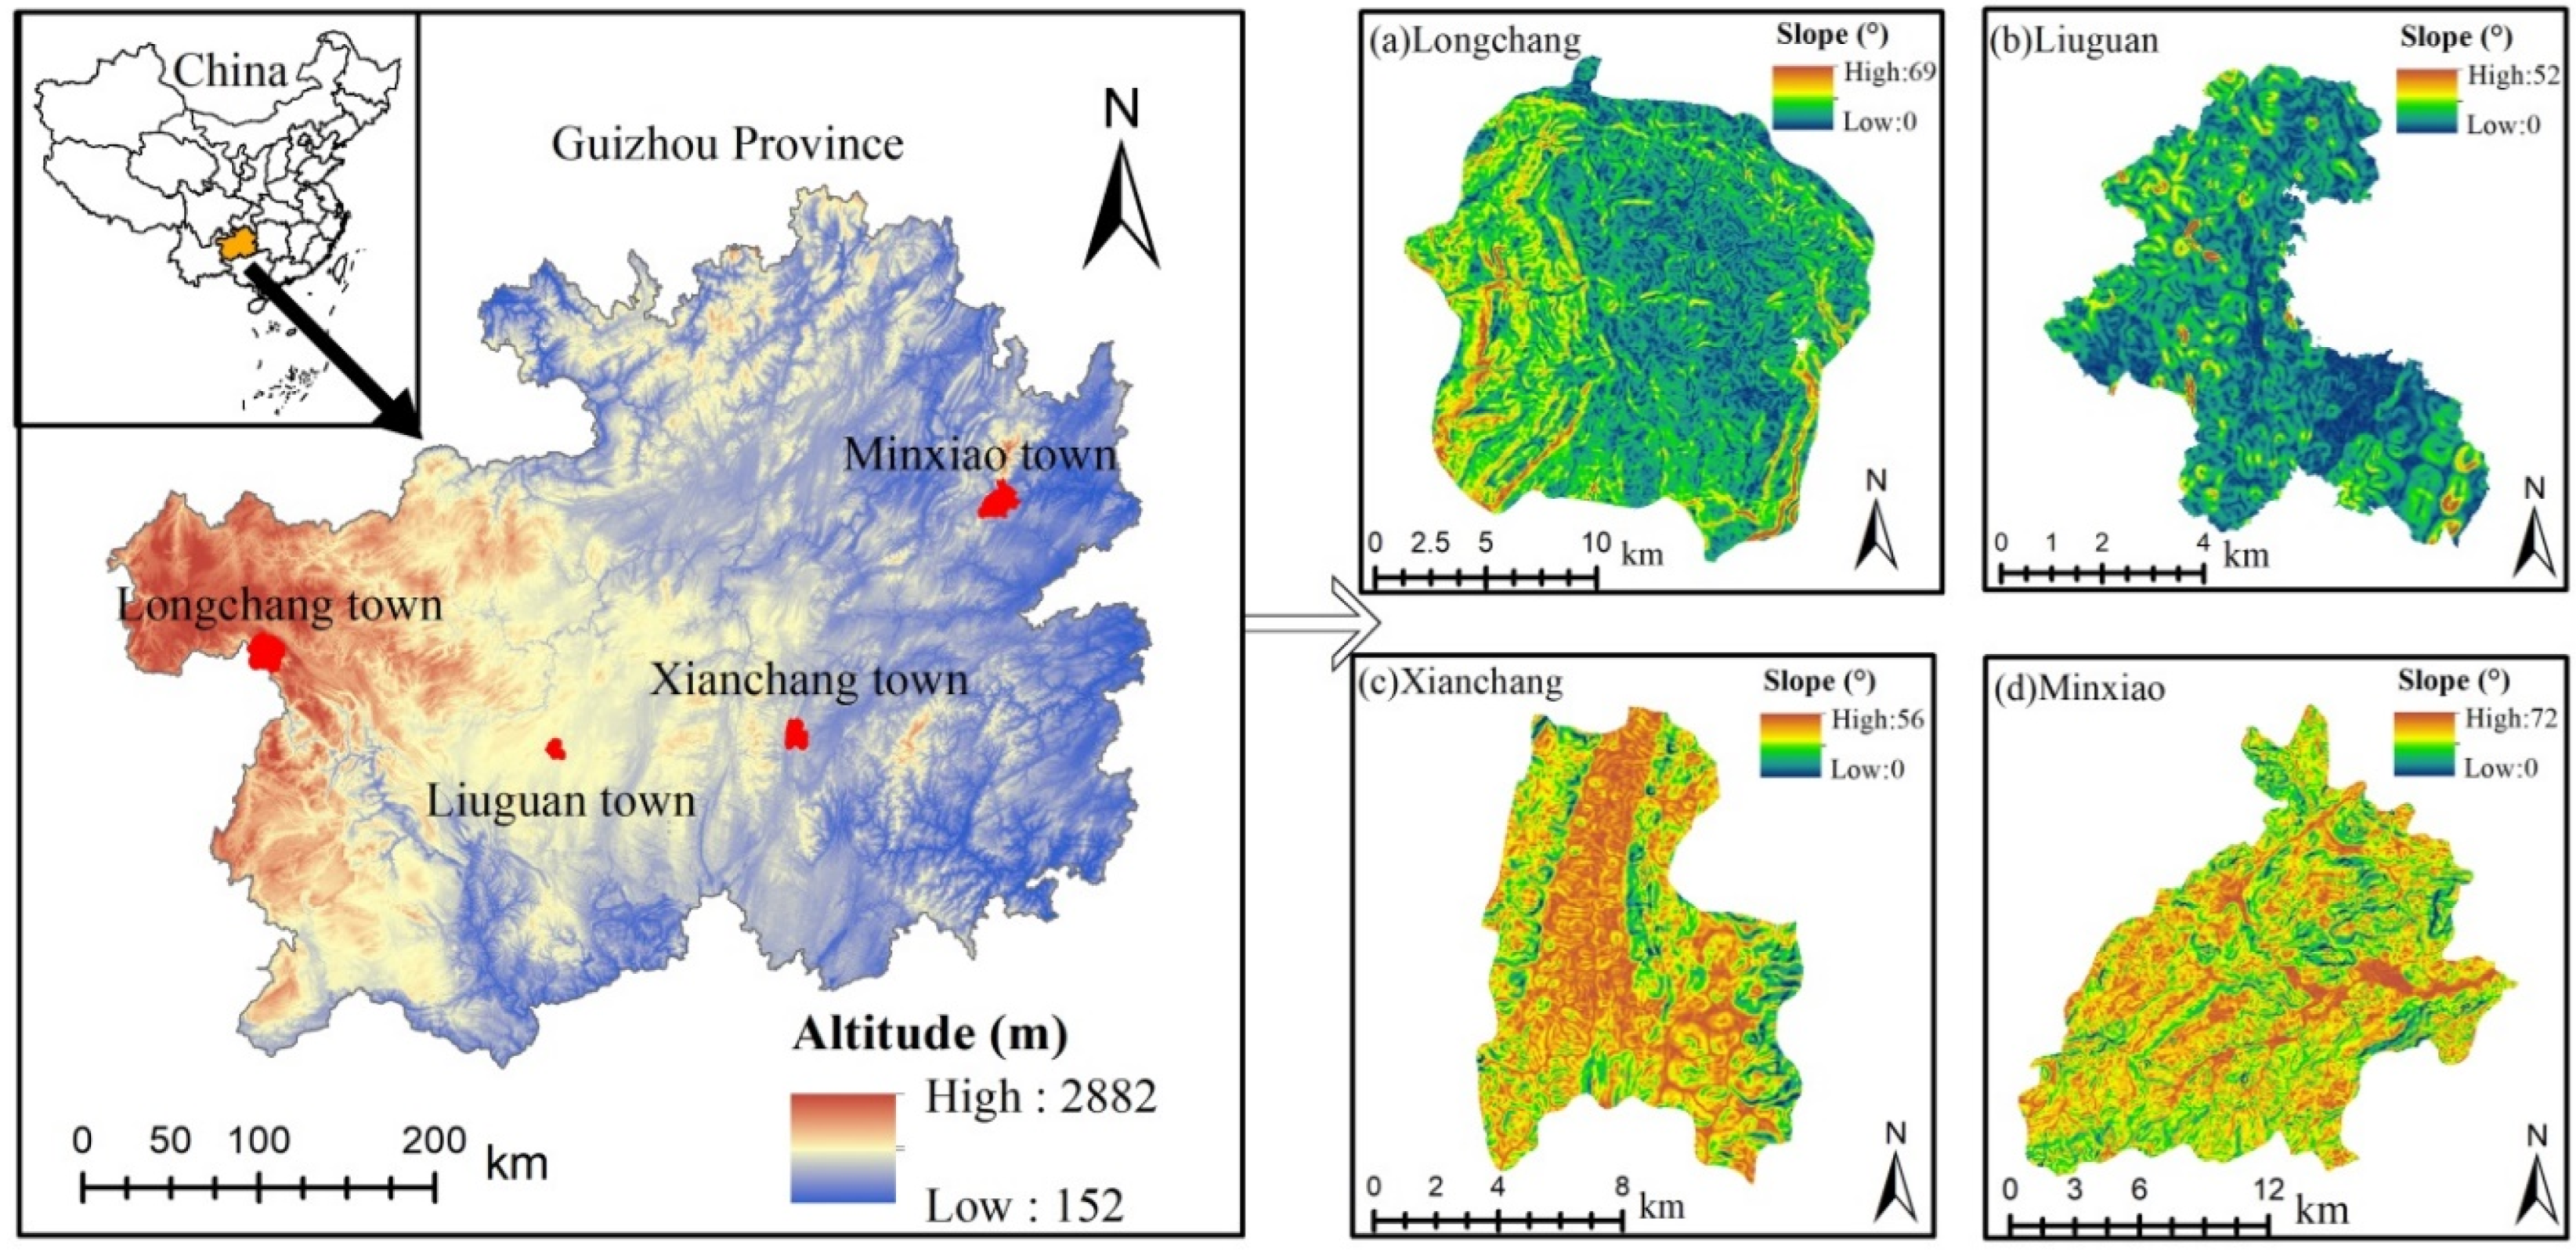
2.1. Overview of the Study Area
2.2. Data Sources and Processing
2.3. Methods
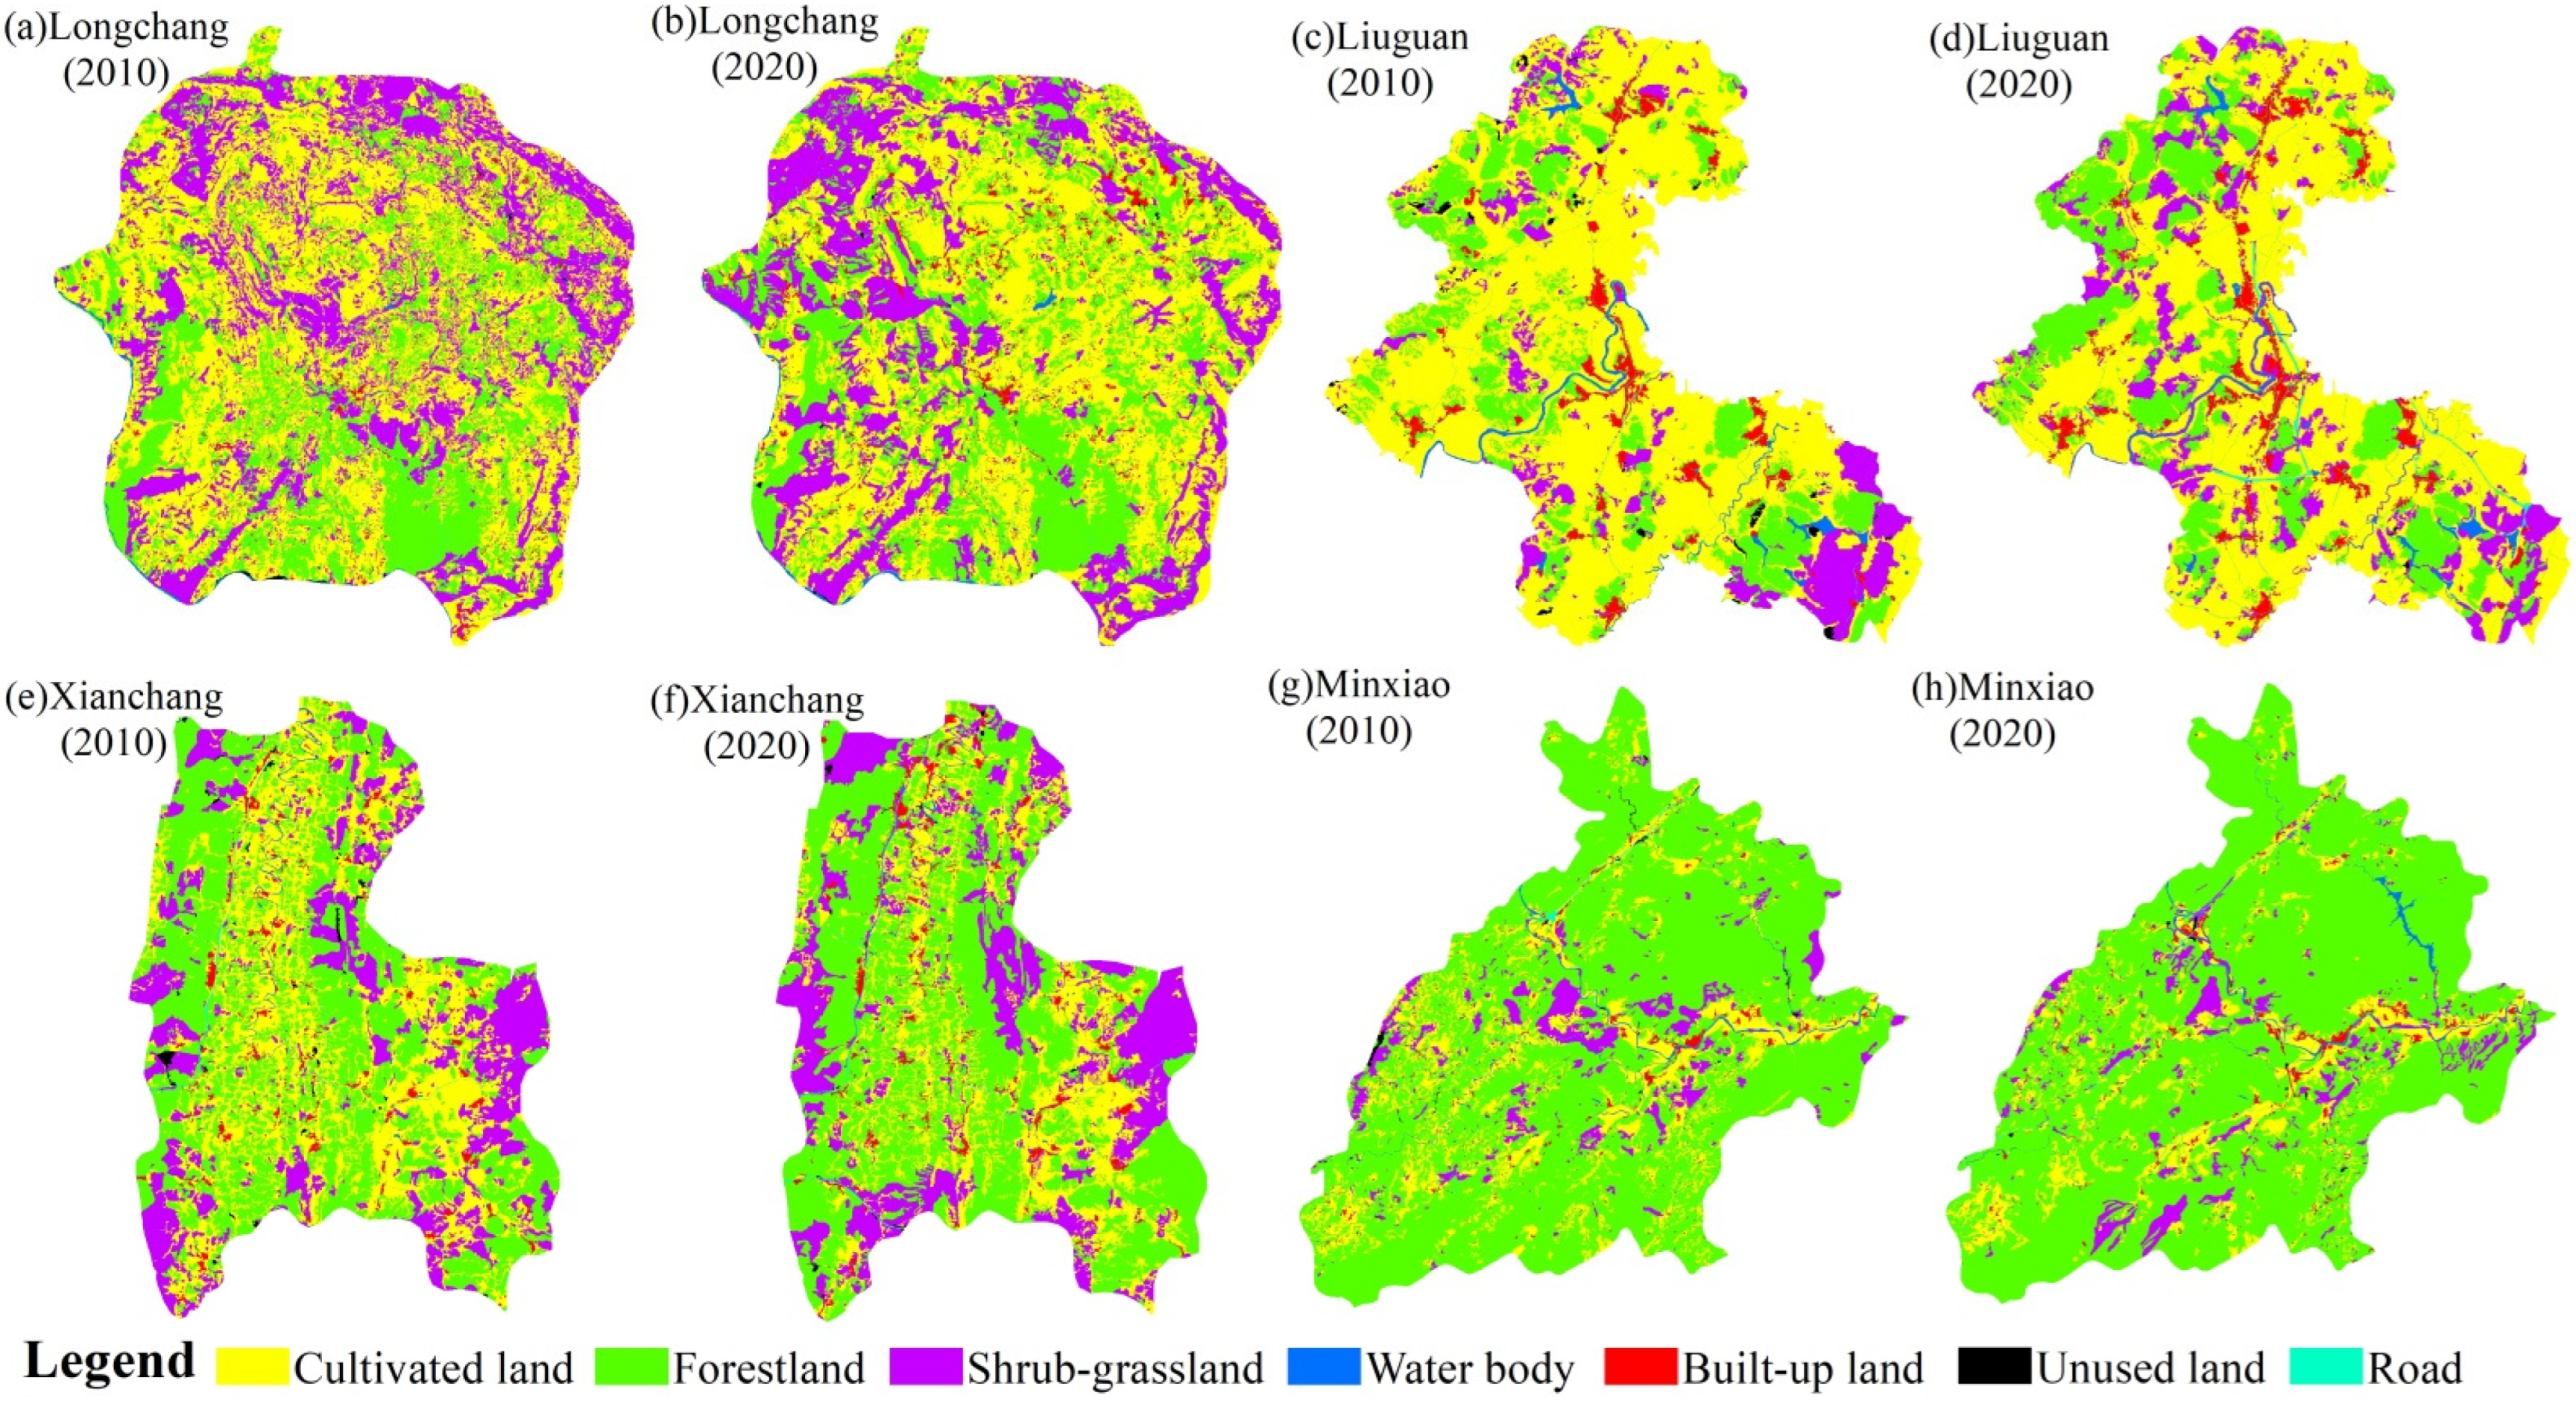
2.3.1. Land-Use Change Matrix
2.3.2. Calculation Method of the Non-Agriculturalization of Cultivated Land
2.3.3. Calculation Method of Landscape Ecological Risk
2.3.4. Correlation between the Non-Agriculturalization of Cultivated Land and Landscape Ecological Risk
3. Results
3.1. Land-Use Change Matrix
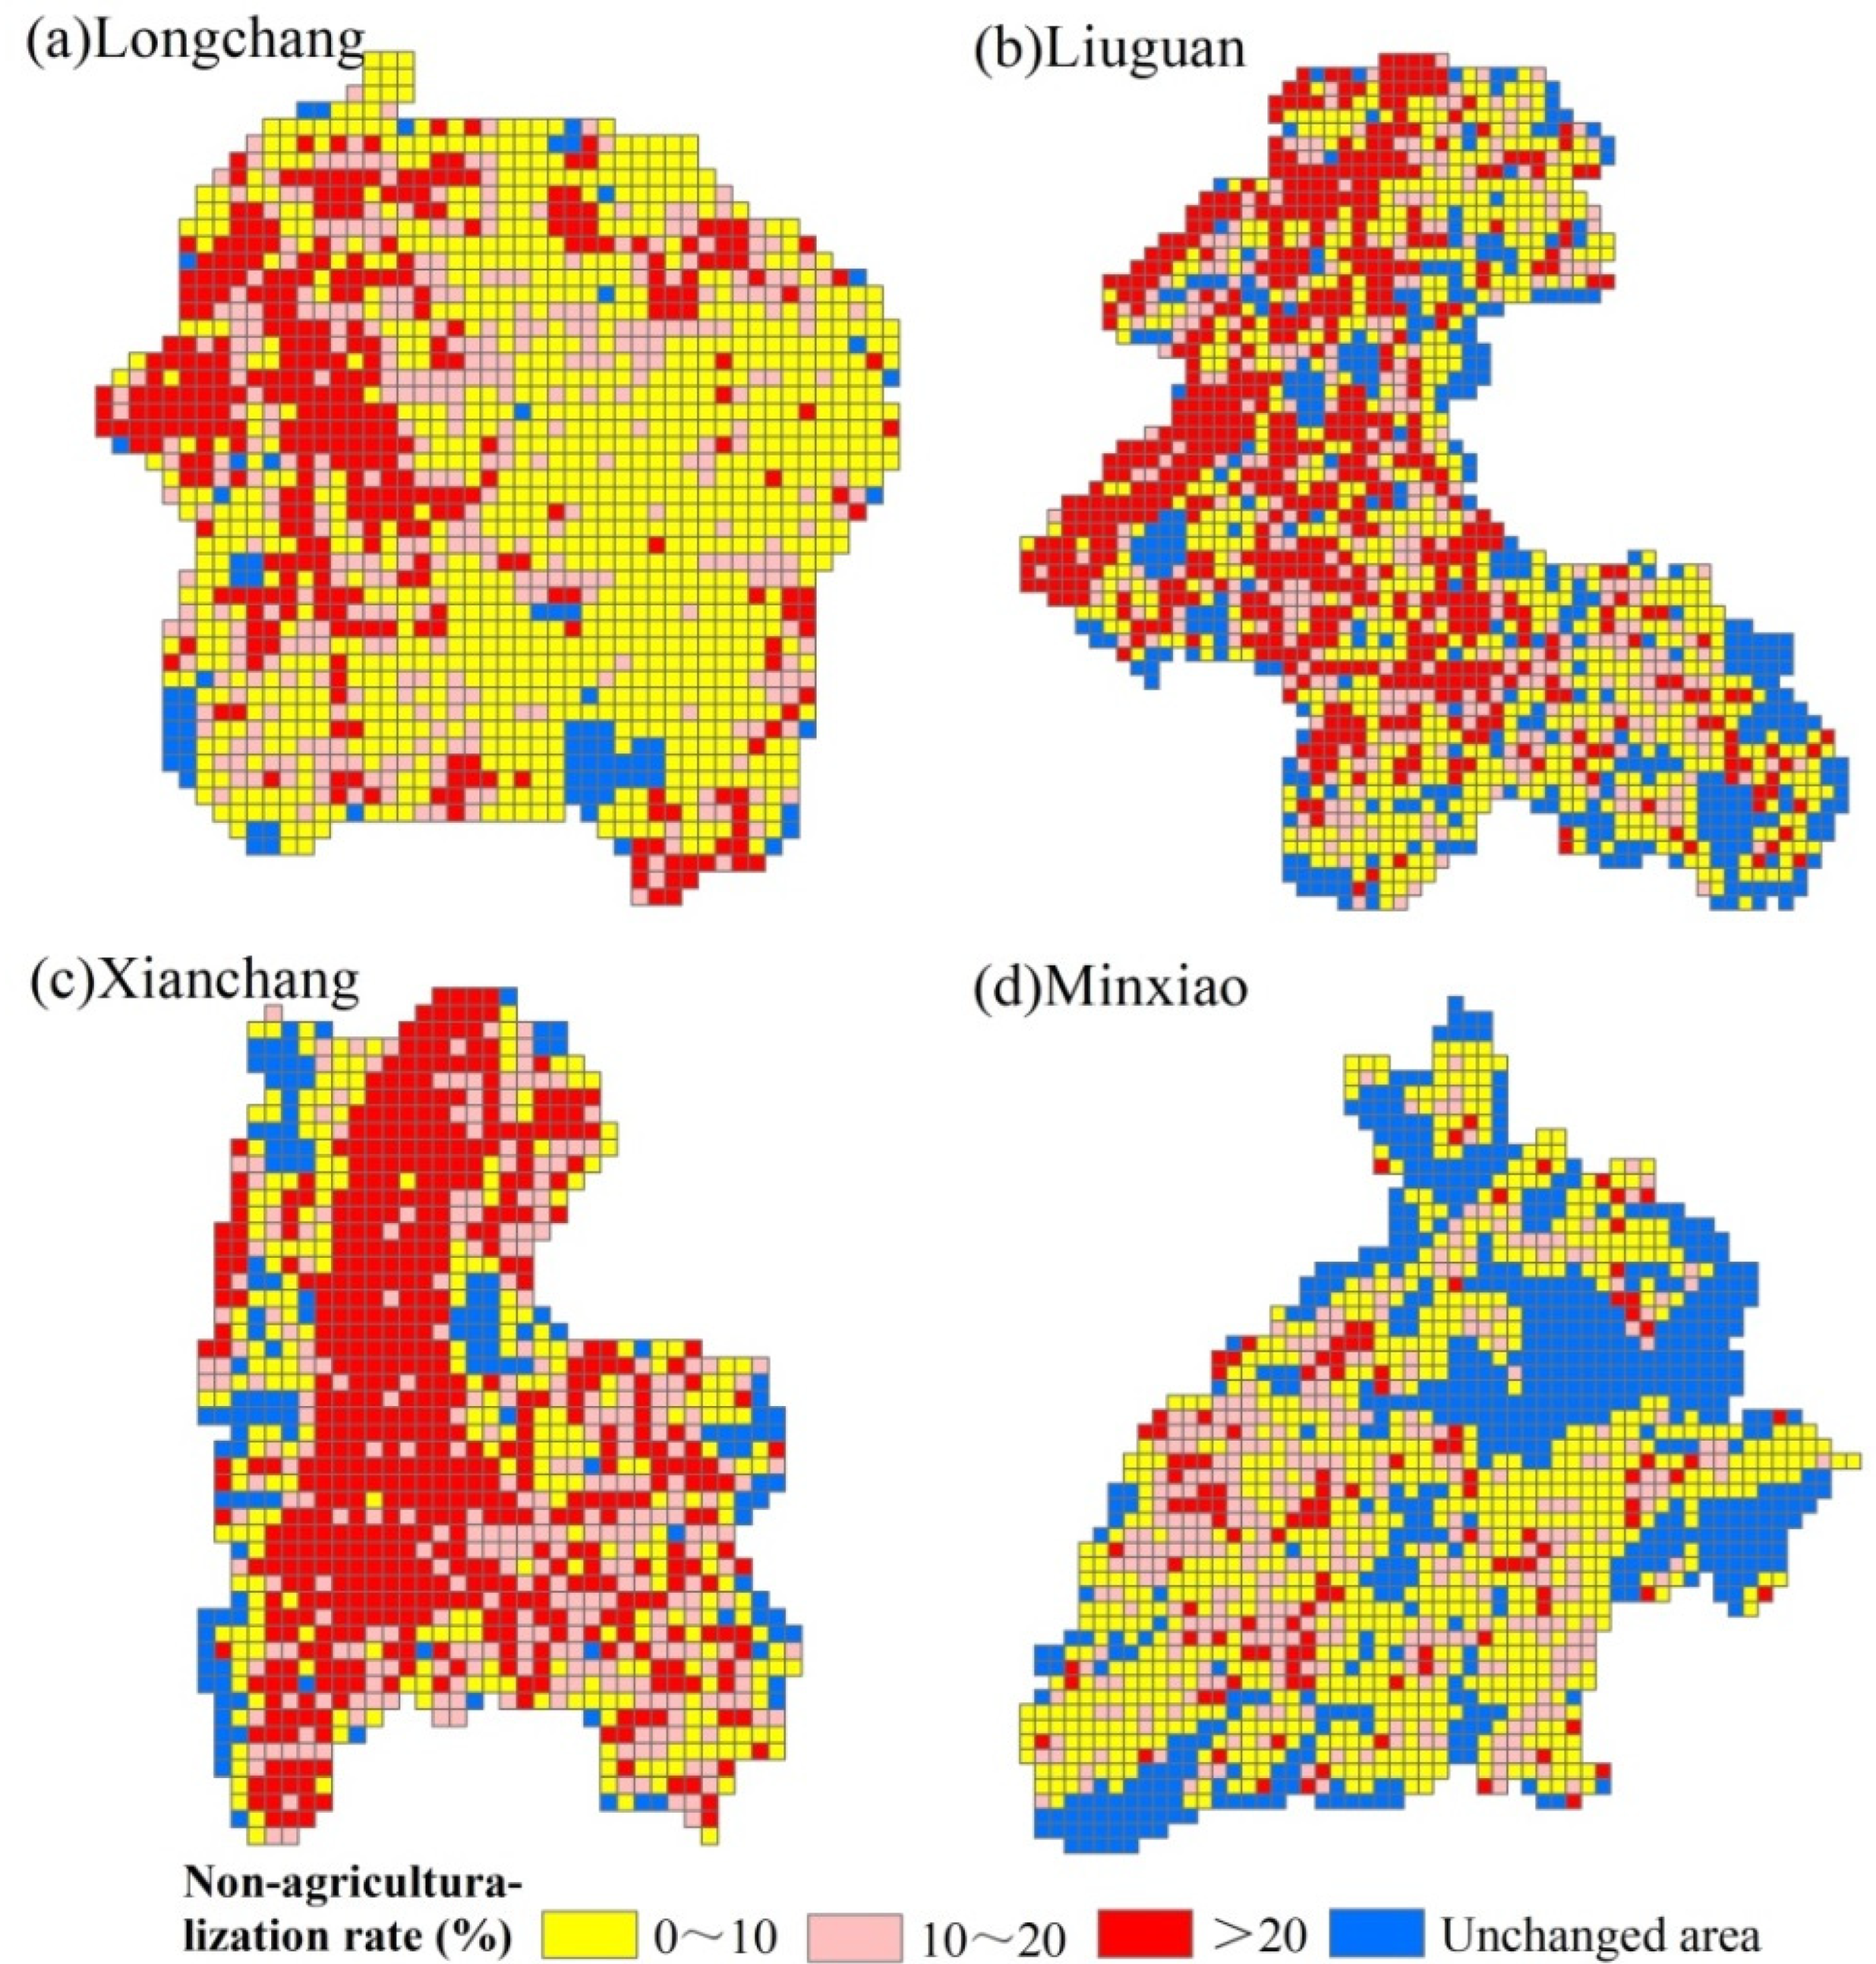
3.2. Changes in the Non-Agriculturalization of Cultivated Land
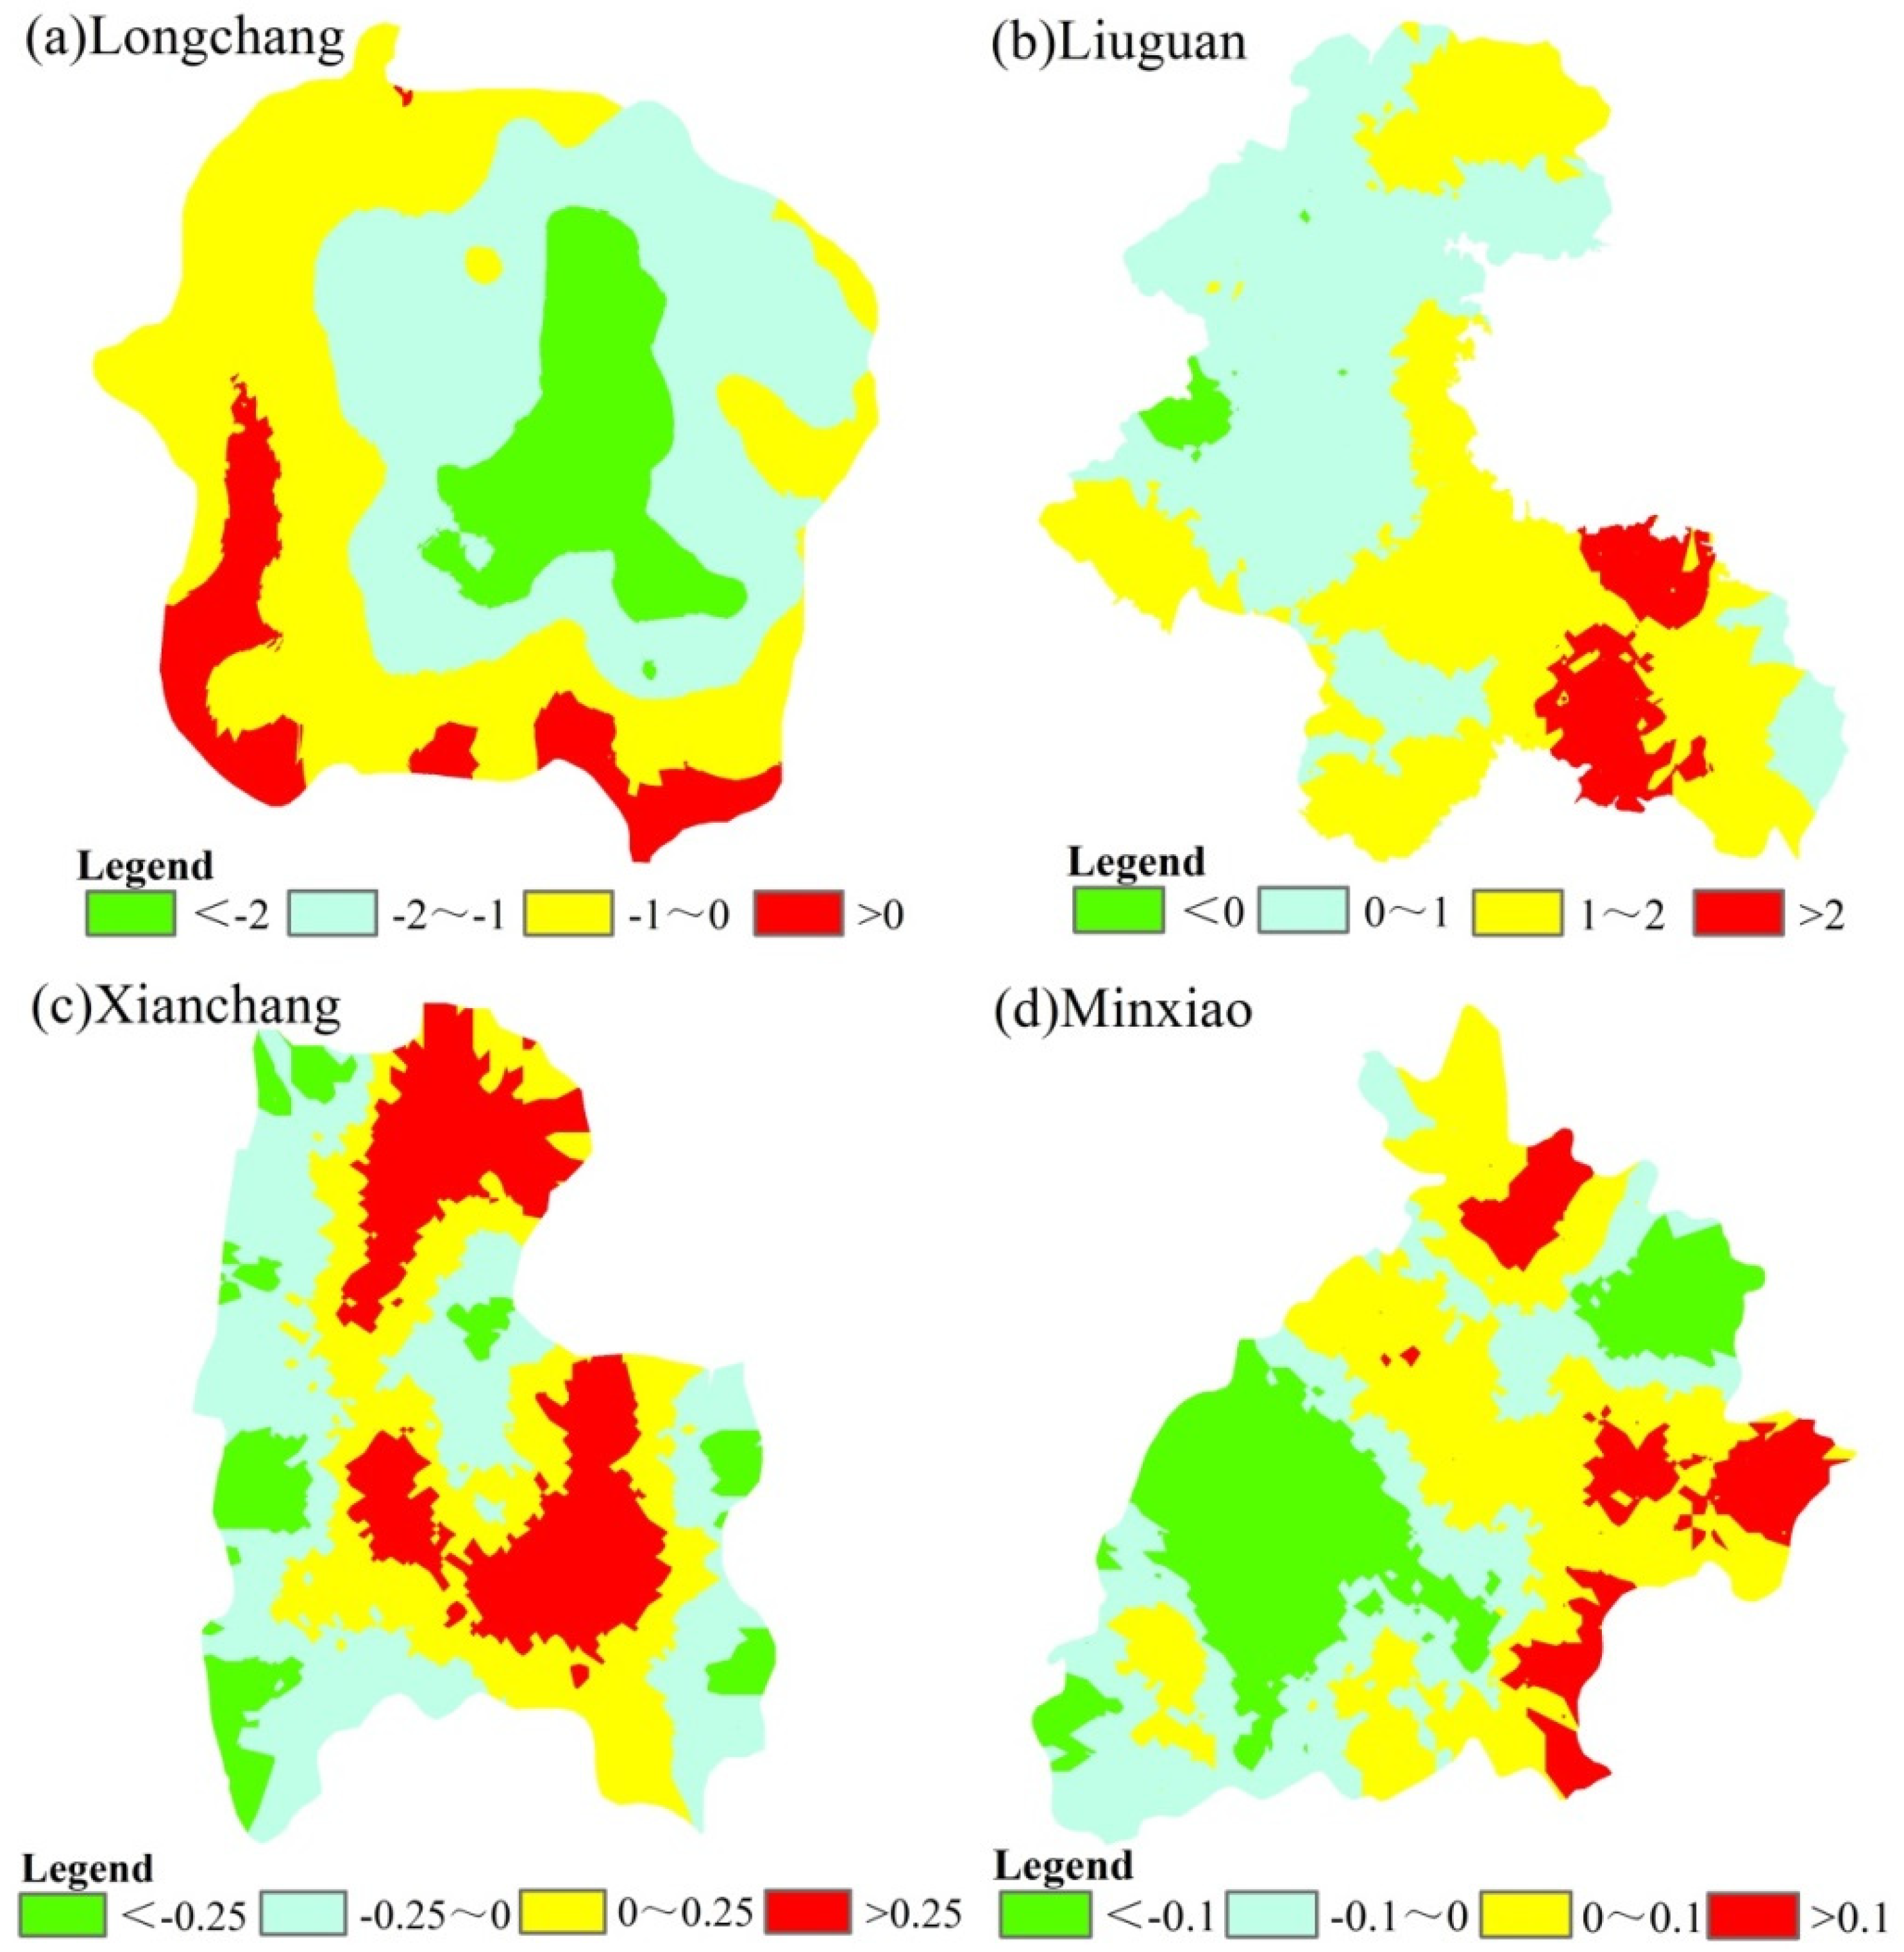
3.3. Changes of Landscape Ecological Risk
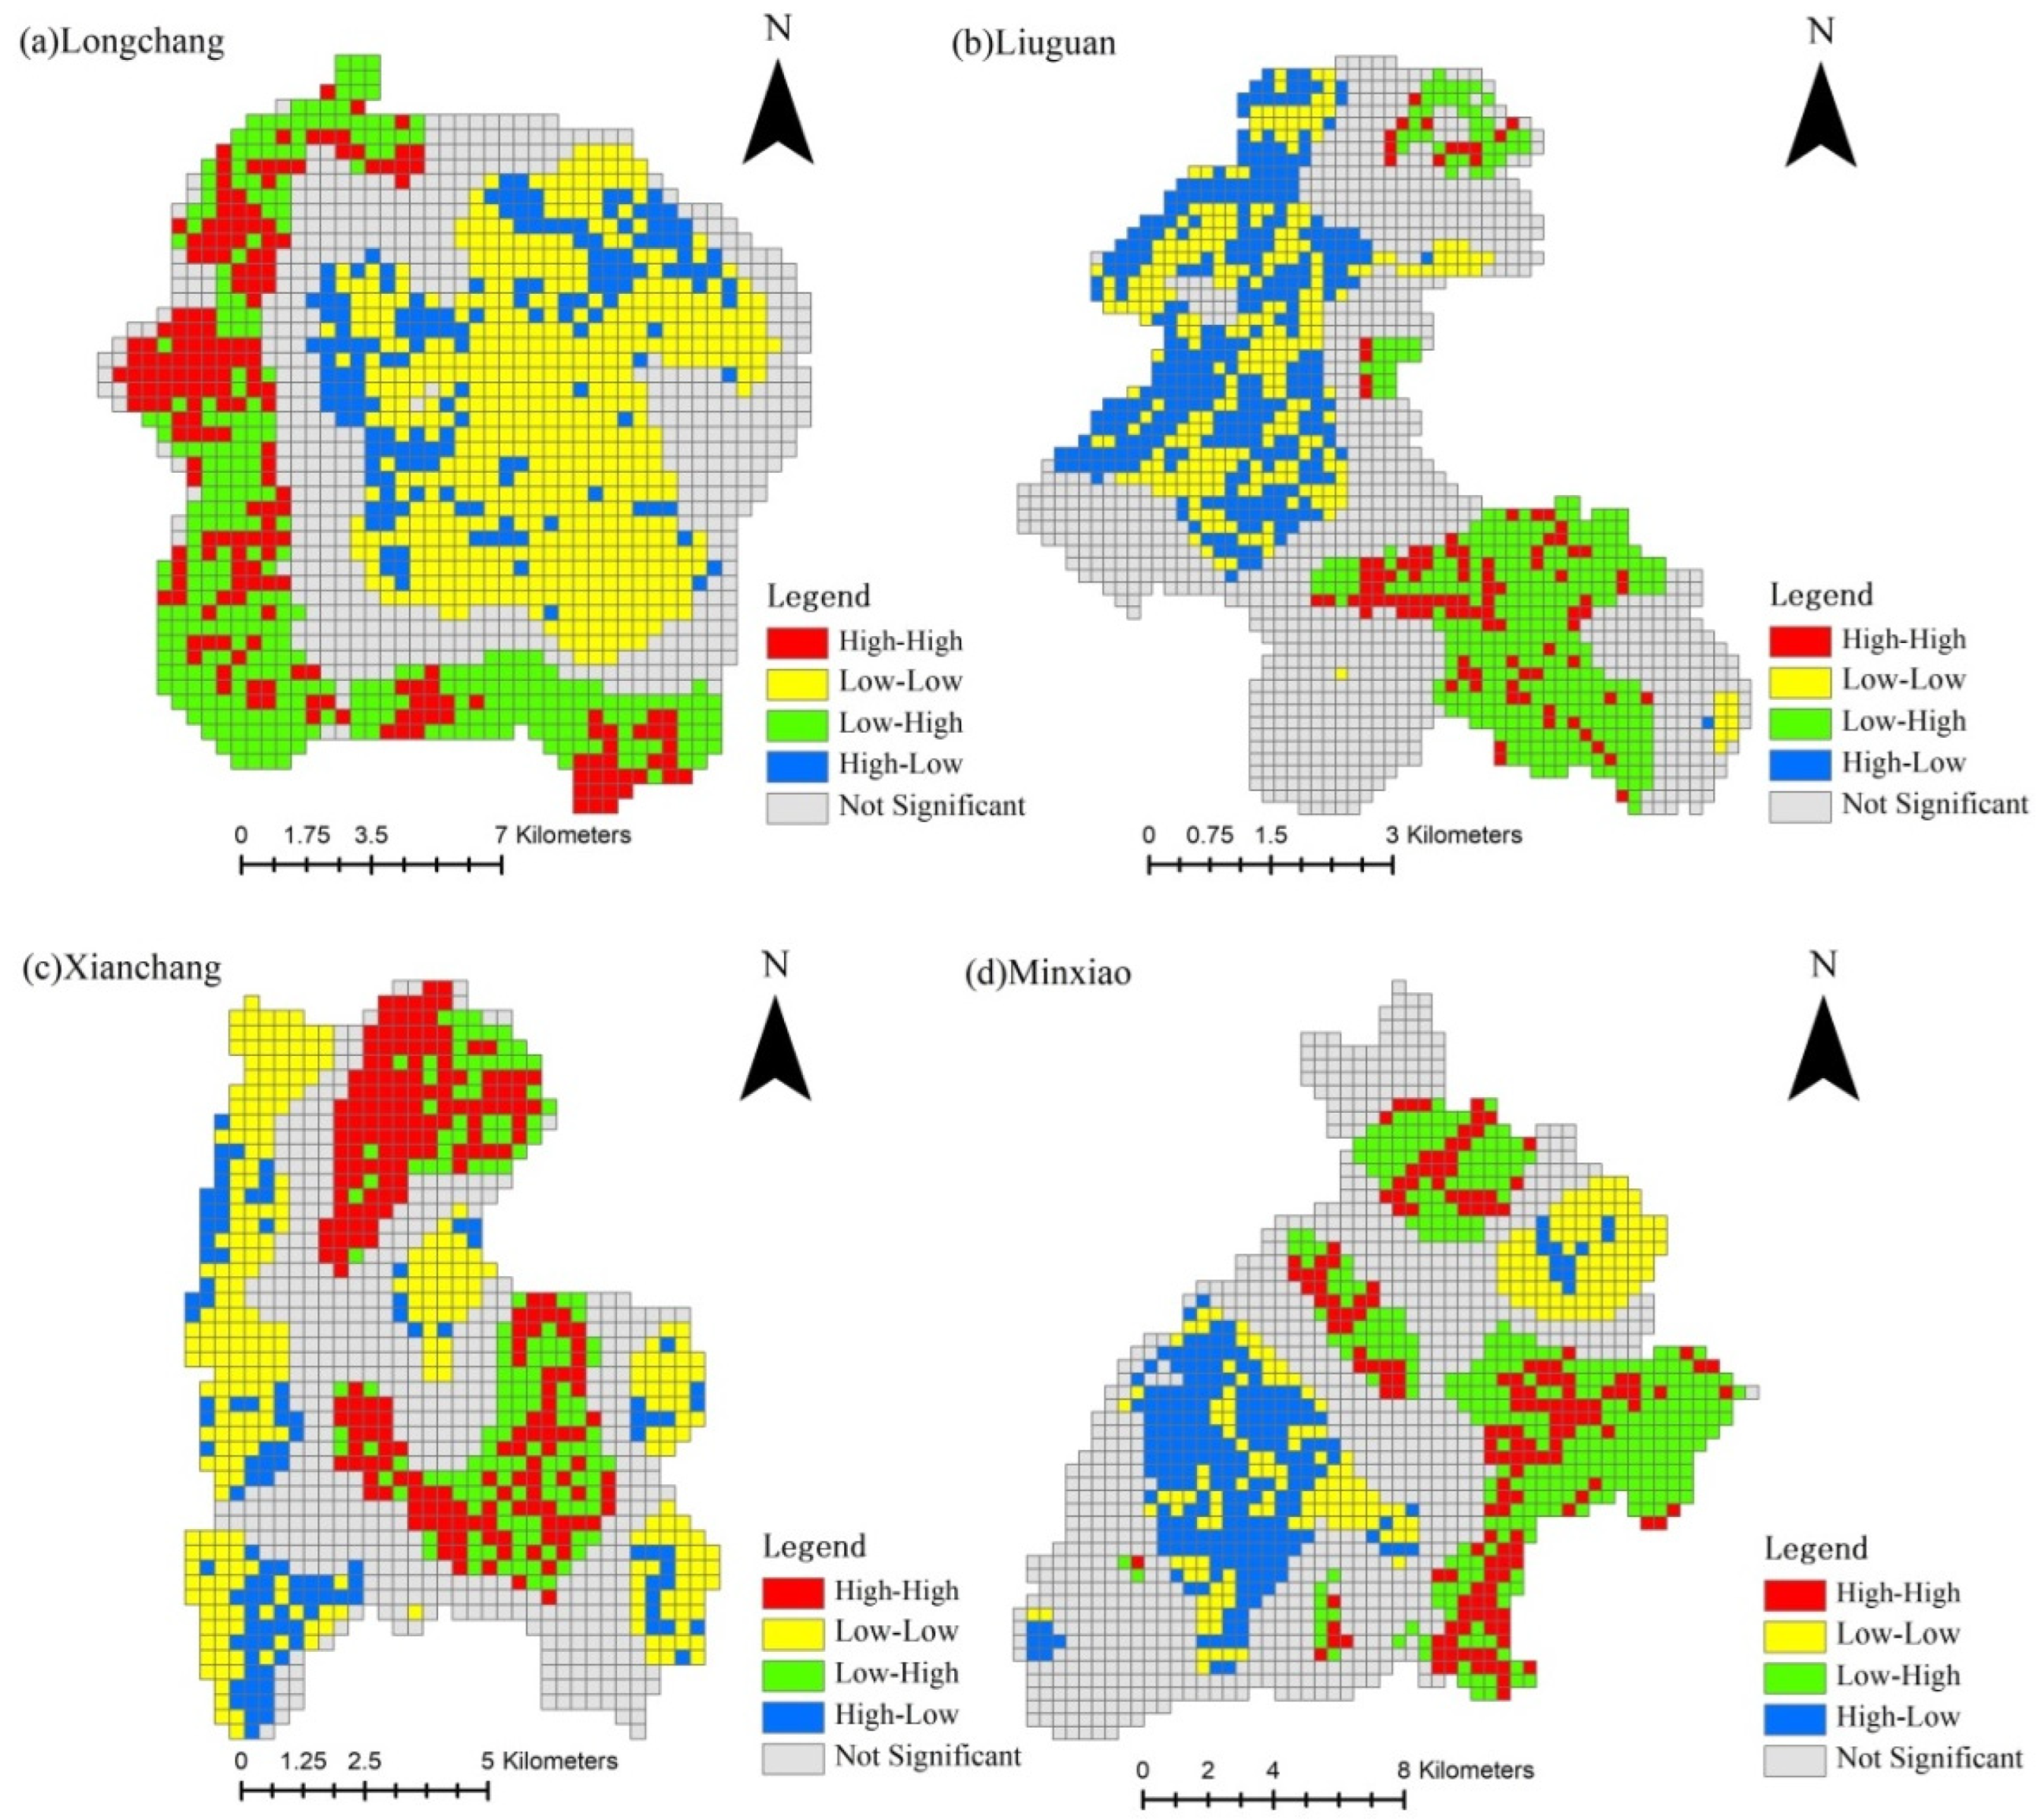
3.4. Correlation between the Non-Agriculturalization of Cultivated Land and Landscape Ecological Risk
4. Discussion
4.1. Comparison with Previous Research Results
4.2. Formation Mechanism of the Non-Agriculturalization of Cultivated Land in Karst Mountainous Areas
4.3. Land Management Policy
4.4. Limitations
5. Conclusions
Author Contributions
Funding
Data Availability Statement
Conflicts of Interest
References
- Xu, W.Y.; Jin, X.B.; Liu, J.; Zhou, Y.K. Impact of cultivated land fragmentation on spatial heterogeneity of agricultural agglomeration in China. J. Geogr. Sci. 2020, 30, 1571–1589. [Google Scholar] [CrossRef]
- Yin, G.Y.; Lou, Y.; Xie, S.; Wei, W.E. Valuation of the Response of Grain Productivity to Different Arable Land Allocation Intensities in the Land Use Planning System of China. Sustainability 2022, 14, 3109. [Google Scholar] [CrossRef]
- Ho, S.P.S.; Lin, G.C.S. Non-agricultural land use in post-reform China. China Q. 2004, 179, 758–781. [Google Scholar] [CrossRef]
- Busko, M.; Szafranska, B. Analysis of changes in land use patterns pursuant to the conversion of agricultural land to non-agricultural use in the context of the sustainable development of the Malopolska Region. Sustainability 2018, 10, 136. [Google Scholar] [CrossRef] [Green Version]
- Chen, Y.; Wang, S.; Wang, Y. Spatiotemporal evolution of cultivated land non-agriculturalization and its drivers in typical areas of southwest China from 2000 to 2020. Remote Sens. 2022, 14, 3211. [Google Scholar] [CrossRef]
- Azadi, H.; Barati, A.A.; Rafiaani, P.; Raufirad, V.; Zarafshani, K.; Mamoorian, M.; Passel, S.V.; Lebailly, P. Agricultural land conversion drivers in northeast Iran: Application of structural equation model. Appl. Spat. Anal. 2016, 9, 591–609. [Google Scholar] [CrossRef] [Green Version]
- Maryati, S.; Humaira, A.N.S.; Pratiwi, F. Spatial pattern of agricultural land conversion in West Java Province. IOP Conf. Ser. Earth Environ. Sci. 2018, 131, 012034. [Google Scholar] [CrossRef] [Green Version]
- Verhoeve, A.; Dewaelheyns, V.; Kerselaers, E.; Rogge, E.; Gulinck, H. Virtual farmland: Grasping the occupation of agricultural land by non-agricultural land uses. Land Use Policy 2015, 42, 547–556. [Google Scholar] [CrossRef]
- Tufa, D.E.; Megento, T.L. Conversion of farmland to non-agricultural land uses in peri-urban areas of Addis Ababa Metropolitan city, Central Ethiopia. Geojournal 2022. [Google Scholar] [CrossRef]
- Li, G.L.; Chen, J.; Sun, Z.Y. Non-agricultural land expansion and driving forces: A multi-temporal study of Suzhou, China. Int. J. Sustain. Dev. World Ecol. 2007, 14, 408–420. [Google Scholar] [CrossRef]
- Wang, D.C.; Sang, M.Q.; Huang, Y.; Chen, L.D.; Wei, X.W.; Chen, W.G.; Wang, F.C.; Liu, J.Y.; Hu, B.X. Trajectory analysis of agricultural lands occupation and its decoupling relationships with the growth rate of non-agricultural GDP in the Jing-Jin-Tang region, China. Environ. Dev. Sustain. 2019, 21, 799–815. [Google Scholar] [CrossRef]
- Liu, S.K.; Wang, J.J.; Lin, S.G.; Deng, S.Y.; Lu, R.C. The spatial features and migration path of cultivated land non-agriculturalization in the border areas of Guangxi Zhuang autonomous region. Chin. J. Agric. Res. Reg. Plan. 2022; in press. [Google Scholar]
- Fang, F.; Liang, H.G.; Liu, Y.S. The micro mechanism of the effect of land non-agriculturalization on rural development in typical agricultural plain region. Chin. J. Agric. Res. Reg. Plan. 2016, 37, 57–64. [Google Scholar]
- Liu, C.C.; Deng, C.X.; Li, Z.W.; Sun, H.F.; Chen, S.Q.; Zhao, H. Study on the evolution and influencing factors of the spatial pattern of rural land non-agriculturalization in typical suburban county: Taking Xiangtan county, Hunan Province as an example. Chin. J. Agric. Res. Reg. Plan. 2021, 42, 253–264. [Google Scholar]
- Li, M. The effect of land use regulations on farmland protection and non-agricultural land conversions in China. Aust. J. Agric. Resour. Econ. 2019, 63, 643–667. [Google Scholar] [CrossRef] [Green Version]
- Zhang, L.Y. The deviation and adjustments of farmland conversion in the process of urbanization in China. Reg. Econ. Rev. 2020, 3, 79–89. [Google Scholar]
- Cao, G.Z.; Liu, T.; Liu, H.; Miao, Y.B. Changing spatial and structural patterns of non-agricultural activities in outward-moving Beijing urban fringe. Chin. Geogr. Sci. 2012, 22, 718–729. [Google Scholar] [CrossRef]
- Cheng, M.Y.; Liu, Y.S. Spatial differentiation and its influencing factors of non-agricultural land in Huang-Huai-Hai plain. Areal. Res. Dev. 2019, 38, 170–176. [Google Scholar]
- Li, R.; Wu, Q.L.; Zhang, J.J.; Wen, Y.Q.; Li, Q.G. Effects of land use change of sloping farmland on characteristic of soil erosion resistance in typical karst mountainous areas of southwestern China. Pol. J. Environ. Stud. 2019, 28, 2707–2716. [Google Scholar] [CrossRef]
- Zollinger, B.; Krannich, R.S. Factors influencing farmers’ expectations to sell agricultural land for non-agricultural uses. Rural Sociol. 2002, 67, 442–463. [Google Scholar] [CrossRef]
- Wang, J.Y.; Xin, L.J.; Wang, Y.H. How farmers’ non-agricultural employment affects rural land circulation in China? J. Geogr. Sci. 2020, 30, 378–400. [Google Scholar] [CrossRef]
- Boltryk, P. Conversion of agricultural land into non- agricultural land in Poland. Ekon. Srod. 2020, 1, 40–56. [Google Scholar]
- Ye, S.J.; Song, C.Q.; Shen, S.; Gao, P.C.; Cheng, C.X.; Cheng, F.; Wan, C.J.; Zhu, D.H. Spatial pattern of arable land-use intensity in China. Land Use Policy 2020, 99, 104845. [Google Scholar] [CrossRef]
- Meng, J.J.; Zhu, L.J.; Wang, Q.; Guo, L.R.; Zhang, W.J. Influence of policy-driven land use transformation on multifunctional land use in the middle reaches of the Heihe river basin. Acta Sci. Nat. Univ. Pekin. 2020, 56, 1102–1112. [Google Scholar]
- Han, H.Q.; Yang, J.Q.; Liu, Y.; Zhang, Y.J.; Wang, J.W. Effect of the Grain for Green Project on freshwater ecosystem services under drought stress. J. Mt. Sci. 2022, 19, 974–986. [Google Scholar] [CrossRef]
- Zhu, C.L.; Zhou, Z.F.; Ma, G.X.; Yin, L.J. Spatial differentiation of the impact of transport accessibility on the multidimensional poverty of rural households in karst mountain areas. Environ. Dev. Sustain. 2022, 24, 3863–3883. [Google Scholar] [CrossRef]
- Cai, G.P.; Zhang, C.Q. Temporal and spatial analysis of land use changes based on the topography. J. Sichuan Agric. Univ. 2015, 33, 392–398. [Google Scholar]
- Wang, Z.J.; Liu, Y.; Li, Y.X.; Su, Y. Response of ecosystem health to land use changes and landscape patterns in the karst mountainous regions of southwest China. Int. J. Environ. Res. Public Health 2022, 19, 3273. [Google Scholar] [CrossRef]
- Peng, J.; Xu, Y.Q.; Cai, Y.L.; Xiao, H.L. The role of policies in land use/cover change since the 1970s in ecologically fragile karst areas of Southwest China: A case study on the Maotiaohe watershed. Environ. Sci. Policy 2011, 14, 408–418. [Google Scholar] [CrossRef]
- Xu, E.Q.; Zhang, H.Q. Human-desertification coupling relationship in a karst region of China. Land Degrad. Dev. 2021, 32, 4988–5003. [Google Scholar] [CrossRef]
- Kurucu, Y.; Chiristina, N.K. Monitoring the impacts of urbanization and industrialization on the agricultural land and environment of the Torbali, Izmir region, Turkey. Environ. Monit. Assess. 2008, 136, 289–297. [Google Scholar] [CrossRef] [PubMed]
- Tian, L.; Ge, B.Q.; Li, Y.F. Impacts of state-led and bottom-up urbanization on land use change in the peri-urban areas of Shanghai: Planned growth or uncontrolled sprawl? Cities 2017, 60, 476–486. [Google Scholar] [CrossRef]
- Yang, Z.; Liu, H.M.; Yu, B. Estimation on loss of ecological value in the process of land’s non-agriculturalization. China. Popul. Resour. Environ. 2013, 23, 146–150. [Google Scholar]
- Yang, W.J.; Liu, D.; Gong, Q.W. Estimation loss of agroecosystem service value in farmland conversion and its provincial difference in 2001–2016. Econ. Geogr. 2019, 39, 201–209. [Google Scholar]
- He, Y.H.Z.; Wang, L.; Niu, Z.; Nath, B. Vegetation recovery and recent degradation in different karst landforms of southwest China over the past two decades using GEE satellite archives. Ecol. Inform. 2022, 68, 101555. [Google Scholar] [CrossRef]
- Chen, T.T.; Peng, L.; Liu, S.Q.; Wang, Q. Land cover change in different altitudes of Guizhou-Guangxi karst mountain area, China: Patterns and drivers. J. Mt. Sci. 2017, 14, 1873–1888. [Google Scholar] [CrossRef]
- Peng, J.; Tian, L.; Zhang, Z.M.; Zhao, Y.; Green, S.M.; Quine, T.A.; Liu, H.Y.; Meersmans, J. Distinguishing the impacts of land use and climate change on ecosystem services in a karst landscape in China. Ecosyst. Serv. 2020, 46, 101199. [Google Scholar] [CrossRef]
- Xu, Y.Q.; Mcnamara, P.; Wu, Y.F.; Dong, Y. An econometric analysis of changes in arable land utilization using multinomial logit model in Pinggu district, Beijing, China. J. Environ. Manag. 2013, 128, 324–334. [Google Scholar] [CrossRef]


| Towns | Gradient I | Gradient II | Gradient III | Gradient IV | Gradient V |
|---|---|---|---|---|---|
| Longchang (karst mid-mountain) | 0°–9.01° | 9.02°–13.42° | 13.43°–18.38° | 18.39°–25.65° | 25.66°–69.67° |
| Liuguan (karst basin) | 0°–2.71° | 2.72°–4.69° | 4.70°–6.85° | 6.86°–9.97° | 9.98°–51.68° |
| Xianchang (karst trough valley) | 0°–5.54° | 5.55°–9.25° | 9.26°–13.61° | 13.62°–19.78° | 19.79°–55.94° |
| Minxiao (karst low hilly) | 0°–10.05° | 10.06°–15.87° | 15.88°–21.31° | 21.32°–27.95° | 27.96°–72.30° |
| Town | Land Use Types | Cultivated Land | Forestland | Shrub-Grassland | Water Bodies | Built-Up Land | Unused Land | Roads | Total Area in 2010 |
|---|---|---|---|---|---|---|---|---|---|
| Longchang (karst mid-mountain) | Cultivated land | 8674.70 | 951.97 | 2224.76 | 5.06 | 238.76 | 5.41 | 95.22 | 12,195.88 |
| Forestland | 832.35 | 4422.79 | 746.47 | 3.29 | 142.01 | 1.87 | 35.61 | 6184.39 | |
| Shrub-grassland | 1718.58 | 1705.13 | 3130.53 | 14.76 | 121.64 | 10.35 | 51.82 | 6752.81 | |
| Water bodies | 7.47 | 6.57 | 9.82 | 60.02 | 0.08 | 0.80 | 0.53 | 85.29 | |
| Built-up land | 76.19 | 26.38 | 29.76 | 0.01 | 287.60 | 1.14 | 8.44 | 429.52 | |
| Unused land | 6.80 | 0.62 | 2.81 | 10.80 | 0.52 | 2.44 | 0.82 | 24.82 | |
| Roads | 97.01 | 39.61 | 33.77 | 0.88 | 17.73 | 0.71 | 132.96 | 322.67 | |
| Total area in 2020 | 11,413.10 | 7153.07 | 6177.92 | 94.82 | 808.34 | 22.72 | 325.40 | 25,995.38 | |
| Liuguan (karst basin) | Cultivated land | 1818.86 | 251.98 | 255.48 | 14.26 | 78.34 | 0.59 | 34.25 | 2453.75 |
| Forestland | 119.61 | 542.28 | 105.39 | 2.18 | 10.86 | 0.79 | 3.23 | 784.34 | |
| Shrub-grassland | 204.60 | 95.36 | 143.36 | 1.91 | 4.72 | 0.00 | 3.89 | 453.83 | |
| Water bodies | 15.17 | 2.83 | 11.05 | 33.56 | 0.49 | 0.00 | 1.08 | 64.18 | |
| Built-up land | 20.47 | 10.22 | 11.39 | 0.71 | 104.61 | 0.04 | 1.15 | 148.58 | |
| Unused land | 6.77 | 6.52 | 13.93 | 0.30 | 0.17 | 0.03 | 0.16 | 27.88 | |
| Roads | 0.65 | 0.05 | 0.12 | 0.03 | 0.45 | 0.00 | 27.67 | 28.96 | |
| Total area in 2020 | 2186.12 | 909.24 | 540.71 | 52.95 | 199.62 | 1.45 | 71.43 | 3961.52 | |
| Xianchang (karst trough valley) | Cultivated land | 1520.95 | 1221.56 | 530.27 | 22.65 | 140.81 | 6.60 | 21.49 | 3464.34 |
| Forestland | 655.70 | 2954.71 | 765.72 | 5.46 | 43.28 | 8.49 | 19.17 | 4452.53 | |
| Shrub-grassland | 234.41 | 808.00 | 992.40 | 0.77 | 16.96 | 3.62 | 4.51 | 2060.67 | |
| Water bodies | 25.27 | 8.56 | 2.82 | 2.87 | 3.55 | 0.21 | 0.19 | 43.46 | |
| Built-up land | 79.20 | 64.10 | 23.92 | 2.23 | 69.10 | 0.98 | 4.04 | 243.57 | |
| Unused land | 6.91 | 16.31 | 22.15 | 0.01 | 0.78 | 0.65 | 1.33 | 48.13 | |
| Roads | 5.40 | 9.13 | 6.33 | 0.25 | 5.65 | 0.16 | 48.35 | 75.27 | |
| Total area in 2020 | 2527.83 | 5082.36 | 2343.61 | 34.24 | 280.12 | 20.71 | 99.08 | 10,387.96 | |
| Minxiao (karst low hilly) | Cultivated land | 2532.27 | 1087.71 | 329.43 | 47.16 | 150.23 | 9.98 | 93.33 | 4250.11 |
| Forestland | 443.17 | 17774.27 | 667.29 | 43.65 | 64.10 | 12.08 | 85.10 | 19,089.67 | |
| Shrub-grassland | 119.29 | 1129.55 | 343.23 | 8.08 | 5.31 | 0.23 | 7.62 | 1613.31 | |
| Water bodies | 21.11 | 13.65 | 12.93 | 95.73 | 3.31 | 0.85 | 4.51 | 152.09 | |
| Built-up land | 29.60 | 21.26 | 8.68 | 1.70 | 210.11 | 0.81 | 9.72 | 281.89 | |
| Unused land | 6.87 | 19.86 | 18.26 | 3.95 | 1.29 | 1.54 | 3.11 | 54.88 | |
| Roads | 19.97 | 27.37 | 12.81 | 4.23 | 5.92 | 0.33 | 62.42 | 133.06 | |
| Total area in 2020 | 3172.28 | 20,073.68 | 1392.63 | 204.50 | 440.26 | 25.82 | 265.83 | 25,575.00 |
| Town | Rate of Conversion from Cultivated Land to Ecological Land | Rate of Conversion from Cultivated Land to Living Land | Total Rate of Conversion from Cultivated Land to Non-Cultivated Land |
|---|---|---|---|
| Longchang (karst mid-mountain) | 26.02 | 2.71 | 28.73 |
| Liuguan (karst basin) | 21.36 | 4.55 | 25.91 |
| Xianchang (karst trough valley) | 51.43 | 4.72 | 56.15 |
| Minxiao (karst low hilly) | 34.69 | 5.59 | 40.28 |
| Town | Conversion Types | Gradient I | Gradient II | Gradient III | Gradient IV | Gradient V |
|---|---|---|---|---|---|---|
| Longchang (karst mid-mountain) | Rate of conversion from cultivated land to ecological land | 3.25 | 3.77 | 4.67 | 6.33 | 8.00 |
| Rate of conversion from cultivated land to living land | 0.79 | 0.69 | 0.54 | 0.44 | 0.25 | |
| Total rate of conversion from cultivated land to non-cultivated land | 4.04 | 4.45 | 5.20 | 6.77 | 8.25 | |
| Liuguan (karst basin) | Rate of conversion from cultivated land to ecological land | 2.78 | 3.61 | 4.20 | 5.15 | 5.63 |
| Rate of conversion from cultivated land to living land | 1.27 | 1.05 | 1.02 | 0.61 | 0.59 | |
| Total rate of conversion from cultivated land to non-cultivated land | 4.04 | 4.66 | 5.22 | 5.76 | 6.22 | |
| Xianchang (karst trough valley) | Rate of conversion from cultivated land to ecological land | 12.44 | 12.43 | 10.81 | 8.77 | 6.98 |
| Rate of conversion from cultivated land to living land | 2.16 | 1.38 | 0.75 | 0.28 | 0.14 | |
| Total rate of conversion from cultivated land to non-cultivated land | 14.60 | 13.81 | 11.56 | 9.05 | 7.12 | |
| Minxiao (karst low hilly) | Rate of conversion from cultivated land to ecological land | 10.81 | 9.49 | 7.24 | 5.10 | 2.04 |
| Rate of conversion from cultivated land to living land | 3.38 | 1.15 | 0.63 | 0.33 | 0.10 | |
| Total rate of conversion from cultivated land to non-cultivated land | 14.19 | 10.64 | 7.87 | 5.43 | 2.14 |
| Conversion Type | Longchang (Karst Mid-Mountain) | Liuguan (Karst Basin) | Xianchang (Karst Trough Valley) | Minxiao (Karst Low Hilly) |
|---|---|---|---|---|
| Conversion to forestland | 7.81 | 10.27 | 35.26 | 25.59 |
| Conversion to shrub-grassland | 18.24 | 10.41 | 15.31 | 7.75 |
| Conversion to water bodies | 0.04 | 0.58 | 0.65 | 0.91 |
| Conversion to unused land | 0.04 | 0.02 | 0.19 | 0.23 |
| Conversion to built-up land | 1.96 | 3.19 | 4.06 | 3.53 |
| Conversion to roads | 0.78 | 1.40 | 1.62 | 2.20 |
| Towns | Gradient I | Gradient II | Gradient III | Gradient IV | Gradient V | Total Area |
|---|---|---|---|---|---|---|
| Longchang (karst mid-mountain) | −1.4018 | −1.2992 | −1.1084 | −0.8274 | −0.4499 | −1.0180 |
| Liuguan (karst basin) | 1.2768 | 1.0701 | 0.9876 | 0.9398 | 0.8968 | 1.0344 |
| Xianchang (karst trough valley) | 0.1763 | 0.133 | 0.0555 | −0.0402 | −0.0327 | 0.0606 |
| Minxiao (karst low hilly) | −0.0626 | −0.0549 | −0.0447 | −0.0322 | −0.0247 | −0.0373 |
| Town | Gradient I | Gradient II | Gradient III | Gradient IV | Gradient V | Total Area |
|---|---|---|---|---|---|---|
| Longchang (karst mid-mountain) | −0.197 ** | −0.193 ** | −0.186 ** | −0.165 ** | −0.086 ** | −0.171 ** |
| Liuguan (karst basin) | −0.280 ** | −0.281 ** | −0.290 ** | −0.303 ** | −0.322 ** | −0.297 ** |
| Xianchang (karst trough valley) | −0.325 ** | −0.323 ** | −0.315 ** | −0.295 ** | −0.291 ** | −0.334 ** |
| Minxiao (karst low hilly) | −0.151 ** | −0.149 ** | −0.143 ** | −0.132 ** | −0.127 ** | −0.146 ** |
Publisher’s Note: MDPI stays neutral with regard to jurisdictional claims in published maps and institutional affiliations. |
© 2022 by the authors. Licensee MDPI, Basel, Switzerland. This article is an open access article distributed under the terms and conditions of the Creative Commons Attribution (CC BY) license (https://creativecommons.org/licenses/by/4.0/).
Share and Cite
Han, H.; Peng, H.; Li, S.; Yang, J.; Yan, Z. The Non-Agriculturalization of Cultivated Land in Karst Mountainous Areas in China. Land 2022, 11, 1727. https://doi.org/10.3390/land11101727
Han H, Peng H, Li S, Yang J, Yan Z. The Non-Agriculturalization of Cultivated Land in Karst Mountainous Areas in China. Land. 2022; 11(10):1727. https://doi.org/10.3390/land11101727
Chicago/Turabian StyleHan, Huiqing, Huirong Peng, Song Li, Jianqiang Yang, and Zhenggang Yan. 2022. "The Non-Agriculturalization of Cultivated Land in Karst Mountainous Areas in China" Land 11, no. 10: 1727. https://doi.org/10.3390/land11101727