Article

Land Use and Land Cover Change Assessment and Future Predictions in the Matenchose Watershed, Rift Valley Basin, Using CA-Markov Simulation

by
Markos Mathewos
1,*,
Semaria Moga Lencha
1,2,* and
Misgena Tsegaye
1
1
Faculty of Biosystems and Water Resource Engineering, Institute of Technology, Hawassa University, Hawassa P.O. Box 05, Ethiopia
2
Faculty of Agriculture and Environmental Sciences, University of Rostock, 18051 Rostock, Germany
*
Authors to whom correspondence should be addressed.
Land 2022, 11(10), 1632; https://doi.org/10.3390/land11101632
Submission received: 24 August 2022 / Revised: 16 September 2022 / Accepted: 19 September 2022 / Published: 22 September 2022
(This article belongs to the Special Issue Earth Observation (EO) for Land Degradation and Disaster Monitoring)

Abstract

:
Land use and land cover change (LULC) is known worldwide as a key factor of environmental modification that significantly affects natural resources. The aim of this study was to evaluate the dynamics of land use and land cover in the Matenchose watershed from the years 1991, 2003, and 2020, and future prediction of land use changes for 2050. Landsat TM for 1991, ETM+ for 2003, and Landsat-8 OLI were used for LULC classification for 2020. A supervised image sorting method exhausting a maximum likelihood classification system was used, with the application using ERDAS Imagine software. Depending on the classified LULC, the future LULC 2050 was predicted using CA-Markov and Land Change Models by considering the different drivers of LULC dynamics. The 1991 LULC data showed that the watershed was predominantly covered by grassland (35%), and the 2003 and 2020 LULC data showed that the watershed was predominantly covered by cultivated land (36% and 52%, respectively). The predicted results showed that cultivated land and settlement increased by 6.36% and 6.53%, respectively, while forestland and grassland decreased by 63.76% and 22.325, respectively, from 2020 to 2050. Conversion of other LULC categories to cultivated land was most detrimental to the increase in soil erosion, while forest and grassland were paramount in reducing soil loss. The concept that population expansion and relocation have led to an increase in agricultural land and forested areas was further reinforced by the findings of key informant interviews. This study result might help appropriate decision making and improve land use policies in land management options.

1. Introduction

Land use and land cover (LULC) is a term that refers to both land use categories and different types of land cover. The material that physically shelters the terrestrial surface is referred to as the land cover. Human activities on the land are known as land use, and it typically but not always has something to do with land cover [1]. Changes in land use and land cover are a vital part of current sustainable land conservation and environmental change supervising strategies [2]. Changes in LULC are pervasive, quickening, and taking place at the local, regional, and global levels. LULC dynamics are a pervasive, quickening, and important process that is primarily fueled by human activity and results in modifications that have an impact on people’s quality of life.
The LULC dynamics affect the availability of many crucial resources, including water, soil, and vegetation. These modifications have adverse effects [3]. Ethiopia’s natural resources are impacted by a number of interconnected problems, including population increase, agricultural expansion, emigration, resettlement, rapid urbanization, extreme weather, and environmental degradation [4]. The severity of most erosion processes has been demonstrated to increase as a result of deforestation and the establishment of permanent agriculture, according to studies conducted in northern Ethiopia [5]. Thus, it suggests that at the local, national, and international levels, human activity is the principal driver of ecological disturbance and climate change. Land use and land cover changes are projected to have a considerable influence on ecosystems and natural resources, notably by accelerating soil erosion [6]. Soil erosion rates are influenced by the type of land use, as well as the overall consequences of land use and conservation. Poor land protection can exacerbate soil erosion, and human-dominated landscapes are more vulnerable to it than other types of landscapes [7]. The most dangerous shift in land use was found to be the development of agricultural land at the expense of grassland and shrublands, which resulted in the greatest change in soil erosion intensity [4,8,9].
The highlands of the surrounding hills, perennial and ephemeral rivers, and Lake Boyo frequently flood the Matenchose watershed. Due to this, flora is harmed, livestock and livelihoods are affected, wetlands are destroyed, cultivated land is damaged, deforestation occurs, cultivated land is expanded, overgrazing occurs, and the population grows.
In addition, there is a lack of complete information on the dynamics of changes in land use changes and its drivers over three decades in the studied watershed, the environment, the accessibility of various goods and services for human, livestock, and agricultural production, and knowledge about the implications of future LULC predictions in the studied watershed.
CLUMondo allocates future land change in locations with a highest preference for a defined land system, the relationships between the spatial occurrence of a specific land system and location factors [10] used to explore land management practices in Mediterranean landscapes.
The FLUS model is applicable for exploring the impacts of climate change and human activities on future land use dynamics for the simulation of multiple LUCC dynamics [11], aimed at stimulating urban growth to explore the model and impact of urban enlargement in the city [12,13]
SLEUTH is a bottom-up approach and it is not dependent on intensive preliminary studies regarding the general causes of urban growth in a study area or the location-specific driving forces [14]. SLEUTH, among the many models, is the most popular model used for modeling and forecasting city expansion. It has been a popular CA model for studying land use change, especially urban growth in Ethiopian cities [13,15].
Markov Chain and Cellular Automata modeling are effective ways to monitor and predict land use change and urban expansion as compared with other models in the prediction of land use changes [16]. A Markov Chain model is commonly used to quantify transition probabilities of multiple land cover categories from discrete time steps. These probabilities are then used with a CA model to predict spatially explicit changes over time [17].
The Cellular Automata-Markov Chain (CA-MC) model is one of the most commonly used and effective methods for modeling the spatiotemporal change in LULC [18,19,20]. It is capable of simulating multi-directional LULC change analysis and provides ways for projecting different future scenarios [21,22]; therefore, due to the abovementioned factors, the CA-Markov model is selected for this study to simulate LULC changes in 2020 and to predict 2050 in the Matenchose watershed.
Among different models, the Markov Chain and Cellular Automata model is one of the most effective land use change simulation models, which is known as a bottom-up approach. As a user-friendly model for future LULC prediction through the identification of dynamics of complex systems and prediction of the future spatial model by taking into account both physical and socioeconomic variables under consideration, it fits this study.
In the Ethiopian Rift Valley, alarming trends in LULC change have been observed due to diverse driving factors, namely increasing population and unwise utilization of natural resources [21,23].
The spatiotemporal variation in LULC is expected in the future, yet no study has attempted to simulate the future LULC dynamics and their effect on the Matenchose watershed. This study identified a lack of studies focused on predicting future trends of LULC in the watershed. Moreover, in the Ethiopian context of the Rift Valley Basin, a limited number of studies tried to model the future trends of LULC changes [24,25,26,27].
Evaluating trends of historical LULC changes and predicting future 2050 LULC with the Cellular Automata- Markov Chain model was useful for the implementation of effective and efficient sustainable natural resource management practices, spatial land management, decision making, and policy development [28]. Therefore, this particular study focused on evaluating the trend of LULC change, assessing and analyzing LULC change dynamics, and predicting the future fate of LULC.

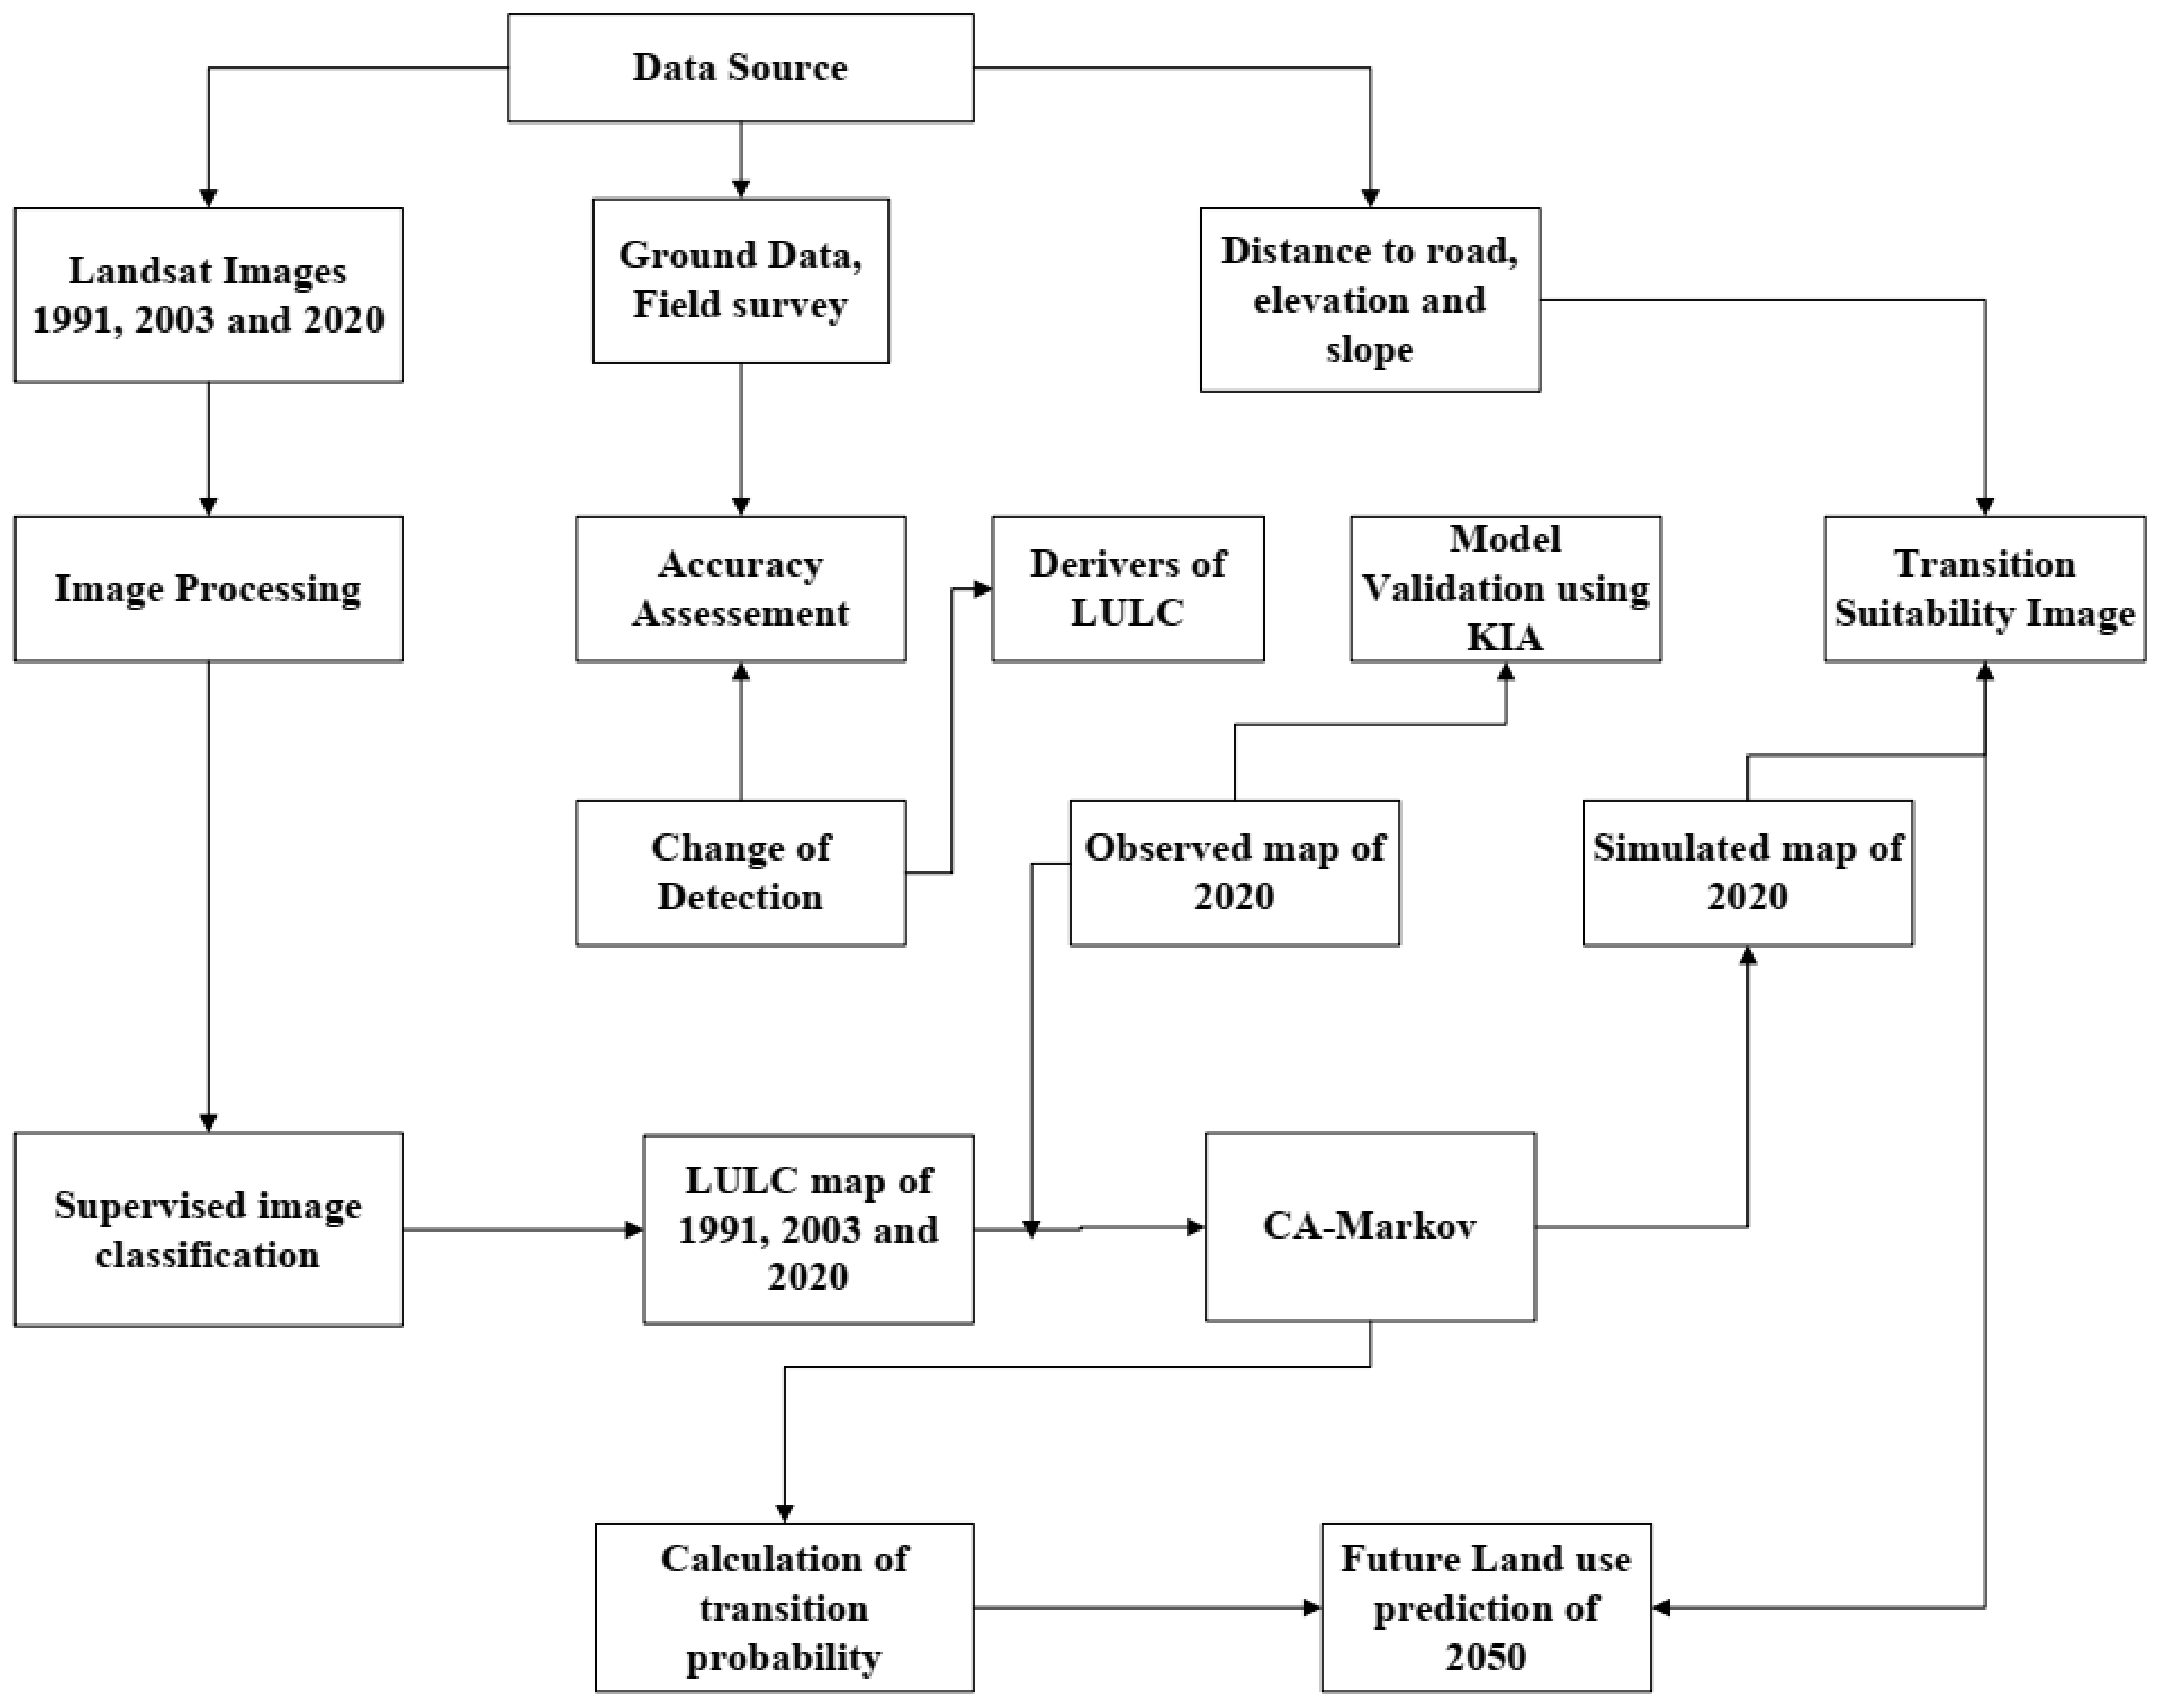
2. Materials and Methods

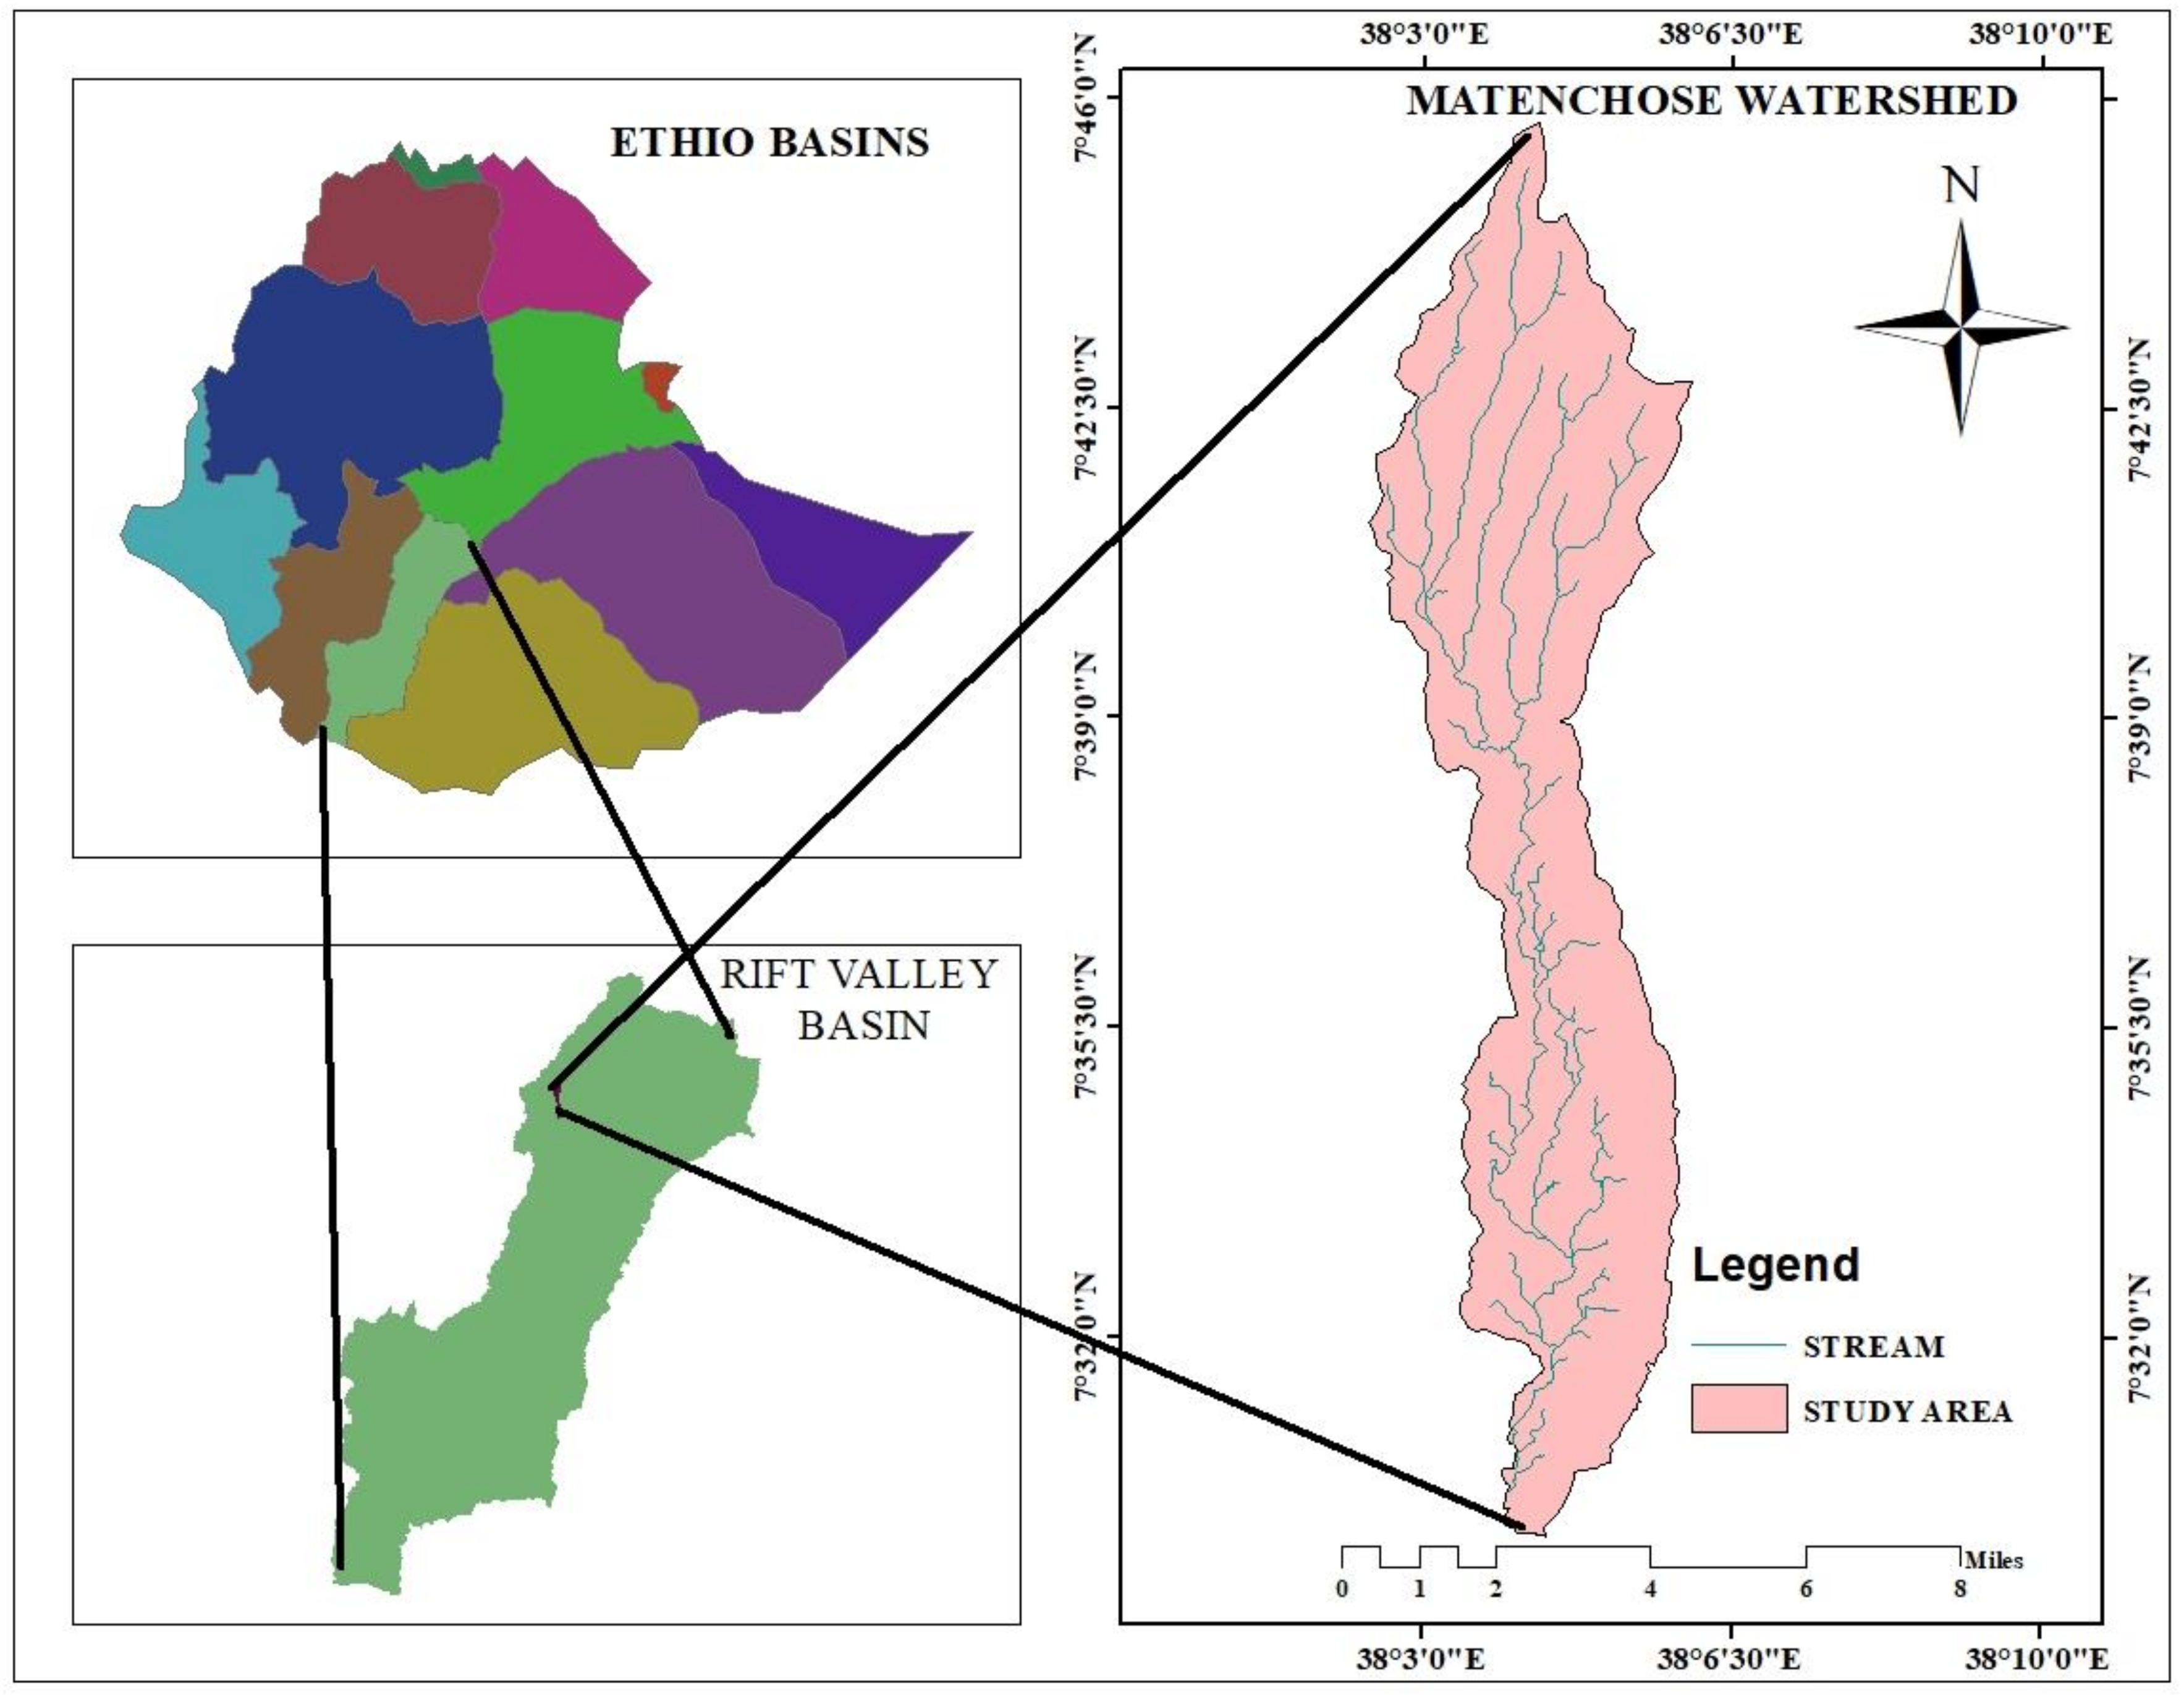
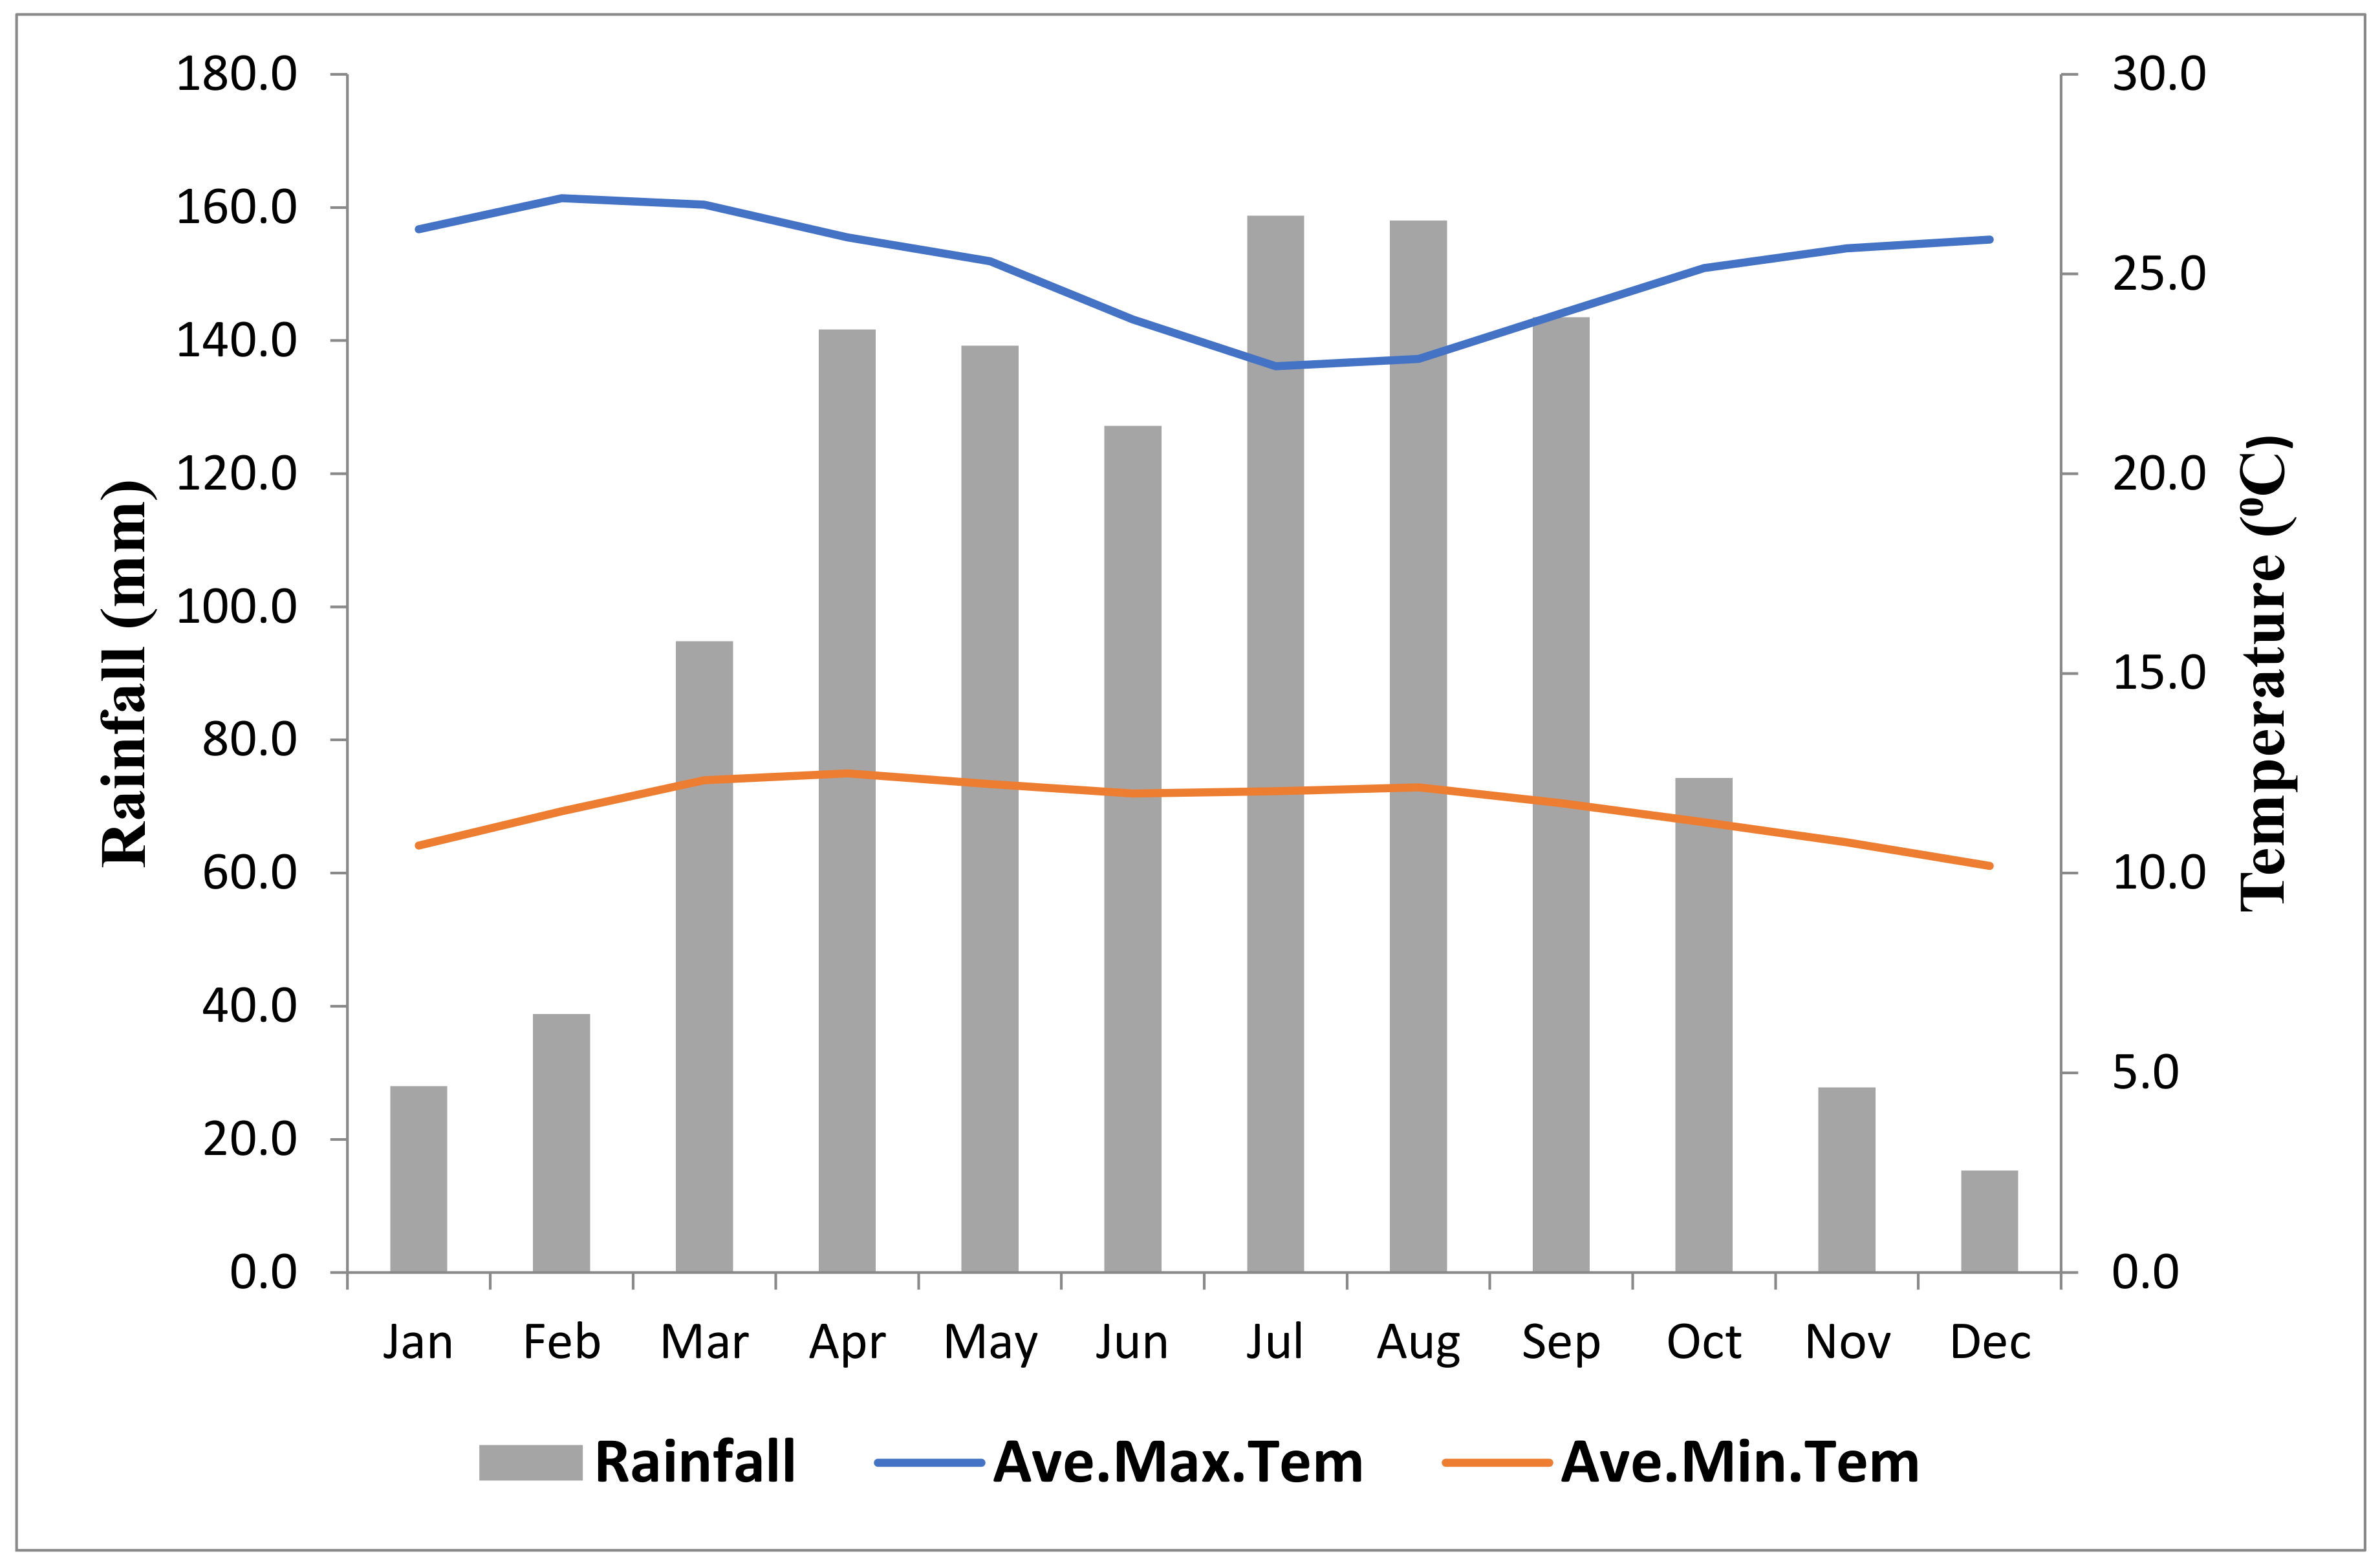
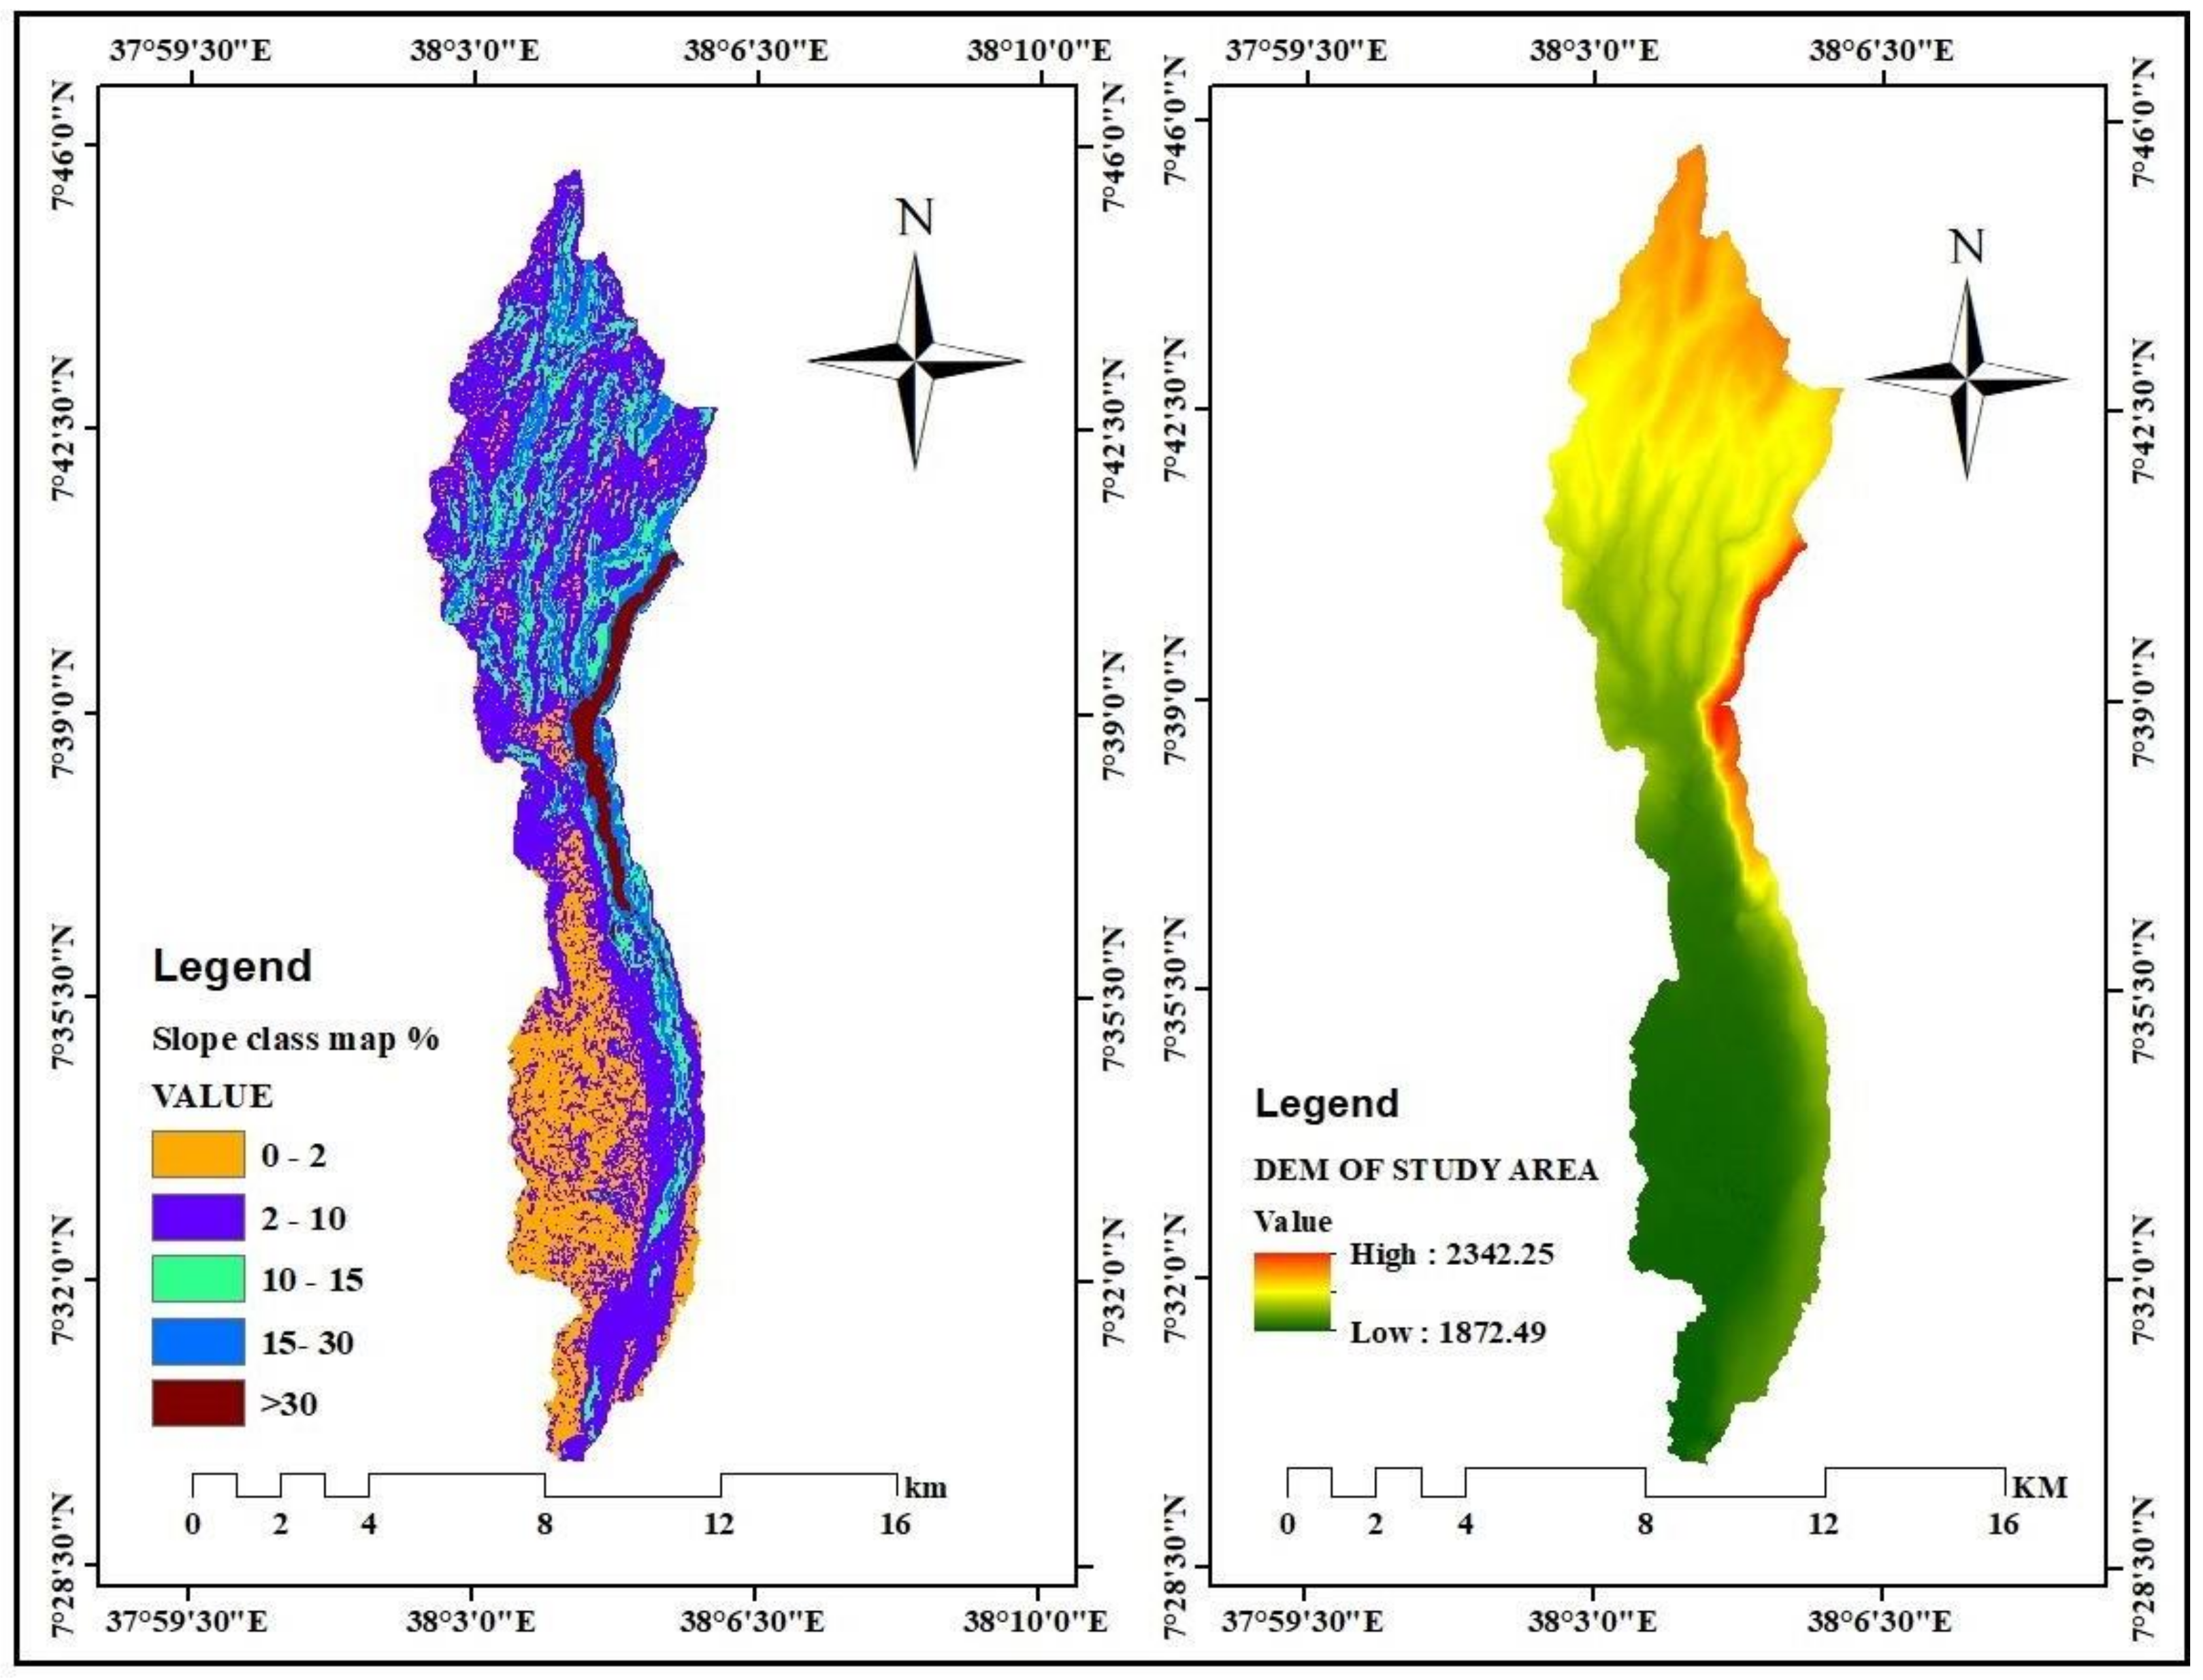
2.1. Description of the Matenchose Watershed
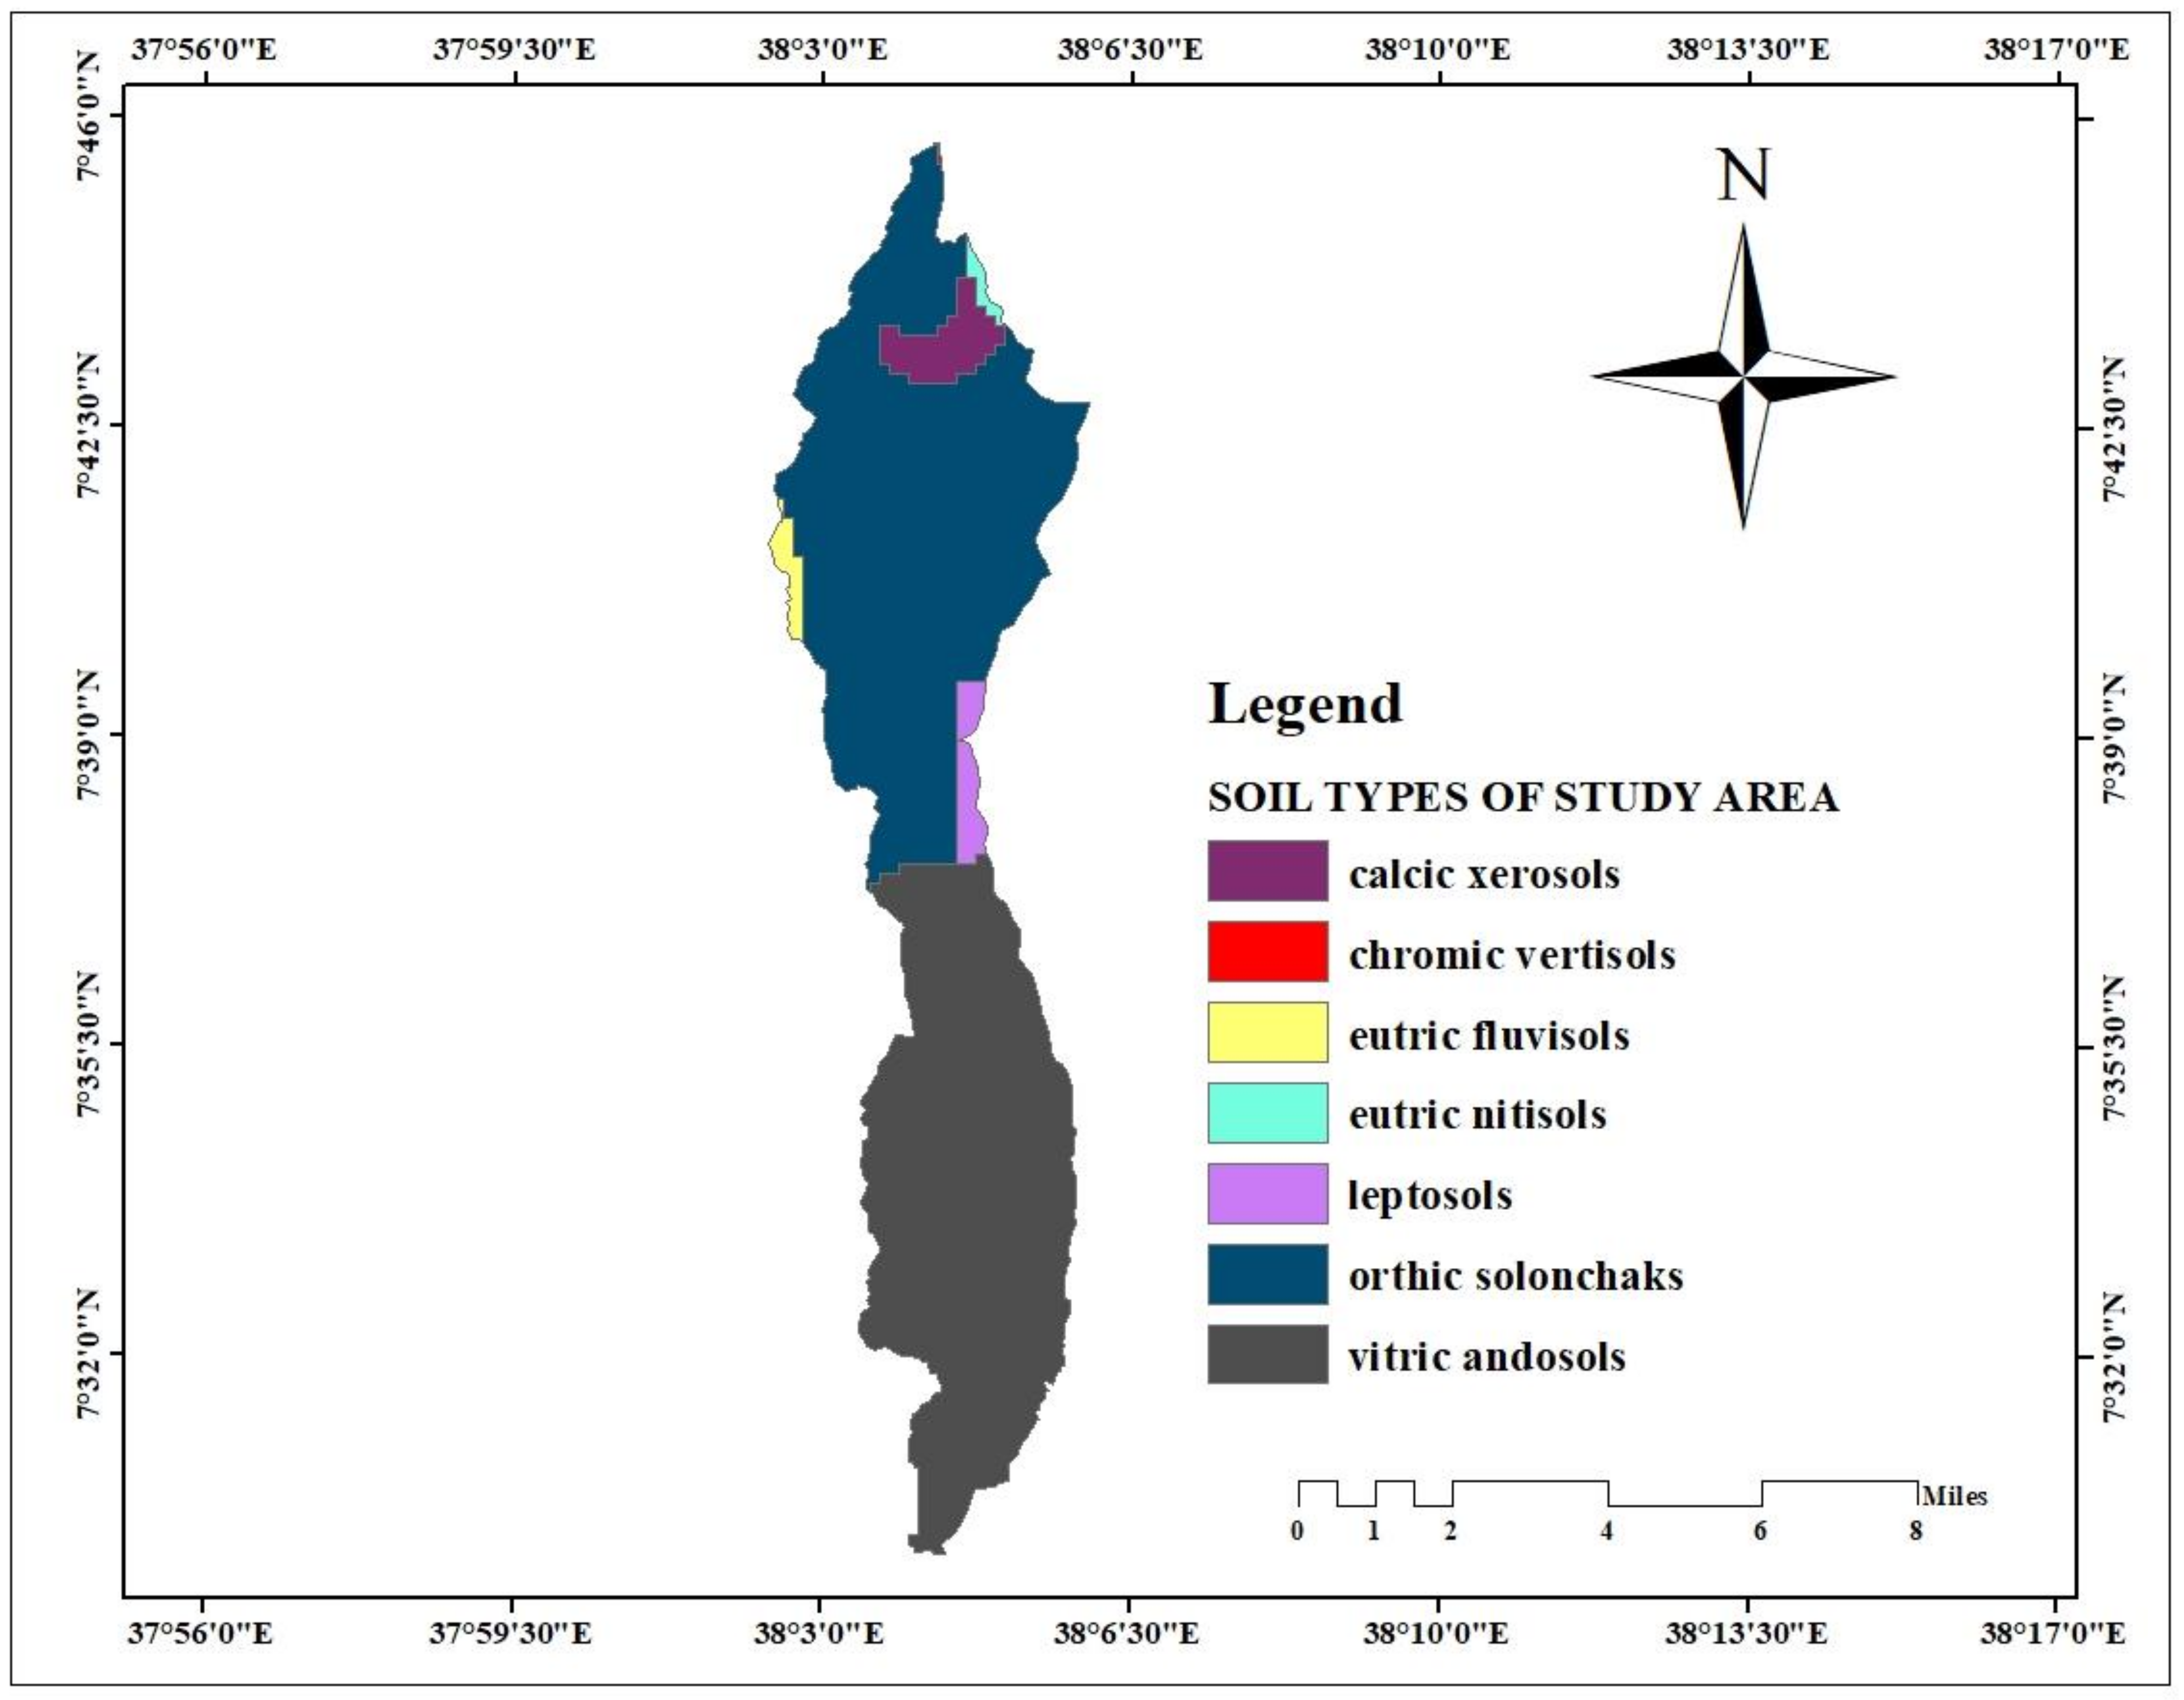
In terms of geography, the Matenchose watershed is situated between latitudes 7°30′ and 7°46′ north and 38°2′ and 38°6′ east, with heights varying from 1872 to 2342 m above sea level (Figure 1). The research area’s geographic center is 120 km west of Hawassa and 200 km south of Addis Ababa, the country’s capital. In this watershed, 359,413 people reside based on CSA [29] and population projection of the country [30]. The study watershed covers an entire area of 9990.42 hectares (ha).
Watershed precipitation data were calculated and mapped using the four major stations (Alaba kulito, Fonko, Hossana, and Wulbereg) in the watershed for which data were available for the past 32 years. At all sites, the rainfall outline exhibits a bimodal nature in the months of March to May and June to September. The extended rainy season in the woreda is the period from June to September, when cropland has been cultivated. The mean maximum temperature of the study area is 26.9 °C in February, while the mean minimum temperature is 10.2 °C in December, obtained from the Ethiopian National Meteorological Agency. The average monthly rainfall and temperature distributions of the study area are shown in Figure 2.
The study area has a varied natural topography, ranging from very flat to rugged. Mountainous landforms exist in the northeastern and southeastern portions of the area. The lowest elevation is in the southwestern part of the area, in the bottom of the main Ethiopian Rift in the floodplains of Shashogo Woreda. Rifting, erosion, and deposition processes gave rise to the region’s physiographic structure [31]. The Matenchose watershed has topographically suitable agricultural purpose. Flooding is a serial problem in areas with flat topography. The research site has slopes ranging from very gentle to quite steep, with gentle slopes predominating. The spatial distribution of the different slope classes in the study area is shown in Figure 3.

2.2. Soil Type

The Matenchose watershed contains seven major types of soil, according to various studies that have been conducted so far [32,33], namely: Eutric Fluvisols, Chromic Vertisols, Orthic Nitisols, Eutric Nitisols, Calcic Xersols, Vitric Andosols, and Leptosols. Orthic Nitisols and Vitric Andosols were the two most prevalent soil types in the study watershed (Figure 4). Most of the study area is characterized by pyroclastic rocks, and some other study areas by basic and ultrabasic rocks, undifferentiated unconsolidated sediments, and undifferentiated igneous rocks [31].
Natural vegetation’s geographic distribution is influenced by a variety of variables, but climate, drainage patterns, and soil types are key ones. The kind and density of vegetation in Ethiopia are significantly influenced by temperature and rainfall, which are heavily influenced by altitude [3]. Farmers in the studied watershed grow crops and cash crops with rainfed agriculture and irrigation. The main crops cultivated in the Matenchose watershed are maize, teff, sorghum, wheat, and pepper. The watershed is home to many different tree species, primarily eucalyptus and cordial Africana Acacia species. These tree species can be found spread across the study watershed, particularly in the cultivated environment. The watershed has a high population and a long history of agriculture; thus, the vegetation cover is very low. As a result, there is a great risk of erosion in locations with steep slopes.

2.3. Data Sources

Primary data were obtained from field observations (field data collections were conducted randomly to verify the supervised classification of the image and to collect the required LULC data). Additionally, field data were gathered to corroborate the findings, and key informant interviews were undertaken to assess the primary causes of LULC changes in the study area. Most spatial data were generated from DEM and satellite images using GPS. LULC datasets were generated from Landsat imagery (Table 1).
A total of 244 ground-truth points were gathered via direct and field observations using the global positioning system (GPS) to validate the correctness of the LULC cover map for 2020. LULC maps from Google Earth were used for 1991 and 2003, and 104 reference points for 1991 and 174 for 2003 were collected for each study year [34]. The data such as satellite images, DEM from Advanced Space Boerne Thermal Emission Radiometer (ASTER), meteorological data, soil data, shape files of the watershed, and soil conservation practice data were collected from the concerned government offices in the study area. Landsat 4–5 Thematic Mapper (TM), Landsat Enhanced Thematic Mapper Plus (ETM+), and Landsat 8 Operational Land Imager (OLI) satellite images were taken at various periods in 1991, 2003, and 2020, respectively [28,35]. All three years of images were obtained and downloaded from the United States Geological Survey (USGS) website (https://earthexplorer.usgs.gov/, accessed on 16 June 2022).
The Ethiopian National Meteorological Agency provided information on temperature and rainfall, the Global Positioning System (GPS) was used for ground verification, and digital cameras and Google Earth satellite image 2020 were used for validation, as well as ASTER 2020 with 30 m × 30 m resolution DEM, shape files, and FAO soil data from the Ministry of Agriculture and Natural Resources Development. The supervised classification of satellite images, accuracy assessment of classified images, identification of appropriate change detection and analysis of LULC changes, and comparison of results with other results performed for accuracy analysis of each LULC change and future predictions were performed.
The Landsat images were TM, ETM+, and OLI; the images have a relatively medium resolution of 30 m × 30 m. In order to detect changes in this watershed using images from different years, the data acquisition and resolution of the images must be as comparable as possible. LULC mapping was performed using ArcGIS 10.4. The parametric maximum probability view was used to categorize each pixel based on recognized ground fact [26,36,37]. Google Earth and field observations were useful to obtain information about LULC during the study period 1991 to 2020 [23]. Classification systems for digital analysis have been established as follows: LULC’s definitions are a modification of the classification scheme [38]. Description of classified LULC in the Matenchose watershed was adopted from Bewket and Teferi [39] and Gelagay and Minale [40]. Verification of identified land use and land cover types to be checked and validated by ground truthing is shown in Table 2.

2.4. Land Use/Land Cover Change Detection

To analyze land cover changes in the study area, the area in ha and percent changes between the 1991–2020, 1991–2003, and 2003–2020 periods were measured for each LULC type (Figure 5). While the LULC statistics were calculated in various ways, the variation in LULC in the three periods was determined by the difference in the values of 1991, 2003, and 2020 of the same category [39,41], which are shown in Equations (1)–(3) below.
Total gain, loss = Area of final year − Area of initial year,
Temporal LULC change = (Areal final year − area initial year)/(area initial year) × 100,
Rate of change(R)(ha/yr) = (Areal final year − area initial year)/(area initial year) × 1/(time interval) × 100

2.5. Assessment of Accuracy

In this study, classification accuracy based on accuracy matrix analysis was evaluated by taking into account overall accuracy, user’s accuracy, producer’s accuracy, and Kappa coefficient analysis. While the Kappa coefficient is an indicator of interpreter agreement, the error matrix expresses user and producer accuracy [42]. Based on the confusion matrix, the Kappa coefficient, and overall accuracy, the producer’s and user’s accuracy were determined. An error matrix is one of the most popular methods for displaying accuracy evaluation data [43,44]. Accuracy assessment in remote sensing is required, and essential to offer proof of the accuracy of the classification made [45].

2.6. Prediction of Future LULC

In this study, the extinction of Land Change Model (LCM) and IDRISI GIS analysis were utilized to predict and model future LULC dynamics in the Matenchose watershed using the MLP NN with CA-Markov Chain built in the software of terrset18.31. Reviews of the literature argue a variety of land use modeling, including those that use time- and space-based simulation models based on different techniques and requests [46,47]. The conceptualization of land use change modeling can take a variety of forms. These include Cellular-Automata-based models, models that use statistical analysis for modeling, Markov Chain models, models that use artificial neural networks, and finally models that use Agent-Based Modeling [47,48]. In this research study, the Matenchose watershed’s future LULC was predicted using the CA Markov model, which combines Markov Chains and Cellular Automata modeling methodologies.
For modeling changes in land usage, combining Markov Chains with Cellular Automata has many benefits [49,50]. Although shift prospects can be precise on a category-by-category basis, the Markov Chain model’s intrinsic flow is its inability to provide spatially referred output. Additionally, the distribution of each land use category’s occurrence in space is not specified [51].
The cross-tabulation of two different images results in the creation of the transition probability matrix, which is integrated with Cellular Automata to form the CA-Markov model [52]. A powerful tool for describing spatial and temporal dynamics is provided by this integration of the CA-Markov model [52].
In other words, any transition between any numbers of categories may be predicted and simulated using the CA-Markov Chain. Future changes in land use and land cover are typically predicted using a dynamic procedural model called CA [53]. Important CA characteristics include showing the spatial and dynamic process, which accounts for its widespread application in land use/land cover simulation [27]. In crux, the CA creates a weighting that is more precise in spatial locations that are close to the prevailing land uses. This ensures that land use change occurs near existing, comparable land use classifications as opposed to occurring at random [54].
Several studies have utilized LULC modeling and simulation with CA-Markov [55,56]. The CA-Markov model is recognized as a trustworthy technique due to its quantitative estimation and the spatial and temporal dynamics it possesses for reproducing LULC dynamics [47,48]. Additionally, it is simple to include both GIS and RS data into CA-Markov modeling [55]. The IDRISI Andis environment’s algorithms were utilized to project the future LULC of the research sector using a CA-Markov model [20].
The CA-Markov model applies to both spatial and temporal changes in LULC and combines Cellular Automata and the Markov Chain to predict the traits and trends of LULC change over time [57]. Therefore, in order to comprehend the relationships between humans and the environment from a long-term perspective, it is imperative to study the chronological LULCC [58]. CA is a dynamic procedure model that is frequently used in a spatial model for predicting future land use/land cover change [27,59]. The important properties of CA models are that they show the spatial and dynamic process, and that is why they have been broadly used in land use/land cover simulation [27].
The Markov Chain model is often used in LULC monitoring, ecological modeling, simulation changes, trends of the LULC, and to predict the extent of the land use change and the stability of future land development in the area of concern [48,57].
Prediction of land use from one period to another is possible using the Markov Chain model, which is generally used for monitoring, simulating the changes, and predicting future land use. A transition probability matrix for land use change was developed using the Markovian transition estimator from time one to two, as outlined in Equation (4) [60,61].
S t , t + 1 = P i j × S t
where S(t) is the system status at the time of t, S(t + 1) is the system status at the time of t + 1; Pij is the transition probability matrix in a state, which is calculated as follows [48,61]:
P i j = P 1 , 1 P 1 , 2 P 1 , n P 2 , 1 P 2 , 2 P 2 , n P N , 1 P N , 2 P N , n
P is the transition probability; Pij represents the probability of converting from the current state i to another state j in next time; PN is the state’s probability for any time.
The low transition has a probability close to 0, and the high transition has probabilities close to 1 [20,62,63]. Hence, transition-based models are the integration between a spatial Markov model with a spatial Cellular Automata model to perform the regression-based models in predicting the land use change [64].

2.7. Validating the LULC Prediction Model

The Kappa Agreement Index (KAI) approach, a method frequently used to evaluate LULC change predictions, was used to compare anticipated or simulated LULC maps reflecting the 2020 LULC with the actual LULC map of 2020. The output of the model was contrasted with the current or actual land use (composition and configuration) map in order to look for similarities between the real image and the simulated image [65,66]. For this, IDRISI Andes’ VALIDATE module was employed.
The use of Kappa indexes for the calculation determines the overall achievement rate, and it delivers an understanding of the real factors in the strength or weakness of the results. When 75% ≤ Kappa ≤ 100, the resulting maps are in a high level of agreement [42]; whereas if Kappa ≤ 50, the resulting maps are in poor agreement [67].
Using the CROSSTAB Module in IDRISI, the agreements of the two maps (actual and simulated 2020) were assessed using the Kappa Index of Agreement (KIA) components such as Kappa for no information (Kno), Kappa for location (Klocation), and Kappa for standard (Kstandard) [68]. The following equations express the statistics for the Kappa variations according to Omar et al. [68] and Equations (6)–(8):
K n o = ( M m N n ) P p   N n  
K l o c a t i o n = ( M m N n ) P p   N n ,  
K s t a n d a r d = ( M m N n ) P p   N n  
where no information is defined by N(n), medium grid cell-level information by M(m), and perfect grid cell-level information across the landscape by P(p).
Moreover, the figure of merit (FOM) is also a ratio, with the numerator being the intersection of the simulated and reference change and the denominator being the union of the two. The intersection of observed change and simulated change divided by the union of observed change and simulated change yields the figure of merit. The range of the figure of merit is 0 (i.e., no overlap between actual and predicted changes) to 100% (i.e., the complete overlap between actual and predicted changes) [69,70]. Mathematically, it can be expressed in Equation (9) as
Figure   of   merit = Hits   Hits + Misses + False   Alarms + Wrong   Hits × 100
where Misses = area of error due to reference change simulated as persistence; Hits = area of correct due to reference change simulated as change; Wrong Hits = area of error due to reference change simulated as a change to the wrong category; False Alarms = area of error due to reference persistence simulated as change.

2.8. Land Use and Land Cover Change Driving Variables

It is necessary to consider the independent variables’ potential power in LULC change simulation [71]. River proximity makes it easy for locals to access resources while affecting the use of the land [26]. One of the key factors in drawing more urban uses and encouraging urban expansion is distance from the road, which determines accessibility [71,72]. The most important anthropogenic element influencing land use change is population density: the greater the density, the more frequently land use changes. The type of land cover is strongly associated with environmental changes [73].
It is acknowledged that one of the key topographic parameters influencing LULC alteration is elevation [26], given that the annual pace of agricultural expansion was significant, it makes logical to develop the evidence likelihood, a quantitative variable that indicates the likelihood of identifying change between agricultural land and all other land classes at the relevant pixel [26,74]. The geographical trends of land cover change are influenced by slope, which leads one to assume that changes in land use are more likely the gentler the slope of the land.
Distance from roads and distance from streams were set as dynamic variables to express the varying distance as they change over time. The evidence likelihood measures the possibility that the LULC categories will change between an earlier and later map empirically [26]. It is used to convert categorical data into numerical values, such as the transition between different land cover classes. Utilizing Cramer’s V, which assesses the strength of the correlation between two variable classes, the significance of variables, was evaluated. A statistical measure of the intensity of dependence between driver variables, Cramer’s V value has a value range of 0.0 to 1.0. Generally, variables with a total Cramer’s V value larger than 0.15 are acceptable and those with a score greater than 0.4 are deliberated noble [26,59,75].
The possible socioeconomic (population density) and biophysical driving forces (slope, elevation, and distance) for the change in the LULC were also considered in the simulation model. These data were gathered from the Central Statistical Agency of Ethiopia. A household (HH) survey was conducted in three kebeles of Matenchose based on the landscape position (the upstream, midstream, and downstream parts of the watershed) and spatial patterns of the LULC. A total of 143 HHs were randomly selected and interviewed. The questionnaires were envisioned to capture the major drivers of land use and land cover change perception, socioeconomic status of HHs, and related information.
Focus group discussion (FGD) with Shashogo Woreda natural resource experts, kebele elders and women, and the kebele administrative chairman, and key informant interviews (KII) with elders, leaders, and women were conducted in the selected three kebeles for detailed analyses of LULC change drivers.

3. Results and Discussions

3.1. Land Use and Land Cover Dynamics

3.1.1. Accuracy Assessment

Accuracy evaluations were performed for the designated LULC categories for the years 1991, 2003, and 2020. For the years 1991, 2003, and 2020, respectively, overall classification accuracy was achieved using the stratified random sample method of 91.5, 95.4, and 95% with a Kappa coefficient of 0.89, 0.94, and 0.94, respectively (Table 3). The accuracy assessment results of the study area showed that the bare land, forestland, and cultivated land were the more accurately classified LULC categories, followed by grassland and settlement (Table 3). As a result, the estimate of accuracy based on the overall accuracy is more accurate. The classification accuracy of the study matched the recommendation that there must be at least 80% accuracy for sensor data [76].

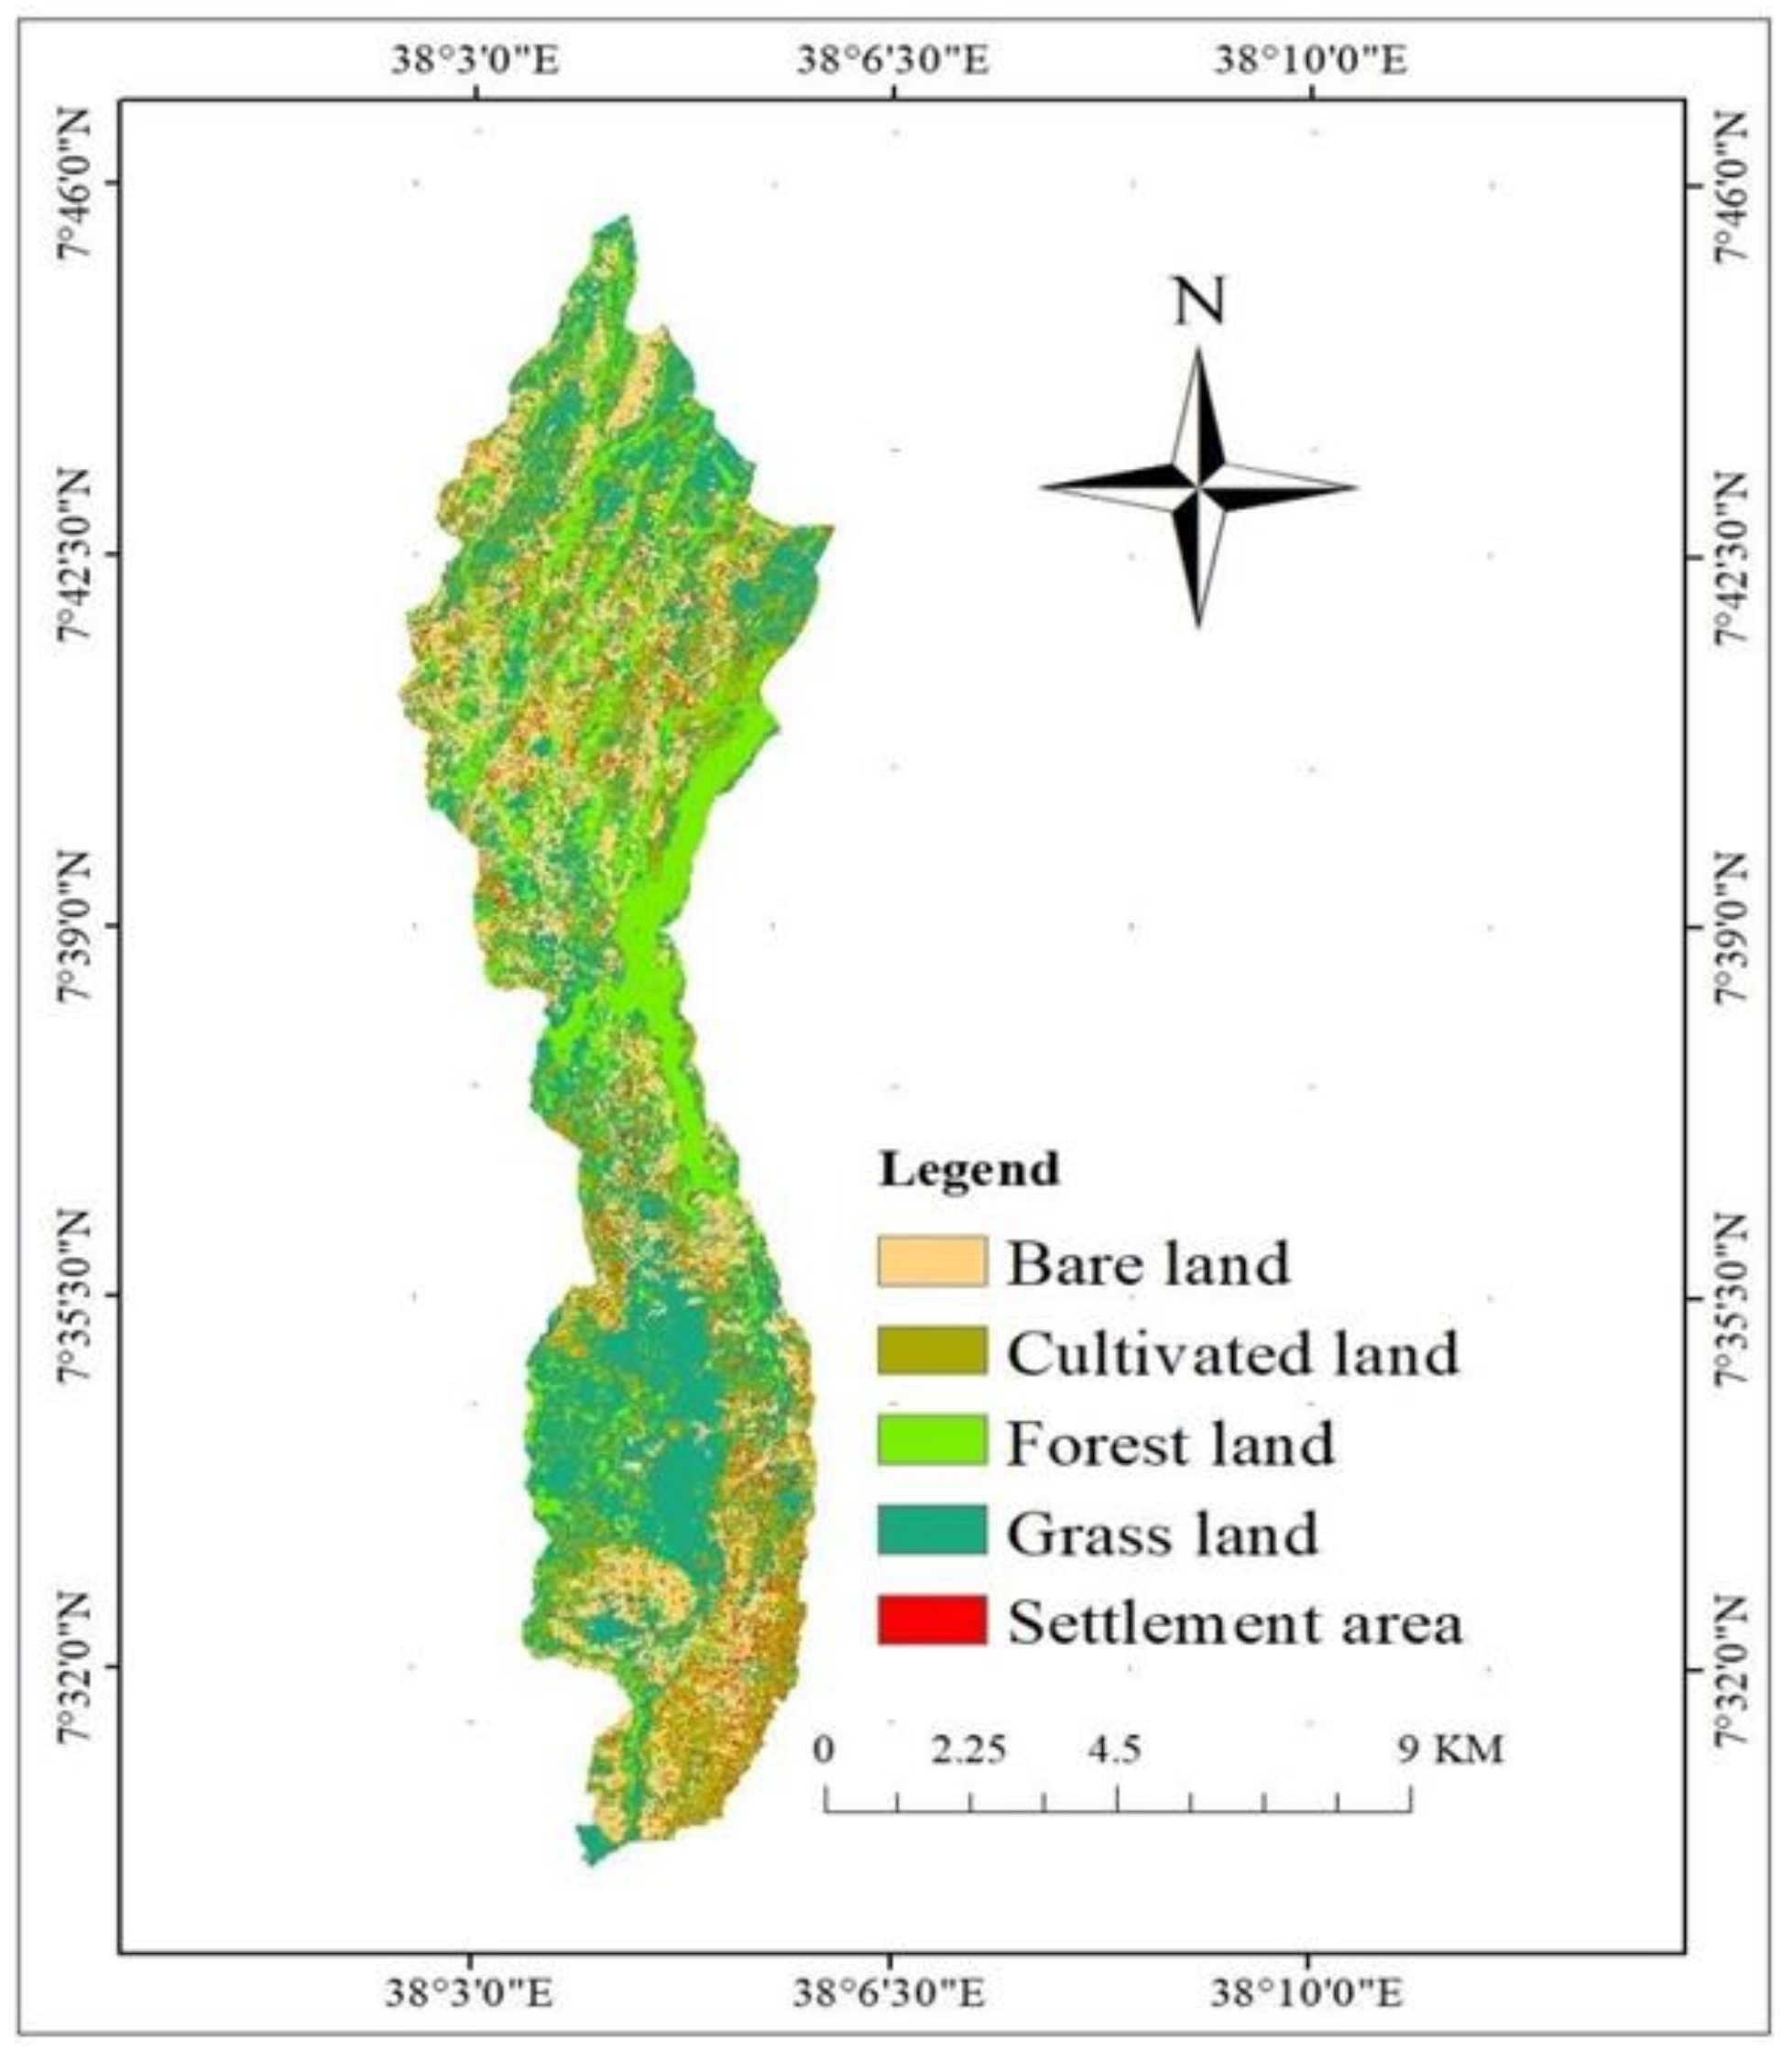
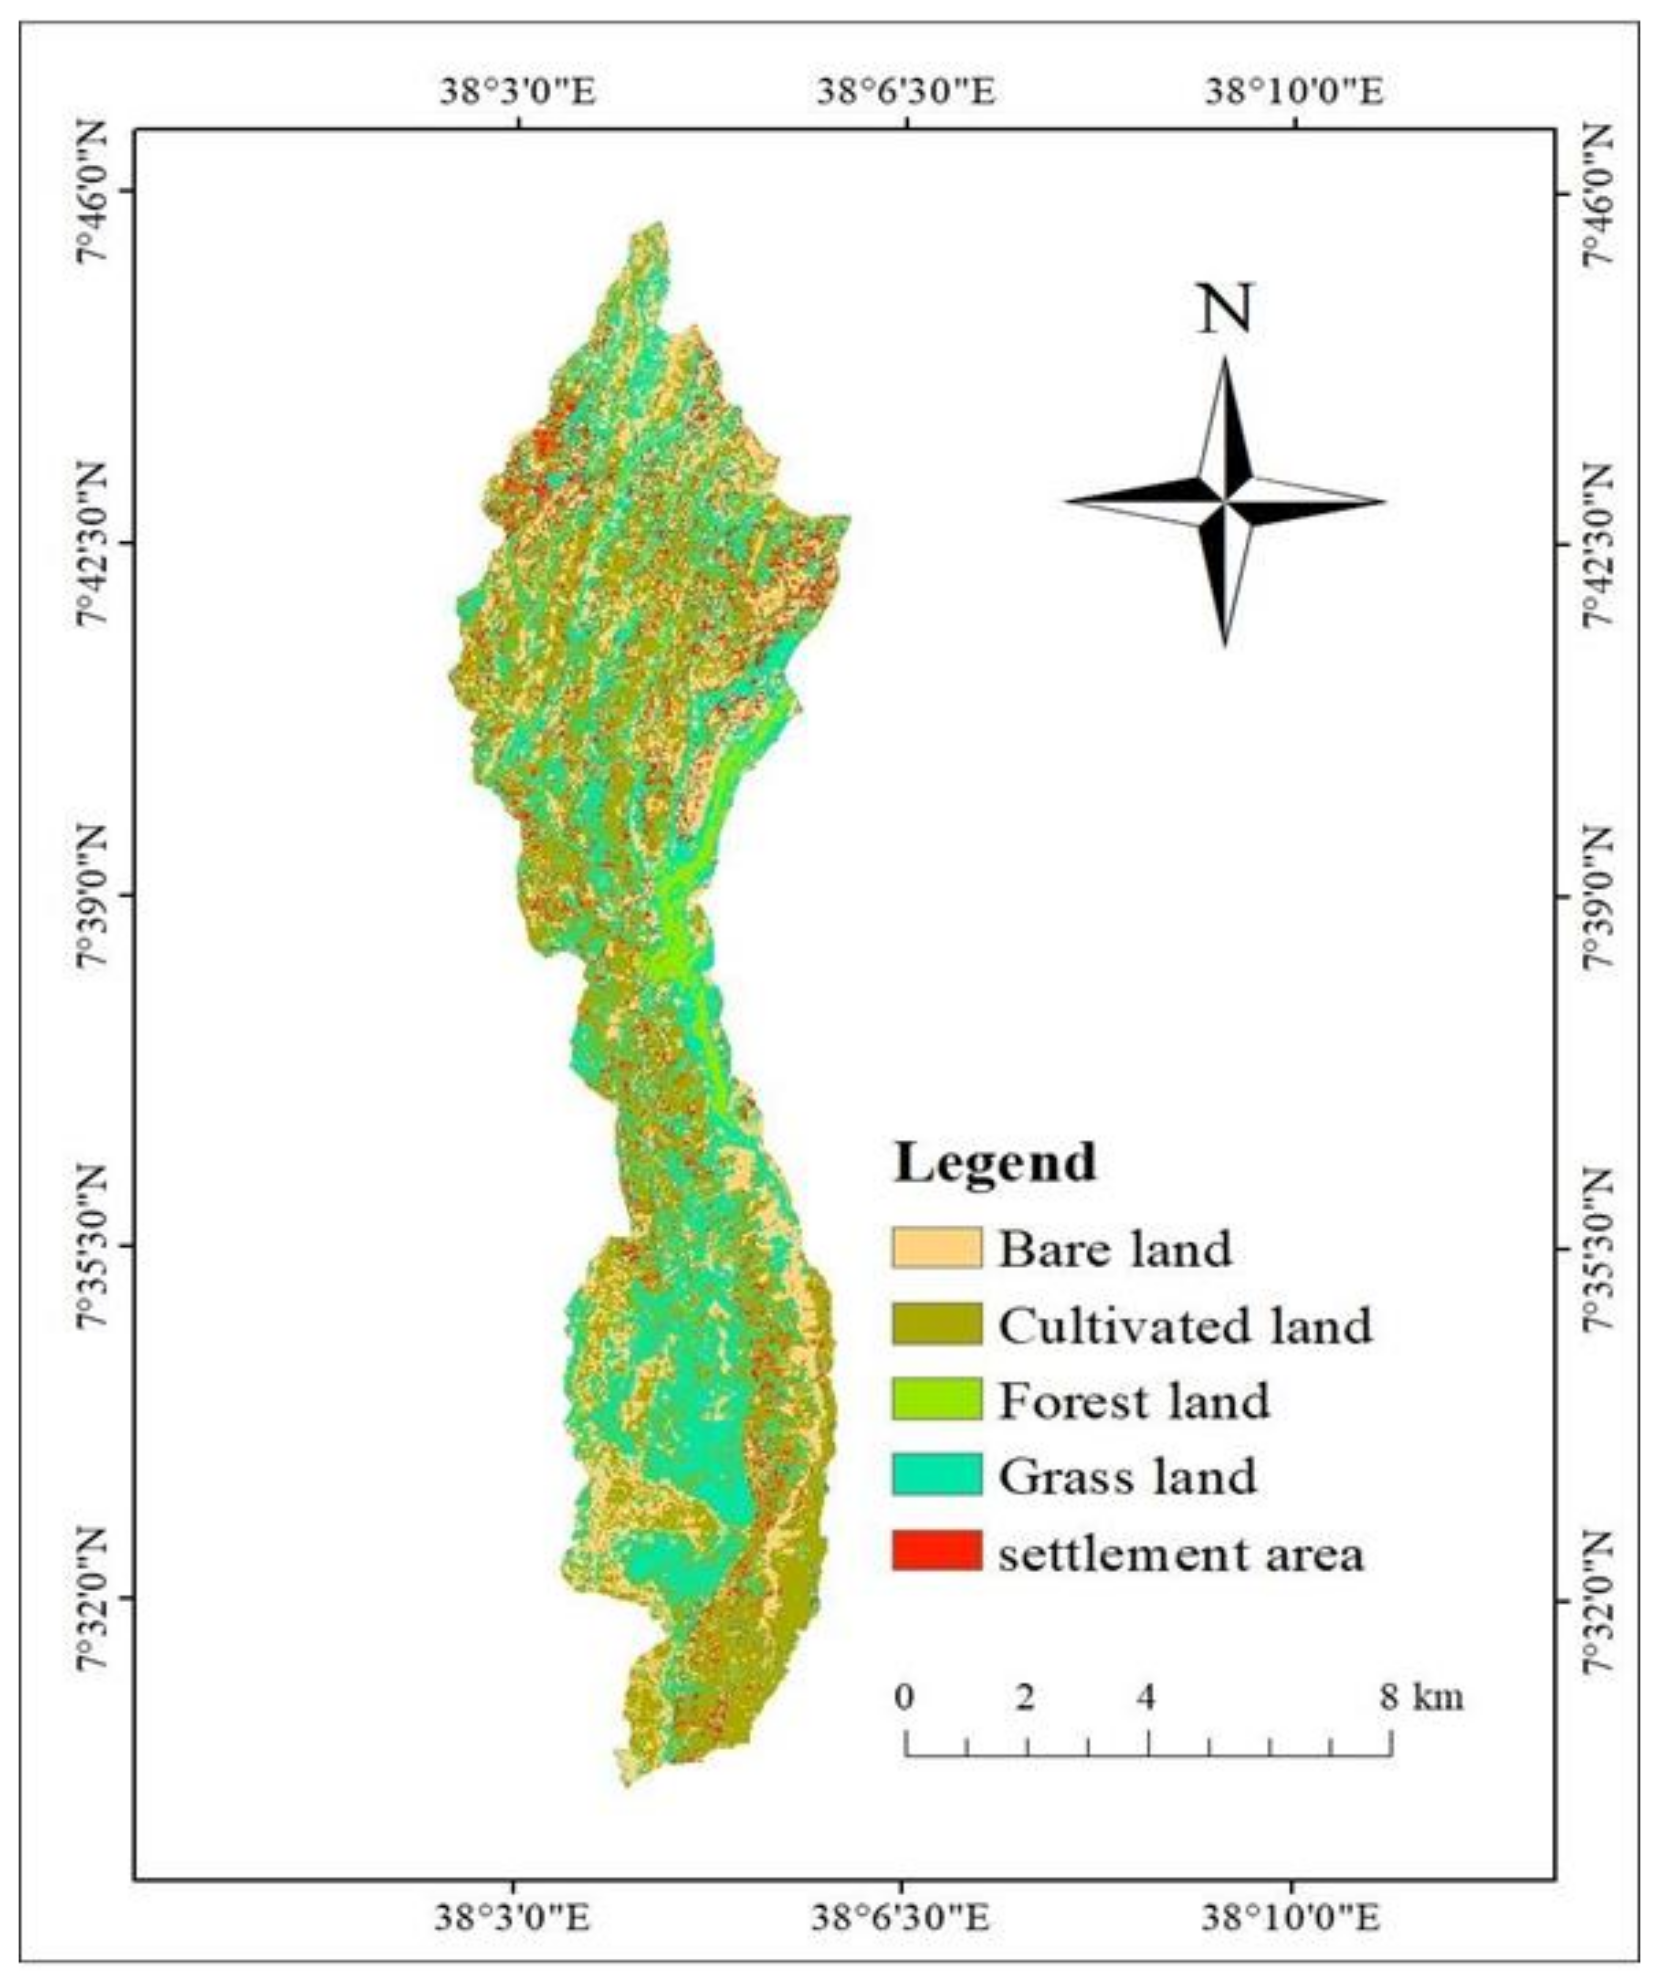
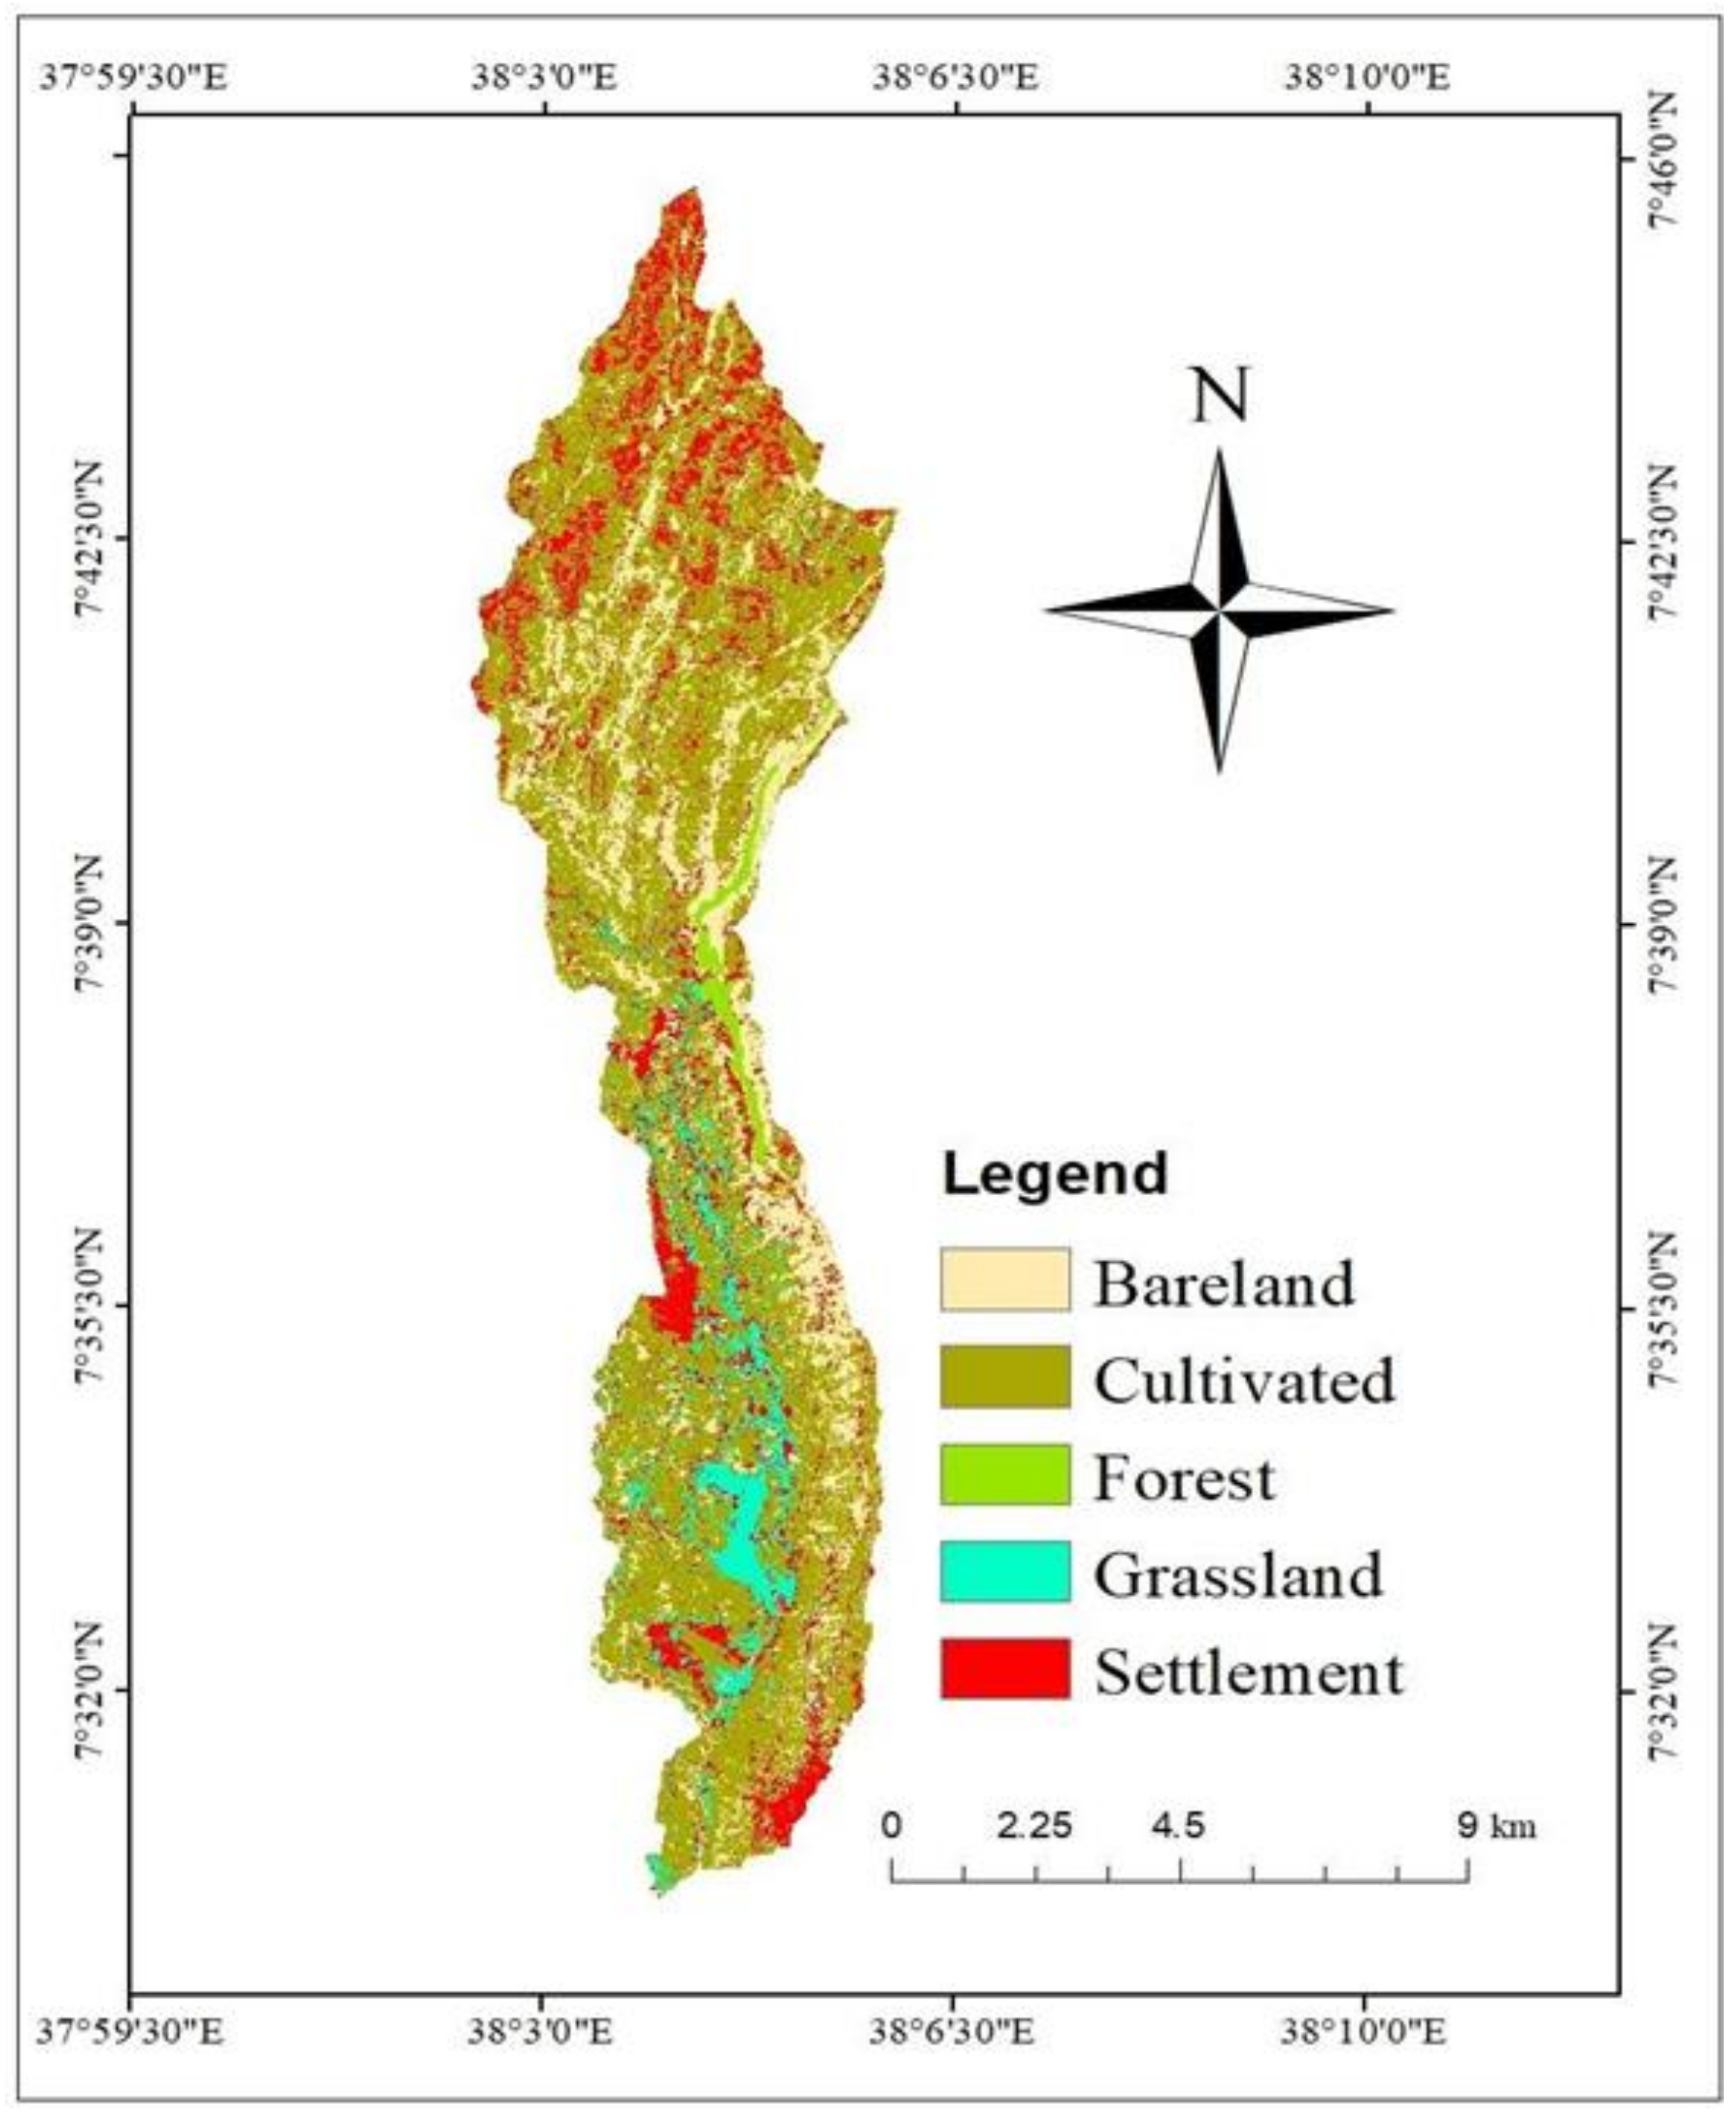
3.1.2. Land Use Land Cover Classification

Based on the supervised image sorting method system, LULC in the study watershed was classified into five types, namely forestland, grassland, cultivated land, bare land, and settlement area using GIS techniques (Table 4).
As shown in Table 4, the largest proportion of land use/land cover in the 1991 Landsat TM image (Figure 5) was grassland and cultivated land, which occupied 3498.76 ha (35%) and 2176.12 ha (22%) of the total watershed, respectively. Forestland, settlement, and bare land LULC types, on the other hand, occupied 1837.63 ha (18%), 358.84 ha (4%), and 2119.06 ha (21%). The study watershed is dominated by grassland and cultivated land. In 1991, Ethiopia’s land use policy under the Derge government encouraged farmers to maintain forest resources; however, the study area’s forest resources were negatively impacted, since they were replaced by resettlement programs.
According to the study, forestland was preserved during the initial study period, but decreasing patterns in its conversion to agricultural were seen over time. As a result, from 22 percent (2176.122 ha) in 1991 to 36% (3549.918 ha) in 2003 to 52% (5209.734 ha) in 2020, the share of cultivated land has increased (Figure 6).
The extent of the settlement increased in line with the trend of the cultivated land, and in 2020 it covered an area that was roughly 4.6 times larger than it did in 1991 (Table 4).
Similar to Table 4, the findings of the land use and land cover classification from the 2003 Landsat ETM+ imagery (Figure 7) showed that around 4% of the area was forestland, 29% was grassland, 36% was cultivated land, 8% was populated, and 23% was bare land. These findings demonstrate that cultivated and grassland areas dominated LULC.
Moreover, the results of land use land cover classification from the 2020 Landsat OLI image (Figure 8) indicated that about 3% was forestland, 8% was grazing land, 52% was cultivated land, 17% was settlement, and 20% was bare land. This result showed that cultivated land was dominant.

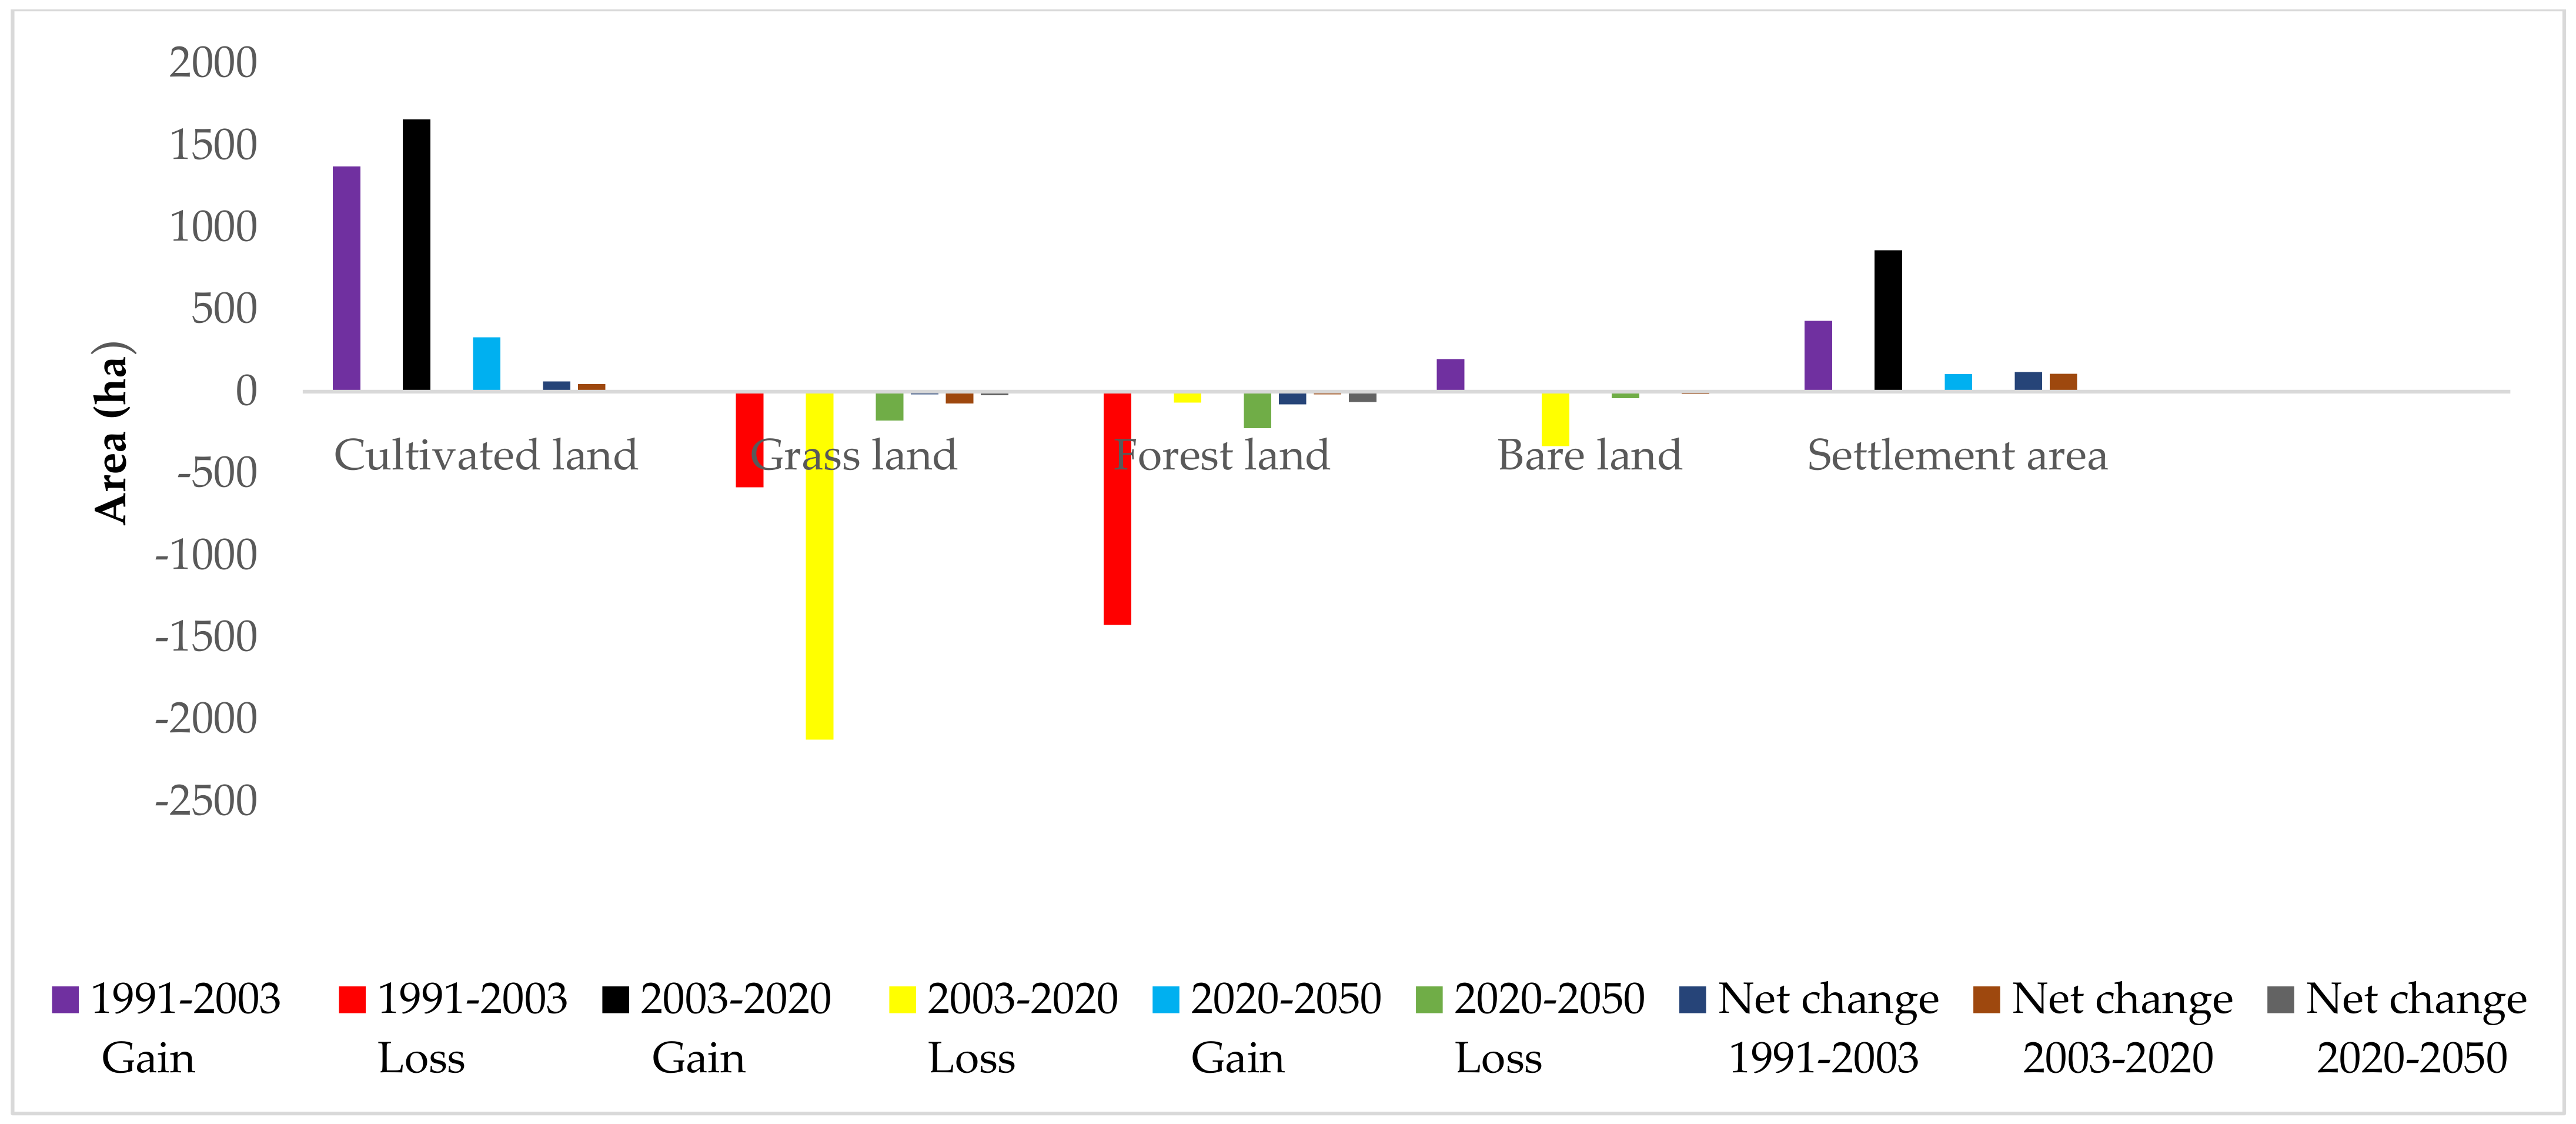
3.1.3. Land Use and Land Cover Change Dynamics between 1991–2003, 2003–2020, and 1991–2020

The rate of change is discussed by linking the rate of alteration of each LULC class over the period measured. The rate of change in each LULC class could provide the information to make a comparison among the different classes. Hence, the land use and land cover change of the three periods was analyzed based on the temporal and annual rate of change (Table 5).
In 1991, there were 2176.12 ha (22%) of cultivated land; this number raised to 3549.92 ha (36%) in 2003, and to 5209.73 ha (52%) in 2020. According to this, a 63% temporal increase was observed over the course of 12 years, from 1991 to 2003, and a 47% temporal increase was seen from 2003 to 2020. The research area had a temporal growth in cultivated land of 139.40% over the 29-year period from 1991 to 2020. In 1991, grassland covered 3498.76 ha (or 35 percent of the total area), which fell to 2914.97 ha (or 29%) in 2003, and to 792.26 ha (or 8%) in 2020. This showed that between 1991 and 2003, a 12-year period, a 17% temporal decline was realized, and between 2003 and 2020, −73% temporal reductions were observed. Moreover, there was a 77% temporal decline of grassland in the watershed over the 29-year period from 1991 to 2020 (Table 5).
The coverage of settlement area in 1991 was 358.84 (4%), but this was increased to 791.33 ha (8%) in 2003 and 1653.11 ha (17%) in 2020. This indicated that from 1991 to 2003, within 12 years, a 121% change was observed. In addition, a 109% temporal increase was observed from 2003 to 2020 within the settlement area in the watershed, whereas in the 29-year interval (1991 to 2020) there was a 361% temporal increase in the settlement observed in the Matenchose watershed. In general, there was a decrease in grassland, forestland, and bare land; nevertheless, a progressive increase in cultivated land and settlement area in the study watershed was observed.
Beyamo [3] confirmed that, from 1973 to 2005, there were 4516.92 ha of cultivated land in Shashogo Woreda, Southern Ethiopia, but by 2010, there were 20,872 ha. This showed that cultivated land increased by 362% during the 37-year period in the studied Shashogo Woreda.
In another study by Mathewos et al. [77] in 1985, shrub and grassland made up the majority of the land, followed by cultivated land (23.35%) and forestland (9.38%). However, cultivated land in southern Ethiopia’s Bilate-Alaba sub-watershed significantly increased in size in 2017 by 15.71%.
In the Gumara watershed of the Lake Tana Basin, northwestern Ethiopia, between 1957 and 2005, it was found that cultivated and settlement land increased by 21.9%, whereas forestland, shrubland, grassland, and wetland decreased by 85.3, 91.3, 76.1, and 72.54%, respectively [78]. The annual rate of land use land cover changed between 1991 and 2003; cultivated lands, bare land, and settlement area have each displayed a positive rate of change.
Forest and agriculture land decreased, whereas home gardens, agroforestry/settlements, and grassland increased across East Africa [79]; cultivated land and settlement area increased, whereas forestland and bare land decreased in Jimma Geneti District, Western Ethiopia [80]. While cultivated areas and settlements expanded, woods and grassland decreased in extent over the observation period [81]; the reverse trend was observed in the Gog District, Gambella area of southern Ethiopia [82]. While forest and grassland were reduced, cultivated land and class built-up area rose [24,83].
Getachew and Melesse [84] noted that although forest and rangeland decreased, built-up and agricultural land rose. While grazing land and Acacia forests decreased, bare land, cultivated land, and shrubland increased in the central Rift Valley Basin [85]. Sewnet and Abebe [86] showed the rise in areas covered by agricultural and built-up land and forests; on the contrary, grassland decreased considerably.
The settlement area displayed the highest positive rate of change (10.08%) and cultivated land displayed the second-highest positive rate of change, while the bare land very slightly showed a positive rate of change (0.75%). On the other hand, grassland (−17%) and forestland (−77%) both presented a negative rate of change in the study period between 1991 and 2003. In addition, the annual rate of LULC change between 2003 and 2020 regarding cultivated land and settlement areas each presented a positive rate of change. Settlement area showed a peak positive rate of change (6.41%) and cultivated land showed the second highest rate of change (2.76%); on the other hand, grassland (−4.29%), bare land (−0.82%), and forestland (−2.7%) presented a negative rate of change in the study period.
The results of this study are in line with those of other studies conducted across the nation. For instance, Zeleke and Hurni [87] in the Dembecha region of northwest Ethiopia reported that between 1957 and 1995, 99% of the forest cover was converted into cropland. Similar to this, Kindu et al. [88] reported that nearly 66.2% of woodland has been converted to agricultural land in the Munessa-Shashemene environment of the Ethiopian highlands. Several new local-level LULC dynamics research works designated related trends [24,84,89,90].
A study in the Baro River Basin in southwest Ethiopia also revealed that between 1984 and 2010, the expansion of cropland and human habitation was the primary factor in the conversion of forest area to non-forestland [91]. On the other hand, a community afforestation effort in a degraded hilly section of the watershed led to a 27% increase in forestland in the Chemoga watershed of the Blue Nile [92], which indicated the worthy arrangement between the real and simulated LULC maps [24,93].
According to a study by Wondrade et al. [94], there has been a decrease in forest and grassland and an increase in the built-up, cropland, and bare land areas in the Lake Hawassa watershed. In the same watershed, the proportion of cultivated land and agroforestry has increased from 24.2% of the watershed in 1972 to 62% in 2017 [95]. In the Huluka watershed, between 1973 and 2009, cultivated land and open land increased while forestland and grassland decreased [96]. Similarly, in the Lake Ziway watershed, cultivation, agroforestry, and settlement LULC categories increased by 45%, 10.9%, and 141.4%, respectively [97].

3.1.4. Land Use Land Cover Dynamics Matrix

For the LULC change matrix in this study, the LUTM (post-classification) method was used to detect LULC change from 1991 to 2003 and 2003 to 2020. From the five LULC classes, cultivated land was the most vulnerable, while the forestland use class was the least vulnerable to soil erosion (Table 6).
We found that soil is highly eroded, especially when another LULC is converted into farmland, and this result is harmonized with other findings [98]. The result of the land use land cover dynamics matrix (1991–2003 and 2003–2020) of the Matenchose watershed shows that during the indicated period a significant land use land cover change matrix exists (Table 7).
The change detection statistics in Table 6 and Table 7 provided a detailed tabulation of variations between two classification images. Table 6 showed that regarding land use and land cover, there was a considerable increase in the area of cultivated land (3640.48 ha) during the period 1991–2003 in the Matenchose watershed, even though the specific portion of its extent was converted to bare land (463.02 ha), to forestland (7.89 ha), grassland (443.74 ha), and to settlement area (215.22 ha). Shrinkage was evident in the area of grassland by 618.86 ha between 1991 and 2003, while at the same time it gained area from the classes of bare land (899.15 ha), settlement (226.83 ha), cultivated land (1134.72 ha), and forestland (22.85 ha), although forestland (−1488.07 ha) decreased during the period 1991–2003 and bare land showed an increasing trend by 200.78 ha in the Matenchose watershed.
In the 2003–2020 period, a similar pattern was observed as in 1991–2003. The area of cultivated land increased by 1878.35 ha, although its area simultaneously was changed to bare land (259.09 ha), forestland (7.89 ha), grassland (79.21 ha), and settlement (329.80 ha) (Table 7). As seen in Table 7, the furthermost key providers to the increase in cultivated land were bare land (1255.12 ha), forestland (679.19 ha), grassland (1946.28 ha), and settlement (152.41 ha). This showed that throughout the same time period, cultivated land rose with the greatest magnitude, whereas grassland and forestland decreased with the greatest magnitude.
In terms of settlement, there were 268.55 ha in 1991, but by 2020 it increased to 1592.88 ha. Grazing land (649.94 ha), forestland (256.476 ha), cultivated land (329.80 ha), and bare land (308.18 ha) were the land uses that contributed to the increase in settlement in the watershed. According to Table 6 and Table 7, cultivation has high pressure on grazing land and forestland in the study area.

3.2. Land Use and Land Cover Change Driver Variables

The model includes the driver variables that influence changes as either static or dynamic components based on spatial analysis [26]. The shift in a driver’s influence served as the foundation for the LULC prediction in the watershed. Both topography and proximity criteria were chosen in this study to examine the change in LULC. In this study, all driver variables were employed to model the transitions. The two primary topographic parameters known to effect LULC change are elevation and slope. The extent to which forests and rangelands are converted to agricultural land, as well as the distribution of cities, are all influenced by topography. Pontius and Malanson [49] discovered that when the slope gradient increases, deforestation reduces.
Other factors that affect land use change include population density, distance from roads, and distance from streams, all of which make it easier for locals to obtain resources. Leta et al. [26] have given recommendations stating that all driving variables must be taken into account, and it has to be checked that a total Cramer’s V value ranges between 0.15 and 1.0 for proper acceptance of the model to predict future land use change.
Based on a change in a driver’s impact, the LULC prediction in the watershed was made. Both topography and proximity criteria were chosen in this study to examine the change in LULC. The chosen driver variables were evaluated for their explanatory value using Cramer’s V before being included in the model (Table 8).
From Table 8, it was observed that the variables such as elevation, population density, distance from stream, and distance from road are considered as useful variables of transitions [26]. Some variables such as slope have low Cramer’s V values, and it shows that the effect of slope on LULC change in the Matenchose watershed is not important [99,100]. The variables with good Cramer’s V values show that they are the most explanatory variables for LULC change.
Agricultural development, population growth, livestock grazing, and wood extraction were the most significant socioeconomic drivers of LULC change in the research area, according to the results of the household interviews (Table 9). Most importantly, agricultural expansion and population growth were more experienced as compared to other driving factors. This is similar to findings in other reports in Ethiopia [24,78,101].
The mean family size in the sub-watershed was 6.68, which is greater than the country mean (5.4), and nearly half of sampled households (47.55%) had more than 6 members in the family, which indicated that the population engaged in agriculture increased. Farmers in the Matenchose watershed who practiced polygamy contributed to raising the population. This is one of the reasons that rapid population expansion and big family sizes are to blame.
Livestock and crop production are carried out together in mixed farming practices. Particularly in the Matenchose watershed where sedentary agriculture is practiced, livestock is crucial for complementing the rural community’s means of subsistence.
According to Shashogo Woreda agriculture office report of 2020 the total number of livestock in the Matenchose watershed was 147,633 (Table 10), but because of the growing human population and the scarcity of grazing area, the number of livestock per person was less than what was necessary to support a sedentary society. A lack of grazing land (due to population pressure) and a lack of rain prevented the growth of adequate feed resources [102].
The total stocking level (4.35 LSU per ha) based on the livestock census shown in Table 5 was higher than the study area’s carrying capability. The amount of grazing pasture needed per total livestock unit (TLU) is 1.5 ha [104]. Accordingly, 50,006.32 ha of grazing pasture would be needed in the study region to accommodate all the livestock units. Compared to what is currently offered in the Matenchose watershed, this is a five-fold increase (9990.42 ha).
Therefore, an additional 40,015.90 ha of grazing area is required in the Matenchose watershed to feed the current cattle population. The population growth may be accompanied by an increase in animal numbers, which would have a disastrous impact on the watershed flora and soil conditions. The overgrazing and soil degradation in the rangelands are made worse by this situation. A similar result was reported by Babiso et al. [105] in the Wallecha watershed in southern Ethiopia, where the higher livestock population affected grazing land.
In 1994 and 2007, Ethiopia conducted three national population and housing surveys, and the possible projection was made for 2020 [29,106]. The watershed’s population was 161,527 in 1991, 229,309 in 2003, 255,666 in 2007, and 359,413 in 2020. The growth rates were using exponential growth, with rates of 2.72, 2.62, and 2.50% between 1991–2003, 2003–2007, and 2007–2020, respectively (Table 11; Equation (9)). The population in the sub-watershed increased from 161,527 to 359,413 between 1991 and 2020, implying that the population doubled in 29 years.
The growing rates were designed on the bases of the work of Bielli et al. [30] with the assumption of exponential growth in Equation (10):
P 2 = P 1 e r t
where P1 and P2 = the population totals for two different time periods, t = the estimated years between the two periods, and r = the mean annual growth rate
This finding is consistent with other studies conducted in various parts of Ethiopia, which discovered that population growth and agricultural crops were important drivers of LULC changes [89,92,101,105,107,108,109].
FGD confirmed that population growth with a land certification program in 2014 in the study area resulted in further expansion of cultivable land at the expense of forestland, which was the main driving agent of LULC change. Rapid population growth combined with the agricultural land expansion were the major dominant drivers of LULC in the Gambella region [42].

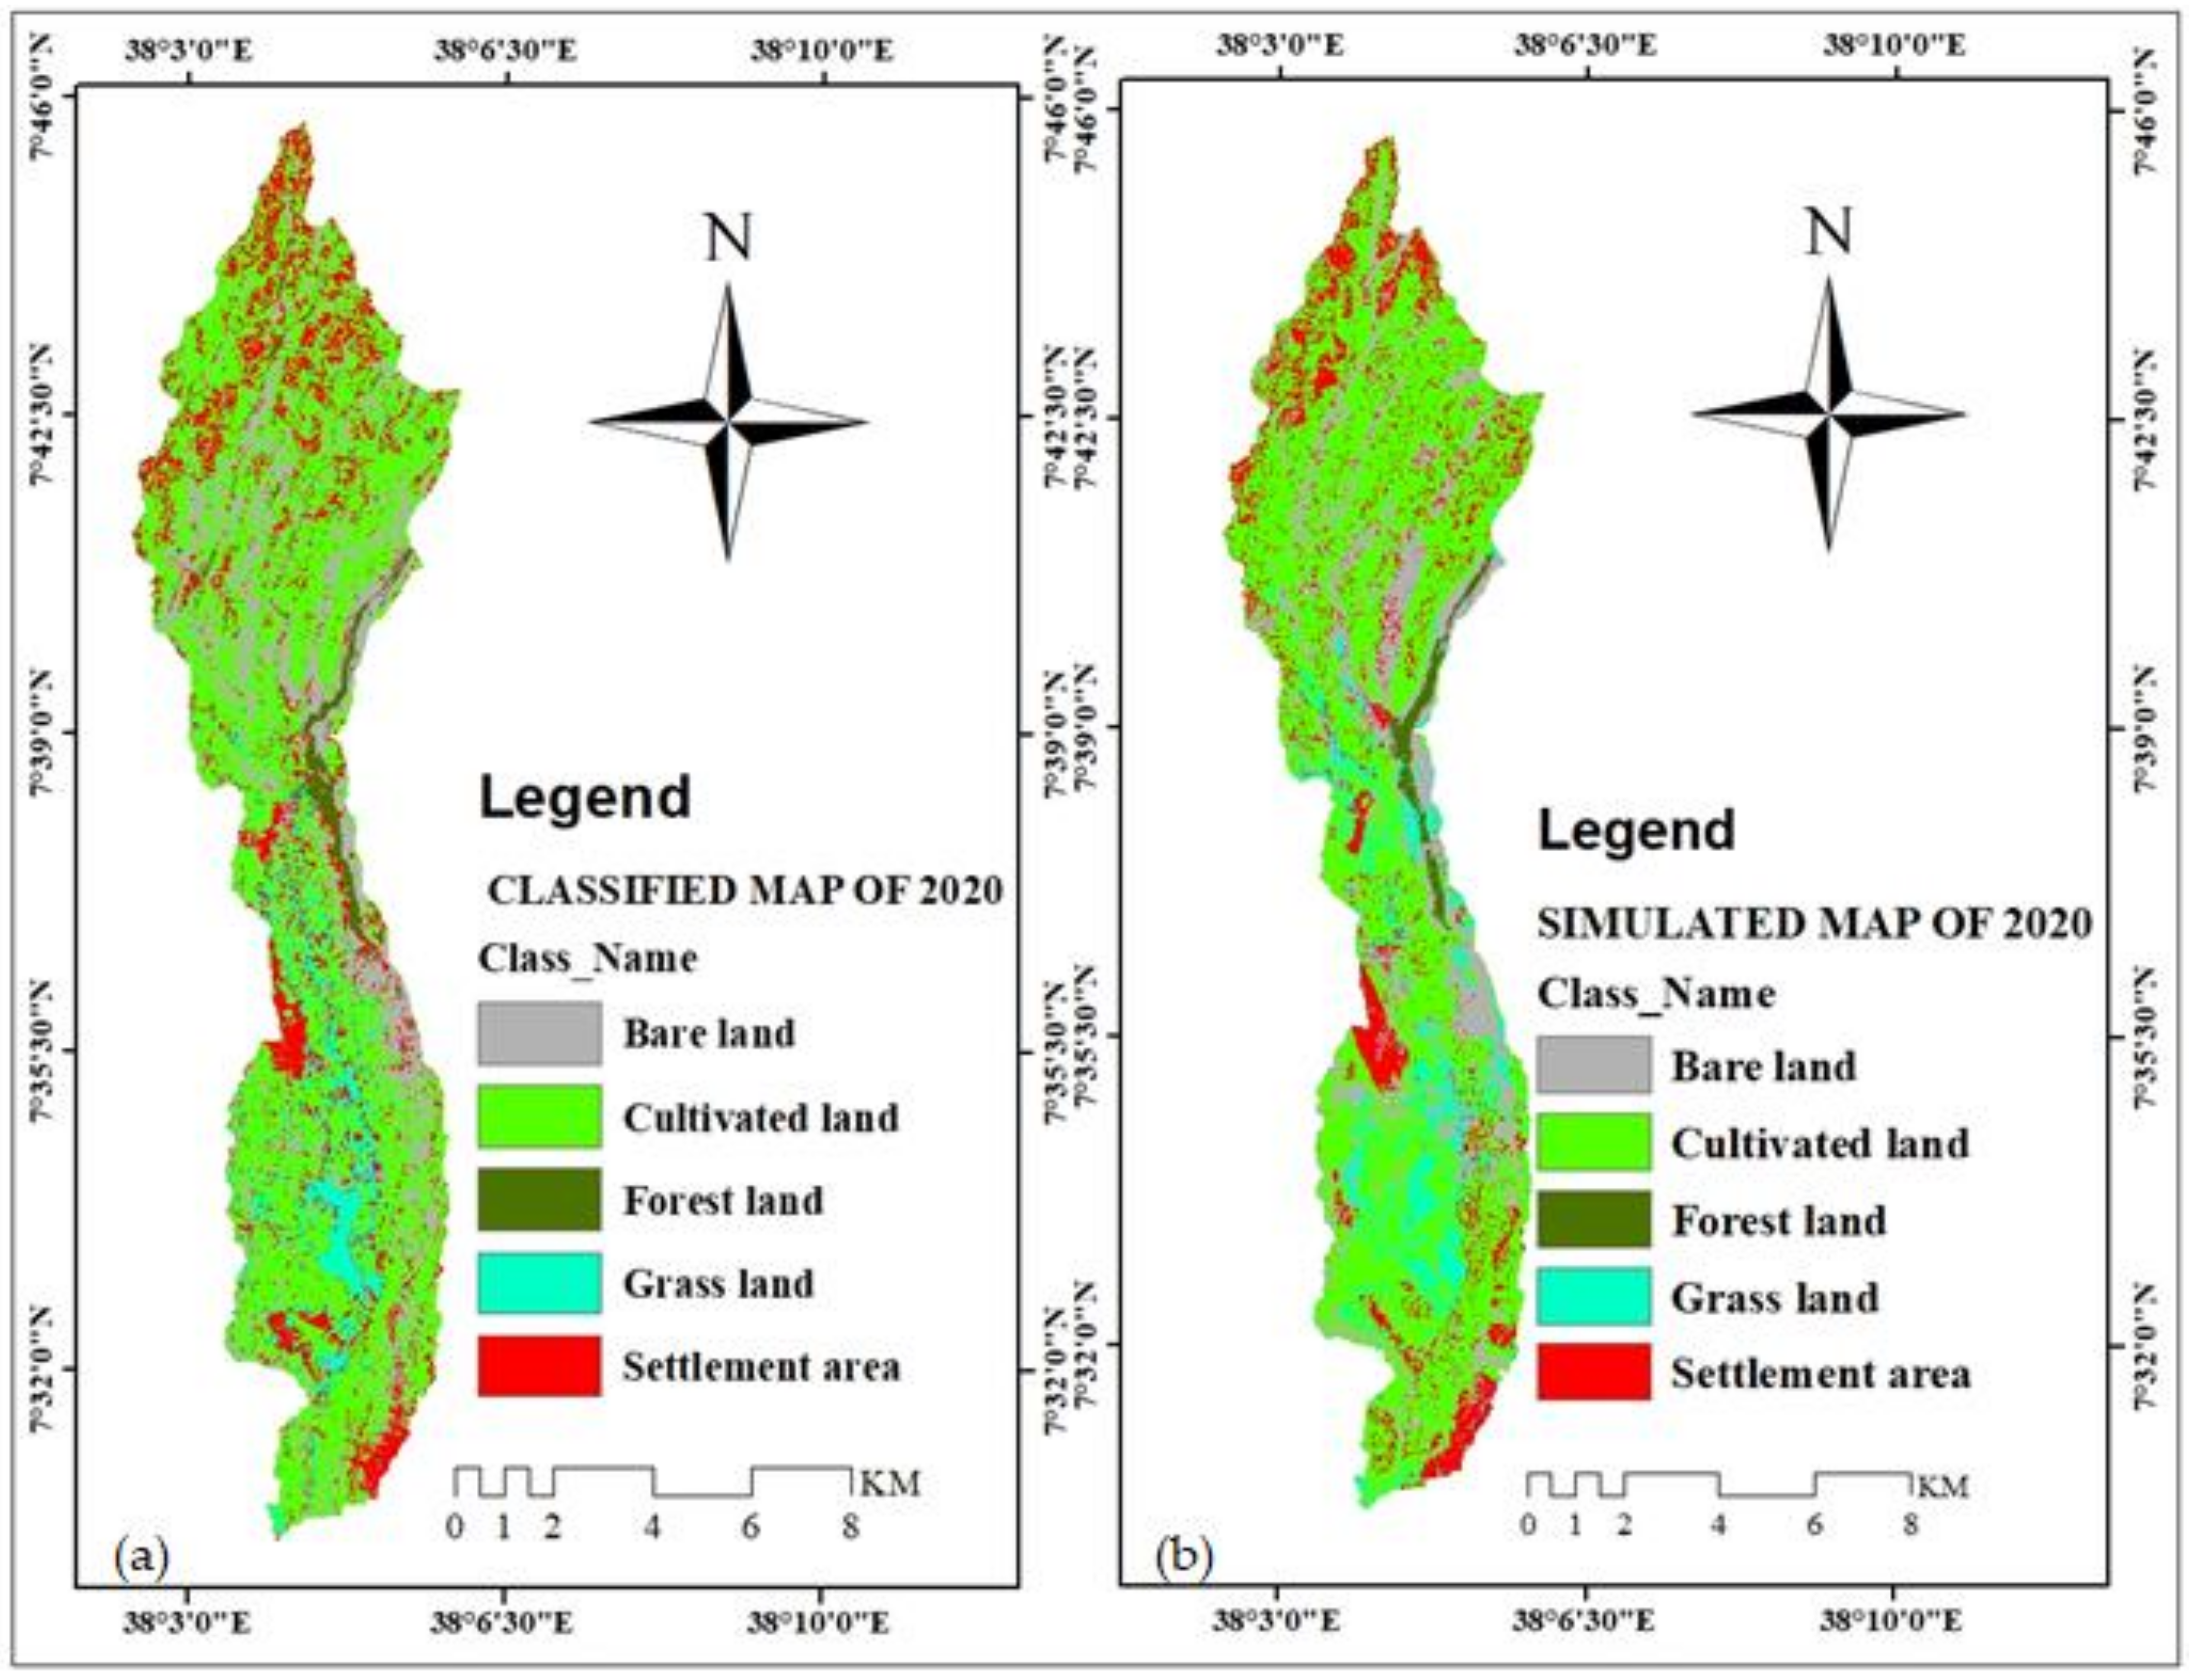
3.3. Simulation of LULC Change Using Markov Chain Analysis (CA-Markov) Model

The projection of land use and land cover (LULC) in 2020 with the aid of CA-Markov model was made possible by the use of the observed land use and land cover in 1991 and 2003. The simulated land use areas were utilized to associate the real current land use in the watershed in order to validate the LULC forecast made by the CA-Markov model. The performance of the model was then assessed using the Kappa index by comparing the observed and simulated LULC 2020. Accordingly, settlement areas, cultivated land, grassland, forestland, and bare land have the best agreements (Table 12).
For the year 2020, real and simulated LULC were constructed. As a result, the forest cover was shown to be remarkably similar in both real and simulated maps of the year 2020, while only minor changes were shown for other LULC classes (Figure 9). According to the area covered by the two maps, all land use/land cover classes have the best range of agreement with a rate of variation under 10%. In order to validate the model, a comparison of the simulated and real LULC maps for 2020 was conducted using the Kappa Index of Agreement (KIA).
The actual and expected LULC changes for the 2020 period as well as the validation of the model or KIA statistics resulted in a reasonable degree of agreement between the actual and predicted maps for 2020 (Table 13). In a validation process, the agreement between the two maps (forecast and real) was assessed in terms of the quantity of pixels in each LULC class and the location of the pixels.
The simulated LULC map revealed that cultivated land and grassland coverage areas are overestimated, while areas covered by forests, bare land, and settlements are underestimated. The top and lower limits of Kappa are +1 (when there is absolute agreement) and −1 (happens when agreement is less likely), and they show how well the actual and reference maps agree [55]. The IDRISI Selva environment version 17.0’s VALIDATE module was used to carry out the accuracy evaluation process. The overall K value (Kno = 0.8012, Klocations = 0.7842, Klocation Strata = 0.7842, Kstandard = 0.7563) above 0.75 shows satisfactory level of accuracy. Therefore, the CA-Markov model is strong to simulate the future for precise forecast of future LULC changes (Table 13).
Nonetheless, the overall KIA showed a high level of agreement, and the criteria varied from 75% to 100% [42,49,67]. This shows that the real and simulated LULC maps have a strong agreement [24,110,111]. Therefore, the CA-Markov model is an effective tool and is reliable to simulate, predict, and analyze different changes in LULC in 2020 and 2050. This demonstrates a good correlation between the real and simulated LULC maps and supports other research findings [22,42,112] that suggested the CA-Markov model might be used to predict LULC changes
Table 14 showed the major FOM components to validate the LULC simulation in the Matenchose watershed. The figure of merit is 50.5%, which is the size of Hits as a percentage of the sum of sizes of the four components. Wrong Hits (20.48%) was the second-largest category, followed by False Alarm (15.08%) and Misses (13.9%). The obtained FOM was higher than in some previous case studies [69,113,114].

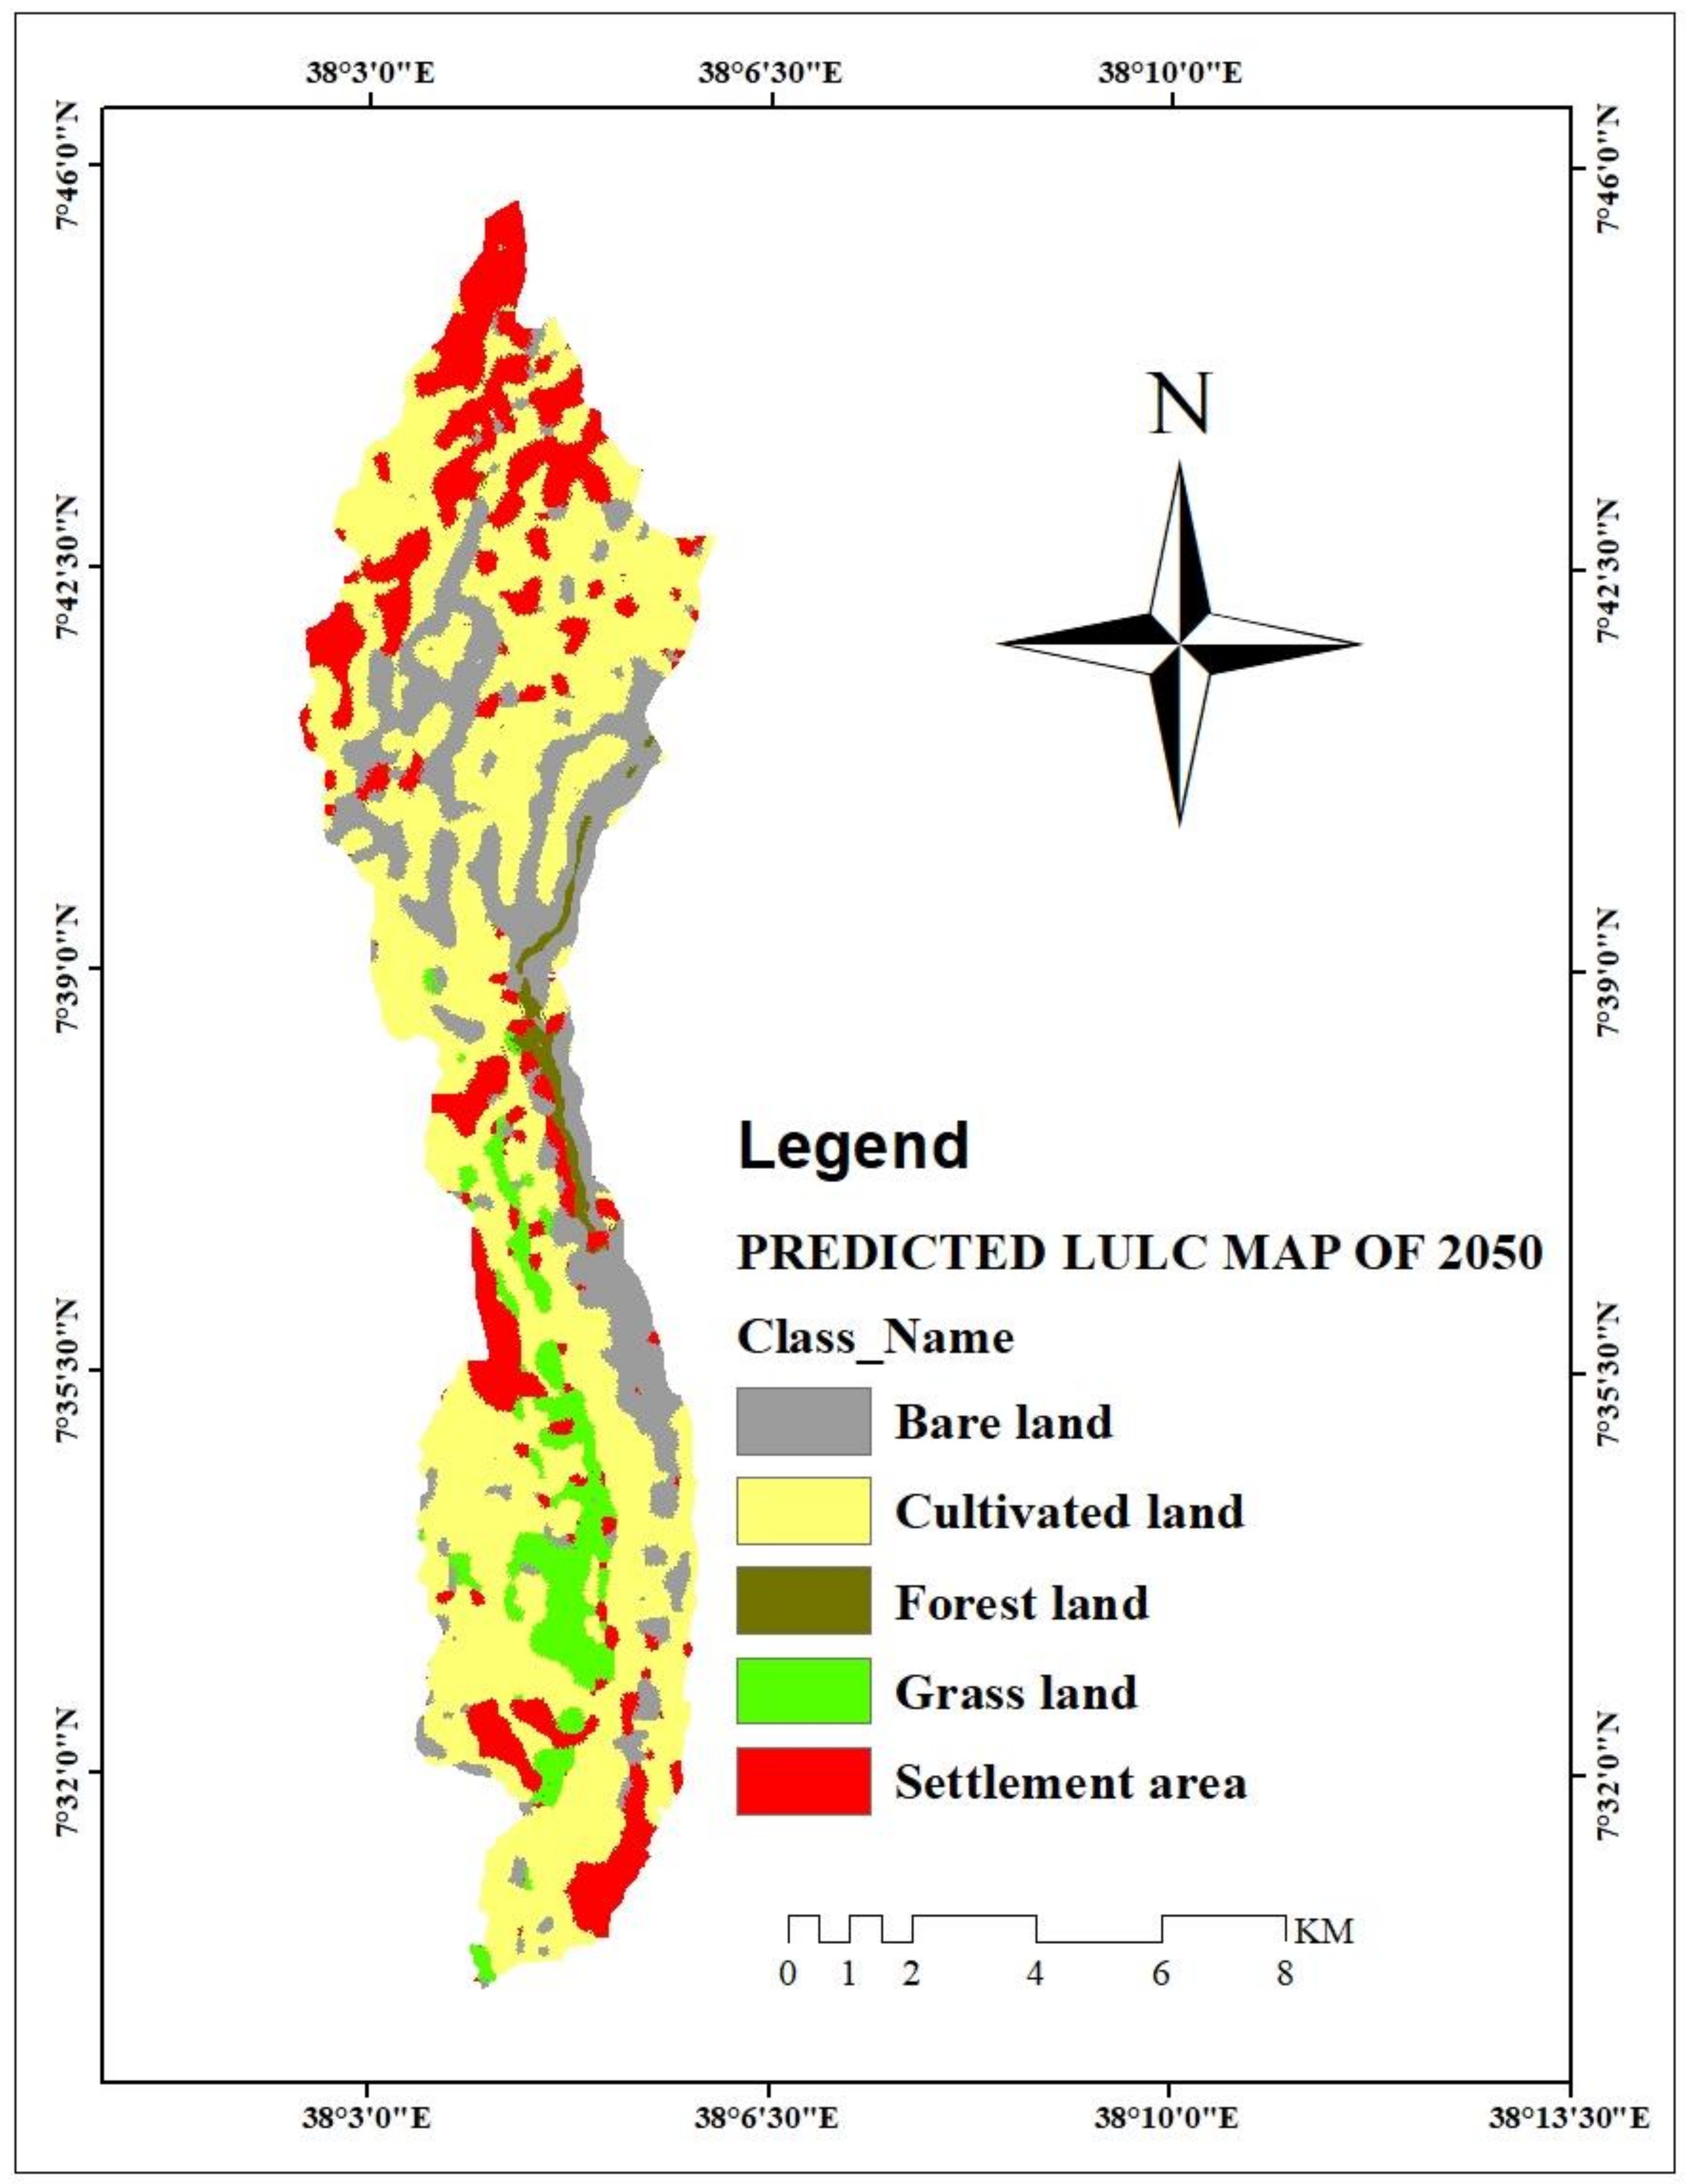
3.4. Future LULC Change with CA-Markov for 2050

Using the land use map of the 1991–2020 transition area matrixes and the 2020 transition potential map, the validation model was put into operation to anticipate the following 30-year land use and cover (2050) based on how well the validation model performed for 2020. As shown in Figure 10 and Table 15, the predicted land use and land cover were calculated using the CA-Markov model. The acreage of grassland declined from 792.264 ha in 2020 to 615.6 ha in 2050, while the area of forestland decreased from 348.924 ha to 126.45 ha (Table 15).
Our results show that from 2020 (52%) to 2050 (55%) and 2020 (17%) to 2050 (18%), respectively, a steady growth in cultivated land and settlement area will be seen. In contrast, the percentage of bare land will decline from 2020 (20%) to 2050 (19%), and its area coverage will fall from 1986.38 ha to 1946.33 ha in 2020 and 2050, respectively. In addition, cultivated land and settlement rose by 3% and 1%, respectively, compared to LULC 2020–2050, whereas grassland and forestland declined by 2% and 3%, respectively (Figure 10). It is anticipated that as population and cultivation grow, grassland and forestland will lose out.
In this study, an increasing trend can be seen in the area of cultivated land that is anticipated to be covered by 2050, accounting for 55.46% of the total area of the watershed, followed by the settlement area, which is at 17.63%. On the other hand, a decreasing trend can be seen for bare land, grassland, and forestland. Ethiopian lands were converted from forest, grazing, and shrubland to bare land and farmland cover, according to historical land use and cover change study [115]. The next 30 years are anticipated to continue this pattern (2050). Thus, the trend has put stress on the forest, which supports grassland and biodiversity. Because the community’s livelihood depends on a growth in the local human population, which will expand the settlement area by the year 2020, the conversion of other land cover types to cultivated land may be necessary. It is generally anticipated that over the 2020 and 2050 time periods, cultivated land and settlement areas will continue to increase at the expense of natural vegetation covers if appropriate management measures are not implemented. In addition, the expansion of cultivated land and built-up areas, as well as the reduction in forest, shrubland, and grassland, were predicted to continue in 2030 and 2045 [24].

3.5. LULC Change Analysis Using Land Change Model

Using the change analysis tool accessible in the Land Change Model (LCM) in Terrset, it was possible to examine the land change evaluated by gains and losses experienced by various classes using LULC maps from 1991, 2003, and 2020, and the projected future LULC map of 2050. A significant change was observed from the change analysis result in LULC between 1991 and 2050. In the Matenchose watershed, cultivated land and settlement areas were increased by 139.4% and 360%, respectively, whereas grassland, bare land, and forestland declined by 77.36%, 81.01%, and 6.26%, respectively (Figure 11).
This could be attributed to the increase in human population, the expansion of agricultural activities, and the cutting down of trees for fuel in the Matenchose watershed. Additionally, deforestation activities were widespread in the study area and contributed to the land use change because of weak land use policy [109]. Few studies have attempted to predict how LULCCs will develop over the course of Ethiopian river basins, primarily using CA-Markov Chain models, which allow for the accounting of both physical and social causes of LULC dynamics [24,27,112,116]. In comparison to other approaches, this tool is efficient and consistent to model, predict, and analyze various deviations of LULC in 2020 and 2050 in the studied watershed of the main rift (Figure 11). The CA-Markov model may be used as an effective model in the prediction of LULC changes, as demonstrated by the same types of agreement and disagreement that were obtained [22].
The 2050 forecast revealed a decrease in grassland and forests, while increasing cropland and settlements at the expense of grassland and forests in the predicted period, which is consistent with earlier findings [18,24,116].
The application of CA-Markov has its limitations; mostly it was the non-accountability of human influences and government policies that affect the behavior of the farmers and occupants of the land while modeling a situation. Moreover, the unavailability of high-resolution imagery of socioeconomic drivers also limits the power of CA-Markov analysis, because in some cases factors that drove the change in land use in the past are assumed to remain the same in the future [117].

4. Conclusions

This study has demonstrated the widespread, accelerating, and important process of changing land use and land cover in the study watershed. Between 1991 and 2020, there was a sharp decrease in grassland and forest areas, while there was a sharp increase in cultivated land and settlement area. In comparison to other land use and land cover types, agricultural land is expanding most rapidly. The predicted 2050 LULC result also showed that the trend from historical to future land use and land cover change will be expanded to be ongoing in the future.
The LULC scenario forecast indicated that this LULC would last into 2050; this would make the Matenchose watershed more susceptible to soil erosion and effects on the watershed’s hydrology. Therefore, in order to promote sustainable development, safeguard the watershed, and lessen the severity of the changes, appropriate physical soil conservation measures, specifically bunds, depending on the slope of the Matenchose watershed, must be planned and implemented by watershed communities with the support of watershed experts.
Based on the respondents’ ranking, the main drivers of LULC changes were identified as agricultural expansion, human population, and fuel wood extraction. Moreover, results from the focus group discussion (FGD) also confirmed that population growth has resulted in further expansion of agricultural land as expanses of forestland. Generally, substantial LULC changes were observed and will most likely continue onward until the specified future period of this study.
In order to manage land resources sustainably, society must be educated about the best ways to use natural resources, implement effective soil and water conservation measures, and reduce pressure from external factors such as population growth. Additional research is needed to address the specific land management practices, and it is important to identify any potential impacts of anthropogenic and socioeconomic elements in order to take further action. Moreover, more research in the area of the impact of LULC changes on climate and hydrology is proposed. The results obtained from current and future land use and land cover changes in the Matenchose watershed could be taken as inputs for policymakers to revise land use policies.
The watershed’s quick and significant LULC changes could have negative environmental effects. The investigation of LULC change revealed a decrease in forest cover as well as a rapid increase in cultivated land and populated areas. To moderate the impact of land use land and cover change, there should be appropriate and ecologically sound natural resource management (NRM) interventions, such as agronomic measures which could be easily implemented through development agent support and that might be practiced in the identified research watershed.

Author Contributions

Conceptualization, M.M., S.M.L., and M.T.; Funding acquisition, S.M.L.; Investigation, M.T.; Methodology, M.M., S.M.L., and M.T.; Software, M.T.; Supervision, M.M.; Writing—original draft, M.T.; Writing—review and editing, M.M. and S.M.L. All authors have read and agreed to the published version of the manuscript.

Funding

Deutsche Forschungsgemeinschaft (DFG) and the Open Access Publication Fund of the University of Rostock (project number 325496636) funded this publication.

Institutional Review Board Statement

Not applicable.

Informed Consent Statement

Not applicable.

Data Availability Statement

The data presented in this study are available on request from the first author.

Acknowledgments

The authors are indebted to the Open Access Department of the University of Rostock for funding the APC.

Conflicts of Interest

The authors declare no conflict of interest.

References

  1. Hurni, H. Degradation and Conservation of the Resources in the Ethiopian Highlands. Mt. Res. Dev. 1988, 8, 123–130. [Google Scholar] [CrossRef]
  2. Rawat, J.S.; Biswas, V.; Kumar, M. Changes in land use/cover using geospatial techniques: A case study of Ramnagar town area, district Nainital, Uttarakhand, India. Egypt. J. Remote Sens. Sp. Sci. 2013, 16, 111–117. [Google Scholar] [CrossRef]
  3. Beyamo, L.S. Assessment of Land Use Land Cover Dynamics and its Impact on Soil Loss: Using GIS and Remote Sensing, in Shashogo Woreda, Southern Ethiopia. Ph.D. Thesis, Addis Abeba University, Addis Ababa, Ethiopia, 2010. [Google Scholar]
  4. Wassie, S.B. Natural resource degradation tendencies in Ethiopia: A review. Environ. Syst. Res. 2020, 9, 33. [Google Scholar] [CrossRef]
  5. Moeyersons, J.; Nyssen, J.; Poesen, J.; Deckers, J.; Haile, M. Age and backfill/overfill stratigraphy of two tufa dams, Tigray Highlands, Ethiopia: Evidence for Late Pleistocene and Holocene wet conditions. Palaeogeogr. Palaeoclimatol. Palaeoecol. 2006, 230, 165–181. [Google Scholar] [CrossRef]
  6. Dagnachew, M.; Kebede, A.; Moges, A.; Abebe, A. Land Use Land Cover Changes and Its drivers in Gojeb River Catchment, Omo Gibe Basin, Ethiopia. J. Agric. Environ. Int. Dev. 2020, 114, 33–56. [Google Scholar] [CrossRef]
  7. Han, J.; Ge, W.; Hei, Z.; Cong, C.; Ma, C.; Xie, M.; Liu, B.; Feng, W.; Wang, F.; Jiao, J. Agricultural land use and management weaken the soil erosion induced by extreme rainstorms. Agric. Ecosyst. Environ. 2020, 301, 107047. [Google Scholar] [CrossRef]
  8. Moges, D.M.; Bhat, H.G. Integration of geospatial technologies with RUSLE for analysis of land use/cover change impact on soil erosion: Case study in Rib watershed, north-western highland Ethiopia. Environ. Earth Sci. 2017, 76, 765. [Google Scholar] [CrossRef]
  9. Moisa, M.B.; Negash, D.A.; Merga, B.B.; Gemeda, D.O. Impact of land-use and land-cover change on soil erosion using the RUSLE model and the geographic information system: A case of Temeji watershed, Western Ethiopia Geographic information systems. J. Water Clim. Change 2021, 12, 3404–3420. [Google Scholar] [CrossRef]
  10. Malek, Ž.; Verburg, P.H.; Geijzendorffer, I.R.; Bondeau, A.; Cramer, W. Global change effects on land management in the Mediterranean region. Glob. Environ. Chang. 2018, 50, 238–254. [Google Scholar] [CrossRef]
  11. Liu, X.; Liang, X.; Li, X.; Xu, X.; Ou, J.; Chen, Y.; Li, S.; Wang, S.; Pei, F. A future land use simulation model (FLUS) for simulating multiple land use scenarios by coupling human and natural effects. Landsc. Urban Plan. 2017, 168, 94–116. [Google Scholar] [CrossRef]
  12. Abedini, A.; Azizi, P. Prediction of future urban growth scenarios using SLEUTH model (Case study: Urmia city, Iran). Iran Univ. Sci. Technol. 2016, 26, 161–172. [Google Scholar] [CrossRef]
  13. Mekonnen, Y.; Hailu, A. Modeling Urban Growth and Land Use Transition Using SLEUTH Model: The Case of Dilla City, Ethiopia. preprint 2020. [Google Scholar] [CrossRef]
  14. Clarke, K.C.; Hoppen, S.; Gaydos, L. A Self-Modifying Cellular Automaton Model of Historical Urbanization in the San Francisco Bay Area. Environ. Plan. B Plan. Des. 1997, 24, 247–261. [Google Scholar] [CrossRef]
  15. Mekonnen, Y.; Ghosh, S.K. Urban Growth and Land Use Simulation Using SLEUTH Model for Adama City, Ethiopia BT—Advances of Science and Technology; Habtu, N.G., Ayele, D.W., Fanta, S.W., Admasu, B.T., Bitew, M.A., Eds.; Springer International Publishing: Cham, Switzerland, 2020; pp. 279–293. [Google Scholar]
  16. Fan, F.; Wang, Y.; Wang, Z. Temporal and spatial change detecting (1998–2003) and predicting of land use and land cover in Core corridor of Pearl River Delta (China) by using TM and ETM+ images. Environ. Monit. Assess. 2007, 137, 127. [Google Scholar] [CrossRef]
  17. Ghalehteimouri, J.; Shamsoddini, A.; Mousavi, M.; Binti Che Ros, F.; Khedmatzadeh, A. Predicting spatial and decadal of land use and land cover change using integrated cellular automata Markov chain model based scenarios (2019–2049) Zarriné-Rūd River Basin in Iran. Environ. Challenges 2022, 6, 100399. [Google Scholar] [CrossRef]
  18. Yirsaw, E.; Wu, W.; Shi, X.; Temesgen, H.; Bekele, B. Land Use/Land Cover Change Modeling and the Prediction of Subsequent Changes in Ecosystem Service Values in a Coastal Area of China, the Su-Xi-Chang Region. Sustainability 2017, 9, 1204. [Google Scholar] [CrossRef]
  19. Dey, N.N.; Al Rakib, A.; Kafy, A.-A.; Raikwar, V. Geospatial modelling of changes in land use/land cover dynamics using Multi-layer Perceptron Markov chain model in Rajshahi City, Bangladesh. Environ. Chall. 2021, 4, 100148. [Google Scholar] [CrossRef]
  20. Hamad, R.; Balzter, H.; Kolo, K. Predicting land use/land cover changes using a CA-Markov model under two different scenarios. Sustainability 2018, 10, 3421. [Google Scholar] [CrossRef]
  21. Girma, R.; Fürst, C.; Moges, A. Land use land cover change modeling by integrating artificial neural network with cellular Automata-Markov chain model in Gidabo river basin, main Ethiopian rift. Environ. Chall. 2022, 6, 100419. [Google Scholar] [CrossRef]
  22. Halmy, M.W.; Gessler, P.E.; Hicke, J.A.; Salem, B.B. Land use/land cover change detection and prediction in the north-western coastal desert of Egypt using Markov-CA. Appl. Geogr. 2015, 63, 101–112. [Google Scholar] [CrossRef]
  23. Garedew, E.; Sandewall, M.; Söderberg, U.; Campbell, B.M. Land-Use and Land-Cover Dynamics in the Central Rift Valley of Ethiopia. Environ. Manag. 2009, 44, 683–694. [Google Scholar] [CrossRef] [PubMed]
  24. Gashaw, T.; Tulu, T.; Argaw, M.; Worqlul, A.W. Evaluation and prediction of land use/land cover changes in the Andassa watershed, Blue Nile Basin, Ethiopia. Environ. Syst. Res. 2017, 6, 17. [Google Scholar] [CrossRef]
  25. Kura, A.L.; Beyene, D.L. Cellular automata Markov chain model based deforestation modelling in the pastoral and agro-pastoral areas of southern Ethiopia. Remote Sens. Appl. Soc. Environ. 2020, 18, 100321. [Google Scholar] [CrossRef]
  26. Leta, M.K.; Demissie, T.A.; Tränckner, J. Modeling and Prediction of Land Use Land Cover Change Dynamics Based on Land Change Modeler (LCM) in Nashe Watershed, Upper Blue Nile Basin, Ethiopia. Sustainability 2021, 13, 3740. [Google Scholar] [CrossRef]
  27. Mohamed, A.; Worku, H. Simulating urban land use and cover dynamics using cellular automata and Markov chain approach in Addis Ababa and the surrounding. Urban Clim. 2020, 31, 100545. [Google Scholar] [CrossRef]
  28. Belay, T.; Mengistu, D.A. Impacts of land use/land cover and climate changes on soil erosion in Muga watershed, Upper Blue Nile basin (Abay), Ethiopia. Ecol. Process. 2021, 10, 68. [Google Scholar] [CrossRef]
  29. CSA. Ethiopian Population Censes; Central Statistics Authority: Addis Ababa, Ethiopia, 2007. [Google Scholar]
  30. Bielli, C.; Berhanu, G.; Isaias, A.; Orasi, A. Population Growth and Environment; CSA: Addis Ababa, Ethiopia, 2001. [Google Scholar] [CrossRef]
  31. Dereje, B.; Nedaw, D. Groundwater Recharge Estimation Using WetSpass Modeling in Upper Bilate Catchment, Southern Ethiopia. Momona Ethiop. J. Sci. 2019, 11, 37. [Google Scholar] [CrossRef]
  32. Fischer, G.; Nachtergaele, F.; Prieler, S.; van Velthuizen, H.T.; Verelst, L.; Wiberg, D. Global Agro-Ecological Zones Assessment for Agriculture; IIASA: Laxenburg, Austria; FAO: Rome, Italy, 2008. [Google Scholar]
  33. MOWR (Ministry of Water Resources). Rift Valley Lakes Basin Integrated Resources Development Master Plan Study Project; Halcrow Group Limited: London, UK; Generation Integrated Rural Development (GIRD) Consultants: Addis Ababa, Ethiopia, 2010. [Google Scholar]
  34. Woldemariam, G.; Iguala, A.D.; Tekalign, S.; Reddy, R.U. Spatial Modeling of Soil Erosion Risk and Its Implication for Conservation Planning: The Case of the Gobele Watershed, East Hararghe Zone, Ethiopia. Land 2018, 7, 25. [Google Scholar] [CrossRef]
  35. Alawamy, J.S.; Balasundram, S.K.; Hanif, A.H.M.; Sung, C.T.B. Detecting and analyzing land use and land cover changes in the Region of Al-Jabal Al-Akhdar, Libya using time-series landsat data from 1985 to 2017. Sustainability 2020, 12, 4490. [Google Scholar] [CrossRef]
  36. Dibaba, W.T.; Demissie, T.A.; Miegel, K. Watershed Hydrological Response to Combined Land Use/Land Cover and Climate Change in Highland Ethiopia: Finchaa Catchment. Water 2020, 12, 1801. [Google Scholar] [CrossRef]
  37. Koko, A.F.; Yue, W.; Abubakar, G.A.; Hamed, R.; Alabsi, A.A. Monitoring and Predicting Spatio-Temporal Land Use/Land Cover Changes in Zaria City, Nigeria, through an Integrated Cellular Automata and Markov Chain Model (CA-Markov). Sustainability 2020, 12, 10452. [Google Scholar] [CrossRef]
  38. Abate, S. Evaluating the Land Use and Land Cover Dynamics in Borenaworeda of South Wollo Highlands, Ethiopia. J. Sustain. Dev. Africa 2011, 13, 87–107. [Google Scholar]
  39. Bewket, W.; Teferi, E. Assessment of soil erosion hazard and prioritization for treatment at the watershed level: Case study in the Chemoga watershed, Blue Nile basin, Ethiopia. Land Degrad. Dev. 2009, 20, 609–622. [Google Scholar] [CrossRef]
  40. Gelagay, H.S.; Minale, A.S. Soil loss estimation using GIS and Remote sensing techniques: A case of Koga watershed, Northwestern Ethiopia. Int. Soil Water Conserv. Res. 2016, 4, 126–136. [Google Scholar] [CrossRef]
  41. Gashaw, T.; Tulu, T.; Argaw, M. Erosion risk assessment for prioritization of conservation measures in Geleda watershed, Blue Nile basin, Ethiopia. Environ. Syst. Res. 2018, 6, 1. [Google Scholar] [CrossRef]
  42. Tadese, S.; Soromessa, T.; Bekele, T. Analysis of the Current and Future Prediction of Land Use/Land Cover Change Using Remote Sensing and the CA-Markov Model in Majang Forest Biosphere Reserves of Gambella, Southwestern Ethiopia. Sci. World J. 2021, 2021, 6685045. [Google Scholar] [CrossRef]
  43. Foody, G.M. Status of land cover classification accuracy assessment. Remote Sens. Environ. 2002, 80, 9–16. [Google Scholar] [CrossRef]
  44. Congalton, R.G.; Green, K. Assessing the Accuracy of Remotely Sensed Data: Principles and Practices, 3rd ed.; Taylor & Francis Group Routledge: Oxfordshire, UK, 2019. [Google Scholar]
  45. Okeke, F.; Karnieli, A. Methods for fuzzy classification and accuracy assessment of historical aerial photographs for vegetation change analyses. Part I: Algorithm development. Int. J. Remote Sens. 2006, 27, 153–176. [Google Scholar] [CrossRef]
  46. Verburg, P.H.; de Nijs, T.C.M.; Ritsema van Eck, J.; Visser, H.; de Jong, K. A method to analyse neighbourhood characteristics of land use patterns. Comput. Environ. Urban Syst. 2004, 28, 667–690. [Google Scholar] [CrossRef]
  47. Koomen, E.; Borsboom, J.v.B. Land-Use Modelling in Planning Practice; Springer Nature: Berlin, Germany, 2011. [Google Scholar]
  48. Subedi, P.; Subedi, K.; Thapa, B. Application of a Hybrid Cellular Automaton-Markov (CA-Markov) Model in Land-Use Change Prediction: A Case Study of Saddle Creek Drainage Basin, Florida. Appl. Ecol. Environ. Sci. 2013, 1, 126–132. [Google Scholar] [CrossRef] [Green Version]
  49. Pontius, G.R.; Malanson, J. Comparison of the structure and accuracy of two land change models. Int. J. Geogr. Inf. Sci. 2005, 19, 243–265. [Google Scholar] [CrossRef]
  50. Guan, D.; Li, H.; Inohae, T.; Su, W.; Nagaie, T.; Hokao, K. Modeling urban land use change by the integration of cellular automaton and Markov model. Ecol. Model. 2011, 222, 3761–3772. [Google Scholar] [CrossRef]
  51. Ye, B.; Bai, Z. Simulating Land Use/Cover Changes of Nenjiang County Based on CA-Markov Model BT—Computer and Computing Technologies in Agriculture; Li, D., Ed.; Springer: Boston, MA, USA, 2008; Volume I, pp. 321–329. [Google Scholar]
  52. Abdulrahman, A.I.; Ameen, S.A. Predicting Land use and land cover spatiotemporal changes utilizing CA-Markov model in Duhok district between 1999 and 2033. Acad. J. Nawroz Univ. 2020, 9, 71–80. [Google Scholar] [CrossRef]
  53. Hasan, S.; Shi, W.; Zhu, X. Impact of land use land cover changes on ecosystem service value—A case study of Guangdong, Hong Kong, and Macao in South China. PLoS ONE 2020, 15, e0231259. [Google Scholar] [CrossRef]
  54. Zubair, A.O. Change detection in land use and land cover using RS & GIS; A Case Study of Ilorin and Its Environs in Kwara State. Master’s Thesis, University of Ibadan, Ibadan, Nigeria, 2006. [Google Scholar]
  55. Arsanjani, J.J.; Helbich, M.; Kainz, W.; Boloorani, A.D. Integration of logistic regression, Markov chain and cellular automata models to simulate urban expansion. Int. J. Appl. Earth Obs. Geoinf. 2013, 21, 265–275. [Google Scholar] [CrossRef]
  56. Gong, W.; Yuan, L.; Fan, W.; Stott, P. Analysis and simulation of land use spatial pattern in harbin prefecture based on trajectories and cellular automata-markov modelling. Int. J. Appl. Earth Obs. Geoinf. 2015, 34, 207–216. [Google Scholar] [CrossRef]
  57. Weng, Q. Land use change analysis in the Zhujiang Delta of China using satellite remote sensing, GIS and stochastic modelling. J. Environ. Manage. 2002, 64, 273–284. [Google Scholar] [CrossRef]
  58. Sang, L.; Zhang, C.; Yang, J.; Zhu, D.; Yun, W. Simulation of land use spatial pattern of towns and villages based on CA–Markov model. Math. Comput. Model. 2011, 54, 938–943. [Google Scholar] [CrossRef]
  59. Hasan, M.E.; Nath, B.; Sarker, A.H.M.R.; Wang, Z.; Zhang, L.; Yang, X.; Nobi, M.N.; Røskaft, E.; Chivers, D.J.; Suza, M. Applying multi-temporal landsat satellite data and markov-cellular automata to predict forest cover change and forest degradation of sundarban reserve forest, Bangladesh. Forests 2020, 11, 1016. [Google Scholar] [CrossRef]
  60. Behera, M.D.; Borate, S.N.; Panda, S.N.; Behera, P.R.; Roy, P.S. Modelling and analyzing the watershed dynamics using Cellular Automata (CA)–Markov model—A geo-information based approach. J. Earth Syst. Sci. 2012, 121, 1011–1024. [Google Scholar] [CrossRef] [Green Version]
  61. Kumar, S.; Radhakrishnan, N.; Mathew, S. Land use change modelling using a Markov model and remote sensing. Geomat. Nat. Hazards Risk 2014, 5, 145–156. [Google Scholar] [CrossRef]
  62. Fitawok, M.B.; Derudder, B.; Minale, A.S.; Van Passel, S.; Adgo, E.; Nyssen, J. Modeling the impact of urbanization on land-use change in Bahir Dar City, Ethiopia: An integrated cellular automata-markov chain approach. Land 2020, 9, 115. [Google Scholar] [CrossRef]
  63. Memarian, H.; Balasundram, S.K.; Bin Talib, J.; Teh, C.; Sung, B.; Sood, A.M.; Abbaspour, K. Validation of CA-Markov for Simulation of Land Use and Cover Change in the Langat Basin, Malaysia. J. Geogr. Inf. Syst. 2012, 4, 542–554. [Google Scholar] [CrossRef]
  64. Hua, A.K. Application of CA-Markov model and land use/land cover changes in Malacca river watershed, Malaysia. Appl. Ecol. Environ. Res. 2017, 15, 605–622. [Google Scholar] [CrossRef]
  65. Ahmed, B.; Kamruzzaman, M.D.; Zhu, X.; Shahinoor Rahman, M.D.; Choi, K. Simulating land cover changes and their impacts on land surface temperature in Dhaka, Bangladesh. Remote Sens. 2013, 5, 5969–5998. [Google Scholar] [CrossRef]
  66. Jiang, W.; Chen, Z.; Lei, X.; Jia, K.; Wu, Y. Simulating urban land use change by incorporating an autologistic regression model into a CLUE-S model. J. Geogr. Sci. 2015, 25, 836–850. [Google Scholar] [CrossRef]
  67. Pontius, R.G.; Schneider, L.C. Land-cover change model validation by an ROC method for the Ipswich watershed, Massachusetts, USA. Agric. Ecosyst. Environ. 2001, 85, 239–248. [Google Scholar] [CrossRef]
  68. Omar, N.Q.; Ahamad, M.S.S.; Wan Hussin, W.M.A.; Samat, N.; Binti Ahmad, S.Z.; Markov, C.A. Multi Regression, and Multiple Decision Making for Modeling Historical Changes in Kirkuk City, Iraq. J. Indian Soc. Remote Sens. 2014, 42, 165–178. [Google Scholar] [CrossRef]
  69. Pontius, R.G.; Boersma, W.; Castella, J.-C.; Clarke, K.; de Nijs, T.; Dietzel, C.; Duan, Z.; Fotsing, E.; Goldstein, N.; Kok, K.; et al. Comparing the input, output, and validation maps for several models of land change. Ann. Reg. Sci. 2008, 42, 11–37. [Google Scholar] [CrossRef]
  70. Pontius, R.G.; Peethambaram, S.; Castella, J.C. Comparison of three maps at multiple resolutions: A case study of land change simulation in cho don district, Vietnam. Ann. Assoc. Am. Geogr. 2011, 101, 45–62. [Google Scholar] [CrossRef]
  71. Gharaibeh, A.; Shaamala, A.; Obeidat, R.; Al-Kofahi, S. Improving land-use change modeling by integrating ANN with Cellular Automata-Markov Chain model. Heliyon 2020, 6, e05092. [Google Scholar] [CrossRef]
  72. Kim, Y.; Newman, G.; Güneralp, B. A Review of Driving Factors, Scenarios, and Topics in Urban Land Change Models. Land 2020, 9, 246. [Google Scholar] [CrossRef]
  73. Chowdhury, M.; Hasan, M.E.; Abdullah-Al-Mamun, M.M. Land use/land cover change assessment of Halda watershed using remote sensing and GIS. Egypt. J. Remote Sens. Space Sci. 2020, 23, 63–75. [Google Scholar] [CrossRef]
  74. Eastman, J.R. TerrSet Manual, Geospatial Monitoring and Modeling System; Clark Labs Clark University: Worcester, MA, USA, 2016. [Google Scholar]
  75. Islam, K.; Rahman, M.F.; Jashimuddin, M. Modeling land use change using Cellular Automata and Artificial Neural Network: The case of Chunati Wildlife Sanctuary, Bangladesh. Ecol. Indic. 2018, 88, 439–453. [Google Scholar] [CrossRef]
  76. Tilahun, A.; Teferie, B. Accuracy Assessment of Land Use Land Cover Classification using Google Earth. Am. J. Environ. Prot. 2015, 4, 193–198. [Google Scholar] [CrossRef]
  77. Mathewos, M.; Dananto, M.; Erkossa, T.; Mulugeta, G. Land Use Land Cover Dynamics at Bilate Alaba Sub-watershed, Southern Ethiopia. J. Appl. Sci. Environ. Manag. 2019, 23, 1521–1528. [Google Scholar] [CrossRef]
  78. Wubie, M.A.; Assen, M.; Nicolau, M.D. Patterns, causes and consequences of land use/cover dynamics in the Gumara watershed of lake Tana basin, Northwestern Ethiopia. Environ. Syst. Res. 2016, 5, 8. [Google Scholar] [CrossRef]
  79. Maitima, J.M.; Mugatha, S.M.; Reid, R.S.; Gachimbi, L.N.; Majule, A.; Lyaruu, H.; Pomery, D.; Mathai, S.; Mugisha, S. The linkages between land use change, land degradation and biodiversity across East Africa. Afr. J. Environ. Sci. Technol. 2009, 3, 310–325. [Google Scholar]
  80. Hailu, A.; Mammo, S.; Kidane, M. Dynamics of land use, land cover change trend and its drivers in Jimma Geneti District, Western Ethiopia. Land Use Policy 2020, 99, 105011. [Google Scholar] [CrossRef]
  81. Tefera, M.M. Land-use/land-cover dynamics in Nonno district, central Ethiopia. J. Sustain. Dev. Africa 2011, 13, 123–141. [Google Scholar]
  82. Othow, O.O.; Gebre, S.L.; Gemeda, D.O. Analyzing the Rate of Land Use and Land Cover Change and Determining the Causes of Forest Cover Change in Gog District, Gambella Regional. J. Remote Sens. GIS 2017, 6, 218. [Google Scholar] [CrossRef]
  83. Berihun, M.L.; Tsunekawa, A.; Haregeweyn, N.; Meshesha, D.T.; Adgo, E.; Tsubo, M.; Masunaga, T.; Fenta, A.A.; Sultan, D.; Yibeltal, M. Exploring land use/land cover changes, drivers and their implications in contrasting agro-ecological environments of Ethiopia. Land Use Policy 2019, 87, 104052. [Google Scholar] [CrossRef]
  84. Getachew, H.E.; Melesse, A.M. The Impact of Land Use Change on the Hydrology of the Angereb Watershed, Ethiopia. Int. J. Water Sci. 2012, 1, 1–7. [Google Scholar] [CrossRef]
  85. Molla, M.B. Land Use/Land Cover Dynamics in the Central Rift Valley Region of Ethiopia: Case of Arsi Negele District. African J. Agric. Res. 2015, 10, 434–449. [Google Scholar] [CrossRef]
  86. Sewnet, A.; Abebe, G. Land use and land cover change and implication to watershed degradation by using GIS and remote sensing in the Koga watershed, North Western Ethiopia. Earth Sci. Inform. 2018, 11, 99–108. [Google Scholar] [CrossRef]
  87. Zeleke, G.; Hurni, H. Implications of Land Use and Land Cover Dynamics for Mountain Resource Degradation in the Northwestern Ethiopian Highlands Implications of Land Use and Land Cover Dynamics for Mountain Resource Degradation in the Northwestern Ethiopian Highlands. Mt. Res. Dev. 2001, 21, 184–191. [Google Scholar] [CrossRef]
  88. Kindu, M.; Schneider, T.; Teketay, D.; Knoke, T. Land Use/Land Cover Change Analysis Using Object-Based Classification Approach in Munessa-Shashemene Landscape of the Ethiopian Highlands. Remote Sens. 2013, 5, 2411–2435. [Google Scholar] [CrossRef]
  89. Gashaw, T.; Bantider, A.; Mahari, A. Evaluations of Land Use/Land Cover Changes and Land Degradation in Dera District, Ethiopia: GIS and Remote Sensing Based Analysis. Int. J. Sci. Res. Environ. Sci. 2014, 2, 199–208. [Google Scholar] [CrossRef]
  90. Hailemariam, S.N.; Soromessa, T.; Teketay, D. Land Use and Land Cover Change in the Bale Mountain Eco-Region of Ethiopia during 1985 to 2015. Land 2016, 5, 41. [Google Scholar] [CrossRef]
  91. Kasaye, A. Land Use Land Cover Change and Its Implication on Surface Runoff: A Case Study of Baro River Basin in South Western Ethiopia. J. Environ. Earth Sci. 2015, 5, 53–57. [Google Scholar]
  92. Bewket, W. Land cover dynamics since the 1950s in Chemoga watershed, Blue Nile basin, Ethiopia. Mt. Res. Dev. 2002, 22, 263–269. [Google Scholar] [CrossRef]
  93. Mosammam, H.M.; Nia, J.T.; Khani, H.; Teymouri, A.; Kazemi, M. Monitoring land use change and measuring urban sprawl based on its spatial forms: The case of Qom city. Egypt. J. Remote Sens. Space Sci. 2017, 20, 103–116. [Google Scholar] [CrossRef]
  94. Wondrade, N.; Dick, Ø.B.; Tveite, H. GIS based mapping of land cover changes utilizing multi-temporal remotely sensed image data in Lake Hawassa Watershed, Ethiopia. Environ. Monit. Assess. 2014, 186, 1765–1780. [Google Scholar] [CrossRef] [PubMed]
  95. Degife, A.; Worku, H.; Gizaw, S.; Legesse, A. Land use land cover dynamics, its drivers and environmental implications in Lake Hawassa Watershed of Ethiopia. Remote Sens. Appl. Soc. Environ. 2019, 14, 178–190. [Google Scholar] [CrossRef]
  96. Gebreslassie, H. Land Use-Land Cover dynamics of Huluka watershed, Central Rift Valley, Ethiopia. Int. Soil Water Conserv. Res. 2014, 2, 25–33. [Google Scholar] [CrossRef]
  97. Desta, H.; Fetene, A. Land-use and land-cover change in Lake Ziway watershed of the Ethiopian Central Rift Valley Region and its environmental impacts. Land Use Policy 2020, 96, 104682. [Google Scholar] [CrossRef]
  98. Negassa, M.D.; Mallie, D.T.; Gemeda, D.O. Forest cover change detection using Geographic Information Systems and remote sensing techniques: A spatio-temporal study on Komto Protected forest priority area, East Wollega Zone, Ethiopia. Environ. Syst. Res. 2020, 9, 1. [Google Scholar] [CrossRef]
  99. Deep, S.; Saklani, A. Urban sprawl modeling using cellular automata. Egypt. J. Remote Sens. Space Sci. 2014, 17, 179–187. [Google Scholar] [CrossRef]
  100. Wang, W.; Zhang, C.; Allen, J.M.; Li, W.; Boyer, M.A.; Segerson, K.; Silander, J.A. Analysis and prediction of land use changes related to invasive species and major driving forces in the state of Connecticut. Land 2016, 5, 25. [Google Scholar] [CrossRef]
  101. Kindu, M.; Schneider, T.; Teketay, D.; Knoke, T. Drivers of land use/land cover changes in Munessa-Shashemene landscape of the south-central highlands of Ethiopia. Environ. Monit. Assess. 2015, 187, 452. [Google Scholar] [CrossRef]
  102. Shiferaw, A.; Puskur, R.; Tegegne, A.; Hoekstra, D. Innovation in forage development: Empirical evidence from Alaba Special District, southern Ethiopia. Dev. Pract. 2011, 21, 1138–1152. [Google Scholar] [CrossRef]
  103. Ramakrishna, G.; Demeke, A. An Empirical Analysis of Food Security in Ethiopia: The Case of North Wello. Africa Dev. 2002, 27, 127–143. [Google Scholar] [CrossRef]
  104. FAO. Ethiopian Highlands Reclamation Study, Final Report Vol. 1.Ethiopian Funds-in-Trust; Food and Agriculture Organization of the United Nations: Rome, Italy, 1986. [Google Scholar]
  105. Babiso, B.; Toma, S.; Bajigo, A. Land use/Land Cover Dynamics and its Implication on Sustainable Land Management in Wallecha Watershed, Southern Ethiopia. Glob. J. Sci. Front. Res. 2016, 16, 49–53. [Google Scholar]
  106. CSA. National Population Statistics. Federal Democratic Republic of Ethiopia; Central Statistical Authority: Addis Ababa, Ethiopia, 1994. [Google Scholar]
  107. Hurni, H.; Tato, K.; Zeleke, G. The implications of changes in population, land use, and land management for surface runoff in the Upper Nile Basin Area of Ethiopia. Mt. Res. Dev. 2005, 25, 147–154. [Google Scholar] [CrossRef] [Green Version]
  108. Kidane, Y.; Stahlmann, R.; Beierkuhnlein, C. Vegetation dynamics, and land use and land cover change in the Bale Mountains, Ethiopia. Environ. Monit. Assess. 2012, 184, 7473–7489. [Google Scholar] [CrossRef] [PubMed]
  109. Mengistu, D.A.; Waktola, D.K.; Woldetsadik, M. Detection and analysis of land-use and land- cover changes in the Midwest escarpment of the Ethiopian Rift Valley. J. Land Use Sci. 2012, 7, 239–260. [Google Scholar] [CrossRef]
  110. Singh, S.K.; Mustak, S.; Srivastava, P.K.; Szabó, S.; Islam, T. Predicting Spatial and Decadal LULC Changes Through Cellular Automata Markov Chain Models Using Earth Observation Datasets and Geo-information. Environ. Process. 2015, 2, 61–78. [Google Scholar] [CrossRef]
  111. Mishra, V.N.; Rai, P.K.; Mohan, K. Prediction of Land Use Changes Based on Land Change Modeler (LCM) Using Remote Sensing: A Case Study of Muzaffarpur (Bihar), India. J. Geogr. Inst. 2014, 64, 111–127. [Google Scholar] [CrossRef]
  112. Gidey, E.; Dikinya, O.; Sebego, R.; Segosebe, E.; Zenebe, A. Cellular automata and Markov Chain (CA_Markov) model-based predictions of future land use and land cover scenarios (2015–2033) in Raya, northern Ethiopia. Model. Earth Syst. Environ. 2017, 3, 1245–1262. [Google Scholar] [CrossRef]
  113. Yang, Y.; Zhang, S.; Liu, Y.; Xing, X.; de Sherbinin, A. Analyzing historical land use changes using a Historical Land Use Reconstruction Model: A case study in Zhenlai County, northeastern China. Sci. Rep. 2017, 7, 41275. [Google Scholar] [CrossRef]
  114. Yang, Y.; Zhang, S.; Yang, J.; Xing, X.; Wang, D. Using a Cellular Automata-Markov Model to Reconstruct Spatial Land-Use Patterns in Zhenlai County, Northeast China. Energies 2015, 8, 3882–3902. [Google Scholar] [CrossRef]
  115. Regasa, M.S.; Nones, M.; Adeba, D. A Review on Land Use and Land Cover Change in Ethiopian Basins. Land 2021, 10, 585. [Google Scholar] [CrossRef]
  116. Hishe, S.; Bewket, W.; Nyssen, J.; Lyimo, J. Analysing past land use land cover change and CA-Markov-based future modelling in the Middle Suluh Valley, Northern Ethiopia. Geocarto Int. 2020, 35, 225–255. [Google Scholar] [CrossRef]
  117. Ghosh, P.; Mukhopadhyay, A.; Chanda, A.; Mondal, P.; Akhand, A.; Mukherjee, S.; Nayak, S.K.; Ghosh, S.; Mitra, D.; Ghosh, T. Application of Cellular automata and Markov-chain model in geospatial environmental modeling—A review. Remote Sens. Appl. Soc. Environ. 2017, 5, 64–77. [Google Scholar] [CrossRef]
Figure 1. Matenchose watershed map.
Land 11 01632 g001
Figure 2. Mean monthly rainfall and temperature of the study area (1988–2020).
Land 11 01632 g002
Figure 3. The slope class map and DEM of the Matenchose watershed.
Land 11 01632 g003
Figure 4. Major soil types map of Matenchose Watershed.
Land 11 01632 g004
Figure 5. Methodological flow chart of LULC simulation and prediction of the 1991–2050.
Land 11 01632 g005
Figure 6. The LULC Map of Matenchose watershed in 1991.
Land 11 01632 g006
Figure 7. The LULC Map of Matenchose watershed in 2003.
Land 11 01632 g007
Figure 8. The LULC Map of Matenchose watershed in 2020.
Land 11 01632 g008
Figure 9. Matenchose Watershed LULC map of 2020, observed (a) and simulated (b).
Land 11 01632 g009
Figure 10. The LULC map of Matenchose watershed predicted for in 2050.
Land 11 01632 g010
Figure 11. The gains, losses and net change of LULC Matenchose Watershed area (1991, 2003, 2020 and 2050).
Land 11 01632 g011
Table 1. Satellite image used in this study area.
No.PathRowSensorAcquisition Date Spatial Resolution (m)Source
1169055TMDecember/28/199130 × 30USGS
2169055ETM+December/2/200330 × 30USGS
3169055OLIDecember/11/202030 × 30USGS
Table 2. Description of classified LULC in the Matenchose watershed.
Land Use and Land Cover ClassDescription
GrasslandGrazing lands are those with tiny grasses and other types of natural plants.
ForestlandArea covered by dense and tall trees both natural and plantations (>2 m height).
Bare landHighly degraded land areas with little to no vegetation cover, primarily with typical gullies and exposed rocks.
Cultivated landAreas designated for irrigation and rain-fed farming, as well as fallow fields and farmland with a mix of plants and trees.
SettlementA small town’s share of an urbanized area, including its markets, roads, and institutions such as schools, clinics, courts, and others.
Table 3. Accuracy assessment for 1991, 2003, and 2020 classified images.
Land Use and Land Cover 199120032020
User
Accuracy
Producer AccuracyUser
Accuracy
Producer AccuracyUser
Accuracy
Producer Accuracy
Cultivated lad94.489.594.194.996.295.0
Grassland 95.5491.392.896.393.593.5
Forestland92.0095.895.695.694.194.1
Bare land91.7095.794.196.991.495.5
Settlement 82.6786.496.893.796.296.2
Overall accuracy (%)91.5 95.4 95
Kappa coefficient0.89 0.94 0.94
Table 4. Land use land cover (LULC) classification of Matenchose watershed 1991, 2003, and 2020.
Land Use
Land Cover Classes
1991 2003 2020
Area (ha)Area (%)Area (ha)Area (%)Area (ha)Area (%)
Cultivated land2176.1222%3549.9236%5209.7352%
Grassland3498.7635%2914.9729%792.268%
Forestland1837.6318%415.854%348.923%
Bare land2119.0621%2318.3623%1986.3820%
Settlement area358.844%791.338%1653.1117%
Total9990.42100%9990.42100%9990.42100%
Table 5. Temporal and annual rate of change between 1991–2003, 2003–2020, and 1991–2020.
LULC Class199120032020Temporal (%) ChangeThe Annual Rate of the Change (%)
Area (ha)Area (ha)Area (ha)2003–19912020–20032020–19912003–19912020–20032020–1991
Cultivated land2176.123549.925209.736347139.405.252.764.81
Grassland3498.762914.96792.26−17−73−77−1.42−4.29−2.66
Forestland1837.63415.85348.92−77−16−81−6.42−4.77−2.79
Bare land2119.062318.361986.389−14−60.75−0.82−0.21
Settlement358.84791.331653.1112110936110.086.4112.45
Total9990.429990.429990.42
Table 6. LULC change matrices of the Matenchose watershed (1991–2003).
Change to LULC 2003 (ha)
Change from LULC 1991 (ha) Bare LandCultivated LandForest LandGrasslandSettlement AreaTotal
Bare land590.69922.848.36448.69169.452140.03
Cultivated land463.021030.419.55443.74215.222161.94
Forestland329.29428.69283.79717.8558.071817.69
Grassland899.151134.7222.851318.65226.833602.19
Settlement area58.67123.825.0654.2126.79268.55
Total2340.813640.48329.622983.14696.3663
Table 7. LULC change matrices of the Matenchose watershed (2003–2020).
Change to LULC 2020 (ha)
Bare LandCultivated LandForest LandGrasslandSettlement AreaTotal
change from LULC 2003 (ha)Bare land467.551255.129.7898.81308.182139.43
Cultivated land259.091485.837.8979.21329.802161.82
Forestland608.6679.19217.0456.55256.471817.84
Grassland524.551946.2821.37460.58649.943602.72
Settlement area46.01152.415.21916.4748.50268.61
Column total1905.795518.83261.29711.621592.88
Table 8. Cramer’s V values of LULC driver variables.
LULC
Driving Variables
Cramer’s V
Slope 0.1375
Elevation 0.2265
Population density0.4461
Distance to roads0.1574
Distance to streams0.1658
Table 9. The frequency of the major driving forces of LULC changes in the Matenchose watershed based on local farmers’ perceptions (N = 143).
LULC
Changes Drivers
%Rank
Agricultural activities97.91
Population pressure94.42
Livestock pressure92.33
Wood extraction91.94
Rainfall variability90.95
Land tenure83.96
Land degradation 82.57
Investment 62.98
Settlement 49.09
Table 10. Livestock density in Matenchose watershed.
LivestockQuantityTLU *Density/haLSU/ha
Cattle 36,83936,838.623.693.69
Donkey71304634.270.460.30
Horse22432243.010.220.22
Mule176202.700.020.02
Sheep25,9043885.630.390.06
Goat25,4523817.730.380.06
Poultry49,890249.450.020.00
Total147,63351,871.415.194.35
* TLU values are given as each cattle = 1, mule = 1.15, horse = 1, donkey = 0.65, sheep = 0.15, goat = 0.15, and poultry = 0.005 [103].
Table 11. The population size of Matenchose watershed between 1991 and 2020.
Year 1991200320072020
Population size (#)161,527229,309255,666359,413
Growth rate (%)2.922.722.622.5
Table 12. Comparison of actual and projected LULC 2020.
LULC ClassSimulatedObserved
Area (ha)%Area (ha)%
Cultivated land5410.10454%5209.7352%
Grassland877.72479%792.2648%
Forestland294.41093%348.9243%
Bare land1803.9118%1986.3820%
Settlement area1604.2716%1653.1117%
Total9990.42100%9990.42100%
Table 13. Statistical validation of the CA-Markov Chain model.
StatisticsValue (%)
Kstandard75.63
Kno80.12
Klocation78.42
Klocation Strata78.42
Table 14. The figure of merit (FOM) component LULC prediction.
ComponentValues Percentage
Hits0.493650.54
Misses0.135813.90
Wrong Hits 0.200020.48
False Alarm0.147315.08
Table 15. Comparison between LULC map 2020 and predicted CA-Markov LULC map of 2050.
LULC Class2020
Classified Area (ha)
(%)2050
Predicted Area (ha)
(%)
Cultivated land5209.7352.155540.9355.46
Grassland792.267.93615.606.16
Forestland348.923.49126.451.27
Bare land1986.3919.881946.3319.48
Settlement area1653.1116.551761.1117.63
Total9990.421009990.42100
Publisher’s Note: MDPI stays neutral with regard to jurisdictional claims in published maps and institutional affiliations.

