Article

Assessing Cultivated Land–Use Transition in the Major Grain-Producing Areas of China Based on an Integrated Framework

1
School of Tourism and Urban Management, Jiangxi University of Finance and Economics, Nanchang 330013, China
2
Institute of Ecological Civilization, Jiangxi University of Finance and Economics, Nanchang 330013, China
3
School of Public Policy and Administration, Chongqing University, Chongqing 400044, China
*
Author to whom correspondence should be addressed.
Land 2022, 11(10), 1622; https://doi.org/10.3390/land11101622
Submission received: 19 August 2022 / Revised: 13 September 2022 / Accepted: 20 September 2022 / Published: 22 September 2022
(This article belongs to the Special Issue Rethinking the Man-Land Relations in China)

Abstract

:
The cultivated land-use transition (CLUT) is the morphological result of changes in the cultivated land-use mode over time, and the result of the interaction and mutual restriction of the human land system. This paper applies a “spatial–functional” integrated framework to understand the structure and functioning of CLUTs, and quantitatively evaluates and visualizes CLUTs in the major grain-producing area in southern China. The results show that (1) the comprehensive CLUT index in the middle and lower reaches of the Yangtze River changed from 0.0480 to 0.0711 from 2001 to 2019 and indicated significant differences in the transition index between different regions. (2) The CLUT identified a positive aggregation effect under a 5% significance during the period, and the agglomeration degree of the spatial and functional transitions strengthened, which increased from 0.3776 to 0.4673 and from 0.2127 to 0.2952, respectively. (3) The gravity center of the CLUT demonstrated a pattern of migration from the southwest to the northeast, and the migration speed of the gravity center decreased from 2.9401 km/year to 1.2370 km/year. The migration direction of the gravity center for the spatial transition is opposite to the functional transition, and the migration speed of the gravity center for the spatial and functional transitions decreased from 8.3573 km/year to 1.0814 km/year, and from 3.2398 km/year to 1.0254 km/year, respectively. To address this transition, policymakers should formulate differentiated policies to promote the sustainable use of cultivated land through the spatial and functional transition of major grain-producing areas.

1. Introduction

Cultivated land is a key component to achieve sustainable development and ensure food security [1]. China has the third largest cultivated area in the world, but the per capita level is less than 1/2 of the global average. Since 1978, when socioeconomic reforms were implemented, China has experienced rapid development [2,3]. In 2000, in the opening year of the Tenth Five-Year Plan, the Chinese government stated that China’s conditions for promoting urbanization were gradually maturing, and it was necessary to accelerate the implementation of an urbanization strategy [4,5]. Therefore, Chinese urbanization has entered an accelerated development stage. The urbanization levels increased from 36.20% to 60.60%, and the average annual urbanization growth rate remained at 1.28% from 2000 to 2019 [6]. However, this achievement also led to corresponding social, economic, and ecological problems. These problems include disorderly construction land expansion, inefficient land use [7], abandoned villages [8,9], and the overexploitation of ecological resources, which lead to a significant depletion of cultivated land resources and serious non-agriculturalization and pollution [10]. With this context of the times, China’s cultivated land conditions are undergoing drastic changes. Accordingly, the cultivated land-use transition (CLUT) has become one of the most urgent issues to be addressed by the academic and governmental sectors. Land-use transition (LUT) originated in the 1990s at the University of Aberdeen in Scotland as the geographer Mather’s exploration of the forest transition hypothesis, which involves corresponding changes in land-use morphology during social development [11,12]. The research on LUT has expanded from forests to grasslands, waters, and cultivated land. Meanwhile, from the research perspective of land change from land-use/cover change (LUCC) to land-change science (LCS), LUT has become a frontier hotspot of land-system science [13].
In fact, CLUT is the main component of LUT, which continues the research results of LUT in terms of concept and connotation, and is a trend turning point of cultivated land-use morphology under long-term changes. In other words, it is a process of transition from one stable state to another stable state [14]. Existing studies usually decompose cultivated land-use morphology into dominant and recessive [15]. The former includes the amount of cultivated land, planting structure, and landscape pattern attributes. The latter includes attributes that are not easy to be directly observed, such as cultivated land quality, property rights, and management methods, and can only be obtained through investigation, testing, and analysis [16]. This applies, for example, to the soil chemical content of cultivated land. The dominant morphology of cultivated land is the direct expression of its space utilization status; therefore, the dominant morphology is also called the spatial morphology, and the two are essentially the same [17]. In order to present the recessive morphology of cultivated land more intuitively, this study starts from the functional morphology of cultivated land for transition diagnosis. The functional morphology perspective of cultivated land corresponds to the human demand for cultivated land and is a comprehensive manifestation of recessive morphology [18].
Based on the definition of cultivated land pattern, the current research in this field generally covers the CLUT path, index construction, spatiotemporal differentiation characteristics, and driving mechanism [19] and its relationship to social and economic activities [20]. Regarding the path of CLUT, most studies mainly focus on the expression of a single path of cultivated land morphology. From the perspective of spatial pattern, it focuses on the study of land-use/cover change [21]. Research on the recessive pattern has a wide range of perspectives, such as changes in cultivated land productivity, monitoring of soil quality, and conversion of property rights [22,23,24,25]. There is still a gap in the research on combining spatial morphology and functional morphology to comprehensively evaluate CLUT. In terms of index construction, the evaluation of CLUT is mainly to quantify the morphological changes of cultivated land [26]. For different scholars, the understanding of CLUT performance is different, and the selection of indicators is also prone to differences, which reduces the comparability between different studies. For instance, when choosing the evaluation index of the social function of arable land, some researchers consider it to be the ability of cultivated land to solve farmers’ work problems, and they select indicators such as agricultural income and the labor-carrying capacity of cultivated land; to the contrary, some researchers think that it is the faculty of cultivated land to produce food to feed the population, so the per capita food availability is selected for evaluation [27]. At the analysis level of the driving mechanism, the spatial econometric model is mainly used for quantitative research, and variables are selected from social and natural factors. However, qualitative research is the foundation of quantitative research, and the current logical analysis of the driving mechanism from a qualitative perspective is still relatively weak. In terms of the relationship with society and the economy, there are studies on the coupling and interaction mechanism of food production, agricultural–economic development, and rural labor transfer [28]. At the same time, CLUT is also usefully explored from the perspective of its ecological environment effect. At the regional level, the research mainly focuses on the national, provincial, and municipal regions. The cultivated land is mainly used for food production, and CLUT has a more profound impact on the main grain-producing areas than other areas. However, scholars have neglected the issue of CLUT in the main grain-producing areas, which limits the guidance and reference value for formulating policies for sustainable use of regional cultivated land. To sum up, it can be seen that the relevant research on CLUT still has an incomplete evaluation framework, inconsistent index selection criteria, weak qualitative analysis of the driving mechanism, and gaps in regional research [29].
The main grain-producing areas have faced the various tasks of stable grain production, economic growth, industrial upgrading, and ecological protection [30]. The population and economy here are highly dense, which puts enormous pressure on the local land supply and ecological environment. Undoubtedly, urban development has changed the morphology of cultivated land. Therefore, this paper takes the middle and lower reaches of the Yangtze River as the research area. In addition, we attempt to construct a “spatial–functional” integrated framework to evaluate the CLUT. In particular, the study aims to: (1) identify and construct the connotation of CLUT from multiple dimensions; (2) build a comprehensive evaluation index system to achieve a scientific and effective quantitative evaluation of a regional CLUT; (3) reveal the spatiotemporal variation laws and characteristics of the CLUT in the main grain-producing areas; and (4) put forward targeted strategies for the optimal utilization and reasonable transition of cultivated land.
The marginal contributions of this study are mainly in the following four parts. (1) Based on the perspective of the comprehensive “spatial–functional” pattern to explore the spatiotemporal characteristics of CLUT, which expands the definition of cultivated land-use pattern and enriches the related literature of CLUT; (2) the selection of CLUT indicators under the two morphologies is subdivided and explained, which provides an evaluation system that can be used for reference; (3) the driving mechanism of CLUT is described from the theoretical level. The driving principles of natural and socioeconomic policy, technology, and other factors are analyzed. It lays a theoretical foundation for carrying out qualitative research; (4) considering the particularity of the main grain-producing areas, it provides a research basis for the formulation of cultivated land-use policies in the study area and similar areas.

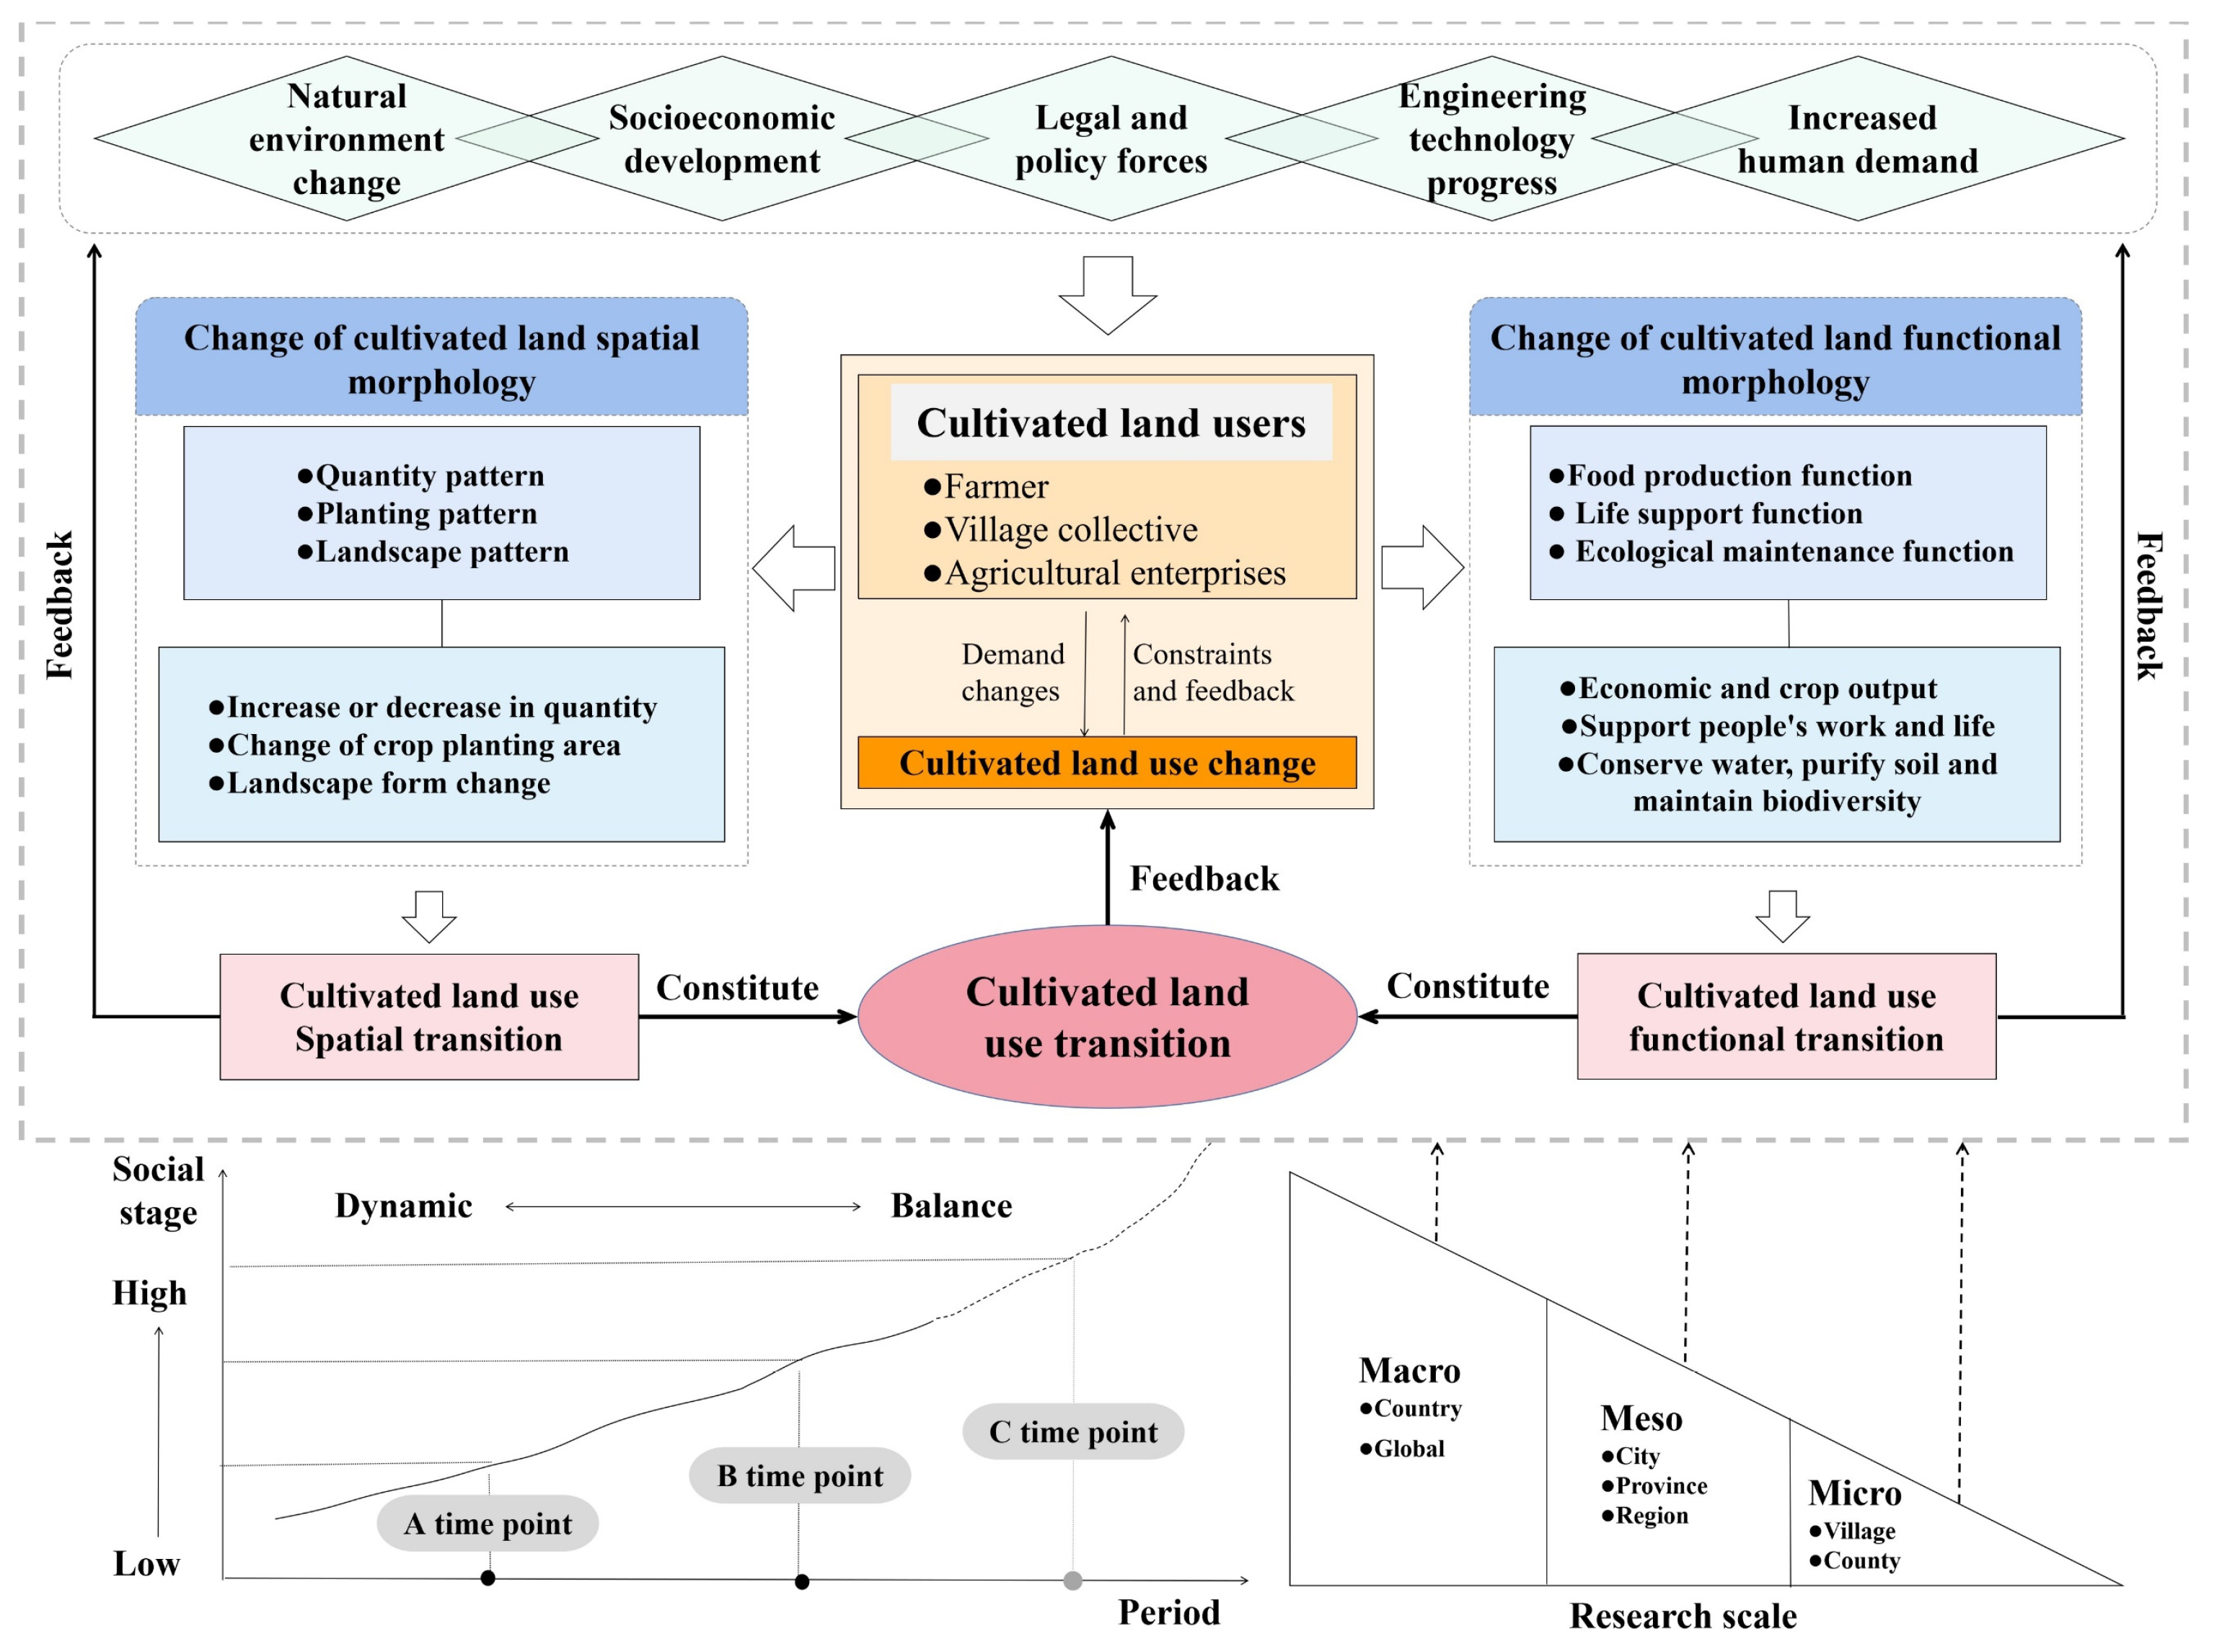
2. CLUT Interpretation Framework

As the social stage develops from point A to point B (Figure 1), which is mainly affected by the natural environment, socioeconomic policy, and technology [31], to meet the needs of the social development stage, the cultivated land users will adjust their cultivated land utilization behavior through the actual conditions of the cultivated land, and the cultivated land-use morphology will change accordingly. When the social stage develops toward a higher point C, the original cultivated land-use morphology at point B should continue to be adjusted accordingly [32]. Therefore, for different scales, the CLUT is an iterative process of dynamic balancing of the human–earth system interactions and joint constraints [33,34].
Thus, this study divides cultivated land-use morphology into two aspects: namely, spatial and functional. Spatial morphology consists of the amount of cultivated land, landscape, and crop planting structure [35]. Functional morphology reflects the types of cultivated land functions, which is an inherent attribute [36]. According to the classification of land-use functions (LUFs), the functions of cultivated land are divided into the three basic functions of crop production, life support, and ecological maintenance [37]. Therefore, this study constructs a “spatial–functional” integration framework to identify and construct the mechanism of CLUT from multiple dimensions, which is helpful to comprehensively identify and evaluate CLUT.
(1) Cultivated land-use spatial transition: When the social development level is low, due to the unclear property rights of cultivated land and underdeveloped agricultural technology, the social awareness of cultivated land protection is relatively weak and there is a disorderly expansion in cities. To ensure people’s rations, food crops have always been the main crops grown on cultivated land. With the progress of society and the gradual improvement of the agricultural system, people’s skills in using cultivated land will continue to increase, and more attention will be given to promoting the sustainability of cultivated land use. The national government will take relevant measures to curb the reduction of the cultivated land area and ensure quality degradation so that the amount of cultivated land may show a trend of “decrease–stable–increase” [38]. For example, China currently implements strict cultivated farmland requisition–compensation-balance policies to ensure the stability of the amount of cultivated land. To facilitate agricultural production, people constantly adjust the distribution pattern of cultivated land plots through engineering means, and the landscape pattern of cultivated land will develop in a concentrated, continuous, and regular direction [39]. Moreover, against the background of enriched consumer demand, and driven by the economic interests of cultivated land operators, the arable land planting structure will show the characteristics of diversified development. However, if the proportion of grain planting is too low, then the government will introduce and implement relevant systems to control the trend of non-grain cultivated land. In general, the quantity, planting, and landscape patterns of cultivated land change in the course of social development.
(2) Cultivated land-use functional transition: For most farmers, agricultural labor can provide employment and income, and the harvested crops can satisfy rations, which maintains the farmers’ livelihood, prevents the occurrence of social risks such as hunger and unemployment, and ensures the stable development of society [40]. At this time, an increased use of chemicals is often relied on to increase food production. In this way, it is easy to cause the decline of cultivated land quality and biodiversity, which restricts the ecological function of cultivated land.
The average patch area of cultivated land will increase, the variety of crops will be diversified, and the quality will be increasingly higher so that the production function will be enhanced. In the urbanization process, in the pursuit of higher income, the rural surplus labor force will be transferred to nonagricultural industries, which results in the reduction of farmland employment opportunities for farmers and ultimately affects the life-support function of cultivated land [41]. Moreover, as the extensive use of agriculture leads to ecological destruction, human beings have begun to understand and adjust their relationship with nature [42], reduce the use of pesticides and fertilizers, and promote green fertilizers. Thus, the ecological maintenance function of cultivated land has received much attention and has improved greatly.
Comprehensively, CLUT is a continuous and cyclic process [43] that not only depends on the influence of the social economy, policy, technology, and other factors, as well as the promotion of cultivated land-user behavior, but also demonstrates the influencing factors and the behavior of cultivated land users. The cultivated land user decides whether to adjust the decision-making and behavior mode of cultivated land use according to their satisfaction with the result of a CLUT. At the same time, the feedback of the CLUT can promote the change and generation of the driving factors. For example, to satisfy the endless demands of mankind, the cultivated land users try to continuously add chemical fertilizers in exchange for the output of cultivated land. However, the result may be the destruction of the cultivated land ecosystem [44]. To ensure sustainable development, policymakers need to issue corresponding policies to restrict the input of chemical fertilizers. Therefore, in the overall operation of the CLUT mechanism, the driving factors and transition results promote and restrict one another through the subject of cultivated land use to form a “multifactor drive → subject behavior change → CLUT → transition result feedback → new wheel drive” cyclical interaction process, which is also the internal model of the spatiotemporal dynamic evolution of cultivated land-use morphology.

3. Methodology and Data
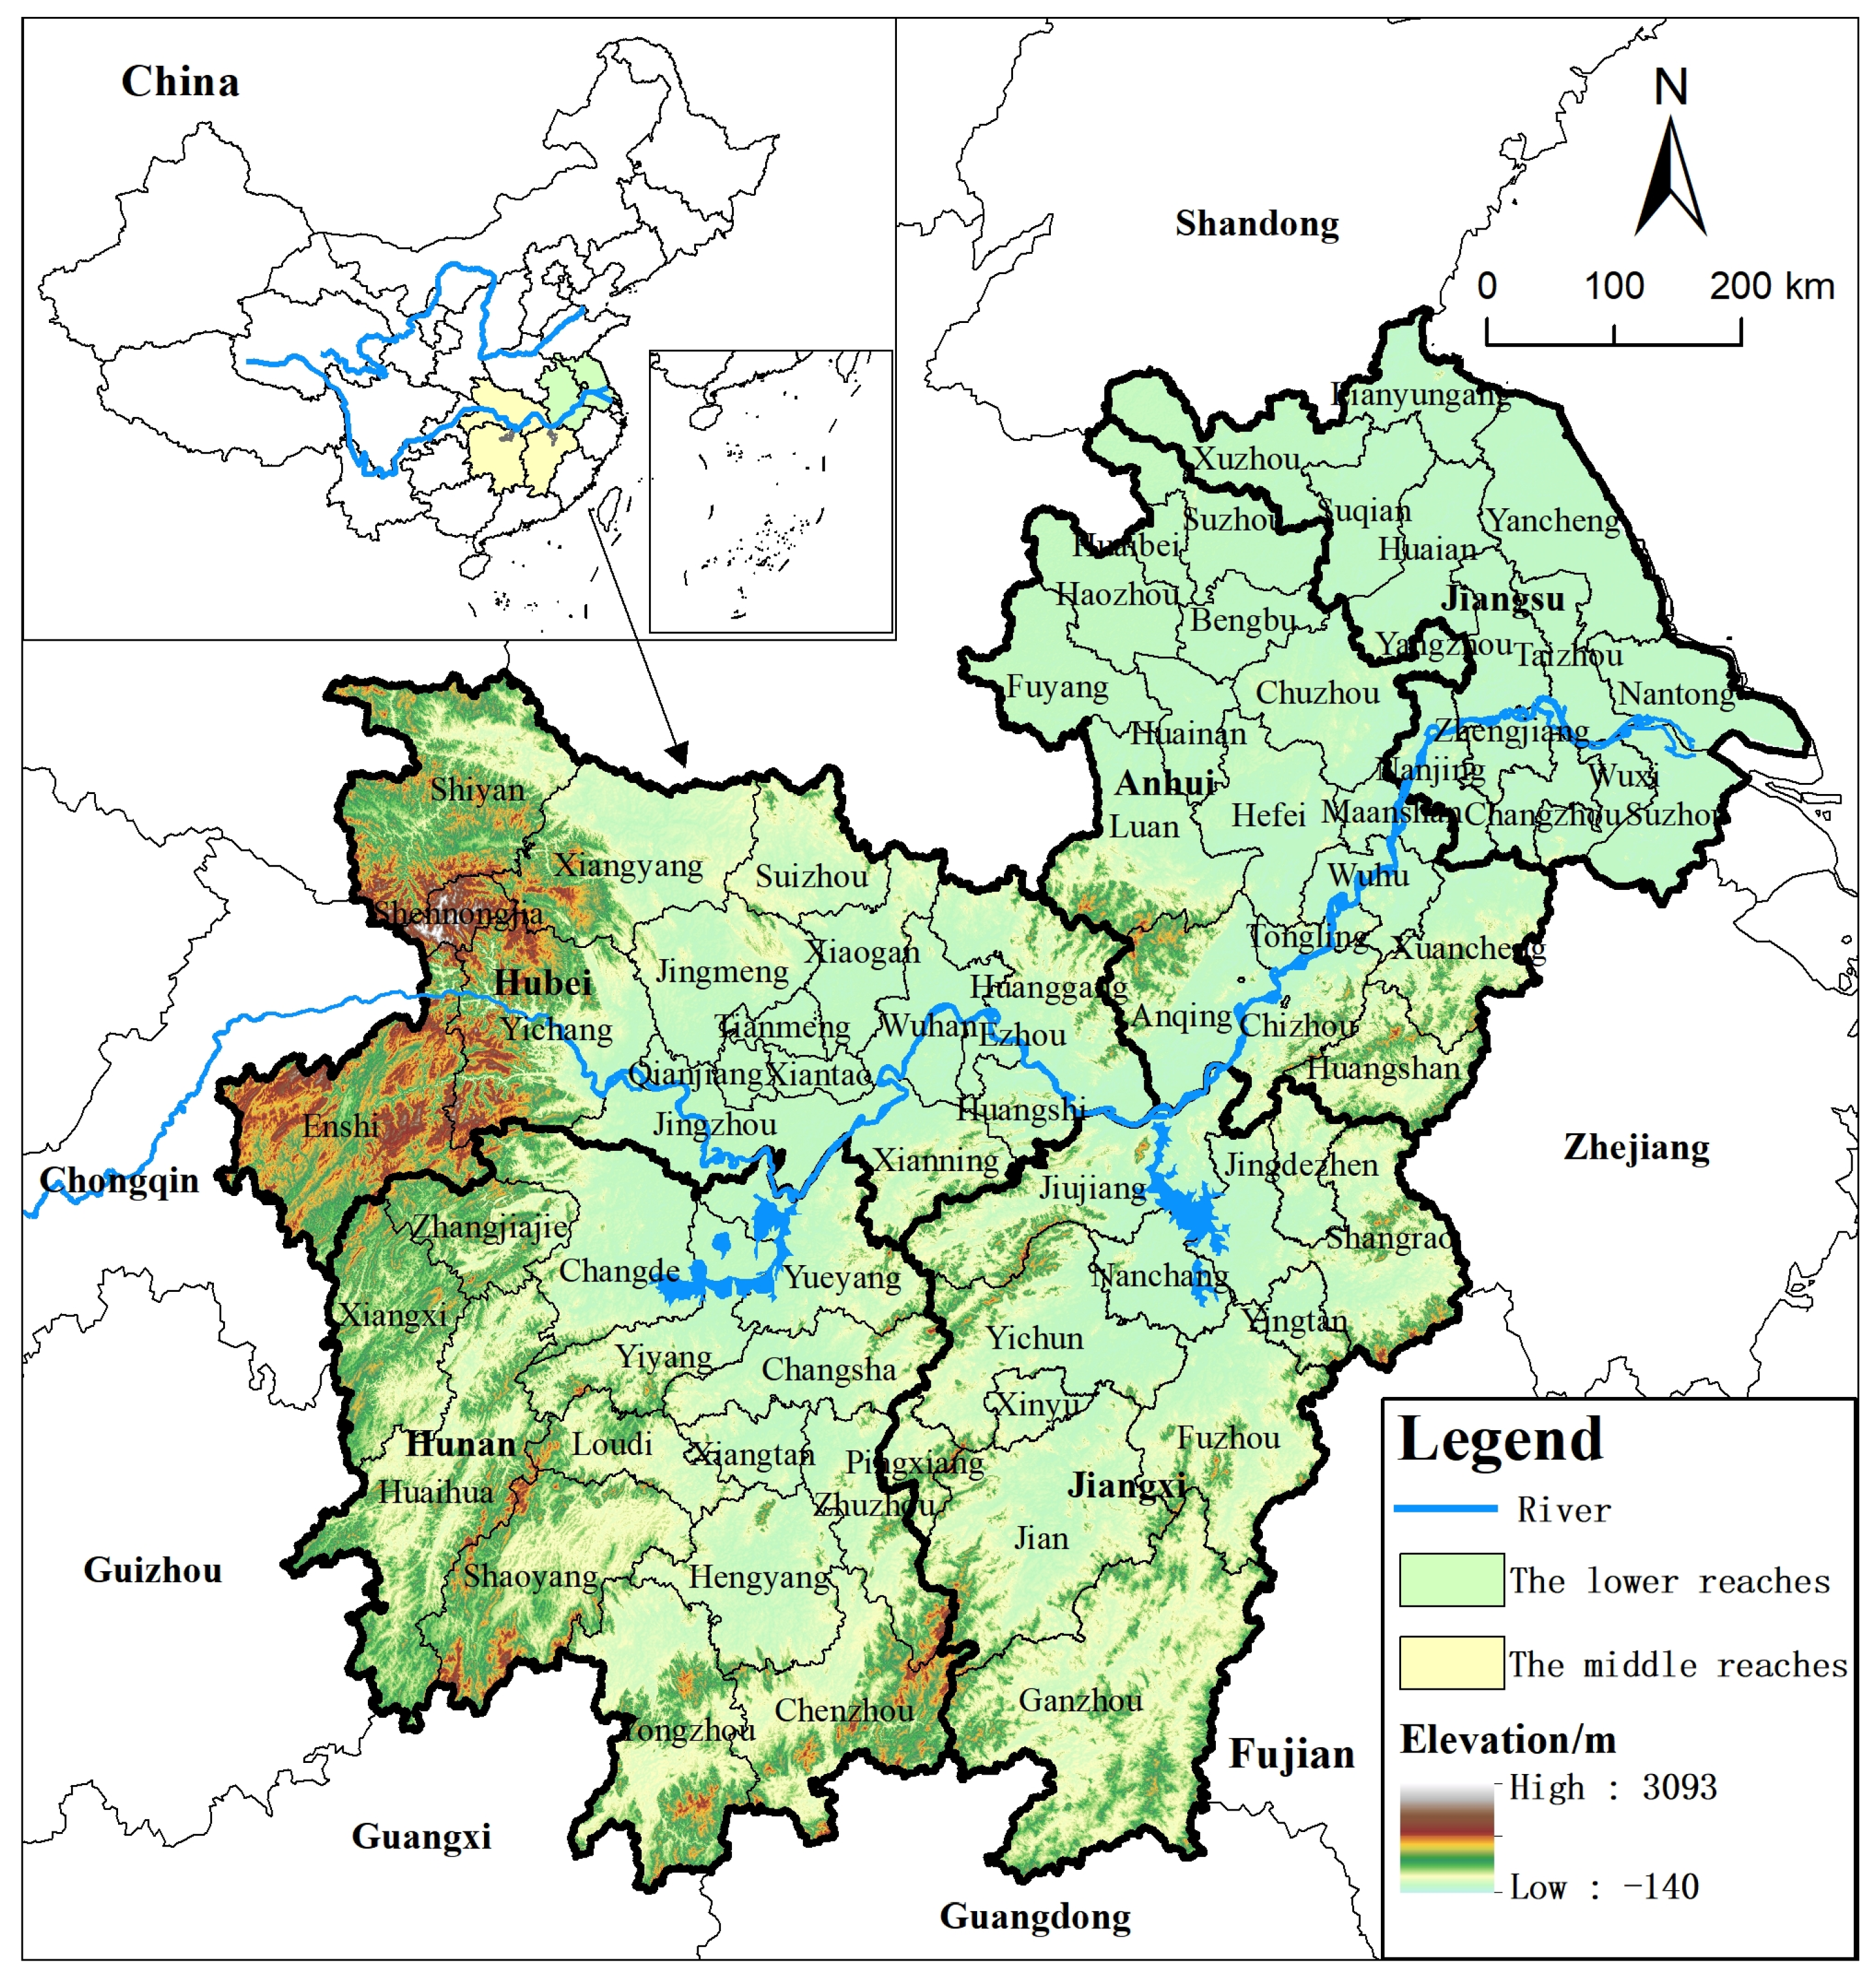
3.1. Study Area

The main grain-producing area is situated in Southern China at 24°29′–35°20′ N and 108°21′–121°57′ E. The study included 71 prefecture-level cities under the jurisdiction of the five provinces of Jiangxi, Hunan, Hubei, Anhui, and Jiangsu (Figure 2). The total area measures 81.19 × 10⁴ km2, which is approximately 8.46% of China’s total land area. The terrain here is flat, and it has abundant cultivated land resources. Meanwhile, the mild climate and abundant rainfall have laid a good foundation for China’s agricultural production. In 2019, the urban area was 37,672.74 km2, and the cultivated land of this region was 21.77 × 10⁴ km2, which account for approximately 4.64% and 26.82% of the total area, respectively. The grain output reached 15,617.47 × 104 tons, which is nearly one-quarter of the country’s total grain output (National Bureau of Statistics of China (NBSC), 2020). With the improvement in the degree of economics and urbanization, and the change in social demand, the structure and methods of cultivated land use have undergone tremendous changes.

3.2. Explanation of the CLUT Assessment Indicators

Based on the “spatial–functional” integration of the CLUT, the evaluation indicator system of the CLUT was established from the perspective of morphology. The indicators were selected based on a scientific analysis of cultivated land morphology and collaboration with scholars. The evaluation system consists of six factor layers and 18 indicator layers in spatial and functional morphology. The following is a brief summary of the reasons for choosing these indicators (Table 1).

3.2.1. Selection of the Evaluation Index for the Spatial Transition

(1) The index of the pattern of cultivated land quantity considers its total resources, area-change rate, and utilization degree [45]. The total area of cultivated land can reflect the resource endowment conditions of a region, and the area-change rate can embody the change in the amount of cultivated land. The reclamation rate can embody the change in the cultivated land-use area. Therefore, the quantity pattern of cultivated land is measured by three indicators: namely, the total area of cultivated land (x1), the rate of area change (x2), and the reclamation rate (x3).
(2) Cultivated land planting pattern evaluation indicators consider the spatial change in the cultivated land per capita planting area, the planting intensity, and the planting structure. The per capita cultivated land area owned by planting industry employees can reflect the area of cultivated land that can be planted per capita. The proportion of the grain and cash crop planting area can reflect the planting structure of arable land. The multiple cropping index can measure the planting intensity of cultivated land. The expansion of the sown area of arable land will lead to the exponential growth of multiple cropping. Therefore, we choose the per capita cultivated land area (x4), the proportion of the planting area for food crops and cash crops (x5), and the multiple cropping index (x6) to characterize the changes in the cultivated land planting pattern.
(3) The evaluation index of the cultivated land landscape pattern should represent the transition of its landscape morphology in agricultural production activities [43]. The landscape pattern mainly includes the degree of fragmentation and agglomeration, and the irregularities of farmland patches. This represents the concentration of cultivated land plots and the convenience of cultivators to plant. If cultivated land is relatively fragmented and has an irregular shape, then this will hinder large-scale development and mechanization. Therefore, the transition of the cultivated land landscape pattern is characterized by the fragmentation degree (x7), aggregation degree (x8), and landscape patterns index of cultivated land patches (x9).

3.2.2. Selection of the Evaluation Index for the Functional Transition

(1) The crop production function evaluation indicators are considered from the two aspects of the economic value output capacity and the crop output capacity of cultivated land. The gross value of cultivation is an important manifestation of the productive capacity of the cultivated land economy. The output of food crops and cash crops can reflect the production value of agricultural products on cultivated land [37]. Therefore, the crop production function of cultivated land is calculated by using the average economic output value (x10), average grain yield (x11), and average cash crop yield of cultivated land (x12).
(2) The life-support function evaluation index should show the ability of cultivated land to guarantee the rural population’s employment, income, and social food security [42]. The proportion of planting in the rural population represents the employment absorption capacity of cultivated land for the rural population. The ratio of per capita agricultural income to total income represents the population’s economic dependence on cultivated land. The per capita food guarantee rate represents the degree to which people depend on cultivated land for survival. Thus, the proportion of employees in the planting industry (x13), the per capita food guarantee rate (x14), and per capita agricultural income ratio (x15) are selected to represent the life-support function of arable land.
(3) The evaluation indicators of the ecological maintenance function take into account the negative pressure of chemical substances on cultivated land ecosystems, the resilience of the ecosystems, and the resistance to natural disasters [46]. When the chemical load of cultivated land is heavier, the degree of ecological damage to cultivated soil is greater. When the crop species diversity index is higher, the resilience of cultivated land ecosystems is stronger. When the effective irrigation area is larger, the drought resistance of cultivated land is stronger. The reasonable and effective use of cultivated land will decrease ecological damage and maintain the balance of the ecosystem. Therefore, the ecological maintenance function is characterized by the chemical load of cultivated land (x16), the diversity of crop species (x17), and the effective irrigation area ratio (x18).

3.3. Methodology

3.3.1. Entropy Weight Method

The entropy weight method is currently the most widely used objective weighting method, which can effectively eliminate the dimensional influence. This study uses the entropy weight method to determine the weight of each evaluation index, which reflects the contribution of each index to the CLUT. According to the evaluation index system of CLUT, the CLUT index is the sum of the products of each functional index and its respective weight. Since this method is relatively common, the specific formula refers to [47].

3.3.2. Exploratory Spatial Data Analysis

An exploratory spatial data analysis (ESDA) can perform a correlation and aggregation analysis of neighborhood spatial data, which can effectively verify the spatial clustering characteristics of regional CLUTs. Two types of autocorrelation coefficients are usually used for this measurement. The first is the global spatial autocorrelation coefficient: the distribution of the Moran scatter plot is used to show the spatial correlation of the CLUT in the study area. The expression is
I = n i = 1 n j = 1 n W i j ( x i - x ¯ ) ( x j - x ¯ ) i = 1 n j = 1 n W i j i = 1 n ( x i - x ¯ ) 2
where I is the global Moran index, and xi and xj are the CLUT index in cities i and j, respectively, and x ¯ represents the average of the CLUT indices, and Wij is the spatial weight matrix. In this study, a spatial adjacency matrix was used, which was constructed by GeoDa software. The value of I is [−1,1]. When I = 0, this indicates that the space is not autocorrelated; when I > 0, this means that there is a positive correlation, and when I < 0, this indicates that there is a negative correlation. The closer the absolute value of I is to 1, the greater the degree of clustering and the spatial correlation.
The second type is the local spatial autocorrelation coefficient: it can use an LISA graph to check the heterogeneity of the data calculation and reveal the correlation degree of the attribute values between spatial units and adjacent units. The formula is as follows:
I i = n ( x i x ¯ ) j = 1 n W i j ( x j x ¯ ) i = 1 n ( x i x ¯ ) 2
When Ii > 0, high-high/low-low means that the spatial unit value is higher/lower than all the surrounding units and that the integrated spatial difference is smaller. When Ii < 0, then low-high/high-low means that the lower/higher spatial unit value is higher/lower than the surrounding units and that the integrated spatial difference is smaller.

3.3.3. Standard Deviation Ellipse

The standard deviation ellipse (SDE) is used to quantitatively describe the spatial characteristics of the elements. The azimuth of the ellipse represents the main trend direction, the long axis represents the dispersion of the geospatial elements in its direction, and the center of gravity represents the relative position. The results of the SDE calculation can reflect the spatial change in the CLUT (Equations (3)–(5)).
t a n θ = ( i = 1 n w i 2 x i 2 - i = 1 n w i 2 y i 2 ) + ( i = 1 n w i 2 x i 2 - i = 1 n w i 2 y i 2 ) 2 + 4 i = 1 n ( w i 2 x i 2 y i 2 ) 2 i = 1 n w i 2 x i y i
X w = i = 1 n w i x i i = 1 n w i ; Y w = i = 1 n w i y i i = 1 n w i
σ x = i = 1 n ( w i x i c o s θ w i y i s i n θ ) 2 i = 1 n w i 2 ; σ y = i = 1 n ( w i x i s i n θ w i y i c o s θ ) 2 i = 1 n w i 2
where tan θ is the azimuth angle of the ellipse, i.e., the angle formed by the clockwise rotation from due north to the long axis of the ellipse; ( X w , Y w ) are the center of gravity coordinates, and Xi and Yi are the spatial location elements, Wi represents the weight, x i , y i represents the deviation of the coordinates of the elements at different points from the mean center, and σ x and σ y are the standard deviations along the x- and y-axes, respectively.

3.3.4. Data Collection

The socioeconomic data come from the provincial and municipal statistical yearbooks of Hubei, Hunan, Jiangxi, Anhui, and Jiangsu in 2002, 2008, 2014, and 2020. Since ESA’s land-use cover data has the advantages of authority, continuity, openness, and includes research time-point data, the land-use data in this research are derived from the ESA’s global 300-m land cover data in 2001, 2007, 2013, and 2019. The administrative zoning data were obtained from the 1:4 million dataset of the China National Basic Geographic Information Center. To preprocess the land-use data, we first classified the land-use types into six types: namely, cultivated land, forestland, grassland, water bodies, construction land, and unused land. Afterward, the different land-use type data were recoded and assigned CLT1 to CLT6. On this basis, Fragstats software was then used to measure the fragmentation, aggregation, and landscape morphology indices of the cultivated land.

4. Results

4.1. Analysis of the CLUT

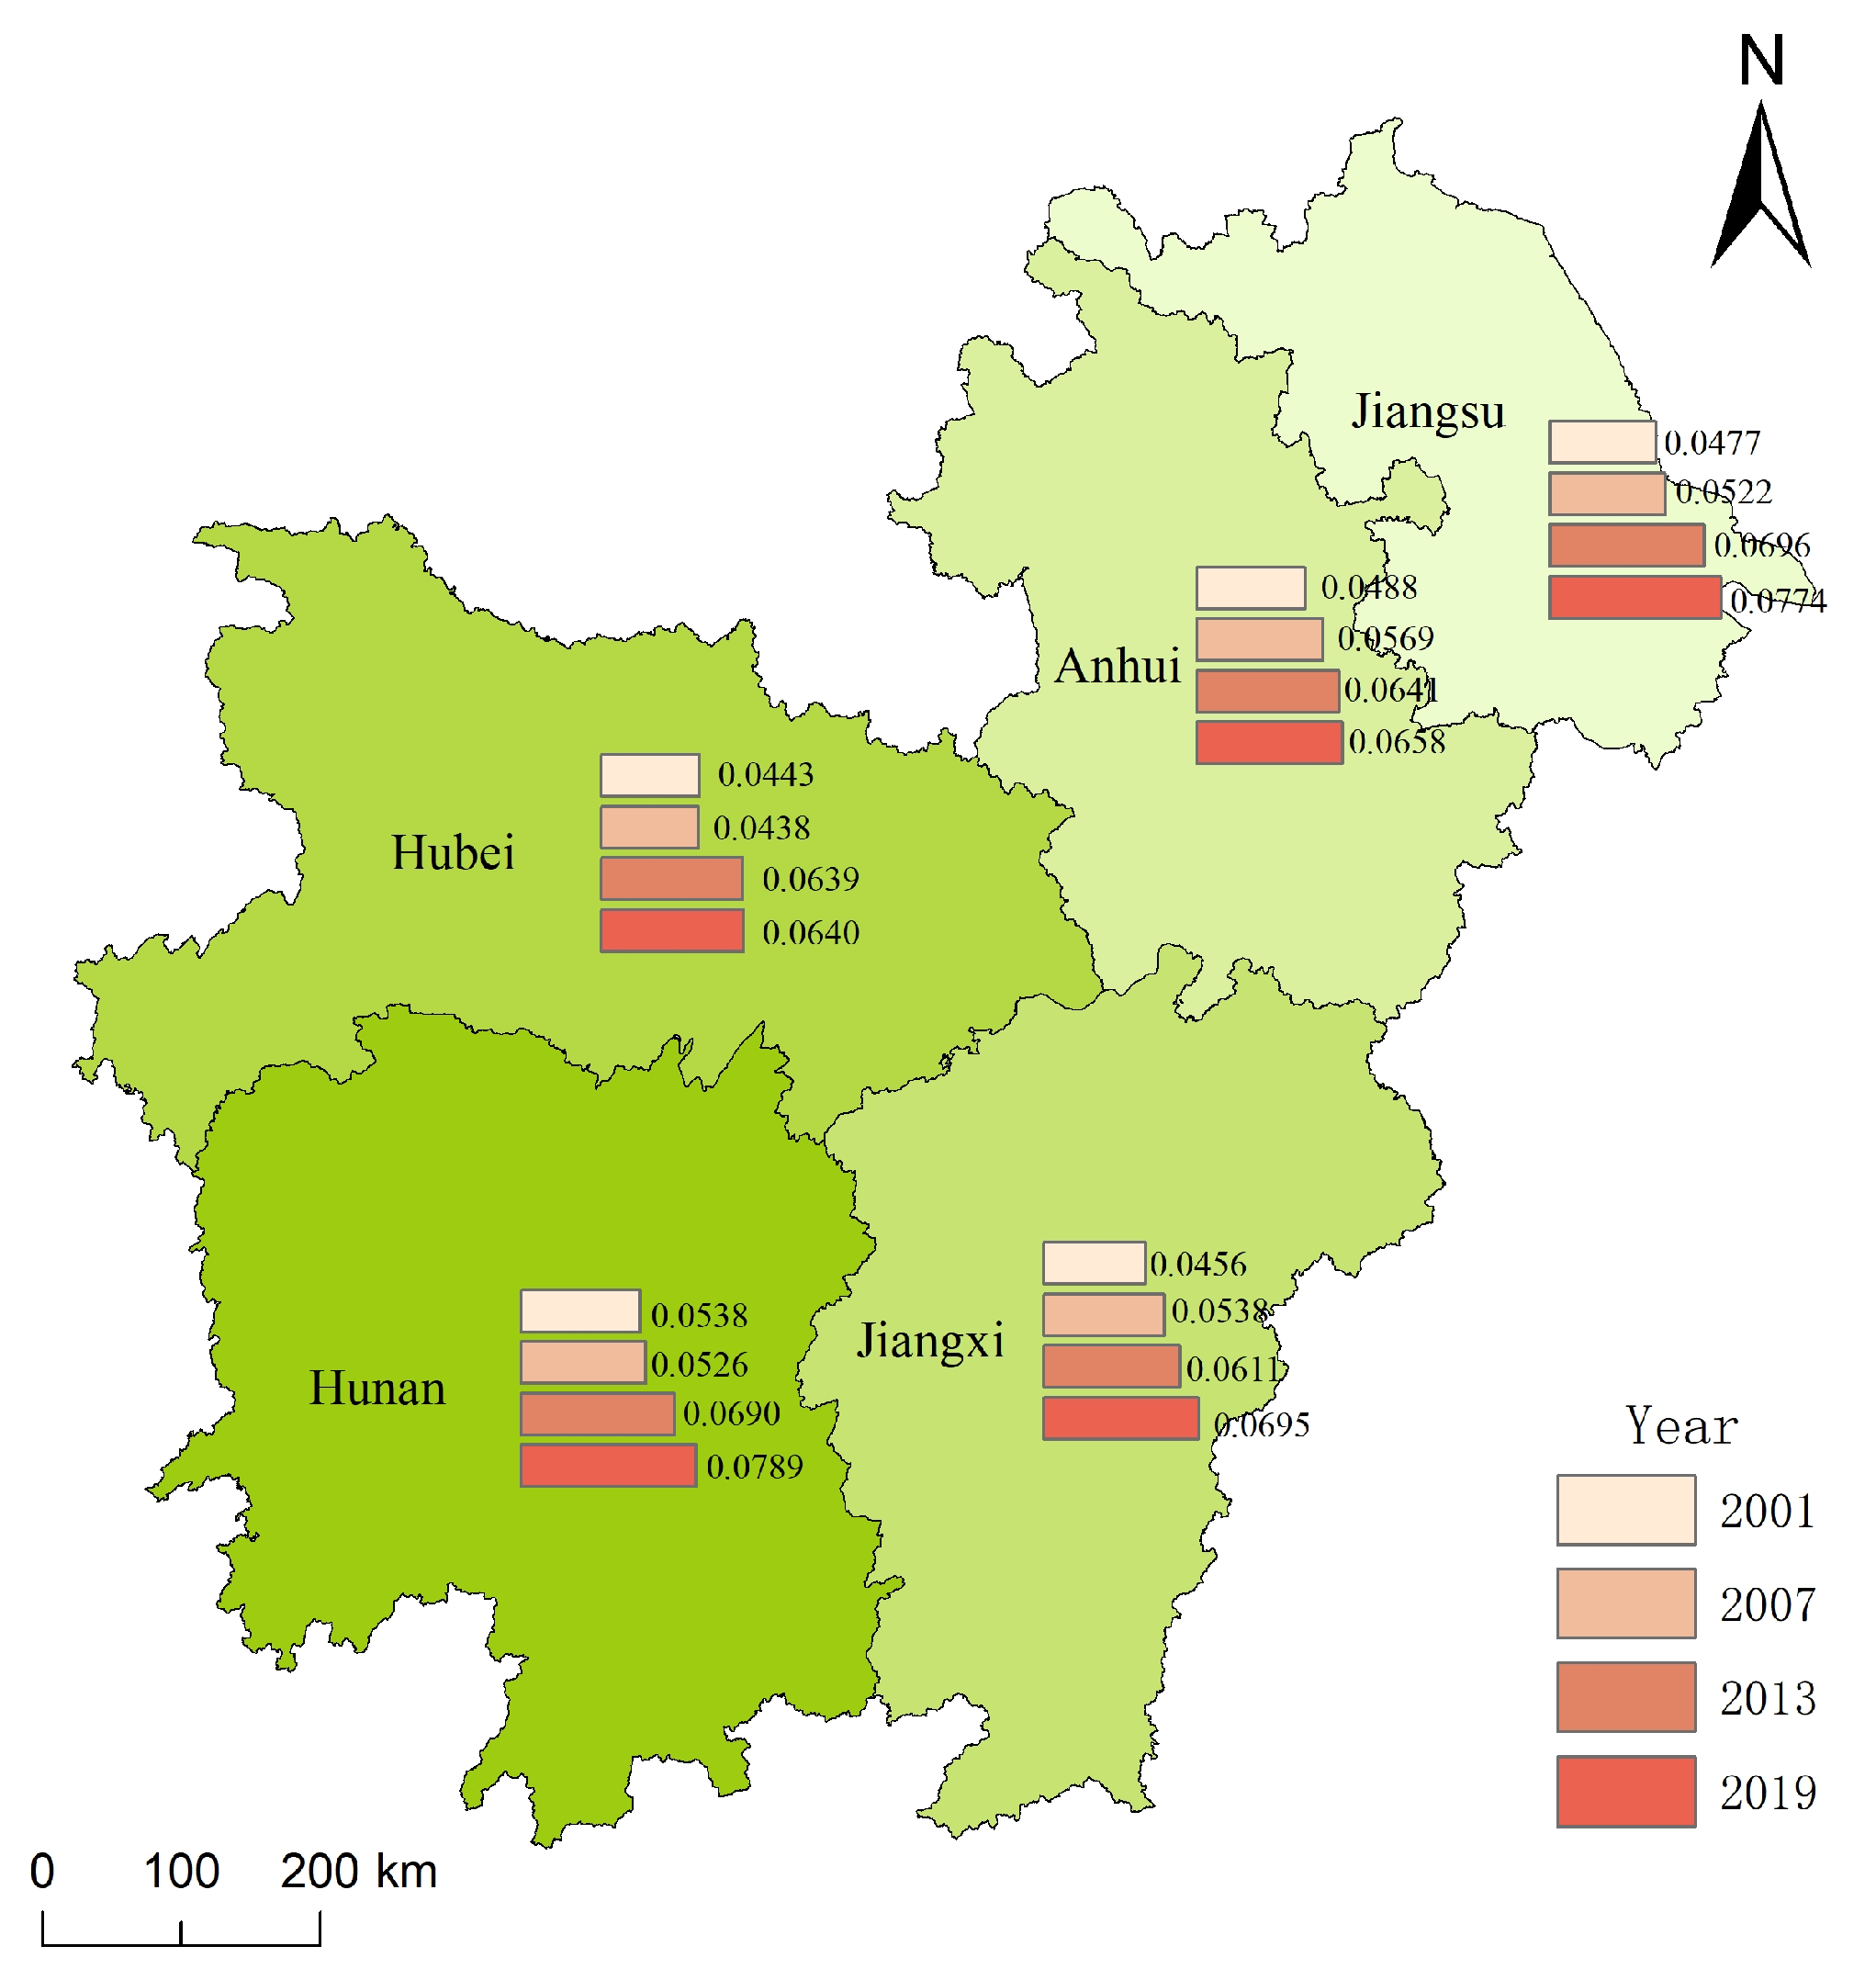
4.1.1. Measurement of Comprehensive Index of the CLUT

Overall, the comprehensive index of the CLUT in the study area increased from 0.0480 to 0.0711, which is an increase of 48.13%. The comprehensive CLUT index in the five provinces also increased (Figure 3). However, there was an imbalance in the CLUT between provinces. The order of the average value of the comprehensive transition index was: Hunan Province (0.0645) > Jiangsu Province (0.0617) > Anhui Province (0.0589) > Jiangxi Province (0.0575) > Hubei Province (0.0540). The order of the growth rate of the comprehensive transition index was: Jiangsu Province (62.26%) > Jiangxi Province (52.41%) > Hunan Province (46.65%) > Hubei Province (44.47%) > Anhui Province (34.84%). The extreme differences in the comprehensive transition index in the study area in 2001, 2007, 2013, and 2019 were 0.0345, 0.0438, 0.0587, and 0.0641, respectively. These results indicate that the morphology of cultivated land use in this region is undergoing rapid changes. Due to the heterogeneity of natural and socioeconomic characteristics, the differences in the CLUT between regions are expanding.

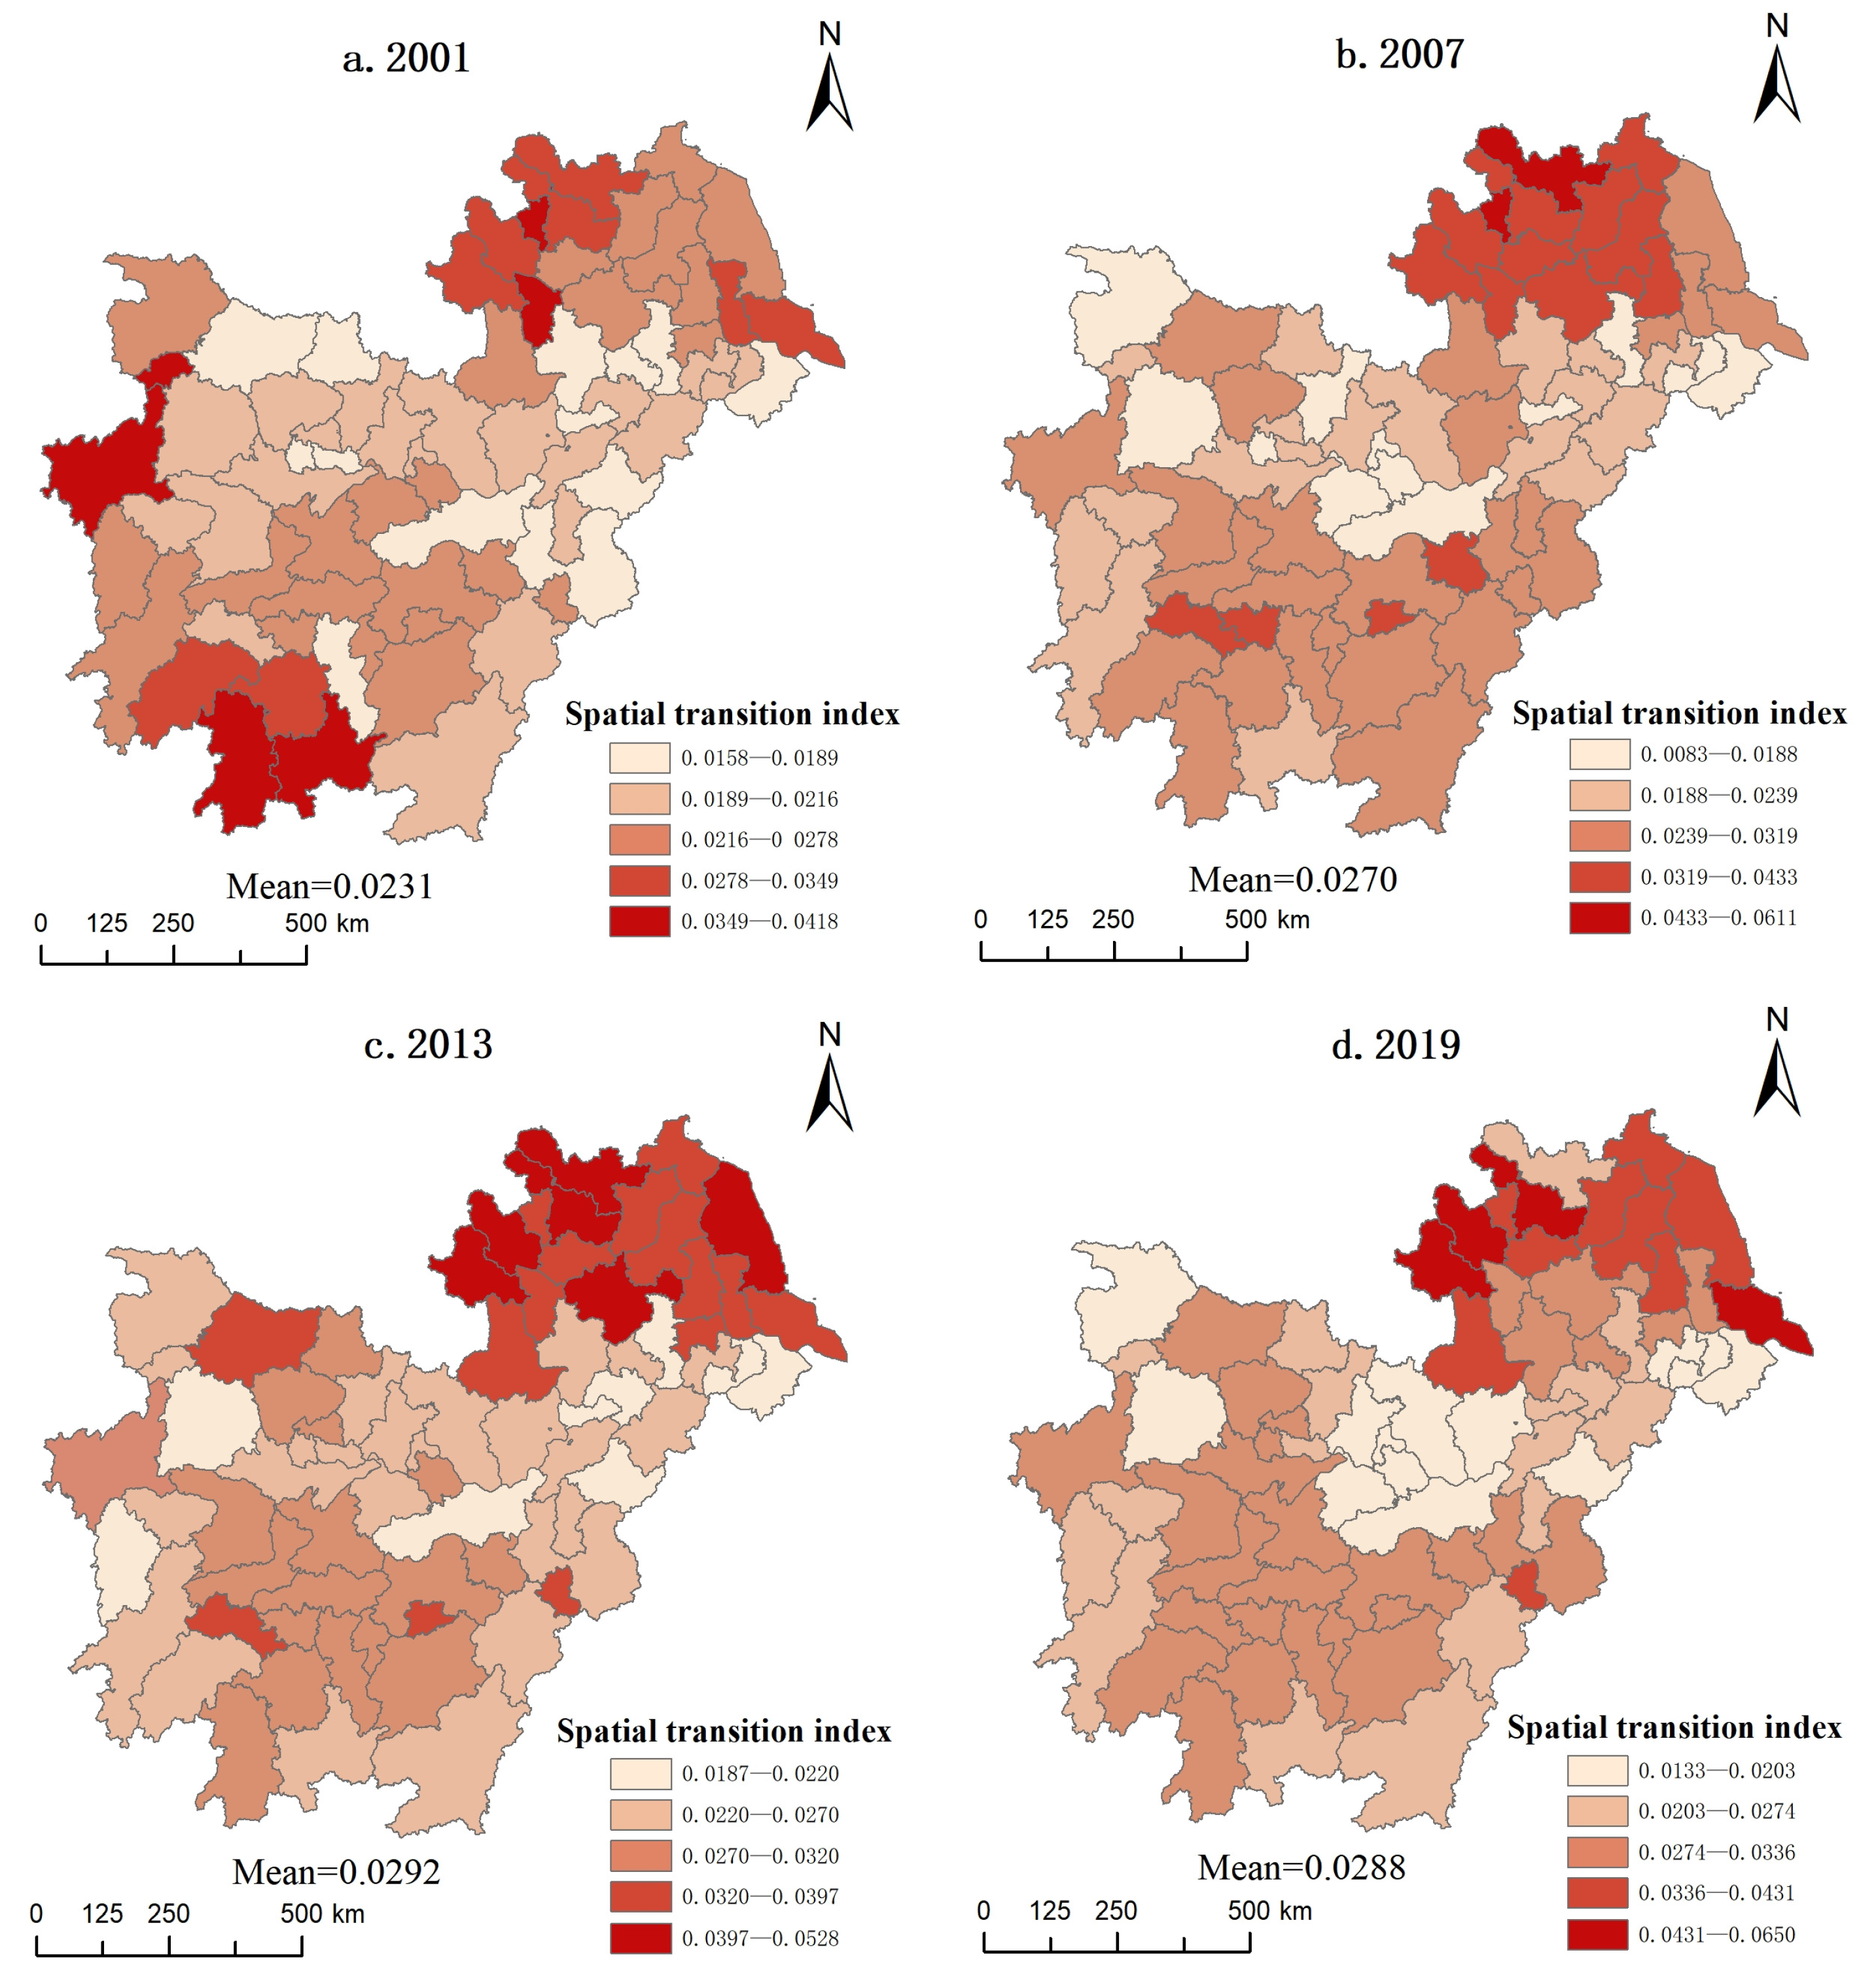
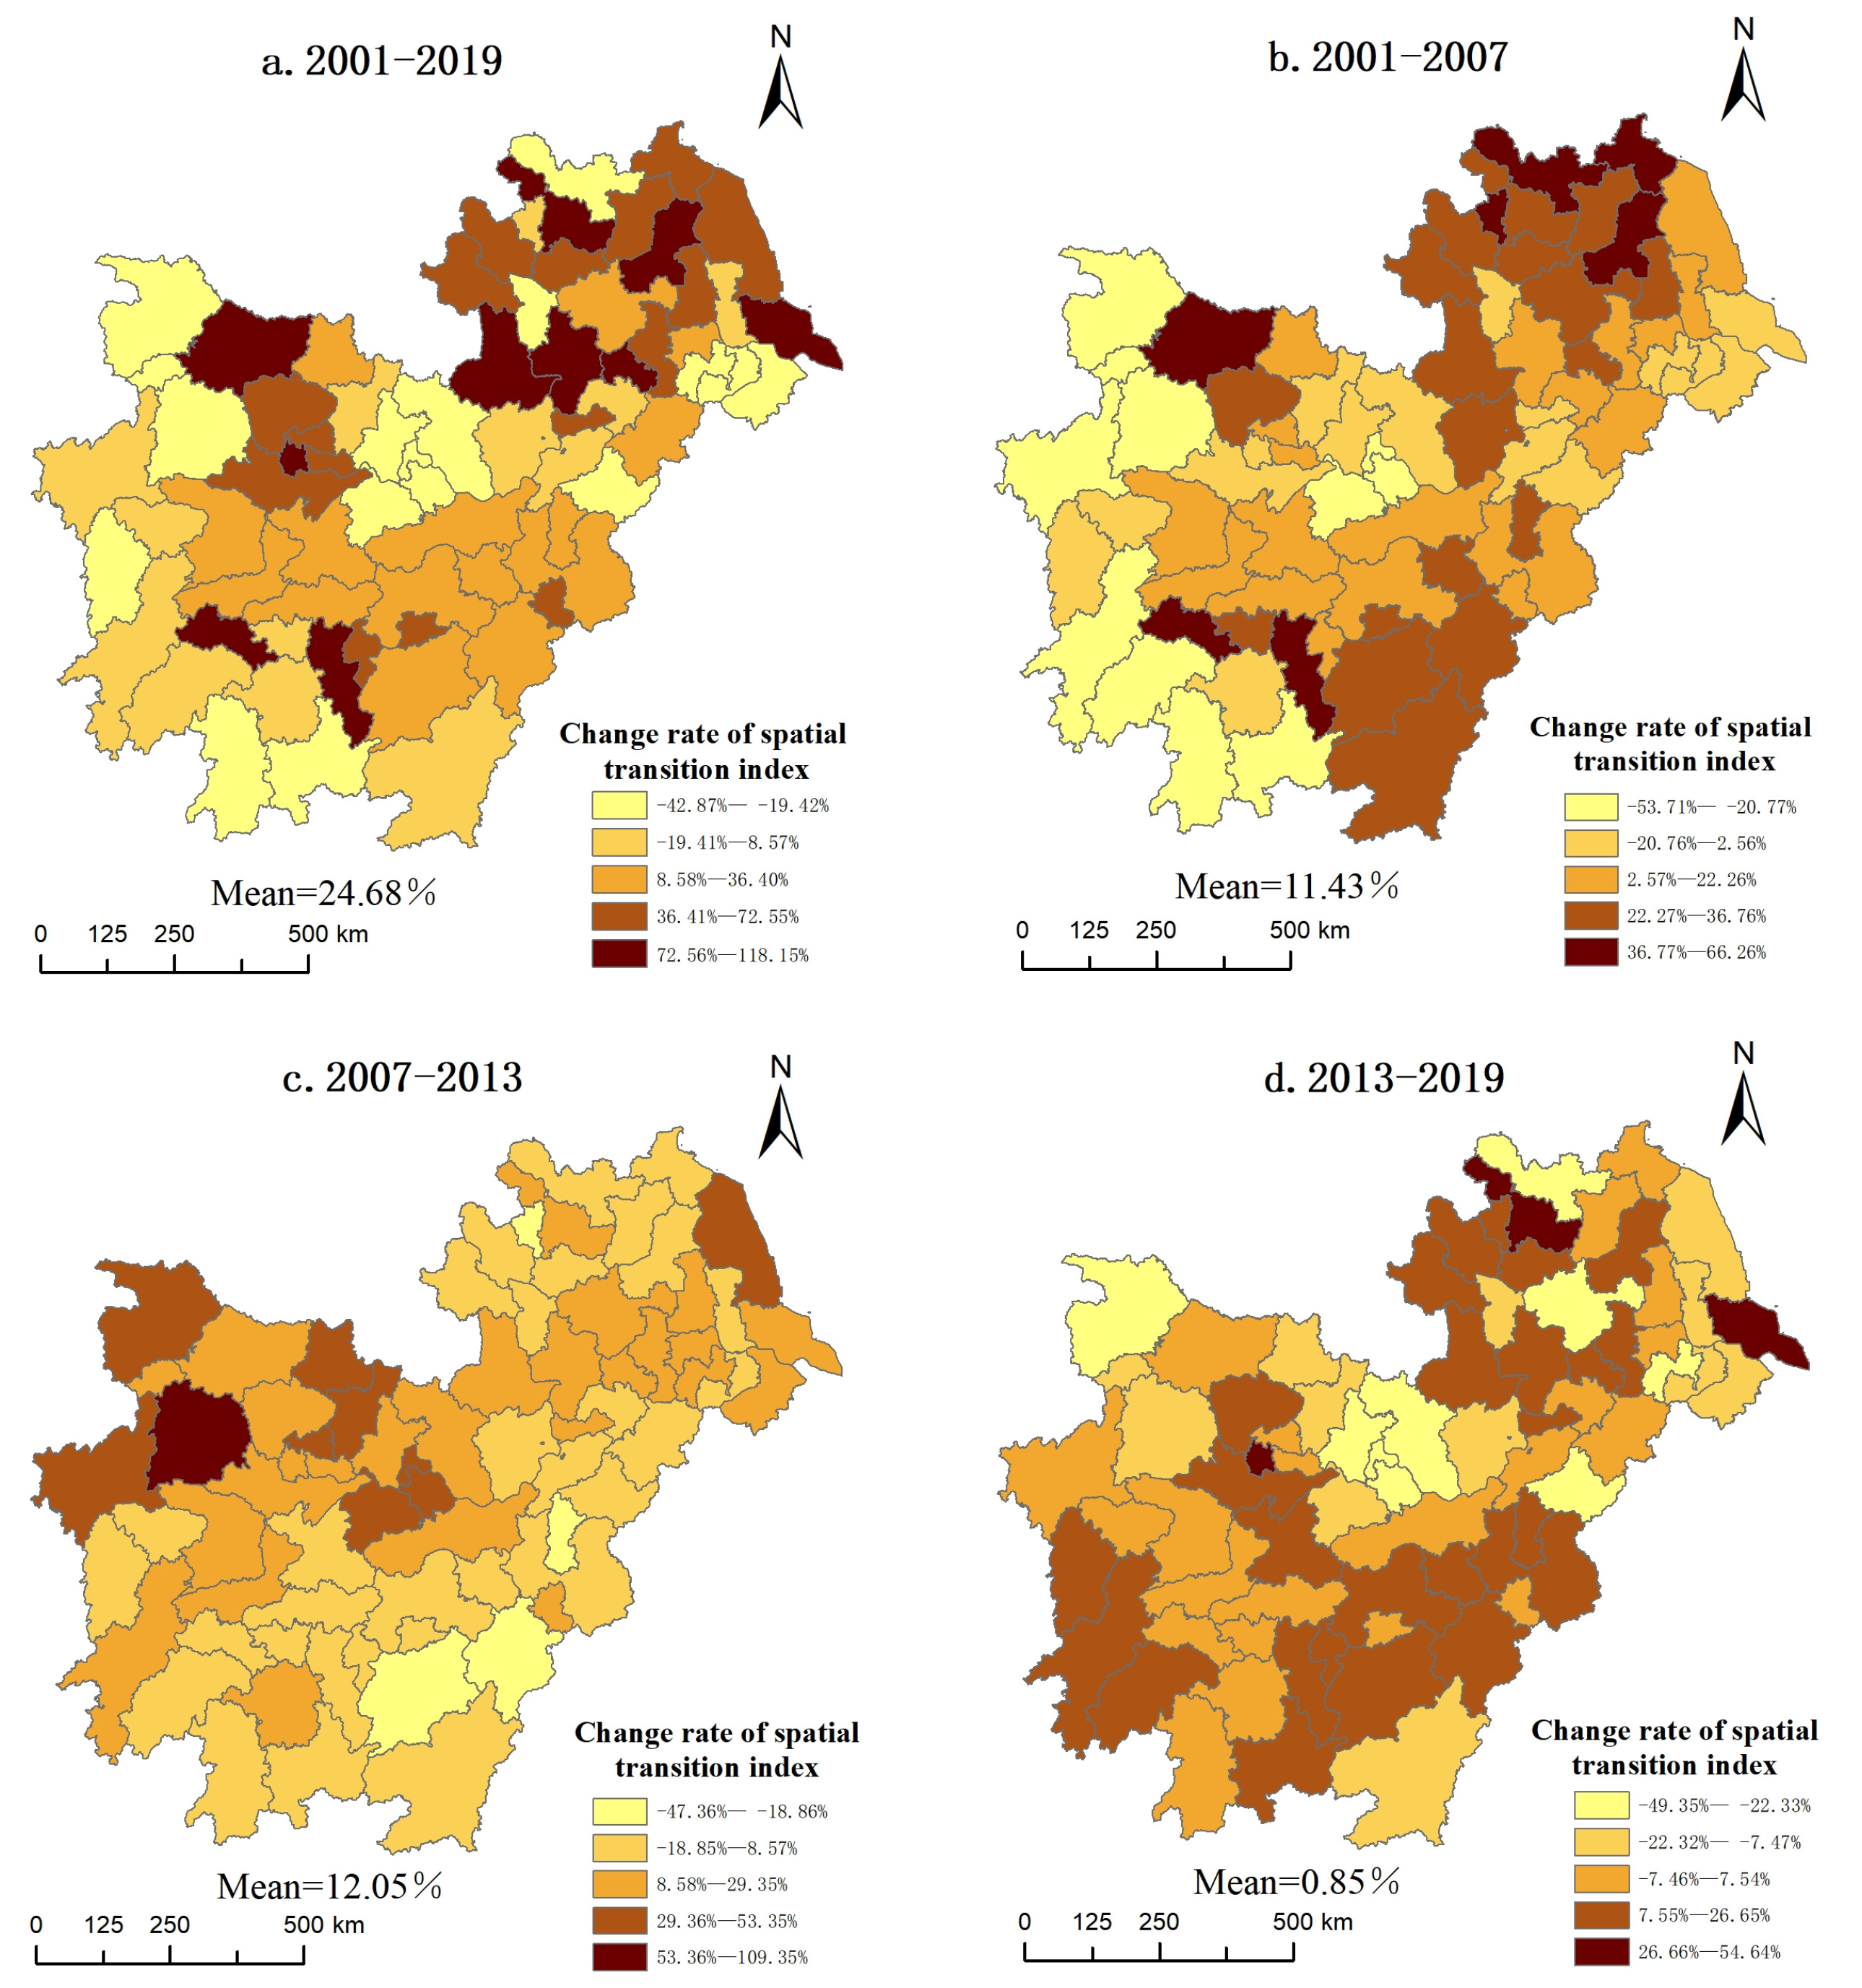
4.1.2. Variations in the Cultivated Land-Use Spatial Transition

Based on ArcGIS software, this study uses the Natural Breaks method to divide the CLUT index and change rate into five grades from high to low and visualize them.
From 2001 to 2019, the spatial transition of the high-value areas of cultivated land use was mainly concentrated in Jiangsu and Anhui Provinces in the northeast (Figure 4). There was no obvious law in the distribution of low-value areas, which were distributed in all provinces, and the central region was relatively concentrated in 2019. These results suggest that the change rate of the spatial transition index was higher in the northern and southern regions of the study area than that in the central region from 2001 to 2007 (Figure 5). Meanwhile, the overall difference in the change rate of the spatial transition index narrowed, and the regions with high change rates decreased significantly from 2007 to 2013. These results demonstrate that the regions with a high rate of change were clustered in the south and north from 2013 to 2019. Overall, the spatial transition index of cultivated land use in the study area increased from 0.0231 to 0.0288, and the spatial transition index change rate was 24.68% in the past 20 years. The distribution of the transition index and change rate are similar to the economic development and topographic differences in the study area. Areas with a higher CLUT index have the characteristics of a high economic development level, low altitude, and flat terrain, while regions with a lower CLUT index have the opposite characteristics.
The Jiangsu and Anhui Provinces are both within the Yangtze River Delta, with flat terrain. In 1985, the Chinese government opened this region as a coastal economic open zone, with a high degree of economic development and advanced agricultural technology. From 2001 to 2019, the per capita GDP increased in Jiangsu and Anhui Provinces from $1571 and $725 to $17,698 and $8410, respectively, and the proportion of the grain and cash crop planting areas decreased from 1.052 and 1.271 to 0.977 and 1.166, respectively. This shows that people’s demand for agricultural products continues to diversify with the growth of the economy, which results in an increase in the economic crop sowing area and changes in the cultivated land planting pattern. Furthermore, the social awareness of cultivated land protection in this area is stronger, and the response to national policies is also more active. From 2001 to 2019, the per capita cultivated land area in Jiangsu and Anhui Provinces increased from 0.099 hm2 and 0.082 hm2 to 0.125 hm2 and 0.112 hm2, respectively, and the patch aggregation degree increased from 93.384 and 93.320 to 94.659 and 96.660, respectively, which promoted the optimization and transition of the cultivated land spatial morphology. The rate of change in the spatial transition index decreased from 11.43% to 0.85%, which indicates that the landscape pattern has slowed in recent years.

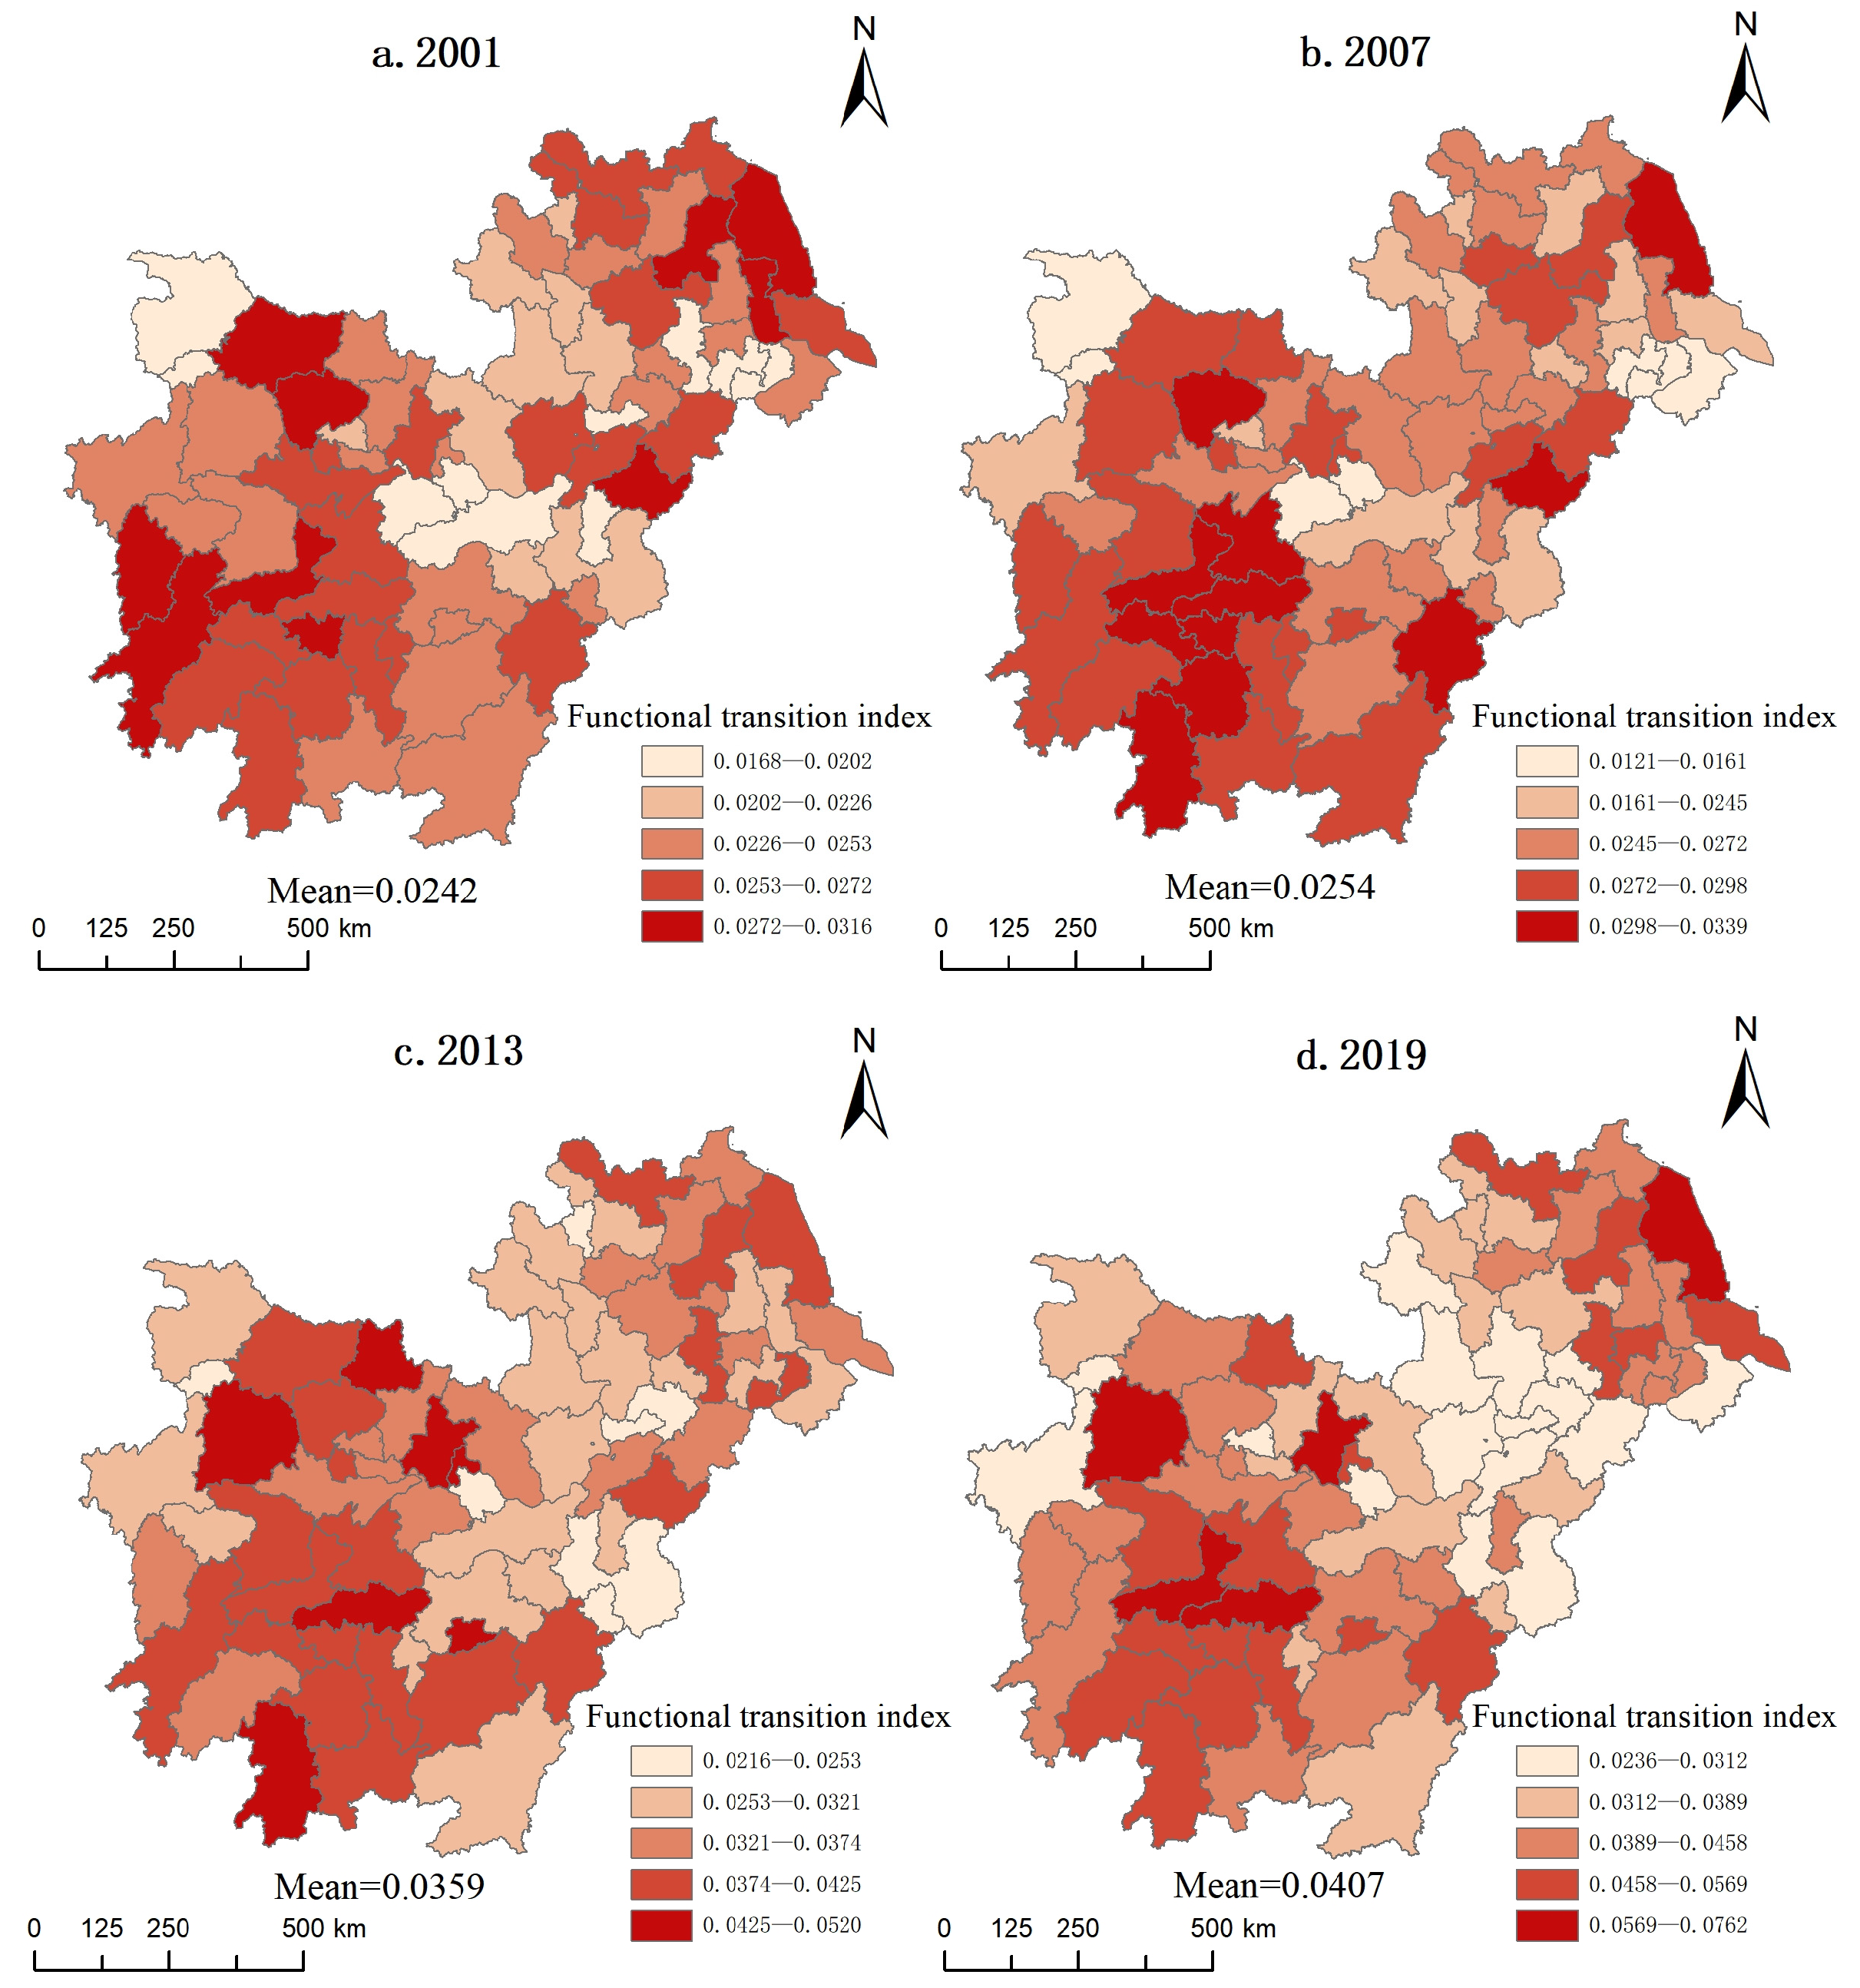
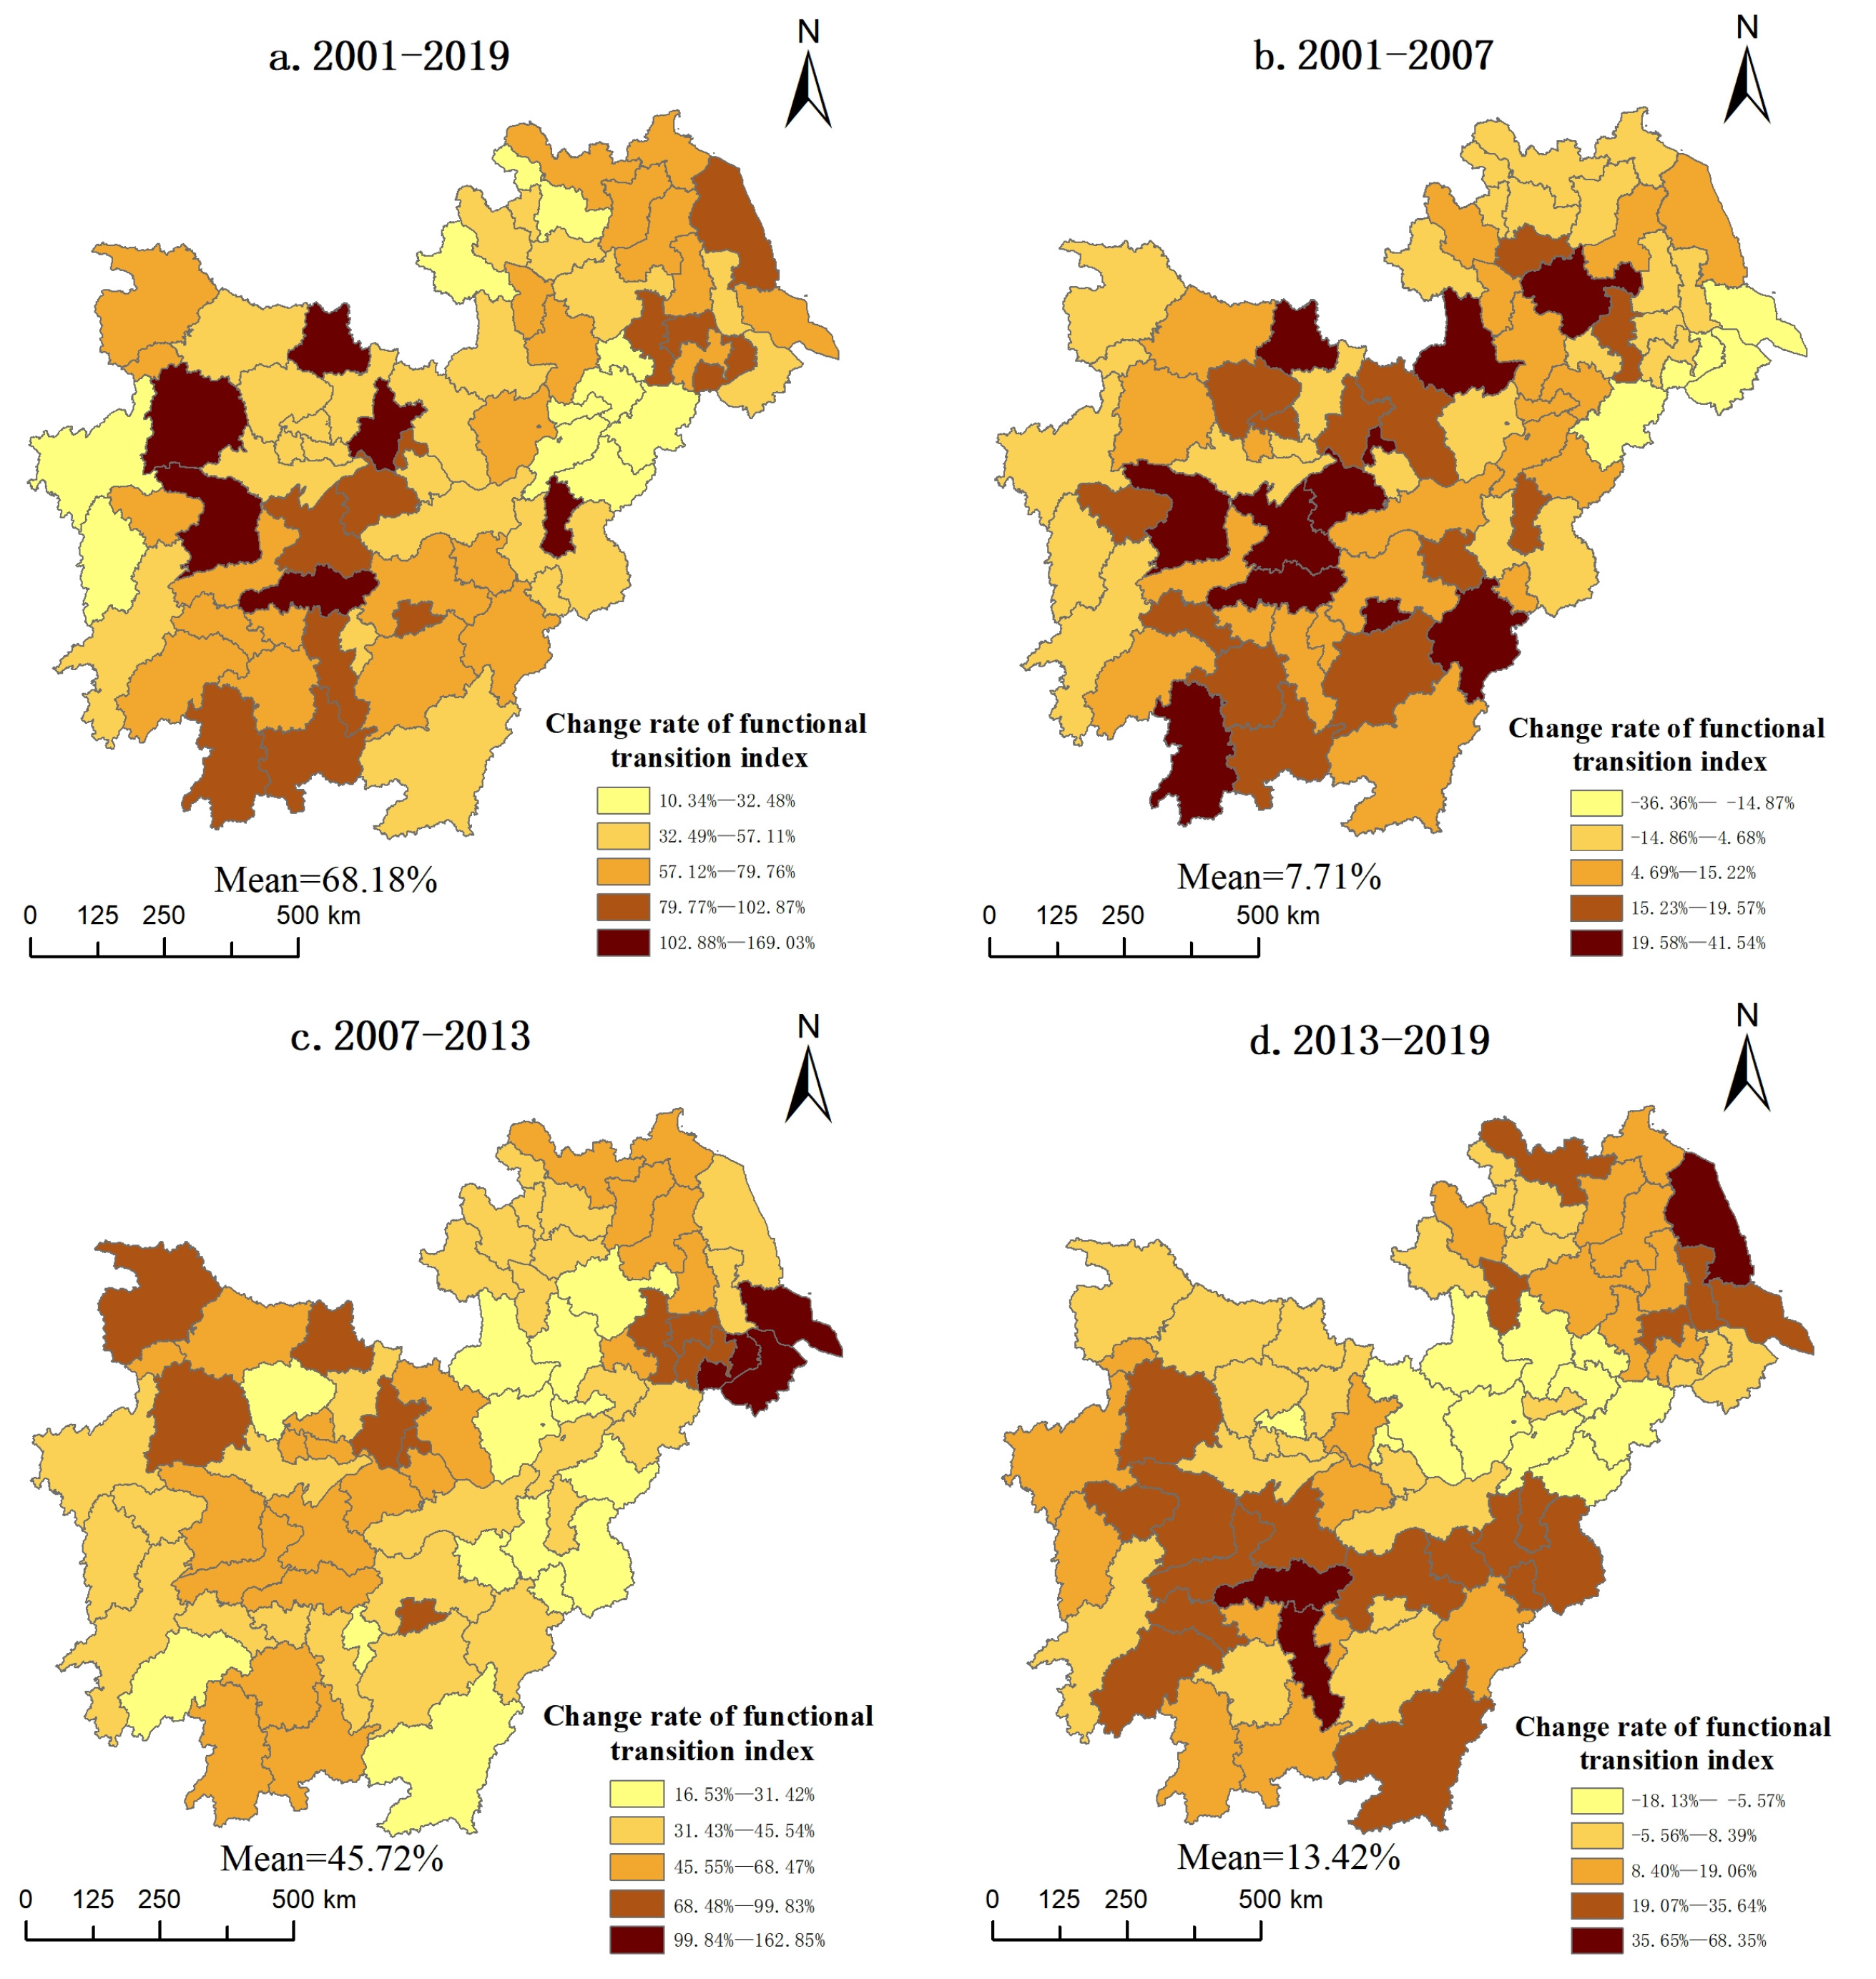
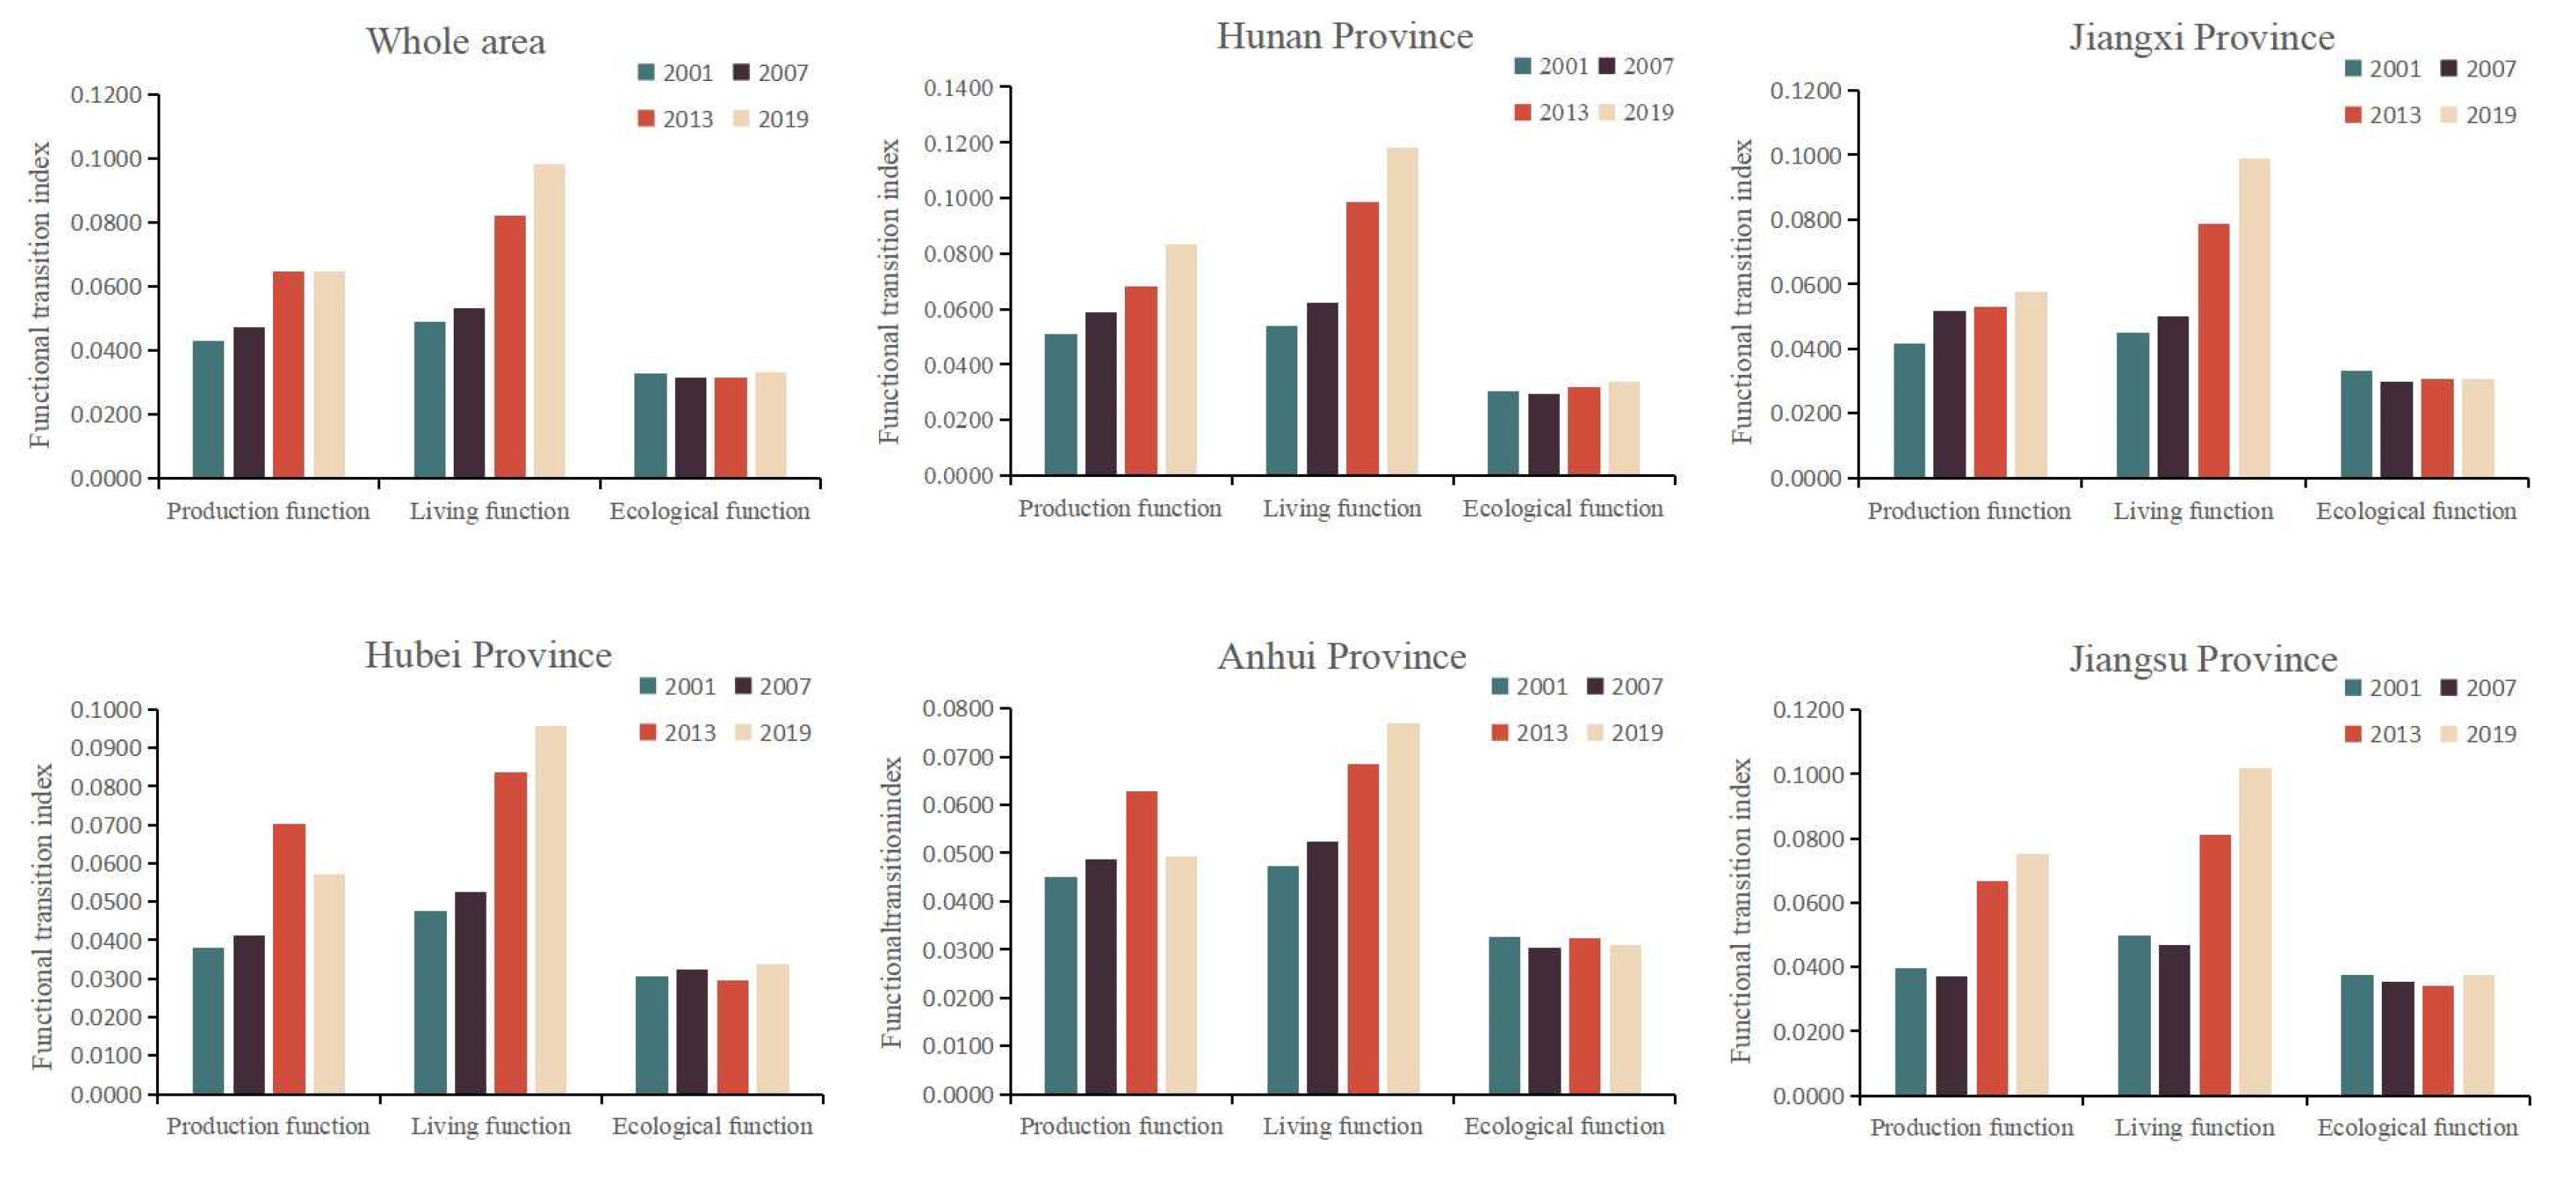
4.1.3. Variations in the Cultivated Land-Use Functional Transition

Figure 6 shows that the transition of the cultivated land-use function is generally strong. The high-value areas were mostly distributed in Hunan, Hubei, Jiangsu, and central Jiangxi from 2001 to 2013. Correspondingly, the number of high-value areas declined significantly, and the low-value areas were mainly concentrated in Anhui Province from 2013 to 2019. Meanwhile, Figure 7 demonstrates that the areas with a higher rate of change in the functional transition index were mainly in the central and southern regions from 2001 to 2007. This transferred to the western and eastern regions from 2007 to 2013 and moved to the south and northeast from 2013 to 2019. Overall, the transition index of the cultivated land-use function also increased from 0.0242 to 0.0407 during these periods. The change rate of the transition index is 68.18%, which is higher than that of the spatial transition index, indicating that the influence of the socioeconomic development process is stronger on the functional morphology of cultivated land than on the spatial morphology. The transition index and rate of change in the southwestern and northeastern regions are significantly higher, which is also similar to the difference in the local economic levels.
From 2001 to 2019, the production, living, and ecological functional transition index of cultivated land in the study area increased from 0.0431, 0.0488, and 0.0329 to 0.0645, 0.0983, and 0.0333, respectively (Figure 8). During this period, the total number of plantation employees in the study area decreased from 75.44 million to 53.77 million. Although the average agricultural output value increased from 19,858.86 RMB/hm2 to 64,764.13 RMB/hm2, correspondingly, the average grain output increased from 5545.15 t/hm2 to 6205.30 t/hm2, and the farmers’ per capita agricultural income rose from 1672.26 RMB to 8608.71 RMB; all of this resulted in a significant improvement in the production and living functions. From the perspective of the ecological function of cultivated land, the effective irrigation rate increased from 38.06% to 45.85%, the chemical load of cultivated land increased from 12.17 million tons to 25.85 million tons, and the crop species diversity index decreased from 0.581 to 0.508; therefore, the growth rate of the ecological function of cultivated land was not obvious.
The production and living functions of cultivated land in Hunan, Hubei, Jiangxi, Anhui, and Jiangsu Provinces also showed an upward trend, while the ecological functions differed significantly. Hunan and Hubei showed an increasing trend, Jiangxi and Anhui showed a decreasing trend, and Jiangsu did not change significantly. The main reason is that, in 2019, the proportion of the agricultural industry in Hunan and Hubei reached 10.2% and 9.5%, respectively, while in Jiangxi it was 8.7%, and in Anhui it was 8.2%. The proportion of agriculture was relatively low, and the emphasis on agriculture was relatively insufficient, which resulted in the extensive use of cultivated land and biodiversity. Sexual decline limits the ecological maintenance of cultivated land. Similarly, the rate of change of the functional transition index also showed a slowdown, which increased from 7.71% to 45.72 and then decreased to 13.42%. This could be linked to a slowdown of China’s economic growth.

4.2. Spatial Agglomeration Characteristics of the CLUT

4.2.1. Global Spatial Autocorrelation Analysis

Using GeoDa software, the global Moran’s I index of the CLUT was calculated. Between 2001 and 2019, a significance test of the integrated, spatial, and functional transition of cultivated land-use was passed by 5% (Table 2), which indicates that the three transitions had a positive agglomeration effect on the geospatial distribution. Among the fluctuating changes in the agglomeration of the cultivated land spatial morphology transition, the agglomeration degree was the strongest in 2007, and Moran’s I index reached 0.5698. The agglomeration degree decreased from 2007 to 2013. The reason is closely related to the implementation of the policy of “balance of compensation for land requisition” promulgated by China in 2006, which ensures the stability of cultivated land quantity and realizes spatial agglomeration changes. The agglomeration of the cultivated land functional morphology transformation shows an increasing trend of fluctuation. The agglomeration degree was the strongest in 2019, and the Moran’s I index reached 0.2952.

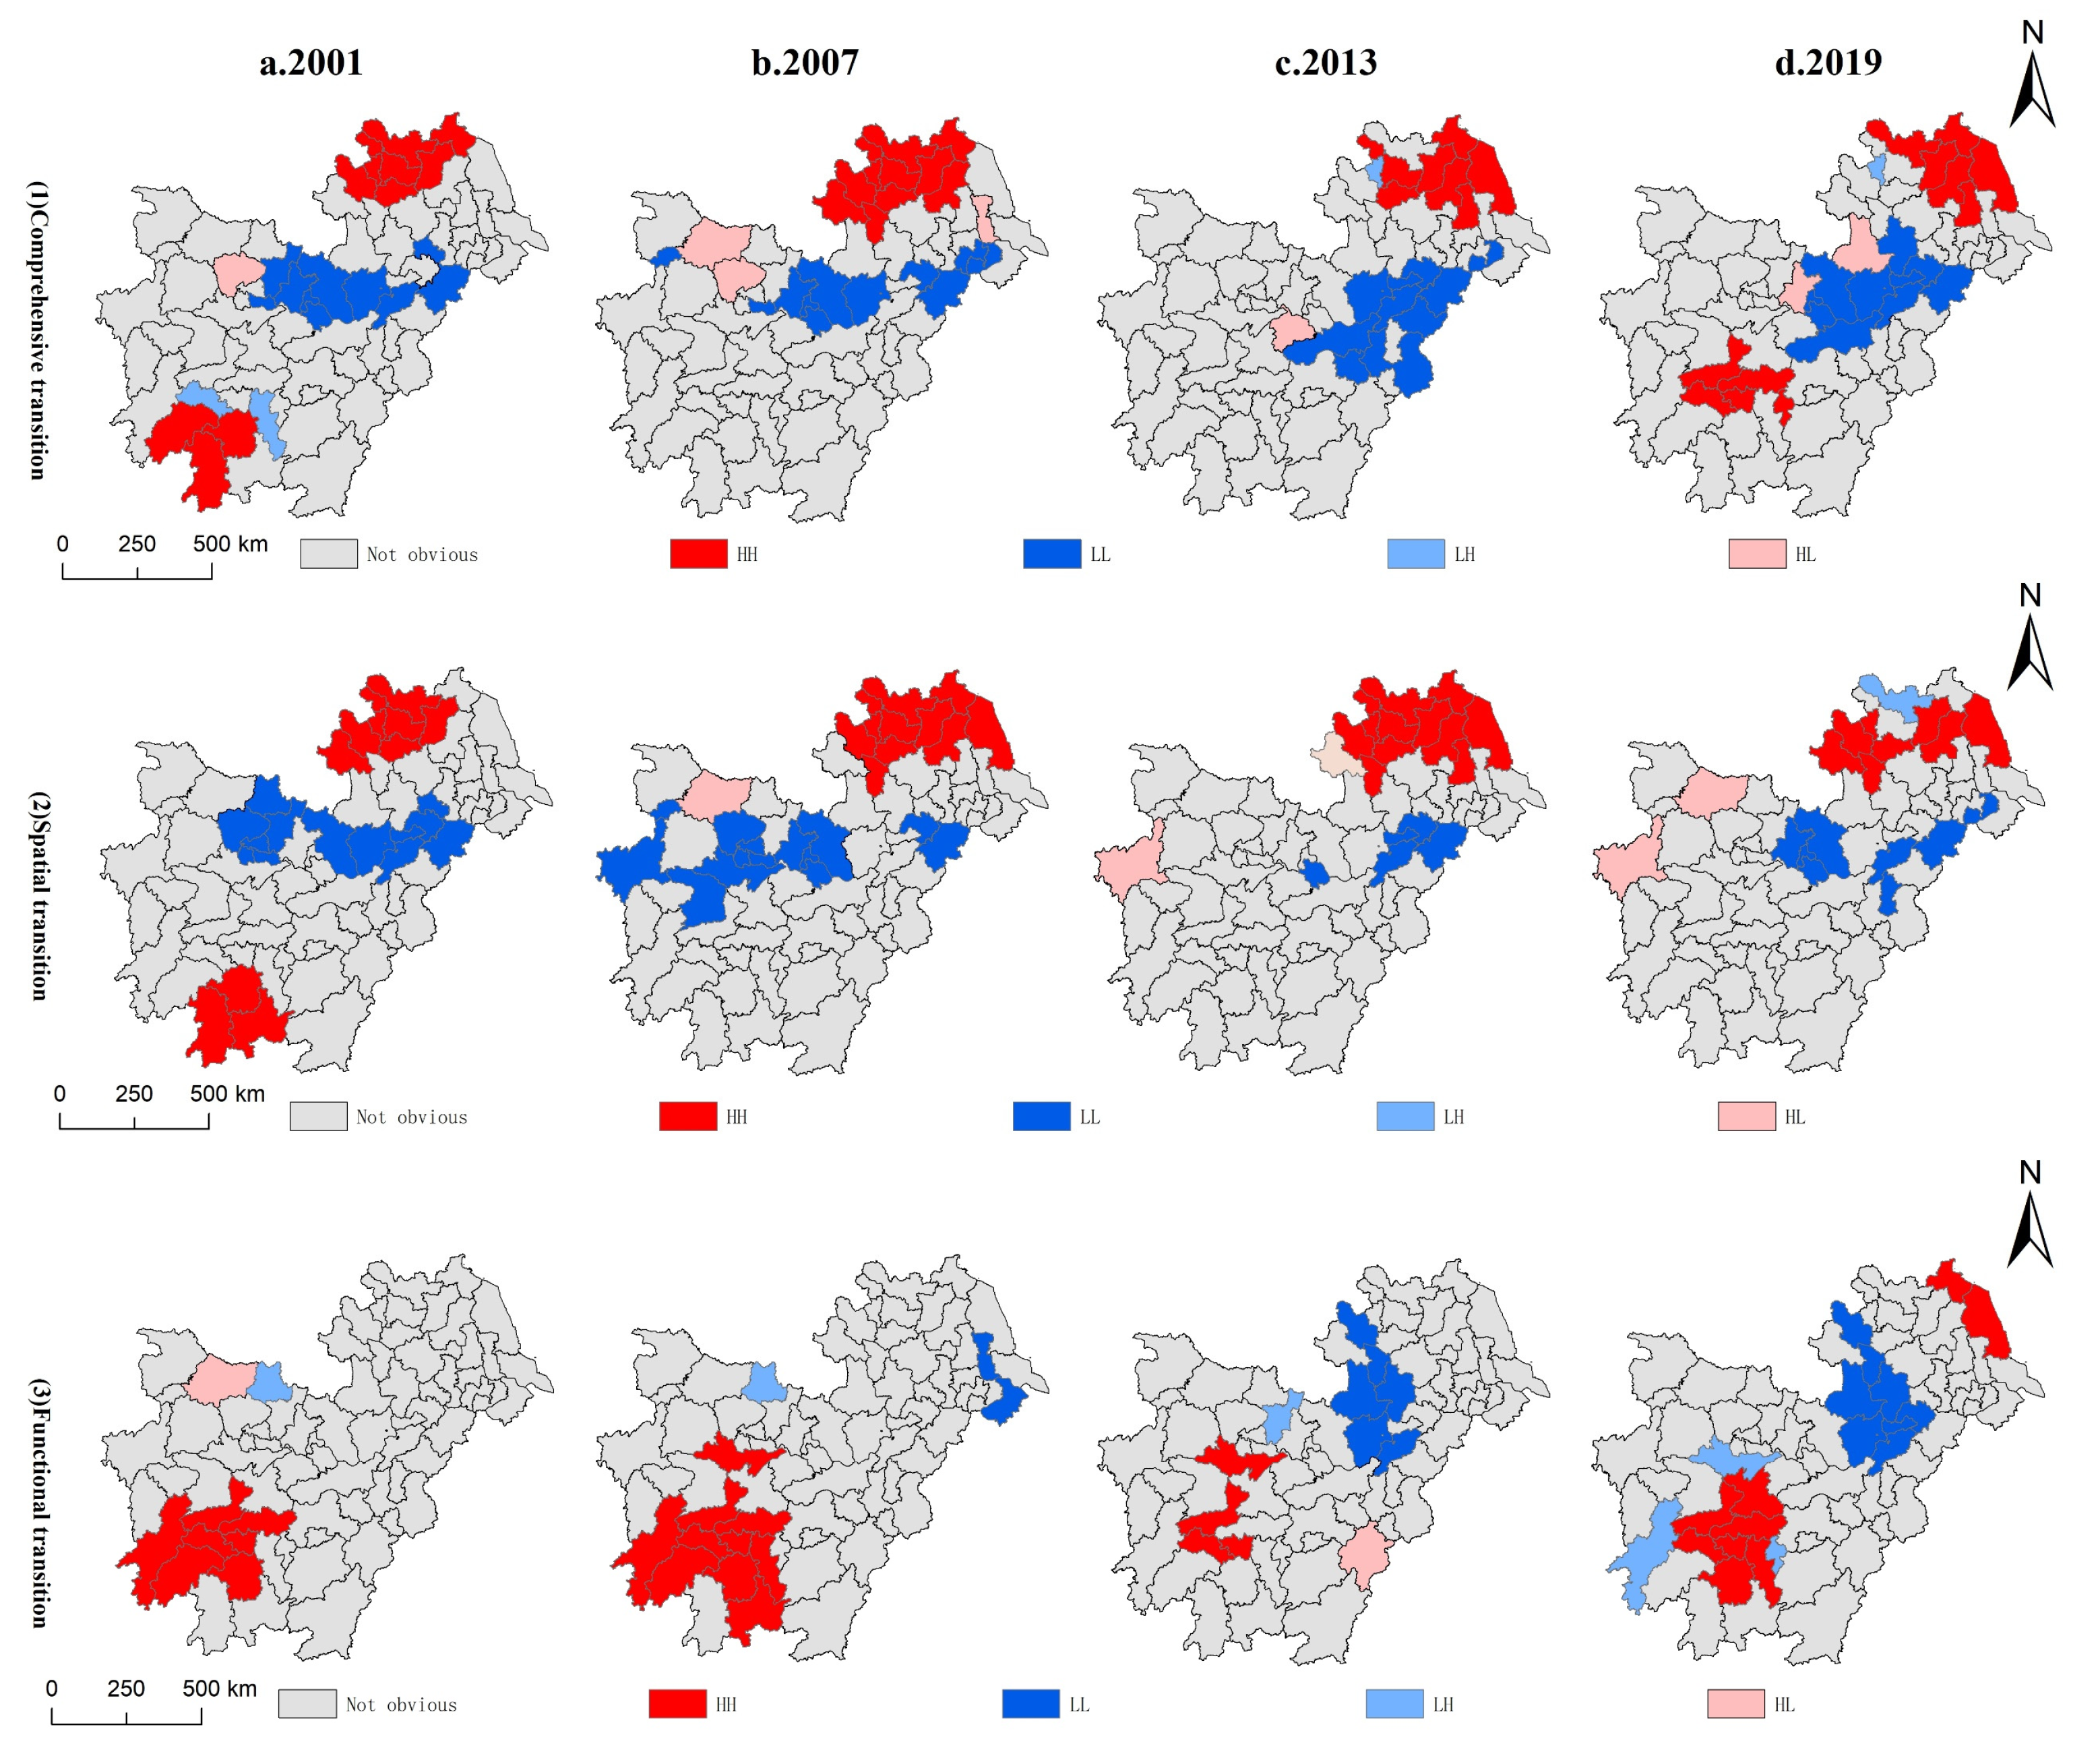
4.2.2. Local Spatial Autocorrelation Analysis

The LISA agglomeration shows the spatiotemporal evolution characteristics of the agglomeration of the CLUT (Figure 9). From 2001 to 2019, the high-high agglomerations of the comprehensive transition of cultivated land use were concentrated in the northeast and southwest of the region, the high-high agglomerations of the spatial transition were concentrated in the northeast, and the high-high agglomerations of the functional transition were distributed in the southwest. This is mainly affected by the differences in location, national policies, and economic development stages, which are analyzed in Section 4.1.2 and Section 4.1.3 of this study. The low-low agglomerations of the cultivated land-use comprehensive, spatial, and functional transitions were distributed in the central region. Combined with Figure 2, it is found that most of these areas are in the transitional zone from mountainous and hilly to plains, with low economic development levels and poor agricultural production techniques. There are few contiguous and flat cultivated lands that are convenient for cultivation, and fragmentation is serious. Thus, the optimization of the cultivated land spatial and functional morphology is restricted to a certain extent.

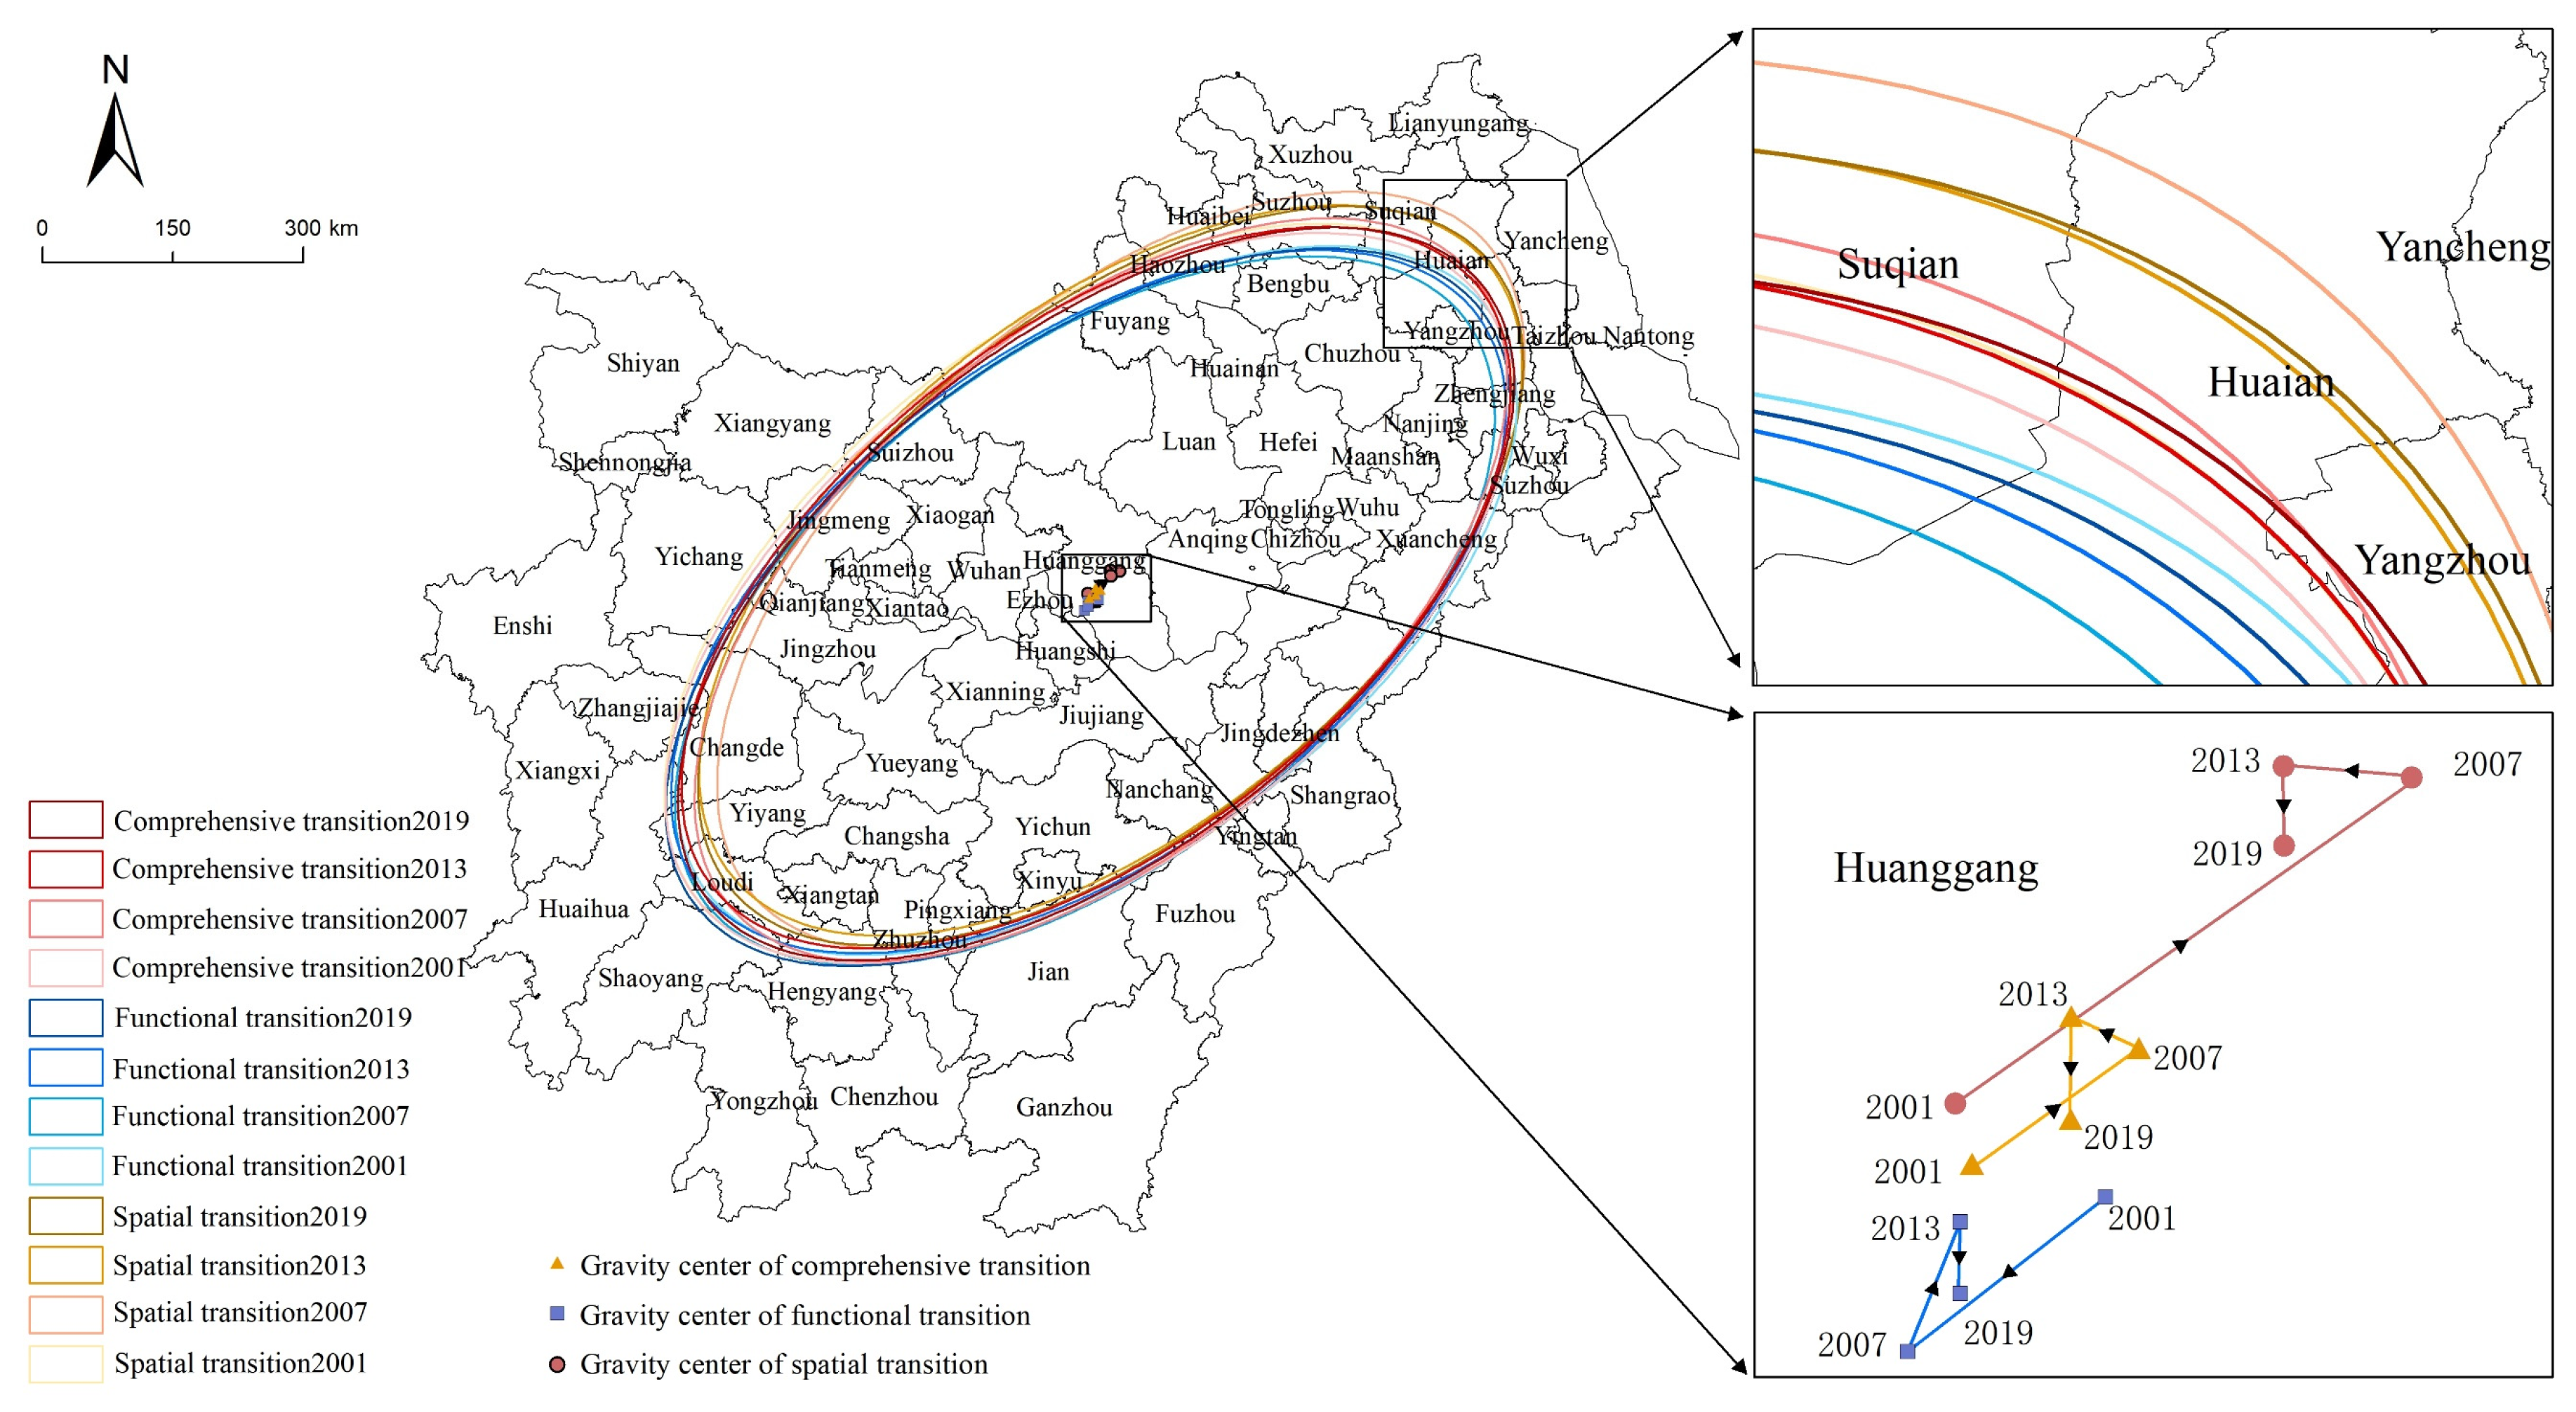
4.3. Changes in the Gravity Center of the CLUT

Figure 10 shows that the overall direction of the gravity center of the comprehensive transition moved from the southwest to the northeast from 2001 to 2019. The migration direction of the gravity center of the spatial transition is basically the same as that of the comprehensive transition, while the functional center of gravity moves in the opposite direction from northeast to southwest. However, since 2013, the movement direction of the gravity center of the spatial transition and functional transition has converged, and the distance between the centers of gravity has been reduced, which is due to the narrowing of the economic level gap within the region. The development of society is a staged process. Therefore, it is speculated that in the short term, the northeastern part of the study area will still be dominated by spatial transitions, while the southwestern part will still be dominated by functional transitions.
From the migration speed of the transition center of gravity, the comprehensive, spatial, and functional transitions all show a slowdown (Table 3). Among them, the center of gravity of the comprehensive transition moved 31.0182 km, and the moving speed dropped from 2.9401 km/year to 1.2370 km/year. The center of gravity of the space transition moved 69.0618 km, and the moving speed decreased from 8.3573 km/year to 1.0814 km/year. The functional transition center of gravity moved 38.5782 km, and the moving speed decreased from 3.2398 km/year to 1.0254 km/year. This was mainly the result of being influenced by the driving forces of socioeconomic transition. First, the central government has focused on high-quality regional development rather than on high-speed development. Therefore, the economic growth rate has slowed, which has led to a slowdown in the migration speed of the center of the cultivated land transition.

5. Discussion

5.1. Comparison of the Hidden Causes of the CLUT

Combined with the research results, this paper analyzes the driving factors of the CLUT. At present, some scholars have carried out the related research from an empirical perspective. Here, we selected several representative studies that measured and calculated the influencing factors of the cultivated land spatial transition or functional transition (Table 4). Through the comparison results, it is found that socioeconomic factors such as the decline in the agricultural population and regional economic development; increasing social demand; physical geographical factors such as the location, topography, hydrogeology, and soil types of cultivated land; and national-led policy factors all promote the CLUT.
The results show that the changes in the spatial morphology of cultivated land are mainly reflected in the reduction in the amount of cultivated land caused by the construction of urban and rural housing sites. Cultivated land generally changes in scale and intensification. However, there is still a small amount of cultivated land that moves toward intensification, because the improvement of living standards of urban residents has created high-end demand for “slow growing” crops. The country’s greening policy also affects the area distribution of cultivated land crops. It can be seen that policies and social needs strongly influence the cultivated land-use direction. Furthermore, with the improvement of the regional socioeconomic level and the implementation of national culture and tourism policies, the functions of cultivated land have developed in a diversified way, such as in cultivated land-cultural functions and landscape functions. There are few studies on the empirical verification of the impact of engineering and technological factors on cultivated land. Nevertheless, engineering technology assists in the leveling and restoration of cultivated land.
Table 4. Comparison of hidden causes of CLUT.
Representative ExampleCultivated Land MorphologyResearch ScaleData TypeConclusion
The slope CLUT characteristics and driving mechanism [48].SpatialMicroSpatial, physical geography, and socioeconomicNatural, socioeconomic, and humanistic policies are the main influencing factors.
The influence of state LED grain localization on the CLUT in suburban areas [49].SpatialMesoSpatial, socioeconomic, policyNational leading food localization promotes the development of greenhouse agriculture.
The change of CLUT after the CAP greening [50].DominantMicroSpatial, policyThe CLUT are subject to greening rules.
The CLUT drivers in Tanzania [51].SpatialMesoSpatial, biophysical, demographic, and socioeconomicDemographic and socioeconomic factors are more significant.
Transitions in the function of cultivated land [33].FunctionalMacroSocioeconomicCultivated land functions change with policy development.
Characteristics and influencing factors of the CLUT in Urban–Rural Coordination Area [52].Dominant and recessiveMesoSpatial and socioeconomicRural employment, per capita GDP, and proximity to central cities are the main factors affecting the CLUT.

5.2. Policy Implications

It can be seen from the above evaluation results that the degree of the CLUT between regions is imbalanced. If the CLUT meets the socioeconomic stage, then it can promote social development, but if it does not meet the socioeconomic stage, then it may hinder socioeconomic development. Therefore, policymakers need to clarify the leading factors of the CLUT, take social development and people’s needs as guidance, and fully consider the regional differences in the CLUT to formulate cultivated land utilization policies. Based on the above analysis, we found that the relatively developed northeast region of the study area has a strong spatial transition of cultivated land, while the relatively underdeveloped economy of the southwest region has a strong functional transition. For areas with a strong spatial transition, urban construction has a greater demand for land, and people’s demands are more abundant. The main goal should be to clarify the relationship between cultivated land use and social demand, and then promote the implementation of measures to compensate for the external cost of the loss of the cultivated land quantity in the following ways. First, it is necessary to control the amount of urban land supply, increase the level of land intensity, and strengthen the protection of basic farmland. Second, this study has demonstrated that the planting structure and type of cultivated land must not only match the needs of society but also meet sustainability requirements. Finally, a cultivated land landscape improvement plan should be established to ensure the degree of concentration and contiguous farmland.
For areas with strong arable land function transitions, the main goal should be to achieve the balanced development of various functions of cultivated land as follows. First, the reform of agricultural modernization should be deepened, land should be consolidated, the soil fertility should be improved, and farmland production efficiency should be increased. In addition, it is necessary to increase agricultural subsidies and absorb agricultural labor. Most importantly, it is essential to develop green agriculture from the perspective of ecological security and innovate agricultural ecological compensation mechanisms. Through these strategies, we can stimulate the endogenous development momentum of agriculture and realize the saving, green, and efficient use of cultivated land. In addition, both the overall and local CLUTs in the study area have positive aggregation effects, which indicates that the CLUT is a systematic problem, and there is a connection between the CLUTs in neighboring areas. Thus, it is necessary to strengthen regional cooperation, facilitate agricultural marketization and information construction, and invigorate agricultural operation mechanisms.

5.3. Limitations and Prospects

The CLUT is an inevitable consequence of socioeconomic transition. In previous studies, scholars have given more attention to changes in the amount or functional structure of cultivated land, while the comprehensive transition process of the cultivated land spatial and functional morphology has not received enough attention. Therefore, this study serves as a useful exploration to evaluate the CLUT and provides a reference for future research. The advantages of this research are as follows. First, this study combined quantitative and qualitative considerations to construct a “spatial–functional” integrated framework to identify the law of the CLUT. The transition of the cultivated land-use morphology is the dominant and recessive manifestation of CLUTs. This parameter is a comprehensive identification of the CLUT. Thus, compared with other regions, the main grain-producing areas have more important tasks for cultivated land protection and food security.
This research provides a novel perspective and content, but it still has some shortcomings. The evaluation of the CLUT is a complicated task, and a unified and standardized evaluation system needs to be established. In this study, natural factors are not considered in the “spatial–functional” comprehensive framework and should be included in subsequent studies. In addition, the defects of China’s current farmland management regulations and property rights system have led to a decline in the quality of arable land. Moreover, the internal changes in cultivated land are more difficult to detect than the external changes. Therefore, research on the scientific and effective comprehensive evaluation systems for the transformation of cultivated land function forms should be the focus of future CLUT research. Subsequent research objects could be further enriched, such as the city scale, village scale, or field scale, especially in semi-urbanized areas where land conflict is more prominent and cultivated land protection is under great pressure. In addition, it is also a key consideration to put forward regulatory policies for the CLUTs in typical regions according to local conditions. In the future plan of this study, the spatial econometric model can be used to quantitatively analyze the core driving factors of CLUT.

6. Conclusions

This paper analyzes the mechanism of CLUT and evaluates the CLUT characteristics in the main grain-producing areas in the middle and lower reaches of the Yangtze River from 2001 to 2019 based on the “spatial–functional” integrated framework. The CLUT index of 71 prefecture-level cities was calculated, and then the magnitude, spatial correlation, direction, and speed of the inter-regional CLUT were analyzed.
The results show that the comprehensive transition index of cultivated land use continued to increase from 0.0480 to 0.0711 during the period. It can be said that social and economic factors have driven the acceleration of CLUT. In particular, the speed of functional transition is stronger than that of spatial transition, because the functional changes of cultivated land are directly intervened by human needs. However, the difference in the transition index between regions significantly expanded, and the transition range increased from 0.0345 to 0.0641. Such evidence suggests that the CLUT in the flat terrain area is larger than that in the mountainous area. Due to the advantages of terrain, the economic development, urbanization, and population growth of the plain area are strong, and the CLUT is fast.
The CLUT in the study area exhibited a positive aggregation effect and strengthened in the period. The degree of aggregation of the spatial and functional transitions increased from 0.3776 to 0.4673 and from 0.2127 to 0.2952, respectively. The CLUT of high-high agglomeration areas was concentrated in the northeast and southwest of the study area, and the low-low agglomerations areas were essentially distributed in the central region. This means that there is a spatial relationship between the CLUT in a region and its surrounding areas, and the activities of cultivated land used by humans are not separated.
The center of gravity of the CLUT has shifted from the southwest to the more economically developed northeast region. and the center of gravity migration speed of comprehensive, functional, and spatial transitions decreased from 2.9401 km/year to 1.2370 km/year, 8.3573 km/year to 1.0814 km/year, and 3.2398 km/year to 1.0254 km/year, respectively. Indeed, socioeconomic factors are often the main driving force behind the CLUT. In the current stage of China’s economic slowdown, optimizing the morphology of cultivated land may be particularly important when adjusting the existing cultivated land management policy.

Author Contributions

Conceptualization, T.L. and S.F.; methodology, T.L., X.Z., G.W. and J.T.; software, S.F. and H.H; validation, T.L. and S.F.; formal analysis, T.L.; investigation, S.F.; resources, X.Z.; data curation, H.H.; writing—original draft preparation, T.L. and S.F.; writing—review and editing, T.L., G.W. and J.T.; visualization, S.F.; supervision, X.Z.; project administration, T.L. and X.Z.; funding acquisition, H.H. All authors have read and agreed to the published version of the manuscript.

Funding

This study was supported by the National Natural Science Foundation of China (No. 71864016 & 42261049), the Postdoctoral Science Foundation of China (No. 2017M622098), the Major Project of Social Science Foundation of China (21&ZD185), the Jiangxi Postdoctoral Science Foundation (No.2017KY55), the Postdoctoral Daily Funding of Jiangxi Province (No. 2017RC036), the Science and Technology Project of Jiangxi Education Department (No. GJJ200509 & GJJ200542), the Humanities and Social Sciences Project of Jiangxi Education Department (No. JC20201), and the Student Research Project of Jiangxi University of Finance and Economics (No. 20210913221051660).

Institutional Review Board Statement

Not applicable.

Data Availability Statement

Not applicable.

Acknowledgments

We thank the editors and anonymous reviewers for their very constructive remarks in preparing the final version of the paper. We also thank all authors for their contributions and joint work to complete the paper. We are solely responsible for the opinions expressed in this article.

Conflicts of Interest

The authors declare no conflict of interest.

References

  1. Foley, J.; DeFries, R.; Asner, G.; Barford, C.; Bonan, G.; Carpenter, S.; Stuart, F.; Coe, M.; Daily, G.; Gibbs, H.; et al. Global consequences of land use. Science 2005, 309, 570–574. [Google Scholar] [CrossRef] [PubMed]
  2. Bai, X.; Shi, P.; Liu, Y. Realizing China’s urban dream. Nature 2014, 509, 158–160. [Google Scholar] [CrossRef] [PubMed]
  3. Jiang, G.; Wang, M.; Qu, Y.; Zhou, D.; Ma, W. Towards cultivated land multifunction assessment in china: Applying the “influencing factors-functions-products-demands” integrated framework. Land Use Policy 2020, 99, 104982. [Google Scholar] [CrossRef]
  4. Liu, Y.S.; Wang, L.; Long, H. Spatio-temporal analysis of land-use conversion in the eastern coastal China during 1996–2005. J. Geogr. Sci. 2008, 18, 274–282. [Google Scholar] [CrossRef]
  5. Long, H.; Zhang, Y.; Ma, L.; Tu, S. Land Use Transitions: Progress, Challenges and Prospects. Land 2021, 10, 903. [Google Scholar] [CrossRef]
  6. Hong, T.; Yu, N.; Mao, Z.; Zhang, S. Government-driven urbanisation and its impact on regional economic growth in China. Cities 2021, 117, 103299. [Google Scholar] [CrossRef]
  7. Lu, X.; Shi, Y.; Chen, C.; Yu, M. Monitoring cropland transition and its impact on ecosystem services value in developed regions of China: A case study of Jiangsu province. Land Use Policy 2017, 69, 25–40. [Google Scholar] [CrossRef]
  8. Long, H.; Li, Y.; Liu, Y. Analysis of evolutive characteristics and their driving mechanism of hollowing villages in China. Acta Geogr. Sin. 2009, 64, 1203–1213. [Google Scholar]
  9. Liu, Y.; Li, Y. Revitalize the world’s countryside. Nature 2018, 548, 275–277. [Google Scholar] [CrossRef]
  10. Li, Y.; Chen, C.; Wang, Y.; Liu, Y. Urban-rural transition and farmland conversion in China: The application of the environmental Kuznets Curve. J. Rural Stud. 2014, 36, 311–317. [Google Scholar] [CrossRef]
  11. Mather, A. The forest transition. Area 1992, 24, 367–379. [Google Scholar]
  12. Lu, X.; Qu, Y.; Sun, P.; Yu, W.; Peng, W. Green Transition of Cultivated Land Use in the Yellow River Basin: A Perspective of Green Utilization Efficiency Evaluation. Land 2020, 9, 475. [Google Scholar] [CrossRef]
  13. Lambin, E.; Meyfroidt, P. Land use transitions: Socio-ecological feedback versus socio-economic change. Land Use Policy 2010, 27, 108–118. [Google Scholar] [CrossRef]
  14. Long, H.L. Land use transition and rural transition development. Prog.Geogr. 2012, 31, 131–138. [Google Scholar]
  15. Ma, L.; Long, H.L.; Tu, S.S. Farmland transition in China and its policy implications. Land Use Policy 2020, 92, 104470. [Google Scholar] [CrossRef]
  16. Song, X.; Wu, Z.; Ouyang, Z. Changes of cultivated land function in China since 1949. Acta Geograph. Sin. 2014, 4, 435–447. [Google Scholar]
  17. Qiang, W.; Liu, A.; Cheng, S.; Kastner, T.; Xie, G. Agricultural trade and virtual land use: The case of China’s crop trade. Land Use Policy 2013, 33, 141–150. [Google Scholar] [CrossRef]
  18. Bren d’Amour, C.; Reitsma, F.; Baiocchi, G.; Barthel, S.; Güneralp, B.; Erb, K.H.; Haberl, H.; Creutzig, F.; Seto, K. Future urban land expansion and implications for global croplands. Proc. Natl. Acad. Sci. USA 2017, 114, 8939–8944. [Google Scholar] [CrossRef]
  19. Deng, X.; Huang, J.; Rozelle, S.; Zhang, J.; Li, Z. Impact of urbanization on cultivated land changes in China. Land Use Policy 2015, 45, 1–7. [Google Scholar] [CrossRef]
  20. Bian, Z.; Kang, M.; Liu, L.; Zhu, R.; Yang, Z. Analysis on farmland multifunction in urban fringe area of Shenyang. Chin. J. Soil Sci 2015, 3, 533–538. [Google Scholar]
  21. Swinton, S.; Lupi, F.; Robertson, G.; Hamiltonde, S. Ecosystem services and agriculture: Cultivating agricultural ecosystems for diverse benefits. Ecol. Econ. 2007, 64, 245–252. [Google Scholar] [CrossRef]
  22. Eklund, L.; Persson, A.; Pilesj, P. Cropland changes in times of conflict, reconstruction, and economic development in iraqi kurdistan. Ambio 2016, 45, 78–88. [Google Scholar] [CrossRef] [PubMed]
  23. Ma, W.; Jiang, G.; Chen, Y.; Qu, Y.; Zhou, T.; Li, W. How feasible is regional integration for reconciling land use conflicts across the urban–rural interface? Evidence from Beijing–Tianjin–Hebei metropolitan region in China. Land Use Policy 2020, 92, 104433. [Google Scholar] [CrossRef]
  24. Li, T.; Long, H.; Zhang, Y.; Tu, S.; Ge, D.; Li, Y.; Hu, B. Analysis of the spatial mismatch of grain production and farmland resources in China based on the potential crop rotation system. Land Use Policy 2017, 60, 26–36. [Google Scholar] [CrossRef]
  25. Long, H.; Liu, Y.; Hou, X.; Li, T.; Li, Y. Effects of land use transitions due to rapid urbanization on ecosystem services: Implications for urban planning in the new developing area of China. Habitat Int. 2014, 44, 536–544. [Google Scholar] [CrossRef]
  26. Jiang, L.; Deng, X.; Seto, K. Multi-level modeling of urban expansion and cultivated land conversion for urban hotspot counties in China. Landscape Urban Plann. 2012, 108, 131–139. [Google Scholar] [CrossRef]
  27. Yue, D.; Du, J.; Gong, J.; Jiang, T.; Zhang, J.; Guo, J.; Xiong, Y. Dynamic analysis of farmland ecosystem service value and multiple regression Analysis of the influence factors in Minqin Oasis. Acta Ecol. Sin. 2011, 31, 2567–2575. [Google Scholar]
  28. Niu, S.; Lyu, X.; Gu, G. A New Framework of Green Transition of Cultivated Land-Use for the Coordination among the Water-Land-Food-Carbon Nexus in China. Land 2022, 11, 933. [Google Scholar] [CrossRef]
  29. Chao, L.; Xu, Y.; An, H.; Liu, Y.; Wang, H.; Lu, L.; Sun, P.; Zheng, W. Spatial identification of land use multi-functionality at grid scale in farming-pastoral area: A case study of Zhangjiakou city, China. Habitat Int. 2018, 76, 48–61. [Google Scholar]
  30. Vadrevu, K.; Ohara, T.; Justice, C. Land cover, land use changes and air pollution in Asia: A synthesis. Environ. Res. Lett. 2017, 12, 120201. [Google Scholar] [CrossRef]
  31. Su, S.; Zhou, X.; Wan, C.; Li, Y.; Kong, W. Land use changes to cash crop plantations: Crop types, multilevel determinants and policy implications. Land Use Policy 2016, 50, 379–389. [Google Scholar] [CrossRef]
  32. He, L.; Min, Q.; Zhang, D. Assessment models for multifunctionality of agriculture and their applications: A case study on Qingtian County in Zhejiang Province. China. Resour. Sci. 2010, 32, 1057–1064. [Google Scholar]
  33. Tian, J.; Wang, B.; Zhang, C.; Li, W.; Wang, S. Mechanism of regional land use transition in underdeveloped areas of China: A case study of northeast China. Land Use Policy 2020, 94, 104538. [Google Scholar] [CrossRef]
  34. Song, X.; Huang, Y.; Wu, Z.; Ouyang, Z. Does cultivated land function transition occur in china? J. Geogr. Sci. 2015, 25, 19. [Google Scholar] [CrossRef]
  35. Daily, G.; Soderquist, T.; Aniyar, S.; Arrow, K.; Dasgupta, P.; Ehrlich, P.; Folke, C.; Jansson, A.; Jansson, B.; Kautsky, N. The value of nature and the nature of value. Science 2000, 289, 395–396. [Google Scholar] [CrossRef]
  36. Xiang, J.; Liao, X.; Song, X.; Xiong, J.; Ma, W.; Huang, J. Regional convergence of cultivated land multifunctions in China. Resour. Sci. 2019, 41, 1959–1971. [Google Scholar] [CrossRef]
  37. Long, H.; Li, T. The coupling characteristics and mechanism of farmland and rural housing land transition in china. J. Geogr. Sci. 2012, 22, 548–562. [Google Scholar] [CrossRef]
  38. Meiyappan, P.; Roy, P.; Sharma, Y.; Ramachandran, R.; Joshi, P.K.; Defries, R.; Jain, A. Dynamics and determinants of land change in India: Integrating satellite data with village socioeconomics. Reg. Environ. Chang. 2017, 17, 753–766. [Google Scholar] [CrossRef] [Green Version]
  39. Xu, Z.; Xu, J.; Deng, X.; Huang, J.; Uchida, E.; Rozelle, S. Grain for green versus grain: Conflict between food security and conservation set-aside in China. World Dev. 2006, 34, 130–148. [Google Scholar] [CrossRef]
  40. Siciliano, G. Urbanization strategies, rural development and land use changes in China: A multiple-level integrated assessment. Land Use Policy 2012, 29, 165–178. [Google Scholar] [CrossRef]
  41. Ma, W.; Jiang, G.; Li, W.; Zhou, T.; Zhang, R. Multifunctionality assessment of the land use system in rural residential areas: Confronting land use supply with rural sustainability demand. J. Environ. Manag. 2019, 231, 73–85. [Google Scholar] [CrossRef]
  42. Jiang, G.; Ma, W.; Qu, Y.; Zhang, R.; Zhou, D. How does sprawl differ across urban built-up land types in China? A spatial-temporal analysis of the Beijing metropolitan area using granted land parcel data. Cities 2016, 58, 1–9. [Google Scholar] [CrossRef]
  43. Rodríguez Sousa, A.; Parra-López, C.; Sayadi-Gmada, S.; Barandica, J.; Rescia, A. A multifunctional assessment of integrated and ecological farming in olive agroecosystems in southwestern Spain using the Analytic Hierarchy Process. Ecol. Econ. 2020, 173, 106658. [Google Scholar] [CrossRef]
  44. Liu, Y.; Liu, Y.; Chen, Y.; Long, H. The process and driving forces of rural hollowing in China under rapid urbanization. J. Geogr. Sci. 2012, 20, 876–888. [Google Scholar] [CrossRef]
  45. Jiang, P.; Chen, D.; Li, M. Farmland landscape fragmentation evolution and its driving mechanism from rural to urban: A case study of changzhou city. J. Rural. Stud. 2021, 82, 1–18. [Google Scholar]
  46. Laliberte, E.; Tylianakis, J. Cascading effects of long-term land-use changes on plant traits and ecosystem functioning. Ecology 2011, 93, 145–155. [Google Scholar] [CrossRef]
  47. Chen, C.-H. A Novel Multi-Criteria Decision-Making Model for Building Material Supplier Selection Based on Entropy-AHP Weighted TOPSIS. Entropy 2020, 22, 259. [Google Scholar] [CrossRef] [PubMed]
  48. Wang, Q.; Li, Y.; Luo, G. Spatiotemporal change characteristics and driving mechanism of slope cultivated land transition in karst trough valley area of Guizhou province, China. Environ. Earth. Sci. 2020, 79, 284. [Google Scholar] [CrossRef]
  49. Zhong, T.; Si, Z.; Shi, L.; Liu, S. Impact of state-led food localization on suburban districts’farmland use transformation: Greenhouse farming expansion in Nanjing city region, China. Landscape. Urban Plan. 2020, 202, 103872. [Google Scholar] [CrossRef]
  50. Bertoni, D.; Aletti, G.; Ferrandi, G.; Micheletti, A.; Cavicchioli, D.; Pretolani, R. Farmland use transitions after the CAP greening: A preliminary analysis using markov chains approach. Land Use Policy 2018, 79, 789–800. [Google Scholar] [CrossRef]
  51. Michael Uisso, A.; Tanrıvermis, H. Driving factors and assessment of changes in the use of arable land in Tanzania. Land Use Policy 2021, 104, 105359. [Google Scholar] [CrossRef]
  52. Li, L.; Wang, L.; Qi, Z. The spatiotemporal variation of farmland use transition and its critical influential factors in coordinated urban-rural regions: A case of Chongqing in western china. Sustain. Cities Soc. 2021, 70, 102921. [Google Scholar] [CrossRef]
Figure 1. Interpretation framework of CLUT.
Land 11 01622 g001
Figure 2. The study area includes Anhui, Hubei, Hunan, Jiangsu, and Jiangxi Provinces.
Land 11 01622 g002
Figure 3. Change trend of the CLUT.
Land 11 01622 g003
Figure 4. The cultivated land-use spatial transition index.
Land 11 01622 g004
Figure 5. Change rate of cultivated land-use spatial transition index.
Land 11 01622 g005
Figure 6. Cultivated land-use functional transition index.
Land 11 01622 g006
Figure 7. Change rate of the cultivated land-use functional transition index.
Land 11 01622 g007
Figure 8. Change trend of the regional cultivated land functional transition index.
Land 11 01622 g008
Figure 9. Local spatial correlation map of CLUT.
Land 11 01622 g009
Figure 10. Path of gravity center of the CLUT.
Land 11 01622 g010
Table 1. Evaluation index system of CLUT.
TargetFactorIndicatorsUnitWeightsDirectionDescriptionMinMaxMean
Spatial transitionQuantity patternTotal area of cultivated land (x1)khm20.0603+Total area of arable land.6.3210843.2165277.3511
Rate of area change (x2)%0.0322+Newly increased (decreased) cultivated land area/total cultivated land area of the previous year.−8.26655.4520−0.7233
Reclamation rate (x3)%0.1430+Cultivated land area/total land area.0.01940.64050.2914
Planting patternPer capita cultivated land area (x4)hm2/person0.0547+Cultivated land area/employees in planting industry.0.03340.33320.1034
Proportion of the planting area for food crops and cash crops (x5)%0.0292+The planting area of food crops/the planting area of cash crops.0.54239.80292.2209
Multiple cropping index (x6)%0.0965+Total sown area of crops/cultivated land area.1.03522.98171.9745
Landscape patternFragmentation degree (x7)/0.0195Total number of farmland patches/total farmland landscape area.0.00100.11670.0287
Aggregation degree (x8)/0.0136+The number of adjacent patches/the total number of cultivated land patches.56.212899.324391.6753
Landscape patterns index (x8)/0.0169E/min E.2.875783.427822.3680
Functional transitionCrop production functionAverage economic output value of cultivated land (x10)yuan/hm20.1132+Total output value of planting industry/cultivated land area.873.655915,437.15854367.4795
Average grain yield of cultivated land (x11)kg/hm20.0242+The total output of grain crops/the sown area of grain crops.2164.46127918.19705869.9524
Average cash crop yield of cultivated land (x12)kg/hm20.0644+The total output of cash crops/the sown area of cash crops.3159.76508453.77684246.2841
Life support functionProportion of employees in planting industry (x13)%0.0423+Planting industry employees/total rural labor force.0.11970.85320.5163
Per capita food guarantee rate (x14)%0.0612+Total grain output/(resident population × 400 kg).29.7647280.0304116.7594
Per capita agricultural income ratio (x15)%0.1604+Farmers’ per capita planting income/farmers’ per capita income.873.379922,038.80674694.1082
Ecological maintenance functionChemical load of cultivated land (x16)t/hm20.0107Pesticides, fertilizers, and agricultural film usage/area of cultivated land.0.12162.24800.6957
Diversity of crop species (x17)/0.0239+Sim.0.20440.76950.5393
Effective irrigation area ratio (x18)%0.0338+Effective irrigation area/total planting area of crops.0.20760.87960.4055
Note: ① For the “Direction” column, the higher the value of the “+” direction index, the better the practical significance, and the lower the “−” direction index value, the better the practical significance. ② S im = 1 - i = 1 n P i 2 : Sim is an index of crop species diversity. Where Pi is the ratio of the sown area of the i-th type of crops to the total sown area of the crops, i is the type of crops, and n is the number of types of crops. Based on the aforementioned, the area, select food crops, vegetable crops, melon crops, and oil crops for calculation.
Table 2. The results of Global Moran’s I.
Years 2001 2007 2013 2019
Type I ValueZ Valuep ValueI ValueZ Valuep ValueI ValueZ Valuep ValueI ValueZ Valuep Value
Comprehensive transition0.41705.71550.0010.53607.34300.0010.38455.26750.0010.40185.50450.001
Spatial transition0.37765.35760.0010.56988.08460.0010.34814.93900.0010.46736.3030.001
Functional transition0.21273.16930.0020.26793.77170.0010.16832.50770.0210.29524.39850.001
Table 3. Speed of gravity center of the CLUT (km/year).
Type2001–20072007–20132013–2019
Comprehensive transition2.94010.99261.2370
Spatial transition8.35732.06161.0814
Functional transition3.23982.16451.0254
Publisher’s Note: MDPI stays neutral with regard to jurisdictional claims in published maps and institutional affiliations.

