Article

The Synchronous Development Pattern and Type Division of Functional Coupling Coordination and Human Activity Intensity Based on the “Production–Living–Ecological” Space Perspective: A Case Study of Wanzhou District

1
College of Public Management, Chongqing Finance and Economics College, Chongqing 401320, China
2
Institute of Green Development, Chongqing Finance and Economics College, Chongqing 401320, China
3
College of Economics, Chongqing Finance and Economics College, Chongqing 401320, China
4
Research Center for Economic of Upper Reaches of Yangtze River, Chongqing Technology and Business University, Chongqing 400067, China
5
Guizhou Academy of Social Sciences, Guiyang 550002, China
6
College of Economics, Yunnan University, Kunming 650091, China
7
College of Economics and Management, Chongqing Jiaotong University, Chongqing 400074, China
*
Authors to whom correspondence should be addressed.
Land 2022, 11(11), 1897; https://doi.org/10.3390/land11111897
Submission received: 16 September 2022 / Revised: 20 October 2022 / Accepted: 23 October 2022 / Published: 26 October 2022
(This article belongs to the Special Issue Rethinking the Man-Land Relations in China)

Abstract

:
The coupling and coordinated change characteristics of land-use production, living, and ecological functions (PLEFs) and their relationship with human activity intensity (HAI) in ecologically fragile areas are important to study, especially in promoting the sustainable development of regional land-use and revealing the evolution of the human–land relationship. In this paper, the coupling coordination degree (CCD) model was used to analyze the coordinated development level of PLEF in Wanzhou District from 2000 to 2020. The HAI was measured by the equivalent of construction land. The synchronous development model was introduced to analyze the relationship between them. The results showed that, in Wanzhou District, the PLEFs showed significant spatial distribution differences and evident spatial complementarity. The PLEFs of Wanzhou District were at a good coordination level, but exhibited a downward trend. A spatial pattern of “high in the west and low in the southeast” was presented. The CCD of the production–living function was poor, which is the critical direction of future optimization. The value of HAI in Wanzhou District showed an increasing trend and exhibited a high concentration in the central town and its surrounding regions. According to the synchronous development state of the HAI and the CCD of the PLEFs, Wanzhou District was divided into three development types. The development type of most areas of Wanzhou District was positive, but the area decreased over the past 20 years. Therefore, it is crucial to propose other regulatory strategies for regions with different development types. This research will provide a decision-making reference for promoting the coordination of the PLEFs and alleviating human–land relations in the reservoir area of central and western China, mountainous regions, and similar areas in developing countries.

1. Introduction

Land is the spatial carrier of national survival and development [1,2,3]. Land is multifunctional. It can provide various products and services to human beings through different land-use functions [4,5]. The classification of land-use functions from the perspective of “production–living–ecological” space (PLES) has been recognized by more and more scholars [6,7,8]. It includes production, living, and ecological functions (PLEFs) [9,10]. The production function (PF) refers to the social output function of using land as the labor carrier to produce products and services [11]. The living function (LF) refers to the function that various land types provide to ensure human survival and growth [12]. The ecological function (EF) is the natural basis and function for maintaining human survival and development, which occurs in the ecosystem and its processes [13]. With the rapid growth of urbanization, intensified human activities have caused severe disturbances to land-use. The function and pattern of land have undergone drastic changes [14,15]. The competition and conflict of the PLES are becoming increasingly fierce [16]. Additionally, the imbalance problems and contradictions of the PLEFs are becoming increasingly prominent [11,17,18] and many other issues frequently occur [19,20,21,22,23,24]. The sustainable utilization of territorial space and the relationship between humans and land are facing severe crises and challenges [11,25]. Accurately understanding the changes in the PLEFs and their relations with the intensity of human activities is the basis for carrying out territorial space planning and coordinating the relationship between humans and land [26,27,28].
The research on PLES functions has mainly focused on the following aspects: (1) the definition of concept and connotation [29], spatio-temporal pattern evolution research [30], classification and function evaluation [31], coupling coordination degree (CCD) research [6,32], spatial layout optimization of PLES and land-use policy, etc. The degree of interaction and coordination between multiple systems can be calculated by the CCD model [33], which has been widely used and achieved fruitful results [34,35]. Scholars generally use human activity intensity (HAI) to measure the degree of human interference with the natural environment. However, when related to research on the degree of land-use, single indicators, such as the land utilization rate and land development intensity, are often used [36], resulting in one-sided research results. In addition, the selection of indicators and the determination of weights in these studies are primarily targeted at specific regions, with the defects of intense subjectivity and poor universality. Based on this, this study adopts the HAI measurement model [37]. The percentage of the equivalent area of construction land to the total area of provincial land is used in this model. This method can reflect the comprehensive status of regional land-use degrees and has strong universality. These methods provide an essential reference for measuring the CCD and HAI in Wanzhou District. However, research on the relationship between them in ecologically fragile areas has not been systematically and deeply carried out. It is urgent that new research ideas are injected for further research.
Wanzhou District is located in the central area of the Three Gorges Reservoir Region (TGRR) and is the financial center of the TGRR. The ecological environment in this area is fragile and highly sensitive to human activities [38]. Therefore, we took ArcGIS 10.4 as the technology platform and adopted land-use raster data. The technical solution for this paper is shown in Figure 1. We aimed to study the evolution characteristics of the CCD and its relationship with the HAI in Wanzhou District from 2000 to 2020. This could reveal the evolution of the human–land relationship in Wanzhou District. The results of this study will contribute to the adjustment and optimization of various ecological policies in the hinterland of the TGRR. We provided a typical example for the study of sustainable development in the reservoir area of central and western China, mountainous areas, and similar areas in developing countries. The objectives of this paper include the following:
(1)
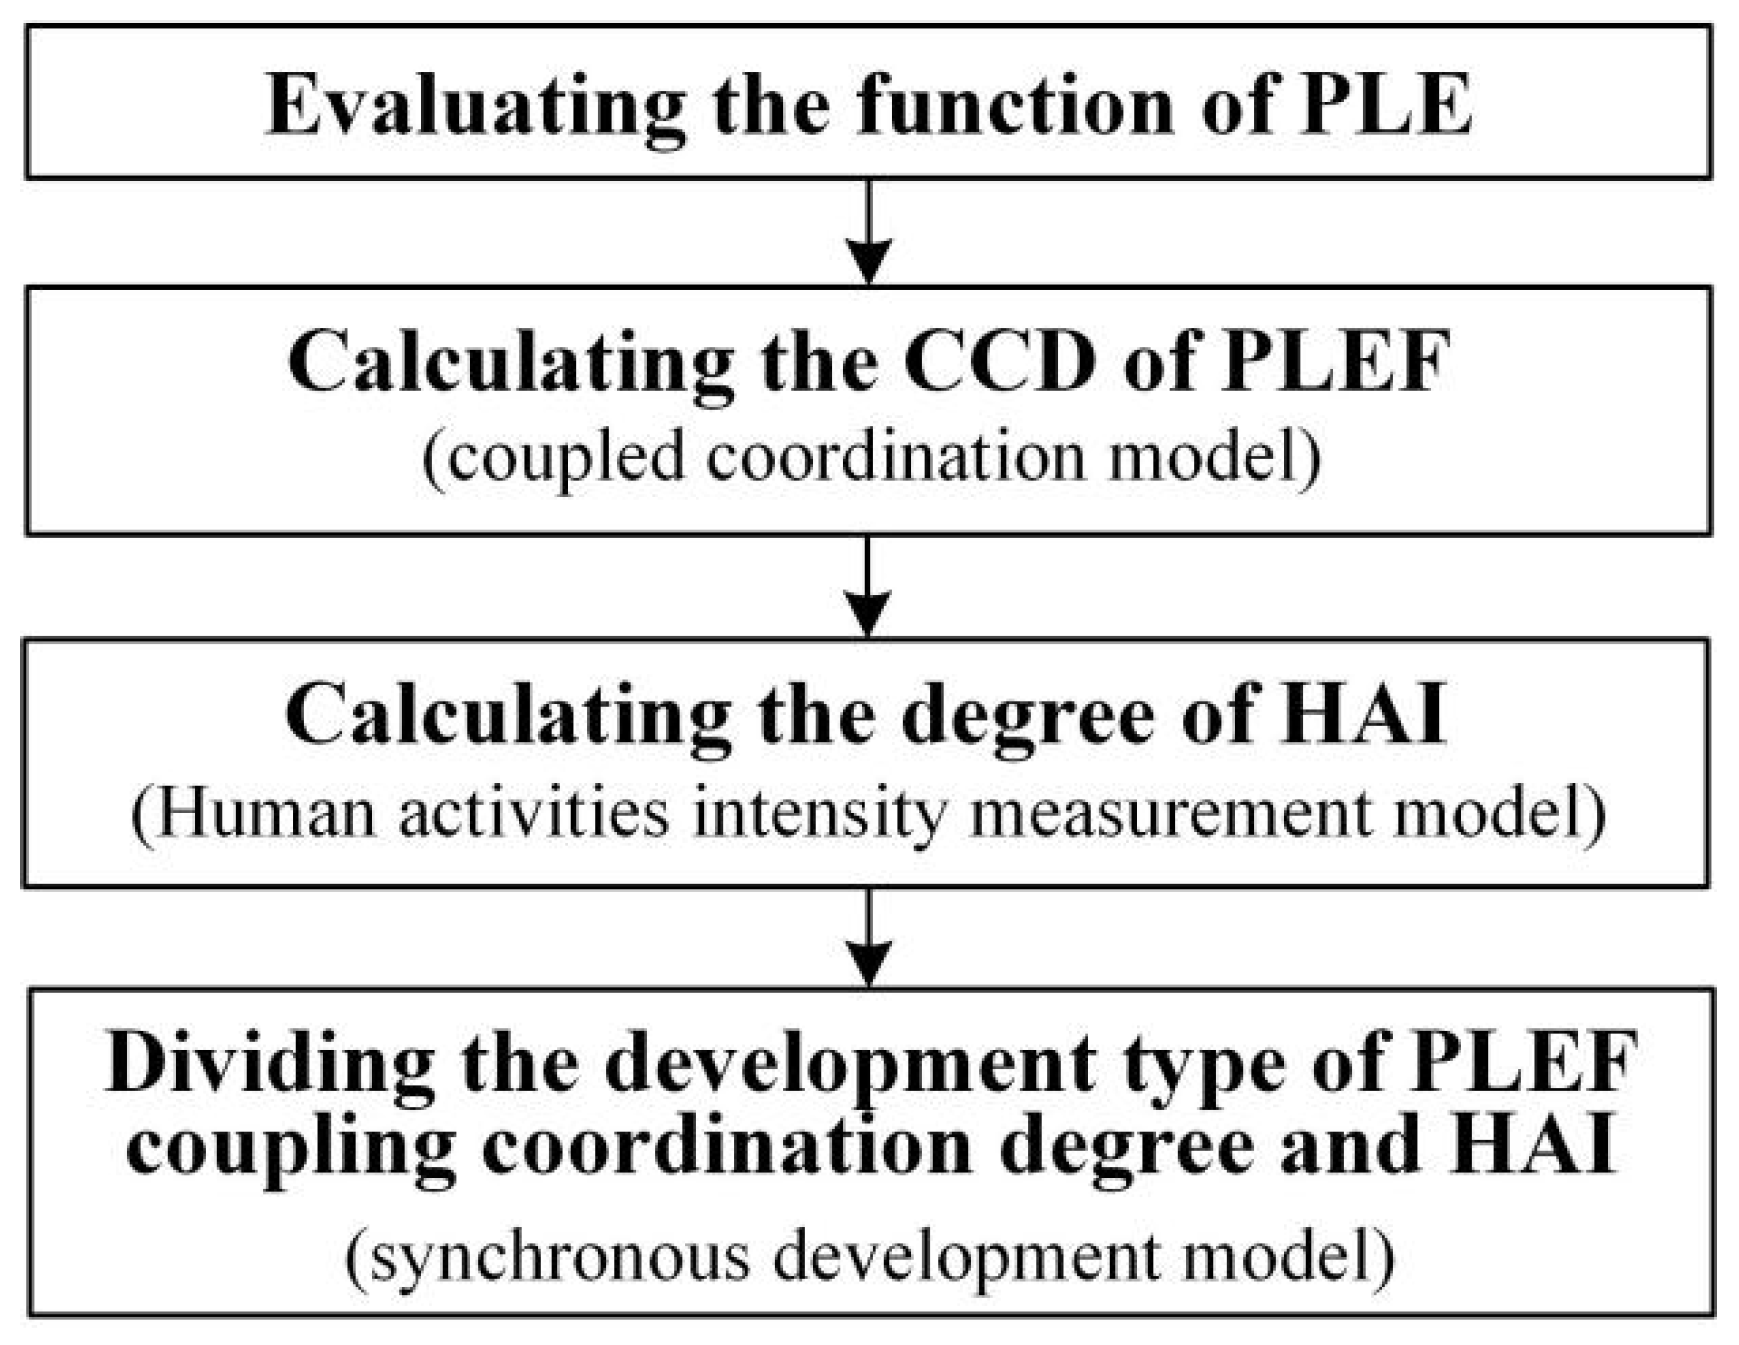
Quantitatively evaluate the CCD of the PLEFs;
(2)
Calculate the spatio-temporal evolution characteristics of the HAI in Wanzhou District;
(3)
Use a synchronous development model to explore the response process of the HAI to the CCD of the PLEFs;
(4)
Divide the development types and put forward different regulation strategies.

2. Materials and Methods

2.1. Study Area

Wanzhou District is located in the upper reaches of the Yangtze River and the heart of the TGRR. It is the second-largest city in Chongqing. It covers an area of 3457 km2, with 12 townships, 29 towns, and 11 subdistricts under its jurisdiction. It also has the dual characteristics of a mountain city and a river city (Figure 2). According to the Seventh National Census bulletin of Wanzhou District, by the end of 2020, the total population was 172.57 million, with an urbanization rate of 68.92%. It is the district with the largest population, the most significant urban volume, and the most management units in Chongqing. The terrain of Wanzhou District is mainly mountainous, and forest is the primary land cover type (53.5%). Purple soil, yellow soil, and lime soil are the main soil types. After three impoundments in the TGRR, the inundated area and the scale of the resettlement project in Wanzhou District are huge. During this period, land-use and the intensity of human activities have undergone significant changes. The ecological environment and landscape pattern change clearly in the area, which is a typical representative area of the hinterland of the TGRR. Therefore, taking Wanzhou District as the study area, this paper will be helpful in revealing the general law of the coupling and coordinated evolution of the PLEFs and their response to the human activity intensity in other ecologically vulnerable areas.

2.2. Data

This paper adopted the land-use raster data of Chongqing from 2000, 2010, and 2020. The resolution is 30 m × 30 m. The data were downloaded from the Data Center for Resources and Environmental Sciences, Chinese Academy of Sciences (http://www.resdc.cn/ (accessed on 5 June 2022)). We used a mask extraction tool to extract the data from Wanzhou District. These data include the following types: cultivated land, woodland, grassland, water area, urban and rural industrial and mining areas and residential land, and unused land. The social–economic data of the Wanzhou District primarily came from the Chongqing Statistical Yearbook (2021), including the total area, population, urban population, urbanization rate, forest coverage rate, etc.

2.3. Methods

2.3.1. Evaluation of PLEFs

Based on the current research results and guided by the functional theory of PLEF, the concepts of strong production land, semi-production land, and weak production land; strong living land, semi-living land, and weak living land; and strong ecological land, semi-ecological land, and weak ecological land were introduced. In addition, according to the existing studies [2,6,39,40], the hierarchical assignment method was used to assign the applicable scores of various functional lands (Table 1).
Firstly, to more accurately identify the land types and evaluate the “production–living–ecological” function, based on the existing research [24] and the actual situation of the research area, the fishing net tool was used to determine the 300 m × 300 m grid as the evaluation unit. We divided Wanzhou District into 39,230 evaluation units. Secondly, the frequency statistics tool was used to calculate the area of each land-use type in each evaluation unit. Thirdly, the multi-factor weighted summation method was used to sum up the functional scores of each evaluation unit. Finally, the results were analyzed by visual mapping to reveal the spatial and temporal evolution characteristics of the PLEFs in Wanzhou District. The formula is as follows:
W j = i = 1 n S i × V i
where Wj is the functional evaluation value of subsystem j in the study area, j = 1, 2, 3; W1, W2, and W3 are the evaluation values of the production space functional system, living space functional system, and ecological space functional system, respectively; I is the land-use type; n is the number of land-use types included in each evaluation unit; Si represents the area of each land-use type in each evaluation unit, and the unit is km2; and Vi represents the function score corresponding to the i-th land-use type (Table 1).

2.3.2. PLEF Coupled Coordination Model

The CCD, introduced from physics, describes the degree of the interaction influence of two or more systems. The coupling effect and coordination degree determine the sustainable development of the system [33]. To explore the spatial distribution and evolution characteristics of the coupling coordination relationship between the PLEFs in Wanzhou District at different periods, considering relevant research results [41,42] and based on the actual study, a measuring model of the coupling degree of the PLEFs in Wanzhou District was constructed.
C = 3 { P i × R i × E i ( P i + R i + E i ) 3 } 1 / 3
where C is the coupling degree of the PLEFs in Wanzhou District, and the value range is [0–1]. The value of C is determined by the evaluation value of the PLEFs. Pi, Ri, and Ei represent the evaluation scores of the production, living, and ecological functions in Wanzhou District, respectively. The higher the value of C, the stronger the interaction and influence within the PLEFs. Using the Natural Breakpoint classification method, the coupling degree of the PLEFs in the study area was divided into four types (Table 2).
To further explore whether the PLEFs are mutually promoted to a high level or mutually restricted to a low level, we constructed the CCD model to further analyze the comprehensive coordination development degree between the PLEFs. The formula is as follows:
D = ( C × T ) 1 / 2 ,   T = α P i + β R i + γ E i
where D is the CCD between the PLEFs in Wanzhou District. The higher the D value of the PLEFs, the better the coupling coordination between functions. T is the comprehensive coordination index among the PLEFs; and α, β, and γ are the undetermined coefficients of the PF, LF, and EF, respectively. Based on the existing research results, the undetermined coefficient was determined to be α = β = 0.3, γ = 0.4.
To further explore the interaction degree and coordinated development of the production–living function, production–ecological function, and living–ecological function, Equations (2) and (3) can be further subdivided into:
C 1 = 2 { P i × R i ( P i + R i ) 2 } 1 / 2 ,   C 2 = 2 { P i × E i ( P i + E i ) 2 } 1 / 2 ,   C 3 = 2 { R i × E i ( R i + E i ) 2 } 1 / 2
D = ( C × T ) 1 / 2 ,   T 1 = α P i + β R i   o r   T 2 = α P i + γ E i   o r   T 3 = β R i + γ E i
According to current research results [43], when measuring the CCD between the production and living functions, α = β = 0.5. When calculating the CCD between the production and ecological functions, α = 0.45, γ = 0.55. When calculating the CCD between the ecological and living functions, β = 0.45, γ = 0.55. By referring to relevant research results [36,37] and combining them with this study, the CCD of the PLEFs can be divided into three stages: good coordination, barely coordinated, and dysregulation recession (Table 3).

2.3.3. Human Activities Intensity Measurement Model

The HAI is an effective index to calculate the intensity of the human transformation of nature. In this paper, we used the construction land equivalent to measure the HAI in Wanzhou District. The areas of different land-use types were converted into corresponding construction land equivalents according to their conversion coefficients of construction land equivalents. Then, HAI was calculated according to the equivalent sum of construction land of different land-use types in the region [37]. The calculation formulas are as follows:
H A I i = S C L E i S i × 100 %
S C L E i j = j = 1 n S L i j × C I i j
where HAIi is the human activity intensity in the i-th region, S C L E i is the equivalent area of construction land in the i-th region, Si is the total area of the i-th region, SLij is the area of the j-th land-use type in the i-th region, CIij is the equivalent conversion coefficient of construction land of the j-th land-use type in the i-th region, and n is the number of land-use types in the i-th region. Referring to existing studies [44], the equivalent conversion coefficient (CIij) of construction land for different land-use types is shown in Table 4.

2.3.4. The Synchronous Development Model

The relationship between the HAI and the CCD of the PLEFs is not only a state at a specific time point, but also a changing process at different time points. Therefore, a synchronous development model was constructed in this paper. We used this model to reveal the synchrony characteristics (lead or lag) of the changes in the CCD of the PLEFs and the HAI level in different years [45,46]. The results can provide a basis for the formulation of differentiated regulation strategies. The calculation formula is as follows:
T = D H A I
where T is the synchronous development degree. If T > 0.1, the coordination degree of the PLEFs is relatively higher than the HAI, and the HAI is lagging, which is defined as the lagging type of development. In this type, HAI does not negatively affect the coupling and coordinated development of the PLEFs. If −0.1 ≤ T ≤ 0.1, their difference is slight. When there is more balance, it is defined as the synchronous type of development. In this type, the HAI and coupling coordination development of the PLEFs are in synchronous coordination; If T < −0.1, it means that the HAI is relatively higher than the CCD of the PLEFs. The HAI is leading development, defined as the leading type of development. This type of HAI negatively affects the coupling and coordinated development of the PLEFs.

3. Results

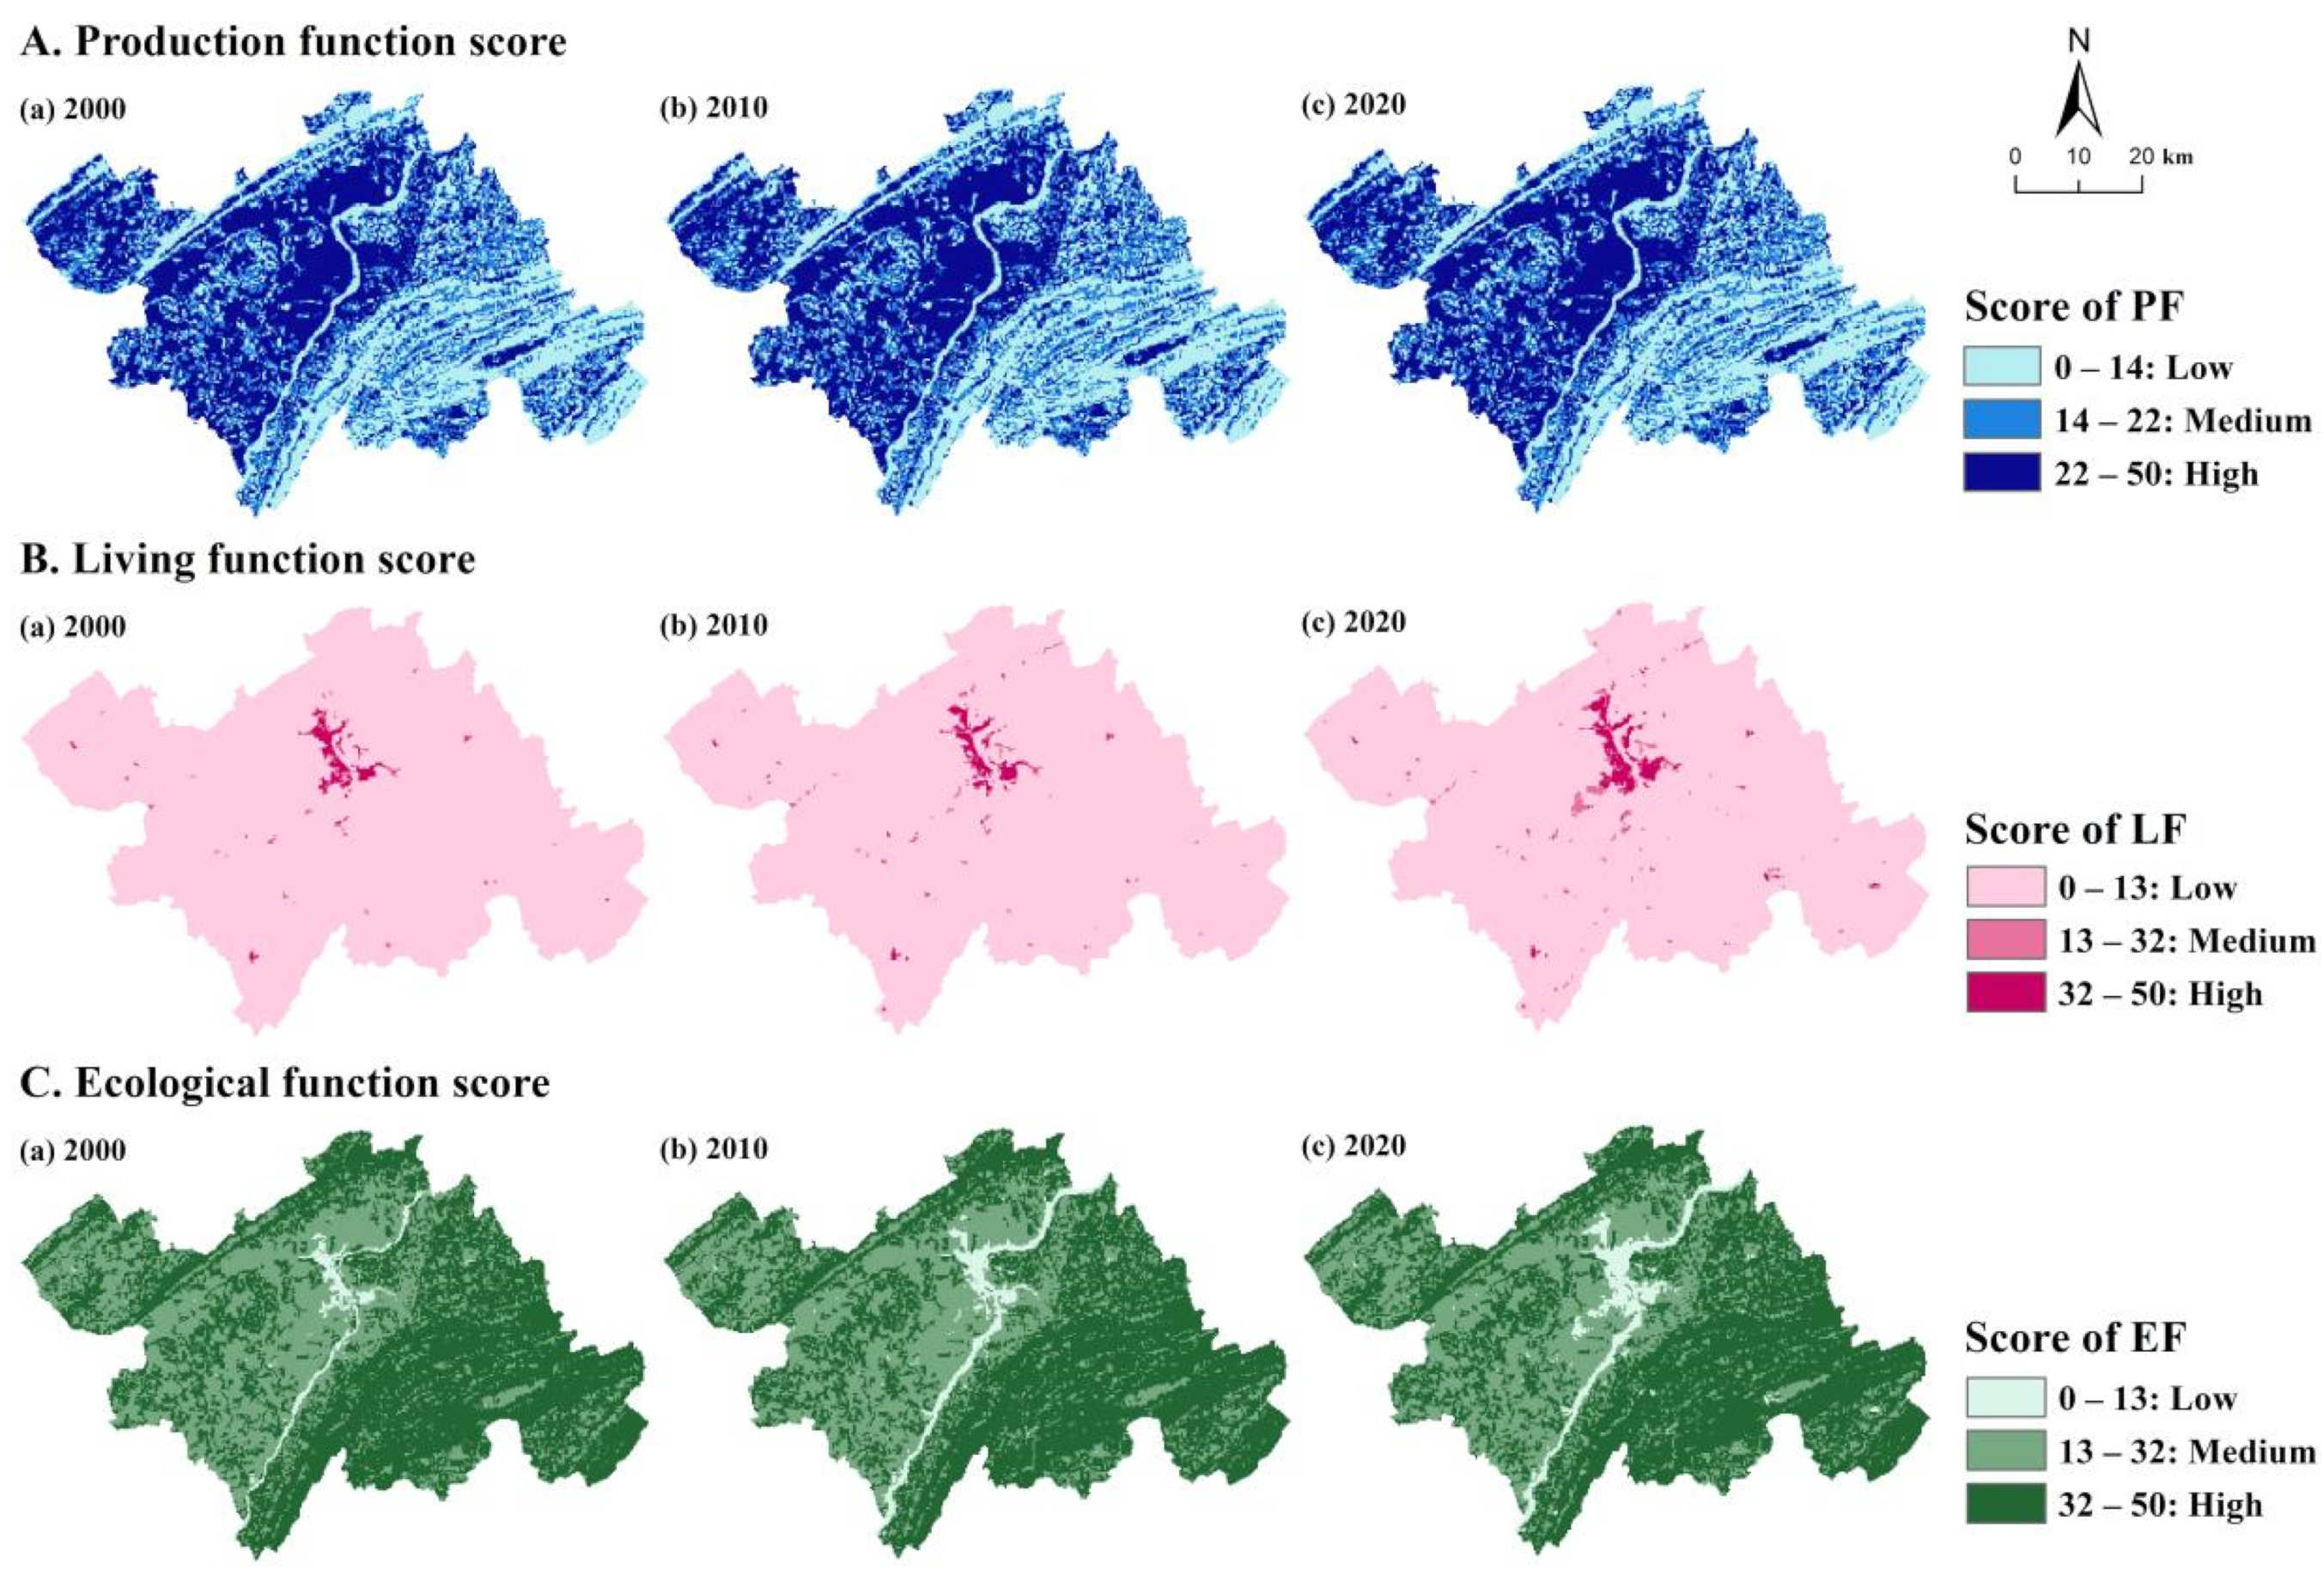
3.1. Spatial–Temporal Evolution Characteristics of the PLEFs

3.1.1. Production Function

From 2000 to 2020, the production function in Wanzhou District increased yearly, showing a spatial distribution characteristic of higher values in the west and lower values in the east (Figure 3). High values were mainly distributed in Gaofeng Town, Shuanghekou Street, Longdu Street, and other places. In the east of Wanzhou District, Zouma Town, Puzi Town, Lishu Town, Dibao Tujia Town, and the Yangtze River had lower values. Owing to the implementation of environmental protection policies along the Yangtze River basin, the land used for industrial and mining construction in the coastal areas was rectified and transferred. The area of land used for intensive production in the Yangtze River basin is decreasing. Tai’an Town, Puzi Township East, Dibao Tujia Township, and the other regions in the past 20 years have developed their strong production land area to vigorously develop the economy. Therefore, the production function scores of the coastal regions of the Yangtze River Basin, Tai’an Town, the eastern part of Puzi Town, Dibao Tujia Town, and other areas changed significantly.

3.1.2. Living Function

From 2000 to 2020, the area with a high living function value in Wanzhou District expanded year by year, showing the spatial distribution characteristics with higher elevation in the central area and lower around (Figure 3). The high value was mainly distributed in the central towns of Wanzhou District, including Pailou Street, Chenjiaba Street, and Wuqiao Street. In the rapid urbanization process in Wanzhou District, especially in the combination of urban and rural areas, the population flow was large, leading to increases in the urban land around the central towns. The living function score changed most significantly in these areas.

3.1.3. Ecological Function

From 2000 to 2020, the evaluation value of the ecological function in Wanzhou District showed a spatial distribution with higher values in the east and lower values in the west (Figure 3). The area with high weight was mainly distributed in Puzi Township, Lishu Township, and Zouma Town. The area with low weight was mainly distributed in the central towns of Wanzhou District and the coastal areas of the Yangtze River Basin, and the scope expanded year by year. Owing to the development concept of “clear water and green mountains are gold and silver mountains” and the implementation of the policies of “returning farmland to forest or grassland” and “returning farmland to the lake”, the ecological environment along the Yangtze River basin was restored, and its ecological function was enhanced. Therefore, the ecological function scores in these areas changed dramatically.
In general, the evaluation values of the ecological function and the other two functions in Wanzhou District showed evident spatial complementarity in their distribution.

3.2. Coupling Coordination Degree of the PLEsF

3.2.1. Coupling Degree

In the spatial dimension, the coupling degree of the PLEFs in Wanzhou District showed the distribution characteristics of high in the west and low in the east. In Gaofeng Town, Jiuchi Town, and other areas, the coupling degree of the PLEFs reached the highest value of “1”. This indicates that the PLEFs of these regions had a great degree of mutual influence. In the temporal dimension, the interaction within the PLEFs in Wanzhou District weakened from 2000 to 2020. Additionally, the weakening range gradually expanded in the center of Chenjiaba Street (Figure 4).
Since the establishment of the TGRR and the direct jurisdiction of Chongqing Municipality, Wanzhou District, the second-largest city of Chongqing and the heart of the TGRR, has received counterpart support from China. In this stage, Wanzhou District vigorously developed its economy, and the areas of urban residential land, industrial and mining land, and land for transportation and water conservancy increased significantly. Moreover, it constantly encroached on ecological space, leading to the weakening of ecological functions and causing the coupling degree of the PLEFs to become lower and lower from 2000 to 2020.
As shown in Figure 5, the production–living function (PLF) coupling degree of central towns in Wanzhou District had a significant value, with the highest value reaching “1”, the scope of which gradually expanded with Pailou Street as the center. This shows that the interaction of central towns in Wanzhou District continued to strengthen. With the continuous development of the economy, the infrastructure of Wanzhou District continuously improved. During the past 20 years, economic production developed vigorously, and the production function reached a dominant position. The production function provides the financial basis and material guarantee for the living function. Therefore, the living function of the central town also improved, and the degree of mutual influence between production and living function increased. The coupling degree of the living–ecological function (LEF) changed little, except in the central urban area. The spatial distribution of the production–ecological function (PEF) coupling was higher in the west than in the east. In 2015, Wanzhou District actively implemented the policy of “returning farmland to forest or grassland.” The area of forest and grassland in Wanzhou District significantly increased, and the ecosystem was restored. Therefore, the coupling degree of PEF in Wanzhou District grew yearly. The interaction between the production and ecological functions has become more robust. However, due to the irreversible impact of economic construction on the ecological environment, the coupling degree of PEF in the central towns of Wanzhou District decreased.

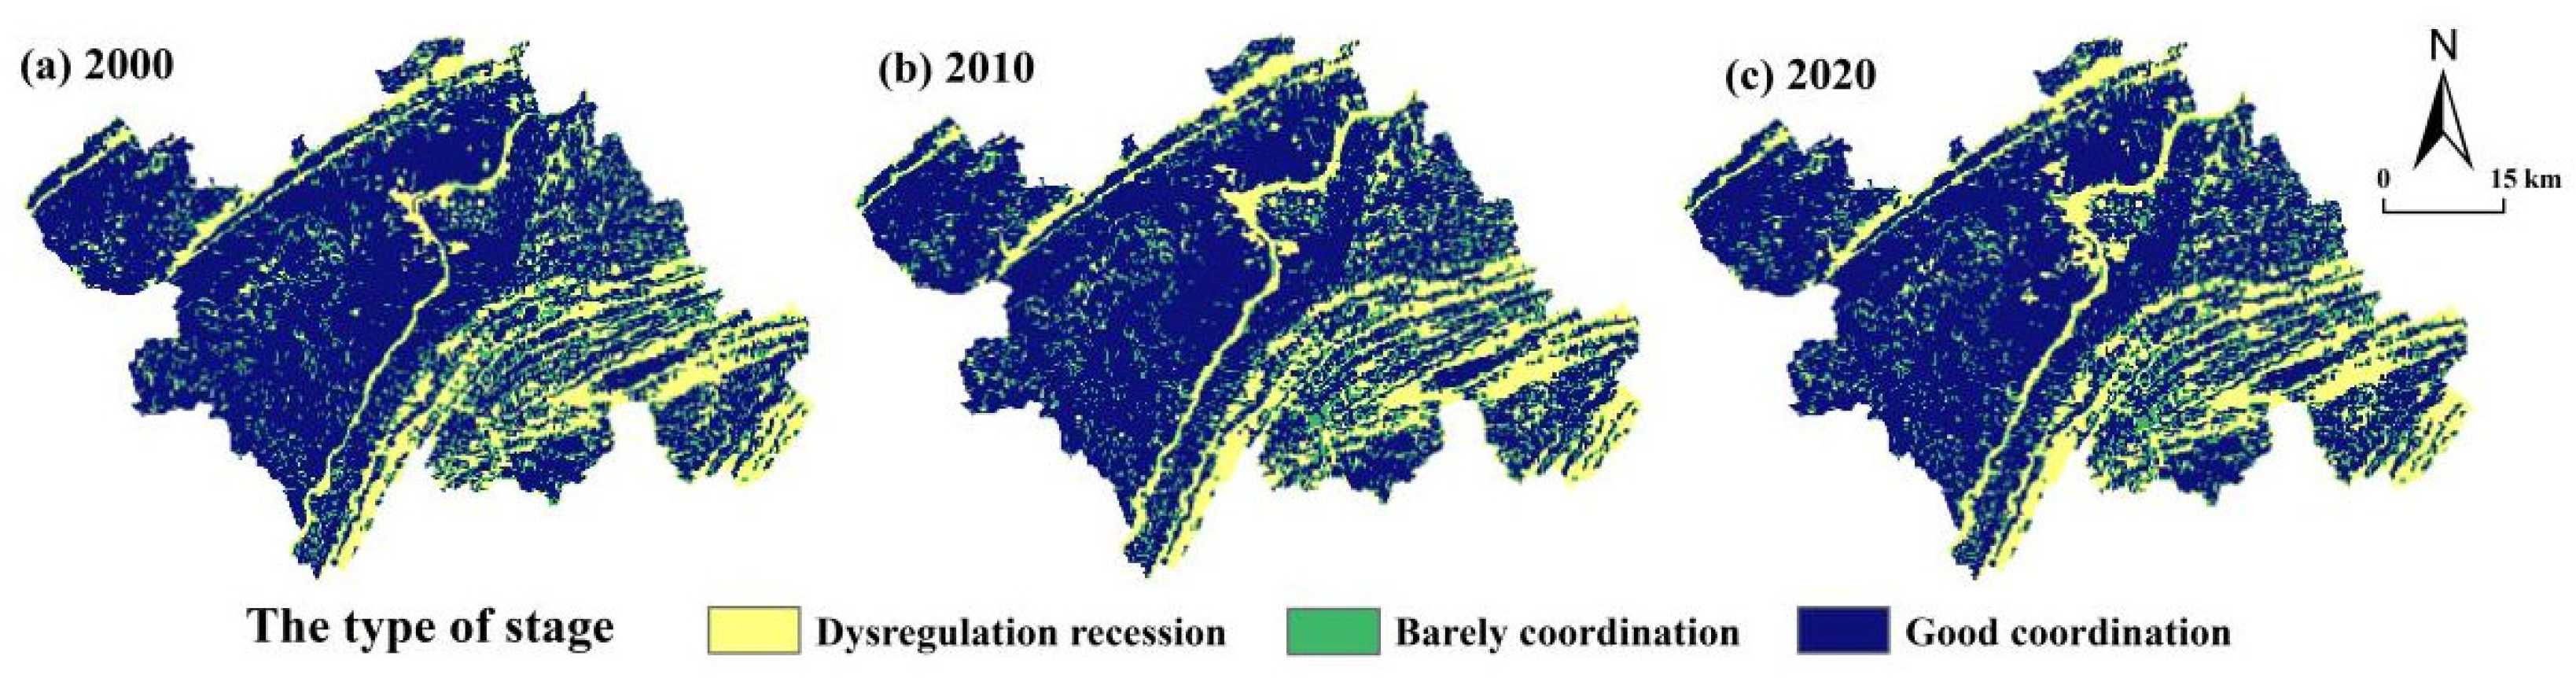
3.2.2. Coupling Coordination Degree

In Wanzhou District, the CCD of the PLEFs was at the coordination level. The spatial distribution decreased from northwest to southeast, and the regional difference was noticeable. The western region of Wanzhou District exhibited good coordination, including Zhushan Township, Gaofeng Town, Lihe Town, and other areas. However, the area of this region decreased from 2198.46 km2 in 2000 to 2142.99 km2 in 2020. This shows that the CCD of the PLEFs decreased in the study area. The barely coordinated area had a wide distribution range, but was relatively scattered, and its area showed a trend of decreasing first and then increasing. The dysregulation recession area was mainly distributed in the eastern and southeastern regions of Wanzhou District, including Longju Town, Lishu Town, Dibao Tujia Town, and the east part of Puzi Town. Its area showed an increasing trend from 566.71 km2 in 2000 to 625.84 km2 in 2020. It can be concluded that, although the coordination area of the PLEFs was dominant, the coordination level decreased in Wanzhou District (Figure 6).
Regarding the CCD of PLF, Wanzhou District was generally in a moderate state of coordination. The spatial distribution included high values in the middle and low values on the two sides, and regional differences were apparent. Most of the western part of Wanzhou District was in a barely coordinated area, including Longsha Town, Ganning Town, Sunjia Town, etc. The moderate coordination area decreased from 2557.00 km2 in 2000 to 2478.39 km2 in 2020. The eastern and southeastern regions were in dysregulated recession, including Longju Town, Puzi Town, Zouma Town, etc. Its area showed a trend of first increasing and then decreasing. The good coordination area was mainly distributed in the central towns of Wanzhou District, such as Longdu Street, Bell and Drum Tower Street, Pailou Street, etc. The spatial distribution was more concentrated, and its area showed an increasing trend. This indicates that the CCD of PLF in Wanzhou District improved. This was mainly due to the construction and development of central towns in Wanzhou District and the continuous improvement of infrastructure, which provide space-bearing and material guarantees of living functions. The CCD between the production and life functions improved and was at the coordination level (Figure 7).
Regarding the CCD of PEF, Wanzhou District was in a moderate coordination state. The spatial distribution features included high values on both sides and low values in the middle, and the regional difference was pronounced. Most of the eastern and western areas of Wanzhou District were in good coordination, such as Zishui Town, Danzi Town, Puzi Town, etc. The coordination area decreased from 3358.24 km2 in 2000 to 3300.50 km2 in 2020, indicating that the CCD of production and life decreased. The barely coordinated area showed a point distribution, and the area showed an upward trend. The moderate coordination area increased by 12.48 km2. The central region was in dysregulation recession, including Chenjiaba Street, Pailou Street, etc. Its area showed an increasing trend, and the area of the discordant area increased by 45.26 km2 over the past 20 years. Owing to the excessive production development and human activities, ecological damage in the central region was caused. The CCD of PEF was at an uncoordinated level, and the scope gradually expanded (Figure 7).
Regarding the CCD of LEF, Wanzhou District was in a state of coupling coordination. The spatial distribution exhibited a decrease from northwest to southeast. Most of the western and northwestern areas were in good coordination, including Fanshui Town, Yujia Town, Houshan Town, etc. The area of coordination decreased from 2325.32 km2 in 2000 to 2264.59 km2 in 2020. The CCD of LEF in the southeast region was in dysregulation recession, including Lishu township, the eastern part of Puzi township, and the eastern part of Yanshan township. During the past 20 years, the discordant area increased by 60.22 km2. The barely coordinated area was scattered between the uncoordinated area and the communal area, and its area showed a trend of decreasing first and then increasing. The distribution of CCD between the production and ecological functions of central towns in Wanzhou District changed obviously. The uncoordinated area showed a trend of expansion year by year. This was mainly because domestic land continuously encroached on ecological land, resulting in the reduction of the area of ecological land and the reduction of the CCD between the living and ecological functions (Figure 7).

3.3. Spatial–Temporal Evolution Characteristics of HAI

From 2000 to 2020, the human activity intensity in Wanzhou District showed an increasing trend. It was 17.47% in 2000, 17.97% in 2010, and 18.81% in 2020. The HAI in Wanzhou District during different periods was divided into five levels by the GIS natural break point method (Table 5).
Only the highest level has expanded, while the other four scales reduced. The spatial distribution of the HAI in Wanzhou District differed. The distribution pattern was “high in the west and low in the east”. The areas with the highest level were primarily distributed in the central towns of Wanzhou District, and the scope expanded yearly. The areas with lower and lowest levels were primarily distributed in the eastern part of Wanzhou District. This area had high elevation, and its land-use type was ecological land dominated by forest and grass, playing an ecological protection role (Figure 8).

3.4. The Development Type of the PLEF Coupling Coordination Degree and HAI

The development types were preliminarily determined according to the synchronous development index of the HAI and the CCD of the PLEFs (Table 6). According to the coupling coordination index (D), Wanzhou District could be divided into three types: dysregulation recession, barely coordinated, and good coordination. According to the synchronous development index (T), Wanzhou District could be divided into three types: lagging development, synchronous development, and advanced development. The results of the two indices can be combined into nine classes, including dysregulation recession–advanced development, dysregulation recession–synchronous development, dysregulation recession–lagging development, barely coordinated–advanced development, barely coordinated–synchronous development, barely coordinated–lagging development, good coordination–advanced development, good coordination–synchronous development, and good coordination–lagging development. It is considered that regulating the synchronous development index is key to promoting the coordinated development of regional human–land relations. Therefore, we used the synchronous development index to classify the study area into three types: negative, positive, and synchronous.
According to the preliminary results, the development type of most areas in Wanzhou District was positive. That is, the development of regional economic construction was not based on the sacrifice of the coordinated development of the PLEFs. However, the proportion of positive and synchronous types decreased over 20 years. Among them, the proportions of the “good coordination–lagging development” type and the “dysregulation recession–synchronous development” type fell the most obviously, which decreased by 2.44% and 1.81%, respectively. The ratio of the negative area increased by 4.26%, among which the proportion of the “dysregulation recession–advanced development” type increased the most, with a total increase of 3.6% over the past 20 years. The development of these regions was the sacrifice of the coordinated development of PLEFs. The relationship between humans and land is tense and is in urgent need of regulation. Therefore, according to the synchronous development state of the HAI and the CCD of PLEFs in Wanzhou District, it is essential to classify the study area and put forward different regulation strategies (Figure 9).

4. Discussion

4.1. Policy Recommendations

The first recommendation is for the development of hostile regions. The scale of construction land should be reasonably determined and the HAI should be controlled. To avoid irreversible damage to the coupling coordinated development of the PLEFs in the process of HAI growth, it is also necessary to increase investment in environmental protection and environmental governance. The remediation and the closure of seriously polluting factories, and promoting the ecological transformation of the industry are important. The implementation of policies and striving to improve the maladjustment of human–land relationships should be strengthened.
The second is for the development of synchronous regions. It is necessary to maintain the synchronous and coordinated development state of the current HAI and the coupling coordination level of PLEFs. It is also important to upgrade and relocate industries that are energy-intensive and highly polluting, treating wastewater, waste gas, and waste residue. The government should also actively promote knowledge of agricultural pollution, and improve the awareness of farmers to use land and raise land in order to reduce agrarian non–point source pollution and soil pollution considering the synchronous coordination of economic development, ecological protection, and comfortable living. Thus, this will promote the deep integration of the PLEFs.
The third is for the development of positive regions. Under the guidance of the concept of “ecological priority and green development”, The relationship between protecting the ecological environment, guaranteeing economic development, and preserving bare farmland should be resolved. Through land space planning, the layout of ecological lands, such as green heartlands and the green belt, should be increased. An appropriate amount of development of unused land, easing the central area of land tension, and undertaking industrial transfer should be conducted. Combined with local characteristics, ecological leisure tourism should be properly developed. The advanced production technology should be introduced and there should be scientific increases in various production input factors. A three-dimensional, circular, ecological, high–quality, and sustainable agricultural development model should be formed.

4.2. Contributions and Limitations

Promoting the coupling and coordinated development of the regional PLEF has become one of the critical issues for regional sustainable development. To clarify the relationship between the HAI and the CCD of the PLEFs, this paper has the following advantages. Firstly, compared with previous studies [47], we used a 300 m × 300 m grid as the evaluation unit to make the evaluation result more accurate. This provided more precise location information for land-use decisions and land management. Secondly, we referred to the existing research [37] and calculated the HAI according to the sum of the construction land equivalents of different regional land use types on the grid scale. The calculated results could not only reflect the comprehensive effect degree of human social and economic activities on land resources, but also enhance the comparability of the research results of the intensity of human activities in different regions. Thirdly, exploring the relationship between the HAI and the coupling coordination of PLEF is a point that was easily neglected in previous studies. In this study, we try to use the synchronous development model [45,46] to preliminarily discuss and classify the development relationship. Fourthly, based on analyzing the level of HAI and the CCD of PLEF, this paper scientifically discriminated the factors restricting synchronous development and divided the regions into different types. The differentiation promotion strategy was put forward, providing a theoretical and practical reference for regional sustainable development.
However, because of the complexity of the changing interaction between the HAI and the CCD of the PLEFs, and due to the limitations of data and data acquisition, this paper only tried to explore the interaction relationship between them from the perspective of synchronous development and the spatial grid scale. The scientific prediction of the evolution of the relationship and taking scientific measures in advance for accurate regulation are of significance to alleviate the contradiction between humans and land and achieve regional sustainable development. Therefore, in the future, it will be necessary to carry out relevant research on the evolution direction of the synchronous development relationship between the HAI and the CCD of PLEF from other perspectives and different spatial scales in order to obtain its internal operating mechanism and distribution law systematically.

5. Conclusions

The methods of the CCD model, human activity intensity model, and synchronous development model were used in this paper. This paper calculated and analyzed the evolution characteristics of the CCD of the PLEFs and the intensity of human activities in Wanzhou District from 2000 to 2020, as well as the types of their development relations. The following conclusions can be obtained:
(1)
In Wanzhou District, the PLEFs showed significant spatial distribution differences and evident spatial complementarity. The spatial distribution of the production function was higher in the west than in the east. The living function showed the spatial distribution characteristics of being higher in the middle. The ecological function showed the spatial distribution characteristics of being higher in the east and lower in the west.
(2)
From 2000 to 2020, the coupling degree of the PLEFs in the Wanzhou District decreased and the interaction became weak. The CCD of the PLEFs was at a good coordination level, but there was also a downward trend. The coupling coordination of the living–production function was poor, which is the critical direction for future optimization.
(3)
The HAI in Wanzhou District showed an increasing trend and formed a high concentration in the central town and its surrounding areas. The development type of most regions in Wanzhou District was positive.
(4)
In Wanzhou District, the “good coordination–lagging development” type was dominant, but the area ratio decreased, while the proportion of “dysregulation recession–advanced development” increased. We proposed different regulation strategies for further development types to improve the regional CCD of the PLEFs and guide the harmonious development of regional human–land relationships.

Author Contributions

The co-authors together contributed to the completion of this article. Specifically, their individual contributions are as follows: conceptualization, T.L., F.Y. and Y.L.; software, M.F., X.H. and F.Y.; methodology, T.L., X.H. and M.F.; validation, T.L., Y.L. and M.F.; formal analysis, T.L. and X.H.; resources, T.L.; data curation, X.H. and M.F.; writing—original draft preparation, T.L., X.H. and M.F.; writing—review and editing, T.L., F.Y. and Y.L.; visualization, T.L. and F.Y.; supervision, T.L., Z.Z., C.W. and X.R. All authors have read and agreed to the published version of the manuscript.

Funding

This research was funded by the Key Program of the National Social Science Foundation of China (Grant No. 20&ZD095), the National Social Science Foundation of China (Grant No. 21BJY223), the 2020 General Project of Water Transport Economics Research Center, Key Research Base of Humanities and Social Sciences of Colleges and Universities of Sichuan Province (Grant No. SYJJ2020C02), the National Social Science Youth Foundation of China (Grant No. 21CJY044), the National Social Science Youth Foundation of China (Grant No. 18CJL031), the Science and Technology Research project of Chongqing Education Commission (Grant No. KJQN202102103), the Humanities and Social Sciences Research Project of Chongqing Education Commission (Grant No. 21SKGH308), and the Chongqing Social Science Planning Social Organization Project (Grant No. 2021SZ26).

Institutional Review Board Statement

Not applicable.

Informed Consent Statement

Not applicable.

Data Availability Statement

The data presented in this study are available on request from the author.

Conflicts of Interest

The authors declare no conflict of interest.

References

  1. Ahmad, M.; Rehman, A.; Shah, S.A.A.; Solangi, Y.A.; Chandiod, A.A.; Jabeen, G. Stylized heterogeneous dynamic links among healthcare expenditures, land urbanization, and CO2 emissions across economic development levels. Sci. Total Environ. 2021, 753, 142228. [Google Scholar] [CrossRef]
  2. Wang, D.; Jiang, D.; Fu, J.; Lin, G.; Zhang, J. Comprehensive assessment of production–living–ecological space based on the coupling coordination degree model. Sustainability 2020, 12, 2009. [Google Scholar] [CrossRef] [Green Version]
  3. Lin, G.; Fu, J.; Jiang, D. Production–living–ecological conflict identification using a multiscale integration model based on spatial suitability analysis and sustainable development evaluation: A case study of Ningbo, China. Land 2021, 10, 383. [Google Scholar] [CrossRef]
  4. Helming, K.; Perez-Soba, M.; Tabbush, P. (Eds.) Sustainability Impact Assessment of Land Use Changes; Springer: Berlin/Heidelberg, Germany, 2008. [Google Scholar]
  5. Liu, Y.S. Introduction to land use and rural sustainability in China. Land Use Policy 2018, 74, 1–4. [Google Scholar] [CrossRef]
  6. Yang, Y.Y.; Bao, W.K.; Liu, Y.S. Coupling coordination analysis of rural production-living-ecological space in the Beijing-Tianjin-Hebei region. Ecol. Ind. 2020, 117, 106512. [Google Scholar] [CrossRef]
  7. Zhou, D.; Xu, J.C.; Lin, Z.L. Conflict or coordination? Assessing land use multi-functionalization using production-living- ecology analysis. Sci. Total Environ. 2017, 577, 136–147. [Google Scholar] [CrossRef] [PubMed]
  8. Zou, L.L.; Liu, Y.S.; Yang, J.X.; Yang, S.F.; Wang, Y.S.; Cao, Z.; Hu, X.D. Quantitative identification and spatial analysis of land use ecological-production-living functions in rural areas on China’s southeast coast. Habitat Int. 2020, 100, 102182. [Google Scholar] [CrossRef]
  9. Fang, Y.G.; Liu, J.S. Diversified agriculture and rural development in China based on multi–function theory: Beyond modernization paradigm. Acta Geogr. Sin. 2015, 70, 257–270. [Google Scholar]
  10. Long, H.L.; Tu, S.S.; Ge, D.Z.; Li, T.T.; Liu, Y.S. The allocation and management of critical resources in rural China under restructuring: Problems and prospects. J. Rural Stud. 2016, 47, 392–412. [Google Scholar] [CrossRef] [Green Version]
  11. Zhang, Y.N.; Long, H.L.; Tu, S.S.; Ge, D.Z.; Ma, L.; Wang, L.Z. Spatial identification of land use functions and their tradeoffs/ synergies in China: Implications for sustainable land management. Ecol. Ind. 2019, 107, 1100–1114. [Google Scholar] [CrossRef]
  12. Geoghegan, J. The value of open spaces in residential land use. Land Use Policy 2002, 19, 91–98. [Google Scholar] [CrossRef]
  13. Shan, Y.J.; Wei, S.K.; Yuan, W.L.; Miao, Y. Spatial-temporal differentiation and influencing factors of coupling coordination of “production-living-ecological” functions in Yangtze River Delta urban agglomeration. Acta Ecol. Sin. 2022, 42, 1–12. [Google Scholar]
  14. Azadi, H.; Vanhaute, E.; Janekova, K.; Sklenick, P.; Teklemariamet, D.; Feng, L.; Witlox, F. Evolution of land distribution in the context of development theories. Land Use Pol. 2020, 97, 104730. [Google Scholar] [CrossRef]
  15. Sumari, N.S.; Cobbinah, P.B.; Ujoh, F.; Xu, G. On the absurdity of rapid urbanization: Spatio-temporal analysis of land-use changes in Morogoro, Tanzania. Cities 2020, 107, 102876. [Google Scholar] [CrossRef]
  16. Liang, T.; Du, P.; Yang, F.; Su, Y.; Luo, Y.; Wu, Y.; Wen, C. Potential land-use conflicts in the urban center of Chongqing based on the “production–living–ecological space” perspective. Land 2022, 11, 1415. [Google Scholar] [CrossRef]
  17. Zhang, L.L.; Zheng, X.Q.; Meng, C.; Zhang, P.T. Space and temporal division of land multi-function coupling and coordination in Hunan Province. China Land Sci. 2019, 33, 85–94. [Google Scholar]
  18. Bernues, A.; Rodríguez-Ortega, T.; Alfnes, F.; Clemetsen, M.; Eik, L.O. Quantifying the multifunctionality of fjord and mountain agriculture by means of sociocultural and economic valuation of ecosystem services. Land Use Policy 2015, 48, 170–178. [Google Scholar] [CrossRef]
  19. Chen, L.D.; Sun, R.H.; Liu, H.L. Progress on the evolution of urban landscape pattern. J. Ecol. 2013, 33, 1042–1050. [Google Scholar]
  20. Yang, Q.Y.; Luo, K.; Lao, X. Evolution and enlightenment of foreign spatial planning: Exploration from the perspective of geography. Acta Geogr. Sin. 2020, 75, 1223. [Google Scholar]
  21. Liu, Y.S.; Fang, F.; Li, Y.H. Key issues of land use in China and implications for policy making. Land Use Policy 2014, 40, 6–12. [Google Scholar] [CrossRef]
  22. Lu, D.; Wang, Y.; Yang, Q.; Su, K.; Zhang, H.; Li, Y. Modeling spatiotemporal population changes by integrating DMSP-OLS and NPP-VIIRS nighttime light data in Chongqing, China. Remote Sens. 2021, 13, 284. [Google Scholar] [CrossRef]
  23. Chen, B.; Wu, C.; Huang, X.; Yang, X. Examining the relationship between urban land expansion and economic linkage using coupling analysis: A case study of the Yangtze River Economic Belt, China. Sustainability 2020, 12, 1227. [Google Scholar] [CrossRef] [Green Version]
  24. Chen, H.; Yang, Q.; Su, K.; Zhang, H.; Lu, D.; Xiang, H.; Zhou, L. Identification and optimization of production-living- ecological space in an ecological foundation area in the upper reaches of the Yangtze River: A case study of Jiangjin district of Chongqing, China. Land 2021, 10, 863. [Google Scholar] [CrossRef]
  25. Zou, L.L.; Liu, Y.S.; Wang, J.Y.; Yang, Y.Y. An analysis of land use conflict potentials based on ecological-production-living function in the southeast coastal area of China. Ecol. Indic. 2021, 122, 107297. [Google Scholar] [CrossRef]
  26. Dullinger, I.; Essl, F.; Moser, D.; Erb, K.; Haberl, H.; Dullinger, S. Biodiversity models need to represent land-use intensity more comprehensively. Glob. Ecol. Biogeogr. 2021, 30, 924–932. [Google Scholar] [CrossRef]
  27. Gkargkavouzi, A.; Halkos, G.; Matsiori, S. A multi-dimensional measure of environmental behavior: Exploring the predictive power of connectedness to nature, ecological worldview and environmental concern. Soc. Indicat. Res. 2019, 143, 859–879. [Google Scholar] [CrossRef] [Green Version]
  28. Duan, Y.M.; Wang, H.; Huang, A.; Xu, Y.Q.; Lu, L.H.; Ji, Z.X. Identification and spatial-temporal evolution of rural “production-living-ecological” space from the perspective of villagers’ behavior–A case study of Ertai Town, Zhangjiakou City. Land Use Policy 2021, 106, 105457. [Google Scholar] [CrossRef]
  29. Huang, J.C.; Lin, H.X.; Qi, X.X. A literature review on optimization of spatial development pattern based on ecological- production-living space. Prog. Geogr. 2017, 36, 378–391. [Google Scholar]
  30. Liang, T.; Yang, F.; Huang, D.; Luo, Y.; Wu, Y.; Wen, C. Land-Use Transformation and Landscape Ecological Risk Assessment in the Three Gorges Reservoir Region Based on the “Production–Living–Ecological Space” Perspective. Land 2022, 11, 1234. [Google Scholar] [CrossRef]
  31. Gao, X.; Liu, Z.W.; Li, C.X.; Cha, L.S.; Song, Z.Y.; Zhang, X.R. Land use function transformation in the Xiong’an New Area based on ecological-production-living spaces and associated eco-environment effects. Acta Ecol. Sin. 2020, 40, 7113–7122. [Google Scholar]
  32. Wang, C.; Tang, N. Spatio-temporal characteristics and evolution of rural production-living-ecological space function coupling coordination in Chongqing Municipality. Geogr. Res. 2018, 37, 1100–1114. [Google Scholar]
  33. Zhang, Y.; Yang, Q.Y.; Min, J. An analysis of coupling between the bearing capacity of the ecological environment and the quality of new urbanization in Chongqing. Acta Geogr. Sin. 2016, 71, 817–828. [Google Scholar]
  34. Cheng, X.; Long, R.; Chen, H.; Li, Q. Coupling coordination degree and spatial dynamic evolution of a regional green competitiveness system-A case study from China. Ecol. Ind. 2019, 104, 489–500. [Google Scholar] [CrossRef]
  35. Li, W.; Yi, P. Assessment of city sustainability-Coupling coordinated development among economy, society and environment. J. Clean. Prod. 2020, 256, 120453. [Google Scholar] [CrossRef]
  36. Fan, J.; Li, P.X. The scientific foundation of major function oriented zoning in China. J. Geogr. Sci. 2009, 19, 515–531. [Google Scholar] [CrossRef]
  37. Xu, Y.; Sun, X.Y.; Tang, Q. Human activity intensity of land surface: Concept, method, and application in China. Acta Geogr. Sin. 2015, 70, 1068–1079. [Google Scholar] [CrossRef]
  38. Schönbrodt-Stitt, S.; Behrens, T.; Schmidt, K.; Shi, X. Thomas Scholten. Degradation of cultivated bench terraces in the Three Gorges Area: Field mapping and data mining. Ecol. Indic. 2013, 34, 478–493. [Google Scholar] [CrossRef]
  39. Wei, L.; Zhang, Y.; Wang, L.; Mi, X.; Wu, X.; Cheng, Z. Spatiotemporal Evolution Patterns of “Production- Living-Ecological” Spaces and the Coordination Level and Optimization of the Functions in Jilin Province. Sustainability 2021, 13, 13192. [Google Scholar] [CrossRef]
  40. Wang, M.; Qin, K.; Jia, Y.; Yuan, X.; Yang, S. Land Use Transition and Eco-Environmental Effects in Karst Mountain Area Based on Production-Living-Ecological Space: A Case Study of Longlin Multinational Autonomous County, Southwest China. Int. J. Environ. Res. Public Health 2022, 19, 7587. [Google Scholar] [CrossRef]
  41. Zhao, Y.; Hou, P.; Jiang, J.; Zhai, J.; Chen, Y.; Wang, Y.; Bai, J.; Zhang, B.; Xu, H. Coordination Study on Ecological and Economic Coupling of the Yellow River Basin. Int. J. Environ. Res. Public Health 2021, 18, 10664. [Google Scholar] [CrossRef]
  42. Liao, G.; He, P.; Gao, X.; Deng, L.; Zhang, H.; Feng, N.; Zhou, W.; Deng, O. The Production–Living–Ecological Land Classification System and Its Characteristics in the Hilly Area of Sichuan Province, Southwest China Based on Identification of the Main Functions. Sustainability 2019, 11, 1600. [Google Scholar] [CrossRef]
  43. Li, Q.Y.; Fang, C.L.; Wang, S.J. Quality evaluation of provincial territorial space utilization in China: Based on the spatial perspective of “production-living-ecological”. Reg. Res. Dev. 2016, 35, 163–169. [Google Scholar]
  44. Han, M.; Zhang, C.; Lu, G.; Liu, Y.B.; Yu, H.Z. Response of wetland landscape pattern gradient to human activity intensity in Yellow River Delta. Trans. CSAE 2017, 33, 265–274. [Google Scholar]
  45. Sun, Y.S.; Tong, L.J. Spatio-temporal coupling relationship between development strength and eco-environment in the Restricted Development Zone of Northeast China. Sci. Geogr. Sin. 2021, 41, 684–694. [Google Scholar]
  46. Wang, C.; Ji, M.Z.; Dai, R.L.; Chen, J.; Shen, Y. Coupling and coordination pattern and type division of village and town construction land expansion and ecological environment effect: A case study of Rongchang District, Chongqing Municipality. Prog. Geogr. 2022, 41, 409–422. [Google Scholar]
  47. Huang, M.Q.; Li, Y.B.; Li, Y.B.; Li, M.Z.; Chen, S.; Zeng, C.C.; Zhang, B.; Xia, C.H. Coupling respinse of human activity intensity and ladscape pattern in the Three Gorges Reservoir Area. Acta Ecol. Sin. 2022, 42, 3959–3973. [Google Scholar]
Figure 1. The primary steps of the technical solution.
Land 11 01897 g001
Figure 2. Administrative division of Wanzhou District.
Land 11 01897 g002
Figure 3. Spatial–temporal evolution of the PF(A), LF(B), and EF(C) from 2000 to 2020.
Land 11 01897 g003
Figure 4. Coupling degree of the PLEFs in 2000 (a), 2010 (b), and 2020 (c).
Land 11 01897 g004
Figure 5. Coupling degree of PLF (A), PEF (B), and LEF (C).
Land 11 01897 g005
Figure 6. Coupling coordination degree of the PLEFs in 2000 (a), 2010 (b), and 2020 (c).
Land 11 01897 g006
Figure 7. Coupling coordination degree of PLE (A), PEF (B), and LEF (C).
Land 11 01897 g007
Figure 8. Degree of human activity intensity in 2000 (a), 2010 (b), and 2020 (c).
Land 11 01897 g008
Figure 9. The development type of the PLEF coupling coordination degree and HAI in 2000 (a), 2010 (b), and 2020 (c).
Land 11 01897 g009
Table 1. Index system of PLEFs.
The PLES TypesSecondary CategoriesLand-Use TypeFunction Score
Production landStrong production landIndustrial and mining construction land5
Semi-production landPaddy fields, dry land, urban land, and rural settlements3
Weak production landWoodland, grassland, rivers,
reservoir ponds, and wetlands
1
Living landStrong living landUrban land and rural settlements5
Semi-living landIndustrial and mining construction land3
Weak living landPaddy fields, dry land, rivers,
reservoir ponds, and wetlands
1
Ecological landStrong ecological landWoodland, grassland, rivers, and wetlands5
Semi-ecological landPaddy fields and dry land3
Weak ecological landReservoirs and ponds1
Table 2. Stage division of the coupling degree of PLEF.
Coupling DegreeSpecific StageCharacteristic
C ∈ [0, 0.2]Low coupling periodThe game within the PLEFs began to be played, which were in a low-level coupling period. When C = 0, the PLEFs are unrelated and develop into disorder.
C ∈ [0.2, 0.5]Antagonism periodThe interaction between the PLEFs is strengthened. The phenomenon is that the dominant function becomes stronger and occupies the space of other parts, while other parts continue to weaken.
C ∈ [0.5, 0.8)Run-in periodPLEF begins to balance and cooperate, showing a benign coupling feature.
C ∈ [0.8, 1)Coordinated coupling periodThe benign coupling between the PLEFs is stronger and gradually develops in an orderly direction during the period of high-level coordination coupling. When C = 1.0, the PLEFs achieve benign resonance coupling and tend toward a new orderly structure.
Table 3. Stage division of the CCD of the PLEFs.
Coupling Coordination DegreeSpecific StageCharacteristic
D ∈ [0, 0.15)Dysregulation recessionPLEFs conflict with each other and are in the low level of coupling and coordination stage.
D ∈ [0.15, 0.35)Barely coordinatedPLEFs check and balance each other and cooperate, and enter the transitional stage of coupling, coordination, or conflict.
D ∈ [0.35, 0.5]Good coordinationCoordinated development of the PLEFs with a high level of coupling and coordination stage
Table 4. Equivalent conversion coefficient of construction land for different land-use types.
Land-use TypesCultivated LandWoodlandGrasslandWater AreaUrban and Rural Industrial and Mining Areas and Residential LandUnused Land
CIij0.200.130.100.601.000.00
Table 5. Human activity intensity at different times.
Level of HAIStandards (%)Area Ratio
200020102020
Lowest<80.61%0.59%0.58%
Lower8–1538.49%38.29%38.03%
Medium15–1927.62%27.61%27.46%
Higher19–3830.12%29.29%28.46%
Highest>383.16%4.22%5.47%
Table 6. Preliminary results of the development types in Wanzhou District in 2000, 2010, and 2020.
Development TypesSpecific TypesArea Ratio (%)
200020102020Variation
Negative typeI: Dysregulation recession—Advanced development13.8415.6517.443.6
II: Barely coordinated—Advanced development0.630.620.810.18
III: Good coordination—Advanced development0.750.871.230.48
Subtotal15.2217.1419.484.26
Synchronous typeIV: Dysregulation recession—Synchronous development2.261.980.45−1.81
V: Barely coordinated—Synchronous development1.531.781.680.15
VI: Good coordination—Synchronous development0.690.841.10.41
Subtotal4.484.63.23−1.25
Positive typeVII: Dysregulation recession—Lagging development000.010.01
VIII: Barely coordinated—Lagging development15.1314.5614.55−0.58
IX: Good coordination—Lagging development65.1763.7062.73−2.44
Subtotal80.378.2677.29−3.01
Publisher’s Note: MDPI stays neutral with regard to jurisdictional claims in published maps and institutional affiliations.

