Article

Changes in Ecosystem Service Value in the 1 km Lakeshore Zone of Poyang Lake from 1980 to 2020

1
State Key Laboratory of Hydraulic Engineering Simulation and Safety, School of Civil Engineering, Tianjin University, Tianjin 300072, China
2
State Key Laboratory of Simulation and Regulation of Water Cycle in River Basin, China Institute of Water Resources and Hydropower Research, Beijing 100044, China
3
Xinjiang Production and Construction Group Key Laboratory of Modern Water-Saving Irrigation, College of Water Conservancy & Architectural Engineering, Shihezi University, Shihezi 832000, China
4
School of Geography and Environment, Key Laboratory of Poyang Lake Wetland and Watershed Research, Ministry of Education, Jiangxi Normal University, 99 Ziyang Road, Nanchang 330022, China
*
Author to whom correspondence should be addressed.
These authors contributed equally to this work and should be considered co-first authors.
Land 2021, 10(9), 951; https://doi.org/10.3390/land10090951
Submission received: 5 August 2021 / Revised: 3 September 2021 / Accepted: 4 September 2021 / Published: 8 September 2021
(This article belongs to the Special Issue Celebrating 25 Years of World Wetlands Day)

Abstract

:
Poyang Lake is a typical lake in the middle and lower reaches of the Yangtze River and is the largest freshwater lake in China. The habitat quality of Poyang Lake has been declining in recent years, leading to a series of ecological problems. An ecological risk evaluation, based on land use, is important in order to promote a coordinated development of land use and the ecological environment. In this paper, land use data from the Poyang Lake basin in the corresponding years are interpreted based on the images from the Landsat satellite mission in seven periods from 1980 to 2020. The lake surface and the 1 km lakeshore zone of Poyang Lake are extracted based on the interpreted land use data. Finally, the ecological service value per unit area of the area is measured by combining it with the Chinese terrestrial ecosystem service value equivalent table, and then with the value of each ecological factor and the value of the changes to land use type. The research results show that: (1) from 1980 to 2000, the lake area of Poyang Lake had an overall decreasing trend (the area slightly increased from 1980 to 1990); from 2000 to 2020, the lake area of Poyang Lake gradually increased (the area slightly decreased from 2015 to 2020). (2) The farmland, forest, grassland and desert areas gradually increased and the wetlands gradually decreased over 40 years; the area of the water body gradually increased from 1980 to 2010, and gradually decreased from 2010 to 2020. (3) The ecosystem service value of the lakeshore zone of Poyang Lake fluctuated around 15,000 × 106 Yuan from year to year.

1. Introduction

How to use land use/cover changes to understand changes in complex human–environment systems in an integrated manner—i.e., causes, consequences, and effects—is one of the focal issues in the land use discipline [1]. Many scholars are now beginning to focus on changes in land use landscape patterns from different perspectives and scales [2,3] and are trying to understand land use change and its ecological effects [4,5,6,7]. With the correction and refinement of the principles and methods of Ecosystem Service Value (ESV) estimation and the various ecosystem service values proposed by Costanza et al. [8], scholars in various countries have determined the appropriate ESVs for different study areas. Research on the value of ecosystem services has entered a period of rapid development [9]. At the same time, the United Nations Environment Programme (UNEP), the World Bank and other agencies launched the Millennium Ecosystem Assessment (MA) from 2001 to 2005. After the MA, the United Nations organized and implemented The Economics of Ecosystems and Biodiversity (TEEB) project (2007–2010), and the UNEP supported the establishment of the Intergovernmental Science-Policy in 2012. In 2012, the UNEP also supported the establishment of the Intergovernmental Science-Policy Platform on Biodiversity and Ecosystem Services (IPBES). Since then, ecosystems have gone through a rapid development phase and a diversified development phase before reaching the current integrated application phase [10]. In recent years, scholars have also started to use machine learning in order to construct ecosystem service frameworks [11].
Xie Gaodi et al. [12,13,14], among other scholars in China, completed a table of ecosystem service value equivalent factors in China, based on existing studies, to provide support for the study of the ecosystem value in China. On this basis, Chinese scholars tried to analyze the value of ecosystem service functions under different time frames and spaces. Chen Juncheng et al. [15] assessed the ecological service value of provincial administrative regions in China and analyzed the characteristics of changing spatial differences; Ma Guoxia et al. [16] studied the ecological damage loss in the Chinese ecosystem in 2015, and from that quantified the ecological loss caused by different factors. The study by Ma Guoxia et al. [16] quantified the ecological losses caused by different factors in 2015; Zhang Hao et al. [17] measured the value of arable land development rights and protection compensation based on this theory. Ecosystem services have a very significant impact on human life [18], and studying the value of ecosystem services helps to understand the process of change in ecosystem service functions, which has become a hotspot for ecosystem sustainability research in recent years.
The lakeshore zone is the area at the edge of the lake basin, which is adjacent to the surrounding land [19], and has the function of regulating water quality [20], water quantity [21], and groundwater recharge [22] of the lake. In addition, the lakeshore zone maintains the biodiversity of flora and fauna in the area [23,24] and is critical for food security in nearby subsistence agriculture areas [25,26]. The lakeshore of Poyang Lake influences wetlands maintenance and the biodiversity of Poyang Lake, but previous studies assumed that there was a fixed area of the lakeshore zone [27,28,29]. In contrast, the lake area of Poyang Lake has experienced large fluctuations caused by the implementation of different water policies in the last 40 years, and the extent of the corresponding lakeshore zone on the lake surface has changed accordingly [30]. In this paper, the distribution of the corresponding 1 km lakeshore zone is divided based on the changes to the lake area in different years from 1980 to 2020. While the remote sensing film of each year cannot fully reflect the overall situation of the lakeshore zone that year, we believe that the long time scale can reflect the inter-annual spatial variation of the lakeshore zone of Poyang Lake, which can provide some reference for the subsequent study of Poyang Lake and the lakeshore area.
The main research contributions of this paper are: (1) an interpretation of the land use data from Poyang Lake basin, based on remote sensing images from the Landsat series satellite from October to November from 1980 to 2020 over seven periods, and we conducted a change analysis of Poyang Lake and the lakeshore zone, based on the land use data from Poyang Lake over seven periods. (2) The area of Poyang Lake, the area of the lakeshore zone, and the land use type of the lakeshore zone from 1980 to 2020 are analyzed. (3) At the end of the article, the ecosystem service value table of the Poyang Lake basin is also calculated and the changes to the ESV of the riparian zone of Poyang Lake from 1980 to 2020 are evaluated.

2. Materials and Methods
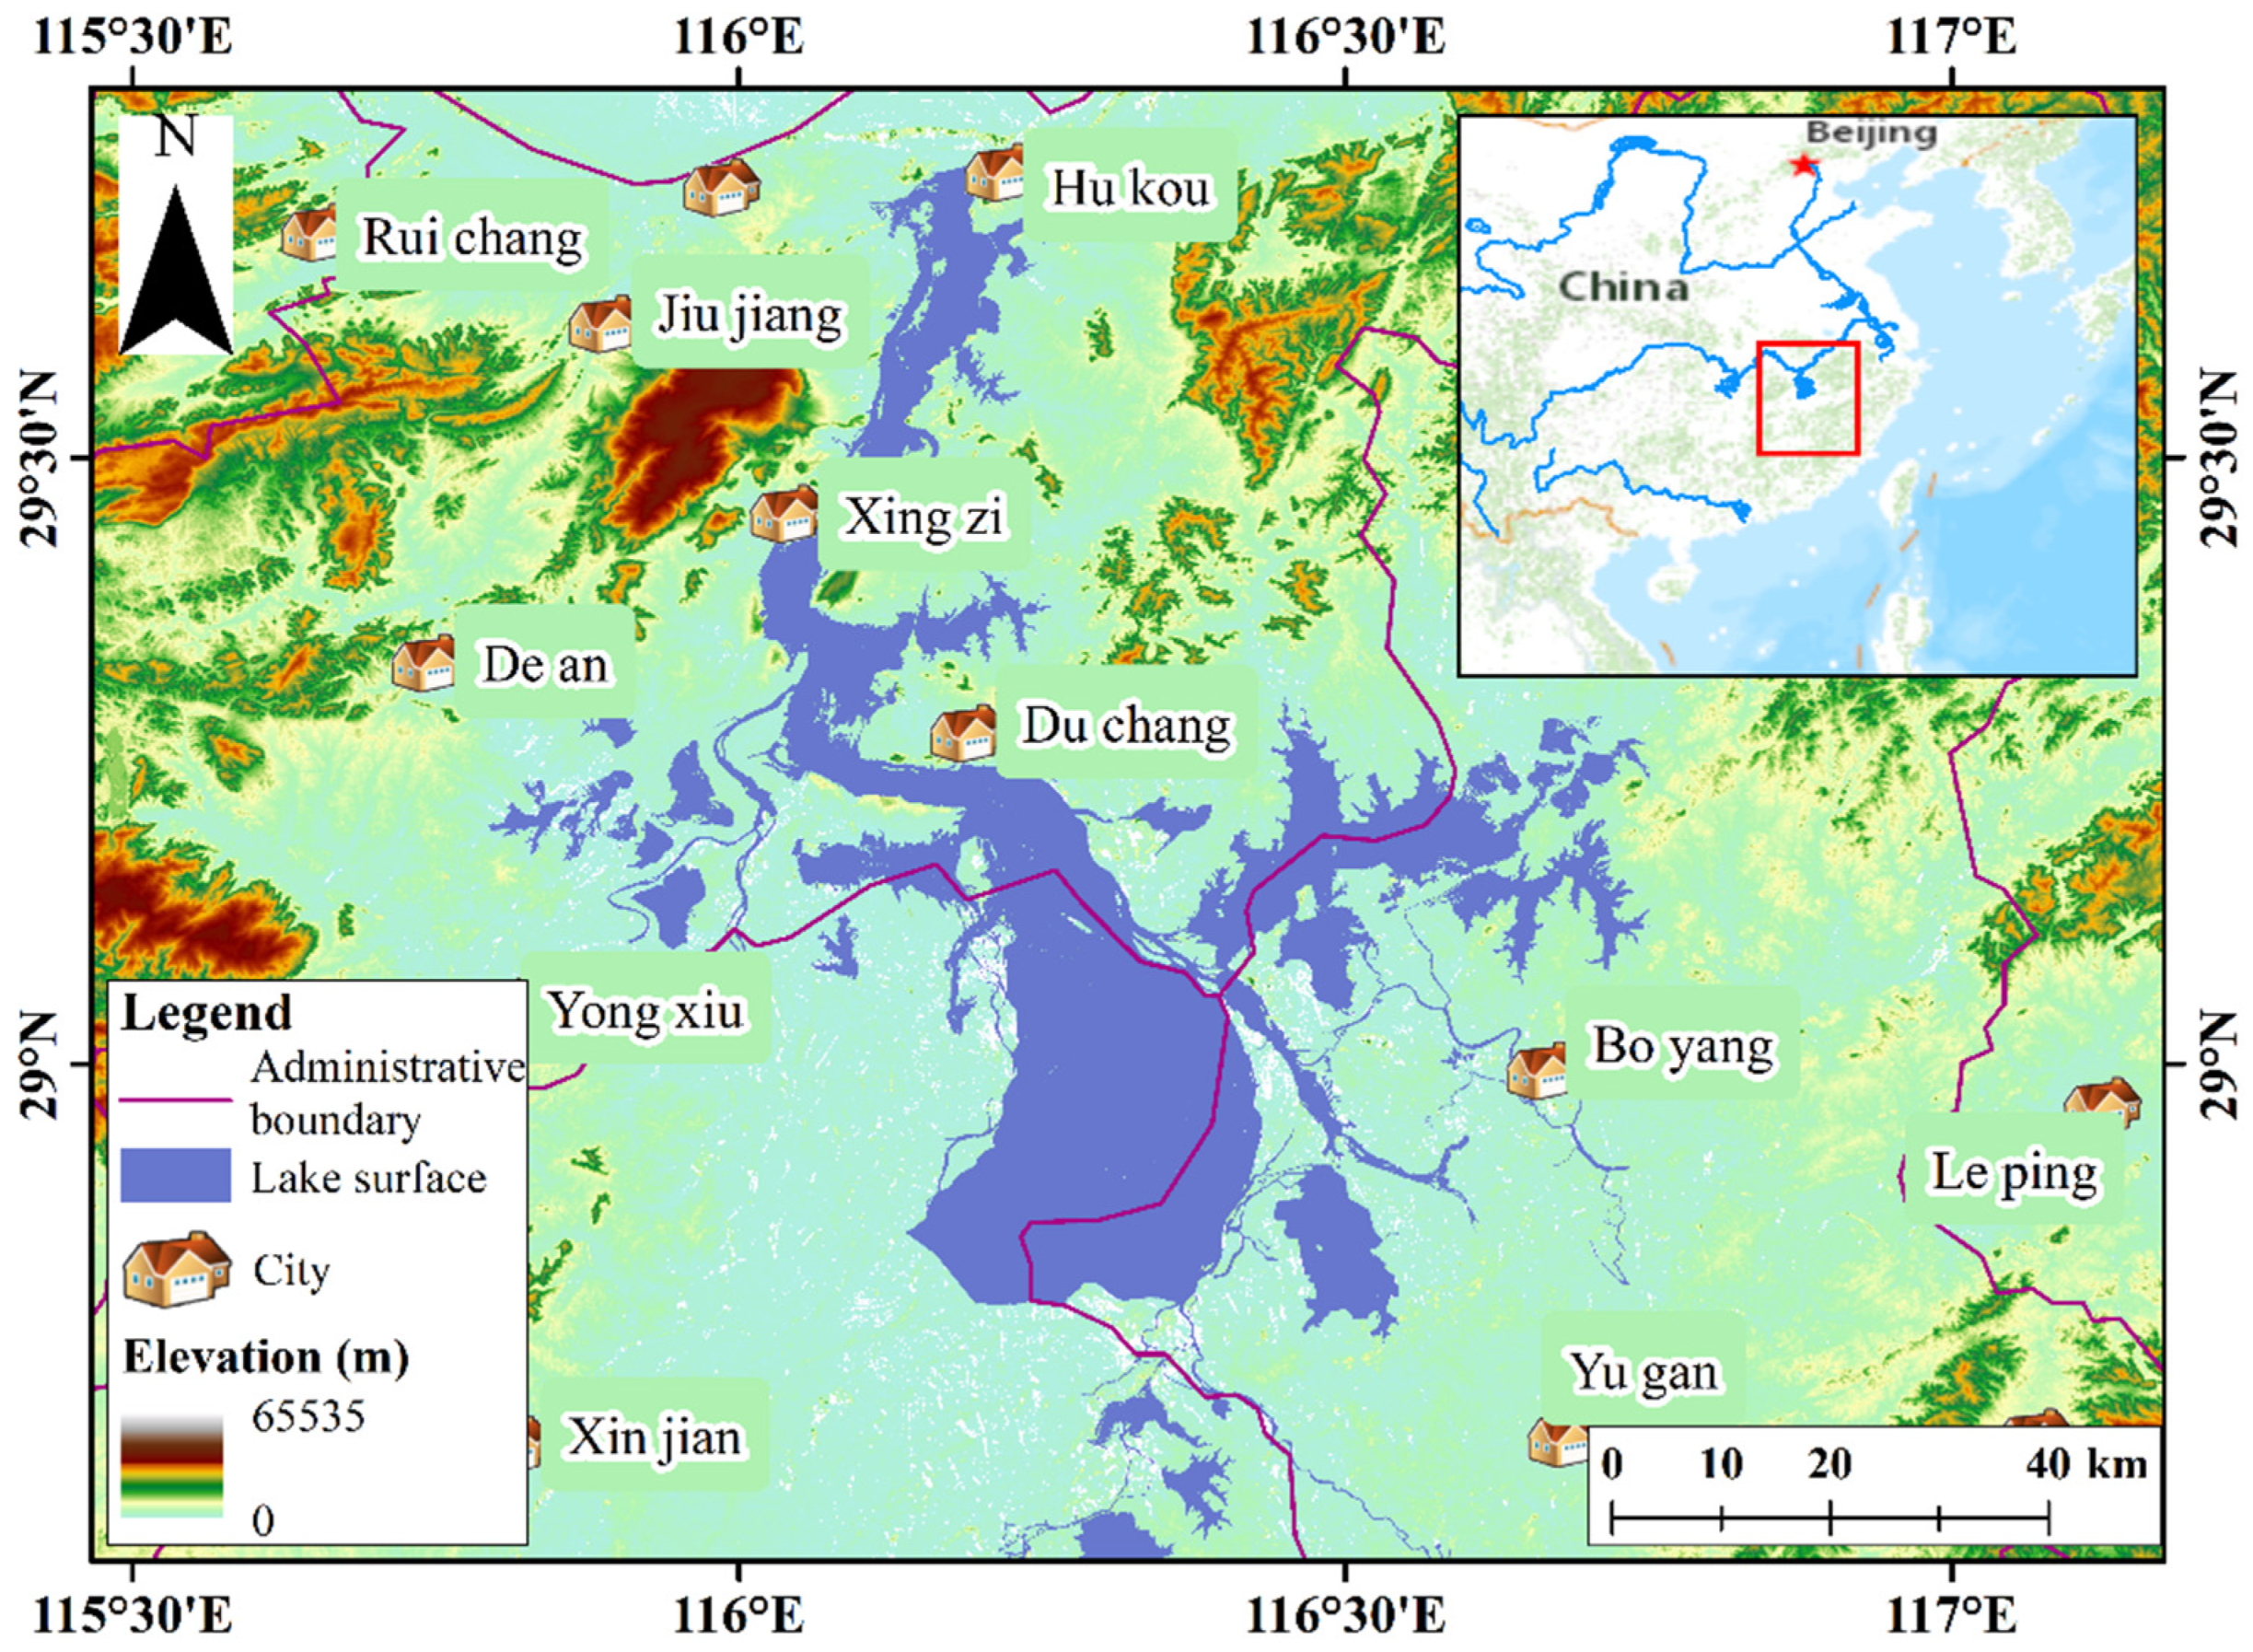
2.1. Study Site

Poyang Lake is located on the south bank of the Yangtze River, north of Jiangxi Province, in three prefecture-level cities of Jiujiang, Nanchang and Shangrao. The geographical range of the main lake body is 115°49′ E~116°46′ E, and 28°24′ N~29°46′ N, and is connected to the lower reaches of five major rivers, including Ganjiang River, Fu River, Xinjiang River, Rao River and Xiushui River (Figure 1). Poyang Lake is connected to the Yangtze River via its mouth under the lake, and is an overwater (exchange of nutrients in lake waters with different rivers) throughput type (water in the lake is fed by rivers and outflow) seasonal shallow freshwater lake, which has a water level change that is influenced twice as much by the five major rivers and the Yangtze River [31]. The groundwater flow direction in the lakeshore zone of Poyang Lake is mainly from the surrounding hilly area to the downstream lake area where the terrain is relatively flat, and the groundwater flows towards the river and lake area in general [32].
Poyang Lake and the adjacent area is a basin that is composed of different landform types, such as mountains, hills, plains and lakes. The elevation of the lake basin is generally high in the south and low in the north; the maximum elevation difference can be up to 13 m, and the average elevation difference between the south and north is about 6.5 m [33]. Taking Songmen Mountain between Duchang County and Wucheng Town of Yongxiu County as the boundary, Poyang Lake is divided into two lakes in the north and south; the southern part is wide and shallow, which is the main lake area; the northern part is narrow and deep, which is the waterway into the Yangtze River. The geomorphology of the lake is combined by a waterway, continental beach, island, inner lake and branching port. The waterway includes five rivers that lead into the lake and Poyang Lake leads into the river waterway. The distribution is strongly influenced by the water level. Due to the influence of human activities, most of the branches and harbors were turned into closed water bodies for aquaculture, or were transformed into paddy fields for rice cultivation.
The biodiversity and ecological conservation of the Yangtze River basin has been the priority area of the World Wide Fund for Nature or World Wildlife Fund, and the ecological wetlands of Poyang Lake were listed in the “List of Wetlands of International Importance” in 1992, which is the only representative of China to join the “World Network of Lakes for Life”. Poyang Lake is responsible for various ecological functions, such as flood control and water storage, climate regulation and pollution degradation. Poyang Lake is an important storage lake of the Yangtze River, and the annual average water volume into the river accounts for about 15.6% of the runoff of the Yangtze River. The sustainable stability of water quantity and quality of Poyang Lake is directly related to the water security of the surrounding area of Poyang Lake and even the middle and lower reaches of the Yangtze River.
Throughout history, China has seen several southward migrations of populations in the Central Plains, and a southward migration of the population lived nearby the water, The migration led to an increase in the population around Poyang Lake, and the seasonally submerged beach was reclaimed to a large extent, which is called “polder farming”. With the increase in population and demand for arable land, the activity of “paddock farming” around Poyang Lake was very active in the early 1970s; after the 1980s, people gradually realized the harm caused by excessive paddock farming in the Poyang Lake, and paddock farming was subsequently prohibited. However, due to the influence of the Yangtze River Three Gorges Storage Project, the low water level of Poyang Lake was persistently low, and since 2008, the climax of paddock farming, paddock city farming and paddock land farming in the areas along the lake began. The official approval of the “Poyang Lake Ecological Economic Zone Plan” by the State Council of China in December 2009 marks the point at which the construction of Poyang Lake Ecological Economic Zone was formally upgraded to a national strategy. The Poyang Lake Ecological Economic Zone is an economic development zone with Poyang Lake as the core, Poyang Lake City Cluster as the base, the low-carbon economic development pioneer area as the target, and ecological civilization and coordinated economic and social development as the strategic concept.

2.2. Data Source

We obtained Landsat-MSS, Landsat-TM/ETM, and Landsat-8 remote sensing data from the Geospatial Data Cloud Platform of the Computer Network Information Center of the Chinese Academy of Sciences (http://www.gscloud.cn/, accessed on 31 August 2021) for October–November 1980, 1990, 2000, 2005, 2010, 2015, and 2020 for the Poyang Lake basin. Among them, Landsat-MSS remote sensing image data were mainly used for the 1980 land use interpretation and Landsat-TM/ETM remote sensing image data were mainly used for the remote sensing interpretation of the 1990, 2000, 2005 and 2010 data periods, while Landsat8 remote sensing image data were used for the 2015 and 2020 land use data. All Landsat satellite mission remote sensing image data were filtered appropriately, based on cloudiness. Then, ENVI 4.5/ArcGIS 10.2 was used for the preliminary interpretation of remote sensing images, and land use classification was carried out using the secondary land use classification standard issued by the Chinese Academy of Sciences (Appendix A, Table A1). We used the computer supervised classification method, based on the maximum likelihood method, to classify land use in the Poyang Lake region. The advantages of the computer supervised classification method are higher classification accuracy, based on training samples, and faster speed, as compared to the traditional classification method, and finally, the seven-phases of the Poyang Lake Basin land use data could be obtained.
The DEM data used in this paper were obtained from the geospatial data cloud platform of the Computer Network Information Center of Chinese Academy of Sciences (http://www.gscloud.cn, accessed on 31 August 2021), which was processed from the data from ASTER GDEM version 1, which is a digital elevation data product with a global spatial resolution of 30 m.

2.3. Research Methodology

Costanza et al. [8,34] classified ecosystem services into 17 types, and in this paper, the 17 types of ecosystem services proposed by Costanza et al. [35] were reclassified into 11 types, based on the results obtained by Xie Gaodi et al. [35]. We reclassified the 17 categories of ecosystem services found by Costanza into 11 categories, with the following criteria (Appendix A, Table A2): (1) climate regulation includes climate regulation and disturbance regulation in the Costanza system; (2) soil conservation includes erosion control and sediment retention, and soil formation in the Costanza system; (3) biodiversity includes pollination, biological control, refugia, and genetic resources in the Costanza system; and (4) the aesthetic landscape includes recreation and culture in the Costanza system.
According to Costanza’s findings [8], the amount of economic value obtained from one ecological service value equivalent factor was 446.58 Yuan/hm2 (in 1997, the exchange rate between the US dollar and the Chinese yuan was 1:8.27); however, Xie Gaodi et al. [12,14,35] argued that the calculation of ecological service value equivalent per unit area of the Chinese ecosystems should set the ecological service value equivalent of farmland failure production as 1, and then the value of other ecological services provided by the ecosystem should be determined. The size of the other ecological services provided by the ecosystem was determined (Appendix A, Table A3). The calculation method of the ecosystem service value is as follows.
(1)
Firstly, the ecological service value per unit area of the secondary ecosystem in Poyang Lake basin is calculated as (Table 1):
P i j = 1 7 k · b · c · a i j
where P i j is the value of the ecosystem service of class i per unit area of the class j secondary land use type; i = 1, 2, … 11 represent different types of ecosystem service values of gas regulation, climate regulation, etc.; j = 1, 2, … 14 represent secondary land use types of dryland, paddy field, grassland, meadow, etc.; a i j represents class i ecosystem of the class j secondary land use type service equivalent factor [14]; b represents the unit area grain yield; c is the average grain purchase price in the region in that year; k is the correction coefficient of the equivalent factor; and 1 7 k · b · c is the corrected unit ecosystem value equivalent in the Poyang Lake basin.
(2)
Combine secondary land use types into primary land use types according to the specific research scale of this paper.
Since the land use classification standard used for remote sensing interpretation is the secondary land use classification standard issued by the Chinese Academy of Sciences (Appendix A, Table A1), this paper converts both classification standards into six primary land use types according to the table of ecological service values per unit area of the primary ecosystem in Poyang Lake Basin (Table 2) before analysis.
According to the geomorphological characteristics of the lakeshore zone of Poyang Lake [28], we combined the land use types of the lakeshore zone of Poyang Lake; the average value of dry land and grassland was taken as the ecological service value of the primary use type farmland; the ecological service value of the shrubs with the highest area share were taken as the ecological service value of the forest; the ecological service value of the meadow was taken as the ecological service value of the grassland; wetlands were kept unchanged; the ecological service value of bare land was taken as the ecological service value of the desert; the ecological service value of the water system was taken as the ecological service value of the watershed. Finally, the unit to calculate the ecosystem value service was converted to Yuan/km2, and the table of the ecological service value per unit area of the ecosystem in the Poyang Lake basin level after conversion is shown as follows (Table 2):
(3)
Calculate the value of the ecosystem services in the lakeshore zone.
E S V = m = 1 6 P m · A m
where m = 1, 2, … 6 represent the primary land use types, such as farmland, forest and grassland, respectively; P m represents the ecological service value of the m class primary land use types, and the conversion relationship between P m and P i j is shown in Table 2 ( P j = i = 1 11 P i j , and P j represents the ecological service value of the j class secondary land use types). We converted the secondary land use ecosystem service value ( P j ) into the primary land use ecosystem service value ( P m ), based on the situation of the lakeshore zone of Poyang Lake); A m is the area size of the m class land use types in the lakeshore zone, unit hm2; and ESV is the total ecological service value of the lakeshore zone (units are in Yuan).
Based on the results obtained in Xie Gaodi’s study [14,36], the economic value of 1 ecosystem value equivalent in China was determined to be 3406.50 Yuan/hm2, and this paper calculated the grain yield per unit area using the National Bureau of Statistics (http://www.stats.gov.cn/tjsj/zxfb/201512/t20151208_1286449.html, accessed on 31 August 2021), published by Jiangxi Province in 2015; the grain yield per unit area of cultivated land was 5798.6 kg/hm2, while the average grain yield per unit area of the cultivated land in China in the same period was 5482.9 kg/hm2, and the correction coefficient was calculated as 1.058, i.e., k = 1.058. Then, the value equivalent of one ecosystem in the Poyang Lake basin was determined to be 3604.08 Yuan/hm2. In this paper, the corresponding secondary ecosystem service value of Poyang Lake was calculated based on the corrected ecosystem service value equivalent and different land use areas of the corresponding lakeshore zones (Table 1 and Table 2).

3. Results

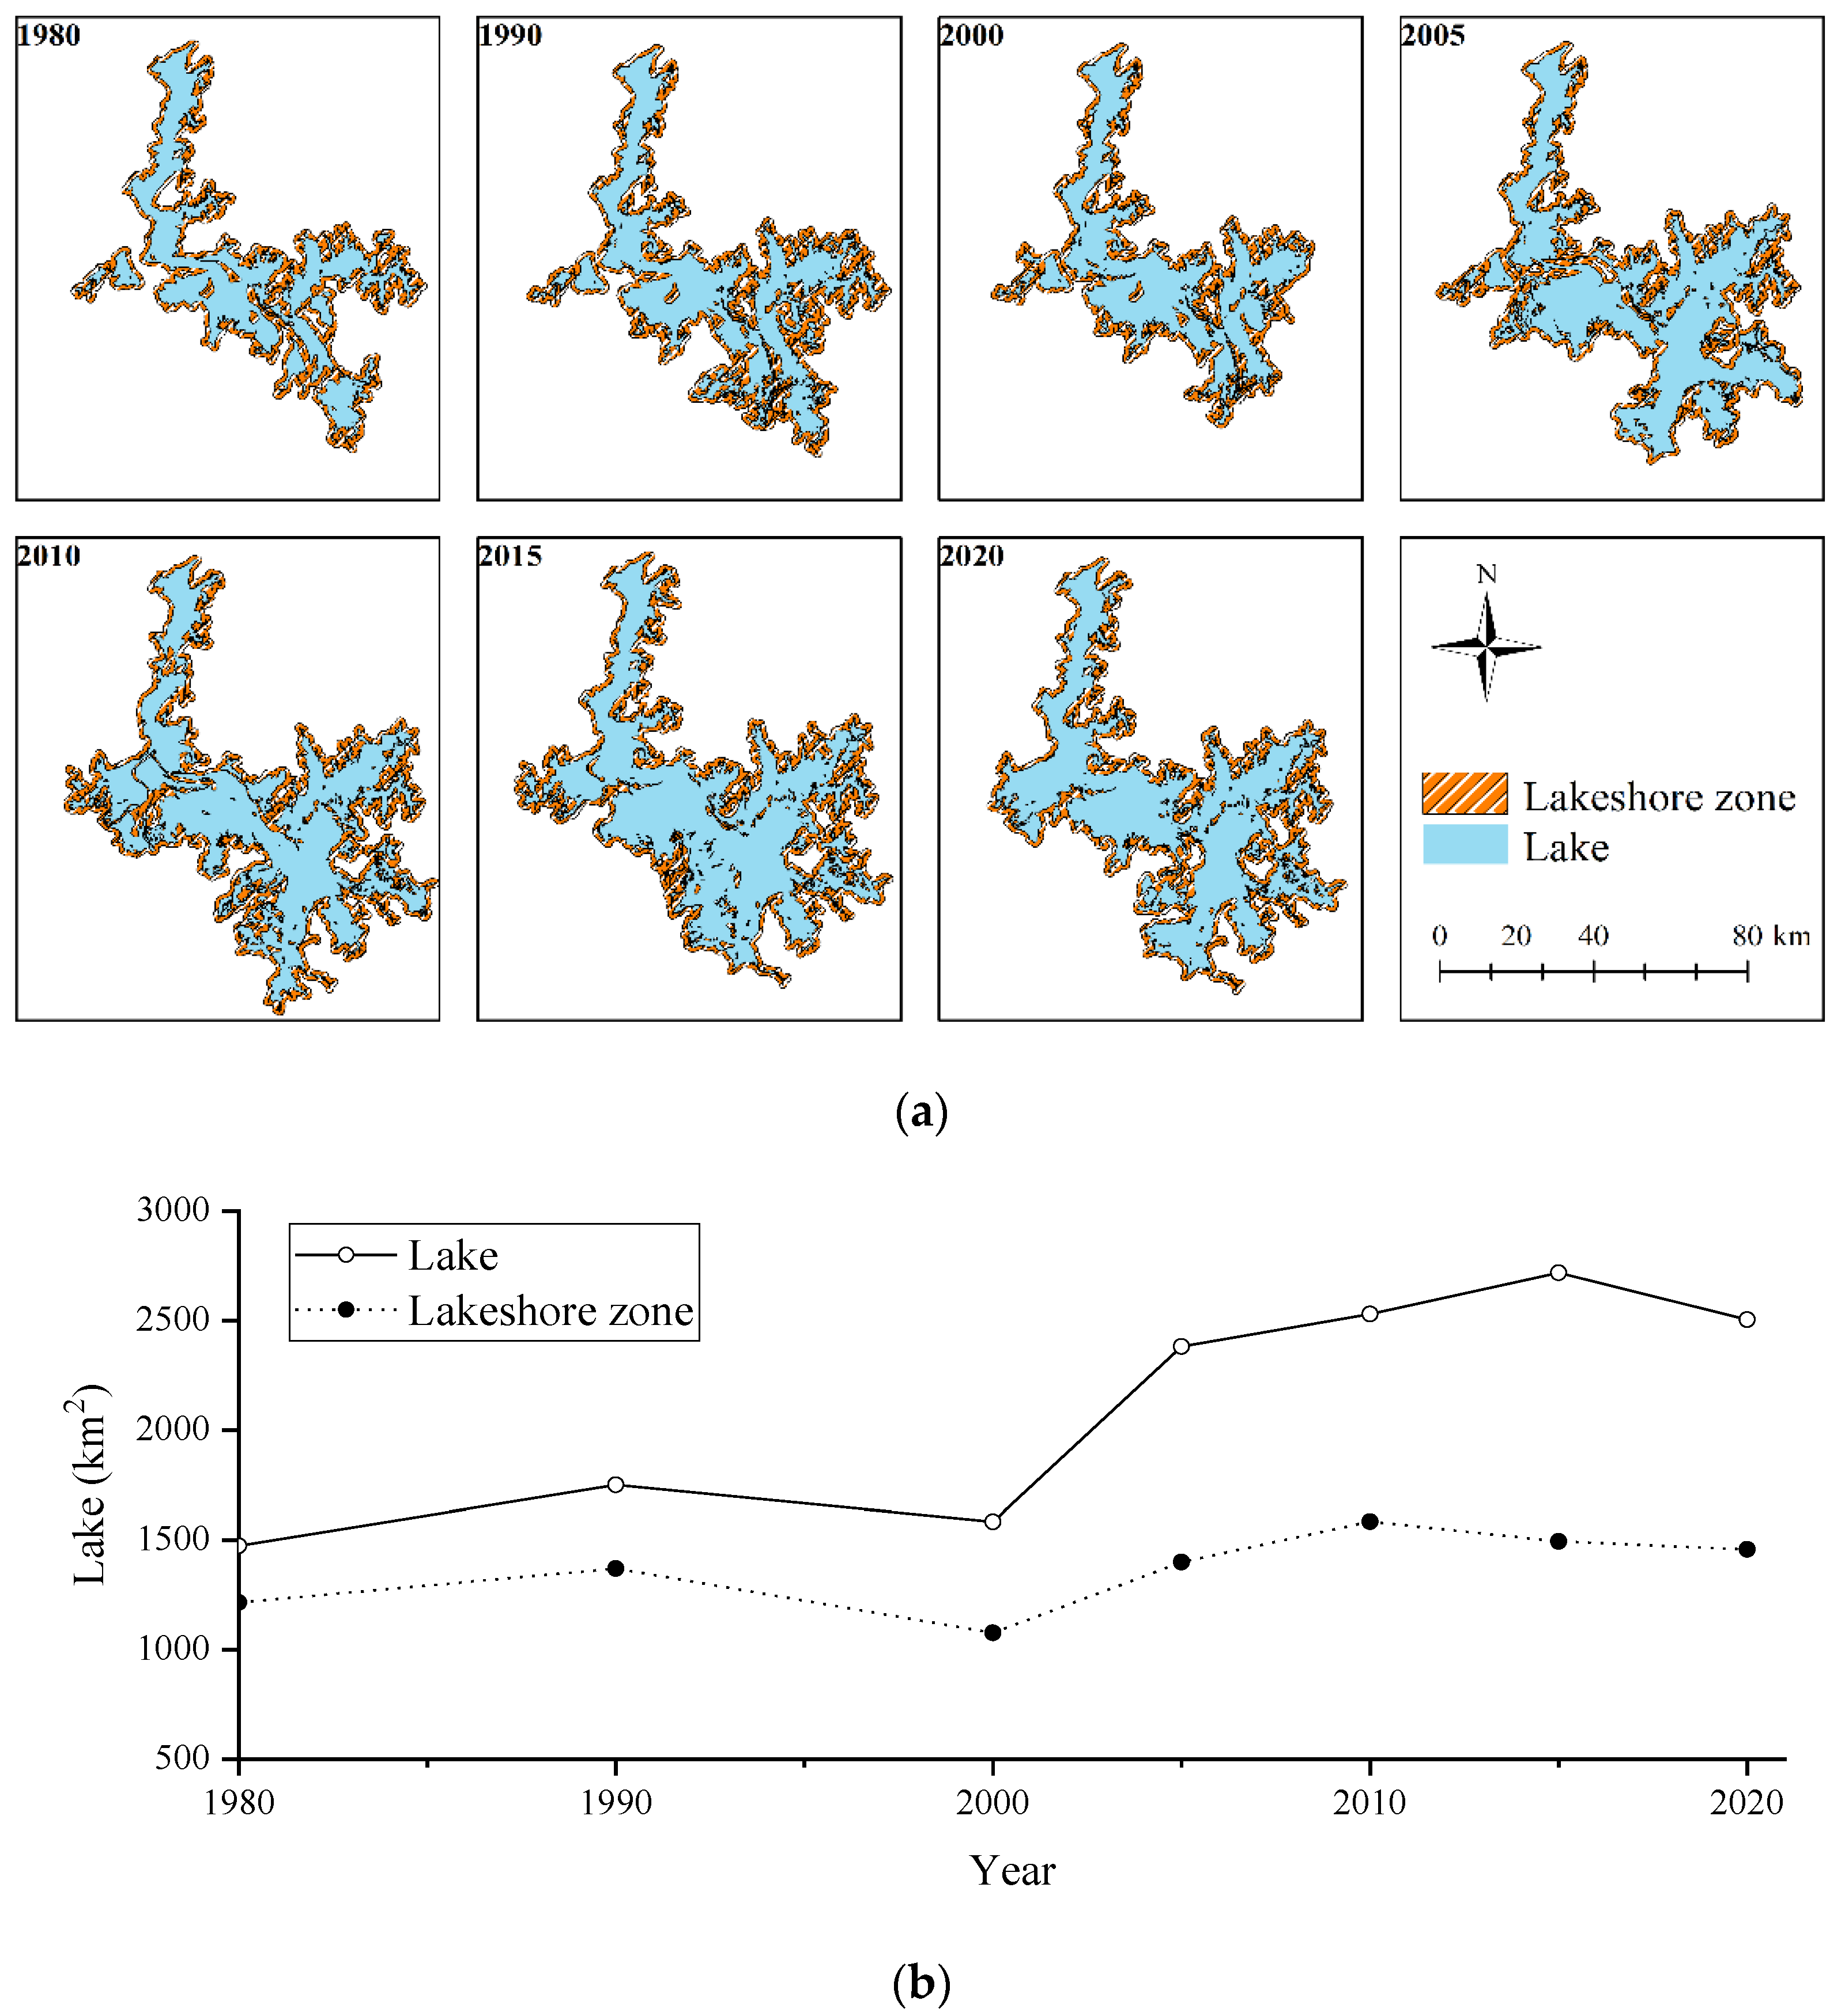
3.1. Spatial and Temporal Changes of Poyang Lake and Lakeshore Zone

According to the results from the remote sensing image interpretation, the lake area of Poyang Lake had a generally increasing trend from 1980 to 2020, the lake area decreased from 1990 to 2000, and the lake area decreased from 2015 to 2020. From Figure 2a, the lake area of Poyang Lake had an increasing trend, year-by-year, from 1980 to 2020. Due to the increase in the lake area, all the waters of the lake started to be connected, and the lake integrity of Poyang Lake was enhanced. It can be seen that the decrease in the lake level of Poyang Lake firstly leads to the degradation of the lake surface in the southwest area of Poyang Lake, which is the most significant area, and this reflects the changes to the lake area of Poyang Lake. The lake area increased by 109.96 km2 from 1980 to 2000, which was an increase in the lake area by 7.46% in 20 years. The lake area increased by 920.74 km2 from 2000 to 2020, which was an increase in the lake area by 58.13% in 20 years. The total lake area increased by 1030.43 km2 in 40 years, and the lake area obviously increased (Figure 2).
According to the results from the remote sensing interpretation, the area of the 1 km range lakeshore zone of the lake in 1980 was 1215.38 km2, the area of the 1 km range lakeshore zone of the lake in 1990 was 1370.22 km2, the area of the 1 km range lakeshore zone of the lake in 2000 was 1076.20 km2, and the area of the 1 km range lakeshore zone of the lake in 2005 was 1399.76 km2. The area of the 1 km extent lakeshore zone in 2010 was 1584.66 km2, the area of the 1 km extent lakeshore zone in 2015 was 1494.19 km2, and the area of the 1 km extent lakeshore zone in 2020 was 1457.13 km2. The area of the lakeshore zone decreased by 139.18 km2 between 1980 and 2000, a decrease by −11.45%.
The area change of Poyang Lake and the area change of the 1 km lakeshore zone of the lake were highly consistent; both reached the lowest value in 2000 and then started to increase. Over 40 years, the average change rate of the lake area was 25.76 km2/year, and the average change rate of the 1 km lakeshore zone of the lake was 6.04 km2/year.

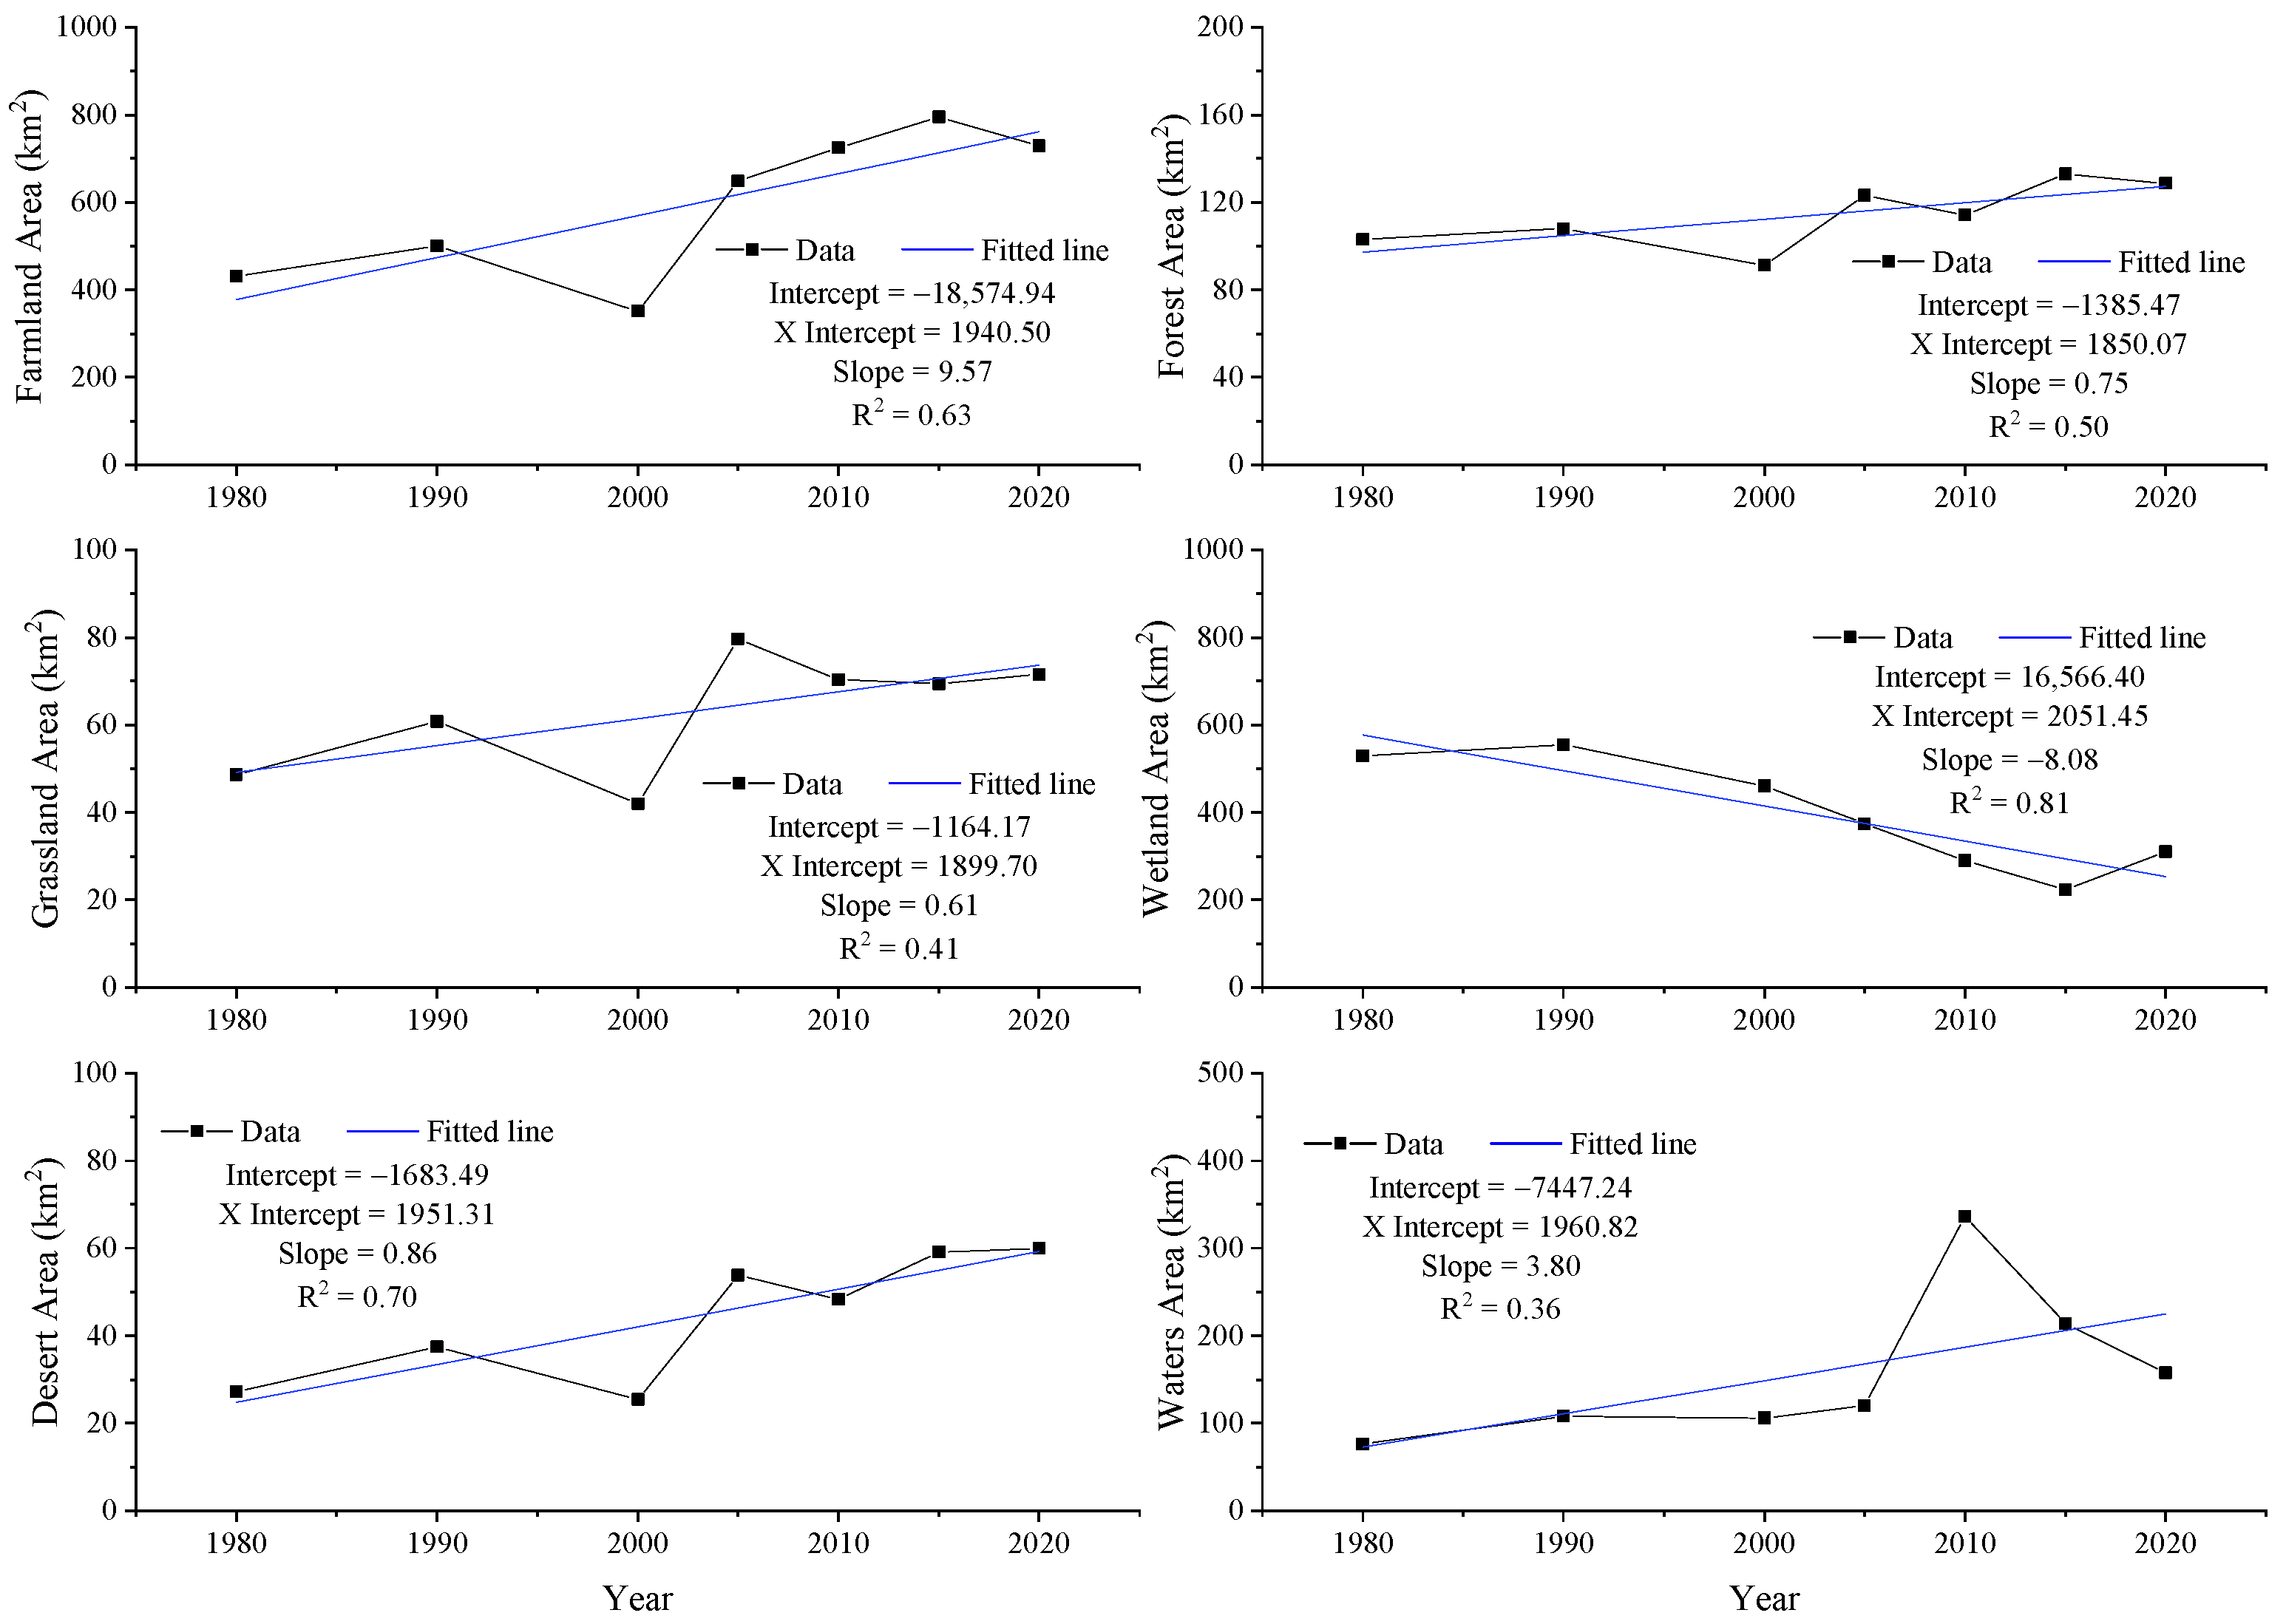
3.2. Changes of Various Land Use Types in the Lakeshore Zone of Poyang Lake

The area of each land use type at the first level of the lakeshore zone of Poyang Lake from 1980 to 2020 was analyzed by counting the area of each land use type at the first level of the lakeshore zone of Poyang Lake from 1980 to 2020; the area of each land use type at the first level of the lakeshore zone of Poyang Lake from 1980 to 2020 shows an increasing trend from 1980 to 1990, and a decreasing trend from 1990 to 2000 (Table 3). From 2000 to 2015, the area of farmland and forest shows a continuously increasing trend, the area of grassland and wetlands show a decreasing trend, the area of desert shows a decreasing and then increasing trend, and the area of water shows an increasing and then decreasing trend. From 2015 to 2020, the area of farmland, forest and water shows a decreasing trend, and the area of grassland, wetlands and desert shows an increasing trend; over 40 years, except the area of wetland, which decreased, the area of all other types increased (Figure 3). The area of all types of land use increased during the 40-year period, except for the area of wetlands. The area changes and trends of each land use type were analyzed using a linear fit, as shown in Figure 3. The proportion of various types of land uses in the lakeshore zone of Poyang Lake remained the same in 2000, but its area was greatly reduced compared to other years. This is due to the fact that the lake area of Poyang Lake shrank to a minimum in 2000, resulting in the lowest area of the Poyang Lake riparian zone in history.
The farmland area generally showed an increasing trend from 1980 to 2020: the lowest value of 351.16 km2 was reached in 2000 and the highest value of 794.51 km2 was reached in 2015. Through linear fitting, it was found that the farmland area in the lakeshore zone increased at a rate of 9.57/year over 40 years. It is worth noting that the area of farmland in the lakeshore zone was 728.49 km2 in 2020, which is a decrease of 66.02 km2, indicating a decreasing trend in the area of farmland. The forest area generally showed an increasing trend between 1980 and 2020; the lowest value of 91.13 km2 was reached in 2000 and the highest value of 132.90 km2 was reached in 2015. Through linear fitting, it was found that the forest area in the lakeshore zone increased at a rate of 0.75/year over the 40-year period, an insignificant increase. It is noteworthy that the forest area in the lakeshore zone shows a small fluctuation between 2005 and 2020, indicating that its area tends to be stable. The grassland area generally shows an increasing trend between 1980 and 2020; the lowest value of 42.02 km2 was in 2000 and the highest value of 79.63 km2 was in 2015. There is a high similarity between the area of grassland and agricultural land during the 40-year period. From 1980 to 2020, the wetlands area showed a generally decreasing trend; the lowest value of 224.26 km2 was in 2015 and the highest value of 555.66 km2 was in 1990. The area of wetlands in the lakeshore zone declined at an average rate of 8.08/year over the 40-year period, and the area of wetlands rebounded in 2020, as compared to that in 2015. The water area showed an overall increasing trend between 1980 and 2020; the lowest value of 75.97 km2 was in 1980 and the highest value of 336.34 km2 was in 2010. The linear fit shows that the water area in the lakeshore zone increased at an average rate of 0.86/year over 40 years. The average rate of increase in the water area in the lakeshore zone was 3.80/year over the 40 years.

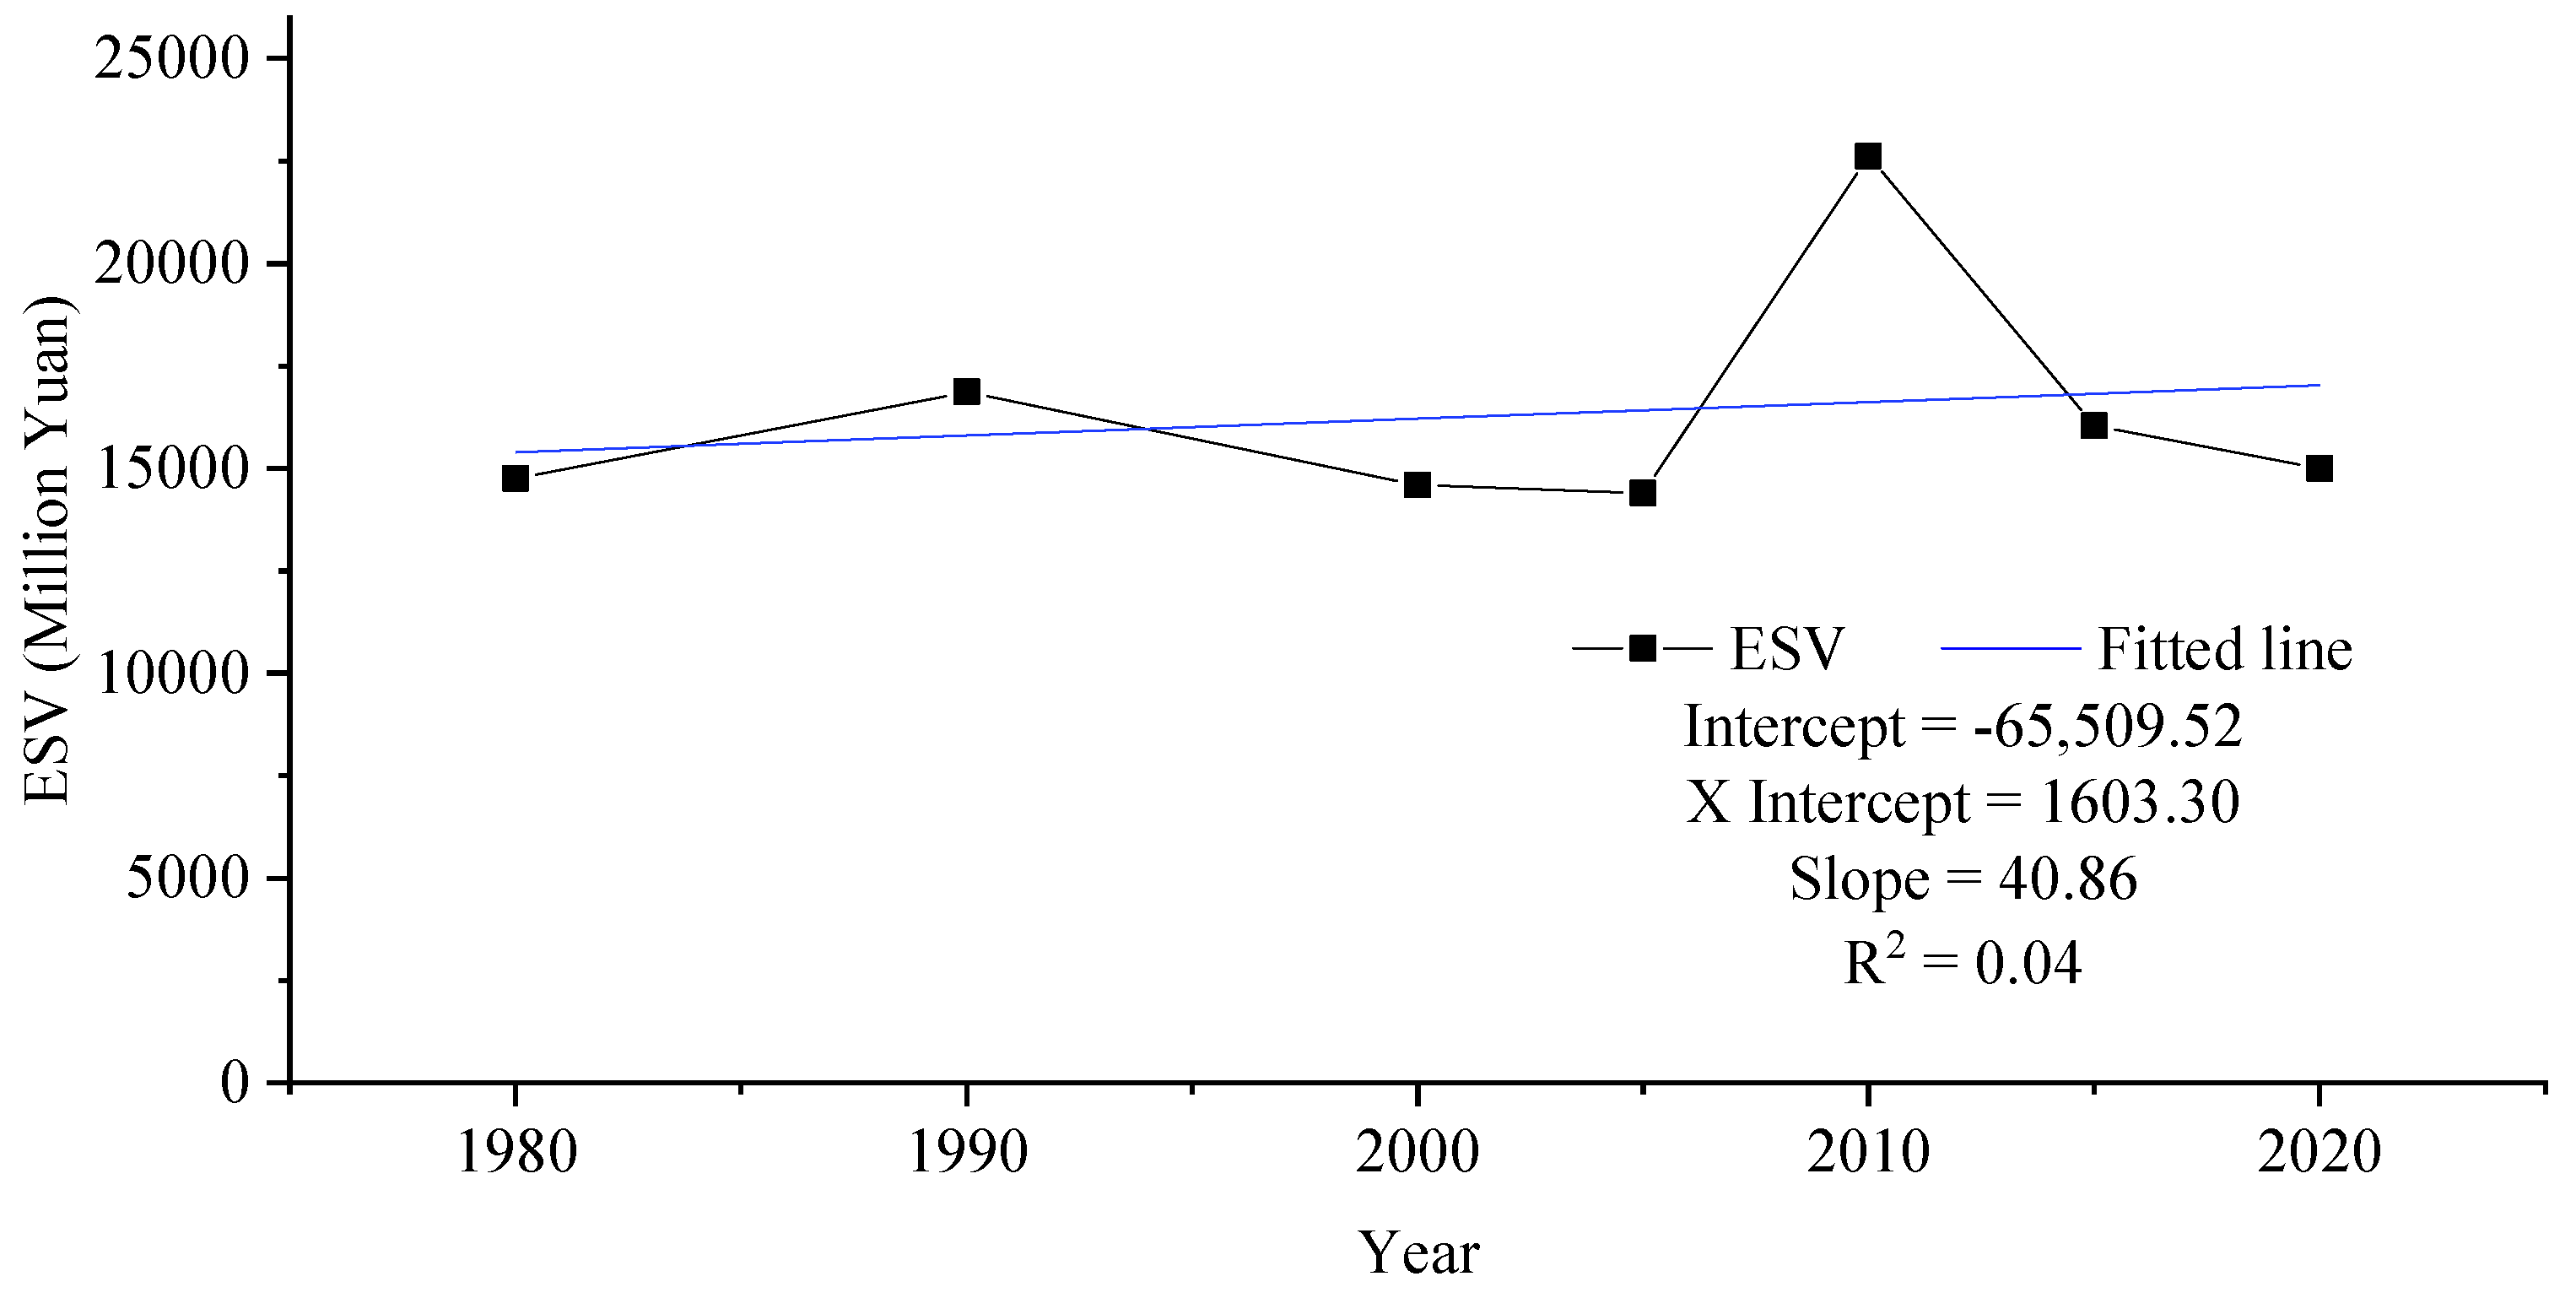
3.3. Changes of Ecosystem Service Value in the Lakeshore Zone of Poyang Lake

Based on the area of each primary land use type in the lakeshore zone from 1980 to 2020 (Table 4), combined with Table 2, changes in the value of various ecosystem services were calculated, as shown in the following table (Table 4).
From 1980 to 2020, the ecosystem value service of the lakeshore zone of Poyang Lake showed an increasing trend from 1980 to 1990, and a decreasing trend from 1990 to 2000. From 2000 to 2010, the ecosystem value service of farmland, forest and water areas showed a continuously increasing trend, the ecosystem value service of grassland and desert showed an increasing trend first and then a decreasing trend, and the ecosystem value service of wetlands showed a decreasing trend. During the period 2015–2020, the ecosystem value services of farmland, forest and watershed showed a decreasing trend, and grassland, wetlands and desert showed an increasing trend; during the 40-year period, except for the decrease in ecosystem value services of wetland, all other types of ecosystem value services increased. The trend of the total ecosystem value services is shown in Figure 4.
The overall trend of the ecosystem service value (ESV) of the lakeshore zone of Poyang Lake shows an increasing trend, but the increasing trend is not obvious. Among them, the ESV in 2010 is the highest in the lakeshore zone of Poyang Lake, reaching 22,631.24 × 106 Yuan, which may be related to the fact that the water area in the lakeshore zone of Poyang Lake in 2010 was the largest from 1980 to 2020 (the water area contributes a significant part of the ESV). The ESV in the lakeshore zone of Poyang Lake decreased slightly from 2015 to 2020.

4. Discussion

Human activities and changes in natural conditions directly cause changes in land use land cover, which in turn affects the changes in the ecological environment [2,37,38]. With the development of “enclosing the lake and making fields” of Poyang Lake, the wetlands area is reduced, vegetation is destroyed, soil erosion is serious, and biodiversity is seriously threatened [39,40]. According to a survey, 119 species of wetlands plants and 126 species of fishery resources in the Poyang Lake in the 1960s reduced to 102 and 118 species, respectively, in the 1980s, and the reed and dipterocarp clusters everywhere were gradually replaced by mossy grass clusters with short plants [41,42].
The results of this study show that the lake area of Poyang Lake decreased obviously between 1990 and 2000, and the lake area decreased from 1370.22 km2 in 1990 to 1076.20 km2 in 2000. Meanwhile, about 40% of the land use types in the 1 km lakeshore zone are farmland, which is probably due to the “enclosing lake for farming”. It is likely that the area of the Poyang Lake has been decreasing year after year due to the “enclosing lake for farming”. The study of domestic related scholars [43] shows that the utilization of the wetlands of Poyang Lake is mainly to enclose the lake in order to make fields for agricultural production, which is consistent with the results of this study. Meanwhile, the area of wetlands increased in 2020, as compared to 2015, which indicates that the proposal and construction of “Poyang Lake Eco-Economic Zone” has begun to show effect [43], and this reflects that the ecological service value generated by wetlands accounts for about 40% of the ecological service value generated by all the lakeshore zones in 2020. The land use types that changed more significantly between 1980 and 2020 were agricultural land, wetlands, and waters. Among them, agricultural land had the highest change in area, increasing at a rate of 9.57/year, followed by wetlands, decreasing at the rate of 8.08/year. it is worth noting that the wetlands area in the lakeshore zone of Poyang Lake has continued to decrease from 1990 to 2015, which is consistent with some current findings [44,45,46].
Between 2000 and 2020, the lake area rebounded and the area of the lakeshore zone increased accordingly. The year 2010 benefited from the increase in the area of water bodies and the ecosystem service value (ESV) reached 22,631.24 × 106 Yuan in 2010, which was the highest in 40 years. The area of water bodies in the lakeshore zone decreased in 2020, as compared to 2015, which is the main reason for the lower ESV in 2020, as compared to 2015. This is the main reason why the ESV of the lakeshore zone in 2020 was lower than the ESV in 2015. Except for 2010, the ecological service value of the riparian zone of Poyang Lake grew slowly and remains around 15,000 × 106 Yuan all year round, which indicates that the ecosystem service value of the riparian zone of Poyang Lake fluctuates within the normal range (1500–3000 km2) under the change of lake area and spatial location and area of the riparian zone of Poyang Lake. This manuscript differs from previous papers in the valuation of ecosystem services in the riparian zone of Poyang Lake in that we used the interannual dynamic riparian zone to more accurately quantify the magnitude of ecosystem services provided by the riparian zone to the Poyang Lake region. Few papers have been published on the ecosystem service value of the riparian zone of Poyang Lake. Previous studies [27,32,47,48,49] used the multi-year mean water level of Poyang Lake in order to determine the area of the surface of the Poyang Lake and thus the riparian zone area, and the ESV results obtained from those studies may be inaccurate.
Since the implementation of the Yangtze River Protection Law in March 2021, Poyang Lake has entered a ten-year ban on fishing, which promotes the implementation of the “catching big protection and not big development” in the Yangtze River basin; the previously artificially closed water body has gradually broken the dike, and the hydrological connectivity of the lake area tends to be in the natural state. The local wetlands protection policy has achieved remarkable results and should be continued, as well as the ecological restoration of previously developed agricultural land and construction sites. The local decision makers could consider the following two aspects: (1) ensure that the total amount of wetlands in the Poyang Lake area will not be reduced and the ecological function will not be diminished. That is, consider the need for wetlands protection and biodiversity protection, especially the need to maintain the function of various aquatic biological reserves, and establish an ecological protection alert line in the Poyang Lake area. (2) Speed up the biodiversity reply in the basin, establish a mechanism for establishing aquatic life race restoration, and study the influence of human interference on ecosystem degradation. Use certain anthropogenic methods to accelerate the ecological restoration process of the Poyang Lake region.
In the future, if the farmland type in the lakeshore zone of Poyang Lake is further transformed into the wetlands or water body, and the land use types such as building land, forest and grassland are reasonably allocated, the ecological service value of lakeshore zone will be further improved, the ecological effect of the lakeshore zone will be more stable, and the quality of the lakeshore zone of Poyang Lake will be further improved.

5. Conclusions

In this paper, based on the land use data corresponding to a 30 m resolution, based on 7-Landsat satellite image interpretation from 1980 to 2020, the changes in the ecosystem service value of the Poyang Lake surface and the 1 km lakeshore zone are assessed, in combination with the ecological service value per unit area of different terrestrial ecosystems in Poyang Lake basin, and the conclusions are as follows.
(1)
The lake area of Poyang Lake has shown a decreasing trend from 1980 to 2000; the lake area of Poyang Lake has gradually increased from 2000 to 2020. This indicates that the current lake area of Poyang Lake has recovered.
(2)
The area of farmland, forest, grassland and desert has gradually increased and the area of wetlands has gradually decreased over 40 years. The area of the water body gradually increased from 1980 to 2010, while the area of water body gradually decreased from 2010 to 2020.
(3)
The ecosystem service value of the lakeshore zone of Poyang Lake fluctuates around 15,000 × 106 Yuan from year to year.

Author Contributions

Conceptualization, X.G. and A.L.; methodology, G.L.; software, J.Y.; validation, X.G., A.L. and H.W.; formal analysis, X.G.; investigation, X.G.; resources, H.W.; data curation, H.W.; writing—original draft preparation, X.G.; writing—review and editing, A.L., Y.Y. and P.Z.; visualization, H.W.; supervision, A.L.; project administration, J.Y.; funding acquisition, G.L. All authors have read and agreed to the published version of the manuscript.

Funding

This research was funded by the National Key Research and Development Program of China (Project Numbers: 2017YFC0404301 and 2016YFA0601602) and the National Natural Science Foundation of China (Project Number: 41961004).

Institutional Review Board Statement

Not applicable.

Informed Consent Statement

Not applicable.

Data Availability Statement

The data set is provided by Geospatial Data Cloud site, Computer Network Information Center, Chinese Academy of Sciences (http://www.gscloud.cn/, accessed on 31 August 2021).

Conflicts of Interest

The authors declare no conflict of interest.

Appendix A

Table A1. Chinese Academy of Sciences secondary land use classification system.
No. (Level 1)NameNo. (Level 2)NameDescription
1Farmland Refers to the planting of crops cab land, including ripe cultivated land, newly opened land, recreational land, rotational rest land, grass field rotation crop land; to plant crops which are mainly agricultural fruit, agricultural mulberry, and agricultural forestry land; cultivated for more than three years of the beach and sea shoals.
11Water FieldRefers to the arable land with water guarantee and irrigation facilities, which can be irrigated normally in normal years and used for growing rice, lotus root and other aquatic crops, including the arable land where rice and dryland crops are rotated.
12DrylandCultivated land without irrigation sources and facilities, growing crops by natural precipitation; cultivated land with water sources and irrigation facilities, which can be irrigated normally in one year; cultivated land mainly for growing vegetables; recreational land and rotational land with normal crop rotation.
2Forests Refers to forestry land such as growing trees, shrubs, bamboos, and coastal mangrove land.
21With woodlandRefers to natural forests and plantations with a denseness of >30%. Including timber forests, economic forests, protective forests and other mature woodlands.
22ShrublandRefers to short woodlands and scrub woodlands with densities > 40% and heights below 2 m.
23Open woodlandRefers to forest land with 10–30% tree densities.
24Other woodlandRefers to the non-forested plantations, trails, nurseries and various types of gardens (orchards, mulberry gardens, tea gardens, hot crop forests, etc.).
3Grassland Refers to all kinds of grassland with herbaceous plants growing mainly and covering more than 5%, including scrub grassland mainly for grazing and open forest grassland with less than 10% depression.
31High-cover grasslandRefers to natural grassland, improved grassland and mowed grassland covering > 50%. This type of grassland has a good moisture condition and dense grass cover growth.
32Grassland with medium coverNatural grassland and improved grassland with >20–50% cover, where one strand has insufficient moisture and the grass cover is sparse.
33Low-cover grasslandRefers to natural grassland with a cover of 5–20%. This kind of grassland lacks moisture and the grass cover is sparse and poorly used for grazing.
4Waters Natural terrestrial waters and water facilities.
41River and canalRefers to the land below the perennial water level of naturally formed or artificially dug rivers and their main trunks. Artificial canal including embankment.
42LakesRefers to the land below the perennial water level of naturally formed waterlogged areas.
43Reservoir pondsRefers to the land below the perennial water level of artificially constructed water storage areas.
44Permanent glacial snowIncludes land covered by glaciers and snow all year round.
45MudflatsRefers to the tidal inundation zone between the high and low tide levels of the coastal high tide.
5Urban and rural, industrial and mining, residential land Refers to urban and rural settlements and the land outside of them for industry, mining, transportation, etc.
51Urban landThe land in large, medium and small cities and built-up areas above the county town.
52Rural settlementsRefers to the rural settlements independent of the towns.
53Other construction useLand for large industrial areas, oil fields, salt fields, quarries, etc., as well as traffic roads, airports and special land.
6Unused land Land that is currently unused, including land that is difficult to use.
61Sandy landRefers to land with a sand-covered surface and vegetation cover of less than 5%, including deserts, excluding deserts in water systems.
62GobiRefers to land where the ground surface is dominated by gravel and the vegetation cover is less than 5% cab land.
63Saline landRefers to the land where salt and alkali gather on the surface, vegetation is sparse, and only strong salt-tolerant plants can grow.
64Swampy landRefers to land with flat and low-lying terrain, poor drainage, chronically wet, seasonally waterlogged or perennially waterlogged, and wet plants growing on the surface.
65Bare landRefers to land with surface soil cover and vegetation cover of less than 5%.
9 99MarineMarine
Table A2. Classification of ecosystem services [8,14].
Primary Classification Secondary ClassificationComparison with Constaza Classification
Provisioning servicesFood productionFood production (13)
Raw material productionRaw material (14)
Water supplyWater supply (5)
Regulating servicesGas regulationGas regulation (1)
Climate regulationClimate regulation (2), Disturbance regulation (3)
Environmental purificationWaste treatment (9)
Hydrological regulationWater regulation (4)
Supporting servicesSoil conservationErosion control and sediment retention (6), Soil formation (7)
Maintenance of nutrient cycleNutrient cycling (8)
BiodiversityPollination (10), Biological control (11), Refugia (12), Genetic resources (15)
Cultural servicesAesthetic landscapeRecreation (16), Cultural (17)
Table A3. Ecosystem service equivalent value per unit area [14].
Ecosystem ClassificationProvisioning ServicesRegulating Services Supporting Services Cultural Services
Primary Classification Secondary ClassificationFood ProductionRaw Material ProductionWater SupplyGas RegulationClimate Regulation Environmental PurificationHydrological RegulationSoil ConservationMaintenance of Nutrient CyclesBiodiversity Aesthetic Landscape
FarmlandDryland 0.850.400.020.670.360.100.271.030.120.130.06
Paddy field1.360.09−2.631.110.570.172.720.010.190.210.09
ForestConiferous0.220.520.271.705.071.493.342.060.161.880.82
Mixed coniferous0.310.710.372.357.031.993.512.860.222.601.14
Broad-leaved 0.290.660.342.176.501.934.742.650.202.411.06
Shrub0.190.430.221.414.231.283.351.720.131.570.69
GrasslandGrass0.100.140.080.511.340.440.980.620.050.560.25
Scrub0.380.560.311.975.211.723.822.400.182.180.96
Meadow0.220.330.181.143.021.002.211.390.111.270.56
Wetland
Desert
Wetlands0.510.502.591.903.603.6024.232.310.187.874.73
Desert0.010.030.020.110.100.310.210.130.010.120.05
Bare ground0.000.000.000.020.000.100.030.020.000.020.01
WatersWater system0.800.238.290.772.295.55102.240.930.072.551.89
Glacial snow0.000.002.160.180.540.167.130.000.000.010.09

References

  1. Huajun, T.; Wenbin, W.; Peng, Y.; Youqi, C.; Verburg, P.H. Recent progresses of land use and land cover change (lucc) models. Acta Geogr. Sin. 2009, 64, 456–468. [Google Scholar]
  2. García-Álvarez, D.; Lloyd, C.D.; van Delden, H.; Olmedo, M.T.C. Thematic resolution influence in spatial analysis. An application to land use cover change (lucc) modelling calibration. Comput. Environ. Urban Syst. 2019, 78, 101375. [Google Scholar] [CrossRef]
  3. Bingfang, W.; Quanzhi, Y.; Zhangzhen, Y.; Zongming, W.; Xinfang, Y.; Ainong, L.; Ronghua, M.; Jinliang, H.; Jinsong, C.; Cun, C.; et al. Land cover changes of china from 2000 to 2010. Quat. Sci. 2014, 34, 723–731. [Google Scholar]
  4. Li, W.; Binggeng, X. The variation differences of cultivated land ecological security between flatland and mountainous areas based on lucc. PLoS ONE 2019, 14, e0220747. [Google Scholar]
  5. Lei, Z.; Bingfang, W.; Xiaosong, L.; Qiang, X. Classification system of china land cover for carbon budget. Acta Ecol. Sin. 2014, 34, 7158–7166. [Google Scholar]
  6. Yupeng, L.I.; Yaning, C.; Zhi, L.I. Effects of land use and cover change on surface wind speed in china. J. Arid. Land 2019, 11, 345–356. [Google Scholar]
  7. Rubo, Z.; Meizhen, L.; Jianzhou, G.; Zhuo, W. Spatiotemporal heterogeneity and influencing mechanism of ecosystem services in the pearl river delta from the perspective of lucc. J. Geogr. Sci. 2019, 29, 831–845. [Google Scholar]
  8. Costanza, R.; dArge, R.; deGroot, R.; Farber, S.; Grasso, M.; Hannon, B.; Limburg, K.; Naeem, S.; ONeill, R.V.; Paruelo, J.; et al. The value of the world’s ecosystem services and natural capital. Nature 1997, 387, 253–260. [Google Scholar] [CrossRef]
  9. Winkler, R. Valuation of ecosystem goods and services part 1: An integrated dynamic approach. Ecol. Econ. 2006, 59, 82–93. [Google Scholar] [CrossRef]
  10. Nan, Y.; Shuai, W.; Yanxu, L. Ecosystem service value assessment: Research progress and prospects. Chin. J. Ecol. 2021, 40, 233–244. [Google Scholar]
  11. Willcock, S.; Martinez-Lopez, J.; Hooftman, D.A.P.; Bagstad, K.J.; Balbi, S.; Marzo, A.; Prato, C.; Sciandrello, S.; Signorello, G.; Voigt, B.; et al. Machine learning for ecosystem services. Ecosyst. Serv. 2018, 33, 165–174. [Google Scholar] [CrossRef]
  12. Gaodi, X.; Chunxia, L.; Yunfa, L.; Du, Z.; Shuangcheng, L. Ecological assets valuation of the tibetan plateau. J. Nat. Resour. 2003, 189–196. [Google Scholar]
  13. Gaodi, X.; Caixia, Z.; Changshun, Z.; Yu, X.; Chunxia, L. The value of ecosystem services in china. Resour. Sci. 2015, 37, 1740–1746. [Google Scholar]
  14. Gaodi, X.; Caixia, Z.; Leiming, Z.; Wenhui, C.; Shimei, L. Improvement of the evaluation method for ecosystem service value based on per unit area. J. Nat. Resour. 2015, 30, 1243–1254. [Google Scholar]
  15. Juncheng, C.; Tianhong, L. Changes of spatial variations in ecosystem service value in china. Acta Sci. Nat. Univ. Pekin. 2019, 55, 951–960. [Google Scholar]
  16. Guoxia, M.; Xiafei, Z.; Fei, P.; Ying, Z. Cost of ecological degradation accounting in china in 2015. Sci. Geogr. Sin. 2019, 39, 1008–1015. [Google Scholar]
  17. Hao, Z.; Yaya, J.; Bo, W.; Shuyi, F.; Futian, Q. Compensation for cultivated land protection of shaanxi province based on calculation of cultivated land development rights. Trans. Chin. Soc. Agric. Eng. 2018, 34, 256–266. [Google Scholar]
  18. Li, L.; Wenbo, Z.; Yanhong, L.; Lianqi, Z.; Shuaibo, X.; Xiaoyan, F. Ecosystem service value gains and losses of qihe river basin based on topographic gradient characteristics. Res. Soil Water Conserv. 2019, 26, 287–295. [Google Scholar]
  19. Smardon, R. Wetlands and sustainability. Water 2014, 6, 3724–3726. [Google Scholar] [CrossRef] [Green Version]
  20. de Souza, A.L.T.; Fonseca, D.G.; Liborio, R.A.; Tanaka, M.O. Influence of riparian vegetation and forest structure on the water quality of rural low-order streams in se brazil. For. Ecol. Manag. 2013, 298, 12–18. [Google Scholar] [CrossRef]
  21. Helfenstein, J.; Kienast, F. Ecosystem service state and trends at the regional to national level: A rapid assessment. Ecol. Indic. 2014, 36, 11–18. [Google Scholar] [CrossRef]
  22. Bruijnzeel, L. Hydrological functions of tropical forests: Not seeing the soil for the trees? Agric. Ecosyst. Environ. 2004, 104, 185–228. [Google Scholar] [CrossRef]
  23. Naiman, R.J.; Decamps, H.; Pollock, M. The role of riparian corridors in maintaining regional biodiversity. Ecol. Appl. A Publ. Ecol. Soc. Am. 1993, 3, 209–212. [Google Scholar] [CrossRef]
  24. Surasinghe, T.D.; Baldwin, R.F. Importance of riparian forest buffers in conservation of stream biodiversity: Responses to land uses by stream-associated salamanders across two southeastern temperate ecoregions. J. Herpetol. 2015, 49, 83–94. [Google Scholar] [CrossRef]
  25. Hiraoka, M. Floodplain farming in the peruvian amazon. Geogr. Rev. Jpn. Ser. B 1985, 58, 1–23. [Google Scholar] [CrossRef] [Green Version]
  26. Swanson, C.; Bohlman, S. Cumulative impacts of land cover change and dams on the land–water interface of the tocantins river. Front. Environ. Sci. 2021, 9, 120. [Google Scholar] [CrossRef]
  27. Dongming, X.; Guohua, J. Riparian landscape change in poyang lake. Acta Ecol. Sin. 2016, 36, 5548–5555. [Google Scholar]
  28. Huang, W.; Mao, J.; Zhu, D.; Lin, C. Impacts of land use and land cover on water quality at multiple buffer-zone scales in a lakeside city. Water 2020, 12, 47. [Google Scholar] [CrossRef] [Green Version]
  29. Shen, R.; Lan, Z.; Chen, Y.; Leng, F.; Jin, B.; Fang, C.; Chen, J. The effects of flooding regimes and soil nutrients on lakeshore plant diversity in a pristine lake and a human managed lake in subtropical china. J. Freshw. Ecol. 2019, 34, 757–769. [Google Scholar] [CrossRef]
  30. Haisheng, C.; Xueling, Z.; Dehai, Z. Research on land utilization and deterioration of poyang lake area. Yangtze River 2006, 86–89, 131. [Google Scholar]
  31. Haiyan, Z. Study on Land Use Changes and Its Effects on Eco-Environment in the Poyang Lake Region. Ph.D. Thesis, Nanjing Agricultural University, Nanjing, China, 2011. [Google Scholar]
  32. Yunliang, L.; Guizhang, Z.; Jing, Y.; Qi, Z. Interactions between groundwater and lake water of riparian zone in the typical area of poyang lake. Trop. Geogr. 2017, 37, 522–529. [Google Scholar]
  33. Li, Y.; Zhang, Q.; Yao, J.; Werner, A.D.; Li, X. Hydrodynamic and hydrological modeling of the poyang lake catchment system in china. J. Hydrol. Eng. 2014, 19, 607–616. [Google Scholar] [CrossRef]
  34. Costanza, R.; de Groot, R.; Sutton, P.; van der Ploeg, S.; Anderson, S.J.; Kubiszewski, I.; Farber, S.; Turner, R.K. Changes in the global value of ecosystem services. Glob. Environ. Chang.-Hum. Policy Dimens. 2014, 26, 152–158. [Google Scholar] [CrossRef]
  35. Gaodi, X.; Lin, Z.; Chunxia, L.; Yu, X.; Cao, C. Expert knowledge based valuation method of ecosystem services in china. J. Nat. Resour. 2008, 23, 911–919. [Google Scholar]
  36. Kasimu, Y.; Shengtian, Y.; Simayi, Z. Impact of land use change on ecosystem service value in ebinur lake basin, xinjiang. Trans. Chin. Soc. Agric. Eng. 2019, 35, 260–269. [Google Scholar]
  37. Gu, X.; Yang, G.; He, X.; Zhao, L.; Li, X.; Li, P.; Liu, B.; Gao, Y.; Xue, L.; Long, A. Hydrological process simulation in manas river basin using cmads. Open Geosci. 2020, 12, 946–957. [Google Scholar] [CrossRef]
  38. Smardon, R. International wetlands policy and management issues. Natl. Wetl. Newsl. 2015, 37, 10–16. [Google Scholar]
  39. Gan, X.; Chen, F. Study on influence factors of famers’ willingness to accept ecological compensation living in wetland area based on the investigation for 322 households in poyang lake wetland. In Proceedings of the 2016 2nd International Conference on Economy, Management, Law and Education (Emle 2016), Moscow, Russia, 15–17 December 2016; Volume 20, pp. 100–104. [Google Scholar]
  40. Niu, D.; Guo, X.; Chen, C.; Peng, B. Perspectives on restoration strategies for poyang lake wetlands. In Proceedings of the Eplww3s 2011: 2011 International Conference on Ecological Protection of Lakes-Wetlands-Watershed and Application of 3s Technology, Nanchang, China, 25–26 June 2011; Volume 1, pp. 371–375. [Google Scholar]
  41. Changgen, S. Study on the ecological effects of agricultural activities in poyang lake region. Rural. Eco-Environ. 1996, 4, 11–14. [Google Scholar]
  42. Guoqin, H. On ecological security and ecological construction of poyang lake district. Sci. Technol. Rev. 2006, 24, 73–78. [Google Scholar]
  43. Qiwu, H.; Bo, Y.; Ying, L.; Qin, W.; Zhonggang, Z.; Wushan, L. Analysis on changes of man-land relationship and associated driving force in poyang lake region. Resour. Environ. Yangtze Basin 2010, 19, 628–633. [Google Scholar]
  44. Tang, M. Study on the Influence of Urbanization Process on the Ecological Environment of Poyang Lake Waters. Ph.D. Thesis, Shanghai Normal University, Shanghai, China, 2019. [Google Scholar]
  45. You, H.; Fan, H.; Xu, L.; Wu, Y.; Wang, X.; Liu, L.; Yao, Z.; Yan, B. Effects of water regime on spring wetland landscape evolution in poyang lake between 2000 and 2010. Water 2017, 9, 467. [Google Scholar] [CrossRef] [Green Version]
  46. Wang, Y.; Molinos, J.G.; Shi, L.; Zhang, M.; Wu, Z.; Zhang, H.; Xu, J. Drivers and changes of the poyang lake wetland ecosystem. Wetlands 2019, 39, S35–S44. [Google Scholar] [CrossRef]
  47. Li, X.W.; Yu, X.B.; Jiang, L.G.; Li, W.Y.; Liu, Y.; Hou, X.Y. How important are the wetlands in the middle-lower yangtze river region: An ecosystem service valuation approach. Ecosyst. Serv. 2014, 10, 54–60. [Google Scholar] [CrossRef]
  48. Liu, H.; Zheng, L.; Wu, J.; Liao, Y.H. Past and future ecosystem service trade-offs in poyang lake basin under different land use policy scenarios. Arab. J. Geosci. 2020, 13, 46. [Google Scholar] [CrossRef] [Green Version]
  49. Zhao, X.F.; Tong, P.H. Ecosystem services valuation based on land use change in a typical waterfront town, poyang lake basin, china. In Progress in Environmental Protection and Processing of Resource, Pts 1–4; Tang, X., Zhong, W., Zhuang, D., Li, C., Liu, Y., Eds.; Trans Tech Publications: Baech, Switzerland, 2013; Volume 295–298, pp. 722–725. [Google Scholar]
Figure 1. Location of Poyang Lake.
Land 10 00951 g001
Figure 2. (a) Spatial changes and (b) area changes of Poyang Lake and the lakeshore zone from 1980 to 2020.
Land 10 00951 g002
Figure 3. Values and trends of land use types at the level of the lakeshore zone of Poyang Lake from 1980 to 2020.
Land 10 00951 g003
Figure 4. Values and trends of ESV in the lakeshore zone of Poyang Lake from 1980 to 2020.
Land 10 00951 g004
Table 1. Table of ecological service value per unit area of the secondary ecosystem in Poyang Lake basin (Yuan/hm2).
Ecosystem ClassificationProvisioning ServicesRegulating ServicesSupporting ServicesCultural Services
Primary Classification Secondary ClassificationFood ProductionRaw Material ProductionWater SupplyGas RegulationClimate Regulation Environmental PurificationHydrological RegulationSoil ConservationMaintenance of Nutrient CyclesBiodiversity Aesthetic Landscape
FarmlandDryland 3063.471441.6372.082414.731297.47360.41973.103712.20432.49468.53216.24
Paddy field4901.55324.37−9478.734000.532054.33612.699803.1036.04684.78756.86324.37
ForestConiferous792.901874.12973.106126.9418,272.695370.0812,037.637424.40576.656775.672955.35
Mixed coniferous1117.262558.901333.518469.5925,336.687172.1212,650.3210,307.67792.909370.614108.65
Broad-leaved1045.182378.691225.397820.8523,426.526955.8717,083.349550.81720.828685.833820.32
Shrub684.781549.75792.905081.7515,245.264613.2212,073.676199.02468.535658.412486.82
GrasslandGrass360.41504.57288.331838.084829.471585.803532.002234.53180.202018.28901.02
Scrub1369.552018.281117.267100.0418,777.266199.0213,767.598649.79648.737856.893459.92
Meadow792.901189.35648.734108.6510,884.323604.087965.025009.67396.454577.182018.28
Wetland
Desert
Wetland1838.081802.049334.576847.7512,974.6912,974.6987,326.868325.42648.7328,364.1117,047.30
Desert36.04108.1272.08396.45360.411117.26756.86468.5336.04432.49180.20
Bare ground0.000.000.0072.080.00360.41108.1272.080.0072.0836.04
WatersWater system2883.26828.9429,877.822775.148253.3420,002.64368,481.143351.79252.299190.406811.71
Glacial snow0.000.007784.81648.731946.20576.6525,697.090.000.0036.04324.37
Table 2. Table of ecological service value per unit area of the ecosystem in the Poyang Lake basin level (Yuan/km2).
Ecosystem Level
Classification
Provisioning ServicesRegulating ServicesSupporting ServicesCultural ServicesTotal
Food ProductionRaw Material ProductionWater SupplyGas RegulationClimate RegulationEnvironmental PurificationHydrological RegulationSoil ConservationMaintenance of Nutrient CycleBiodiversityAesthetic Landscape
Farmland398,25188,300−470,332320,763167,59048,655538,810187,41255,86361,26927,0311,423,612
Forests68,478154,97579,290508,1751,524,526461,3221,207,367619,90246,853565,841248,6825,485,411
Grassland79,290118,93564,873410,8651,088,432360,408796,502500,96739,645457,718201,8284,119,463
Wetlands183,808180,204933,457684,7751,297,4691297,4698,732,686832,54264,8732,836,4111,704,73018,748,424
Desert0007208036,04110,812720807208360472,081
Waters288,32682,8942,987,782277,514825,3342,000,26436,848,114335,17925,229919,040681,17145,270,847
Table 3. The values of the lake area of Poyang Lake and the area of the land use type of the lakeshore zone of Poyang Lake from 1980 to 2020 (km2).
Year1980199020002005201020152020
Lake area (km2)1473.471750.001583.432381.272529.602718.232503.90
Lakeshore zone area (km2)1215.381370.221076.201399.761584.661494.191457.13
Farmland430.83500.30351.16648.61724.59794.51728.49
Forests103.08107.9491.13123.08114.18132.90128.60
Grassland48.5860.8642.0279.6370.3769.4671.59
Wetlands529.69555.66460.77374.37290.90224.26311.03
Desert27.2237.5025.4353.8048.2959.1459.95
Waters75.97107.97105.68120.26336.34213.92157.47
Table 4. Values of ESV in the lakeshore zone of Poyang Lake from 1980 to 2020 (106 Yuan).
Classification1980199020002005201020152020
Farmland613.34712.23499.91923.371031.541131.081037.09
Forests565.44592.09499.90675.13626.33729.01705.41
Grassland200.13250.71173.12328.03289.87286.13294.93
Wetlands9930.9310,417.788638.737018.905453.834204.475831.32
Desert1.962.701.833.883.484.264.32
Waters3439.304887.744784.425444.3915,226.199684.267128.61
Total14,751.1116,863.2614,597.9114,393.7022,631.2416,039.2115,001.68
Publisher’s Note: MDPI stays neutral with regard to jurisdictional claims in published maps and institutional affiliations.

