Article

Using Time-Series Remote Sensing Images in Monitoring the Spatial–Temporal Dynamics of LULC in the Msimbazi Basin, Tanzania

1
State Key Laboratory of Estuarine and Coastal Research, East China Normal University, 500 Dongchuan Road, Shanghai 200241, China
2
Department of Computer Science and Engineering, College of Information and Communication Technologies, University of Dar es Salaam, P.O. Box 33335, Dar es Salaam 14112, Tanzania
3
Department of Transportation and Geotechnical Engineering, University of Dar es Salaam, P.O. Box 35131, Dar es Salaam 14113, Tanzania
*
Author to whom correspondence should be addressed.
Land 2021, 10(11), 1139; https://doi.org/10.3390/land10111139
Submission received: 23 September 2021 / Revised: 22 October 2021 / Accepted: 22 October 2021 / Published: 26 October 2021
(This article belongs to the Special Issue Celebrating 25 Years of World Wetlands Day)

Abstract

:
The basins containing rivers and wetlands are very significant to the surrounding dwellers in various ways, altogether aiming at boosting the economy for most developing countries. Unfortunately, the benefits are frequently overlooked and lead to basin mismanagement and degradation posed by increasing population. This study used population and satellite data to quantify the extent of land-use and land-cover changes along the Msimbazi valley between 1990 and 2019. Geographic information system and remote sensing techniques were used in the analysis and processing of remotely sensed images acquired in 1990, 2000, 2010 and 2019. The results reveal that the dominant area is built-up land that occupied 39.3% of the total in 1990 and gradually increased to 42.6% in 2000, 54.1% in 2010 and 65.5% in 2019. Moreover, forest and agriculture that in 1990 had been the second and third largest in size, respectively, had been decreasing throughout the entire period. The population increase had been threatening wetland vegetation during the initial 10 years (1990 to 2000); however, the wetland vegetation showed subsequent improvement after the implementation of some government initiatives. Other land cover, such as bush land and grassland, showed minority status with inconsistent changes in either increase or decrease. These findings imply that the Msimbazi Basin suffers much from uncoordinated human activities that consequently degrade its fertility. This degradation can be observed as well from the population distribution maps that show that a huge stress is being exerted along the riverine due to population growth and urbanization. The study also highlights that a lack of intensive management plans that are supported by clear legal commitments for optimal and sustainable resource utilization contributes to wetland deterioration.

1. Introduction

Globally, river and wetland ecosystems provide significant benefits for humans. Accordingly, different conventions have been formulated to define their conservation for sustainable use. The Ramsar Convention of 1971, for example, defines wetlands as areas of marsh, fen, peat land or water, whether natural or artificial, permanent or temporary, with water that is static, flowing, fresh, brackish or salt, including areas of marine water, the depth of which at low tide does not exceed six meters [1,2]. These areas are recognized as the most important environmental components due to their substantial benefits biologically, ecologically and economically [3,4]. Some biological and ecological benefits derived from wetlands include providing habitats for specific flora and fauna, mitigating flooding, minimizing erosion, controlling pollution and regulating climate [5]. Furthermore, the wetlands support human livelihoods in numerous ways, such as by furnishing water for domestic use and land suitable for socio-economic functions such as agriculture, grazing, industries and settlements [6]. Generally, such benefits are also obtained from the ecosystems with rivers that in some cases connect with wetlands [7].
Despite the substantial ecological, economic and biological contributions of rivers and wetlands, their values have nonetheless been seriously stressed by anthropogenic disturbances [8,9]. Human activities, when carried out arbitrarily, exert pressure on the resource—hence, resulting in adverse impact on rivers and wetlands, such as land degradation, soil erosion, biodiversity loss, pollution and frequent floods [10]. Such impact has been reported in the Yellow River delta of Shandong Province in China [11], the Nakivubo and Lubigi wetlands in Uganda [5,6], and East Kolkata wetland in India [12]. Similar problems have also been happening in the Msimbazi Basin, which contains wetlands with mangroves and marshlands and the river flowing through many areas in Dar es Salaam, Tanzania [13,14,15]. Furthermore, due to industrial activities, the studies by [16,17,18,19] have detected the presence of a high level of heavy metal pollution in the soil, water and vegetables grown in this area. These adverse effects not only affect the humans but also contribute to the degradation of the basin’s potential. Such lands need protection, and for this purpose, Tanzanian National Land Policy (1995) states, for example, that measures will be taken to prevent building and encourage development that is environmentally friendly and beneficial for the local community. Nonetheless, despite the presence of such directives, the studies that have been carried out to date show that many areas in this basin are already inhabited, and hence, the extent of development and trends regarding any additional land-use activity need to be monitored from time to time in order to determine the quality of the constructions and their ecological ramifications [9,20].
This research was designed to join the efforts of restoring the destroyed wetlands and to thus benefit from what their ecosystem provides [21,22,23]. Contrary to the existing studies that focused mainly on the consequences arising from intensive land utilization, this study aimed to determine spatiotemporal dynamics in land use and land cover along the Msimbazi valley between 1990 and 2019. Further, it aimed to realize whether the causes and effects of changes comply with other policies and legal frameworks governing river and wetland resource utilization. These objectives were achieved through the processing of the Landsat remote sensing imagery and population data acquired for four periods of the studied time from GloVis and the National Bureau of Statistics (NBS), respectively. Ultimately, this study is important for providing significant information to land-use planners, policy-makers, decision-makers and other environmental stakeholders for sustainable land management in the Msimbazi valley and all other areas containing river and wetlands ecosystems.

2. Materials and Methods

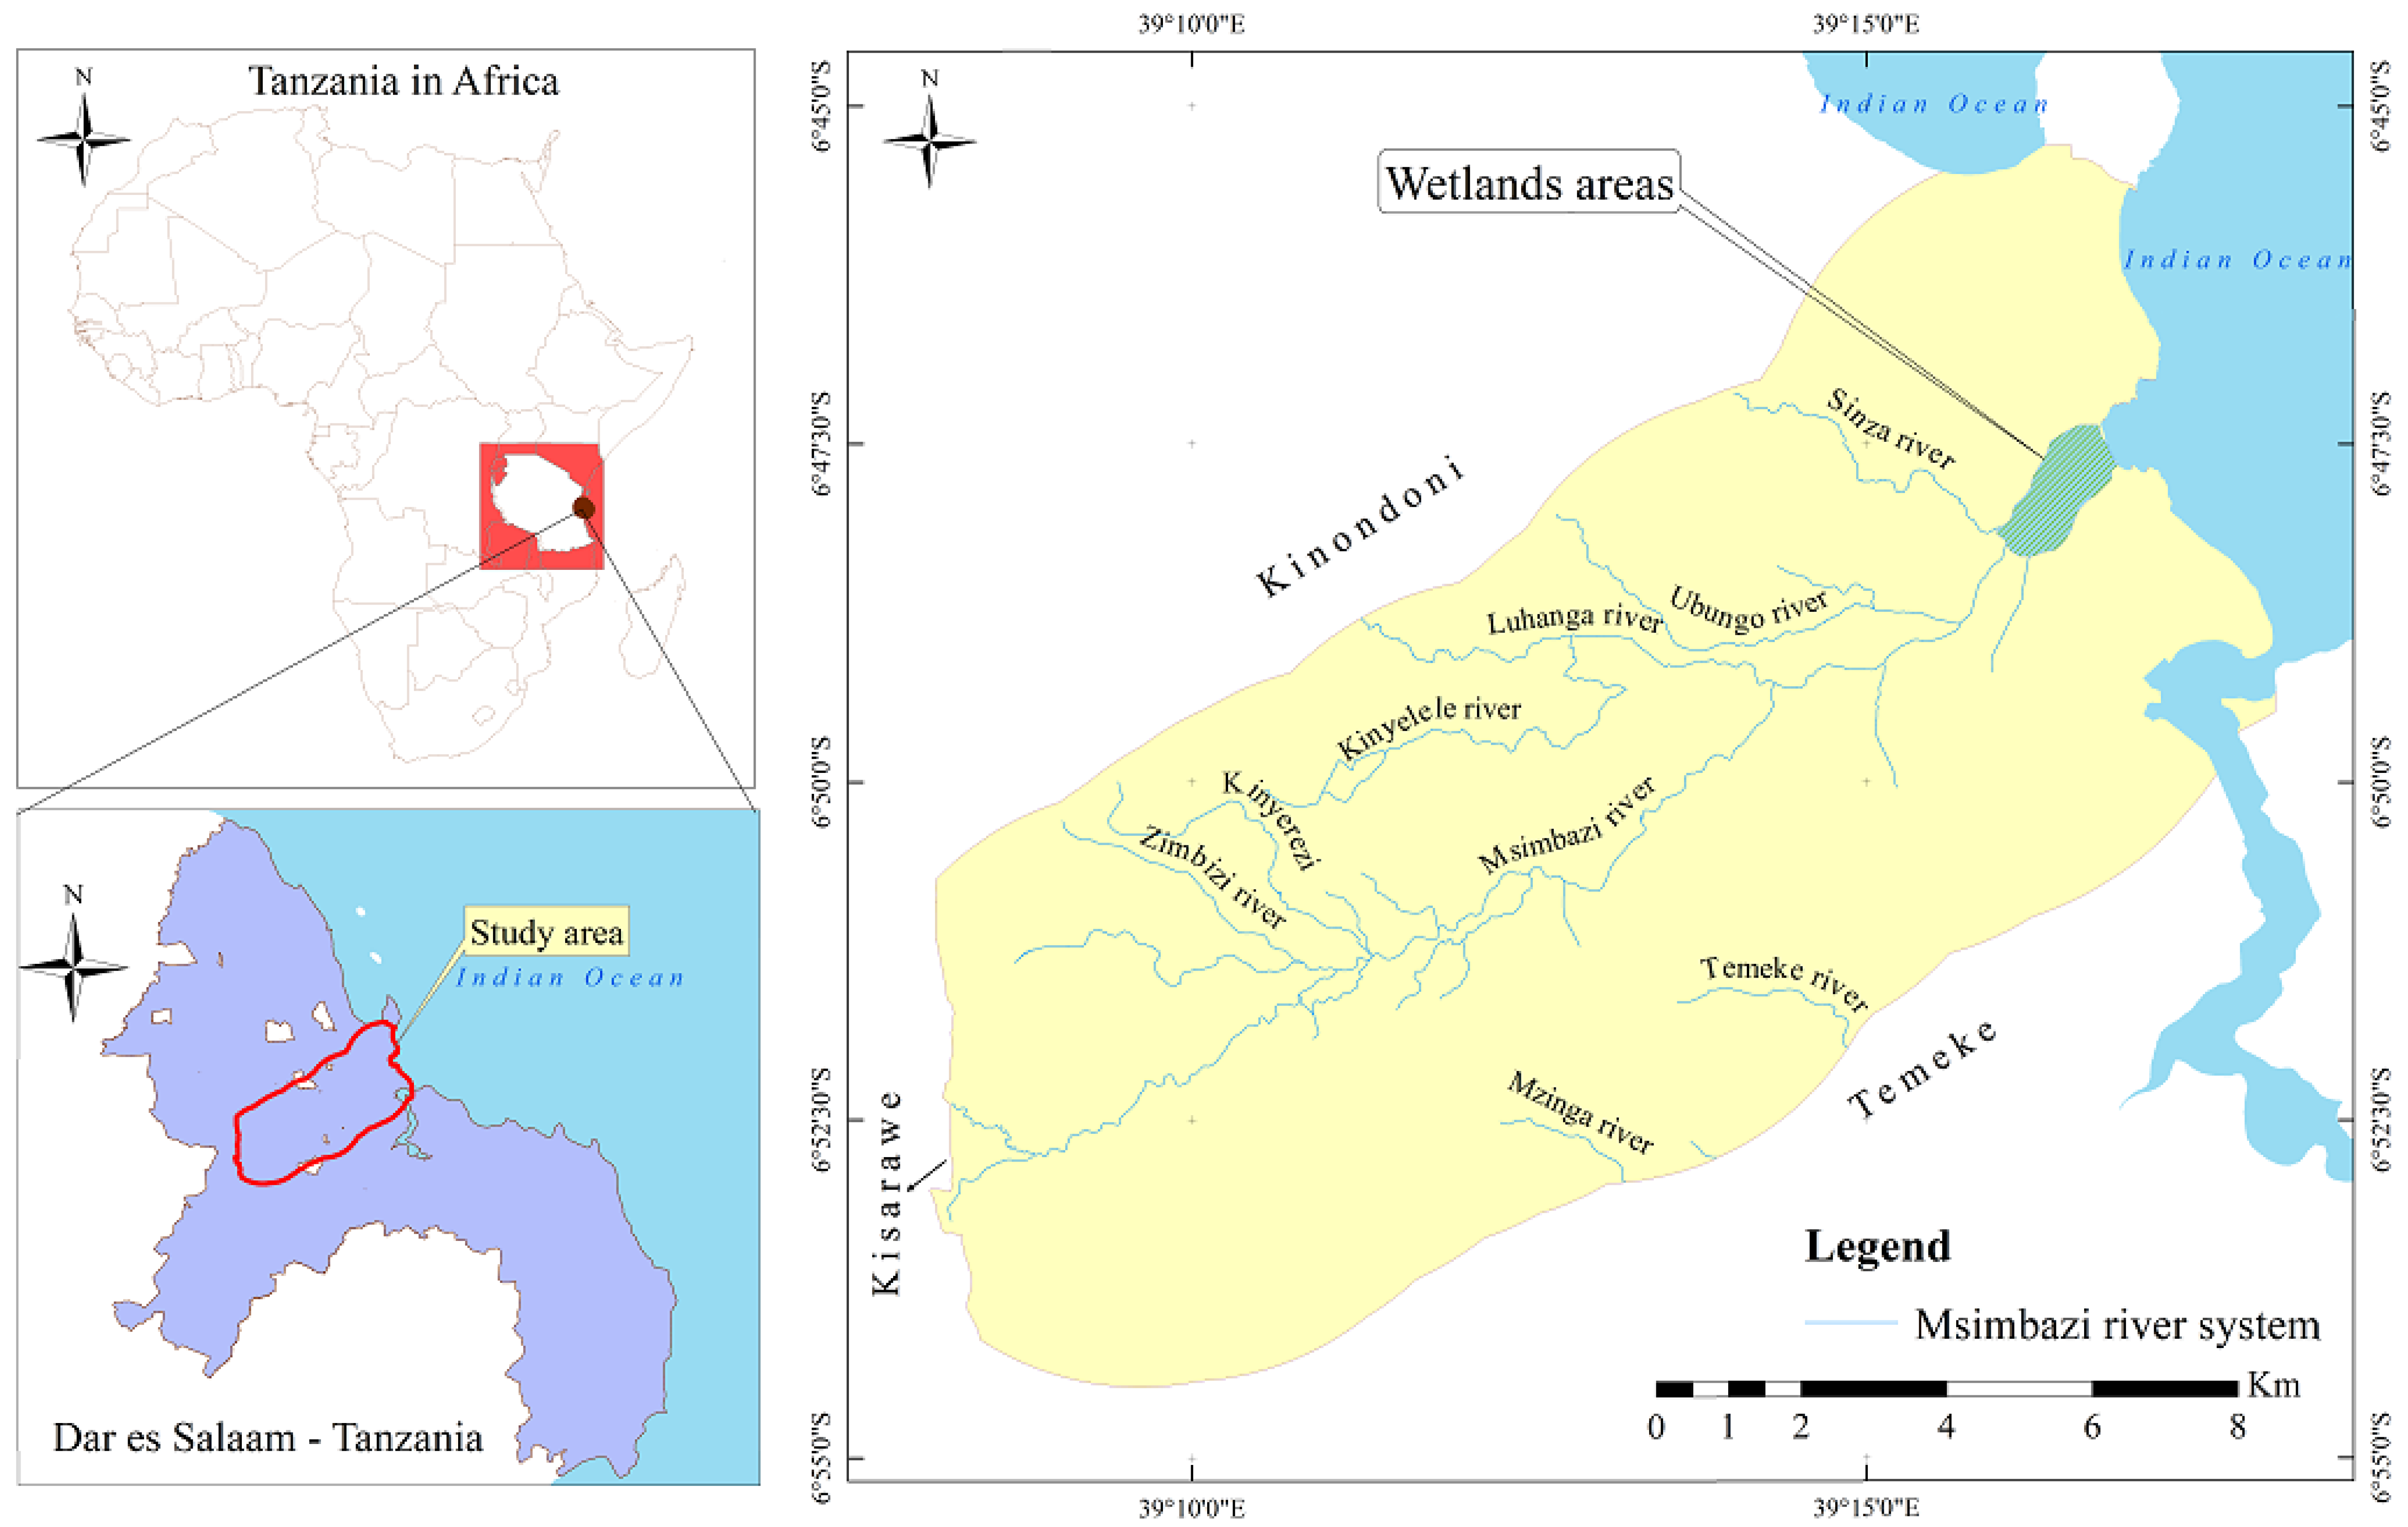
2.1. Description of the Study Area

Msimbazi Basin is part of the Wami-Ruvu Basin that contains rivers and wetlands towards the coast of the Indian Ocean in Tanzania (Figure 1). It is located in Dar es Salaam city, and its boundary coverage is estimated at 162 square kilometers. The main river in this basin is also called Msimbazi (approximately 35 km long), and it traverses through many areas in Dar es Salaam from the Kisarawe district in the Coast region to its discharge into the Indian ocean. Topographically, the highest altitude of this basin is about 308 m (from MSL) recorded at the Pugu Hills in Kisarawe, and geologically, it is characterized by quaternary and Neogene deposits. The wetlands area within the basin is very important as a biodiverse habitat for endemic species. According to the latest Population and Housing Census (PHC) carried out in 2012, the population at this area of study was 2.5 million, and most live in unplanned settlements with inadequate infrastructure services such as sanitation and solid-waste management. Their economic activities include commercial, industrial (e.g., textile, breweries and meat plants) and agricultural pursuits that supply Dar es Salaam city with most of its vegetables and fruits [24]. The climatic condition of this area is humid tropical and characterized by two seasons: dry and wet. The average annual rainfall ranges from 800 to 1400 mm, and the area has bimodal seasons, i.e., long rains (March–May) and short rains (October–December). The mean daily temperature varies between 18 °C and 33 °C. The mean annual evaporation rate is 2104 mm, and humidity lies between 67% and 96%.

2.2. Data Source

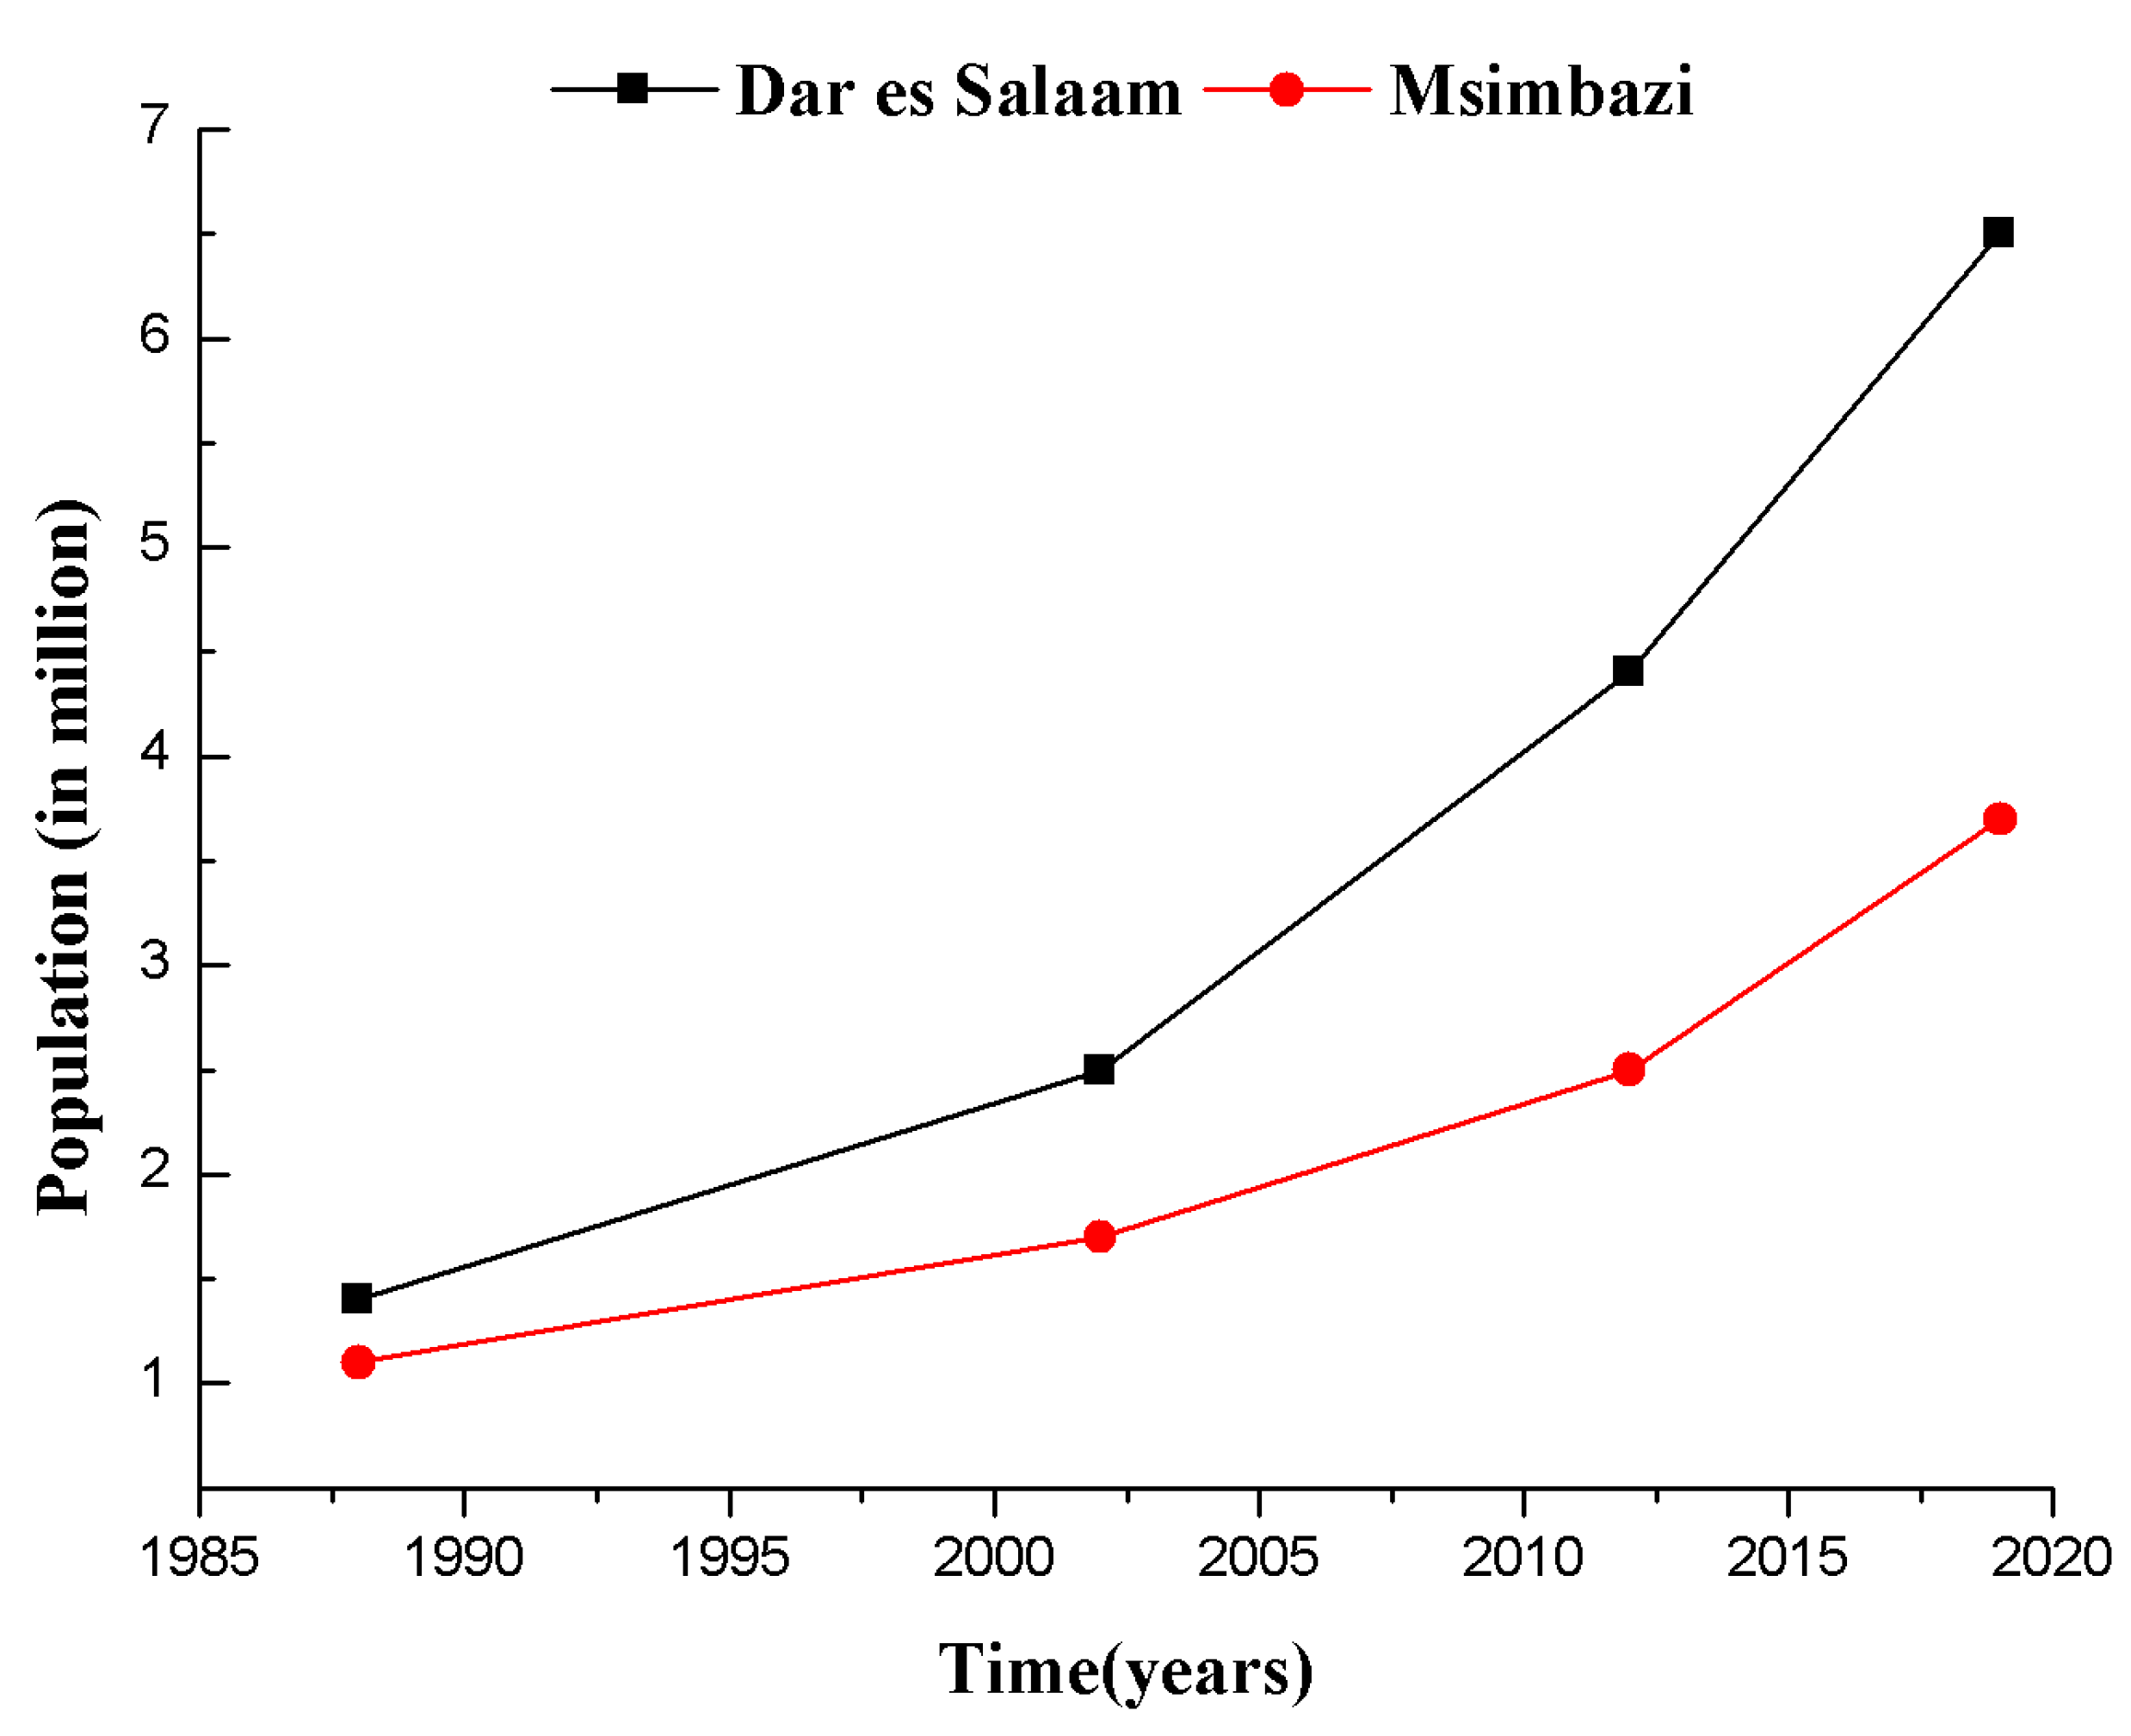
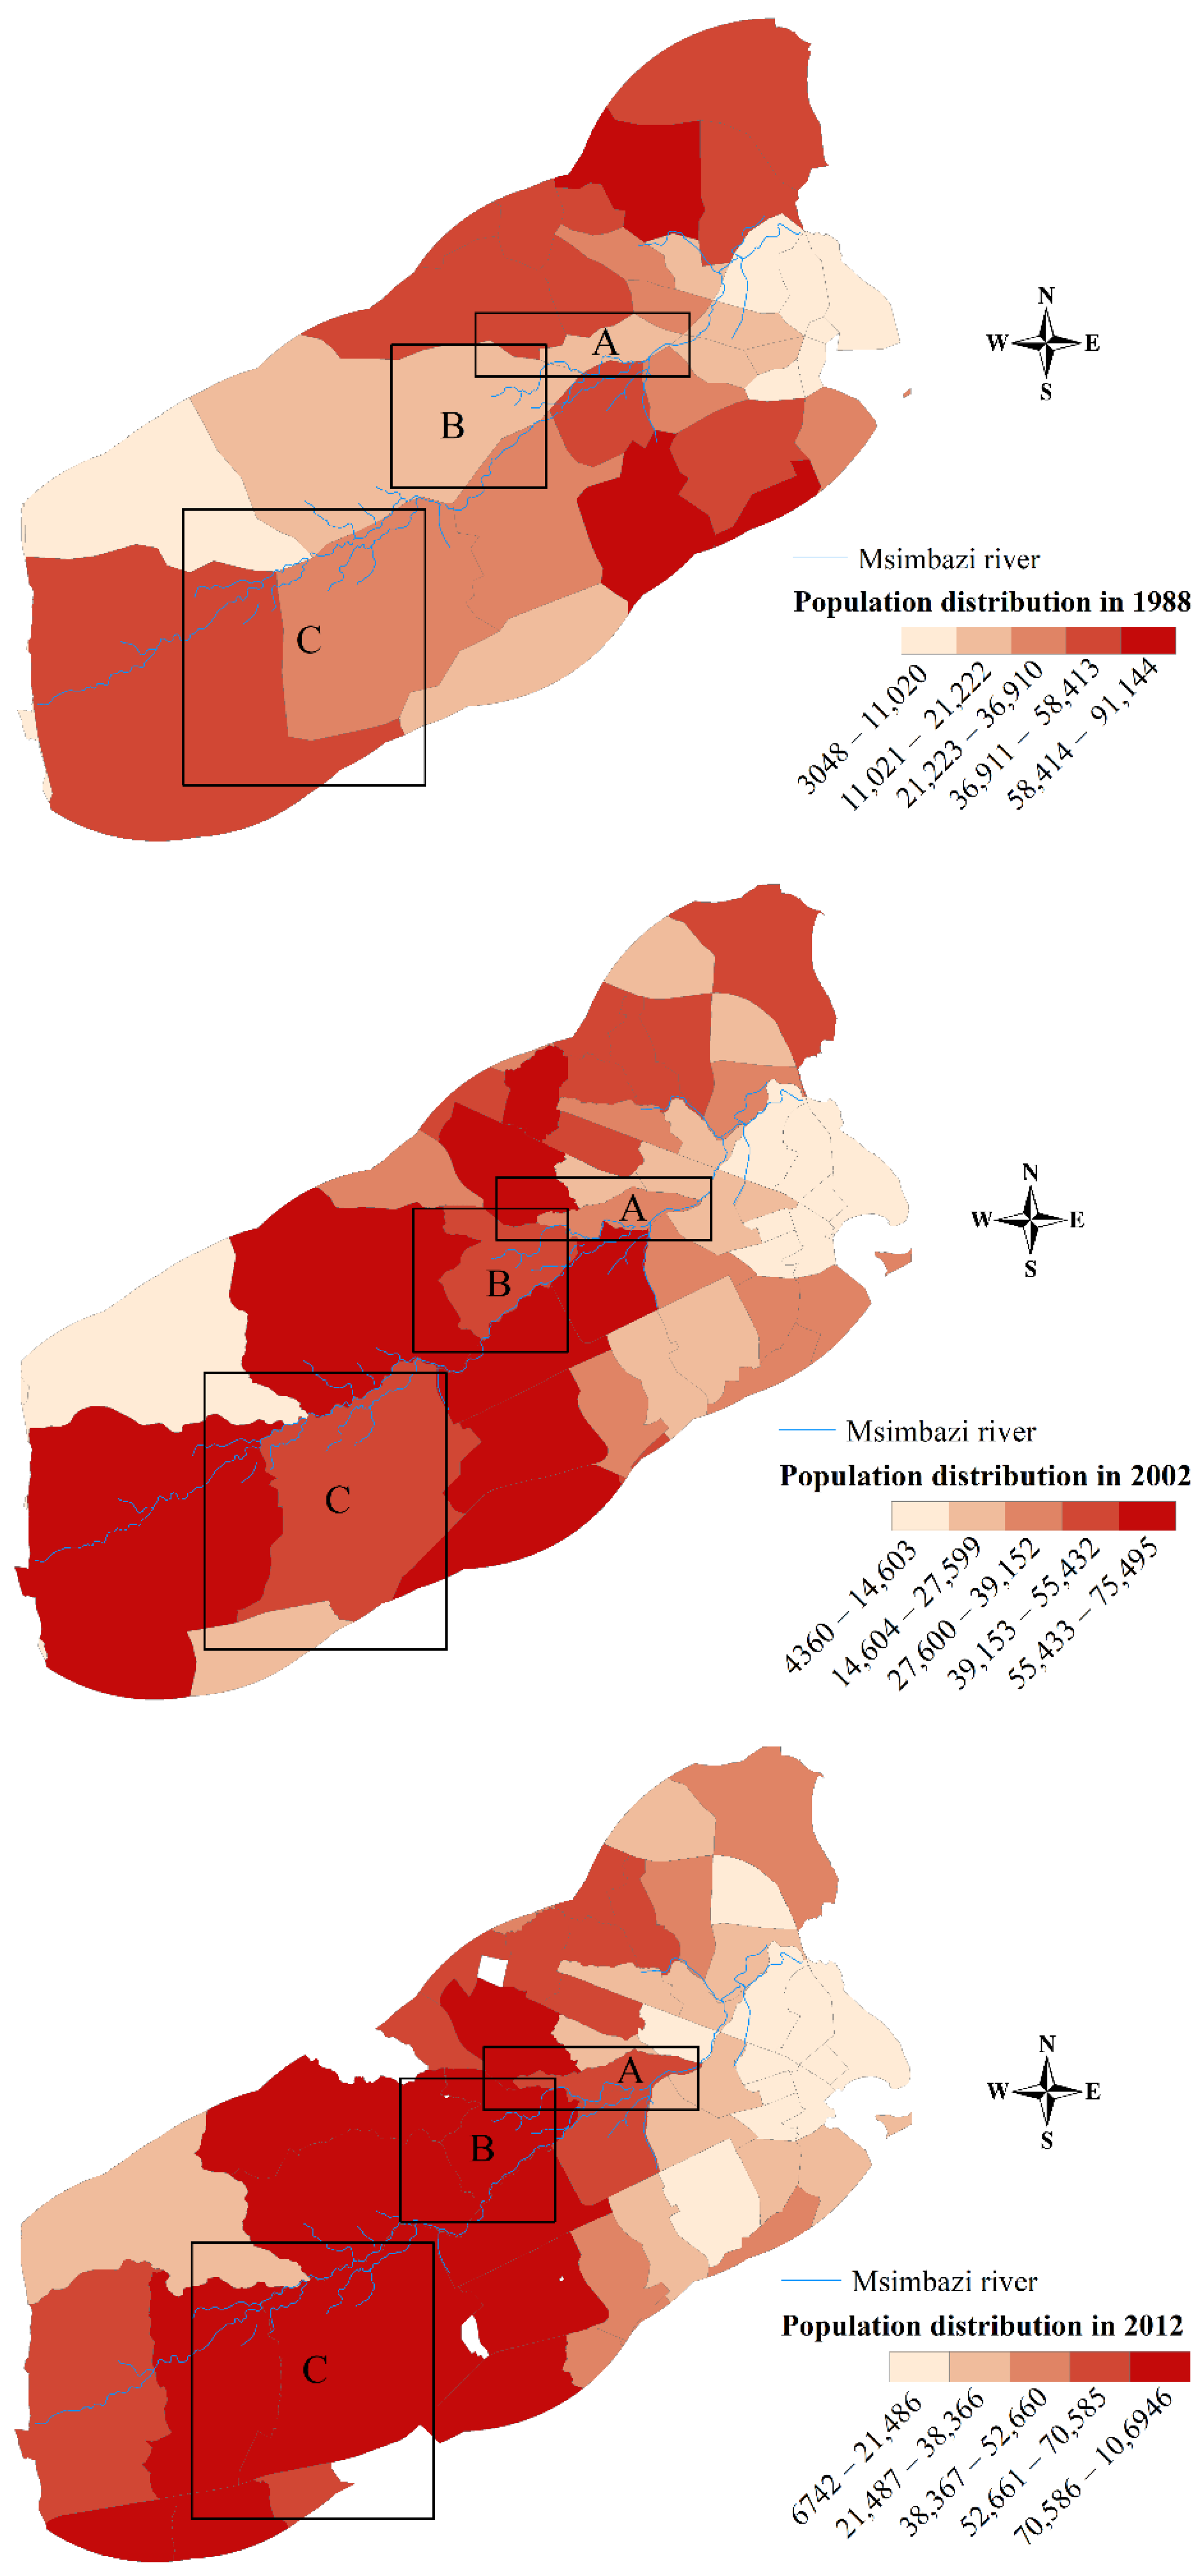
2.2.1. Population Data

Due to the nature of this study, the population in the study area was considered to be the main influence on land-cover changes. This association is given in the sense that an increase in population varies proportionally with human activities that result in variations in land use that ultimately make changes to the land cover. Therefore, based on the same focus for determining spatiotemporal changes of LULC, this study obtained population information from the national censuses conducted in 1988, 2002 and 2012 at NBS Tanzania. Available online: https://www.nbs.go.tz/index.php/en/census-surveys/population-and-housing-census (accessed on 18 January 2021). These population data were obtained along with the shape-files of the valley system and their administrative units. Due to the lack of the recent population census, the 2019 population data were obtained through projection of the 2012 population data by an arithmetical method [13]. In order to fulfill requirements of the formula, the existing population (Po) in 2012, growth rate (r = 5.6%) and the time interval for estimation (n = 7) were identified and used to compute the 2019 population (Pn) using the formula shown below:
P n = P o ( 1 + r 100 ) n

2.2.2. LULC Data

In order to associate trends of the LULC, four remotely satellite datasets overing the study area were identified and downloaded from the Global Visualization Viewer (GloVis) at Glovis. Available online: https://glovis.usgs.gov/ (accessed on 15 March 2021). Landsat-5TM (Thematic Mapper) data for 1990, 2000 and 2010 and Landsat-8OLI (Operational Land Imager) data for 2019 were acquired to determine the extent of LULC spanning 29 years. All of these images have a spatial resolution of 30 m, with multispectral coverage from the visible to the middle infrared radiation fields of the electromagnetic spectrum. In ensuring that the used data were of not poor quality, images were acquired in the dry season (June to October). During this season, the chances of obtaining cloud-free data are higher due to the low cloud coverage and scant ground surface reflectance changes. Moreover, the use of Sentinel-1 data could be effective in this study of coastal wetland by providing cloud-free independent images. This is because they carry C-band synthetic aperture radar (SAR) that can provide images under all weather conditions, day or night. Unfortunately, since it was launched in April 2014, the data were available only for the 2019 time period.

2.3. Image Processing and Classification

The obtained population and satellite data were processed using different approaches based on their status and the direction of the study. The population data from the National Bureau of Statistics (NBS) was not integrated in the shape-file of their administrative units; thus, its format hindered spatial association for easy interpretation via maps. To overcome the formatting challenge, ArcGIS 10.5 software (Environmental Systems Research Institute, West Redlands, CA, USA) was used to explore the data, unify names and update population values for subsequent mapping.
The satellite data for identifying land-use patterns was acquired by separate bands in the WGS84 coordinate system. Thus, in order to make them suitable for deriving intended results, preprocessing of images was done. In this phase, layer stacking, correction of the atmospheric effects and realignments of images were carried out. Layer stacking was performed to combine several single-band images to generate a single multi-layer image. The histogram equalization technique in ERDAS Imagine version 9.1 software was used to enhance the quality of each of the combined images for simplifying visual interpretability. Thereafter, images were corrected using the ENVI 5.1 FLAASH module to eliminated any atmospheric effects. All images were projected using the Universal Transverse Mercator (UTM) coordinate system of the WGS 1984, zone 37S datum so as to align them with other data of the study area.
The pre-processed image was then classified to generate the land-use land-cover status of the area. The image classification process was undertaken by maximum likelihood algorithm using a supervised classification technique. Generally, the classification involved selection and digitization of known pixels “training sites” defined by the user, which guided the software in categorizing all pixels into respective land-cover classes based on the spectral signatures. The classification process was performed using ArcGIS 10.5 software. The area was classified into seven land classes: agriculture, built-up land, forest, bushland, grassland, water and wetland vegetation. A description of these land-cover classes is presented in Table 1.
During land-cover classification, the annual change rates were calculated to show the rate of change per year within each specific 10-year (decadal) interval by using the formula below:
( LC f LC i LC i ) × 100 t f t i  
where LCf is the land coverage area for the final, LCi is the land coverage area for the initial year, tf is the final time period and ti is the initial time period.

2.4. Accuracy Assessment for Land-Cover Classification

The next step after the classification process was to determine how the classified land-use land-cover classification aligned with reality. This objective was realized using a more accurate image of 2016 with 10 m spatial resolution from Sentinel-2 that was downloaded and used to extract and compare its pixel-based information with the classified imagery. In the first step of this post-classification process, 1000 accuracy assessment points were specified and randomly distributed to extract pixel values of the classified imagery. Next, the obtained results of the point shapefiles were updated with the ground-truth values from the Sentinel image. Last, the final files with complete pixel values were used to compute confusion matrixes, providing overall accuracy results, as presented in Section 3.1, below.

3. Results and Discussions

3.1. Accuracy Assessment Results

The accuracy results show that all imagery—i.e., for the years 1990, 2000, 2010 and 2019—were correctly classified, with kappa coefficients of 79, 91, 90 and 85%, respectively. According to the classification schemes by Anderson [25], these results, presented in detail in Table 2, Table 3, Table 4 and Table 5, provide evidence of sufficient reliability for assessing the detected land-cover changes in the studied area. Furthermore, the other overall accuracy results—for example, for the year 2019—show similarity with the image of 2018 that was classified and assessed using the same approach as used in a study by Jamila et al. [7]. This matching implies that, in addition to the compliance with standards, the results of accuracy obtained in this study are also common in other research that involved the Msimbazi Basin. When observing all classes individually, the areas of agriculture and water, especially for the images of 2010 and 2019, showed lower accuracy results compared with others. In general, many reasons for the imprecision in the accuracy for some classes in LULC studies can be argued, including the occurrence of natural disasters such as floods due to seasonal variations [26]. However, in this case, the researchers view this cause as being insignificant because all images were taken during the dry season, i.e., June to October. Rather, the invasion and instability of land-use activities, particularly in such prime areas of water and agriculture, could be the main reason for frequent land cover changes, which when compared with static references provide significant mismatches of their reflectance.

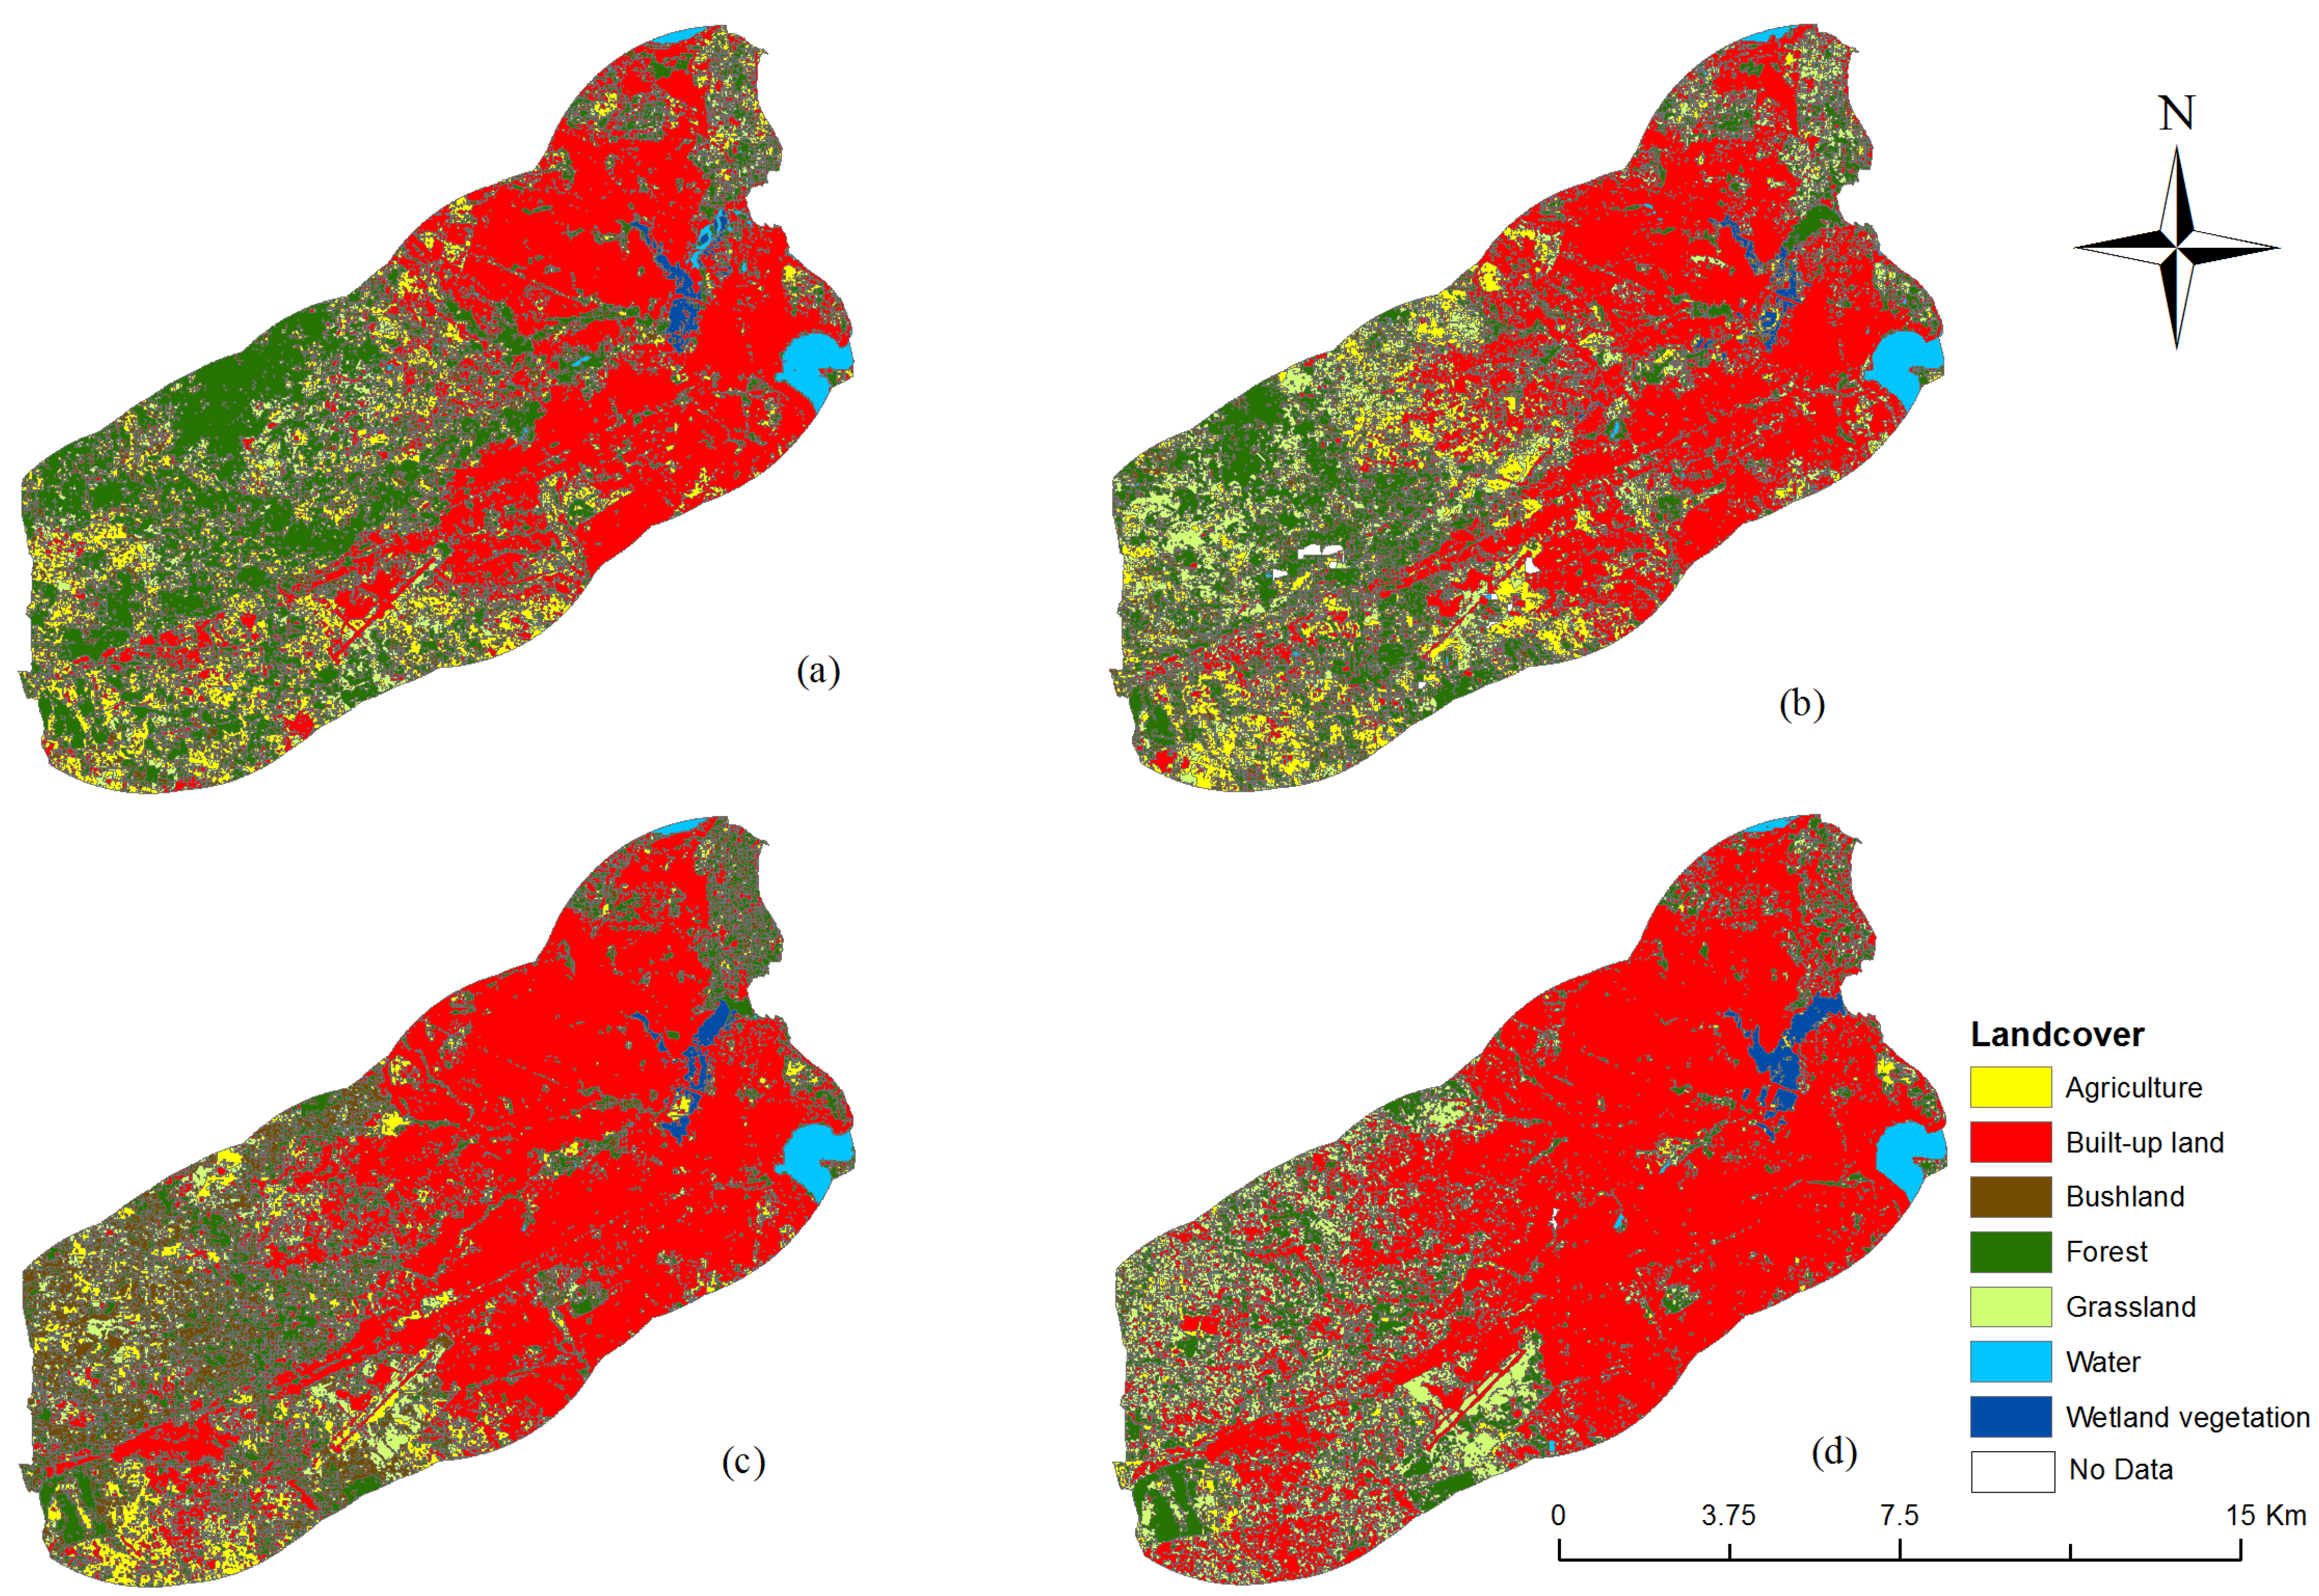
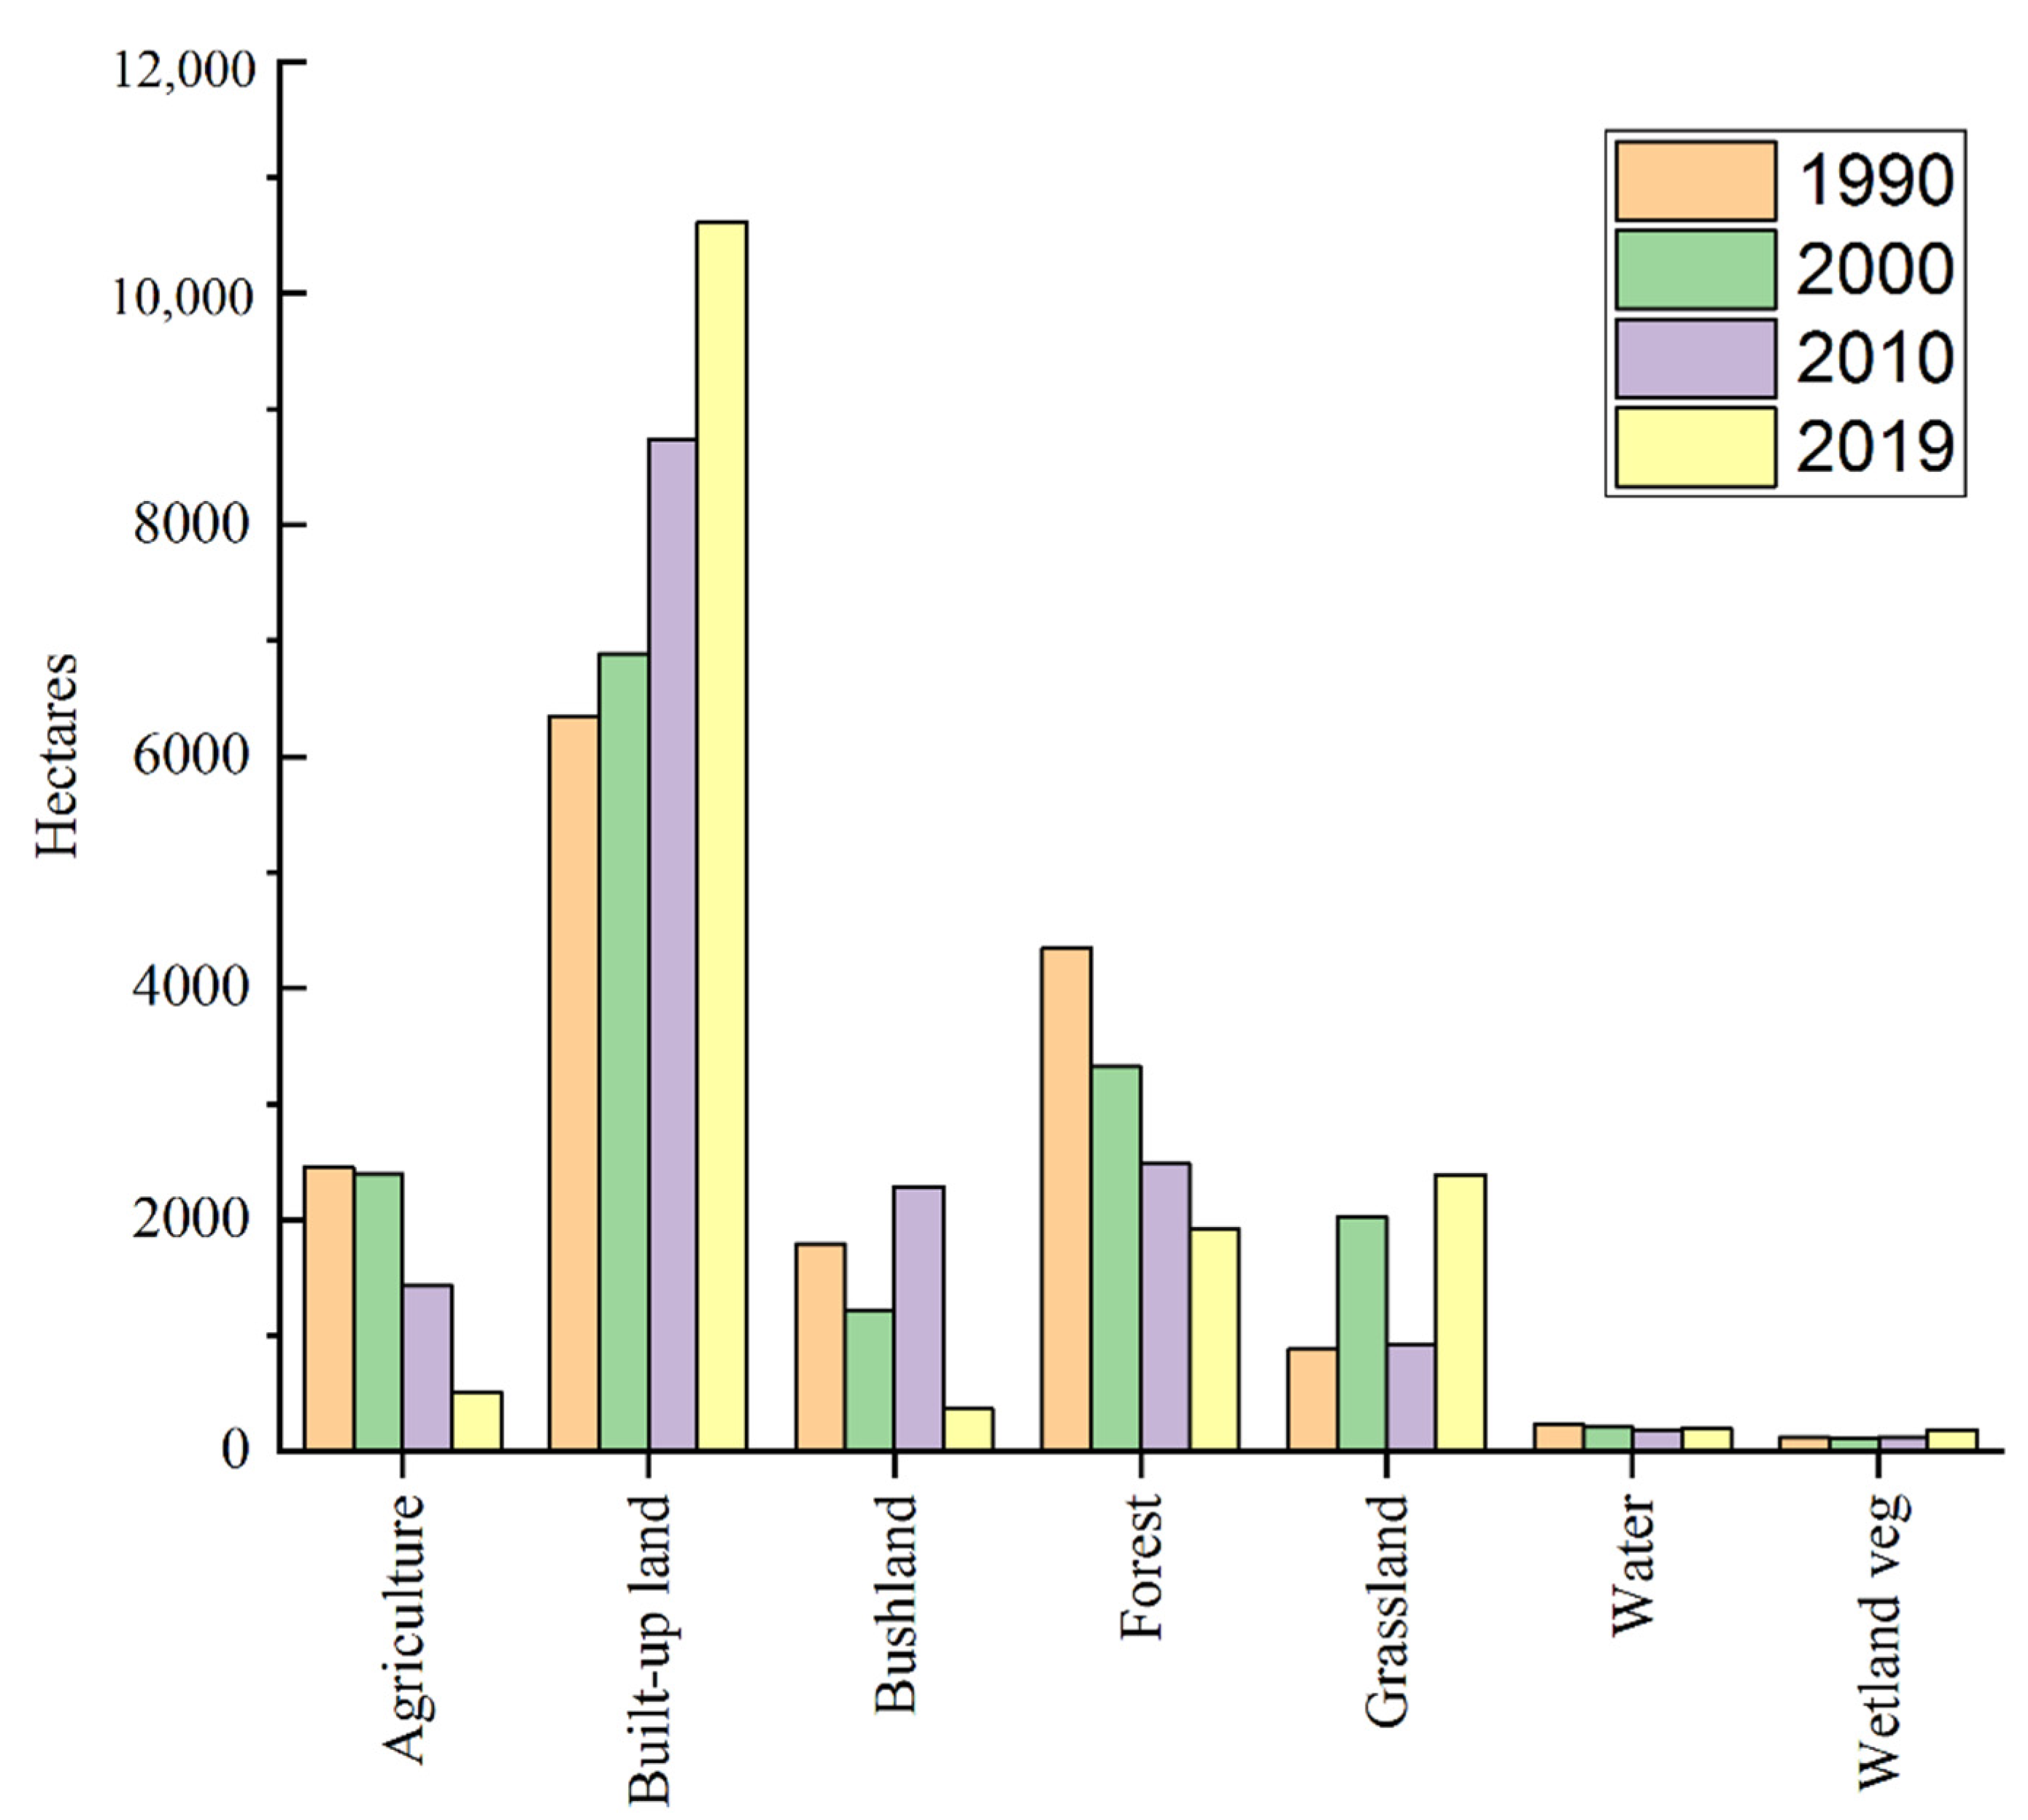
3.2. Trend and Extent of Land-Use Land-Cover Change

The LULC maps for 1990, 2000, 2010 and 2019 generated from the Landsat images are presented in Figure 2. The distribution and extent of changes are shown in Table 6 and Figure 3. From the table, it can be clearly observed that built-up land has dominated and increased tremendously from 6348 ha (39.3%) in 1990 to 10,612ha (65.6%) in 2019. Further analysis revealed that in 1990, the land covered by built-up land and forest comprised 66.2% of all land use, whereas in the most recent period (2019), 66.5% of land cover came from built-up land alone. This implies that the increase in built-up land has generally been to satisfy the growing population’s demands at the expense of the forests [27]. The majority of people depend on the forest’s resources—i.e., firewood, charcoal, timber and medicinal herbs—for sustaining their livelihood. These findings also comport with land-cover change detection along the Tanzanian coast researched by Wang [28].
Despite the decrease in forest land cover, the wetland vegetation still increased gradually from 104 ha in 2000 to 184 ha in 2019. This situation has shown similarity with the mangrove dynamics study conducted along the mainland coast by Wang [29]. It is possible that one of the reasons is due to its location being at the river mouth, which is prone to the effects of the sea. In this respect, the area is found waterlogged almost in all seasons of the year; thus, the area cannot provide a chance for the construction of dwellings. Apart from its geographic position, the government’s initiatives under its national Integrated Coastal Management (ICM) strategies of 2002 have contributed by protecting mangroves (wetland vegetation) that were earlier stressed when used for domestic energy (e.g., firewood and charcoals) by inhabitants [29].
Conversely, the areas occupied by agriculture were shown to decrease significantly, with the greatest change over the latter period from 2010 to 2019, in which a sharp decrease of 7% was realized (Figure 3). Agriculture activity by urban dwellers is getting scarce elsewhere in developing countries due to land scarcity arising from rapid population growth [30]. Likewise, the decrease in agricultural land use in our study is greatly associated with urbanization (Figure 2a–d and Figure 3) where people access surrounding land for establishing settlements. In addition, agricultural land in the area was found to be polluted with heavy metals from the industrial discharges that ultimately degraded the soil fertility, thus making the land unfit for cultivation [15,31,32,33]. With time, the abandoned unfertile land transformed into bushland and grassland [34]. The area covered with grassland increased at a rate of 12.9% per year and 17.7% per year between the periods 1990 and 2000 and between 2010 and 2019, respectively. Possibly, this increase is linked to the slash and burn practices under shifting cultivation, increasingly cutting down trees and expanding urban areas [35,36].

3.3. Urbanization and Its Implication on the Wetland

Considering the analysis results of LULC, built-up land has drawn much attention in this study. In most peri-urban areas, the expansion of built-up land is merely attributed to increases in population. As such, the increasing population in conjunction with rapid urban expansion and industrial activities mostly contributes to threats to the natural environment and the entire ecosystem [37,38]. Environmental unsustainability occurs when the demand rate for resources becomes higher than the rate of resources provision required for eco-friendly economic growth. In Dar es Salaam, the population growth rate is one of the highest among other cities in sub-Saharan Africa [39]; it is a city in which most people are known to concentrate in the Kinondoni district, which the Msimbazi River traverses. This is reflected in Figure 4, which shows how the population of the Msimbazi area is increasing in parallel with the Dar es Salaam population. Census data from National Bureau of Statistics has shown that Msimbazi had a total population of 1.1 million in 1988, which was projected to be an estimated 2019 population of about 3.7 million (Table 7). Generally, this tremendous increase in the population is a consequence of three factors: high birth and fertility rates, reclassification of rural land into urban areas and rural-to-urban migration [40,41,42]. The majority of people migrate into urban areas in search of a better livelihood, social services and economic opportunities [43,44].
Looking at this vast demographic growth on the one hand has positive effects on socio-economic development. On the other hand, the population growth seemed to account for the stresses on the riverine system, as observed in zones A, B and C in Figure 5. The reasons behind this trend could be that the Msimbazi area is characterized by informal settlements [45], and most of its dwellers use the benefits of water availability and soil fertility to engage in irrigation farming along the riverbanks [46,47]. Spatially, it is observed that the eastward area extends towards the city center, thus providing many business opportunities that attract people to migrate and live in the nearby surrounding area [48,49]. Certainly, the business opportunities have increased the demand for agricultural products (vegetables and fruits) in town markets, and as a result, over time, many people along the river have continued to cultivate and stress the valley system for economic gain [15,46]. In fact, stresses arising from continuing intense pressure exerted on the land are diverse depending on the nature of disturbances. For instance, unplanned spatial expansion and over-cultivation along the valley clogs the drainage systems, increases surface run-off and leads to frequent floods [50,51]. Furthermore, because of the potential escalation of environmental pollution (air, water and land), the agricultural and marine products of these resources will therefore be harmful for human consumption [14,31,52].

3.4. Policy and Legal Insights into Wetlands Management

Despite the stresses caused by socio-economic gains, the study area lacks a comprehensive legal framework for governing sustainable resource utilization. This could be justified based on the fact that the management of wetlands in Tanzania depends on directives from multi-sectoral organs with stakes in the resources contained therein [47,53,54]. In this respect, other parts of the wetlands that are of little or no concern to those organs (sectors) are easily vulnerable to anthropogenic activities that degrade the wetlands through pollution, erosion and the loss of its biodiversity. Currently, the Wildlife Division (WD) under the Ministry of Natural Resources and Tourism is in charge of overseeing all wetlands in the country. However, its scope of management is limited only to the areas found within wildlife reserves [47,53], i.e., other wetlands in rural or urban areas (Msimbazi, in this case) receive almost no attention from the WD.
Notwithstanding the lack of specific policy on wetland management, the adopted policy since the year 2000 for the conservation of Ramsar sites seems to recognize few wetlands (about 5.5% of all wetlands) falling within the criteria stipulated by the convention [53]. This implies that even if the WD could extend its scope to include all Ramsar sites, a large percentage of the wetlands would still continue to rely on multi-sectoral directives that essentially focus on providing sustainable use of specific resources owned by the wetlands. The water sector for example uses its Water Policy of 2007 and Resource Management Act No.11 of 2009 to define wetlands as sources of water that need to be protected together with their aquatic biodiversity. Similar objectives are realized from the environmental sector that uses its Environment Policy of 1997 and Management Act No. 20 of 2004 to recognize wetlands as fragile ecosystems that play an important role in water systems. Generally, these two sectors focus on the management and conservation of wetlands as sources of water, and therefore they have limited scope when it comes to protecting the buffer zones of 60 or 120 m [45].
It is for this reason that the land sector within either urban or district councils appears to be the main concern for managing wetlands at-large and beyond the jurisdiction of the WD and other dedicated sectors such as Forestry and Fishery. The National Land Policy of 1995 and its subsequent Land and Village Acts of 1999 have set guidelines for sustainable land use in urban and rural areas. In line with this objective, the guideline clearly defined wetlands as the “wastelands” that are not useful for social and economic development. However, in other sections, the guideline seemed to present a contradiction by encouraging developments that benefit the public and the local community [54]. Hence, this study argues that to some extent, such loopholes weaken implementation of the law, and consequently offer opportunities for people to encroach upon and stress the wetlands, as explained earlier in the study.

4. Conclusions

In the findings of this research, various changes on the land-cover pattern in this area of study are demonstrated through the decrease and increase in certain classes of land cover. Built-up land has been dominant among others and has shown a steady increase at the expense of forest and agriculture. Conversion of agricultural land is likely the result of soil and water pollution due to rapid urbanization with unplanned settlements. Population growth and urban expansion are the main drivers of wetland degradation and other weather-related disasters, such that continuing exposure to drought, floods and pollution will most probably have an adverse impact on the health and livelihood of vulnerable communities. Moreover, findings also indicate that wetland restoration and sustainability have been a challenge for environmental officials due to the deficiencies in policy and law that specifically govern wetlands utilization. This calls for assorted approaches among decision makers and various stakeholders for strengthening sustainable utilization through establishing effective policy and legislation, as well as educating the local communities on how to wisely use wetlands resources. In general, these findings provide the key for sustaining the river and wetland systems in urban areas, even though more promising results could be achieved if all the datasets were available for the exact times of the studied period. There was a slight deviation in the time period for the population data, and the resulting lack of data led to a projection of values for the year 2019. Despite the gap, all data revealed realistic characterizations of the study area. Overall, this study recommends the preservation of wetland and the restriction of certain activities, such as cultivation and building along wetland peripheries, for the benefit of both the current and the future population.

Author Contributions

Conceptualization, H.M., Y.Z., J.M. and D.S.; investigation, H.M. and Y.Z.; software, H.M., D.S. and J.M.; validation, J.M., D.S. and H.M.; methodology, J.M. and H.M.; data curation, H.M., D.S. and J.M.; formal analysis, H.M., J.M. and Y.Z.; writing—original draft preparation, H.M. and J.M.; writing—review & editing, H.M. and Y.Z.; visualization, H.M., D.S. and J.M.; supervision, Y.Z.; funding acquisition, Y.Z.; All authors have read and agreed to the version of the manuscript.

Funding

This work was funded by the NSFC Project Number: 41476151 and “China-Africa Universities 20+20 Cooperation Plan” by the Ministry of Education of China.

Institutional Review Board Statement

Not applicable/study not involving humans or animals.

Informed Consent Statement

Not applicable/study not involving humans.

Data Availability Statement

All data used in this study are contained within the article.

Acknowledgments

We appreciate the support given by our colleagues during data collection, as well as their valuable suggestions that helped in improving the manuscript. The first author would like to thank the Chinese Scholarship Council for sponsoring her studies in China.

Conflicts of Interest

The authors declare no conflict of interest.

References

  1. Hu, S.; Niu, Z.; Chen, Y.; Li, L.; Zhang, H. Global wetlands: Potential distribution, wetland loss, and status. Sci. Total Environ. 2017, 586, 319–327. [Google Scholar] [CrossRef]
  2. World Resources Institute. Millennium Ecosystem Assessment: Ecosystems and Human Well-Being: Wetlands and Water; World Resources Institute: Washington, DC, USA, 2005. [Google Scholar]
  3. Mwakaje, A. Wetlands, livelihoods and sustainability in Tanzania. Afr. J. Ecol. 2009, 47, 179–184. [Google Scholar] [CrossRef]
  4. Uluocha, N.O.; Okeke, I.C. Implications of wetlands degradation for water resources management: Lessons from Nigeria. GeoJournal 2004, 61, 151–154. [Google Scholar] [CrossRef]
  5. Isunju, J.B.; Kemp, J. Spatiotemporal analysis of encroachment on wetlands: A case of Nakivubo wetland in Kampala, Uganda. Environ. Monit. Assess. 2016, 188, 203. [Google Scholar] [CrossRef] [PubMed]
  6. Omagor, J.G. Effect of human wetland encroachment on the degradation of Lubigi Wetland System, Kampala City Uganda. Environ. Ecol. Res. 2018, 6, 562–570. [Google Scholar]
  7. Ngondo, J.; Mango, J.; Liu, R.; Nobert, J.; Dubi, A.; Cheng, H. Land-Use and Land-Cover (LULC) Change Detection and the Implications for Coastal Water Resource Management in the Wami–Ruvu Basin, Tanzania. Sustainability 2021, 13, 4092. [Google Scholar] [CrossRef]
  8. Schuyt, K.D. Economic consequences of wetland degradation for local populations in Africa. Ecol. Econ. 2005, 53, 177–190. [Google Scholar] [CrossRef]
  9. Liu, G.; Zhang, L.; Zhang, Q.; Musyimi, Z.; Jiang, Q. Spatio–temporal dynamics of wetland landscape patterns based on remote sensing in Yellow River Delta, China. Wetlands 2014, 34, 787–801. [Google Scholar] [CrossRef]
  10. Kalisa, D.; Majule, A.; Lyimo, J.G. Role of wetlands resource utilization on community livelihoods: The case of Songwe River Basin, Tanzania. Afr. J. Agric. Res. 2013, 8, 6457–6467. [Google Scholar]
  11. Wang, M.; Qi, S.; Zhang, X. Wetland loss and degradation in the Yellow River Delta, Shandong Province of China. Environ. Earth Sci. 2012, 67, 185–188. [Google Scholar] [CrossRef]
  12. Mondal, B.; Dolui, G.; Pramanik, M.; Maity, S.; Biswas, S.S.; Pal, R. Urban expansion and wetland shrinkage estimation using a GIS-based model in the East Kolkata Wetland, India. Ecol. Indic. 2017, 83, 62–73. [Google Scholar] [CrossRef]
  13. Bushesha, M.S.; Mbura, J.A. Identification of Reasons for and Socio-Economic Impacts of Persistent Floods in Dar Es Salaam. World J. Soc. Sci. Res. 2015, 2, 180. [Google Scholar] [CrossRef]
  14. De Risi, R.; De Paola, F.; Turpie, J.; Kroeger, T. Life Cycle Cost and Return on Investment as complementary decision variables for urban flood risk management in developing countries. Int. J. Disaster Risk Reduct. 2018, 28, 88–106. [Google Scholar] [CrossRef]
  15. John, R.; Magina, F.B.; Kemwita, E.F. From Msimbazi River Valley to Mabwepande Settlement: The Resettlement Process and Its Challenges. Curr. Urban Stud. 2019, 7, 399–426. [Google Scholar] [CrossRef] [Green Version]
  16. Mwegoha, W.J.S.; Kihampa, C. Heavy metal contamination in agricultural soils and water in Dar es Salaam city, Tanzania. Afr. J. Environ. Sci. Technol. 2010, 4, 763–769. [Google Scholar]
  17. Leonard, L.S.; Mwegoha, W.J.S.; Kihampa, C. Heavy metal pollution and urban agriculture in Msimbazi river valley: Health risk and public awareness. Int. J. Plant Anim. Environ. Sci. 2012, 2, 107–118. [Google Scholar]
  18. Shimba, M.J.; Mkude, I.T.; Jonah, F.E. Impacts of waste on macroinvertebrate assemblages of Msimbazi River, Tanzania. Int. J. Biodivers. Conserv. 2018, 10, 106–116. [Google Scholar]
  19. Sawe, S.F.; Shilla, D.A.; Machiwa, J.F. Assessment of enrichment, geo-accumulation and ecological risk of heavy metals in surface sediments of the Msimbazi mangrove ecosystem, coast of Dar es Salaam, Tanzania. Chem. Ecol. 2019, 35, 834–844. [Google Scholar] [CrossRef]
  20. Wang, X.; Ning, L.; Yu, J.; Xiao, R.; Li, T. Changes of urban wetland landscape pattern and impacts of urbanization on wetland in Wuhan City. Chin. Geogr. Sci. 2008, 18, 47–53. [Google Scholar] [CrossRef] [Green Version]
  21. Ehrenfeld, J.G. Evaluating wetlands within an urban context. Urban Ecosyst. 2000, 4, 69–85. [Google Scholar] [CrossRef]
  22. Morin, T.; Bohrer, G.; Naor-Azrieli, L.; Mesi, S.; Kenny, W.; Mitsch, W.; Schäfer, K. The seasonal and diurnal dynamics of methane flux at a created urban wetland. Ecol. Eng. 2014, 72, 74–83. [Google Scholar] [CrossRef]
  23. Kim, K.-G.; Lee, H.; Lee, N.-H. Wetland restoration to enhance biodiversity in urban areas: A comparative analysis. Landsc. Ecol. Eng. 2011, 7, 27–32. [Google Scholar] [CrossRef]
  24. Sawe, S.F.; Shilla, D.A.; Machiwa, J.F. Lead (Pb) contamination trends in Msimbazi estuary reconstructed from 210Pb-dated sediment cores (Msimbazi River, Tanzania). J. Environ. Forensics 2021, 22, 99–107. [Google Scholar] [CrossRef]
  25. Anderson, J.R.; Hardy, E.E.; Roach, J.T.; Witmer, R.E. A Land Use and Land Cover Classification System for Use with Remote Sensor Data; US Government Printing Office: Washington, DC, USA, 1976; 964p.
  26. Najibi, N.; Devineni, N. Recent trends in the frequency and duration of global floods. Earth Syst. Dyn. 2018, 9, 757–783. [Google Scholar] [CrossRef] [Green Version]
  27. Nzunda, N.; Munishi, P.; Soka, G.E.; Monjare, J.F. Influence of socio-economic factors on land use and vegetation cover changes in and around Kagoma forest reserve in Tanzania. Ethiop. J. Environ. Stud. Manag. 2013, 6, 480–488. [Google Scholar] [CrossRef]
  28. Wang, Y.; Tobey, J.; Bonynge, G.; Nugranad, J.; Makota, V.; Ngusaru, A.; Traber, M. Involving geospatial information in the analysis of land-cover change along the Tanzania coast. Coast. Manag. 2005, 33, 87–99. [Google Scholar] [CrossRef]
  29. Wang, Y.; Bonynge, G.; Nugranad, J.; Traber, M.; Ngusaru, A.; Tobey, J.; Hale, L.; Bowen, R.; Makota, V. Remote Sensing of Mangrove Change Along the Tanzania Coast. Mar. Geod. 2003, 26, 35–48. [Google Scholar] [CrossRef]
  30. Forkuor, G.; Cofie, O. Dynamics of land-use and land-cover change in Freetown, Sierra Leone and its effects on urban and peri-urban agriculture—A remote sensing approach. Int. J. Remote Sens. 2011, 32, 1017–1037. [Google Scholar] [CrossRef]
  31. Bahemuka, T.; Mubofu, E.B. Heavy metals in edible green vegetables grown along the sites of the Sinza and Msimbazi rivers in Dar es Salaam, Tanzania. Food Chem. 1999, 66, 63–66. [Google Scholar] [CrossRef]
  32. Kihampa, C.; Mwegoha, W.J. Heavy metals accumulation in vegetables grown along the Msimbazi River in Dar es Salaam, Tanzania. Int. J. Biol. Chem. Sci. 2010, 4, 6. [Google Scholar] [CrossRef]
  33. Chanzi, G. Heavy Metal Pollution Assessment along Msimbazi River, Tanzania. J. Sci. Res. Rep. 2017, 17, 1–8. [Google Scholar] [CrossRef]
  34. Rautiainen, A.; Virtanen, T.; Kauppi, P.E. Land cover change on the Isthmus of Karelia 1939–2005: Agricultural abandonment and natural succession. Environ. Sci. Policy 2016, 55, 127–134. [Google Scholar] [CrossRef]
  35. Kashaigili, J.; Majaliwa, A. Integrated assessment of land use and cover changes in the Malagarasi river catchment in Tanzania. Phys. Chem. Earth Parts A/B/C 2010, 35, 730–741. [Google Scholar] [CrossRef]
  36. Hyandye, C.; Mandara, C.G.; Safari, J. GIS and logit regression model applications in land use/land cover change and distribution in Usangu catchment. Am. J. Remote Sens. 2015, 3, 6–16. [Google Scholar] [CrossRef] [Green Version]
  37. Kebede, A.S.; Nicholls, R.J. Exposure and vulnerability to climate extremes: Population and asset exposure to coastal flooding in Dar es Salaam, Tanzania. Reg. Environ. Chang. 2012, 12, 81–94. [Google Scholar] [CrossRef]
  38. Athukorala, D.; Estoque, R.C.; Murayama, Y.; Matsushita, B. Impacts of Urbanization on the Muthurajawela Marsh and Negombo Lagoon, Sri Lanka: Implications for Landscape Planning towards a Sustainable Urban Wetland Ecosystem. Remote Sens. 2021, 13, 316. [Google Scholar] [CrossRef]
  39. Parsa, A.; Nakendo, F.; McCluskey, W.J.; Page, M.W. Impact of formalization of property rights in informal settlements: Evidence from Dar es Salaam city. Land Use Policy 2011, 28, 695–705. [Google Scholar] [CrossRef]
  40. Kangalawe, R.Y.; Lyimo, J.G. Population dynamics, rural livelihoods and environmental degradation: Some experiences from Tanzania. Environ. Dev. Sustain. 2010, 12, 985–997. [Google Scholar] [CrossRef]
  41. Hambati, H. Weathering the storm: Disaster risk and vulnerability assessment of informal settlements in Mwanza city, Tanzania. Int. J. Environ. Stud. 2013, 70, 919–939. [Google Scholar] [CrossRef]
  42. Buhaug, H.; Urdal, H. An urbanization bomb? Population growth and social disorder in cities. Glob. Environ. Chang. 2013, 23, 1–10. [Google Scholar] [CrossRef]
  43. Kombe, W.J. Land use dynamics in peri-urban areas and their implications on the urban growth and form: The case of Dar es Salaam, Tanzania. Habitat Int. 2005, 29, 113–135. [Google Scholar] [CrossRef]
  44. Kayombo, M.C.; Mayo, A.W. Assessment of Microbial Quality of Vegetables Irrigated with Polluted Waters in Dar es Salaam City, Tanzania. Environ. Ecol. Res. 2018, 6, 229–239. [Google Scholar] [CrossRef]
  45. Kironde, J.M.L. Governance deficits in dealing with the plight of dwellers of hazardous land: The case of the Msimbazi River Valley in Dar es Salaam, Tanzania. Curr. Urban Stud. 2016, 4, 303–328. [Google Scholar] [CrossRef] [Green Version]
  46. Palela, E. The Impacts of Anthropogenic Factors on Urban Wetlands: The Case of Msimbazi Valley. Master's Thesis, University of Dar es Salaam, Dar es Salaam, Tanzania, 2000. [Google Scholar]
  47. Collier, P.; Jones, P. Transforming dar es salaam into a city that work. Tanzan. Path Prosper. 2017, 86, 86–104. [Google Scholar]
  48. Sauka, S. Climate Resilience in Developing Cities: Msimbazi Basin, Dar es Salaam; Report on Policy Insights; South African Institute of International Affairs: Johannesburg, South Africa, 2019. [Google Scholar]
  49. Turpie, J.; Kroeger, T.; De Risi, R.; de Paola, F.; Letley, G.; Forsythe, K.; Day, L. Return on Investment in Green Urban Development: Amelioration of Flood Risk in the Msimbazi River Catchment; World Bank: Dar Es Salaam, Tanazania, 2017. [Google Scholar]
  50. Kikwasi, G.; Mbuya, E. Vulnerability analysis of building structures to floods: The case of flooding informal settlements in Dar es salaam, Tanzania. Int. J. Build. Pathol. Adapt. 2019, 37, 2398–4708. [Google Scholar] [CrossRef]
  51. Aselina, M.A. Levels of Industrial Pollutants and Their Effects on Water Resources and Livelihoods Along Msimbazi Sub catchment. Ph.D. Thesis, Kenyatta University, Dar es Salaam, Tanzania, September 2014. [Google Scholar]
  52. Materu, S.F.; Urban, B.; Heise, S. A critical review of policies and legislation protecting Tanzanian wetlands. Ecosyst. Health Sustain. 2018, 4, 310–320. [Google Scholar] [CrossRef]
  53. Mombo, F.; Speelman, S.; Hella, J.; Van Huylenbroeck, G. How characteristics of wetlands resource users and associated institutions influence the sustainable management of wetlands in Tanzania. Land Use Policy 2013, 35, 8–15. [Google Scholar] [CrossRef]
  54. MLHUD. National Land Policy; The Ministry of Lands and Human Settlements: Dar es Salaam, Tanzania, 1995.
Figure 1. Map of Dar es Salaam showing location of the study area.
Land 10 01139 g001
Figure 2. Land-use land-cover maps for (a) 1990, (b) 2000, (c) 2010 and (d) 2019.
Land 10 01139 g002
Figure 3. Chart showing the extent of land-use land-cover changes between 1990 and 2019.
Land 10 01139 g003
Figure 4. Population growth trend of Dar es Salaam and Msimbazi (1988–2019).
Land 10 01139 g004
Figure 5. Population distribution maps by wards in 1988, 2002 and 2012.
Land 10 01139 g005
Table 1. Land-use land-cover classes used in the classification.
Land-Use ClassDescription
AgricultureLand used for agriculture, including paddy fields, irrigated and dry farmland, vegetation and fruit gardens, etc.
GrasslandLand covered by grasses mainly used for grazing.
ForestNatural and secondary forest covered with trees, including woodlands and dense and open forests.
BushlandLand that is dominated by bushes.
Wetland vegetationLand consisting of shallow water bodies and wetland plants, such as mangroves, and salt marshes.
WaterLand covered by water bodies such as rivers, lakes and ponds.
Built-up landLand that was modified by human activity, including residential, industrial, transportation and other infrastructures.
Table 2. Accuracy assessment results of LULC classification for image of 1990.
LULCGround Truth Pixels
Wetland VegetationBushlandForestGrasslandAgricultureBuilt-UpWaterTotalU-AccuracyKappa
Wetland vegetation400000041-
Bushland719000110350.513514-
Forest211208003002600.8-
Grassland00030060360.833333-
Agriculture41238110290.275862-
Built-up5100261136220.982315-
Water20000012140-
Total432221033106691510020-
P-Accuracy0.9030230.8636360.990.9090910.80.91330.800.89022-
Kappa---------0.792278
Table 3. Accuracy assessment results of LULC classification for image of 2000.
LULCGround Truth Pixels
Wetland VegetationBushlandForestGrasslandAgricultureBuilt-UpWaterTotalU-AccuracyKappa
Wetland vegetation44100010460.956522-
Bushland11421030210.666667-
Forest1121810802290.951965-
Grassland10241091540.759259-
Agriculture0103340110.272727-
Built-up1120162716330.990521-
Water0010009100.9-
Total48182254646521110040-
P-Accuracy0.9166670.7777780.9688890.8913040.750.9616560.81800.952191-
Kappa---------0.910515
Table 4. Accuracy assessment results of LULC classification for image of 2010.
LULCGround Truth Pixels
Wetland VegetationBushlandForestGrasslandAgricultureBuilt-UpWaterTotalU-AccuracyKappa
Wetland vegetation39000011410.95122-
Bushland02113030280.75-
Forest2021620812290.943231-
Grassland11024030290.827586-
Agriculture0020782190.368421-
Built-up113o363916480.986111-
Water000000881-
Total432322229106631210020-
P-Accuracy0.9069770.9130430.9729730.8275860.70.9638010.58333300.951098-
Kappa---------0.904584
Table 5. Accuracy assessment results of LULC classification for image of 2019.
LULCGround Truth Pixels
Wetland VegetationBushlandForestGrasslandAgricultureBuilt-UpWaterTotalU-AccuracyKappa
Wetland vegetation29000010300.966667-
Bushland01920010220.863636-
Forest3019000411980.959596-
Grassland026320200600.533333-
Agriculture1041611140.428571-
Built-up03133364526690.964126-
Water000000881-
Total33242153696721210010-
P-Accuracy0.879780.7916670.8837210.8888890.6666670.9598210.66666700.928072-
Kappa---------0.857554
Table 6. Land-use land-cover status and change between 1990 and 2019.
Land-Use TypesLand-CoverAnnual Change Rate
Year: 1990Year: 2000Year: 2010Year: 20191990–20002000–20102010–2019
Ha%Ha%Ha%Ha%%%%
Agriculture245015.2239614.814308.85093.1−0.2−4.0−7.2
Built-up 634839.3688742.6874254.110,61265.60.82.72.4
Bushland179311.112227.6228714.13632.2−3.28.7−9.3
Forest434426.9332720.6248315.4191711.9−2.3−2.5−2.5
Grassland8825.5201912.59205.7238814.812.9−5.417.7
Water 2261.42111.31831.11921.2−0.7−1.30.5
Wetland vegetation1230.81040.61230.81841.1−1.51.85.5
TOTAL16,166100.016,166100.016,168100.016,165100.0
Table 7. Population census and growth rate of Msimbazi (1988–2019).
Population (in Millions)Average Growth Rate
Year: 1988Year: 2002Year: 2012Year: 20191988–20022002–20122012–2019
1.11.72.53.73.03.85.7
Publisher’s Note: MDPI stays neutral with regard to jurisdictional claims in published maps and institutional affiliations.

