
Evaluation of Tourism Development Potential on Provinces along the Belt and Road in China: Generation of a Comprehensive Index System


Abstract
:1. Introduction
2. Literature Review
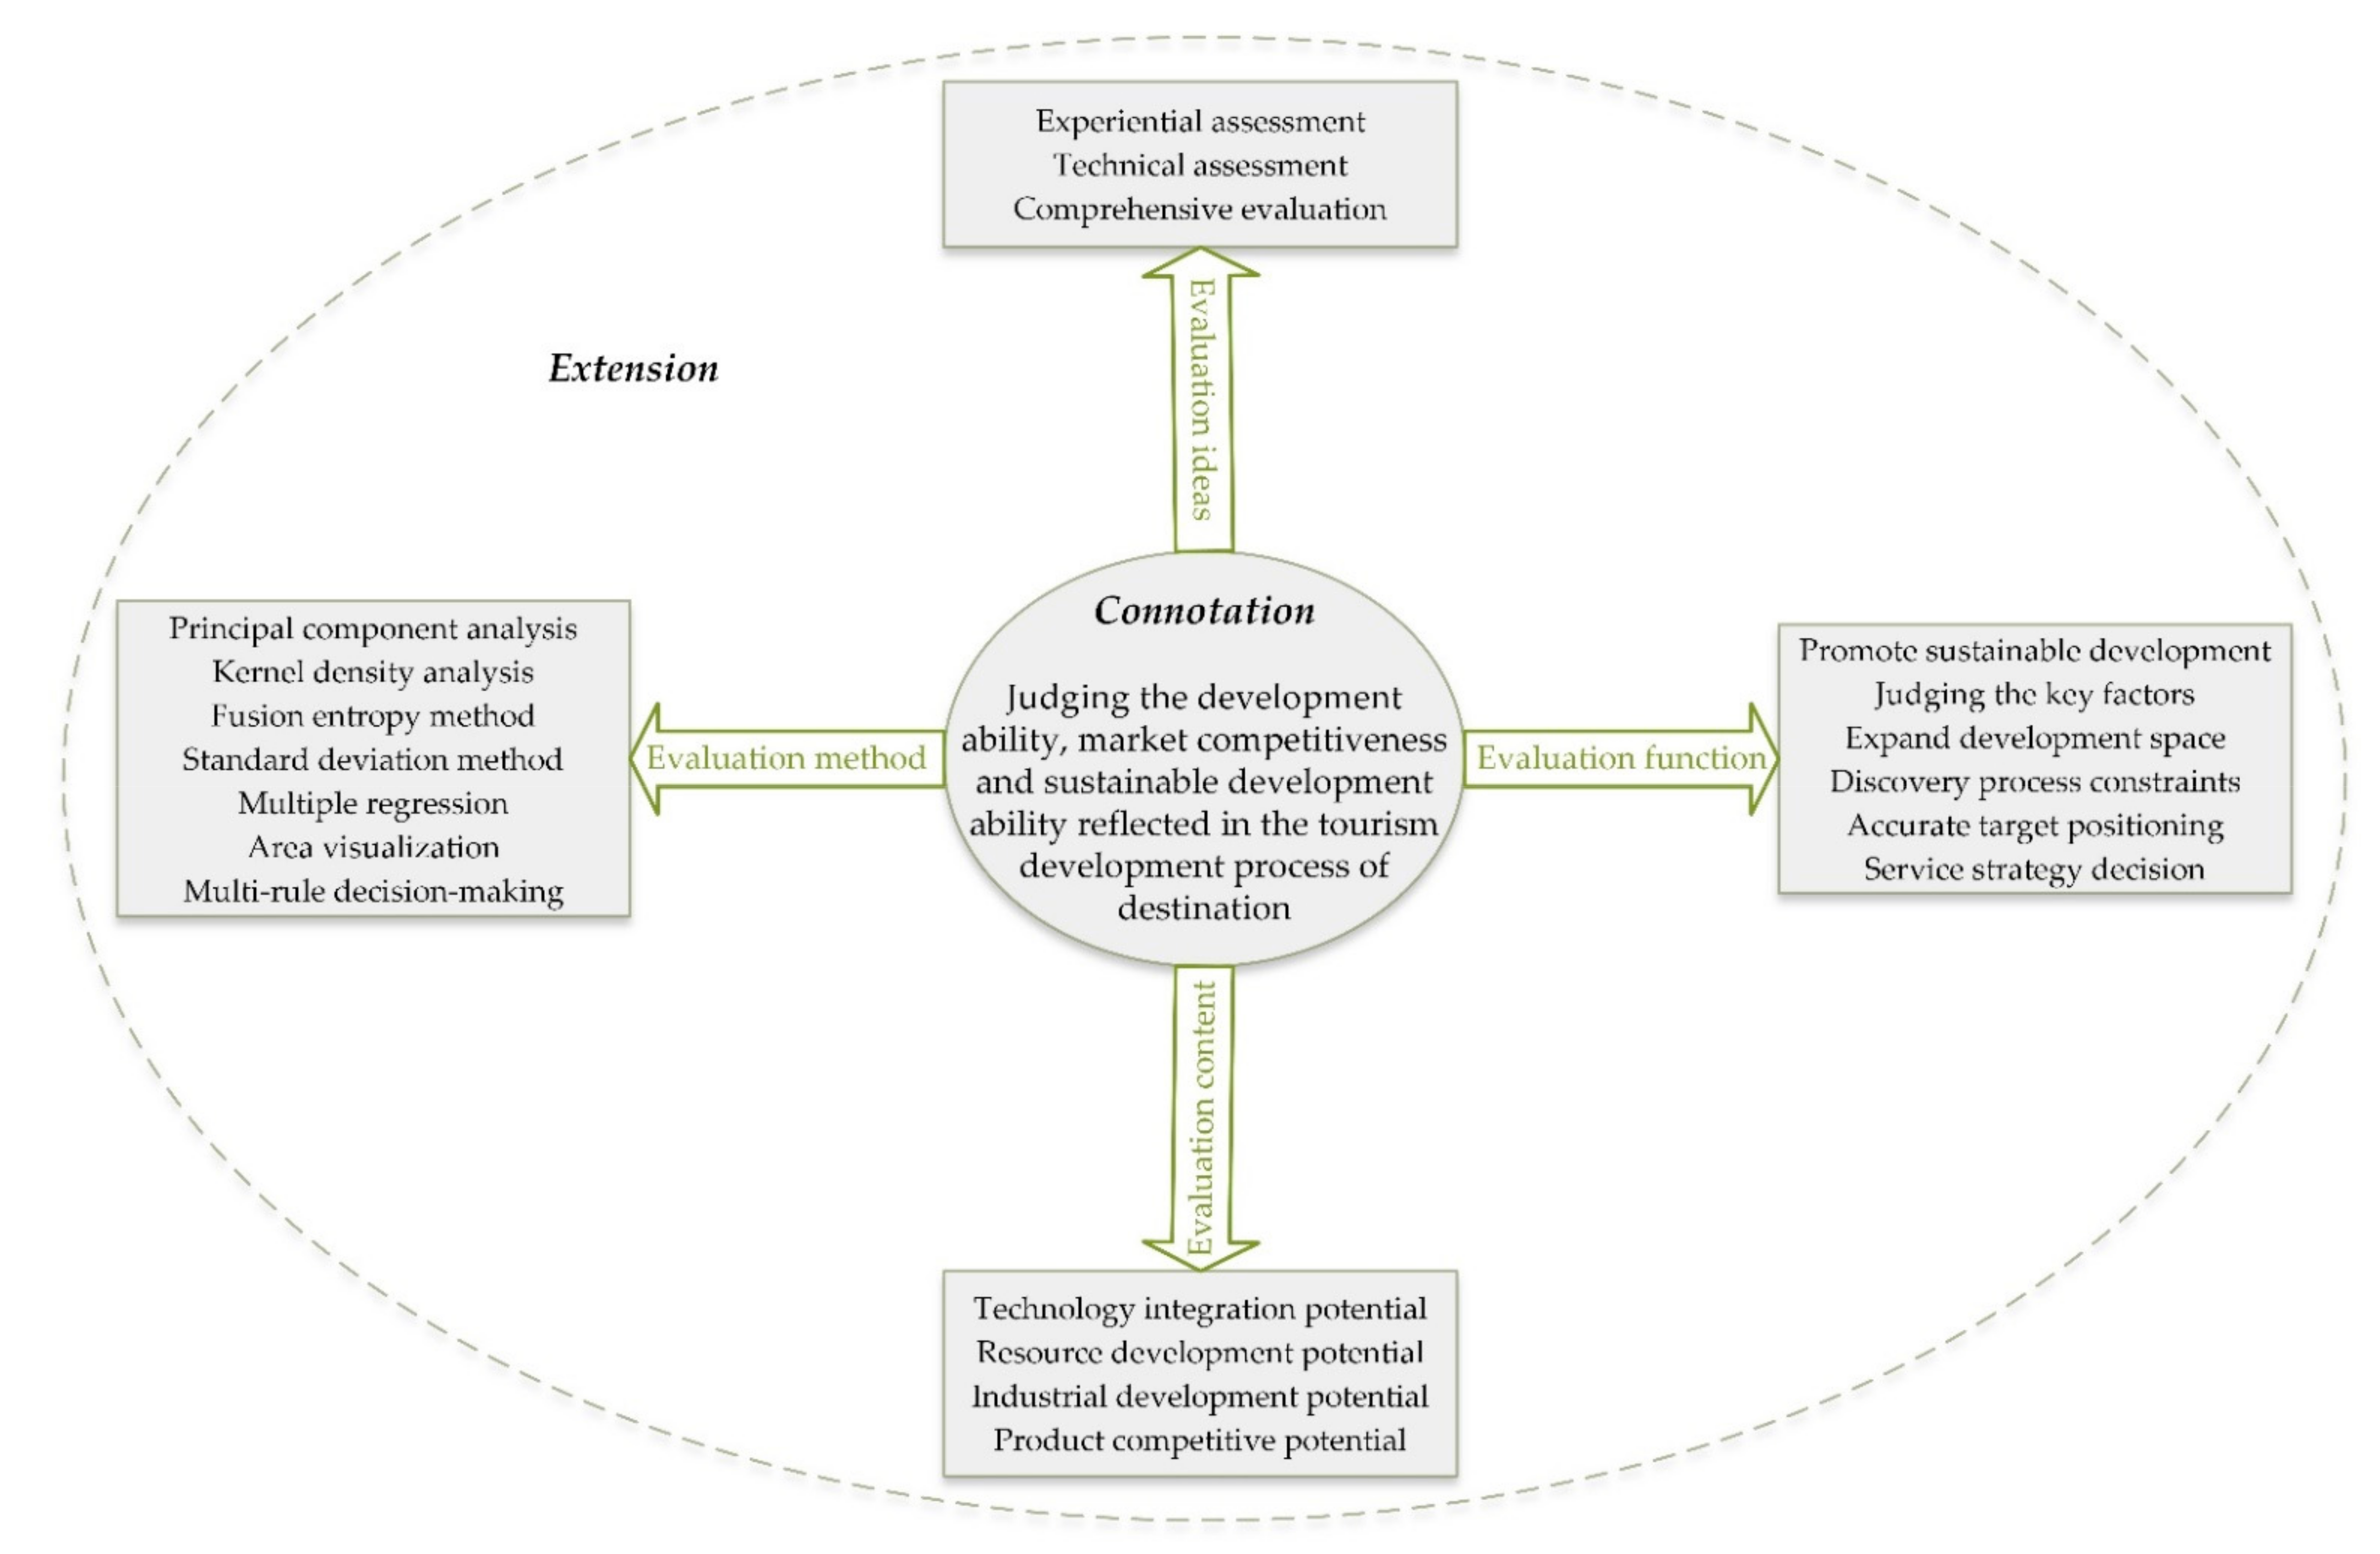
2.1. Tourism Development Potential (TDP)
2.2. Evaluation Index System
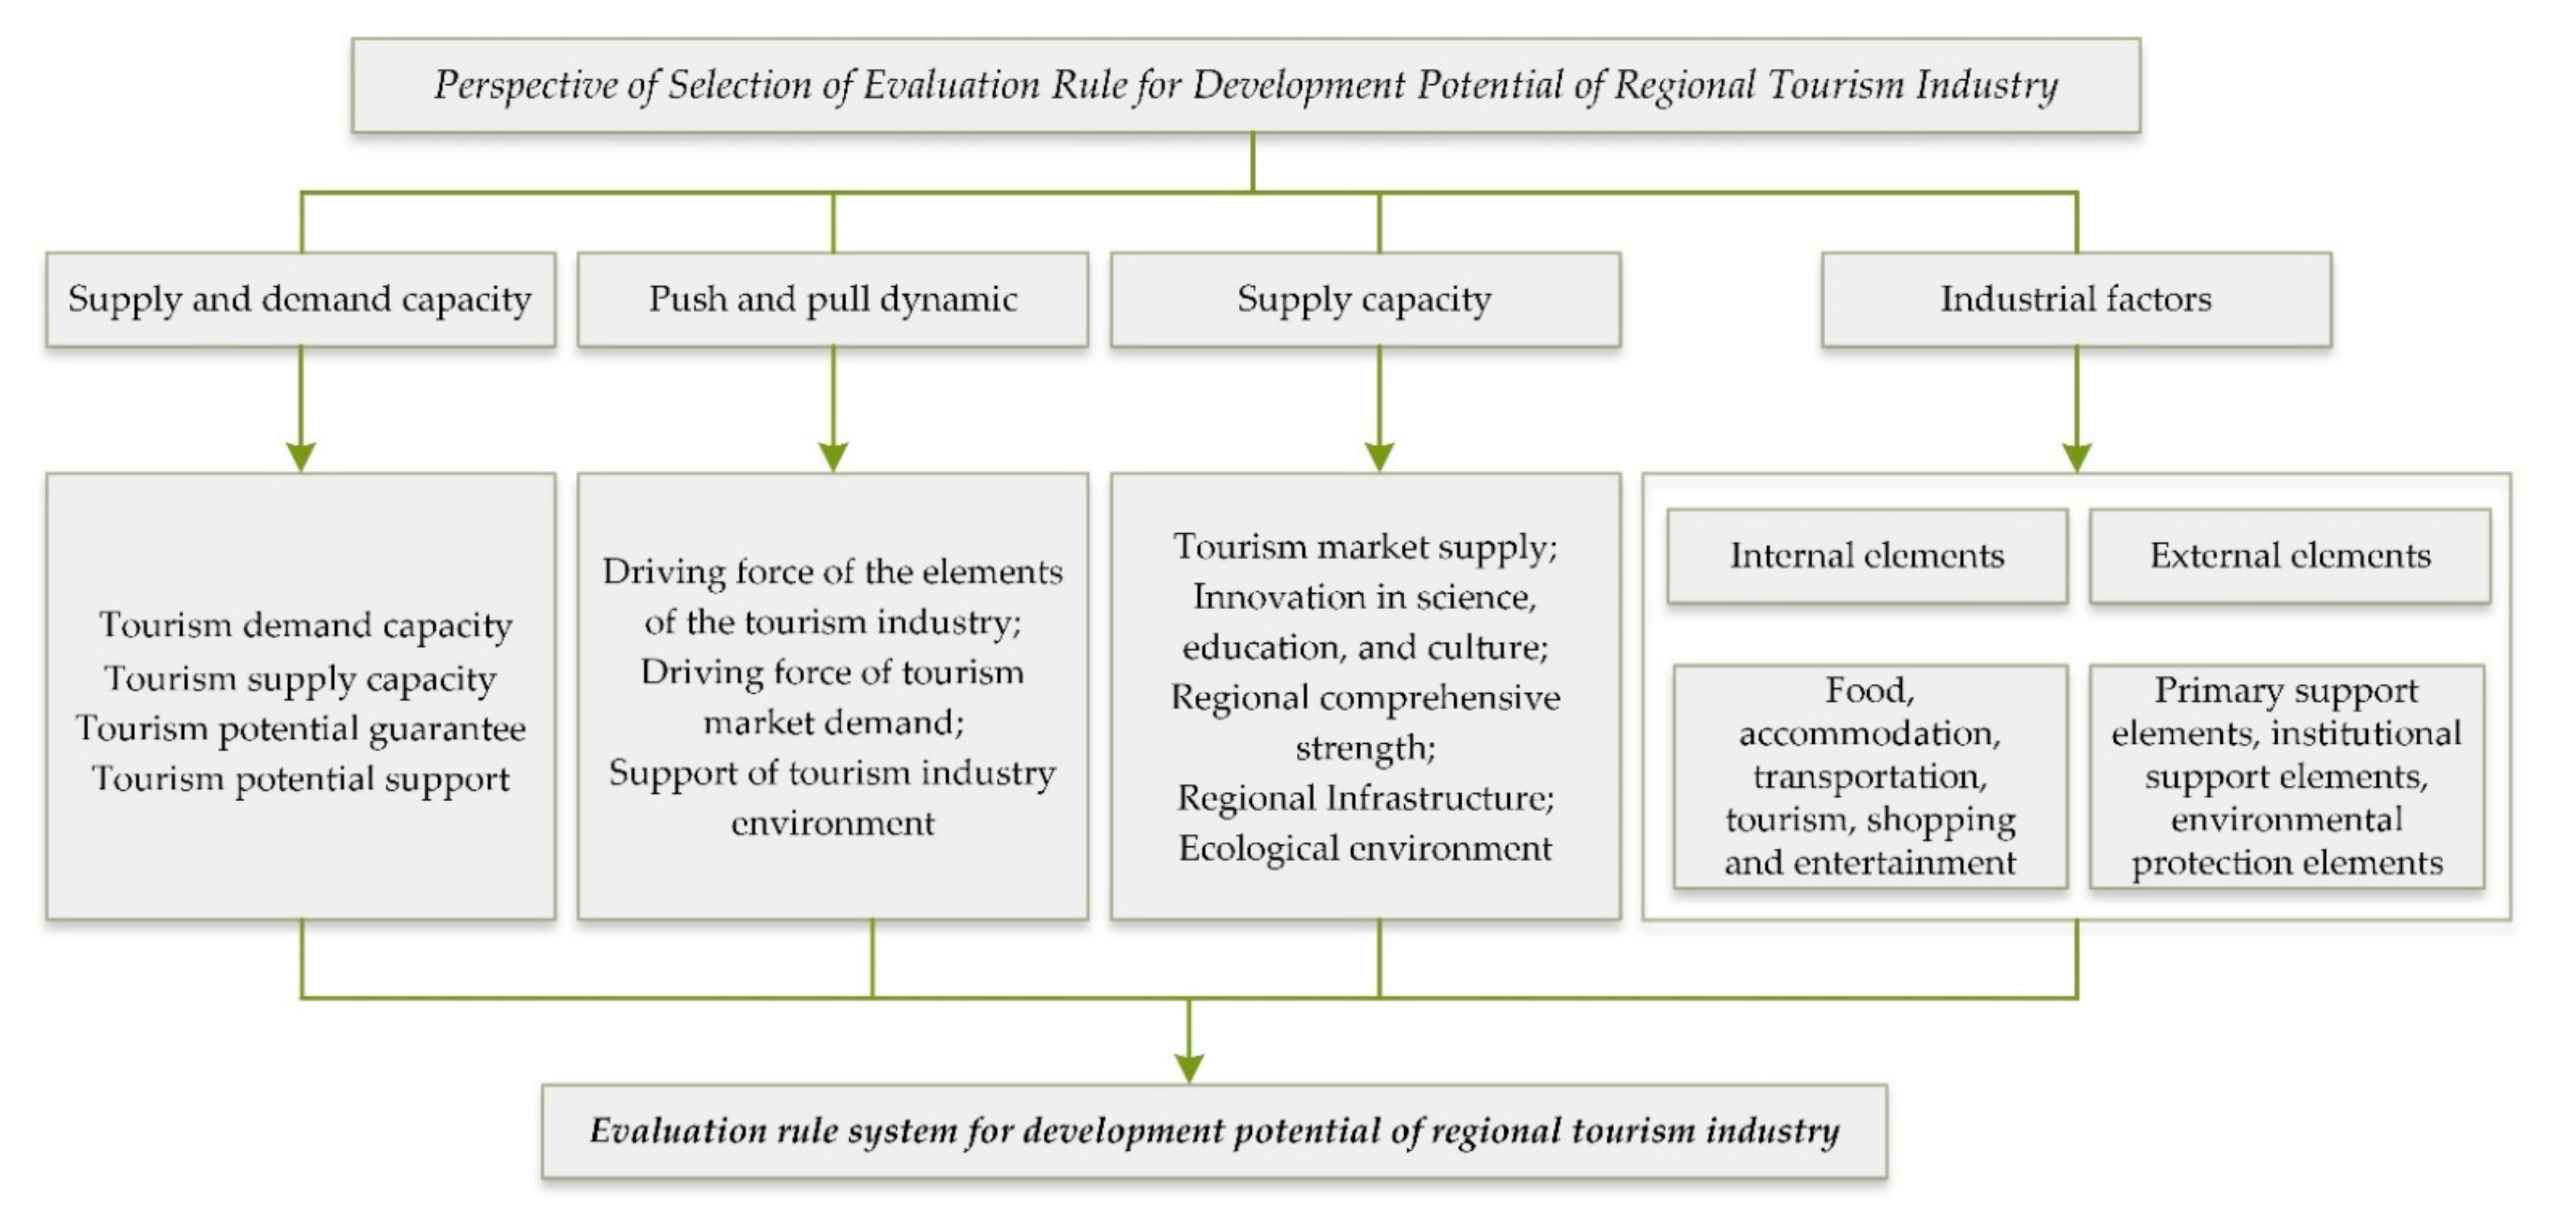
2.3. Theoretical Framework of Evaluation Index System
2.3.1. Selection of Layer and Factor
The Factor Layers of Destination’s Supply and Consumption Capacity (X1)
The Factor Layers of Source Place’s Demand and Purchasing Power (X2)
The Factor Layers of the Development Value of Destination Resource (X3)
The Factor Layers of Destination’s Tourism Industry Contribution Capacity (X4)
2.3.2. Evaluation Index System
3. Research Method
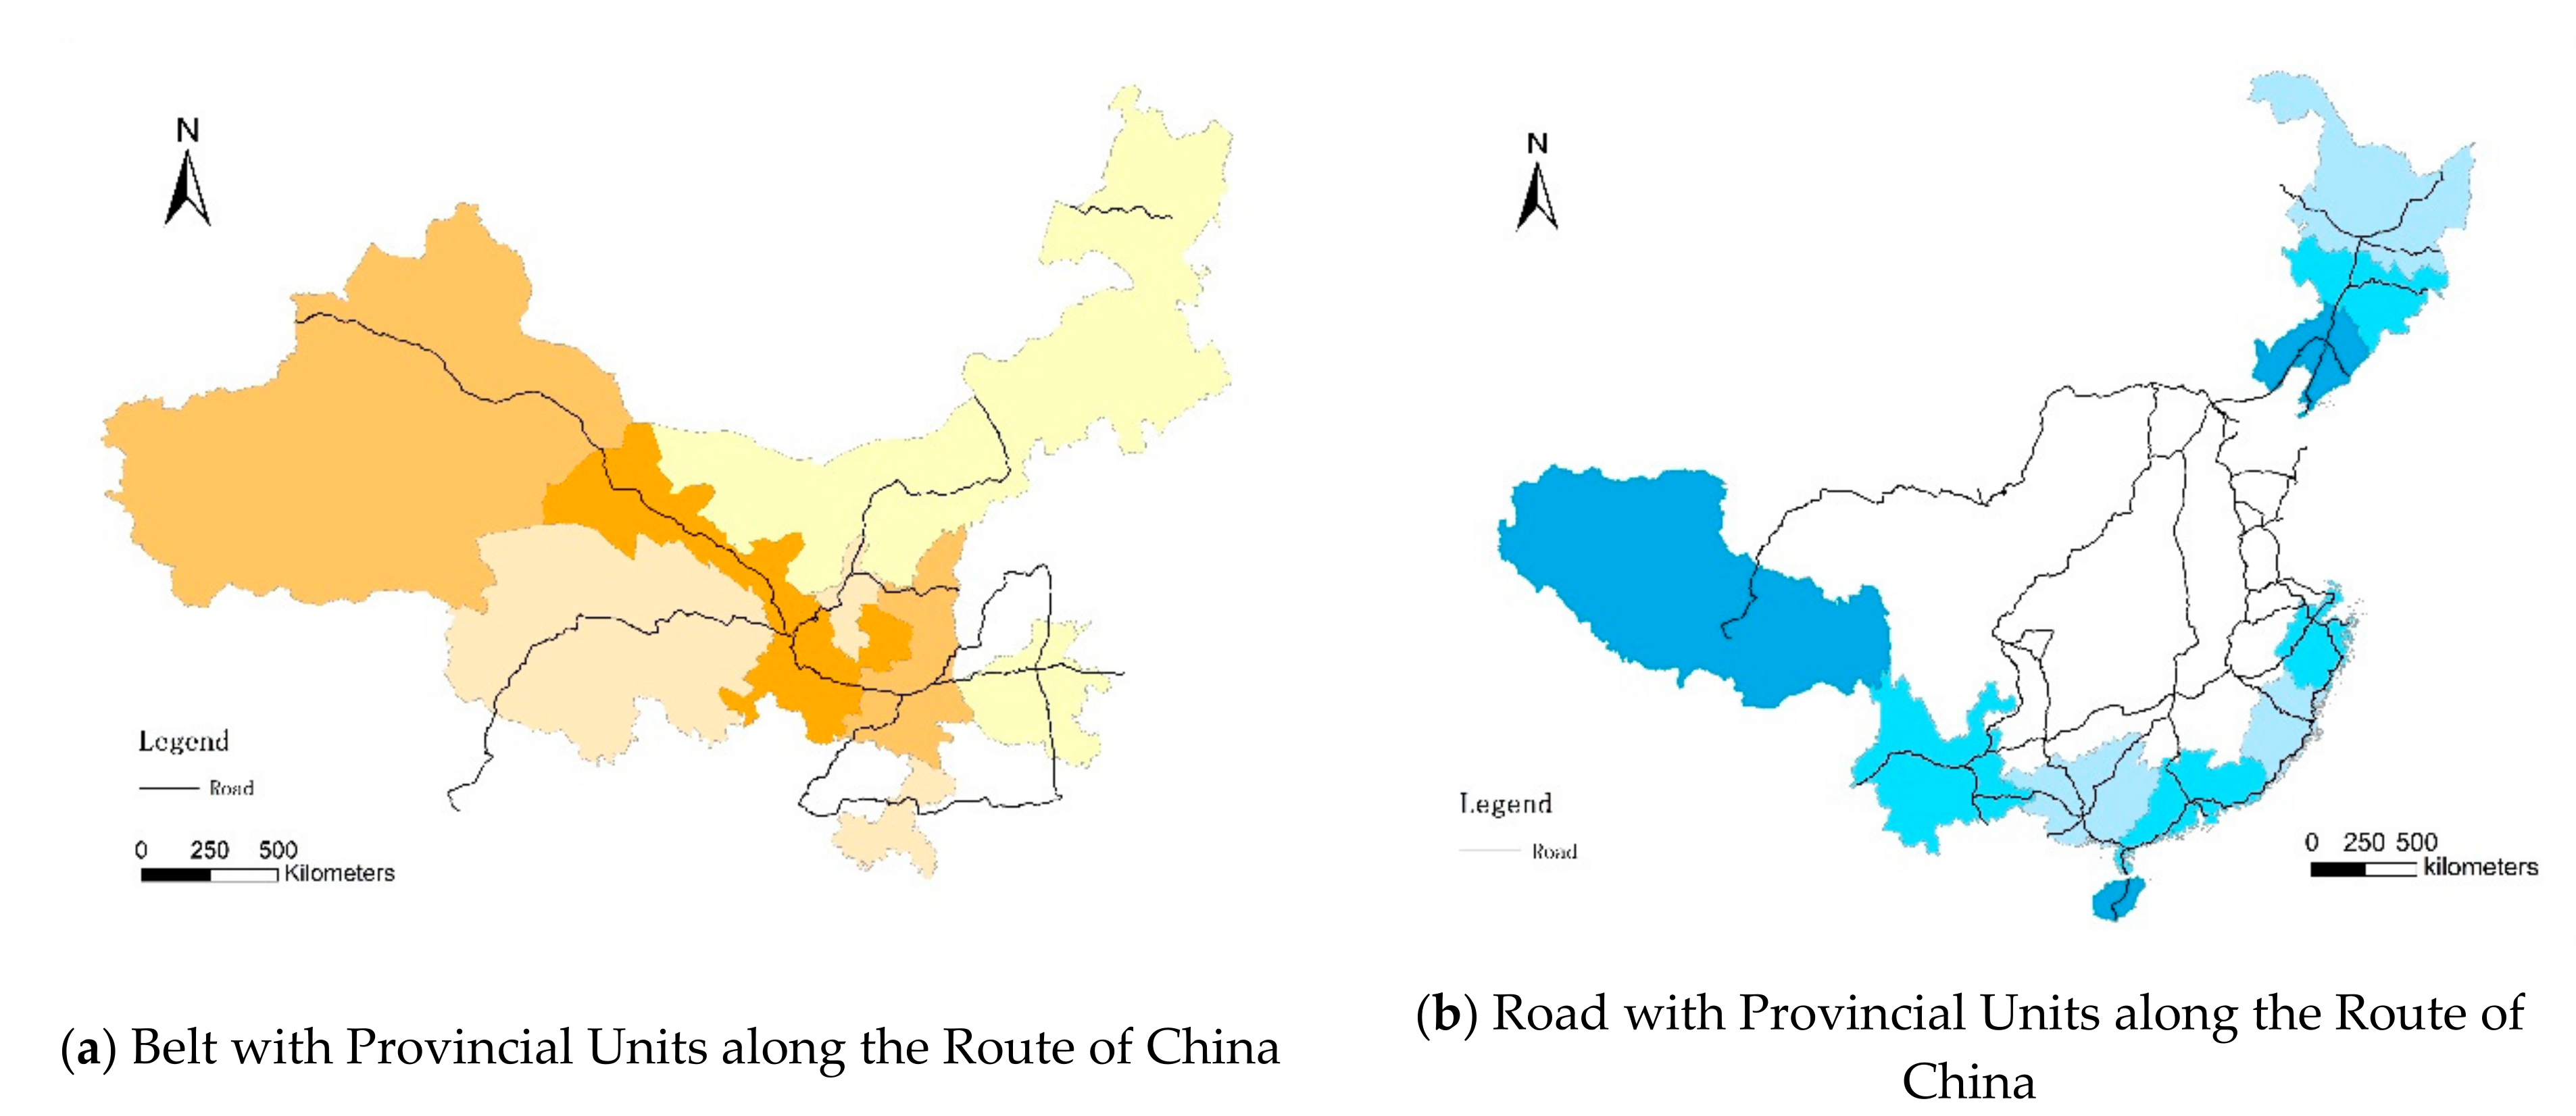
3.1. Research Area
3.2. Data Resources
3.3. The Estimation of Potential Index
4. Results
4.1. Index System and Model
4.2. The Results of Rule Layers
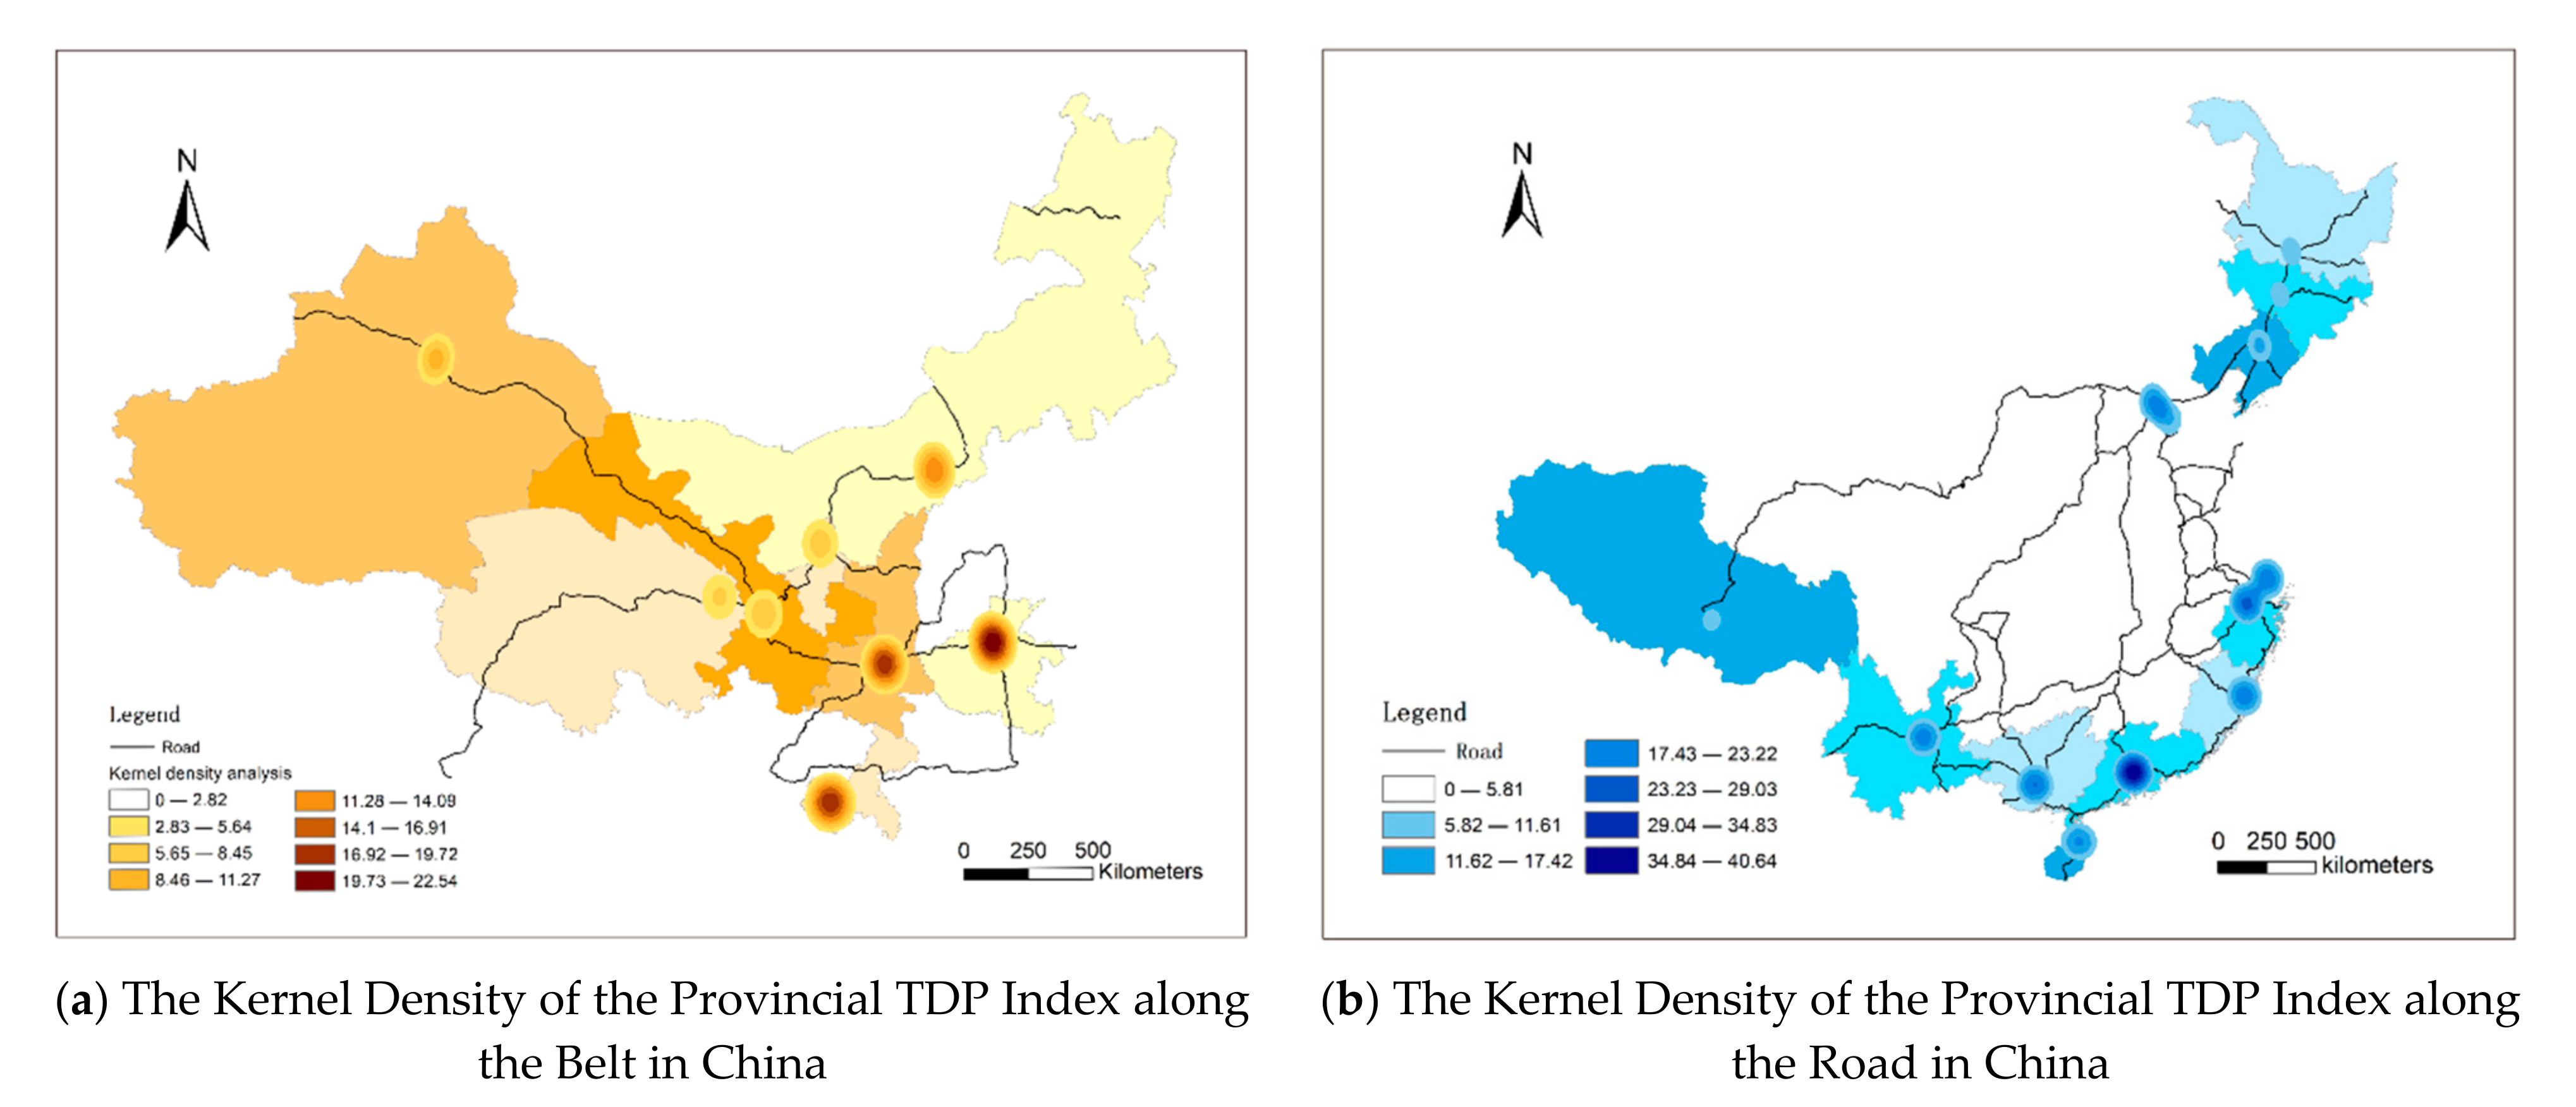
4.3. Spatial Characteristics
5. Discussions and Conclusions
5.1. Discussions
5.2. Conclusions
5.2.1. Theoretical Implications
5.2.2. Managerial Implications
5.3. Limitations
Author Contributions
Funding
Institutional Review Board Statement
Informed Consent Statement
Data Availability Statement
Acknowledgments
Conflicts of Interest
| 1 | The phrase ‘All-for-One Tourism’ was first mentioned in the Government Work Report in 2017. It refers to a new concept and mode of joint regional development. Tourism drives and promotes coordinated economic and social development through all-around systematic optimization and enhancement of regional economic and social resources. It benefits tourism resources, related industries, ecological environment, public services, institutional mechanisms, policies and regulations, and the quality of civilization to achieve organic integration of regional resources, integrated development of industries, and shared social construction. |
References
- Ministry of Commerce of the People’s Republic of China. Vision and actions on jointly building Silk Road Economic Belt and 21st-Century Maritime Silk Road. Available online: http://zhs.mofcom.gov.cn/article/xxfb/201503/20150300926644.shtml (accessed on 15 February 2021).
- Hao, Y.W.; Zhang, H. The realistic basis and path selection of international tourism cooperation of the cities along the Belt and Road. Qinghai Soc. Sci. 2019, 2, 58–65. [Google Scholar]
- Wang, J.J. Research on new land-sea corridor linking up Belt and Road and the domestic and international dual circulation from the perspective of industrial chain. China Bus. Mark. 2020, 10, 3–16. [Google Scholar]
- Wang, X.Y.; Han, X.X. The measurement of tourism efficiencies and spatial features of coastal port cities in China in the Belt and Road Initiative. J. Ocean. Univ. China 2018, 5, 36–42. [Google Scholar]
- Wang, J.Y.; Zhang, H. Tourism competitive potential and tourism competitiveness in the countries along the Belt and Road. Qinghai Soc. Sci. 2019, 6, 62–68. [Google Scholar]
- Zhou, Q.L.; Zhan, B.M. A study of service trade cooperation potential between China and the countries of Belt and Road —Based on the interna-tional competitiveness of service industry. West Forum 2017, 9, 111–124. [Google Scholar]
- Liu, G.B. Research on the advancing path and policy innovation of the Belt and Road Initiative. Northeast Asia Forum 2019, 4, 128. [Google Scholar]
- Zhai, K.; Wang, J.M. The Silk Road Economic Belt and the 21st Century Maritime Silk Road (2017); The Commercial Press: Beijing, China, 2018. [Google Scholar]
- Ke, S.Z.; Han, F. A composite measure and statistical estimation of China’s urban economic development potentials. Stat. Res. 2013, 3, 64–71. [Google Scholar]
- Ruda, A.; Pokladníková, M. Map agebra in tourism potential modelling for improving social issues in Masaryk’s school forest enterprise Křtiny. Geogr. Tech. 2016, 11, 67–83. [Google Scholar] [CrossRef] [Green Version]
- Nestoroska, I. Identifying tourism potentials in Republic of Macedonia through regional approach. Procedia-Soc. Behav. Sci. 2012, 44, 95–103. [Google Scholar] [CrossRef] [Green Version]
- Wang, S.J.; Xie, J.; Yue, Z.L. China’s glacier tourism: Potential evaluation and spatial planning. J. Destin. Mark. Manag. 2020, 18, 1–10. [Google Scholar] [CrossRef]
- Trukhachev, A. Methodology for evaluating the rural tourism potentials: A tool to ensure sustainable development of rural settlements. Sustainability 2015, 7, 3052–3070. [Google Scholar] [CrossRef] [Green Version]
- Elliot, S.; Papadopoulos, N.; Kim, S.S. An integrative model of place image: Exploring relationships between destination, product, and country images. J. Travel Res. 2011, 50, 520–534. [Google Scholar] [CrossRef]
- Andrades, L.; Dimanche, F. Destination competitiveness and tourism development in Russia: Issues and challenges. Tour. Manag. 2017, 62, 360–376. [Google Scholar] [CrossRef]
- Crettaz, U. Marketing im fremdenverkehr. Tour. Rev. 1976, 31, 12–15. [Google Scholar] [CrossRef]
- Corneliu, L.; Mihai, B. A critical analysis on the evaluation of tourism attractiveness in Romania. Case study: The region of Moldavia. In Proceedings of the 5th WSEAS International Conference on Economy and Management Transformation, Timisoara, Romania, 24 October 2010; pp. 145–150. [Google Scholar]
- Glavan, V. Tourist Potential and Its Capitalization; Fundației România de Mâine: Bucharest, Romania, 1996. [Google Scholar]
- Mamun, A.A.; Mitra, S. A methodology for assessing tourism potential:Case study murshidabad district, West Bengal, India. Int. J. Sci. Res. Publ. 2012, 2, 1–8. [Google Scholar]
- Havlíková, M.; Stupková, L.C.; Plíšková, L. Evaluation of sustainable tourism potential of the principle Giant Mountains resorts in the Czech Republic. Environ. Socio-Econ. Stud. 2019, 7, 26–35. [Google Scholar] [CrossRef] [Green Version]
- Shohan, R.; Toleuuly, A.; Assadova, Z.K. Tourist potential and prospects of tourism industry of Kazakhstan. Educ. Sci. Board. 2012, 5, 34–37. [Google Scholar]
- Ma, Y.; Dong, G.Z. The sustainable development potential model of regional tourism industry. Tour. Trib. 1997, 4, 37–40. [Google Scholar]
- Yang, M. The develop potential of tourism industry in Qinghai province. J. Stat. Decis. 2006, 14, 42–44. [Google Scholar]
- Wang, Z.F. The construction of systematic index of developing potential competence in regional tourism industry. East China Econ. Manag. 2008, 10, 31–35. [Google Scholar]
- Qin, Y.C.; Wang, X.; Lu, X.Q.; Li, Z.G.; Chen, S.M. The problems of coordination for regional sustainable development: (I) Concept and objectives. J. Henan Univ. 1997, 12, 77–83. [Google Scholar]
- Qin, Y.C.; Xu, M.J.; Wang, X. On the constraints of the potential of investor output on the process of regional sustainable development. J. Quant. Tech. Econ. 2001, 1, 36–38. [Google Scholar]
- Lu, F.X.; Qin, Y.C.; Xu, L.S.; Meng, H. Tourism ecological footprint—A case study of Songshan Scenic Spot in Maylst Golden Week of 2005. Hum. Geogr. 2006, 10, 31–35. [Google Scholar]
- Zhu, H.; Liu, J.M.; Wei, Z.C.; Li, W.H.; Wang, L. Residents’ attitudes towards sustainable tourism development in a historical-cultural village: Influence of perceived impacts, sense of place and tourism development potential. Sustainability 2017, 9, 61. [Google Scholar] [CrossRef] [Green Version]
- Melián-González, A.; García-Falcón, J.M. Competitive potential of tourism in destinations. Ann. Tour. Res. 2003, 30, 720–740. [Google Scholar] [CrossRef]
- Crampon, L.J. A new technique to analyze tourist markets. J. Mark. 1966, 30, 27–31. [Google Scholar] [CrossRef]
- Bao, J.G. An application of gravity model in tourist forecasting. Acta Sci. Nat. Univ. Sunyatseni 1992, 31, 133–136. [Google Scholar]
- Wilson, S.; Fesenmaier, D.R.; Fesenmaier, J.; Van Es, J.C. Factors for success in rural tourism development. J. Travel Res. 2001, 40, 132–138. [Google Scholar] [CrossRef]
- Tian, L.; Tang, X.X.; Wang, J. Dynamics Measure of Regional Tourism Development Potential—A Case Study of 16 City in Yunnan Province. Resour. Dev. Mark. 2017, 33, 738–743. [Google Scholar]
- Cao, X.X. A comparison study on the development potential of transprovincial tourism industry in China. Hum. Geogr. 2007, 22, 18–22. [Google Scholar]
- Song, Y.M. Study on the evaluation and display mechanism of regional tourism industry development potential: Take Shaanxi as an example. Ph.D. Thesis, Shaanxi Normal University, Xi’an, China, 2013. [Google Scholar]
- Zhang, Z.L.; Liang, L.K. The spatial-temporal evolution and spatial correlation analysis of urban tourism development potential in Henan Province. J. Luoyang Norm. Univ. 2018, 10, 17–23. [Google Scholar]
- Wu, C.B. Quantitative research on the potentiality of urban tourism development—Taking the open coastal cities in China as an example. Tour. Forum 2009, 10, 685–694. [Google Scholar]
- Ding, J.J.; Zhu, Q.H. Study on Spatial-temporal Differences of Development Potential of Regional Tourism Industry in China. Tour. Trib. 2012, 2, 52–61. [Google Scholar]
- Yu, Q.Y. Research on the Potential of Tourism Industry in China. Ph.D. Thesis, East China Normal University, Shanghai, China, 2010. [Google Scholar]
- González-Ramiro, A.; Gonçalves, G.; Sánchez-Ríos, A.; Jeong, J.S. Using a VGI and GIS-Based Multicriteria Approach for Assessing the Potential of Rural Tourism in Extremadura (Spain). Sustainability 2016, 8, 1144. [Google Scholar] [CrossRef] [Green Version]
- Li, H. Preliminary study of the preserve tourism protection—Based on the theory of ecological footprint. For. Econ. 2005, 7, 43–45. [Google Scholar]
- Santana-Gallego, M.; Ledesma-Rodríguez, F.; Pérez-Rodríguez, J. The euro effect: Tourism creation, tourism diversion and tourism potential within the European Union. Eur. Union Politics 2016, 17, 46–68. [Google Scholar] [CrossRef]
- Jarábková, J. The rural areas—the unutilized potential in light of tourism. Agric. Econ. 2010, 56, 532–539. [Google Scholar] [CrossRef] [Green Version]
- Khodadadi, M. Donald Trump, US foreign policy and potential impacts on Iran’s tourism industry: Post-nuclear deal. Tour. Mangement Perspect. 2018, 26, 28–30. [Google Scholar] [CrossRef] [Green Version]
- Li, L.P. The stripping and integrating study of heritage community—historical and cultural villages: Culture tourism sustainable development. Ph.D. Thesis, Northwest University, Lanzhou, China, 2008. [Google Scholar]
- Feng, H.H.; Chen, X.P.; Heck, P.; Miao, H. An Entropy-Perspective Study on the Sustainable Development Potential of Tourism Destination Ecosystem in Dunhuang, China. Sustainability 2014, 6, 8980–9006. [Google Scholar] [CrossRef] [Green Version]
- Hoang, H.T.T.; Truong, Q.H.; Nguyen, A.T.; Hens, L. Multicriteria evaluation of tourism potential in the central highlands of Vietnam: Combining Geographic Information System (GIS), Analytic Hierarchy Process (AHP) and Principal Component Analysis (PCA). Sustainability 2018, 10, 3097. [Google Scholar] [CrossRef] [Green Version]
- Dwyer, L.; Kim, C.W. Destination competitiveness: Determinants and indicators. Curr. Issues Tour. 2003, 6, 369–414. [Google Scholar] [CrossRef]
- Chen, Y.; Jiang, B.; Chu, N.C.; Cui, S.L.; Lu, J.B. A study on the measurement of tourism supply and demand potential in Northeast China by High-Speed Railway. Railw. Transp. Econ. 2019, 10, 14–22. [Google Scholar]
- Matei, F.D. Cultural tourism potential, as part of rural tourism development in the North-East of Romania. Procedia Econ. Financ. 2015, 23, 453–460. [Google Scholar] [CrossRef] [Green Version]
- Wozniak, E.; Kulczyk, S.; Derek, M. From intrinsic to service potential: An approach to assess tourism landscape potential. Landsc. Urban Plan. 2017, 170, 209–220. [Google Scholar] [CrossRef]
- Zhou, L.Z.; Zhou, G.M.; Ying, M. Analysis of suitable climate indicators for tourism activities. Meteorol. Sci. Technol. 1998, 1, 60–63. [Google Scholar]
- Sun, G.N.; Ma, L.J. An analysis of tourist climate comfortable degree and yearly variation of tourist traffic in Xi’an. Tour. Trib. 2007, 7, 34–39. [Google Scholar]
- Lubowiecki-Vikuk, A.; Kurkowiak, J. Medical tourism potential of central and eastern Europe: Attempt at classification. In Proceedings of the CBU International Conference on Innovations in Science and Education, Prague, Czech Republic, 22–24 March 2017; pp. 286–293. [Google Scholar]
- Sai, N. “Internet Plus” allows ecotour tourism potential to be released at an accelerated pace. People’s Trib. 2016, 12, 90–91. [Google Scholar]
- Martín Martín, J.M.; Salinas Fernández, J.A.; Rodríguez Martín, J.A.; Jiménez Aguilera, J.D.D. Assessment of the tourism’s potential as a sustainable development instrument in terms of annual stability: Application to Spanish rural destinations in process of consolidation. Sustainability 2017, 9, 1692. [Google Scholar] [CrossRef] [Green Version]
- Cui, Y.; Xi, J.C. Market classification analysis of China provincial outbound tourism based on the travel potential model. Resour. Sci. 2015, 37, 2120–2128. [Google Scholar]
- Lu, X.J.; Zhou, C.H.; Zhang, H.Y.; Xu, Z.G. Analytical scheme on scale-structure of geographical space. Prog. Geogr. 2004, 3, 107–114. [Google Scholar]
- Dube, K.; Nhamo, G. Evidence and impact of climate change on South African national parks. Potential implications for tourism in the Kruger National Park. Environ. Dev. 2020, 33, 100485. [Google Scholar] [CrossRef]
- Li, Z.M.; Zou, H.X.; Yi, Q.Q.; Zhou, Q. The agricultural cultural heritage tourism resources potential evaluation to terraces. Econ. Geogr. 2015, 6, 198–208. [Google Scholar]
- Radovanov, B.; Dudic, B.; Gregus, M.; Marcikic Horvat, A.; Karovic, V. Using a two-stage DEA model to measure tourism potentials of EU countries and Western Balkan countries: An approach to sustainable development. Sustainability 2020, 12, 4903. [Google Scholar] [CrossRef]
- Kelly, N.; Kelliher, F.; Power, J.; Lynch, P. Unlocking the niche potential of senior tourism through micro-firm owner-manager adaptive capability development. Tour. Manag. 2020, 79, 104081. [Google Scholar] [CrossRef]
- Yan, L.B.; Gao, B.W.; Zhang, M. A mathematical model for tourism potential assessment. Tour. Manag. 2017, 63, 355–365. [Google Scholar] [CrossRef]
- Li, Y.P.; Lo, R.L.B. Applicability of the market appeal—robusticity matrix: A case study of heritage tourism. Tour. Manag. 2004, 25, 789–800. [Google Scholar] [CrossRef]
- iReaserch. 2016 China Online Travel Platform White Paper. Available online: https://www.baidu.com/link?url=-wTBPN7HmzM0wbb3YkQMCXCAK0zl-cfkiYLSH1d6nsts6gZd2Plxeo9g0WdraMfEsjAeqSgQDd7LzdH60Q00V-fJ2q9ZZNDBpf6Dkbp8WuEpi41YzLyZSewnKXGNp1Fo&wd=&eqid=ef8c7c52002a6f2a00000003610d75ce (accessed on 7 August 2021).
- Qin, X.; Zhen, F.; Zhu, S.J.; Xi, G.L. Spatial pattern of catering industry in Nanjing urban area based on the degree of public praise from internet: A case study of Dianping.com. Sci. Geogr. Sin. 2014, 7, 810–817. [Google Scholar]
- Puška, A.; Pamucar, D.; Stojanović, I.; Cavallaro, F.; Kaklauskas, A.; Mardani, A. Examination of the sustainable rural tourism potential of the Brčko District of Bosnia and Herzegovina using a fuzzy approach based on group decision making. Sustainability 2021, 13, 583. [Google Scholar] [CrossRef]
- The State Council of China. Guidance on the Promotion of the Development of All-for-One Tourism. Available online: http://zwgk.mct.gov.cn/zfxxgkml/zykf/202012/t20201213_919358.html (accessed on 22 March 2018).
- Baidu Encyclopedia. All-for-One Tourism. Available online: https://baike.baidu.com/item/%E5%85%A8%E5%9F%9F%E6%97%85%E6%B8%B8/2987065?fr=aladdin (accessed on 23 May 2018).
- China Daily. All-for-one tourism. Available online: http://www.chinadaily.com.cn/opinion/2017-03/09/content_28486265.htm (accessed on 9 March 2017).
- Calderón-Vargas, F.; Asmat-Campos, D.; Carretero-Gómez, A. Sustainable tourism and renewable energy: Binomial for local development in Cocachimba, Amazonas, Peru. Sustainability 2019, 11, 4891. [Google Scholar] [CrossRef] [Green Version]


| Rule Layers | Factor Layers | Units |
|---|---|---|
| Destination’s supply and consumption capacity (X1) | ||
| Direct supply and consumption (X11) | Number of tourism enterprises (X111) | Unit |
| Total amount of fixed investment in tertiary industry (X112) | 10,000 RMB | |
| Number of tourism employees (X113) | Person | |
| Number of tourism training organizations (X114) | Unit | |
| Annual tourism environment capacity (X115) | Person/km2 | |
| The killmeters on the highway passenger transport (X116) | km | |
| The killmeters on the railway passenger transport (X117) | km | |
| Airline by passenger volume (X118) | km | |
| Number of 5G base stations (X119) | % | |
| Indirect supply and consumption (X12) | Vegetation coverage (X121) | % |
| Total utilization of foreign capital (X122) | $10,000 | |
| Number of sanitation facilities (X123) | Unit | |
| Carbon emissions from tourism industry (X124) | kg | |
| Carbon emissions from tourists (X125) | kg | |
| Telecommunications business volume (X126) | 10,000 RMB | |
| Source place’s demand and purchasing power (X2) | ||
| Demand potential (X21) | Number of domestic tourists (X211) | 10,000 person |
| Number of international tourists (X212) | 10,000 person | |
| Purchasing potential (X22) | Domestic Engel coefficient (X221) | % |
| Consumer confidence index of major source countries (X222) | - | |
| Per capita expenditure on education, culture, and entertainment (X223) | RMB | |
| Development value of destination resource (X3) | ||
| Value of landscape resources (X31) | Nature reserve (X311) | Unit |
| Cultural heritage sites (X312) | Unit | |
| Wet land landscape (X313) | 10,000 hector | |
| Forest landscape (X314) | 10,000 hector | |
| Value of climate resources (X32) | Annual frost-free day (X321) | Day |
| Mean annual temperature (X322) | °C | |
| Mean wind speed (X323) | m/s | |
| Mean annual humidity (X324) | % | |
| Contribution of destination tourism industry (X4) | ||
| Economic contribution (X41) | Total tourism income (X411) | 10,000 RMB |
| The share of tourism value-added to GDP (X412) | % | |
| Employment contribution (X42) | Direct employment contribution of tourism (X421) | % |
| Indirect employment contribution of tourism (X422) | % | |
| Advanced tourism adaptability (X43) | Business climate index (X431) | _ |
| International revenue of scenic spots (X432) | $10,000 | |
| International revenue of food and beverages and accommodation (X433) | $10,000 | |
| International revenue of tourism transportation (X434) | $10,000 | |
| International revenue of tourism shopping (X435) | $10,000 | |
| Rule Layers | Sub-Rule Layers | Factor Layers | Weight (%) |
|---|---|---|---|
| Destination’s supply and consumption capacity () (25.73%) | Direct supply and consumption () (64.61%) | Number of tourism enterprises (X111) | 8.62 |
| Total amount of fixed investment in tertiary industry (X112) | 9.45 | ||
| Number of tourism employees (X113) | 8.04 | ||
| Number of tourism training organizations (X114) | 3.50 | ||
| Annual tourism environment capacity (X115) | 5.29 | ||
| The kilometers on the highway passenger transport (X116) | 10.67 | ||
| The kilometers on the railway passenger transport (X117) | 6.22 | ||
| Airline by passenger volume (X118) | 6.63 | ||
| Number of 5G base stations (X119) | 6.19 | ||
| Indirect supply and consumption () (35.39%) | Total utilization of foreign capital (X122) | 9.73 | |
| Number of sanitation facilities (X123) | 9.01 | ||
| Telecommunications business volume (X126) | 10.97 | ||
| Environmental infrastructure investment (X127) | 5.67 | ||
| Source place’s demand and purchasing power () (13.05%) | Demand potential () (28.59%) | Tourist reception (X213) | 28.59 |
| Purchasing potential () (71.41%) | Engel coefficient (X221) | 24.04 | |
| Consumer confidence index of major source countries (X222) | 21.81 | ||
| Per capita expenditure on education, culture, and entertainment (X223) | 25.55 | ||
| Development value of destination resource () (31.77%) | Value of landscape resources () (46.13%) | Nature reserve (X311) | 9.53 |
| Cultural heritage sites (X312) | 18.37 | ||
| Wet land landscape (X313) | 1.76 | ||
| Forest landscape (X314) | 16.48 | ||
| Value of climate resources () (53.87%) | Annual frost-free day (X321) | 18.61 | |
| Mean annual temperature (X322) | 21.09 | ||
| Mean annual humidity (X324) | 14.18 | ||
| Contribution of destination tourism industry () (29.45%) | Economic contribution () (12.56%) | Total tourism income (X411) | 12.56 |
| Employment contribution () (10.31%) | Employment contribution of tourism (X423) | 10.31 | |
| Advanced tourism adaptability () (77.12%) | Business climate index (X431) | 12.26 | |
| International revenue of scenic spots (X432) | 16.21 | ||
| International revenue of food and beverages and accommodation (X433) | 16.18 | ||
| International revenue of tourism transportation (X434) | 16.19 | ||
| International revenue of tourism shopping (X435) | 16.28 |
| Factor Layers | Factor Loadings | Factor Layers’ Weights in Principal Components | Overall Index Weight | |||||
|---|---|---|---|---|---|---|---|---|
| C1 | C2 | C3 | C1 | C2 | C3 | Initial Value | Normalized Value | |
| 0.952 | 0.129 | 0.116 | 0.360 | 0.085 | 0.106 | 0.270 | 0.110 | |
| 0.883 | 0.178 | 0.143 | 0.333 | 0.117 | −0.130 | 0.233 | 0.095 | |
| 0.865 | 0.089 | 0.064 | 0.327 | −0.059 | −0.058 | 0.198 | 0.080 | |
| 0.855 | 0.001 | 0.028 | 0.323 | 0.001 | −0.026 | 0.212 | 0.086 | |
| 0.851 | 0.032 | 0.121 | 0.321 | −0.021 | 0.110 | 0.222 | 0.090 | |
| 0.847 | 0.362 | 0.081 | 0.320 | −0.238 | −0.074 | 0.152 | 0.062 | |
| 0.800 | 0.062 | 0.455 | 0.302 | −0.041 | 0.415 | 0.240 | 0.097 | |
| 0.767 | 0.196 | 0.239 | 0.290 | −0.129 | −0.218 | 0.140 | 0.057 | |
| 0.702 | 0.392 | 0.415 | 0.265 | −0.258 | 0.378 | 0.163 | 0.066 | |
| 0.127 | 0.891 | 0.070 | 0.048 | 0.587 | −0.064 | 0.153 | 0.062 | |
| 0.092 | 0.750 | 0.435 | −0.035 | 0.494 | 0.396 | 0.130 | 0.053 | |
| 0.625 | 0.722 | 0.014 | 0.236 | 0.475 | 0.013 | 0.263 | 0.107 | |
| 0.519 | 0.210 | 0.716 | 0.196 | 0.138 | −0.653 | 0.086 | 0.035 | |
| Region | Destination’s Supply and Consumption Capacity (X1) (25.73%) | Source Place’s Demand and Purchasing Power (X2) (13.05%) | Development Value of Destination Resource (X3) (31.77%) | Contribution of Destination Tourism Industry (X4) (29.45%) | The Evaluation Layers of TDP (Y) | |||||
|---|---|---|---|---|---|---|---|---|---|---|
| The Road in China | Guangdong | 0.8709 | Shanghai | 0.7282 | Hainan | 0.6794 | Guangdong | 0.9247 | Guangdong | 0.7540 |
| Zhejiang | 0.4952 | Zhejiang | 0.7107 | Guangxi | 0.6300 | Shanghai | 0.4634 | Zhejiang | 0.4774 | |
| Beijing | 0.3486 | Yunnan | 0.6655 | Guangdong | 0.6228 | Beijing | 0.3406 | Guangxi | 0.4348 | |
| Fujian | 0.3087 | Beijing | 0.5964 | Fujian | 0.5789 | Zhejiang | 0.3221 | Shanghai | 0.4115 | |
| Guangxi | 0.3037 | Guangxi | 0.5622 | Zhejiang | 0.5112 | Guangxi | 0.2822 | Fujian | 0.4007 | |
| Yunnan | 0.2780 | Liaoning | 0.5105 | Yunnan | 0.4891 | Fujian | 0.2629 | Yunnan | 0.3887 | |
| Shanghai | 0.2527 | Fujian | 0.4592 | Shanghai | 0.3619 | Yunnan | 0.2545 | Beijing | 0.3592 | |
| Liaoning | 0.2501 | Guangdong | 0.4578 | Tibet | 0.3564 | Tianjin | 0.2468 | Hainan | 0.3403 | |
| Heilongjiang | 0.2212 | Tianjin | 0.3760 | Beijing | 0.2878 | Hainan | 0.2265 | Liaoning | 0.2493 | |
| Jilin | 0.1592 | Jilin | 0.3202 | Liaoning | 0.2641 | Liaoning | 0.1169 | Tianjin | 0.2367 | |
| Tianjin | 0.1391 | Heilongjiang | 0.2890 | Tianjin | 0.2493 | Jilin | 0.0700 | Heilongjiang | 0.1873 | |
| Hainan | 0.1164 | Hainan | 0.2131 | Heilongjiang | 0.2445 | Heilongjiang | 0.0508 | Jilin | 0.1723 | |
| Tibet | 0.0340 | Tibet | 0.1500 | Jilin | 0.2170 | Tibet | 0.0294 | Tibet | 0.1502 | |
| The Belt in China | Henan | 0.5831 | Henan | 0.5960 | Chongqing | 0.5447 | Henan | 0.2925 | Henan | 0.4183 |
| Shanxi | 0.3100 | Shanxi | 0.5331 | Shanxi | 0.3953 | Shanxi | 0.2654 | Chongqing | 0.3604 | |
| Inner Mongolia | 0.2855 | Chongqing | 0.4416 | Henan | 0.3285 | Inner Mongolia | 0.2356 | Shanxi | 0.3531 | |
| Xinjiang | 0.2685 | Inner Mongolia | 0.4086 | Xinjiang | 0.2138 | Chongqing | 0.2160 | Inner Mongolia | 0.2570 | |
| Chongqing | 0.2568 | Qinghai | 0.3306 | Inner Mongolia | 0.1916 | Ningxia | 0.1076 | Xinjiang | 0.1836 | |
| Gansu | 0.1640 | Ningxia | 0.3298 | Gansu | 0.1811 | Xinjiang | 0.0615 | Gansu | 0.1474 | |
| Qinghai | 0.0844 | Gansu | 0.3108 | Ningxia | 0.1461 | Qinghai | 0.0252 | Ningxia | 0.1362 | |
| Ningxia | 0.0584 | Xinjiang | 0.2183 | Qinghai | 0.1435 | Gansu | 0.0241 | Qinghai | 0.1179 | |
| Average | 0.2756 | 0.4385 | 0.3637 | 0.2295 | 0.3113 | |||||
Publisher’s Note: MDPI stays neutral with regard to jurisdictional claims in published maps and institutional affiliations. |
© 2021 by the authors. Licensee MDPI, Basel, Switzerland. This article is an open access article distributed under the terms and conditions of the Creative Commons Attribution (CC BY) license (https://creativecommons.org/licenses/by/4.0/).
Share and Cite
Chen, Y.; Li, Y.; Gu, X.; Chen, N.; Yuan, Q.; Yan, M. Evaluation of Tourism Development Potential on Provinces along the Belt and Road in China: Generation of a Comprehensive Index System. Land 2021, 10, 905. https://doi.org/10.3390/land10090905
Chen Y, Li Y, Gu X, Chen N, Yuan Q, Yan M. Evaluation of Tourism Development Potential on Provinces along the Belt and Road in China: Generation of a Comprehensive Index System. Land. 2021; 10(9):905. https://doi.org/10.3390/land10090905
Chicago/Turabian StyleChen, Yuying, Yajie Li, Xiangfeng Gu, Nan Chen, Qing Yuan, and Ming Yan. 2021. "Evaluation of Tourism Development Potential on Provinces along the Belt and Road in China: Generation of a Comprehensive Index System" Land 10, no. 9: 905. https://doi.org/10.3390/land10090905