Article

Can China’s Resource-Saving and Environmentally Friendly Society Really Improve the Efficiency of Industrial Land Use?

1
Department of Public Management-Land Management, Huazhong Agricultural University, Wuhan 430070, China
2
Leibniz Institute of Agricultural Development in Transition Economies (IAMO), 06120 Halle, Germany
*
Author to whom correspondence should be addressed.
Land 2021, 10(7), 751; https://doi.org/10.3390/land10070751
Submission received: 18 June 2021 / Revised: 8 July 2021 / Accepted: 15 July 2021 / Published: 18 July 2021

Abstract

:
The Chinese government is committed to its goal of building a resource-saving and environmentally friendly society (RES). The hope is that establishing an RES will accelerate social and economic development, improve resource utilization, and transform industrialization. This paper focuses on the Changsha–Zhuzhou–Xiangtan urban agglomeration (CZTUA) in Hunan Province, which is a pilot for the RES, as an example. A slack-based measure model based on data envelopment analysis was used to evaluate industrial land use efficiency (ILUE), which includes undesirable outputs. We collected panel data from 2003 to 2018 and used the difference-in-differences method to investigate whether the ILUE in the CZTUA has improved since the implementation of the RES in 2007. The results showed that: (1) the ILUE in the CZTUA increased from 0.25 in 2003 to 0.48 in 2018; (2) from 2007 to 2018, the establishment of the RES increased the ILUE in the CZTUA by 24.6%; (3) gross domestic product and the secondary industry structure ratio had key roles in improving the ILUE in the CZTUA; (4) there is an inverted U-shaped relationship between economic development and the ILUE in the CZTUA; (5) since the establishment of the RES, the pollution emission index of the CZTUA has clearly decreased each year. These findings not only provide a reference for the Chinese government for following up the formation of the RES and its promotion in other regions of China, but may also contribute to sustainable economic development in other transitional countries in the world.

1. Introduction

Since China’s reform and opening up, industrialization and urbanization have advanced rapidly, leading to a prosperous industrial economy [1,2]. In 2019, China accounted for 28.7% of global manufacturing [3]. However, China’s growing industrial production comes at the cost of excessive resource consumption and environmental pollution [3,4,5]. China is one of the top ten manufacturing countries in the world, ranking first in 2019 [3]. According to the environmental sustainability index released by the World Economic Forum (2005), China is near the bottom of the ranking (133 out of 144) [4]. Currently, China accounts for 27.3% of global carbon dioxide emissions and 14.9% of the world’s greenhouse gas emissions, with pollution emissions per unit of gross domestic product (GDP) more than 10 times the average of developed countries [6]. In addition, China is facing challenges of sustainability, such as soil erosion, desertification and loss of biodiversity [6]. How to balance economic development and environmental protection for a large population with scarce land resources has become an urgent problem [7,8,9,10,11].
It is not only in China where environmental issues have become an issue since the 1980s; as the process of industrialization continues to accelerate, many countries have experienced ecological and environmental problems, such as environmental pollution and a decline in biodiversity [12,13]. To solve these problems, different countries have formulated different policies. The developed countries headed by the European Union and the United States, in the process of continuously advancing the development of environmental tax reforms, have gradually explored a path suitable for their own economic development and environmental protection. Europe became a pioneer in the reform of the global environmental tax system in the 1990s [14,15,16]. Finland was the first country in the world to impose a carbon tax to control carbon dioxide emissions. Singapore and Japan in Asia also experienced the process of “pollution first, treatment later”. The rapid development of the industrial economy has brought serious environmental pollution to Singapore [14]. In order to solve this problem, the Singaporean government formulated an ecological accountability system, emphasizing the protection of the ecological environment through legislative means and public participation [17,18,19]. Japan has promulgated more than 100 environmental protection laws and regulations over 30 years. These laws and regulations have raised the awareness of environmental protection of the public and promoted technological innovation and industrial transformation [20,21].
As a developing country, due to the pressures on resources, the environment and development, the Chinese government launched a project to establish a resource-saving and environmentally friendly society (RES). A resource-saving society aims to conserve resources, use resources rationally and increase resource utilization. The overall goal is to obtain the maximum economic and social benefits with the lowest consumption of resources, to guarantee the sustainable development of the economy. In contrast, an environmentally friendly society pursues a social development model in which humans can live in harmony with nature. This model considers the ecological carrying capacity and environmental capacity and requires human beings to respect the natural environment and protect ecosystems. The Chinese government is committed to the goal of building the RES with the hope that this will accelerate social and economic development, improve resource utilization, and transform industrialization, while protecting the environment [11,22]. Resource conservation and environmental protection are the two main purposes of the RES. For sustainable economic development, resources should be economically and intensively used without destroying the ecological balance, the environment should be protected, and the overall efficiency of resource utilization should be improved. The use of industrial land is important for China’s economic development and has major impacts on the sustainable development of Chinese cities [22]. As an important resource, the rational use of industrial land is necessary for the sustainable development of the economy and for protecting ecosystems [23,24,25,26]. Therefore, optimizing the allocation of industrial land and improving the industrial land use efficiency (ILUE) is an important goal for the RES.
In 2007, the Chinese government officially announced that the Changsha–Zhuzhou–Xiangtan urban agglomeration (CZTUA) would be a pilot for establishing the RES. It was the first area where an RES would be implemented in China [27]. However, has the establishment of the RES by the Chinese government led to the optimization of the rational allocation of industrial land resources, improvements in the ILUE, and the achievement of sustainable development?
To answer the above question, 13 prefecture-level cities were studied in Hunan Province (including the CZTUA). A slack-based measure (SBM) model based on data envelopment analysis (DEA) was used to evaluate the ILUE of these cities, including undesirable outputs (industrial wastewater emissions, industrial sulfur dioxide emissions, and industrial smoke and dust emissions). We collected panel data from 2003 to 2018 and used the difference-in-differences method (DID) for policy evaluation to investigate whether resources have been saved and the ILUE has improved since the implementation of the RES in 2007. In addition, to illuminate the relationship between economic development and the ILUE in the CZTUA, we analyzed a Kuznets curve. Furthermore, a pollutant emission coefficient was developed to investigate the implementation of the goal of protecting the environment in an environmentally friendly society.
This research is expected to be a reference for the Chinese government for following up on the establishment of the RES, and subsequently, for exploring ways to save land resources. It may also provide a practical reference for other countries aiming to achieve sustainable economic development.

2. Literature Review and Hypothesis

2.1. Literature Review

In the 1960s and 1970s, the international community began to strongly call for protection of the environment [28,29]. Scholars from various countries published many papers that reflected on human behaviors in the past that had consumed large amounts of resources and destroyed the environment. They pointed out that governments needed to incorporate the effective use of resources and environmental protection into their policies. As early as 1962, American economist Kenneth Boulding proposed that only by protecting the environment could humanity reconcile economic development with serving the needs of society, conserving resources and protecting the environment [30,31]. These studies prompted governments around the world to attach more importance to the coordinated development of the economy, resources and the environment. Building the RES is the rational consequence of today’s global development. The publications of the United Nations Declaration of the United Nations Conference on the Human Environment in 1972 to the “Environmentally friendly Society” in Agenda 21 in 1992 have marked the deepening of our understanding of the relationship between humans and nature [32,33,34,35,36].
Scholars at home and abroad have mostly concentrated on three aspects of the RES: the evaluation system, the evaluation methods, and how it is established. Scholars have conducted a considerable amount of exploration and research into an evaluation system for the RES, including a comprehensive evaluation of resource conservation and environmental friendliness from the perspective of the economy, society, and resource utilization [33,37,38,39,40]. After the 1992 United Nations Conference on Environment and Development, various international organizations, governments, and academics paid increasing attention to how to measure sustainable development [41,42,43,44]. In 1995, the World Bank proposed measuring the sustainable development of countries based on national wealth or national capital per capita. In 1996, the United Nations Commission on Sustainable Development proposed a framework of core indicators for sustainable development. However, some scholars later pointed out that there were too many indicators. Thus, the Scientific Committee on Problems of the Environment proposed a new method that could overcome this shortcoming. Based on China’s national conditions, Chinese scholars have constructed a comprehensive evaluation index for the RES that considers resource conservation, economic level and urban charm [45,46,47,48,49]. The RES should be evaluated quantitatively. Methods include a comprehensive weighted-average index, an analytic hierarchy, and a fuzzy comprehensive evaluation [45,46,47,48,49]. As for how to develop the RES, scholars have mainly conducted research on the transformation of governmental functions, scientific and technological investments, and the transformation of economic development models [43,44,45]. Similarly, to promote the establishment of the RES, Chinese scholars generally believe that the Chinese government should transform governmental functions, change the economic development model based on high inputs and low outputs, and increase investments in science and technology [45,46,47,48,49].
Chinese and foreign scholars have conducted wide-ranging research on the ILUE, including evaluation methods, regional differences in the ILUE, and factors affecting the ILUE [50,51,52,53,54,55,56,57,58,59,60]. Evaluation methods for the ILUE need to be quantitative. Existing methods include DEA, the Cobb–Douglas production function, stochastic frontier analysis, multi-criteria decision-making theory, geographic information systems, the direction distance function, and the Malmquist–Luenberger index [50,51,52,53,54,55]. For example, Zhao et al. (2016) used stochastic frontier analysis to measure the technical efficiency of inputs and outputs based on provincial panel data for China from 2007 to 2013. They also measured the technical efficiency in calculating the ILUE without undesirable outputs. Regional differences in the ILUE have mainly been studied from the perspective of different countries, different provinces, and at different levels of urban economic development [55,56,57,58,59,60]. In recent years, many Chinese scholars have studied regional differences in the ILUE in China’s eastern, central, and western regions, and prefecture-level cities [57,58,59]. Factors that affect the ILUE from a micro-perspective include the type of industrial enterprise, intensity of industrial land use, scale of enterprises, geographical location, regional characteristics of mineral resources and infrastructure, and degree of openness [55,56,57,58,59,60]. Moreover, scholars have studied the impact on the ILUE at a macro level of land property rights, urban construction, social and economic factors, and the government’s industrial land supply [55,56,57,58,59,60,61,62]. For example, Gao et al. [62] found that the agglomeration of industrial land is affected by price regulation in the national land policy. Regulating industrial land prices improved the ILUE.
Although some progress has been made, most methods for calculating the ILUE in existing studies do not include undesirable outputs, and few studies have evaluated the impact of government policy on the ILUE. Our literature review indicates that few scholars have studied the impact of the RES on the ILUE, and our research may fill this gap. This paper makes the following four contributions. Firstly, we used a DEA–SBM model to calculate the ILUE of 13 prefecture-level cities (including the CZTUA) in Hunan Province. We incorporated undesirable outputs to make the ILUE more objective and accurate. Secondly, after adding control variables that may affect the ILUE, this paper used the difference-in-differences method (DID) for policy evaluation to calculate the net effect of the RES on the ILUE in the CZTUA, which may serve as an empirical reference. Thirdly, we analyzed a Kuznets curve to understand the relationship between economic development and the ILUE in the CZTUA. Finally, we used a pollutant emission coefficient to assess the relationship between industrial production and pollution emissions in the CZTUA.

2.2. Research Hypothesis

2.2.1. Theoretical Basis

As production increases, more industrial land is needed. How to reduce industrial production costs, reduce industrial land input, and increase production income has become the focus of economic research. A core factor in economic growth is the substitution of various inputs and technological progress. The classic theory that most directly relates to industrial land use is the law of diminishing returns, which was proposed in 1815 by a British researcher [60,61,62,63,64,65,66,67]. Land remuneration refers to the benefits obtained by inputting labor, capital, material, technology, and other production factors into a piece of land. The law of diminishing returns describes the relationship between land inputs and benefits [60,61,62,63,64,65,66,67,68,69]. According to the law, for the same level of technology and for the same type of inputs, with a continuous increase in the inputs, at some point, the income earned from the land will decrease instead of increasing, because the production capacity of land has a limit [70]. When the limit is reached, even if we continue to increase production inputs, we will not increase the outputs, and there may be a “negative growth” of benefits. This theory has inspired scholars to think about the appropriate level of investment in land. Due to the law of diminishing returns, the land, capital, labor and other factors invested in production need to be moderated. To attain the efficient use of urban land and to attain the most benefits with the fewest inputs, it is necessary to control the scale of investments, optimize the allocation of resources, and improve the efficiency of land use.
In different stages of economic development, the utilization of land resources has different characteristics. With economic development and social progress, the substitution between land and capital gradually becomes stronger. From the classical economics theory of factor input, we can see that in the early stages of economic development, natural land factors have an absolute advantage in production. With continuous changes in the quantitative allocation of land and other factors of production, the efficiency of land use constantly changes. American mathematician Cobb and economist Douglas put forward the famous Cobb–Douglas production function of input–output analysis after studying the influence of the amount of capital and labor in the United States on manufacturing output from 1899 to 1922 [63]. This function assumes that at different stages of production, technological progress and economic development, due to different policy environments, investment will lead to an increase or decrease in economic output of land, thereby affecting the efficiency of land use.

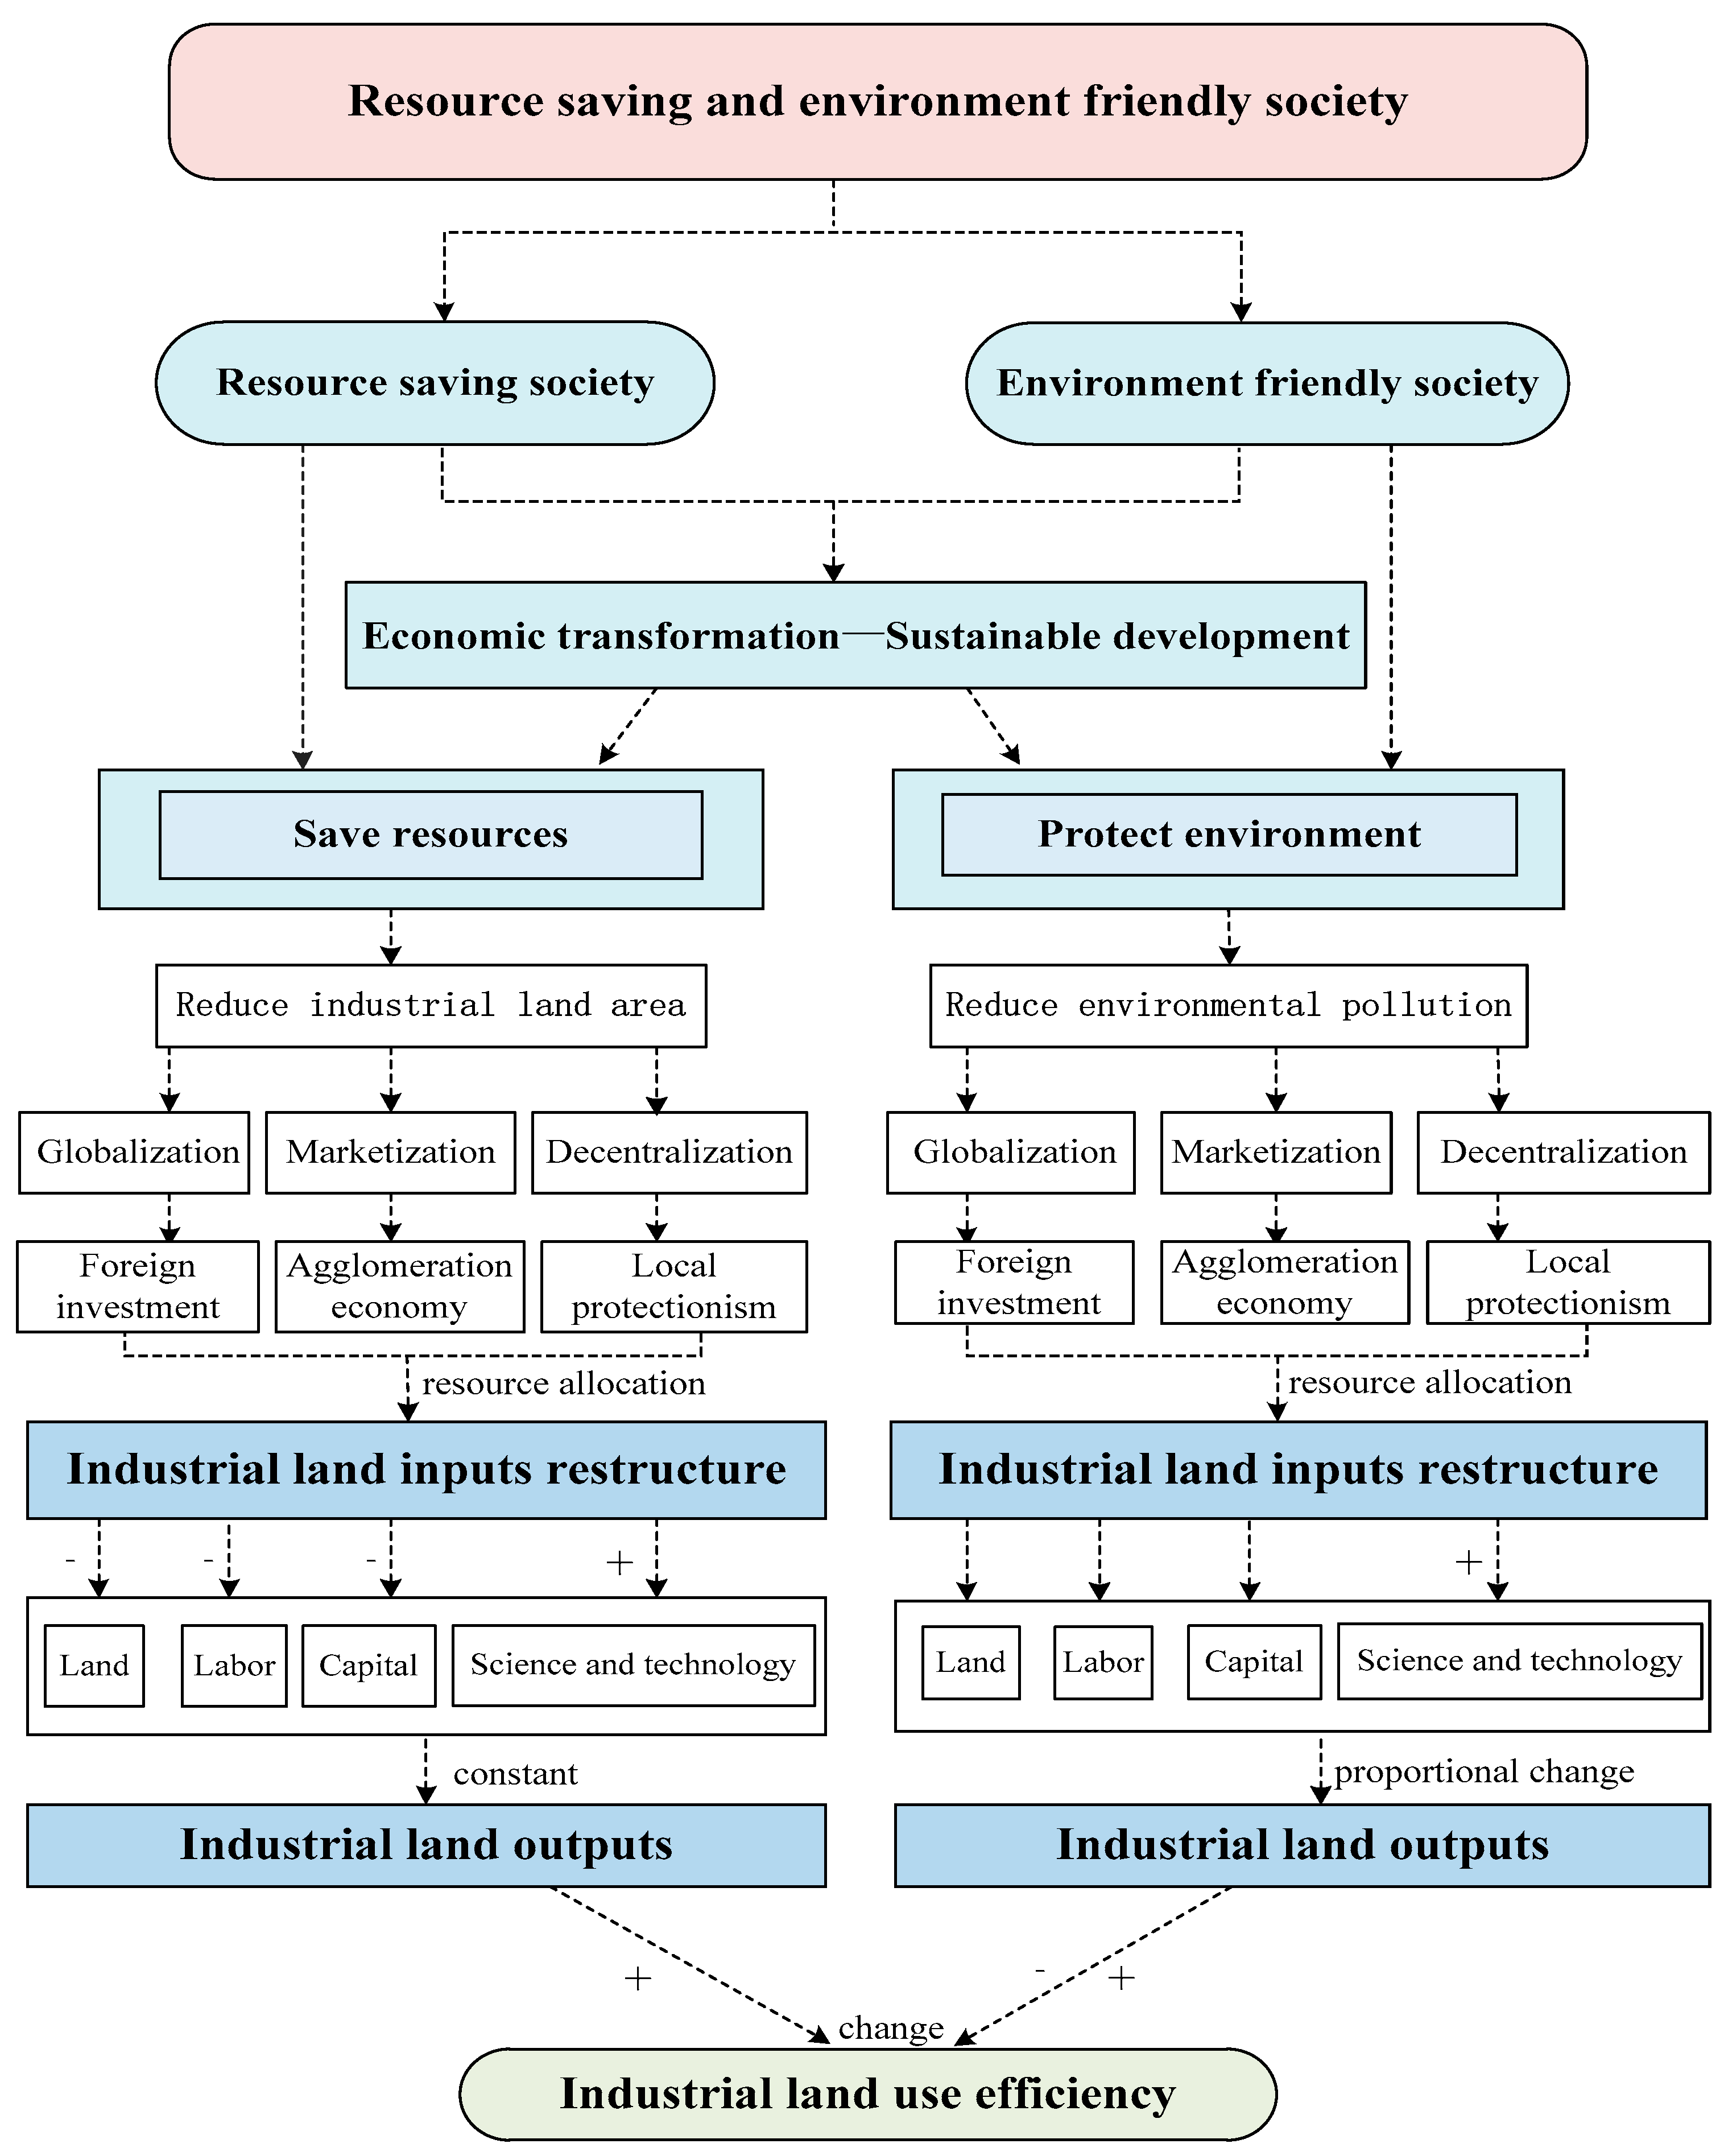
2.2.2. Conceptual Framework and Research Hypothesis

The RES launched by the Chinese government consists of two parts: building a resource-saving society, and building an environmentally friendly society (Figure 1). The core of the former is resource conservation, whereas the core of the latter is protecting the environment [65,66,67,68,69,70,71,72,73]. The common goal is to promote economic transformation and achieve sustainable development. Marketization, globalization, and decentralization are three powerful forces acting on China’s regional economic structure [64], and they are also important perspectives for analyzing China’s regional economic transformation and development. This paper holds that the establishment of the RES and the ILUE in the CZTUA are affected by these three forces. With this theoretical basis, the figure illustrates how the establishment of an RES will affect the ILUE in the CZTUA under the combined influence of marketization, globalization and decentralization.
On the one hand, when building a resource-saving society, social and economic development must be based on resource conservation. To achieve sustainable development, the CZTUA governments mainly aim to save resources by reducing their investment in industrial land. Land, labor, capital and technology are the main factors of land production. According to the Cobb–Douglas production function, changes in land inputs and land outputs will affect land use efficiency [53]. This paper assumes that in building a resource-saving society to save resources, the CZTUA will be affected by the three forces of marketization, globalization and decentralization. With the reorganization of labor, technology and capital, the ILUE in the CZTUA will decrease or increase. The following three situations may occur:
1. With increasing globalization, foreign investment also increases [64,65]. Foreign investment has significant technological spillover effects on the CZTUA, including demonstration effects, competition effects, industrial linkage effects, and human capital effects. Foreign investment promotes science and technology [64], increases the intensive utilization of industrial land, and reduces industrial land investment. Moreover, foreign investment promoted by globalization results in high-efficiency and high-yield land for commerce, business services and tertiary industries. The increased high-efficiency and high-yield land compensates for the reduced industrial land output, resulting in total land output remaining constant. To achieve the goal of saving resources by a resource-saving society, the input of labor and capital and other production factors in production have to be reduced accordingly. In this case, the production input of industrial land decreases while output remains unchanged, and the ILUE increases.
2. In terms of marketization, the opening of markets has promoted cross-regional cooperation among the three prefecture-level cities in the CZTUA. The CZTUA’s local governments have strengthened their economic cooperation and brought into play the advantages of different regions. Regional cooperation results in resource sharing between the regions. It has optimized resource allocation, promoted the free and orderly flow of production factors, and reduced resource consumption. The input to industrial land is reduced, and production factors such as capital and labor are also reduced [71,72,73]. Moreover, inter-regional economic cooperation promotes industrial agglomeration, which forms an industrial chain, promotes the upgrading of industrial structures, strengthens the intensive use of resources, and increases the unit output of industrial land so that the total industrial output remains unchanged. In this case, as the area of industrial land decreases, other factors of production, such as labor and capital, also decrease. Industrial land production input decreases while output remains unchanged, and the ILUE increases.
3. Decentralization, especially the reform of the tax-sharing system, divides taxes into two sets of tax management systems, central and local, so that the central Chinese government and local governments can manage fiscal affairs separately. Local governments work independently and are responsible for their own regional economic development, which leads to the emergence of local protectionism [64]. This has increased the importance of local fiscal revenue and stimulated competition among local governments. After fiscal decentralization, competitive behavior has forced the local governments in the CZTUA to attract foreign companies and increase foreign investment. Advanced production technology brought by foreign enterprises has increased the production efficiency of industrial enterprises and increased the output of industrial land. Competitive behavior has driven the CZTUA prefecture-level cities to upgrade their industrial structures by focusing on the development of high value-added industries, high-tech industries, and specialized service industries. The upgrading of industrial structures and technological advances are conducive to reducing the input of production resources [73,74,75]. Thus, the area of industrial land remains unchanged, the input of labor and capital and other production factors in production decreases, the input of industrial land production decreases whereas the output increases, and the ILUE increases.
On the other hand, when building an environmentally friendly society, the aim is to create a social model in which humans can live in harmony with nature [73,74,75]. Thus, all aspects of social and economic development must be based on protecting the natural environment and sustainable development. To achieve this goal, the CZTUA governments are striving to transform from an economic development model that pollutes the environment to a green and environmentally friendly model. This paper also assumes that to build an environmentally friendly society, protect the environment and reduce pollutant emissions, the CZTUA governments will be affected by the three forces of marketization, globalization and decentralization. Changes to the ratio of desirable outputs to undesirable outputs of industrial land will increase or decrease the ILUE. The following three situations may occur:
1. Globalization can promote technological and management innovation, improve production conditions, and reduce pollution levels [74]. Switching to light industries, advanced production technology, and higher environmental standards may reduce pollution emissions and reduce undesirable outputs (e.g., industrial wastewater emissions, industrial sulfur dioxide emissions, and industrial smoke and dust emissions) in industrial production [73,74,75]. The advanced production technology introduced by foreign enterprises has reduced environmental pollution due to industrial production, and also promoted efficient production by enterprises; therefore, desirable industrial outputs have increased accordingly. If the input of industrial land remains unchanged and the inputs of labor and capital factors remain unchanged, whereas the desirable outputs increase and the undesirable output decreases, then the ILUE increases.
2. The market is not only a resource allocation tool, but also an incentive mechanism [76]. Marketization promotes the effective allocation of resources and also encourages enterprises to buy high-tech production equipment. This may lead to changes in the production capability of enterprises, so that they emit fewer pollutants for the same quantity of resources, which reduces the undesirable outputs. The need for an environmentally friendly society to protect the environment has meant that small industrial enterprises emitting serious levels of pollution are gradually being replaced by low-polluting enterprises with advanced production technologies. Thus, the desirable outputs from industry have increased accordingly. Similarly, if the input of industrial land remains unchanged and the input of labor and capital remain unchanged, the desirable output increases and the undesirable output decreases, then the ILUE increases.
3. Decentralization has made it impossible for local governments to achieve strict control over their own budgets. However, local governments must increase their fiscal revenue to maintain the balance of revenue and expenditure [64]. In this context, the CZTUA’s local governments have gradually started playing the role of entrepreneurs to promote local economic growth. Moreover, financial pressure has forced the CZTUA’s local governments to attract companies that damage the environment by releasing large amounts of pollution, thus increasing undesirable outputs. In addition, competitive behavior may also cause polluting industries to enter local and surrounding areas [62,67], further increasing pollution and increasing undesirable outputs. In this case, the input of industrial land remains unchanged, the input of labor and capital factors also remains unchanged, and the desirable output remains unchanged; however, because the undesirable outputs increase, the ILUE decreases.
In summary, a resource-saving society is affected by globalization, marketization and decentralization. To save resources, it must adjust its use of land, capital and technology in industrial production, which affects the inputs and outputs of industrial land, which, in turn, affects the ILUE. In the pursuit of environmental protection by an environmentally friendly society, globalization, marketization and decentralization have changed the levels of desirable and undesirable outputs in industrial production, which has affected the ILUE.
Based on the above analysis, this paper proposes the following research hypothesis:
In building the RES, the three forces of marketization, globalization and decentralization act as mutual checks and balances in shaping the influence of the RES on the ILUE. Specifically, the RES affects the ILUE in the CZTUA by changing the input–output structure of industrial land production.

3. Research Area

Hunan Province is in the south-central part of China. It is one of 23 provinces in China. CZTUA is in the central-eastern part of Hunan Province. It has three prefecture-level cities, Changsha, Zhuzhou and Xiangtan. The CZTUA has a total area of 28,000 square kilometers, accounting for one-third of the land area of Hunan Province. The region is distributed along the Xiangjiang River in the shape of a pin. In 2018, the total population of this urban agglomeration was 15.04 million. It had a GDP of CNY 1577 billion, and an urbanization level of 70% [33,36,40,41,42,43,44,45,46,47,48,49,50]. Relying on “the same industry structure, the same transportation network, the same supply of energy, the same finance, the same information, the same ecological construction, and the same governance of the environment”, the CZTUA has become the core growth pole of Hunan’s economic development [45,46,47]. The CZTUA is at the intersection of the east, west and south of China. It is a first-level development and T-shaped axis of China, and is an important industrial base [45,46,47]. As one of the representative economic zones for social development in China, the CZTUA was officially approved in 2007 as a comprehensive pilot zone supporting reform in the establishment of the RES in China. It was the first area to implement the RES in China.

4. Methodology and Data Sources

4.1. Methodology

4.1.1. Calculating the ILUE: SBM Model Based on DEA

A traditional DEA directly evaluates the efficiency of a decision-making unit but does not consider the slack variables of the input elements of the unit. The measurement results are likely to be biased [67,68,69]. To solve this problem, Tone (2001) designed the non-radial and non-angle SBM model based on slack variable measures [68]. Entering variables into the objective function accurately solves the above problems. As a non-parametric method, an SBM model does not need to set the optimal behavior target of the producer. Additionally, it does not need to make assumptions about the overall parameters or the form of the production function. The result is better stability. Based on the above analysis, this study used the SBM model with undesirable outputs built following the work of Zhao et al. [69]. The formula is as follows:
ρ = min 1 1 N n = 1 N s n x x k n t 1 + 1 M + I ( m = 1 M s m y y k m t + i = 1 I s i b b k i t )
where
{ t = 1 T k = 1 K z k t x k n t + s n x = x k n t , n = 1 , , N , t = 1 T k = 1 K z k t y k m t s m y = y k m t , m = 1 , , M t = 1 T k = 1 K z k t b k i t + s i b = b k i t , i = 1 , , I z k t 0 , s n x 0 , s m y 0 , s i b 0 , k = 1 , , K
where ρ is the efficiency value to be calculated, and   N ,   M and   I are the number of inputs, desirable outputs and undesirable outputs, respectively.   ( s n x , s m y , s i b ) is the input–output relaxation vector. ( x k n t , y k m t , b k i t ) is the input–output value of the k production unit in the period t . z k is the weight of the decision unit. The objective function ρ strictly decreases with respect to s n x , s m y and s i b .

4.1.2. Difference-in-Differences Method: Measuring the Net Effect of the RES on the ILUE

The DID method is used to assess the effects of a public policy. The basic idea is to treat public policy as a natural experiment. To evaluate the net impact of a policy, the sample data are divided into two groups. The treatment group is affected by the policy, whereas the other group, the control group, is not affected by the policy [70,71]. According to the first difference before the implementation of the policy, two sets of changes can be obtained. After the first difference, the heterogeneity of the individual data points that do not change with time can be eliminated; then, the two sets of changes are used to calculate the second difference to eliminate the increase over time. In the end, the net effect of the policy implementation will be obtained.
This paper regards the impact of the RES on the ILUE in the CZTUA as a natural experiment, and the DID method enables us to obtain accurate results. We compared the difference in the growth rate of the ILUE before and after the implementation of the RES. The three prefecture-level cities of CZTUA in Hunan Province that have implemented the RES were the treatment group. The remaining 10 prefecture-level cities in Hunan Province were in the control group. If the result was significant, the growth rate of the ILUE in the CZTUA where the RES was implemented would exceed that of prefecture-level cities that have not implemented the RES.
Thus, we set up the following model:
I L U E i t = α 0 + α 1   d i d i t + β C i t + μ i t
where I L U E i t is the explanatory variable reflecting the ILUE in area   i in year t , and d i d is the interaction term between the control group and the control period variable, which is also a core explanatory variable of this paper. It is used to evaluate the net policy effect of the RES on the regional ILUE. If the RES has been implemented, then d i d = 1 ; otherwise, it is set to 0. β C i t   is the control variable in this paper, which included SIS, PCG, GDP, POP, GOV, FDI and Market (these terms are defined below). μ i t   is a random error term. α 1 is the core estimation parameter, which is the main focus of this paper. It is used to measure the net effect of the establishment of the RES on the ILUE. If α 1 > 0 , the RES promotes the ILUE, whereas an inverse result shows that the RES inhibits the ILUE.

4.1.3. Relationship between Economic Development and ILUE: Kuznets Curve

The famous environmental Kuznets curve refers to the inverted U-shaped curve between environmental pollution and per capita income. It indicates that, in the early stage of economic development, environmental pollution increases with income, but when per capita income reaches a certain level, environmental pollution will be reduced and the environment will gradually improve [72,73]. To examine the relationship between economic development and the ILUE in the CZTUA, a Kuznets curve was constructed for the ILUE and economic development to determine whether the relationship between economic development and ILUE in the CZTUA followed an inverted U-shaped curve and whether economic development in the CZTUA mainly depended on an increase in industrial land resources. We set the level of economic development as the independent variable and the ILUE as the dependent variable. We used the following panel data model:
I L U E i t = α i + β 1 x i t + β 2 x i t 2 + ε i t
where I L U E i t and   x i t are the ILUE and economic development level of area i in year t , respectively.   α i is the intercept. β 1 and β 2   are the estimated coefficients of the independent variables. ε i t   is a random disturbance term. If β 1 > 0 and β 2 < 0 , then the relationship between economic development and the ILUE is an inverted U-shaped curve. If β 1 < 0 and β 2 > 0 , then the relationship between economic development and the ILUE is a U-shaped curve. Finally, when β 0 and β 2 = 0 , the relationship between economic development and the ILUE is linear. Based on previous studies [72,73], in this model, we used GDP as the indicator of economic development.

4.1.4. Pollution Emission Coefficient

To consider the relationship between industrial production and pollution emissions in industrial production in the CZTUA and to investigate the implementation of the goal of protecting the environment by an environmentally friendly society, a pollutant emission coefficient based on previous studies was used [74,75,76,77]. It was calculated as follows:
P i t = T i t / Y i t
where P i t is the pollution emission coefficient of city   i   in year t , T i t is the total discharge of pollutants in city   i   in year t , and Y i t   is the total industrial output of city   i in year t . The higher the value of P i t , the higher the level of pollution emissions of the city in that year.

4.2. Variable Selection

4.2.1. Input and Output Indicators for Evaluating the ILUE

Based on previous studies [50,51,52,53,54,55,56,57,58,59,60], this study used the following input and output indicators for calculating the ILUE of a city (Table 1).

4.2.2. Control Variables

Based on previous studies [50,51,52,53,54,55,56,57,58,59,60,61,62,63,64,65] and the theoretical analysis in our previous paper, globalization, marketization, decentralization, the level of economic development, secondary industry structure ratio and the size of the population were selected as control variables that may affect the ILUE (Table 2).
Globalization was represented by foreign direct investment (FDI). Decentralization was represented by the ratio of government fiscal expenditure to GDP, which is an indicator of the financial pressure on a government (GOV). Marketization was represented by the proportion of land transferred through bidding, auctions and listings compared to total land transfers (Market).
GDP and per capita GDP (PCG) represent the level of economic development. Regions with relatively higher levels of economic development pay more attention to the quality of industrial economic development, and high-quality industrial economic development usually requires a higher ILUE. The ratio of secondary industries to GDP is called the secondary industry structure ratio (SIS). The size of the SIS affects the intensity of industrial land use, and the strength of industrial land use affects the ILUE. The size of the population (POP) is represented by the number of registered urban residents. POP affects the utilization of industrial land and thus affects ILUE. PCG and GDP are logarithmic.

4.3. Data Sources

The ILUE measurement data and regression equation panel data used in the research were from the China Land Market Website (http://www.landChina.com/, the time we log on to the website to obtain data is 7 December 2020), China Urban Construction Statistical Yearbook and China Urban Statistical Yearbook. The total industrial output values in some years were from the Statistical Bulletin of National Economic and Social Development.

5. Results

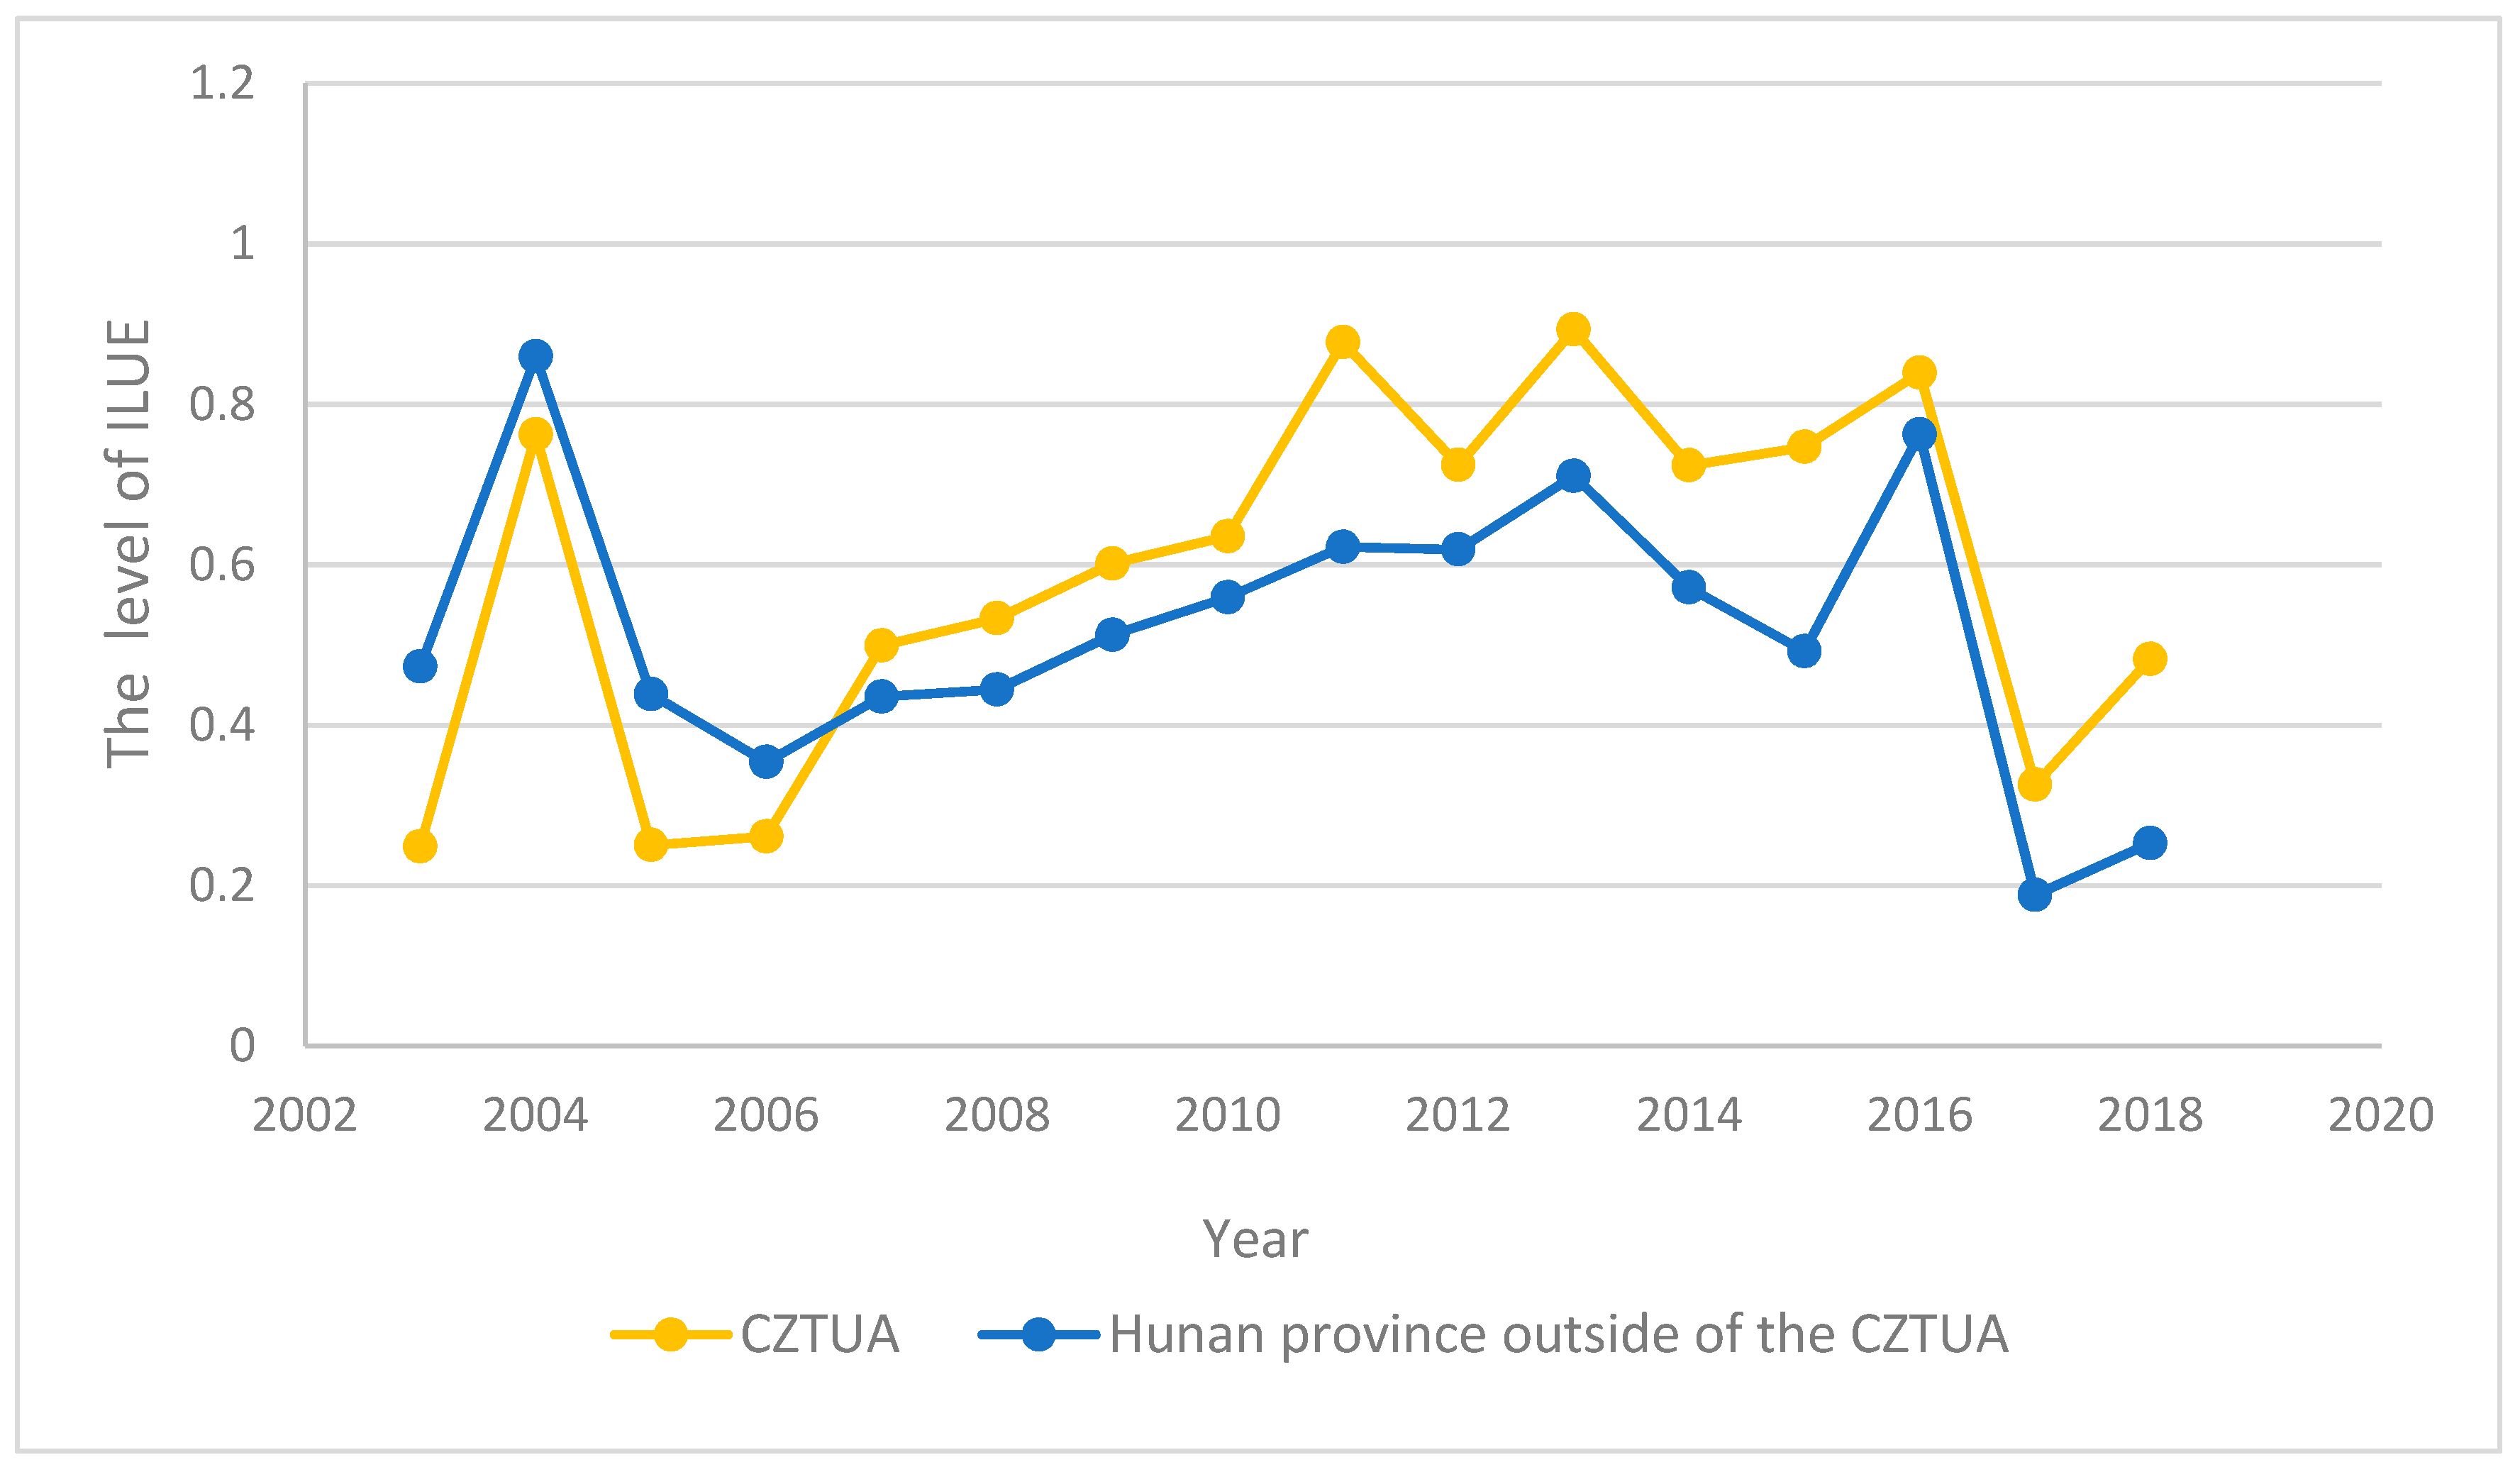
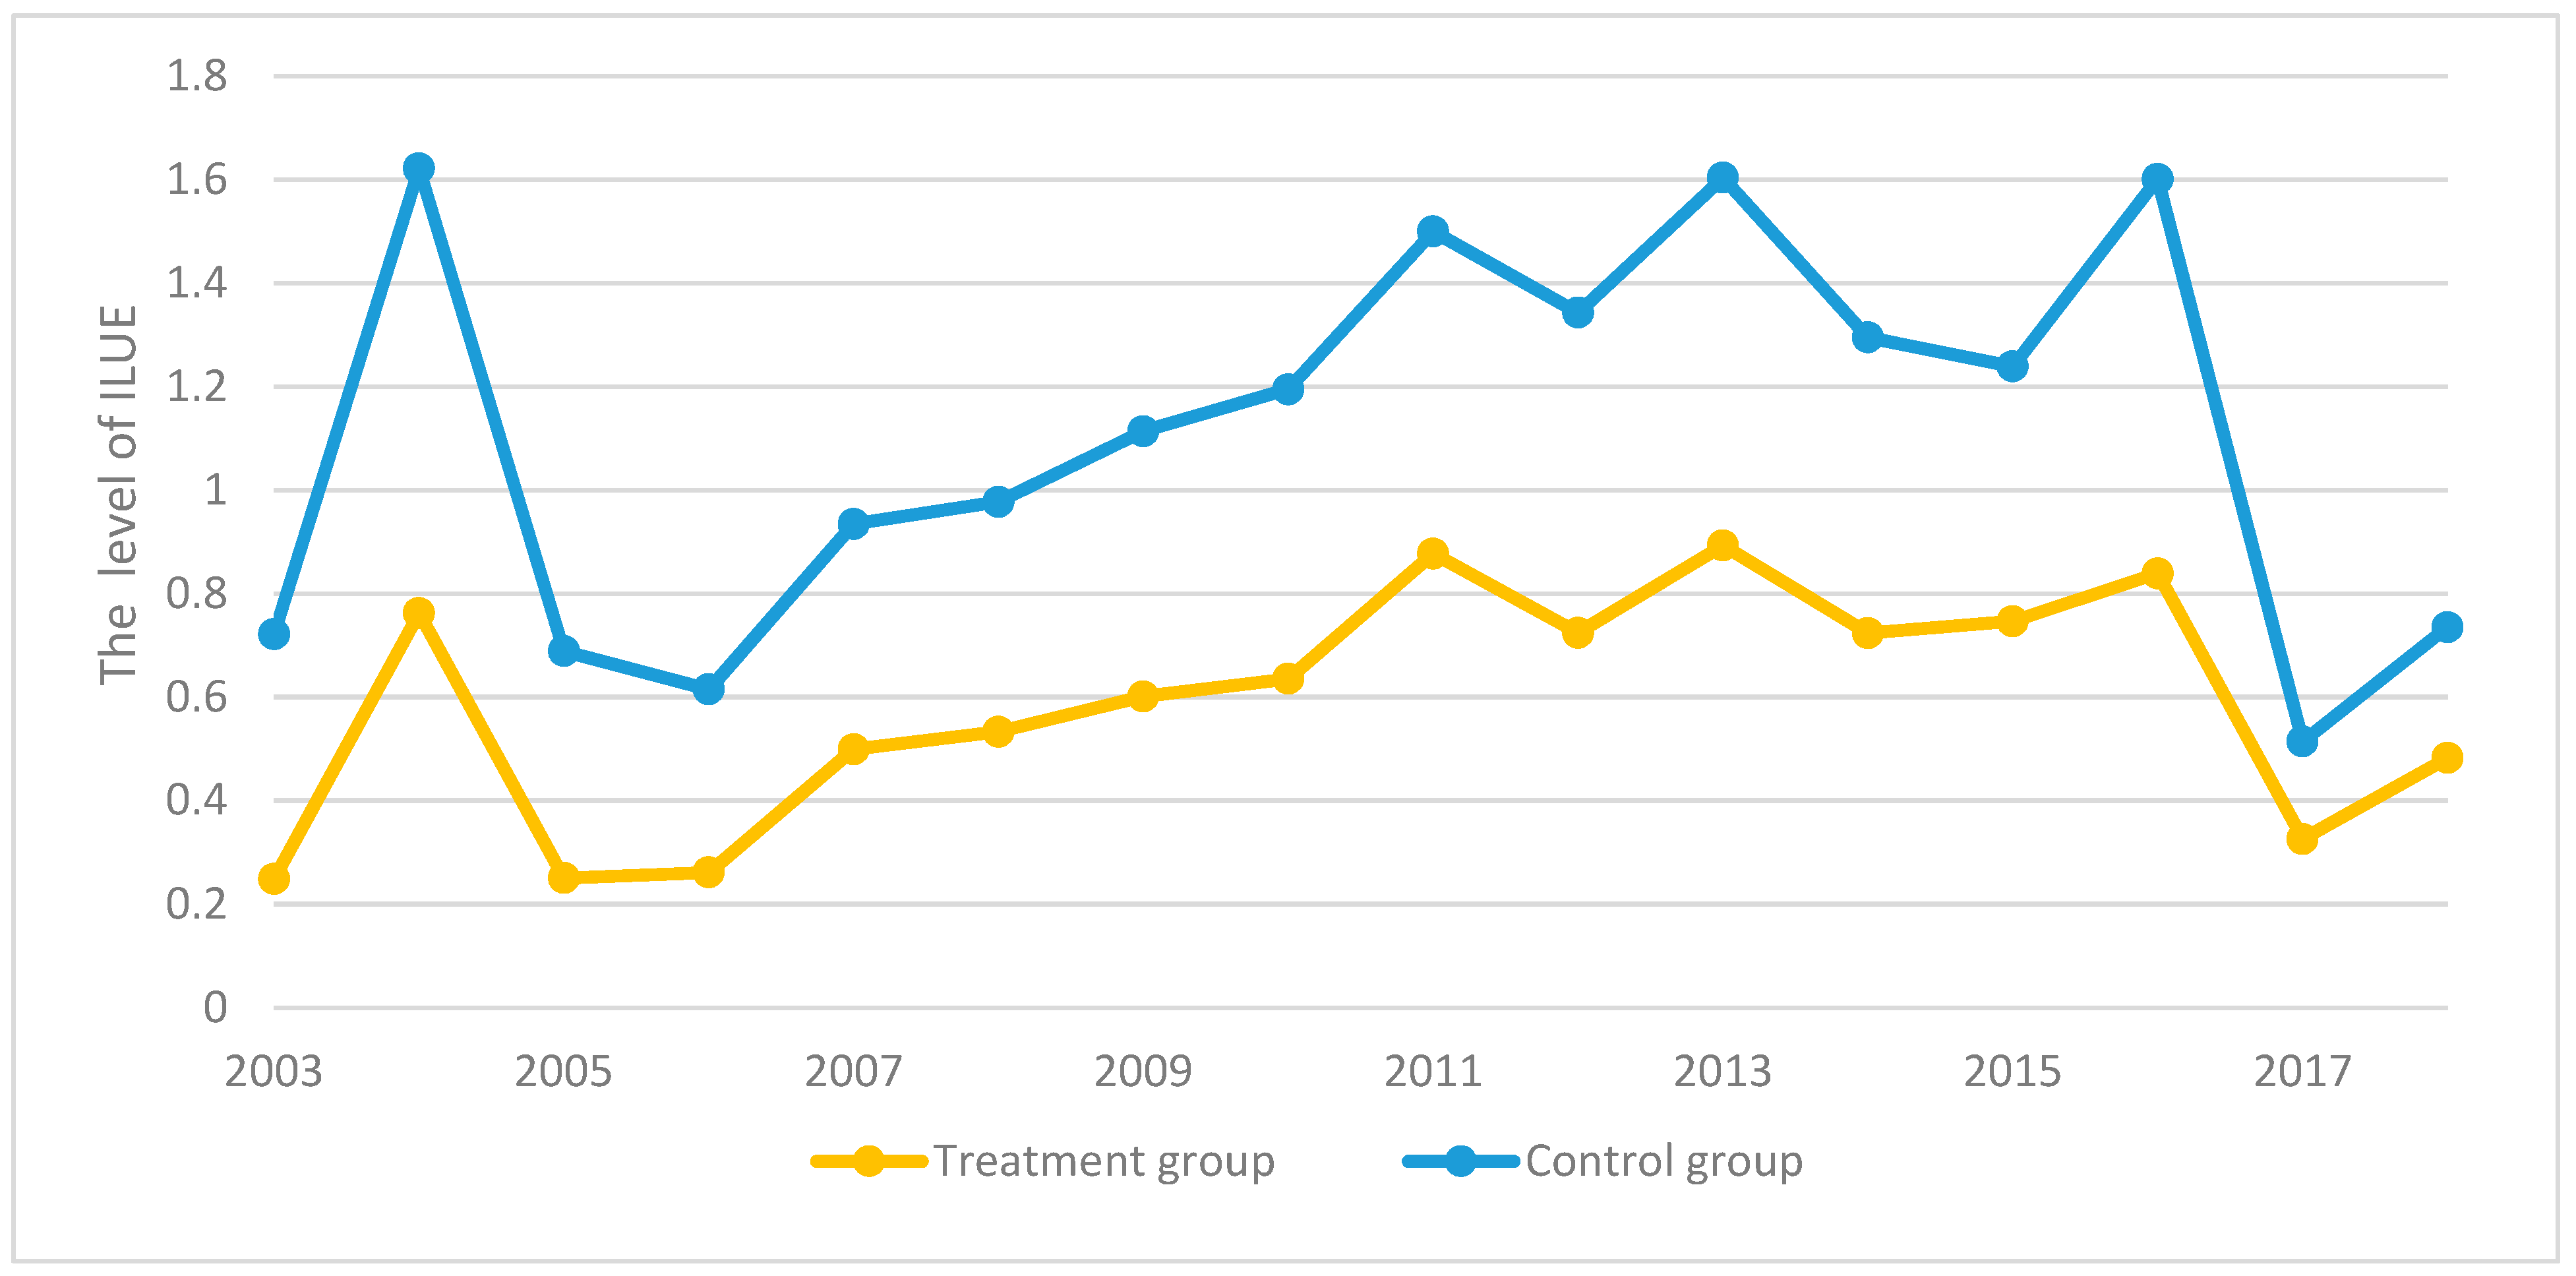
5.1. Change in the ILUE

From the SBM model, the average ILUE in the CZTUA was 0.25 in 2003 and 0.26 in 2006. Thus, the average annual growth rate was small. In 2007, through the establishment of the RES, the ILUE in the CZTUA increased to 0.50. During the study period, the maximum ILUE in the CZTUA was 0.89 in 2013 and the minimum was 0.25 in 2003. The maximum and minimum average values of the ILUE of prefecture-level cities in Hunan Province outside the CZTUA were 0.47 in 2003 and 0.35 in 2006. Thus, the ILUE increased and decreased over the years. In 2007, through the establishment of the RES, the ILUE of prefecture-level cities in Hunan Province outside the CZTUA was 0.44. During the study period, the maximum average value of the ILUE for prefecture-level cities in Hunan Province outside the CZTUA was 0.71 in 2013 and the minimum was 0.19 in 2017.
From a single-city perspective (Table 3), among the three cities in the CZTUA, the maximum annual average of the ILUE for the 16 years from 2003 to 2018 was 0.84 in Changsha, and the minimum value was 0.45 in Zhuzhou. The maximum annual average of the ILUE for the 16 years from 2003 to 2018 among prefecture-level cities in Hunan Province outside the CZTUA was 0.92 in Zhangjiajie, and the minimum was 0.36 in Changde.
Figure 2 shows that Changsha had an average 4-year ILUE of 0.481 from 2003 to 2006, before the implementation of the RES. From 2007 to 2018 after the implementation of the RES, the average ILUE for these 12 years was 0.964, and the ILUE was significantly improved. Similarly, for Zhuzhou, it rose from 0.36 to 0.49, and for Xiangtan, it rose from 0.30 to 0.53. The ILUE values of the three cities in the CZTUA significantly improved after the implementation of the RES.
From Figure 2, we can see that in the research period, the ILUE changed more in the CZTUA before and after the establishment of the RES than in the other prefecture-level cities in Hunan Province.

5.2. Robustness of DID

5.2.1. Parallel Trend Test

When using the DID method, if the trends for the treatment group and the control group before the implementation of the policy are consistent, then the control group is appropriate [70,71,72,73,74]. Figure 3 shows that from 2003 to 2006, the differences in the ILUE between the treatment group and the control group were basically stable, indicating that the control group selected in this paper was appropriate.

5.2.2. Placebo Test

The core idea of a placebo test was to regress the fictitious treatment group by selecting one year before the policy had been implemented as the treatment [70,71,72,73,74]. We assumed that the policy implementation year was 2005 and selected the control group which was not affected by the policy implementation as the treatment group for regression. Table 4 shows that the regression coefficient of the DID estimator under the virtual method was negative. Therefore, the impact of the RES on the ILUE in this virtual case was negative. This indicates that the original estimation was not biased. Thus, this confirmed that the DID method was suitable for this study.

5.3. Regression Results for the Impact of the RES on the ILUE

After controlling for other possible variables, the DID method was used to estimate the net impact of the RES on the ILUE (Table 5). According to the results for the panel model, there was no multicollinearity among the independent variables. The Hausman test rejects the random effects model; therefore, we used the fixed effects model as the final estimate of the model. The model results show that the RES accounted for 24.6% of the ILUE, indicating that the RES may have promoted improvements in the ILUE. This confirms the research hypothesis in this paper. Moreover, among the control variables, the SIS and GDP have a positive role in promoting the ILUE, whereas FDI and Market have a negative role.

5.4. Verification of the Kuznets Curve for Economic Development and the ILUE

According to the Kuznets model, economic development in the CZTUA has an inverted U-shaped relationship with the ILUE (Table 6). This indicates that the evolutionary trend is rapid growth followed by slow growth and then flattening and dynamic decline, which suggests that economic growth in the CZTUA is still supported by an increase in the input of resources such as industrial land.

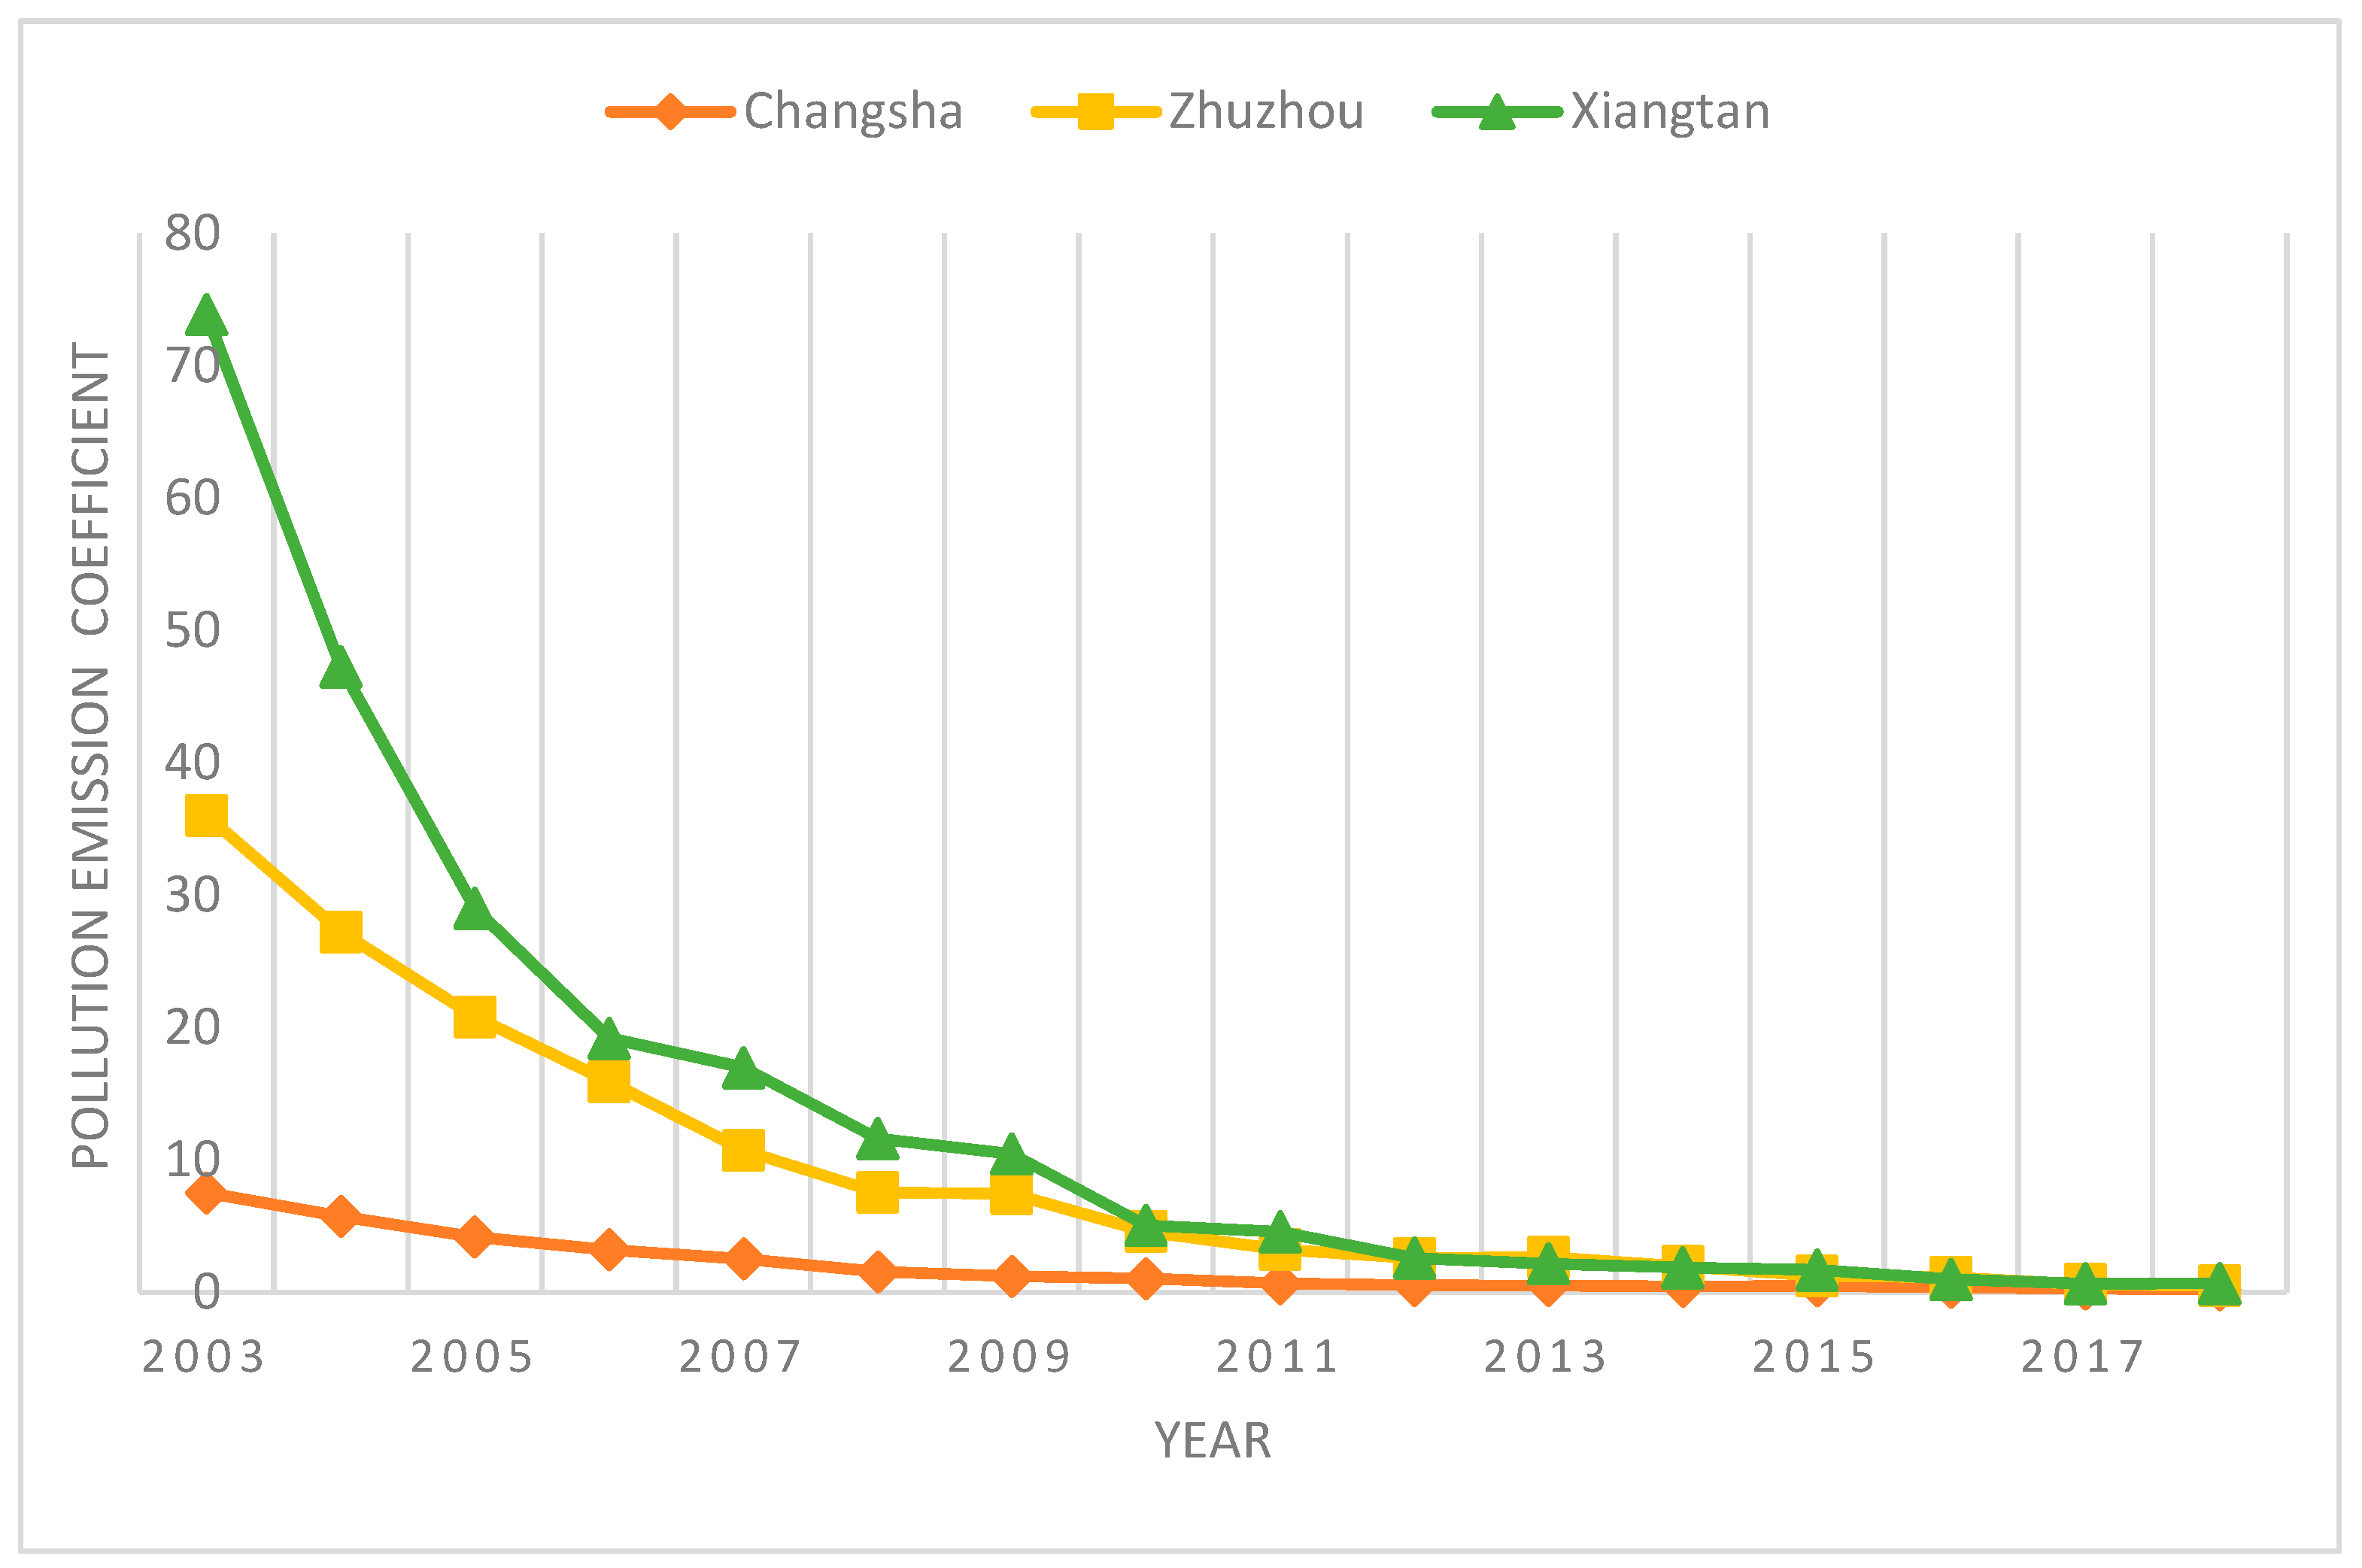
5.5. Pollution Emission Coefficient

The pollution indexes of the three cities in the CZTUA fell significantly each year since the RES was established (Figure 4). The pollution index of Changsha dropped from 2.53 in 2007 to 0.21 in 2018. For Zhuzhou, it fell from 10.73 in 2007 to 0.51 in 2018, and for Xiangtan, it dropped from 16.98 in 2007 to 0.68 in 2018. This further shows that by initiating the RES, pollution control has been significantly improved and the goal of creating an environmentally friendly society has been achieved.

6. Conclusions and Policy Implications

6.1. Conclusions

China’s industrial land use has long relied on an extensive production model at the expense of considerable resource consumption and environmental pollution. To improve the efficiency of resource utilization while protecting ecosystems, rapidly developing the economy with limited resources and alleviating the increasingly acute contradiction between humans and land, the Chinese government proposed establishing the RES. This policy was officially implemented in the CZTUA in 2007. To verify whether the establishment of the RES has improved the efficiency of resource utilization and the ILUE in the CZTUA, this study selected 13 prefecture-level cities in Hunan Province (including the CZTUA) as the research object and used a DEA–SBM model to analyze the ILUE of these cities, including undesirable outputs (e.g., industrial wastewater emissions, industrial sulfur dioxide emissions, and industrial smoke and dust emissions). We collected panel data from 2003 to 2018 and used the policy evaluation DID method to investigate the impact of the RES on the ILUE in the CZTUA since the implementation of the RES in 2007. The following conclusions can be drawn.
Firstly, the ILUE value in the CZTUA has increased over the years. It rose from 0.25 to 0.48 from 2003 to 2018. However, the overall ILUE was not high, and there is still considerable room for improvement. In the CZTUA, the ILUE of Changsha city was higher than that of the other two prefecture-level cities. The minimum average of the ILUE for prefecture-level cities in Hunan Province outside the CZTUA was 0.19 in 2017, and the maximum was 0.71 in 2013. The ILUE in the CZTUA was higher than that of the other prefecture-level cities in Hunan Province.
Secondly, the establishment of the RES may have improved the ILUE in the CZTUA. According to the results of the panel model test, establishing the RES increased the ILUE in the CZTUA by 24.6% from 2007 to 2018. Moreover, among the control variables, GDP and SIS also played a positive role in promoting the ILUE, because technological innovation and industrial upgrades due to economic development influence the ILUE. The scale of the SIS affects the intensity of industrial land use, which affects the ILUE. In contrast, FDI and Market played a negative role in promoting the ILUE. In addition, the environmental Kuznets curve between economic development and the ILUE in the CZTUA had an inverted U shape, which shows that economic growth in the CZTUA is still supported by increases in the input of resources such as industrial land. This also shows that in the CZTUA, it is necessary to strengthen the basic role of urban industrial land resources in urban development to achieve efficient integration of the ILUE and economic development. We also examined the relationship between industrial production and pollution emissions in the CZTUA. The pollution index of the three cities in the CZTUA dropped significantly since the RES was created, which confirms that pollution control has been significantly improved due to the RES and that the goal of protecting the environment has been reached to a certain extent. These results are consistent with the current national conditions in China, which proves the reliability of the results presented in this paper.
In summary, the results in this paper suggest that the establishment of the RES has improved the ILUE in the CZTUA to some extent. It has achieved the goals of reducing the intensive use of land resources and improving the overall efficiency of land resource use. The establishment of the RES has promoted the sustainable development of CZTUA’s economy.

6.2. Policy Implications

Based on the impact of the RES on the ILUE in the CZTUA, this paper proposes the following policies to promote the improvement of the ILUE and the establishment of the RES in China [75,76,77,78,79,80].
Firstly, the CZTUA governments should guide enterprises in technological innovation. The governments need to introduce innovative energy-saving and environmentally friendly technology, use scientific and technological advances to optimize all aspects of industrial production, reduce the three industrial waste streams (industrial wastewater, industrial sulfur dioxide, and industrial smoke and dust emissions), increase pollution control efforts, and promote energy-saving and environmental protection by enterprises. The governments need to improve the ILUE while protecting the environment. They need to develop a sustainable industrial land use model to achieve the goal of building an environmentally friendly society.
Secondly, the CZTUA governments should further optimize the industrial structure and transform their economic growth mode from extensive development with high inputs and low outputs to intensive development with low inputs and high outputs. They need to use less investment to obtain greater land benefits. They need to improve the ILUE and promote economic development to achieve the goal of building a resource-saving society.
Thirdly, these governments need to continue to implement macro-controls on economic development and implement effective guidance for industrial development. Scientific and technological innovations from investments in advanced industrial land require financial support, and upgrading industrial structure requires capital to enhance industrial technology and resource allocation. Sufficient capital investment is a powerful way to achieve sustainable development through industry, as well as the harmonious coexistence of people and the environment. Therefore, through the RES, the CZTUA governments should continue to strengthen their macro-control, implement effective guidance for industrial development and increase industrial capital investment to provide strong support for technological innovation and economic development.
Additionally, local governments need to formulate differentiated industrial land utilization systems to promote the improvement of the ILUE in different regions. For example, economic development and the ILUE in the CZTUA are significantly higher than in the other regions in Hunan Province, and Changsha is significantly better than the two other prefecture-level cities in the CZTUA. Therefore, each city should focus on the existing problems of industrial land use, formulate an industrial land management system based on local conditions, promote improvements in the efficiency of industrial land inputs and outputs, increase the ILUE, and promote regional economic development.
Finally, economic development must not be at the expense of protecting the environment. In developing their industrial economies, the governments need to use their resources and formulate environmental policies to protect the environment. In building the RES, the CZTUA local governments not only need to work hard to improve the ILUE and economic output, but also need to reduce the ecological impacts of industrial land use and achieve the goal of an environmentally friendly society. Moreover, other transitional countries should pay attention to these results when pursuing sustainable development.

Author Contributions

A.Z. conceived and designed this study. W.P. wrote the paper. L.W. modified the paper. All authors have read and agreed to the published version of the manuscript.

Funding

This research was supported by Major Project of National Social Science Foundation of China (No. 18ZDA054), National Natural Science Foundation of China (No. 71873053; No. 71804054; No. 71603288).

Institutional Review Board Statement

Not applicable.

Informed Consent Statement

Not applicable.

Data Availability Statement

Not applicable.

Acknowledgments

The authors would like to thank the anonymous reviewers for their valuable comments.

Conflicts of Interest

The authors declare no conflict of interest.

References

  1. Madelene, O.; Chen, D. Land-use change: Impacts of climate variations and policies among small-scale farmers in the Loess Plateau, China. Land Use Policy 2006, 23, 361–371. [Google Scholar]
  2. Sun, P.; Yuan, Y. Industrial agglomeration and environmental degradation: Empirical evidence in Chinese cities: Agglomeration and pollution in China. Pac. Econ. Rev. 2015, 20, 544–568. [Google Scholar] [CrossRef]
  3. Richter, F. China Is the World’s Manufacturing Superpower, Statista. 2021. Available online: https://www.statista.com/chart/20858/top-10-countries-by-share-of-global-manufacturing-output/#:~:text=With%20total%20value%20added%20by,the%20country’s%20total%20economic%20output (accessed on 4 May 2021).
  4. Sun, H. Research on China’s “Two-Oriented Society” Construction and “Two-Oriented Industry” Development—Based on the Empirical Analysis of Changzhutan Urban Agglomeration. China Ind. Econ. 2009, 11, 25–34. [Google Scholar]
  5. Xie, H.; Chen, Q.; Lu, F.; Wang, W.; Yao, G.; Yu, J. Spatial-temporal disparities and influencing factors of total-factor green use efficiency of industrial land in China. J. Clean. Prod. 2019, 207, 1047–1058. [Google Scholar] [CrossRef]
  6. Xiang, L. Research on the Construction of “Two-Oriented Society”; Wuhan University: Wuhan, China, 2013. [Google Scholar]
  7. Chen, W.; Shen, Y.; Wang, Y.; Wu, Q. The effect of industrial relocation on industrial land use efficiency in China: A spatial econometrics approach. J. Clean. Prod. 2018, 205, 525–535. [Google Scholar] [CrossRef]
  8. Liu, Y.; Fang, F.; Li, Y. Key issues of land use in China and implications for policy making. Land Use Policy 2014, 40, 6–12. [Google Scholar] [CrossRef]
  9. Yu, J.; Zhou, K.; Yang, S. Land use efficiency and influencing factors of urban agglomerations in China. Land Use Policy 2019, 88, 104143. [Google Scholar] [CrossRef]
  10. Deng, X.; Huang, J.; Rozelle, S.; Zhang, J.; Li, Z. Impact of urbanization on cultivated land changes in China. Land Use Policy 2015, 45, 1–7. [Google Scholar] [CrossRef]
  11. Liu, Y. Introduction to land use and rural sustainability in China. Land Use Policy 2018, 74, 1–4. [Google Scholar] [CrossRef]
  12. Hardy, A. Pollution and control: A social history of the Thames in the nineteenth century. Med Hist. 1987, 31, 233–234. [Google Scholar] [CrossRef] [Green Version]
  13. Hill, C. British Economic and Social History, 1700–1964; Hodder Education: London, UK, 1970. [Google Scholar]
  14. Bergemann, D.; Valimaki, J. Dynamic Common Agency. J. Econ. Theory 2003, 111, 23–48. [Google Scholar] [CrossRef]
  15. William, J.; Wallace, E. The Theory of Environmental Policy; Cambridge University Press: London, UK, 1988. [Google Scholar]
  16. Smulders, J. Economic Growth and Environmental Sustainability; Routledge: London, UK, 2000. [Google Scholar]
  17. Dobbs, T.; Pretty, J. Case study of agri-environmental payments: The United Kingdom. Ecol. Econ. 2008. [Google Scholar] [CrossRef]
  18. Scott, J. European Union Environment Policy and New Forms of Governance. J. Environ. Law 2002. [Google Scholar] [CrossRef]
  19. Borsdorf, A. Population growth and urbanization in Latin America: Some comments on demographic development and urban structural change. GeoJournal 1978, 2, 47–60. [Google Scholar] [CrossRef] [PubMed]
  20. Lattes, A. Urbanization, urban growth, and migration in Latin America. Popul. Notes 1995, 62, 211. [Google Scholar]
  21. Needham, B. Planning, Law and Economics: An Investigation of the Rules We Make for Using Land; Routledge: London, UK, 2006. [Google Scholar]
  22. Xie, S. “Two-Oriented Society” Land Use Research; China University of Geosciences: Beijing, China, 2013. [Google Scholar]
  23. Li, B.; Dewan, H. Efficiency differences among China’s resource-based cities and their determinants. Resour. Policy 2017, 31–38. [Google Scholar] [CrossRef]
  24. Li, C.; Gao, X.; He, B.; Wu, J.; Wu, K. Coupling Coordination Relationships between Urban-industrial Land Use Efficiency and Accessibility of Highway Networks: Evidence from Beijing-Tianjin-Hebei Urban Agglomeration, China. Sustainability 2019, 11, 1446. [Google Scholar] [CrossRef] [Green Version]
  25. Chen, W.; Chen, W.; Ning, S.; Liu, E.; Zhou, X.; Wang, Y.; Zhao, M. Exploring the ILUE of China’s resource-based cities. Cities 2019, 93, 215–223. [Google Scholar] [CrossRef]
  26. Wei, Y.; Ewing, R. Urban expansion, sprawl and inequality. Landsc. Urban Plan. 2018, 259–265. [Google Scholar] [CrossRef]
  27. Ma, S.; Zhao, Y.; Tan, X. Exploring smart growth boundaries of urban agglomeration with land use spatial optimization: A case study of Changsha-Zhuzhou-Xiangtan city group, China. Chin. Geogr. Sci. 2020, 30, 665–676. [Google Scholar] [CrossRef]
  28. Xiao, S.; Huang, X.; Pu, L.; Chen, Y.; Chen, Z.; Zhao, D. Resource-saving society development comprehensive evaluation index system and its application: Taking Jiangsu Province as an example. Econ. Geogr. 2008, 1, 118–123. [Google Scholar]
  29. Ye, W.; Tong, C. Commentary on the United Nations Sustainable Development Index System. China Popul. Resour. Environ. 1997, 3, 83–87. [Google Scholar]
  30. Seager, T.; Theis, T. A taxonomy of metrics for testing the industrial ecology hypothesis and application to design of freezer insulation. J. Clean. Prod. 2004, 12, 865–875. [Google Scholar] [CrossRef]
  31. Singh, R.; Murty, H.; Gupta, S.; Dikshit, A. An overview of sustainability assessment methodologies. Ecol. Indic. 2012, 15, 281–299. [Google Scholar] [CrossRef]
  32. Tian, L.; Ma, W. Government intervention in city development of China: A tool of land supply. Land Use Policy 2009, 26, 599–609. [Google Scholar] [CrossRef]
  33. Acemoglu, D.; Finkelstein, A. Input and technology choices in regulated industries: Evidence from the health care sector. J. Political Econ. 2008, 116, 837–880. [Google Scholar] [CrossRef] [Green Version]
  34. Nichols, D.A. Land and Economic Growth. Am. Econ. Rev. 1970, 60, 332–340. [Google Scholar]
  35. Solow, R.M. A contribution to the theory of economic growth. Q. J. Econ. 1956, 70, 65–94. [Google Scholar] [CrossRef]
  36. Fu, L.; Chen, X.; Leng, Z. Research on the eco-efficiency of urban agglomeration based on super-efficiency DEA model—taking the "3+5" urban agglomeration in Changsha, Zhuzhou and Xiangtan as an Example. China Popul. Resour. Environ. 2013, 23, 169–175. [Google Scholar]
  37. Wu, Y.; Zhang, X.; Skitmore, M.; Song, Y.; Hui, E. Industrial land price and its impact on urban growth: A Chinese case study. Land Use Policy 2014, 36, 199–209. [Google Scholar] [CrossRef] [Green Version]
  38. Xi, J. Vigorously develop circular economy and build a resource-saving and environment-friendly society. Manag. World 2005, 7, 1–4. [Google Scholar]
  39. Yu, F. Implement the scientific development concept and build a resource-saving society. Ecol. Econ. 2004, 11, 52–55. [Google Scholar]
  40. Wang, L.; Zuo, Q.; Gao, J. Research on the connotation and evaluation index system of resource-saving society. Adv. Geogr. Sci. 2007, 04, 86–92. [Google Scholar]
  41. Cao, W. Research on the construction of the performance evaluation system for the construction of “Two-oriented Society” under the J2EE Framework. Enterp. Technol. Dev. 2012, 31, 82–195. [Google Scholar]
  42. Chen, Y.; Ma, B. Evaluation model and empirical research on the development of Hunan two-oriented society. Seeker 2009, 11, 37–39. [Google Scholar]
  43. Hu, B.; Chen, X.; Wang, X. Research on the evaluation of innovation ability of innovative city clusters—Based on the empirical analysis of the "Two-oriented Society" comprehensive supporting reform pilot area in Changsha, Zhuzhou and Xiangtan. Inq. Into Econ. Issues 2009, 5, 153–161. [Google Scholar]
  44. Huang, J.; Xue, D. Study on Temporal and Spatial Variation Characteristics and Influencing Factors of Land Use Efficiency in Xi’an, China. Sustainability 2019, 11, 6649. [Google Scholar] [CrossRef] [Green Version]
  45. Wang, G.; Yang, J.; Ou, D.; Xiong, Y.; Deng, O.; Li, Q. Temporal-Spatial Variations and Regional Disparities in Land-Use Efficiency, and the Response to Demographic Transition. Sustainability 2019, 11, 4756. [Google Scholar] [CrossRef] [Green Version]
  46. Liu, S.; Ye, Y.; Li, L. Spatial–Temporal Analysis of Urban Land-Use Efficiency: An Analytical Framework in Terms of Economic Transition and Spatiality. Sustainability 2019, 11, 1839. [Google Scholar] [CrossRef] [Green Version]
  47. Arabsheibani, R.; Sadat, Y.; Abedini, A. Land suitability assessment for locating industrial parks: A hybrid multi criteria decision-making approach using Geographical Information System. Geogr. Res. 2016, 54, 446–460. [Google Scholar] [CrossRef]
  48. Zhao, X.; Zhang, L.; Huang, X.; Zhao, Y.; Zhang, Y. Evolution of the Spatiotemporal Pattern of Urban Industrial Land Use Efficiency in China. Sustainability 2018, 10, 2174. [Google Scholar] [CrossRef] [Green Version]
  49. Zhao, A.; Ma, X.; Qu, F. Can marketization reform improve the efficiency of industrial land use in China? China Popul. Resour. Environ. 2016, 26, 118–126. [Google Scholar] [CrossRef]
  50. Guo, G.; Xiong, Q. Research on the regional differences of urban industrial land efficiency and influencing factors. China Land Sci. 2014, 28, 45–52. [Google Scholar]
  51. Vandermeer, M.; Halleux, J. Evaluation of the spatial and economic effectiveness of industrial land policies in Northwest Europe. Eur. Plan. Stud. 2017, 25, 1454–1475. [Google Scholar] [CrossRef] [Green Version]
  52. Zhang, J.; Zhang, D.; Huang, L.; Wen, H.; Zhan, D. Spatial distribution and influential factors of industrial land productivity in China’s rapid urbanization. J. Clean. Prod. 2019, 234. [Google Scholar] [CrossRef]
  53. Zhou, Y.; Yao, Q.; Tian, P.; Gao, R.; Chu, J. Multidimensional threshold effect of industrial land investment at different levels of economic development: An empirical analysis based on panel data of prefecture-level cities in Jiangsu and Zhejiang from 2004 to 2016. Urban Dev. Stud. 2019, 26, 6–11. [Google Scholar]
  54. Kok, N.; Monkkonen, P.; Quigley, J. Land use regulations and the value of land and housing: An intra-metropolitan analysis. J. Urban Econ. 2014, 81, 136–148. [Google Scholar] [CrossRef] [Green Version]
  55. Chen, Y.; Chen, Z.; Xu, G.; Tian, Z. Built-up land efficiency in urban China: Insights from the General Land Use Plan (2006–2020). Habitat Int. 2016, 51, 31–38. [Google Scholar] [CrossRef]
  56. Shu, H.; Xiong, P. Reallocation planning of urban industrial land for structure optimization and emission reduction: A practical analysis of urban agglomeration in China’s Yangtze River Delta. Land Use Policy 2019, 81, 604–623. [Google Scholar] [CrossRef]
  57. Choy, L.; Lai, Y.; Lok, W. Economic performance of industrial development on collective land in the urbanization process in China: Empirical evidence from Shenzhen. Habitat Int. 2013, 184–193. [Google Scholar] [CrossRef]
  58. Lin, S.; Ben, T. Impact of government and industrial agglomeration on industrial land prices: A Taiwanese case study. Habitat Int. 2009, 33, 412–418. [Google Scholar] [CrossRef]
  59. Qiao, L.; Huang, H.; Tian, Y. The Identification and Use Efficiency Evaluation of Urban Industrial Land Based on Multi-Source Data. Sustainability 2019, 11, 6149. [Google Scholar] [CrossRef] [Green Version]
  60. Tu, F.; Yu, X.; Ruan, J. ILUE under government intervention: Evidence from Hangzhou, China. Habitat Int. 2014, 43, 1–10. [Google Scholar] [CrossRef]
  61. Ustaoglu, E.; Silva, F.; Lavalle, C. Quantifying and modelling industrial and commercial land-use demand in France. Environ. Dev. Sustain. 2020, 22, 519–549. [Google Scholar] [CrossRef]
  62. Gao, B.; Li, W.; Dunford, M. State Land Policy, Land Markets and Geographies of Manufacturing: The Case of Beijing, China. Land Use Policy 2014, 36, 1–12. [Google Scholar]
  63. Cobb, C.; Douglas, P. A theory of production. Am. Econ. Rev. 1928, 18, 139–165. [Google Scholar]
  64. Wei, Y. Decentralization, marketization, and globalization: The triple processes underlying regional development in China. Asian Geogr. 2001, 20, 7–23. [Google Scholar] [CrossRef]
  65. Lin, F.; Wu, W. The main achievements and successful experiences of 70 years of industrial development in New China. Econ. Res. Ref. 2019, 19, 20–33. [Google Scholar]
  66. Zhu, X.; He, C.; Li, Q.; Mao, X. Influence of local government competition and environmental regulations on Chinese urban air quality. China Popul. Resour. Environ. 2018, 28, 103–110. [Google Scholar]
  67. Seiford, L.; Thrall, R. Recent developments in DEA: The mathematical programming approach to frontier analysis. J. Econom. 1990, 46, 7–38. [Google Scholar] [CrossRef]
  68. Tone, K. A slacks-based measure of efficiency in data envelopment analysis. Eur. J. Oper. Res. 2001, 130, 498–509. [Google Scholar] [CrossRef] [Green Version]
  69. Zhao, L.; Sun, C.; Zheng, D. Measurement of water use efficiency and spatial spillover effects among provinces in China. Acta Geogr. Sin. 2014, 69, 121–133. [Google Scholar] [CrossRef]
  70. Bertrand, M.; Duflo, E.; Mullainathan, S. How much should we trust differences-in-differences estimates? Q. J. Econ. 2004, 119, 249–275. [Google Scholar] [CrossRef] [Green Version]
  71. Zheng, X.; Wang, H.; Zhao, Y. Can provincial direct county promote economic growth–double difference method. Manag. World 2011, 8, 34–44. [Google Scholar]
  72. Kuznets, S. Economic growth and income inequality. Am. Econ. Rev. 1995, 45, 1–28. [Google Scholar]
  73. Grossman, G.; Krueger, A. Environmental Impacts of a North American Free Trade Agreement; National Bureau of Economic Research: Cambridge, MA, USA, 1991. [Google Scholar]
  74. Cheung, K.; Ping, L. Spillover effects of FDI on innovation in China: Evidence from the provincial data. China Econ. Rev. 2004, 15, 25–44. [Google Scholar] [CrossRef] [Green Version]
  75. Feinberg, S.; Majumdar, S. Technology spillovers from foreign direct investment in the Indian pharmaceutical industry. J. Int. Bus. Stud. 2001, 32, 421–437. [Google Scholar] [CrossRef]
  76. Jia, H.; Huang, X.; Yu, S.; Wang, G.; Zhen, Z. Development and countermeasures of intensive use of industrial land in China. China Land Sci. 2010, 24, 52–56. [Google Scholar]
  77. Chen, G. Judges’ remote communication and judicial efficiency: Empirical evidence from the dean of the high court. Economics 2012, 11, 1171–1192. [Google Scholar]
  78. Dong, Y.; Jin, G.; Deng, X. Dynamic interactive effects of urban land-use efficiency, industrial transformation, and carbon emissions. J. Clean. Prod. 2020, 270, 122547. [Google Scholar] [CrossRef]
  79. Macedo, J. Urban land policy and new land tenure paradigms: Legitimacy vs. legality in Brazilian cities. Land Use Policy 2008, 25, 259–270. [Google Scholar] [CrossRef]
  80. Firman, T. Major issues in Indonesia’s urban land development. Land Use Policy 2004, 21, 347–355. [Google Scholar] [CrossRef]
Figure 1. Theoretical framework of the impact of the RES on the ILUE.
Land 10 00751 g001
Figure 2. Annual change in the ILUE in Hunan Province.
Land 10 00751 g002
Figure 3. ILUE for the treatment and control groups.
Land 10 00751 g003
Figure 4. CZTUA’s pollution emission coefficients from 2003 to 2018.
Land 10 00751 g004
Table 1. Input and outputs for calculating the efficiency of industrial land use.
CategoryClassificationSingle Index
InputLandIndustrial land area (IL)
LaborEmployment in secondary industries (ESI)
CapitalIndustrial investment in fixed assets (IFA)
Desirable outputEconomic benefitIndustrial output (IOV)
Undesirable outputEnvironmental pollutionIndustrial wastewater discharge (IWD)
Industrial sulfur dioxide discharge (ISD)
Industrial smoke and dust emissions (ISDE)
Table 2. Statistical description of the selected variables.
VariableObs.UnitMaxMinMeanStd. Dev
SBM modelIL208hectare37135.701546.3856661.7012
ESI208104 CNY/hectare63.2511.5115.678411.56019
IFA208108 CNY/hectare6243.10547.361507.2174624.3664
IOV208108 CNY16,329.0515.77871757.6822254.288
IWD208104 ton2276105919.3273573.364
ISD208104 ton24.73903.862.981
ISDE208104 ton134.73702.9210.727
DID modelILUE20810.00010.5340.294
DID208100.1730.379
PCG208104 per person15.2440.3903.0342.635
SIS208%60.4515.7142.70710.048
FDI208108 USD57.80.1135.4568.694
GDP208108 CNY11,003.4181.9091368.861551.484
POP208104 persons830157.29518.15171.194
GOV208%0.0191.4950.1580.163
Market208%10.010.7320.348
Table 3. ILUE values of cities in Hunan Province from 2003 to 2018.
City20032006200720122018
Changsha0.21460.38471.00001.00001.0000
Zhuzhou0.33050.20850.27370.64900.2092
Xiangtan0.20120.19040.22430.52370.2382
Hengyang0.23040.20010.37481.00000.0684
Shaoyang1.00000.31090.40950.53100.1309
Yueyang0.20070.29180.47241.00000.5254
Changde0.26120.19600.23350.42830.0001
Zhangjiajie1.00001.00001.00001.00000.3163
Yiyang0.38460.33240.44130.43920.3824
Chenzhou0.29560.30130.38240.59090.1958
Yongzhou0.73920.36960.44010.34480.1248
Huaihua0.33050.31100.27050.47040.2942
Loudi0.28930.22620.33040.38380.4892
Table 4. Regression of the sample placebo test.
Fixed EffectRandom Effect
DID−0.333 ***
(−5.50)
−0.210 ***
(−3.57)
SIS0.018 ***
(5.25)
0.001
(−0.20)
FDI−0.019 **
(−2.46)
−0.012 *
(−1.77)
PCG−0.001
(0.09)
−0.051 ***
(−3.15)
GDP0.001 ***
(3.87)
0.001 ***
(4.69)
POP0.001
(0.37)
0.001 **
(−2.36)
GOV−0.163
(−1.23)
0.081
(0.58)
Market0.002
(0.02)
0.211 **
(2.59)
_cons−0.276
(−0.51)
0.731 ***
(5.92)
R20.3580.248
Note: The t-values are in parentheses. *, ** and *** represent 10%, 5% and 1% statistical levels, respectively.
Table 5. Impact of RES on the ILUE.
Fixed EffectRandom Effect
DID0.246 **
(2.61)
0.120
(1.52)
SIS0.016 ***
(4.43)
0.001
(−0.12)
FDI−0.018 **
(−2.09)
−0.010
(−1.40)
PCG−0.006
(−0.36)
−0.051 ***
(−3.06)
GDP0.001 ***
(3.71)
0.001 ***
(4.62)
POP0.001
(0.07)
−0.001 ***
(−3.00)
GOV−0.113
(−0.80)
0.090
(0.62)
Market−0.199 **
(−2.32)
0.059
(0.85)
_cons−0.160
(−0.27)
0.709 ***
(5.80)
R20.2810.228
Note: The t-values are in parentheses. *, ** and *** represent 10%, 5% and 1% statistical levels, re-spectively.
Table 6. Kuznets curve values between economic development and the ILUE.
β 1 β 2 consR2FObs.
1.89 ***
(3.91)
−1.20 **
(−2.42)
0.272 ***
(3.89)
β 1 19.80248
Note: The t-values are in parentheses. *, ** and *** represent 10%, 5% and 1% statistical levels, respectively.
Publisher’s Note: MDPI stays neutral with regard to jurisdictional claims in published maps and institutional affiliations.

