1. Introduction
In recent years, the term “cadastral value” has become firmly included in the active vocabulary of Russian real estate owners: this is evidenced by both regular mention in the media and Internet search statistics. The reason for this popularity is not the desire to acquire new knowledge, but rather landowner dissatisfaction with the excessive tax burden, which is a consequence of the overestimated cadastral value.
European countries represent a variety of solutions in the field of real estate taxation. All systems can be summarized in two general groups: valuable systems, where the tax base is the value of the property obtained by the mass valuation, and systems for surface based on the surface of taxable property [
1].
In almost all countries with modern tax systems, the basis for real estate tax is the property value. This is defined in very different ways in relation to particular social and historical circumstances [
2,
3]. According to Jasińska and Preweda, in the EU member states the most popular is cadastral system, which is based on the capital value of the property or rental value [
1].
According to Grover et al., the benefits of property taxation are also recognized in those countries which do not have a comprehensive list of taxable properties and adequate data on transaction prices [
4]. In many countries with a valuable system, calculating the amount of tax is determined by the cadastral value of a property. The issues of determining the cadastral value of a real estate, which has local names in different countries (market, tax, regulatory and other), are being dealt with by researchers around the world, as disclosed in detail by Wang [
5].
Russia also belongs to the countries with a valuable system. The modern approach to determining the amount of real estate tax is based on the cadastral value, which is determined mainly by mass valuation methods. The cadastral value is the most probable price of a real estate object at which it can be acquired, based on the possibility of continuing the actual type of its use. The main properties of mass appraisal and cadastral value in Russia are shown in
Table 1.
Approaches and methods are selected depending on the objects of assessment and available data. For example, the income approach is recommended when there is reliable data on income and expenses for real estate properties, on the total capitalization rate and/or discount rate, while the comparative approach is generally preferred over other approaches to assessing. The main and preferred method for determining the cadastral value is the method of statistical (regression) modeling. It is used when assessors have a sufficient amount of information, and in case of its deficiency, they are forced to resort to the method of the reference object, the method of specific indicators of the cadastral value, etc.
Scientists and cadastral assessors, such as Leifer [
7], Korostelev [
8,
9], Dubovik and Pavlova [
10], Boyko [
11] and others highlight a number of problems typical of the cadastral valuation in Russia, but they all agree that the main disadvantage of the Russian mass appraisal system is the insufficient quantity and low quality of basic data. As for quality of the initial data, it can be improved by in the following ways.
Firstly, using only reliable sources of information. For example, real estate listing in periodicals and on sites may contain false information (according to statistics, in St. Petersburg, on average 30% of advertisings for the sale of real estate objects contain false information [
12]). Also, according to the experts, tenders for land plots are held with a large number of violations, which affects the resulting price [
13].
Secondly, obtaining the values of some pricing factors using spatial interpolation [
12,
13,
14], which makes it possible to abandon the multi-format information (often conflicting) coming from various databases.
The problem of insufficient amount of initial data is more acute because:
- (1)
Firstly, regression allows building statistically significant value models correlated with the market situation but requires a large amount of basic data.
- (2)
Secondly, other assessment methods are either laborious (the method of the reference object) or have poor accuracy (the method of specific indicators of the cadastral value).
- (3)
Thirdly, methods proposed by researchers (based on neural networks, fuzzy sets), also require large amounts of information [
15,
16,
17,
18].
There is no consensus between researchers about the required ratio of the number of dependent variables (market information) and independent variables (pricing factors) for a reliable regression model.
Kacman, Kosorukova and Rodin in their textbook [
19] set the ratio of the amount of market information and pricing factors by the ratio described by Formula (1):
where
n is the amount of market information (number of transaction prices (offers)) and
m is the number of pricing factors.
Smith and Draper say that the number of dependent variables should be 5–10 times greater than the number of factor signs [
20]. Russian authors Gribovsky et al. proposed a formula to determine the minimum number of units of market information (Formula (2)) [
21,
22].
Tabachnick and Fidell in their textbook [
23] advise a minimum of 50 pieces of dependent variables plus eight for each independent variable.
The views on the quantity of dependent variables of some other authors can be read in the works [
24,
25,
26].
The required ratio of a number of transaction prices (offers) and pricing factors proposed by the authors Draper and Smith, and Gribovsky et al. [
20,
21,
22,
23] is shown in
Table 2.
In addition to the table above, it is worth referring to the study “Classification of inhabited localities by the level of development of individual residential land market” [
27]. This study is devoted to the classification of territories according to the level of development of the market for land plots for individual residential construction. According to the study, in 96% of Russian territories, the number of transactions varies from 0 to 10 per year. This is especially typical of rural settlements, namely land plots for individual housing construction. Thus, we can conclude that, firstly, the methods proposed by Draper and Smith, and Tabachnick and Fidell are not applicable in mass evaluation; secondly, for the predominant part of territories, the use of regression analysis becomes impossible, that forces appraisers to use inaccurate methods, e.g., method of specific indicators of the cadastral value.
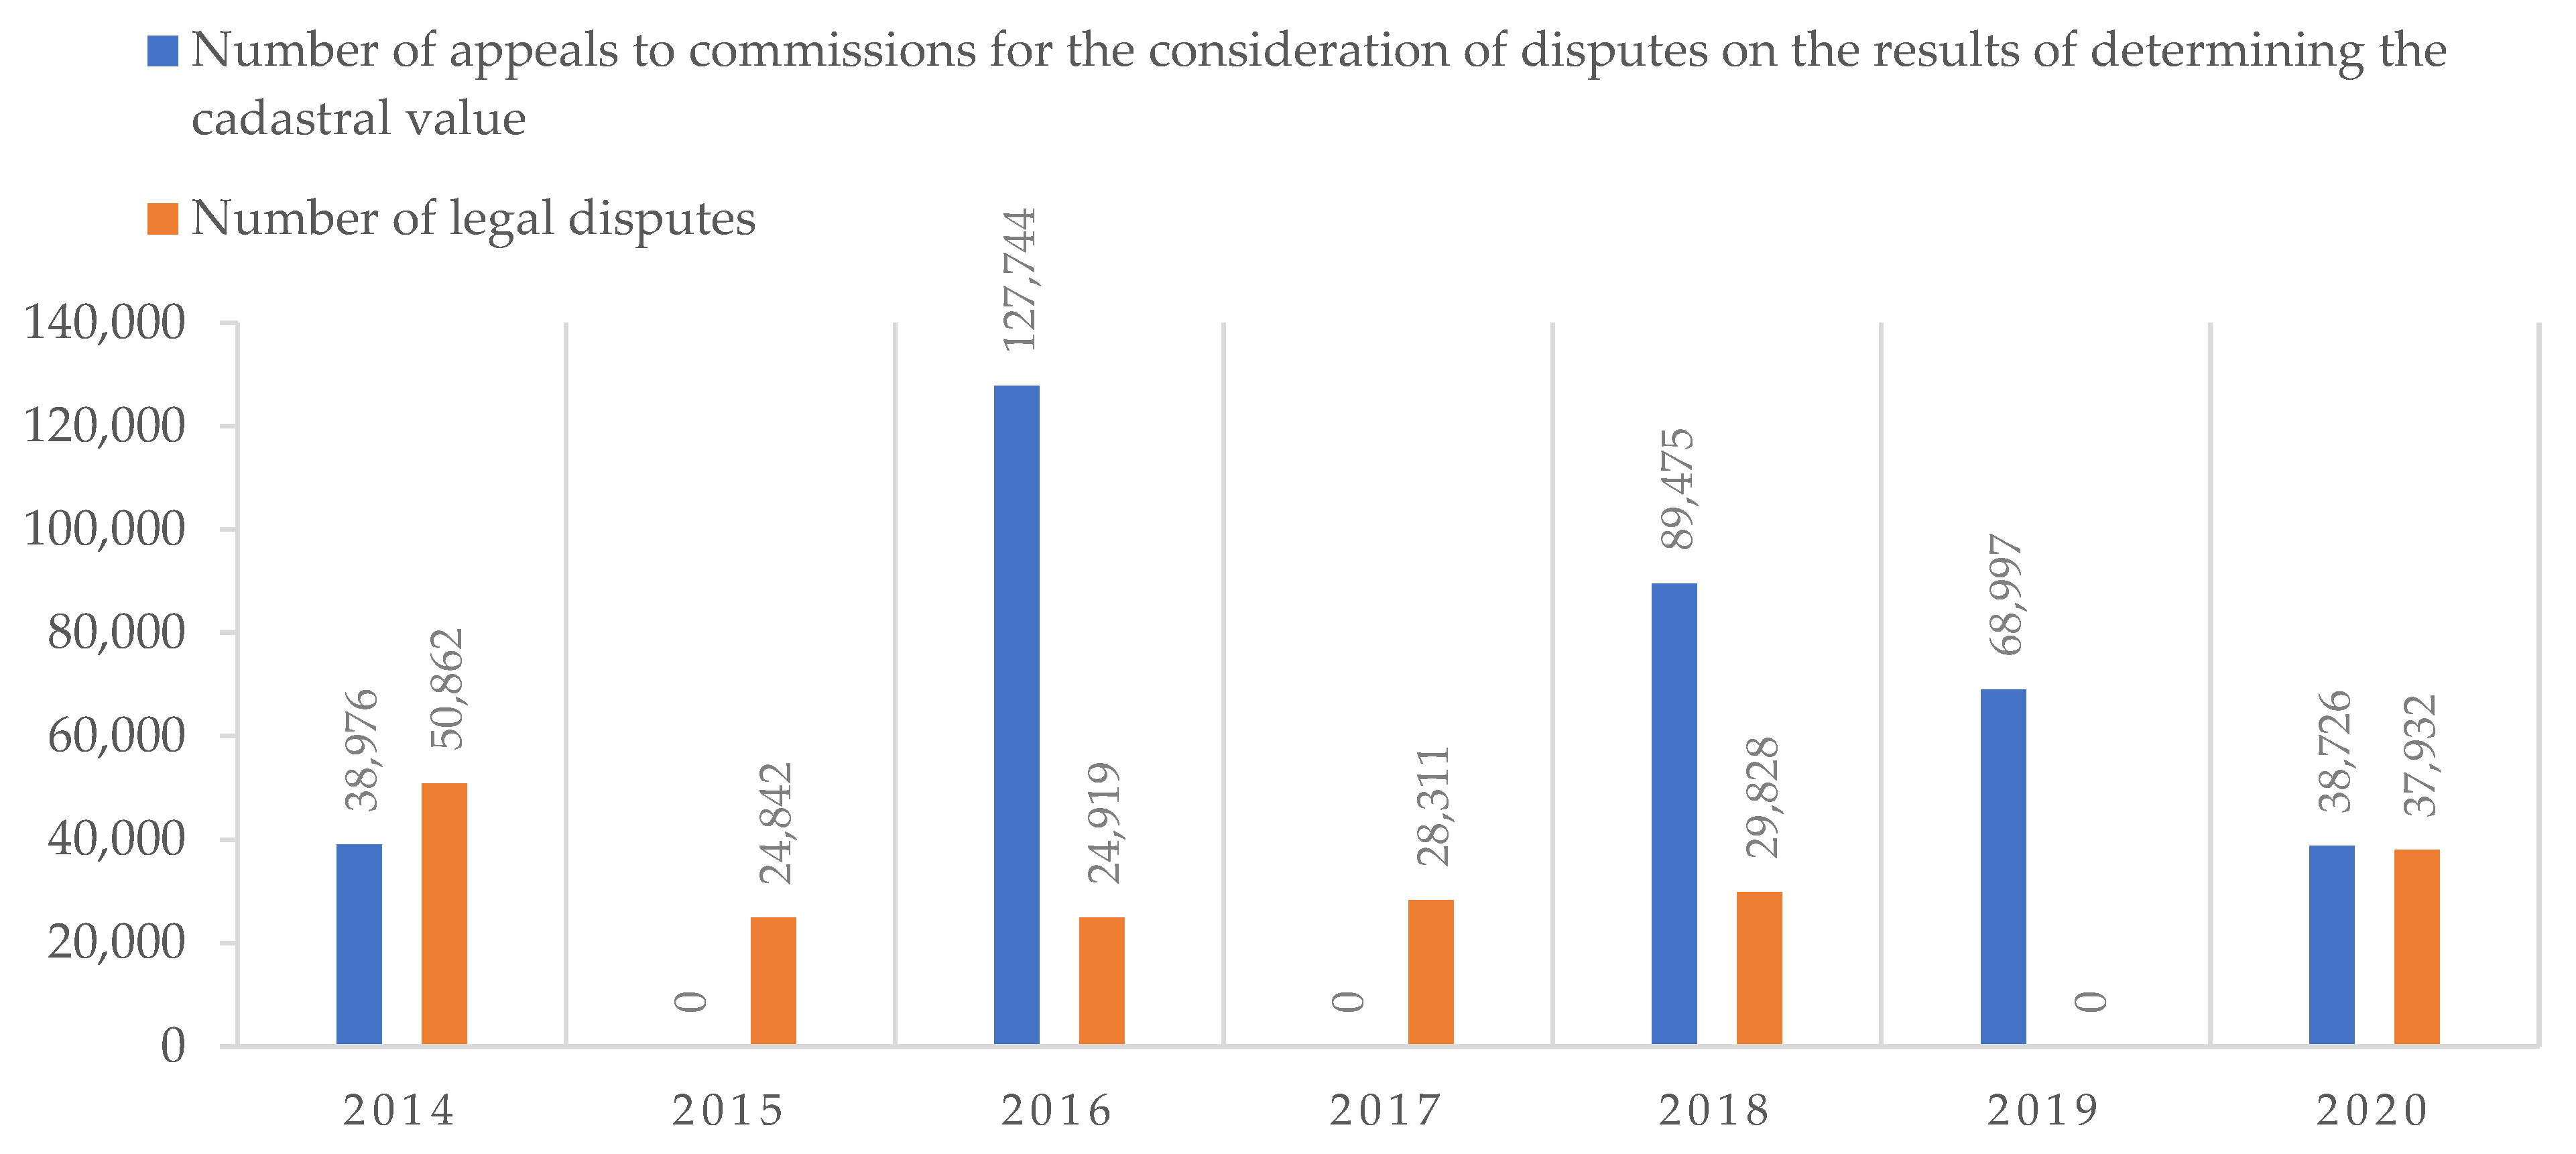
Both the use of low-quality data to build the regression and low accurate methods, lead to lower income to a budget (if a cadastral value is undervalued) and landowner dissatisfaction with the excessive tax burden, which is a consequence of the overestimated cadastral value. Every year, courts and special commissions consider a large number of disputes about the results of determining the cadastral value, most of which are devoted to land plots (
Figure 1). Annually, the total value of the cadastral value (of all real estate in Russia) according to the results of the work of commissions and courts is offset by an average of 30%.
The purpose of the research is to assess the application of the territorial extrapolation of basic data method during a mass (cadastral) assessment of land or territory that is characterized by an acute lack of market information.
2. Materials and Methods
For all of the above reasons, a territorial extrapolation method (TEM) was developed. The idea of TEM is to consolidate settlements (territories) that are comparable in a composition of pricing factors and the nature of their impact on value, as well as price levels, and to build a united model of a cadastral value. A territory (grouping unit) can act as a set of nearly located land plots with one land use, similar pricing factors and the nature of their impact on value, as well as price levels. In rural settlements, grouping units can be equal to the entire territory of village.
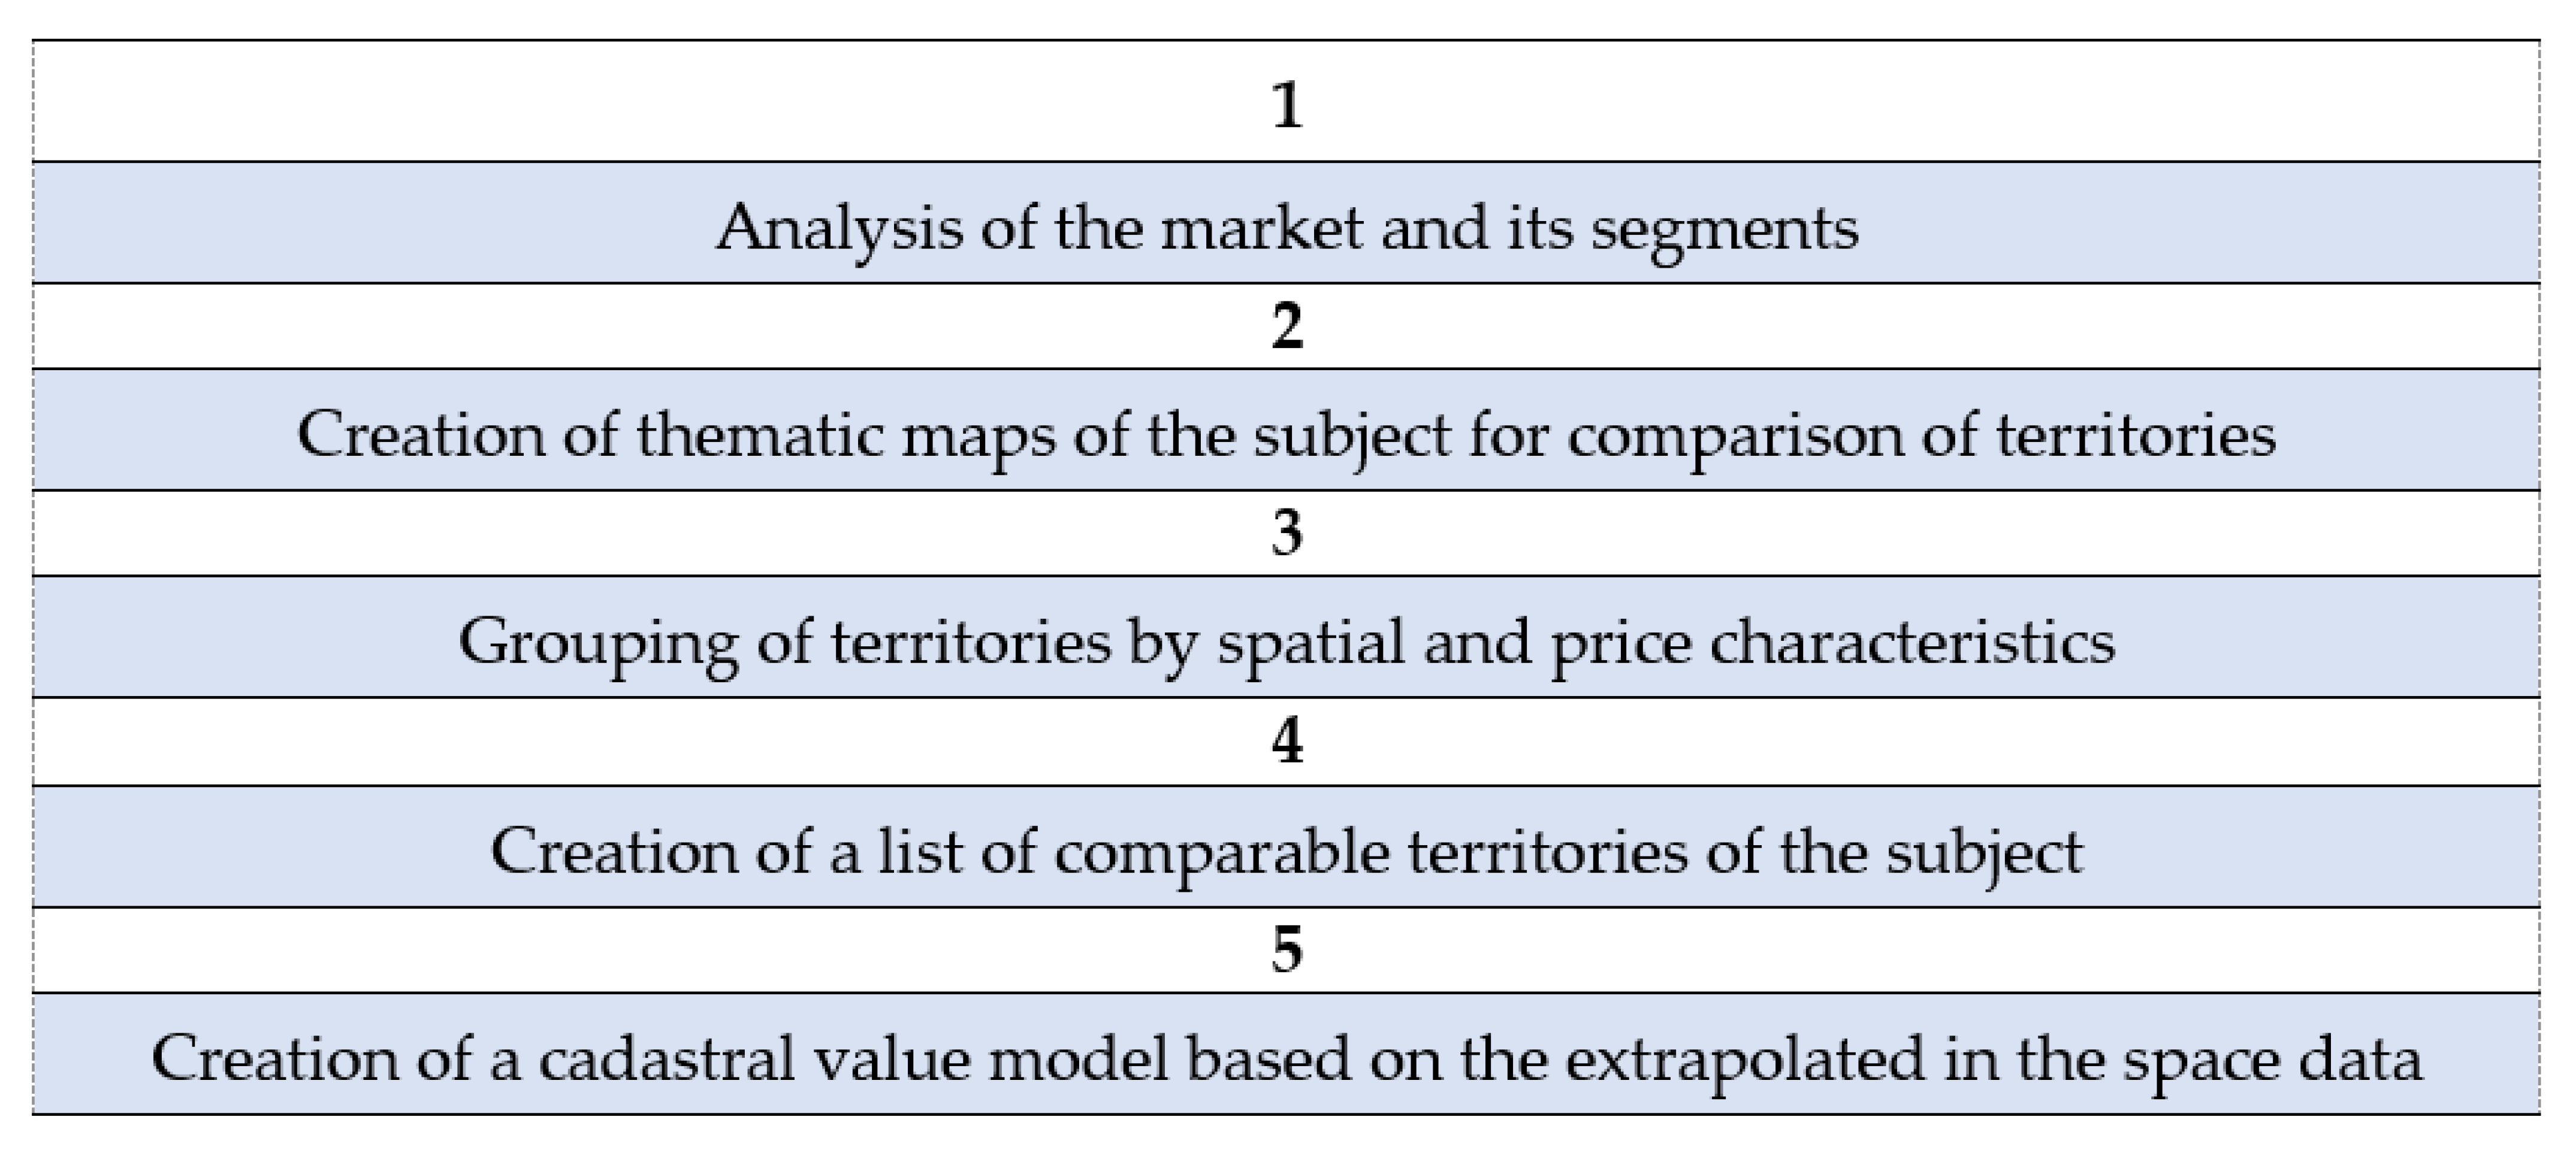
Figure 2 shows the steps of this method. The method of territorial extrapolation can be effectively implemented in the current methodology of cadastral valuation, because the 1st, 2nd and 4th stages overlap with the regulatory framework of mass appraisal in Russia, but has a number of peculiarities.
Market data should be obtained from reliable resources as databases of organizations providing services for supporting transactions with real estate and state information system “Monitoring of the Real Estate Market” for two years. Analysis of a market and its segments allows making a preliminary conclusion about pricing factors, the nature of their impact on value and required minimum of dependent variables for regression. It is a stage when assessors should identify the need to integrate the method of territorial extrapolation.
First of all, it is necessary to determine factors that influence value of land plots. For this, the territory is analyzed for the influence of factors characterizing:
For example, such information could include: the position of the administrative center, water bodies; availability of water supply, sewerage, heat supply; the possibility of flooding and soil erosion; information about the road network; position of land plots and (or) restrictions and others.
Particular attention should be paid to the nature of the influence of factors on the value. For example, in most cases, the proximity of a reservoir has a positive effect on the value, but in case of identified coastal erosion, it acts as a factor in value reduction; in the cadastral valuation of small rural settlements, as a rule, one of the pricing factors is the proximity to regional centers or large settlements.
This is followed by a grouping by price level among those territories that are comparable in a composition of pricing factors and the nature of their influence on the cost. It is advisable to use clustering methods and the method of principal components. Clustering methods are divided into hierarchical and sequential. Hierarchical methods show good results working with small samples (up to 150 objects), otherwise, it is better to use one of the sequential clustering methods [
27]. K-means is one of the most popular methods of sequential clustering. Its advantages are the transparency of the algorithm, high linear speed of operation, and efficient processing of large amounts of data. In the absence of market data, the comparison by the price level is not made and the assignment to a certain group can be carried out by the expert method. This is followed by grouping territories that are comparable in price levels and pricing factors. For this, various classification methods or algorithms can be used; for example, a graph of nearest neighbors.
The next stage of TEM is devoted to collecting the actual values of pricing factors. Information about pricing factors can be obtained only from official resources that could contain up-to-date and complete data. The pricing factors that can be represented graphically are determined from digital thematic maps [
6] created by assessors.
The last and the most important step is creation of a united cadastral value model based on the extrapolated in the space data. The unified cadastral value model is a regression model built using data from territories that are comparable. Various mass valuation methods as well construction of multiple regression models is widely covered in the scientific literature, therefore, we will focus only on the key points of the proposed method. All factors used to build a model are subject to the following requirements:
Firstly, the factors must be quantifiable. The diverse nature of the pricing factors makes it necessary to take into account both quantitative and qualitative factors. In this regard, before the specification of the model, it is necessary to transform basic data. There are different methods of transformation such as binary variables (if the factor can take two values), coding by choosing a basic property, etc.
Secondly, factors should not be correlated with each other. In the case of a strong correlation between factors, it is impossible to determine their isolated effect on cost, and the parameters of the regression equation are not interpretable. To overcome a strong inter-factor relationship the method of principal components, the transition to combined regression equations, etc. are used. These methods make it possible to express a set of pricing factors, but inevitably lead to the loss of some information; therefore, in conditions where there is a lack of information, it is more expedient to exclude one of the correlating factors.
To determine the cadastral value, linear, multiplicative and regression models are specified. The choice of the type of model can be carried out expertly or as a result of building models of all types and comparison of their quality indicators.
A quality indicators analysis of a statistical model includes a set of procedures:
- -
taking into account all potentially influencing pricing factors for which the objects of comparison differ and whose changes are capable of influencing the change in value;
- -
the validity of the signs with the coefficients of the statistical equation, that is, their compliance with the nature of the influence of pricing factors;
- -
correspondence of the type of influence function of each pricing factor to the nature of such influence on the real estate market;
- -
by Student’s t-test (the coefficients of the model are recognized as reliable if the calculated value of the criterion exceeds the tabular value for a given level of reliability);
- -
by the coefficient of determination;
- -
by the calculated value of F—Fisher’s criterion;
- -
by the average approximation error.
The actual values of the effective indicator differ from the theoretical values calculated using the regression equation. The smaller these differences are, the closer the theoretical values are to empirical data, and the better the quality of the model. Lewis’ interpretation of average approximation error is given in
Table 3.
In the case of united model of cadastral value, the maximum allowable value of the average approximation error should not exceed 20%. This is due to the facts that:
TEM is only applied in conditions of lack of market information (the larger the sample size, the more sensitive the model);
during grouping territories, it is not always possible to take into account some hidden factors [
29];
according to Lewis, an approximation error of 20% allows good forecasting.
On the subject of mass valuation using the model, Trawiński et al. [
30], Kokot [
31], Lis [
32], Doszyń [
33] and other authors [
34,
35,
36,
37] wrote about research done in Poland.
Currently, these operations are performed automatically in special software products, such as Microsoft Excel, Statistica, R Studio, SPSS Statistics, etc. The use of software tools allows avoidance of technical errors and reduces the time of work.
In the case of satisfactory results of assessing the quality of the united model, they begin testing on the objects of the control sample. In the 2017 Methodological guidelines on cadastral valuation [
6] and Standard on Mass Appraisal of Real Property [
38], the number of objects in the control sample is not methodically fixed, therefore the method of temporary extrapolation of market data provides for such a minimum number of items in the control sample, which allows making unambiguous conclusions about the quality of the model.
To test the method of territorial extrapolation, the settlements of the Republic of Udmurtia were selected. As a result of the analysis of the market of land plots for individual housing construction (IHC), a list of pricing factors was prepared. It included: the area of the land plot, the presence of encumbrances (mortgage), the distance to the nearest reservoir, shopping center, school, kindergarten, public transport stop, conglomeration center, availability of land plot of electricity, gas supply, water supply and sewerage.
3. Results and Discussion
Due to the fact that a cadastral valuation is carried out within a constituent entity of the Russian Federation, it is advisable to consider the cadastral valuation in the context of one constituent entity of the Russian Federation. Rural settlements of the Republic of Udmurtia were chosen as a pilot object of the research. There are 184 settlements in the republic, six of which are cities (Votkinsk, Glazov, Izhevsk, Mozhga, Sarapul, Kambarka), and the rest are rural settlements. On average, the land plots of individual housing construction occupy about 40% of the territory of settlements of the subject.
During the analysis of the real estate market and collection of market data, it was revealed that:
- -
in 19 settlements in two years there was not a single purchase and sale transaction in relation to land plots for individual housing construction (e.g., in villages Azino and d. Ershovka);
- -
there are settlements where about 100 transactions take place annually (cities Izhevsk, Mozhga);
- -
in 20 settlements, the number of transactions did not exceed 9 units.
As a result of the market analysis, lists of pricing factors for land plots for individual development in settlements of Udmurtia were formed. This is presented in a generalized form in
Table 4.
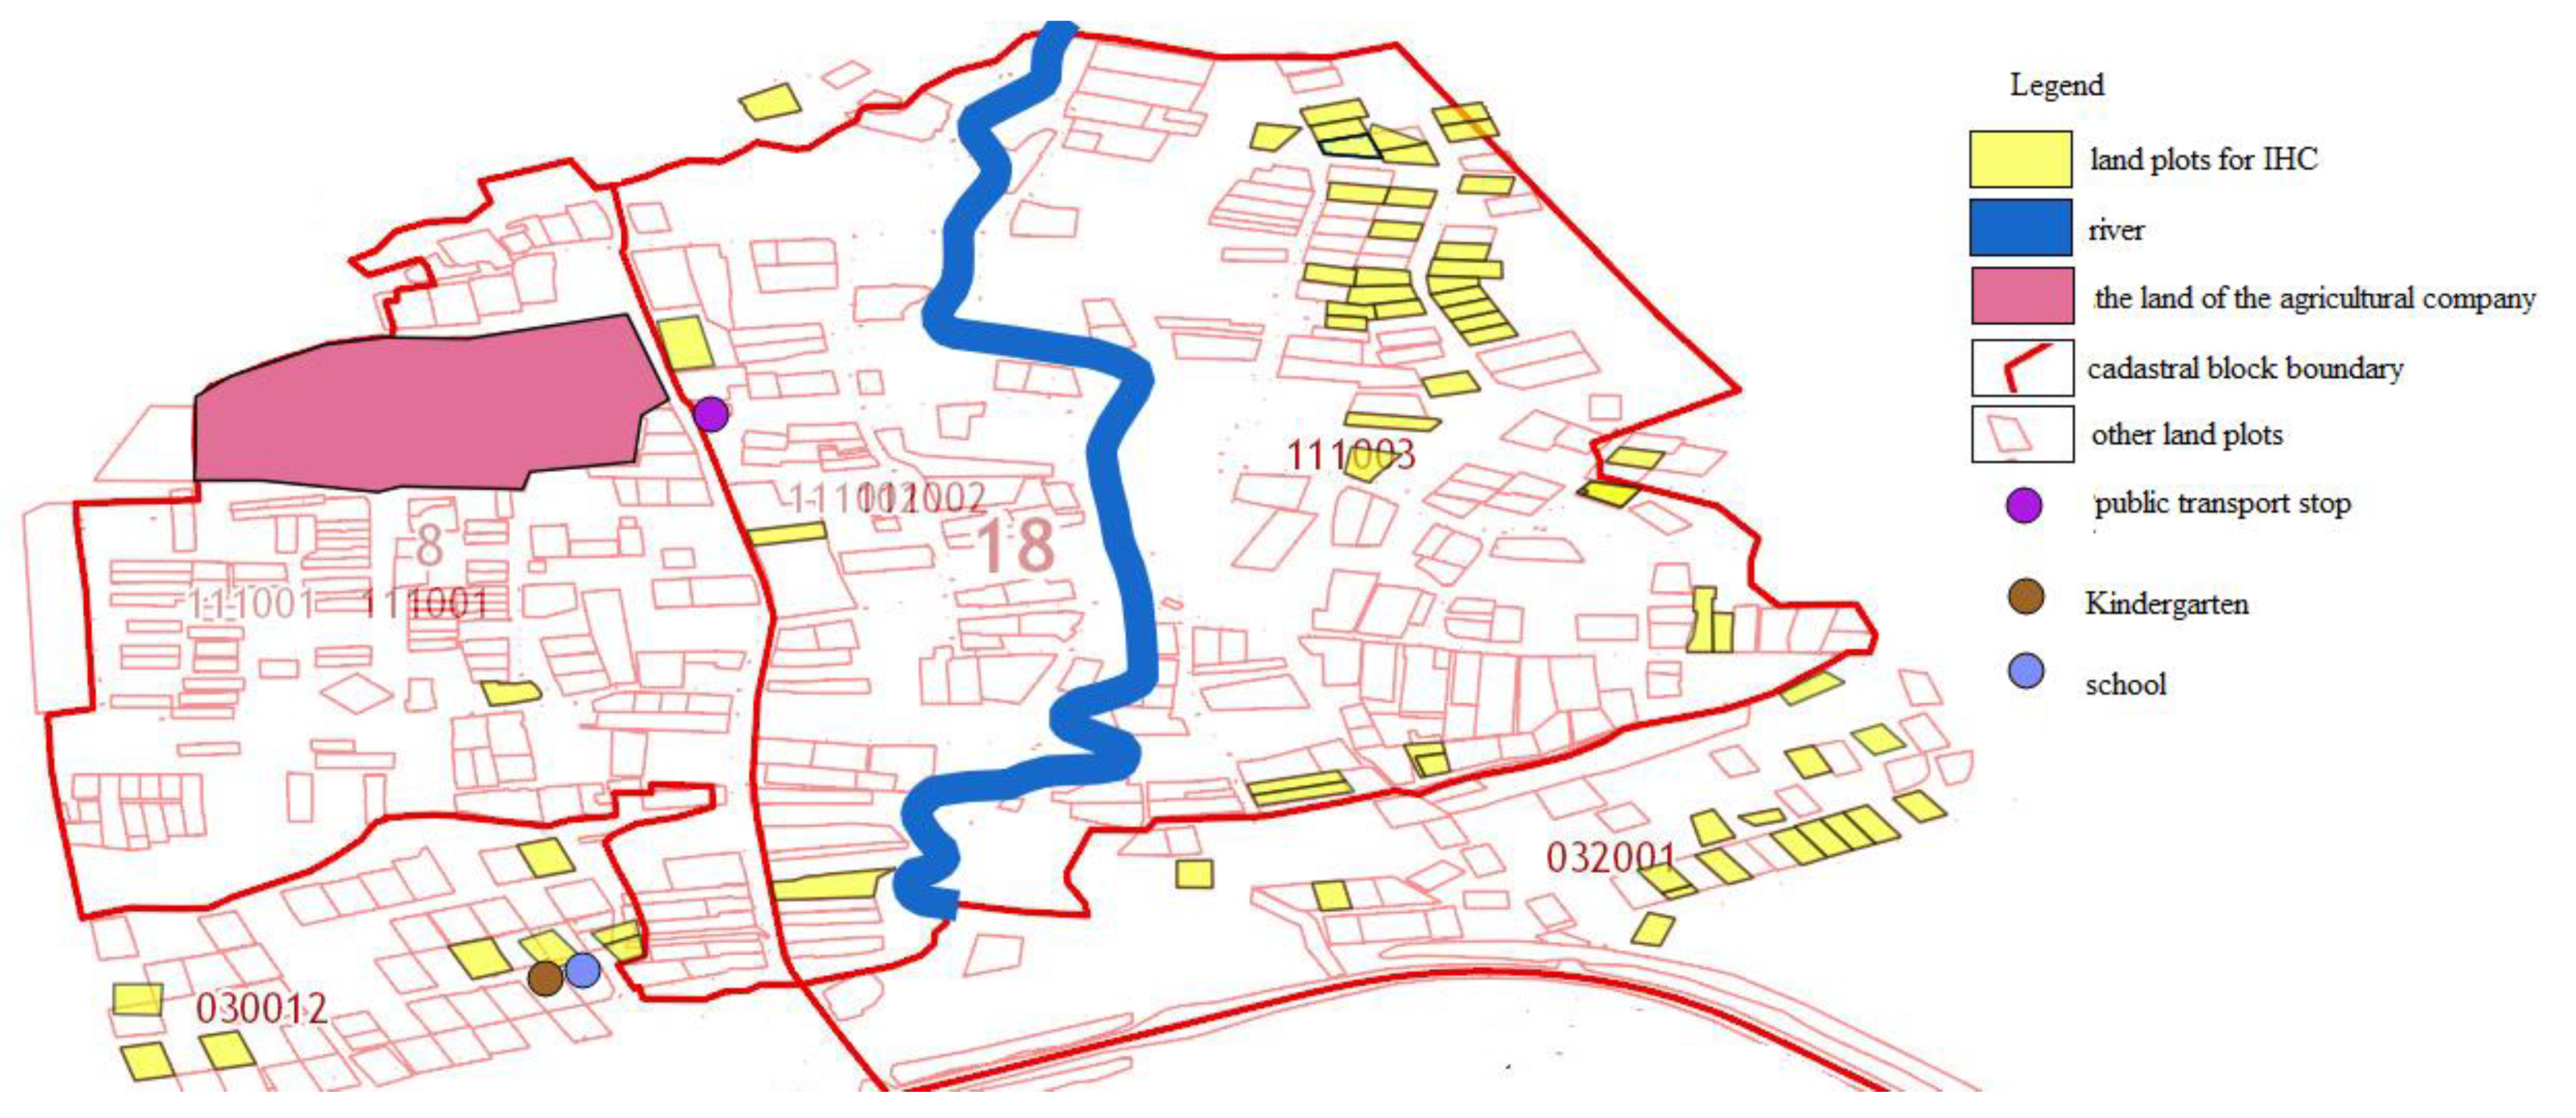
To calculate the values of the factors, thematic maps of settlements were created. The example of a thematic map is shown in
Figure 3.
Qualitative factors (the availability of sewerage, gasification and electricity) have a binary form; therefore, they were coded (1 if yes, 0 if no). Correlation analysis and analysis of statistical significance (using stepwise regression) showed that the proximity to the cities—Izhevsk, Votkinsk, Glazov, Kambarka, Mozhga, Sarapul—is one of the main pricing factors for most rural settlements, and settlements form a kind of conglomeration. It was decided to group settlements according to proximity to cities and price levels.
The process of grouping settlements according to spatial data consisted in collecting information about the coordinates of settlement centers in Udmurtia, and for grouping by price level, information on transaction prices was analyzed and the price level was calculated (
Table 5).
During the grouping of settlements by spatial and price characteristics, it was revealed that:
First, conglomerations, on average, include 6–7 settlements. The largest conglomerate of settlements is formed around Izhevsk, including 37 settlements, more than half of the total sample size.
Grouping according to the price level was made using k-means. Algorithm of the k-means method consists of the following steps:
k cluster centers are chosen randomly;
each sample is attributed to the closest center;
the calculation of the cluster centers is done as the average parameter value of all objects belonging to the certain cluster;
each sample is attributed to the closest cluster center.
Steps 3 and 4 are repeated until the cluster centers stop changing during the following calculations or the maximum number of operations is reached. As a result, k clusters with the minimum value of the objective function should be received.
The sum of square distances within the clusters is usually used as the objective function, being described by the Formula (3).
where
k is the cluster,
- -
is the value of the j variable for i review (of the sample),
- -
is the average value of the j variable in the k cluster
- -
p is the number of the variables [
39].
The basic data for the clusterization using the k-means are the analyzed data massive, the metrics, the number of the clusters and the decomposition method.
The definition of the number of clusters has been made with the use of specialized NbClust software package in R Studio [
40]. It was developed on the basis of the research by Milligan and Cooper [
41] dedicated to the analysis of the stopping rules—approaches defining the best suitable number of the clusters. A total of 30 stopping rules are used in the total package, such as CH (Calinski and Harabasz) index, Duda index, Pseudo t2, C-index, Gamma-index, Beale index, Cubic clustering criterion (CCC), Point-biserial correlation coefficient, Gplus-index and others. Several features were used as definition criteria for the number of clusters, such as the dispersion matrix within the clusters, the dispersion matrix between the clusters, the total data amount in the selection, the total data amount within the cluster, the sum of the distances between the clusters and the sum of the distances within the clusters. Some of stopping rules have their own specialization, which was discussed in detail in the works [
27,
40]. To determine the optimal number of clusters (intervals), KL, CH, Hartigan, CCC, Scott, Marriot stopping rules were used. Among all: 1 proposed 2 as the best number of clusters, 3 proposed 3 as the best number of clusters, 2 proposed 4 as the best number of clusters. According to the majority rule, the best number of clusters is 3. As a result, the settlements were divided into three intervals (
Table 6).
As a method of grouping, the graph of nearest neighbors was used. The essence is one of the main metric algorithms for finding similar elements of a set. The idea of its construction is in seeking the most similar object in the set X to a given query q. Under the conditions of the current task, the main settlements act as q, and the rest of the settlements act as the set X. However, it should be noted that the grouping process can be automated if all the algorithms used are formalized in the form of a program or macro.
Then, settlements with the same set of pricing factors and the nature of their influence on the value were identified using the expert method. This made it possible to form a conglomeration of settlements comparable in terms of price levels, a set of pricing factors and the nature of their impact on value. For example, one conglomeration was formed with villages located near Izhevsk—Golyany, Bolshaya Venya, Shudya, Malaya Venya, Novaya Kazmaska, Old Mikhailovskoye. The amount of market information in these settlements is shown in
Table 7 (collected on all transactions for the sale and purchase of IHC land for the period from 5 January 2015 to 5 January 2017).
It is obvious that the application of the traditional approach to cadastral valuation using regression for these settlements is impossible, therefore, TEM was applied.
On its basis, a list of market information used for modeling was compiled. As a result of the stepwise regression, a model was built (2):
where
x1 is the distance to the school in kilometers,
x2 is the availability of sewerage (yes/no),
x3 is the availability of electricity (yes/no) and
x4 is the distance to Izhevsk in kilometers.
Table 8 presents the quality characteristics of the cadastral value model for the settlements of the Izhevsk conglomeration.
Table 5 checks the predictive ability of the model on the control sample.
The coefficient of determination (R2) shows the percentage of deviation of the resulting indicator due to the variation of the factor. This indicator varies in the range from 0 to 1, and its value is better closer to 1. In this model, it is 0.66, which indicates the preliminary suitability of the model. The adjusted coefficient of determination corrects the number of degrees of freedom and the equality is 0.63.
Fisher’s criterion allows evaluation of the obtained value of the criterion using a table. Under these conditions, Fcrit < Fcalculated, which proves the statistical significance of the equation. The average error is in the specified range of values (A ≤ 20%), which indicates sufficient predictive power. According to Student’s criterion, the equation coefficient is considered reliable if its calculated value exceeds the critical value. In the context of the task, this condition is met. We can conclude that the model is suitable for forecasting.
Table 9 checks the predictive ability of the model on the control sample. In 2017 Methodological guidelines on cadastral valuation there is no criteria of mass value accuracy, therefore Standard on Ratio Studies [
42] was used, which sets a ratio, described by Formula (5).
The calculated ratios are slightly outside the specified interval, which can be considered acceptable, since by rounding it turns out to be 0.9, and the resulting value does not exceed the market value, i.e., the rights of citizens are not violated.


