Article

A Participatory and Spatial Multicriteria Decision Approach to Prioritize the Allocation of Ecosystem Services to Management Units

1
Forest Research Center and Laboratory Terra, School of Agriculture, University of Lisbon, Tapada da Ajuda, 1349-017 Lisboa, Portugal
2
Corvallis Forestry Sciences Laboratory, Pacific Northwest Research Station, US Department of Agriculture, Forest Service, 3200 SW Jefferson Way, Corvallis, OR 97331, USA
3
Mountain View Business Group, 428 Flying Orchid Dr, San Marcos, TX 78666, USA
*
Author to whom correspondence should be addressed.
Land 2021, 10(7), 747; https://doi.org/10.3390/land10070747
Submission received: 13 June 2021 / Revised: 11 July 2021 / Accepted: 14 July 2021 / Published: 16 July 2021

Abstract

:
Forest management planning can be challenging when allocating multiple ecosystem services (ESs) to management units (MUs), given the potentially conflicting management priorities of actors. We developed a methodology to spatially allocate ESs to MUs, according to the objectives of four interest groups—civil society, forest owners, market agents, and public administration. We applied a Group Multicriteria Spatial Decision Support System approach, combining (a) Multicriteria Decision Analysis to weight the decision models; (b) a focus group and a multicriteria Pareto frontier method to negotiate a consensual solution for seven ESs; and (c) the Ecosystem Management Decision Support (EMDS) system to prioritize the allocation of ESs to MUs. We report findings from an application to a joint collaborative management area (ZIF of Vale do Sousa) in northwestern Portugal. The forest owners selected wood production as the first ES allocation priority, with lower priorities for other ESs. In opposition, the civil society assigned the highest allocation priorities to biodiversity, cork, and carbon stock, with the lowest priority being assigned to wood production. The civil society had the highest mean rank of allocation priority scores. We found significant differences in priority scores between the civil society and the other three groups, highlighting the civil society and market agents as the most discordant groups. We spatially evaluated potential for conflicts among group ESs allocation priorities. The findings suggest that this approach can be helpful to decision makers, increasing the effectiveness of forest management plan implementation.

1. Introduction

Forest management planning is a multilayered process because it involves numerous actors and occurs at different spatial and temporal scales [1]. Multifunctional forestry requires a landscape-level management planning approach to integrate different actors’ preferences and goals and to provide a wide range of ecosystem services (ESs) that can address the pillars of sustainable forest management [2]: economic—ensuring profitable forest management; environmental—diversifying ESs; and social—integrating different interests, objectives, and preferences.
An important challenge in contemporary forest management planning is integrating different actors’ preferences and objectives for ESs to produce a forest plan that they have a sense of ownership in and are comfortable implementing [3,4]. In addition, forest owners and managers typically need to deal with various resource limitations to implement a forest management plan [5,6]. So, a central question for forest owners, managers, and other interest groups is how to allocate ESs to forest management units (MUs) that best fulfill the objectives and preferences of multiple competing interests.
To support forest owners, managers, and other interest groups in prioritizing the allocation of ESs to MUs, we developed a Group Multicriteria Spatial Decision Support System approach, combining Multicriteria Decision Analysis (MCDA), multicriteria Pareto frontier methods [7,8,9,10] and EMDS—Ecosystem Management Decision Support [11]. We used the Feasible Goal Method to generate the Interactive Decision Maps (Pareto frontier) based on previous research applied to forest management planning developed by Borges et al. [12,13], Marques et al. [14,15] and Marto et al. [10,16]. This approach can facilitate data visualization and spatial analysis and promote a better understanding of actors’ preferences and the landscape-level impacts of their choices [17,18,19].
Several applications of Group Multicriteria Spatial Decision Support System have been developed within the scope of spatial prioritization of natural resources management. For example, Caglayan et al. [2] combined a participatory MCDA, mixed integer programming, and a Geographic Information System (GIS) approach to assign ESs priority to MUs based on ESs sustainable development goals. Reinhardt et al. [20] created landscape-level prioritization for the management of five invasive forest plants, using a spatial MCDA methodology, whereas Povak et al. [21] developed a combined approach of MCDA and logic models, using EMDS, to prioritize landscape treatment units for invasive species removal and native forest protection from non-native species invasions. Bottero et al. [19] applied an MCDA and GIS to identify suitable areas for biodiversity conservation to be included in spatial planning decision support processes. Uribe et al. [22] used a participatory GIS-based MCDA approach to identify priority areas for forest landscape restoration. There are some applications of prioritizing landscape restoration, using MCDA and EMDS. For example, Cannon et al. [23] prioritized restoration areas for the development of stand treatments (e.g., forest tree thinning, prescribed fire), and Reynolds et al. [24] identified the priority landscape units for treatment (e.g., restoration) and the priority treatment actions to be implemented there.
According to the last National Forest Inventory (IFN6) [25], in 2015, forests were the main land use in Portugal mainland, accounting for 36.2% of the total land area. Public ownership (state and other public entities) represented only 3% of the forest land, with the remainder held by local communities (about 6% of the total forest land) and by private owners (91% of the total forest land, of which 4% were managed by industrial companies) [26]. In 2005, in order to address concerns with the increase of burned forest area the Portuguese Government created a legal regime to promote the cooperation of non-industrial small-scale forest owners through the creation of joint collaborative management areas, ZIF (the acronym for Zona de Intervenção Florestal in Portuguese) [6]. The main objective of ZIF is to promote a sustainable, profitable and wildfire resilient landscape-level forest management. In December 2020, there were 245 ZIF in Portugal mainland, representing more than 23,000 forest owners and extending over 1697 thousand ha, corresponding to 19.0% of the country’s mainland area [26,27].
However, not all ZIF have forest management plans implemented. ZIF managers find it difficult to integrate the different interests and objectives of the forest owners in the planning or implementation of forest management, due to the conflict of interests [5] and to delays in public funds availability [6]. In this context, ZIF managers need participatory approaches that may facilitate the understanding and the integration of the different interests and objectives of forest owners and contribute to the effectiveness of forest management planning. In addition, ZIF forest management and the corresponding allocation of the provision of ESs to MUs is complicated by the large number of forest owners and the fragmentation of forestland into multiple blocks. Thus, ZIF managers and other decision-makers with similar contextual challenges to forest management can benefit from tools that can prioritize the allocation of ESs to MUs, given the competing priorities of multiple interest groups, minimizing potential conflict of interests. Uhde et al. [1] have observed that the research and application of hybrid methods of MCDA and trade-offs between different ESs and their optimization are rare. To our knowledge, no research has focused yet on the use of a Group Multicriteria Spatial Decision Support System to prioritize the allocation of ESs to MUs in a joint management area, such as ZIF, dealing with multiple actors with different interests and objectives.
To fill this gap, we developed and applied a Group Multicriteria Spatial Decision Support System approach to two ZIF areas in Vale do Sousa for allocating bundles of ESs to MUs, according to interest groups’ preferences and objectives. The emphasis was on the facilitation of a transparent participatory forest management planning, integrating different actors into forest decisions of a ZIF, as well as on the promotion of sustainable landscape-level forest management planning in joint management areas (ZIF).

2. Materials and Methods

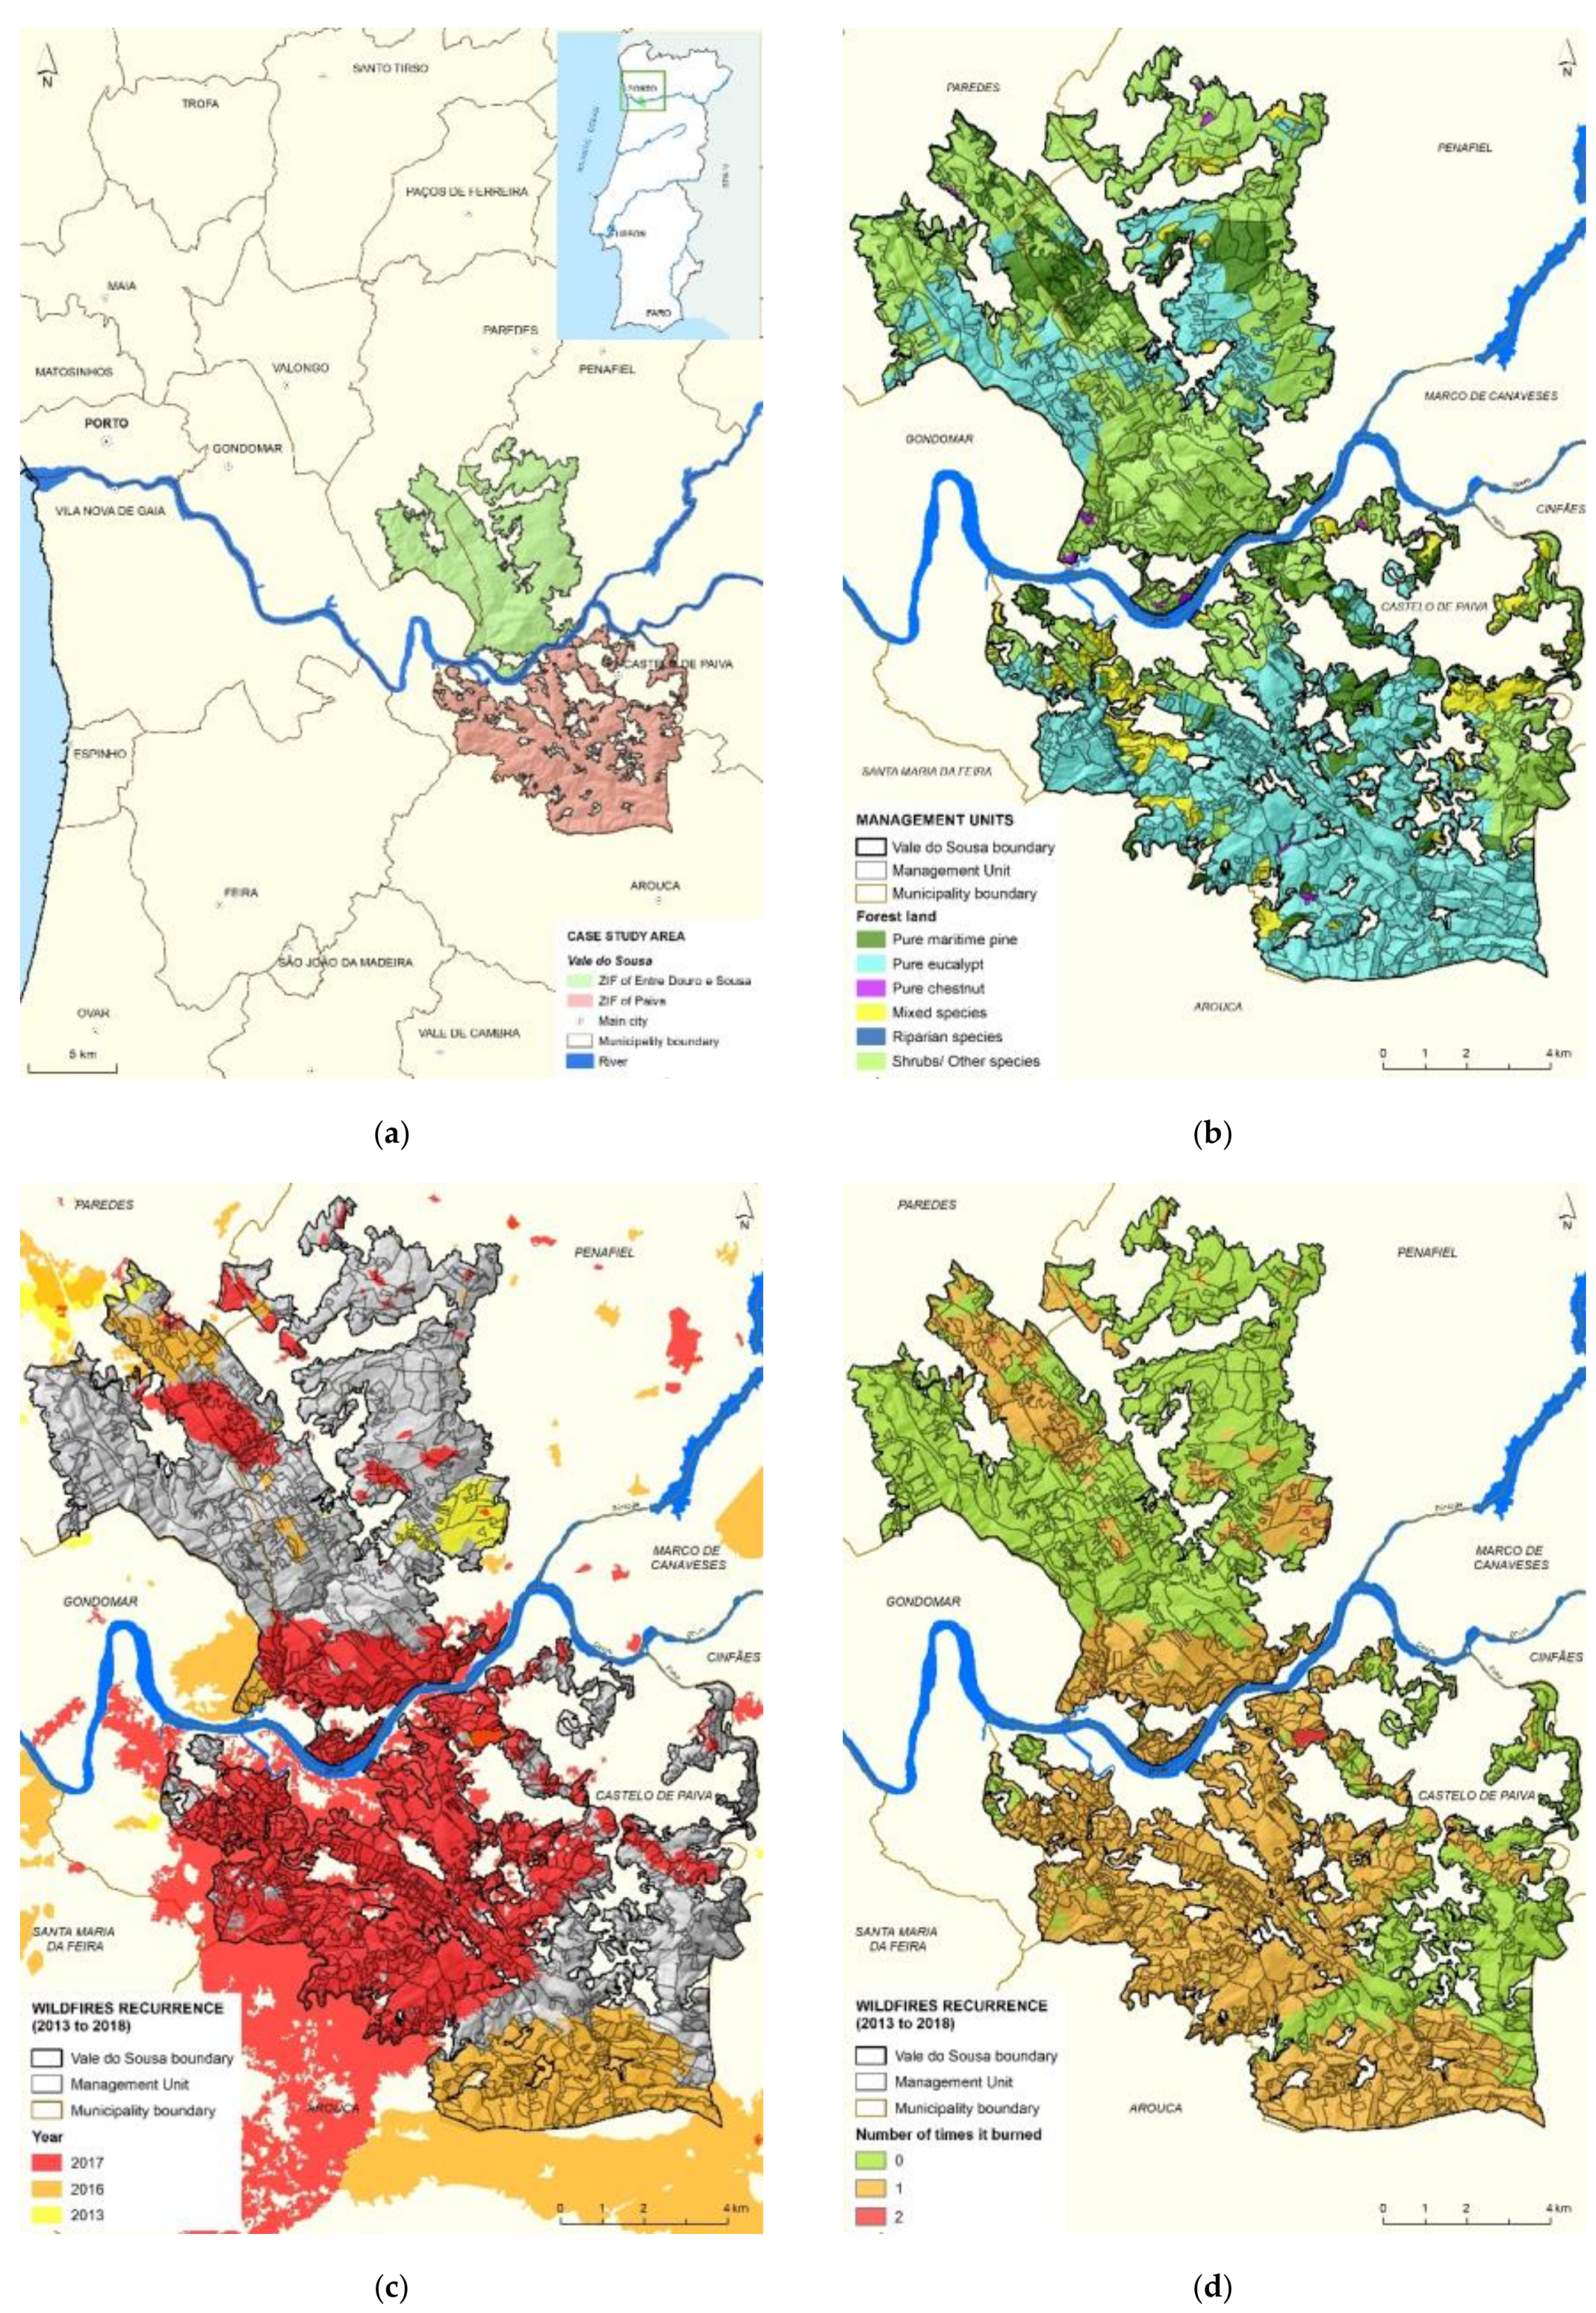
2.1. Case Study Area

The Vale do Sousa case study area extends over 14,840 hectares in the northwestern region of Portugal (Figure 1a). It is located about 50 km East of Porto, so it is popular for recreational activities in nature. Vale do Sousa includes two joint collaborative management areas separated by the Douro River: ZIF of Entre-Douro-e-Sousa (north of the Douro River) and ZIF of Paiva (south of the Douro River). It is a forested area, where the predominant species are pure and mixed stands of eucalypt (Eucalyptus globulus Labill) and maritime pine (Pinus pinaster Aiton). Vale do Sousa is divided into 1373 MUs (Figure 1b). A MU is a delimited contiguous and homogeneous area in terms of land use, type of forest stand (species, age), and physical characteristics (type of soil and slope).
Wildfires have been frequent and severe in Vale do Sousa in the last six years (2013 to 2018), with the accumulated burned area covering 7175 ha [28] (Figure 1c). The years with the largest burned area were 2016 (1763 ha, 11.9% of the total area) and 2017 (4006 ha, 27.0% of the total area). During this period, 7135 ha (48.1% of the total area) of Vale do Sousa burned once and 40 ha (0.3% of the total area) twice (Figure 1d). Before conducting the analysis of MUs, we used the satellite imagery from late 2017 and verified the land occupation in areas that burned before that year. In the case of areas burned in 2017, we simulated alternative land occupation, according to actors’ preferences identified in previous interactions (interviews and workshops; [5,29]), regarding the species to use for regeneration.
The ownership is mainly private, small-scale, and fragmented into numerous small blocks. There are also community areas managed by the local parish councils and private areas managed by the pulpwood industry. Vale do Sousa is also characterized by actors with distinct interests, goals, and concerns in forest management. Therefore, Vale do Sousa is considered representative of forest management in northwestern Portugal.

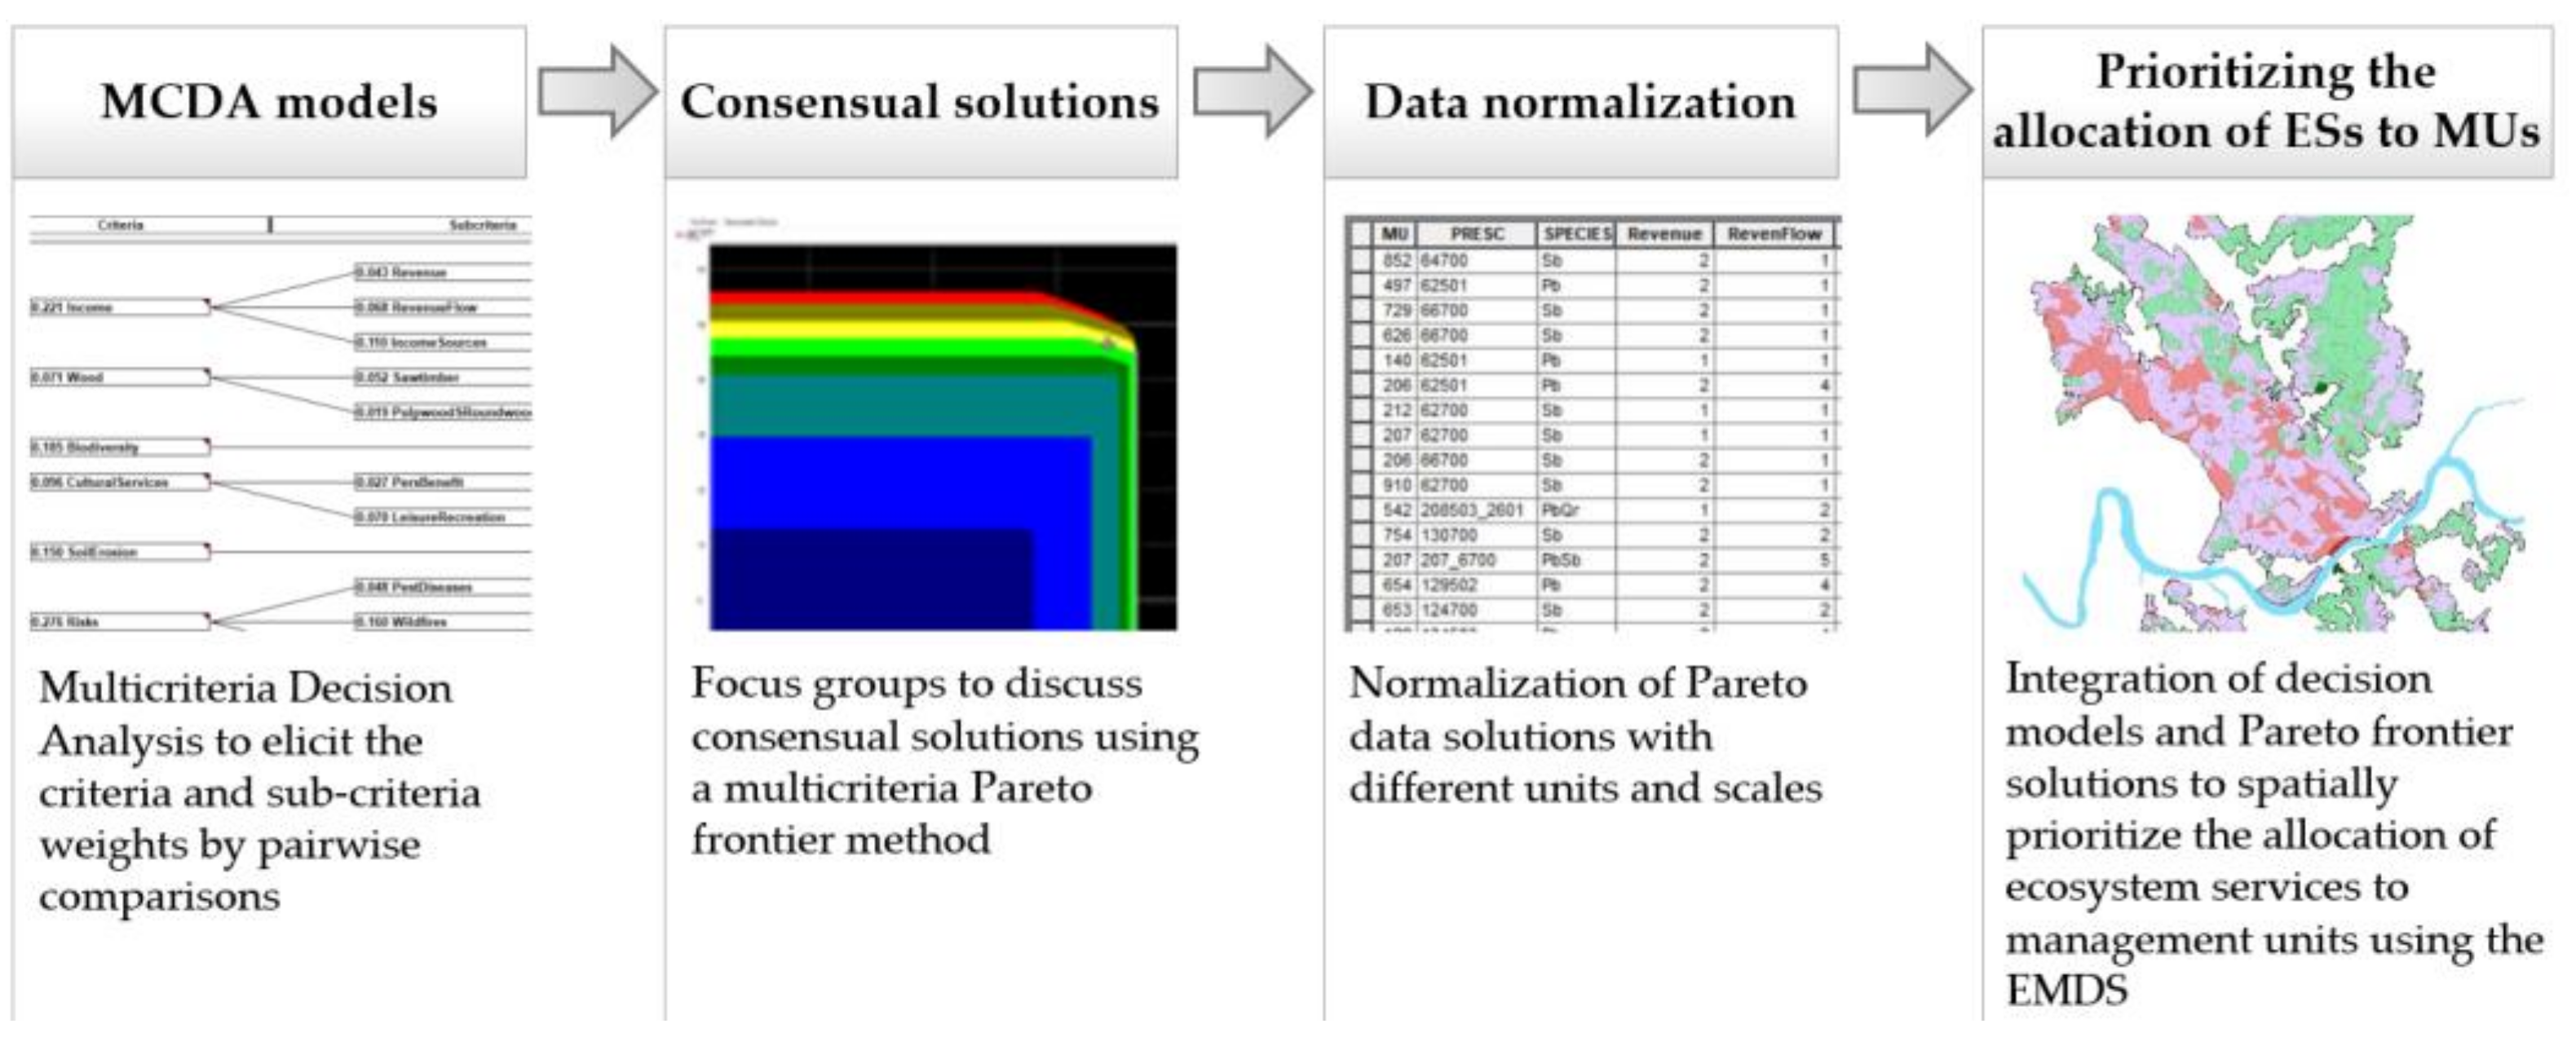
2.2. Research Design

We implemented a Group Multicriteria Spatial Decision Support System approach that encompasses four-step integrating decision support methods (Figure 2) to spatially prioritize the allocation of ESs to MUs that best reflects the competing preferences, priorities, and objectives of the interest groups. First, we applied MCDA to weight the criteria and sub-criteria of the decision models by interest group [30]. Second, we organized a group decision-making session, applying a focus group technique [31] to negotiate consensual solutions, using a multicriteria Pareto frontier method for ESs trade-offs and multi-objective optimization [16,32]. Third, we normalized the Pareto frontier solutions’ data. Fourth, we integrated the decision models and the normalized Pareto frontier solutions into EMDS [11] to estimate the spatial priority scores of interest groups for alternative bundles of ESs. A final phase of the analysis presents a simple approach to spatially evaluating the potential for conflicts among group ESs allocation priorities for ZIF management.

2.2.1. MCDA Models

In a previous study [30], four interest groups participated in the designing of MCDA models to evaluate the priority of forest management models in terms of meeting performance criteria for the provision of ESs. A forest management model identifies the rules of conducting a species according to its defined goals and constraints, within a specific period. All groups’ models shared a common structure in terms of the criteria and sub-criteria used to evaluate performance, and the derived weights of the decision models by interest group (example available in Supplement S1, Figure S1) were obtained through a combined MCDA and group decision-making approach. The criteria and sub-criteria weights were assigned by 37 actors applying analytic hierarchy process (AHP) pairwise comparisons [33,34], using the software Criterium DecisionPlus—CDP (InfoHarvest, Inc., Seattle, WA, USA), a component of the EMDS system (Table 1). The reader is referred to Marques et al. [30] for details about how the actors weighted criteria and sub-criteria and how weights were achieved by the interest groups.
Marques et al. [30] obtained a ranking of the forest management models, according to the actors’ preferences. However, in our study, we did not consider the priority scores from that ranking, but only the weights of the criteria and sub-criteria since the solution obtained through the Pareto frontier method assigns to each MU the forest management model that best meets the actors’ objectives (Section 2.2.2). The alternative of the decision model (Supplement S1, Figure S1) represents the MUs. The criteria and sub-criteria weights for each interest group reflect each group’s preferences for the provision of ESs in a MU, so a group’s priority score for a MU reflects how well the forest management model (FMM in Supplement S1, Figure S1) meets the group objectives, given its allocation of ESs criteria weights. In other words, a MU has high priority for an interest group when the MU has high scores on the ESs most important to the group. Given the relation between a group’s MU priority score and the weights allocated to ES criteria, this has immediate application to the allocation of bundles of ESs to MUs.

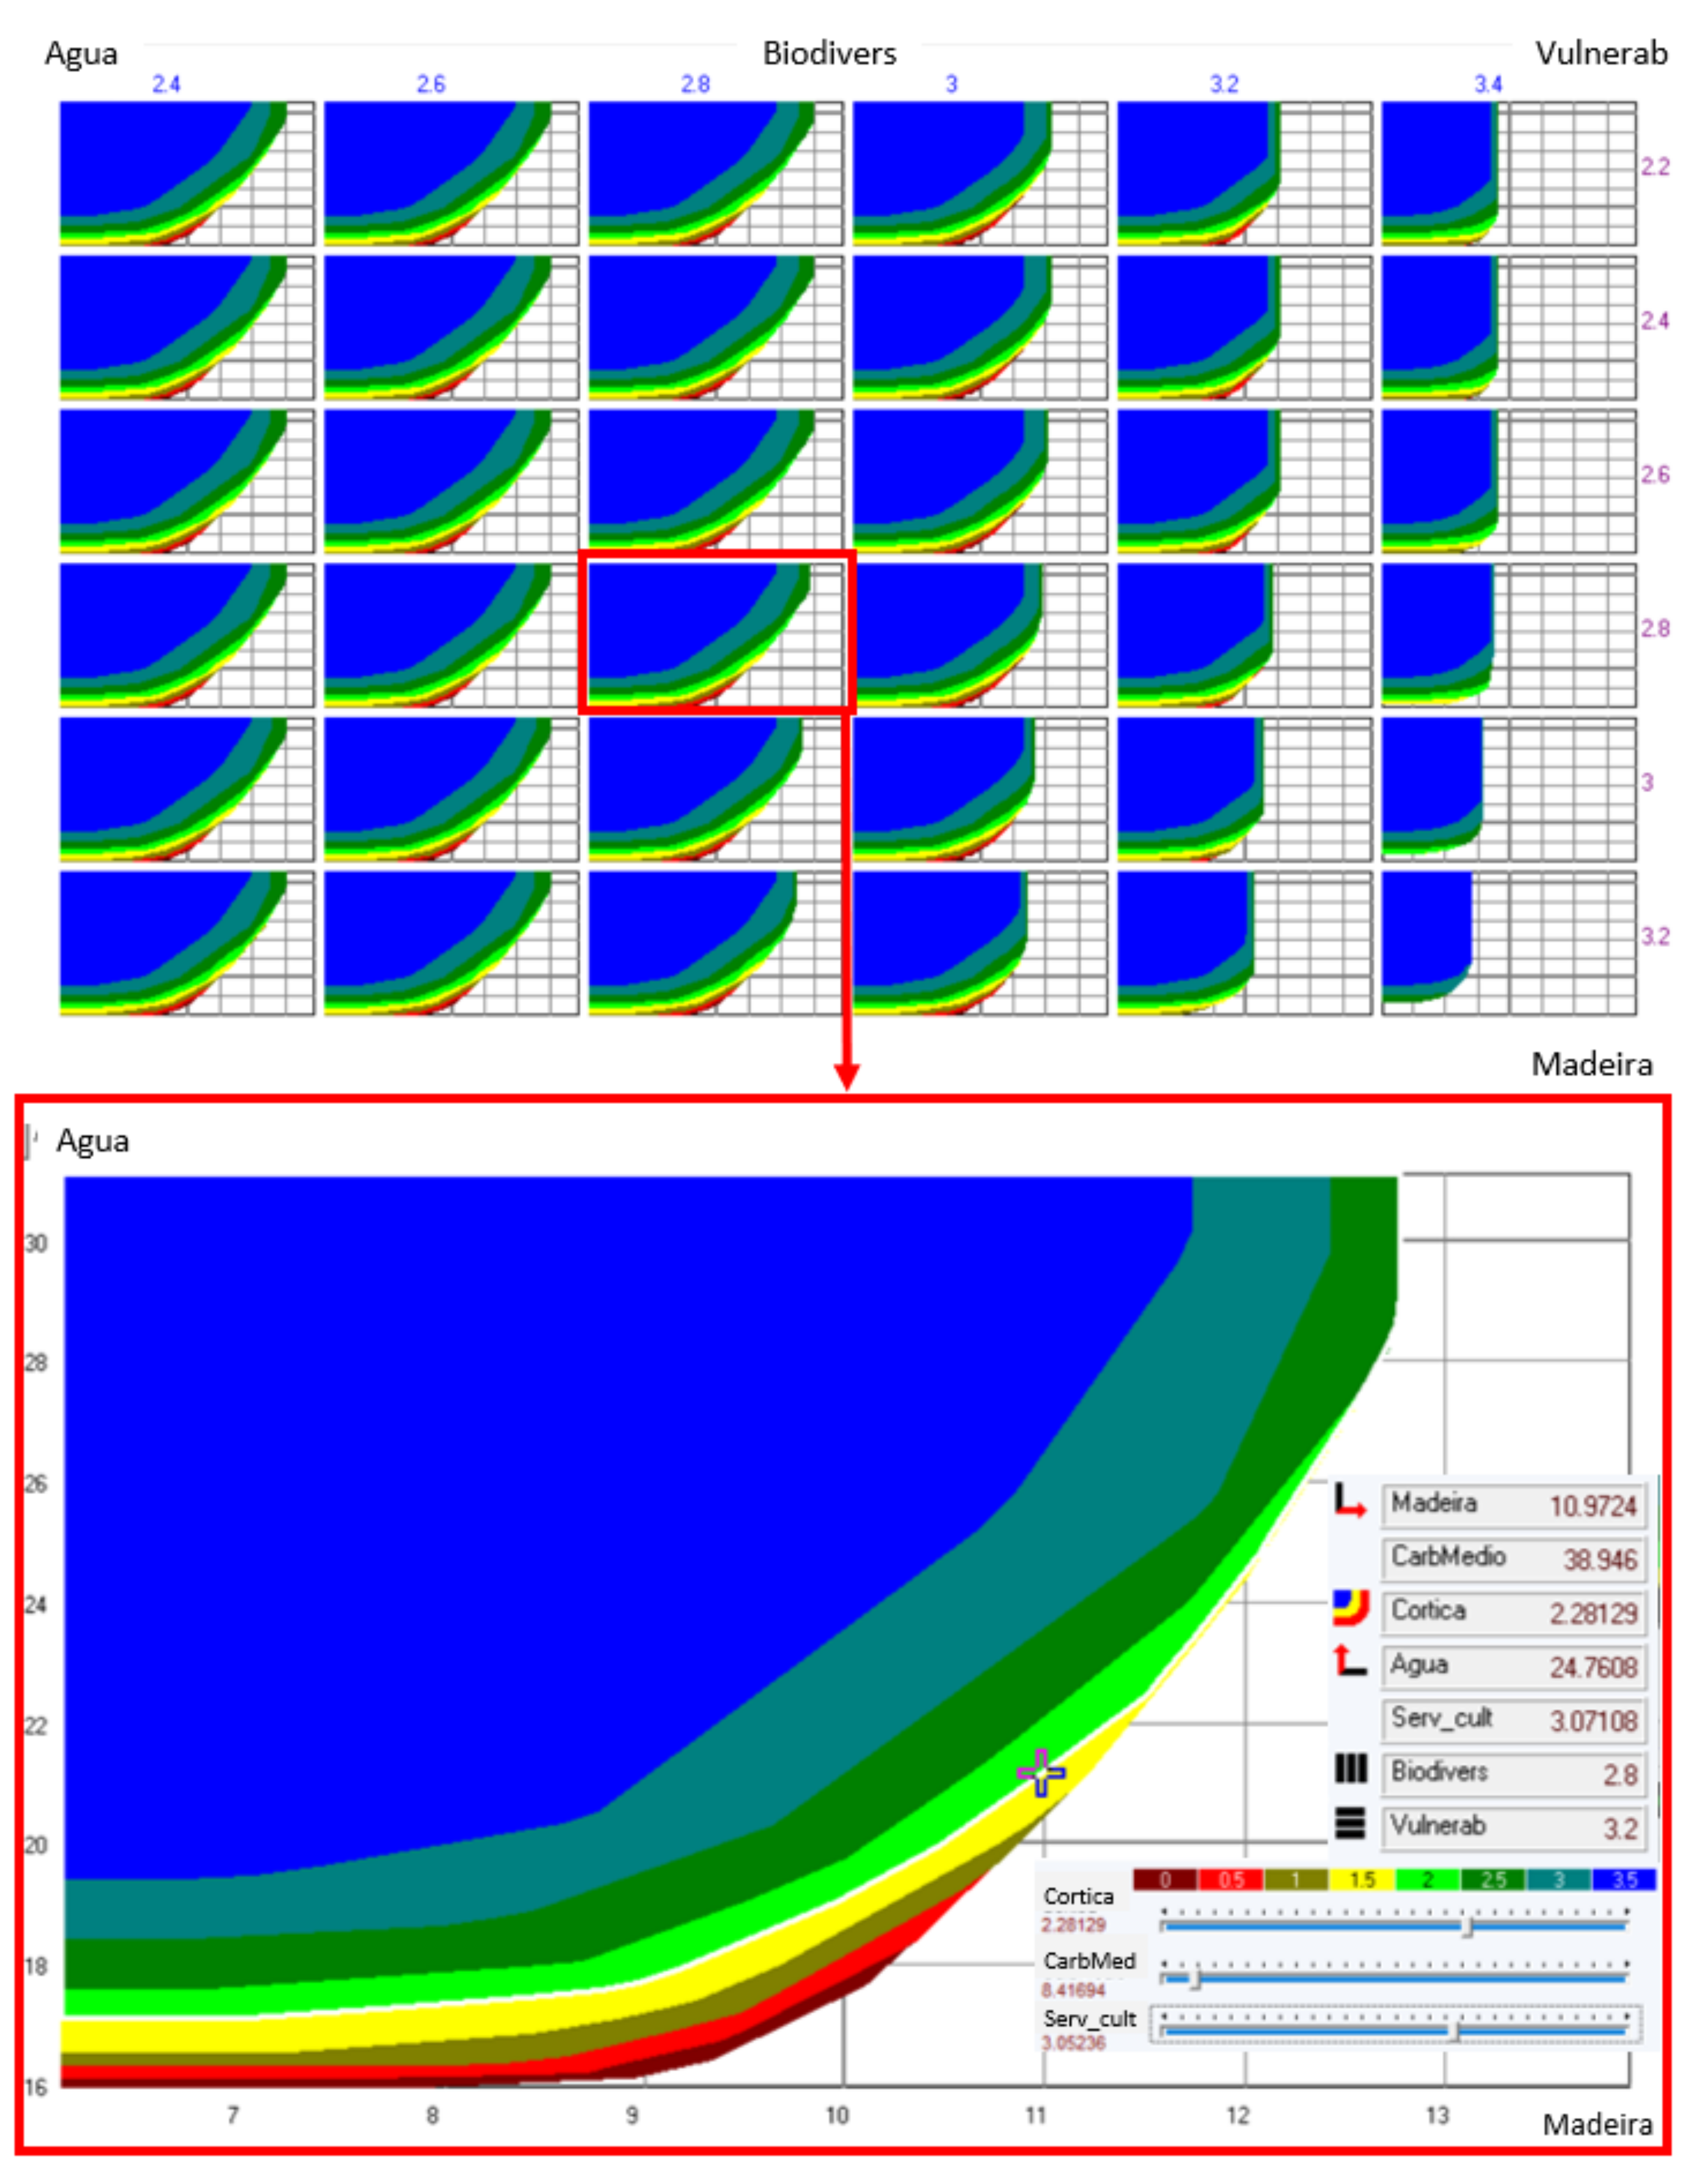
2.2.2. Consensual Solutions

We designed the focus group session with 4 to 6 participants each, i.e., a total of 16 to 24 participants, so that every actor could contribute with their opinion and have time for discussion [31]. A potential drawback of a focus group approach is a lack of participants. Thus, we over-recruited and invited 45 actors who are representative of the forest management interests of Vale do Sousa to participate in a one-day workshop. Twenty-three actors attended the workshop and of these, 19 participated in the focus group session. Of 19 actors, 14 assigned the criteria and sub-criteria weights of the MCDA models [30]. First, we presented and discussed the results of the MCDA participatory process [30]. Next, we explained how to work with the Pareto frontier method. Then, we grouped the actors, according to their interests in forest management. As a result, we assembled four interest groups of four to six actors into civil society, forest owners, market agents, and public administration (Table 2).
A trained facilitator and an observer supported each group. The facilitator started the session by explaining their and the observer’s role, highlighting that they would not interfere in the group discussion. The facilitator conducted the discussion, clarified any questions related to the use of the Pareto frontier method, and ensured that all the group actors participated in the discussion. The facilitator asked actors to discuss the question, “What matters most to us as a group?” , and then to negotiate a consensus solution that best achieved their goals. The observer registered the main conclusions of the discussions and controlled the time throughout the session, periodically indicating the remaining time available. The groups were allowed 90 min to reach a consensus.
The actors applied the Pareto frontier method to negotiate a consensual bundle of seven ESs—biodiversity, carbon stock, cork, cultural services, soil erosion, wildfire resistance, and wood—over a 90-year planning horizon. We considered 90 years in order to be able to check the impact of forest management models on the supply of ESs, especially in the species usually managed with longer rotations (e.g., pedunculate oak and cork oak), due to their slow growth rate.
To avoid an overly complex analysis and to facilitate selecting a solution, we limited the analysis to these seven ESs, where first and second ESs are represented in the X and Y axes, respectively. The third ES is represented by decision maps with different colors that correspond to slices of the three-dimensional Pareto frontiers. The fourth and fifth ESs are represented as columns and in rows, respectively, while the sixth and seventh as scroll bars (Figure 3). Each group of actors selected how they wanted to see the ESs represented (order of ESs) for their interactive and collaborative decision process (Table 2). The interactive use of the Pareto frontier method [35] and the analysis of trade-offs between ESs allowed actors to select the solution that they agreed to be the most appropriate and representative of group interests and objectives. To select a consensus solution each group analyzed the set of Interactive Decision Maps and selected a point in the Pareto frontier. In the negotiation process, the actors discussed and negotiated the following:
  • The level of the ESs represented in the scroll bars, fixing them.
  • The level of the ESs represented in columns and rows.
  • The level of the third ESs represented in decision maps.
  • Finally, the desired level on ESs in Y and X axis.
After the group reached the consensus solution and fixed this selection, the tool displayed the management plan associated with the solution, thus identifying the forest management models and the corresponding prescriptions to be assigned to each MU.

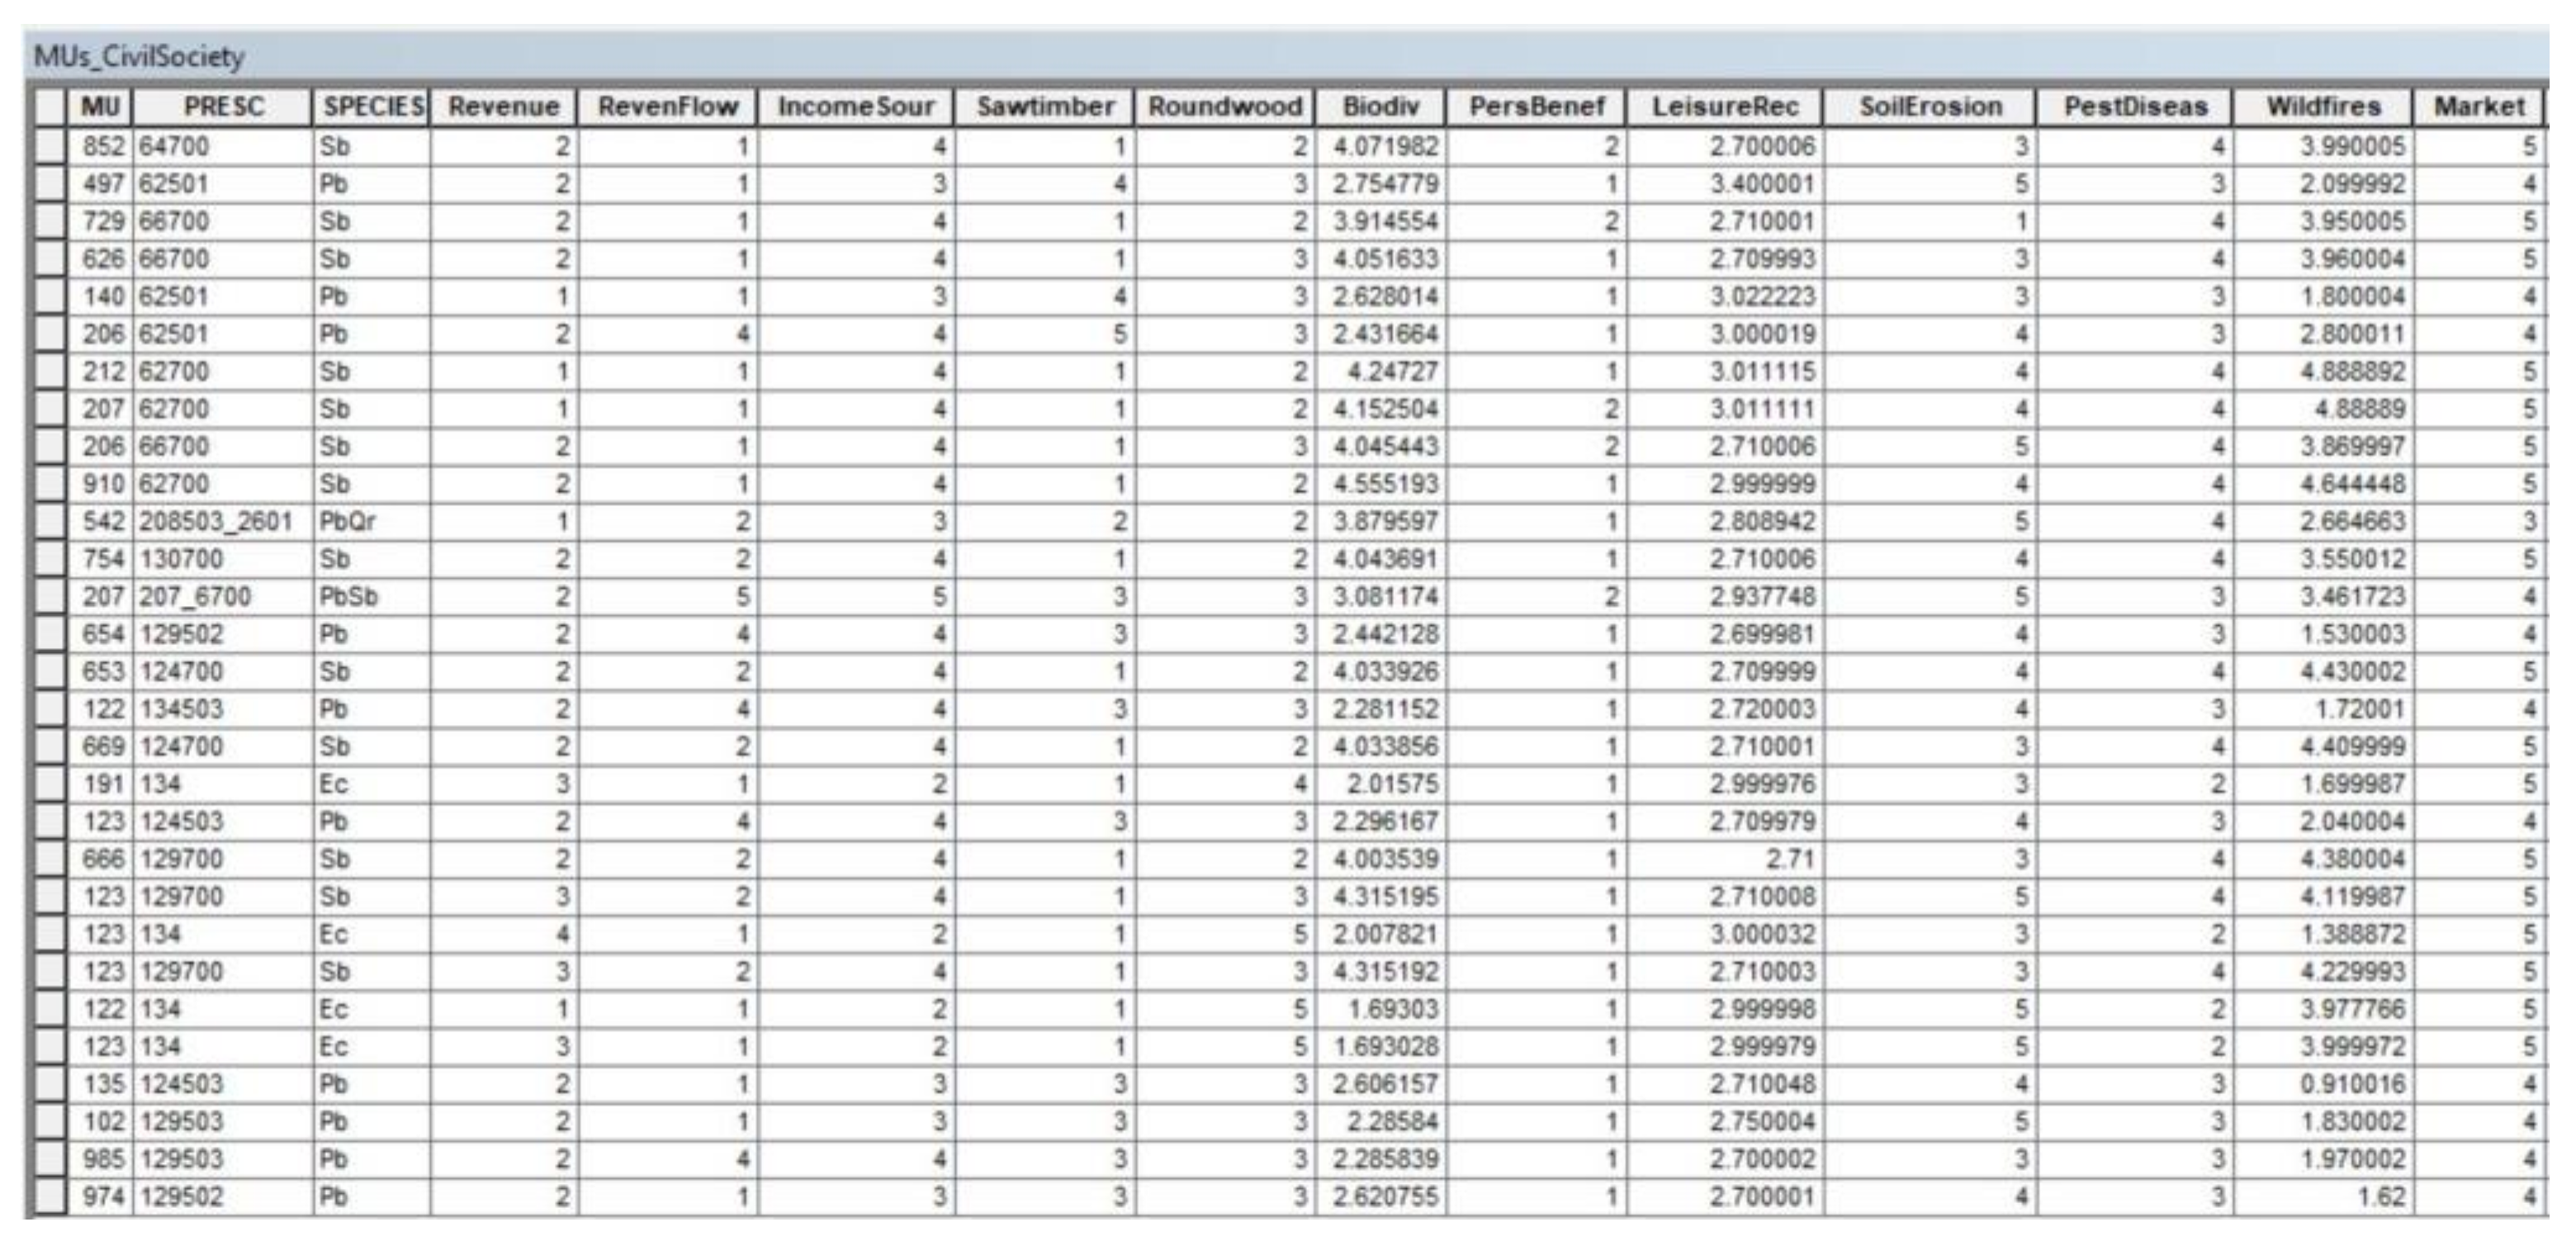
2.2.3. Data Normalization

Most data from Pareto frontier solutions had different units and scales (e.g., revenue was in EUR and soil erosion was in t/year). So, to integrate the contributions of the lowest criteria and normalize data inputs, we defined a common scale ranging between 1 (very poor) and 5 (very good) (Table 3). Then, we assigned this scale to the MU Pareto frontier database solutions (Figure 4 and Supplement S2, Figure S2.1 to Figure S2.4). However, it was not necessary to normalize the values of three ESs—biodiversity, leisure and recreation (cultural services), and wildfires (risks)—as they were already ordinal indices ranging between 1 and 5.
In CDP, the normalized input ratings on the 1-to-5 scale (Table 3) are linearly trans-formed to utility scores such that a rating of 1 has a utility of 0, and a rating of 5 has a utility of 1. Lowest level criteria evaluate the attributes of the alternatives (Table 1). The priority score for an alternative (a management unit) is calculated as the sum of products of the lowest level criterion weights and the utility scores of each attribute for the alternative. Given that the weights of lowest level criteria sum to 1, and utilities are on a [0, 1] scale, the resulting priority scores for MUs likewise are on a [0, 1] scale.

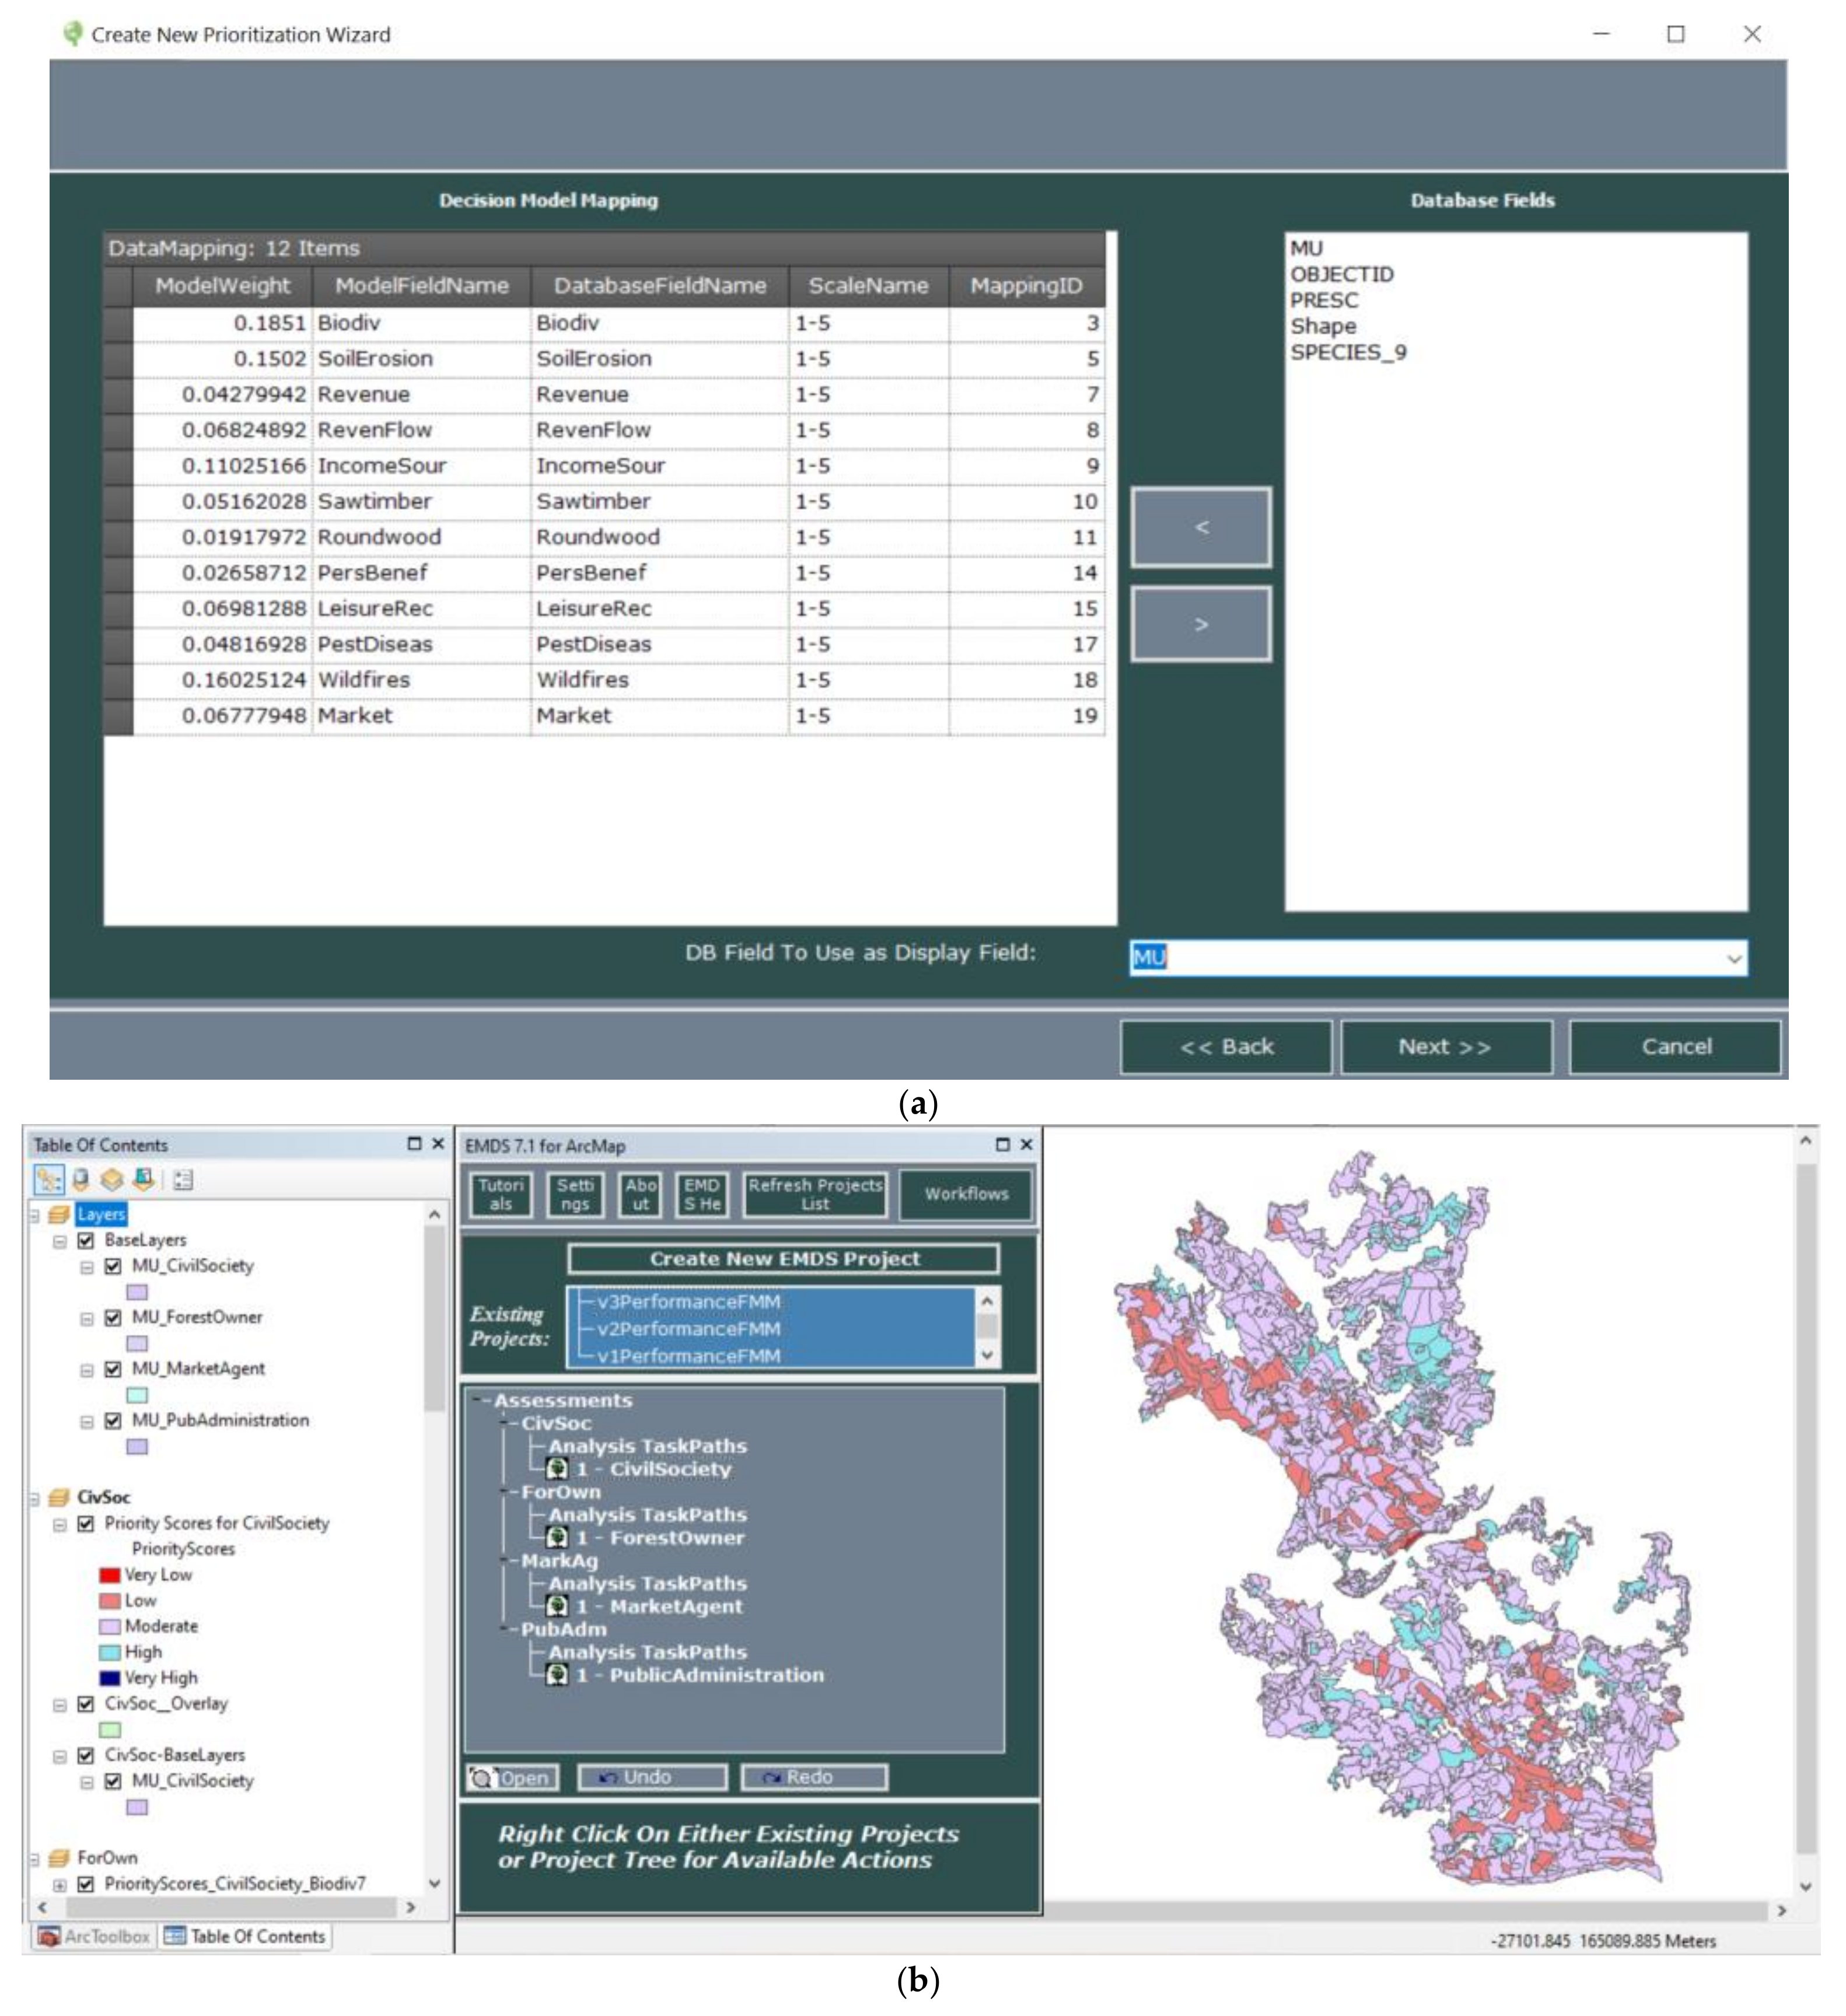
2.2.4. Prioritizing the Allocation of Ecosystem Services to Management Units

In the final step of the analysis, we used the EMDS 7.1.0.22 system (Mountain View Business Group, San Marcos, TX, USA) with the ArcGIS 10.6 geographic information system (Environmental Systems Research Institute, Redlands, CA, USA) to prioritize the allocation of ESs to MUs given the competing priorities of interest groups. In EMDS, we started by creating a new assessment and loading the normalized Pareto frontier solution geographic database (Supplement S2, Figure S2.1 to Figure S2.4). Next, we created a new analysis for the assessment by selecting CDP from the list to create a task and loading the corresponding decision model weights (Table 1; Supplement 1, Figure S1). Then, we mapped the MUs database fields to the CDP decision model names (Figure 5a) and calculated the priority score for each MU (Figure 5b). Given the discussion in Section 2.2.1, the output effectively prioritized the allocation of ESs to MUs based on the group criteria (Table 1) and objectives for the Vale do Sousa landscape.

2.3. Data Analysis

We conducted a spatial analysis using the software ArcGIS 10.6 and a statistical analysis using the software IBM SPSS Statistics, version 26 (IBM Corp., Armonk, NY, USA), to understand the priority scores of the allocation of ESs to MUs at the landscape level and to compare results between the interest groups. First, we used descriptive statistics to understand the distribution of ESs priority scores at the MU level and their spatial distribution by interest group. Next, we applied statistical tests to compare the results between groups and to determine which groups had the most concordant and the most discordant results. We established the inference with a significance level of α = 0.05. Because the assumptions of normality and homogeneity of variance were not met, we applied the non-parametric Kruskal–Wallis Rank Test to determine if there were statistically significant differences between groups.
To determine which groups were different after the Kruskal–Wallis Test rejected the null hypothesis, and because the groups were independent, we used a post hoc test for each group pair, the Mann–Whitney U-Test (also known as Wilcoxon Rank Sum Test).
Both non-parametric tests replace all priority scores by their rank numbers. So, higher priority scores get higher rank numbers. Additionally, we calculated the effect size (Cohen’s d) to compare and analyze the size of differences between groups [56,57].

2.4. Identifying Management Units in which There Is Low Conflict among Interest Groups

To assess if there were MUs on the landscape that could fulfill the objectives of one group without compromising the objectives of the other groups, we developed two analyses. Compromise, in this case, means that meeting the objectives of one group can only occur at the expense of realizing the objectives of one or more other groups. In other words, there is conflict among at least two groups with respect to satisfying their respective objectives. For example, MU 1597 had a priority score of 0.60 for civil society and 0.62 for market agent, that is, this MU is classified in the high class by both groups, which represents a conflict of interest between them, as these groups have different criteria and objectives for the Vale do Sousa landscape.
In both analyses, we began by assigning the Boolean value 1 to each group in each MU if a group’s priority rating was high or very high and 0 otherwise (Supplement S3, Figure S3.1). In this Boolean classification, a group value of 0 (not high or very high) was interpreted as an indicator that there was room for compromise with other groups, thus reducing the potential for conflict.
In the first analysis, we summed the Boolean values in each MU to count how many groups assigned high or very high priority in the same MU. We used the resulting count as an indicator of potential group conflicts, with a count of 0 or 1 indicating no or low potential for conflict among groups, and values from 2 to 4 indicating increasing potential for conflict among groups.
The second analysis is a refinement of the first in which we used the NetWeaver logic modeling component of the EMDS system to evaluate four specific cases that can create potential conflict if one or more groups rate the same MU as high or very high (Supplement S3, Figure S3.2). The design of the logic model was informed by the results presented in Section 3.3. Case 1 assumes the priorities of forest owners and public administrators are basically compatible (e.g., there is no or low conflict in these two groups when both rate a MU as high or very high priority). Cases 2 and 3 test for high priority in only civil society or market agents, respectively. Case 4 tests that no group rates the priority high or very high in a MU so there is at least the potential for compromise among groups.

3. Results

3.1. Consensual Solutions

During the focus group session, each group worked to reach a consensus, discussing the bundle of ESs. All groups discussed wood volume provisioning and wildfire risk resistance in depth. However, only the market agents discussed carbon stock more deeply, while the civil society group addressed biodiversity broadly. The forest owners group had the most difficulty managing the discussion of trade-offs, having tested only one consensual solution, in contrast to the other groups who analyzed between three to four solutions until arriving at a consensus (Table 2). The forest owners also had some difficulty interpreting the Pareto frontier solution, while the other three groups were relatively comfortable with the tool and its outputs.
We obtained four consensual solutions, according to the preferences of each interest group (Table 4). Comparing the different ESs values achieved by each group, the forest owners group selected wood provisioning (11.10 × 10⁶ m3) as the main ES, so the trade-offs were lower values for the other ESs. The civil society group selected the highest values for biodiversity (3.26), cork (3.30 × 10⁶ arroba), and carbon stock (54.09 × 10⁵ t/year), the trade-off being the lowest value for wood provisioning (8.44 × 10⁶ m3). The market agents group selected the highest value of wildfire risk resistance (3.84) and public administration, the highest value of soil erosion (22.50 × 10⁶ t of soil loss).

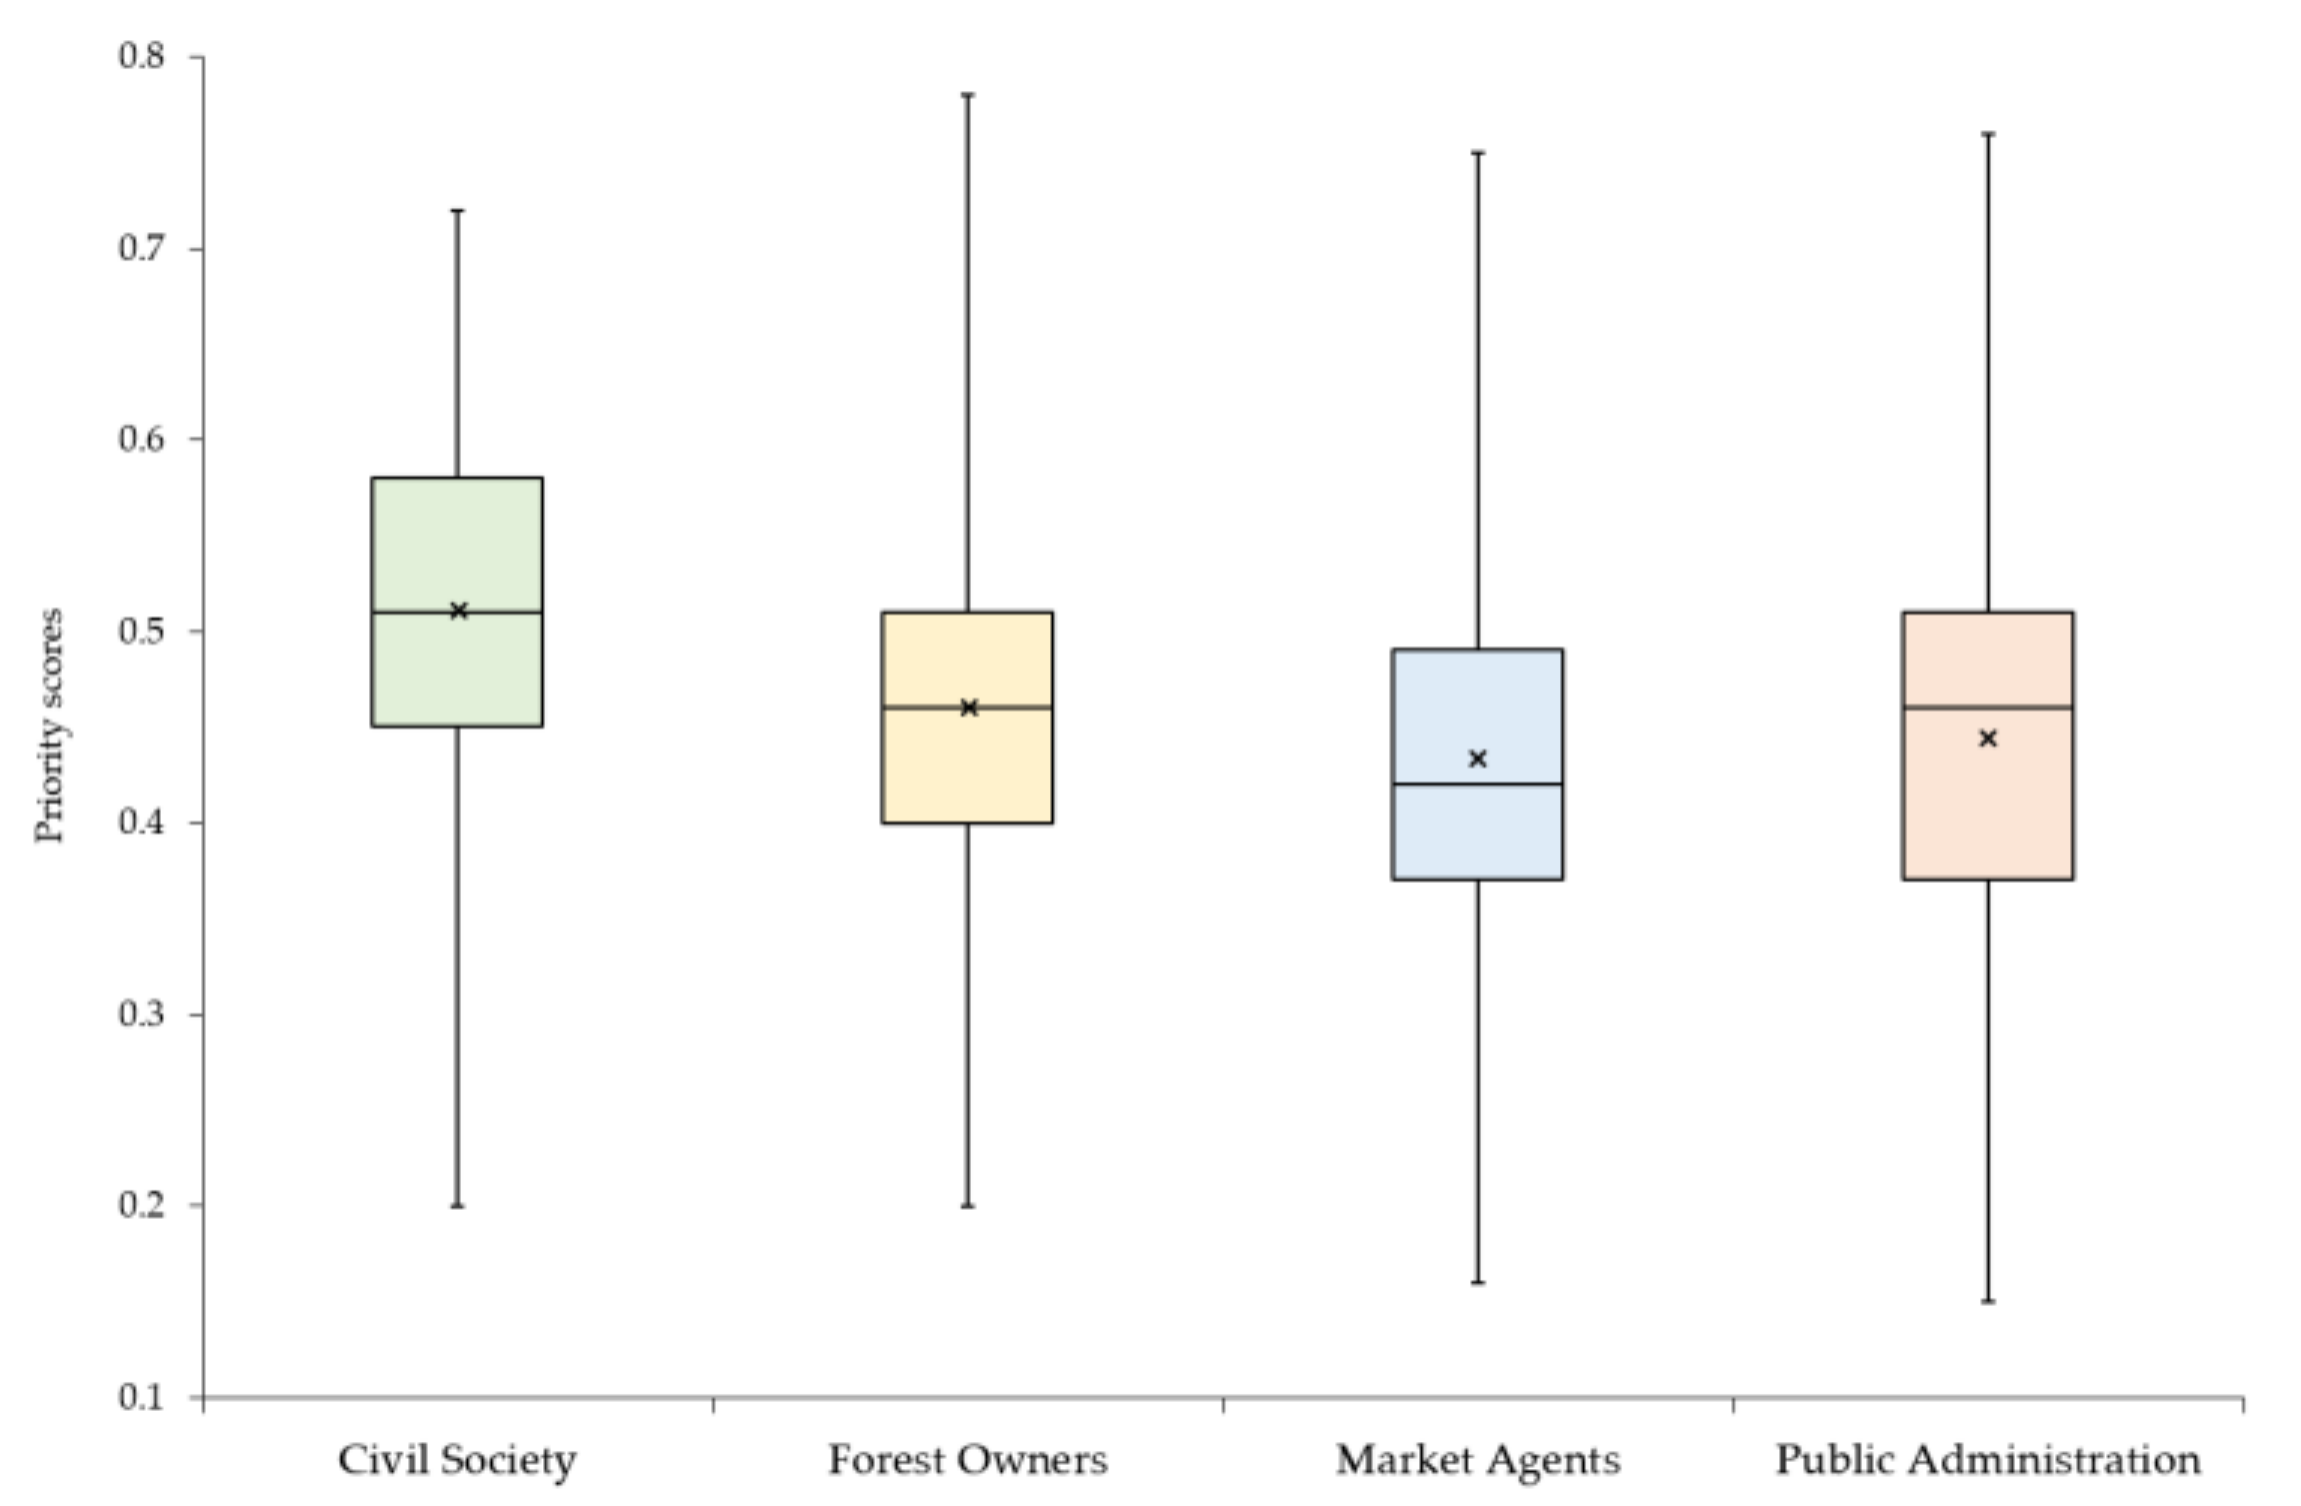
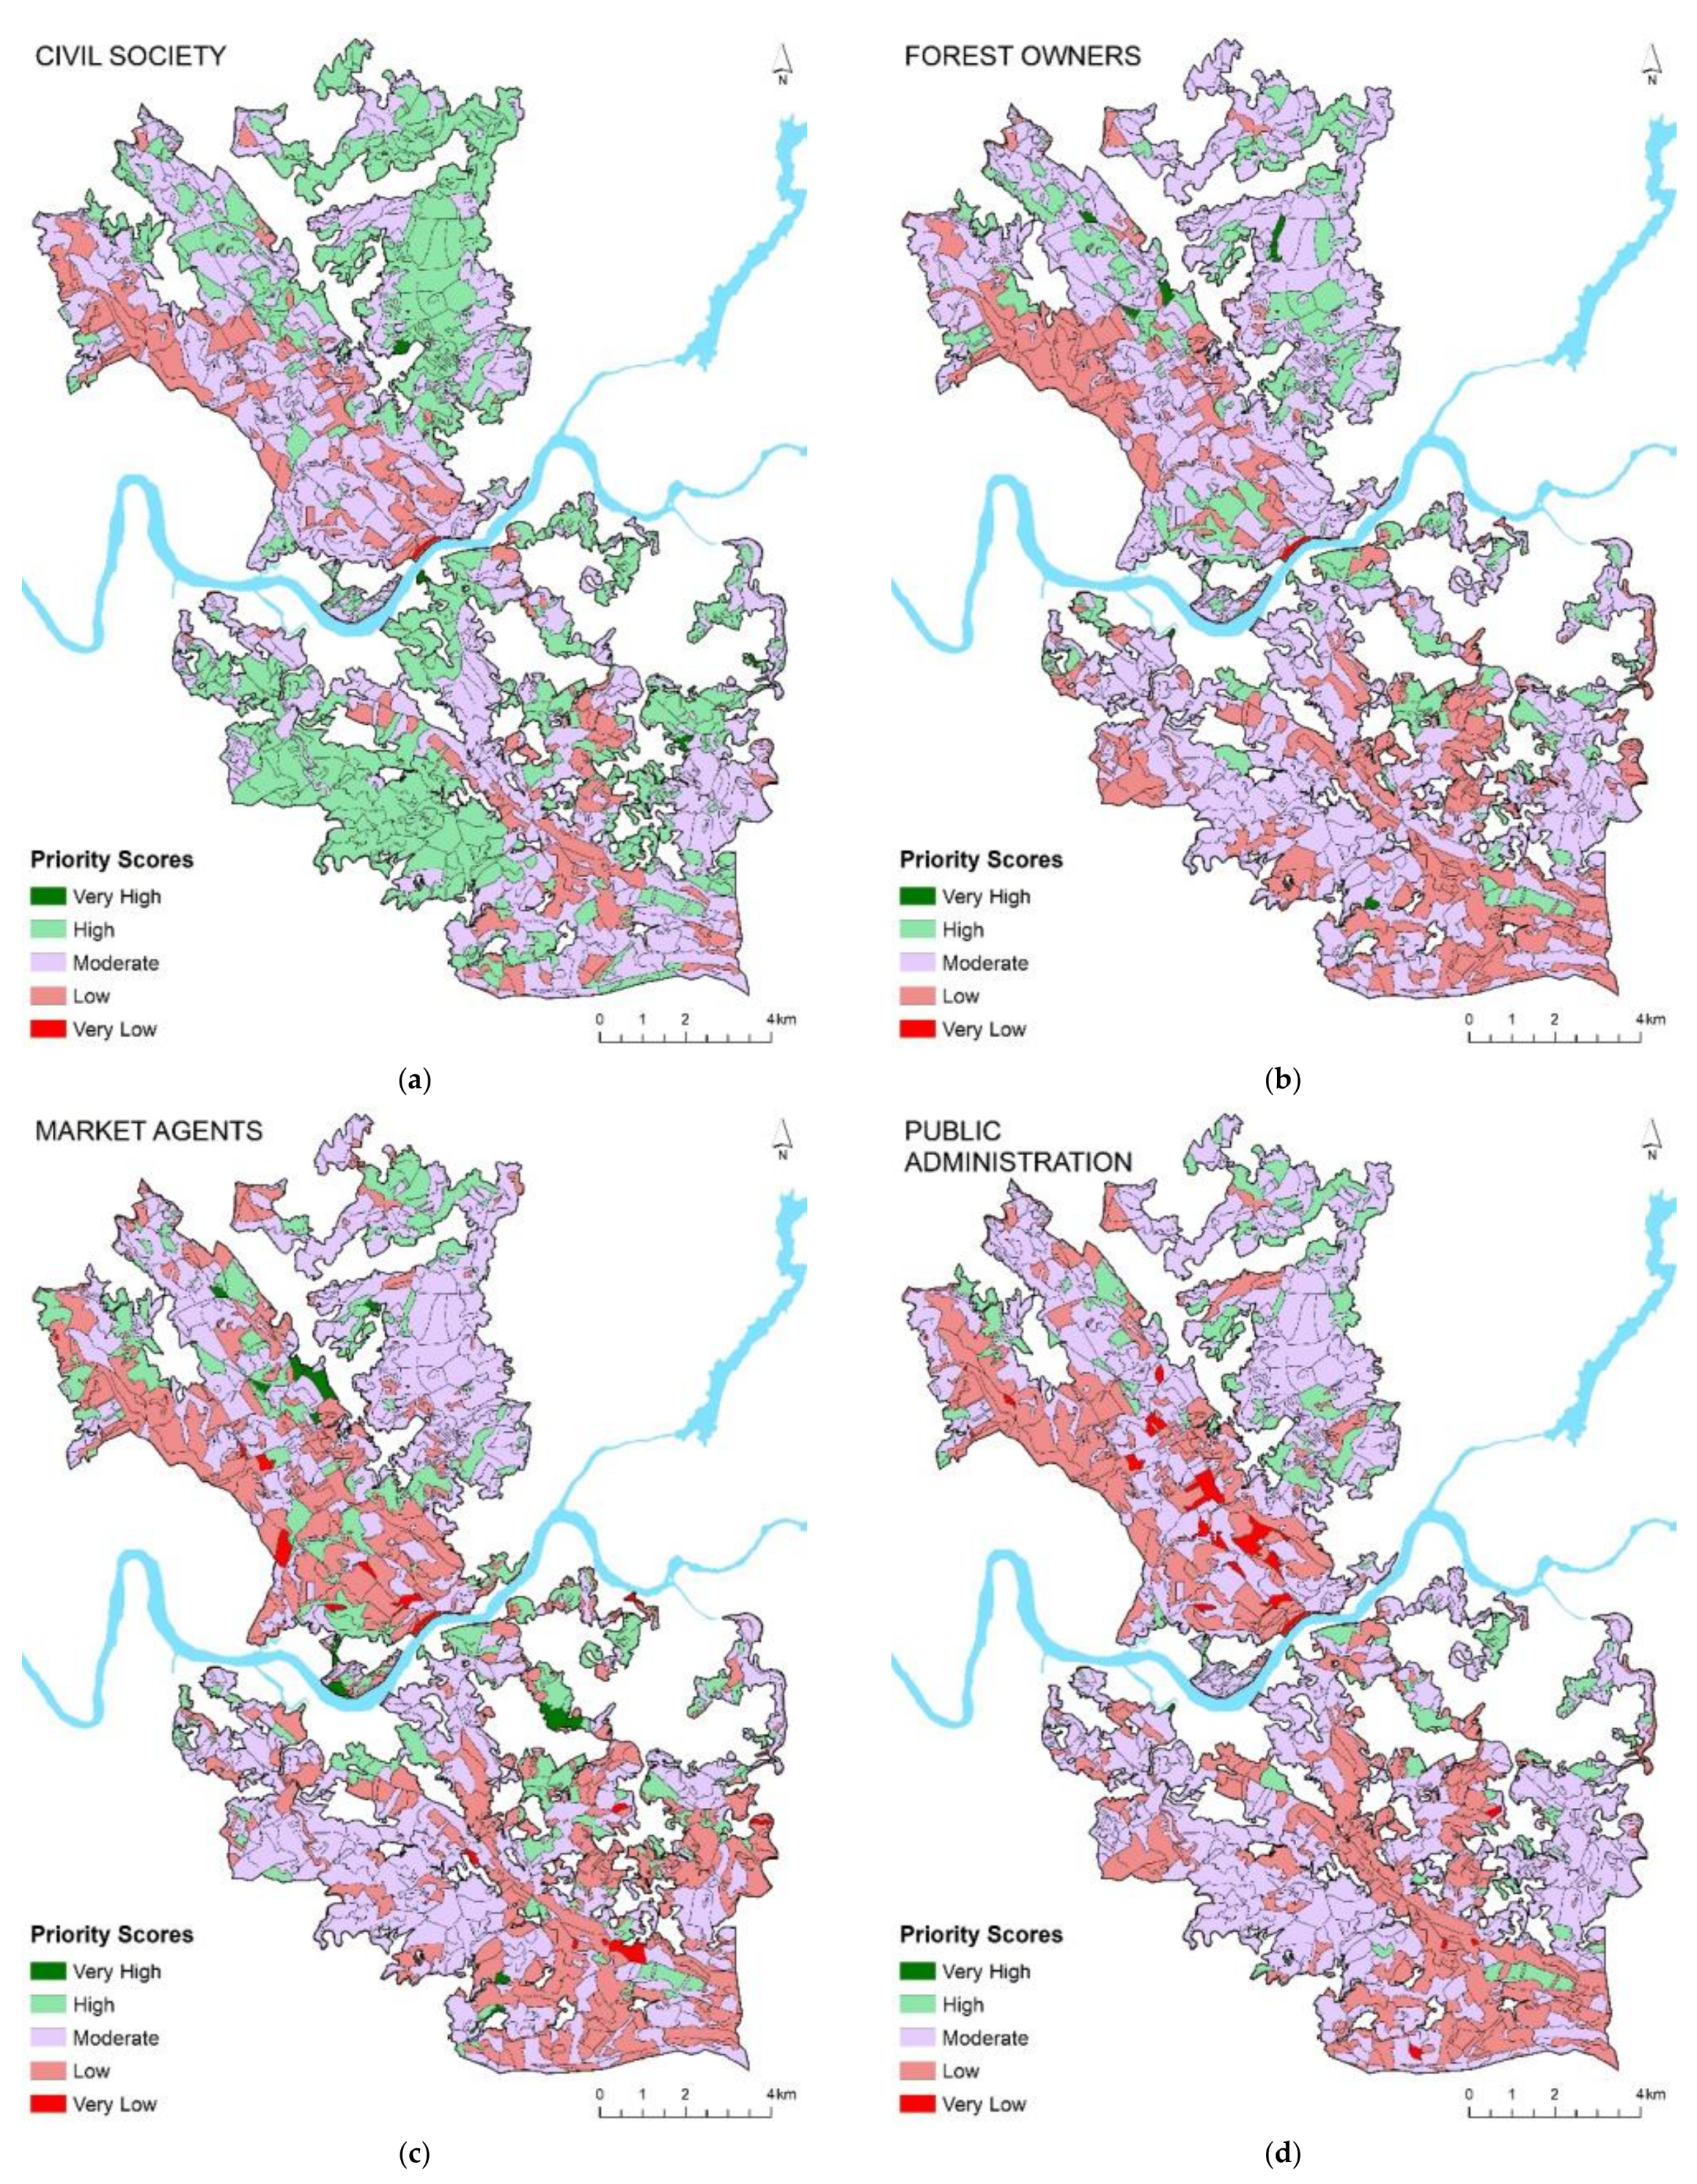
3.2. Priority Scores of the Allocation of Ecosystem Services to Management Units

The result of the prioritization of the allocation of ESs to MUs were priority scores for each MU. These priority scores differed among the interest groups (Figure 6). Given potential priority scores between 0.0 (very low) and 1.0 (very high), the civil society group had the smallest difference between the minimum (0.20) and maximum (0.72) values. In contrast, the public administration group had the greatest range between the minimum (0.15) and maximum (0.76) values. The mean of priority scores varied between 0.43 (market agents) and 0.51 (civil society).
Keeping in mind that each interest group developed its own set of criteria weights, some care is needed in comparing priorities across groups. For example, civil society and forest owners may assign roughly the same priority to a MU, but each group has its own rationale for that priority as determined by their respective criteria weights. Conversely, but by the same reasoning, if civil society rates the priority of an MU higher than the forest owners, this, per se, does not mean that the allocation of ESs by civil society should take precedence over that of forest owners. Nevertheless, large differences in interest group can be helpful as a rough guide to minimizing conflicts among interest groups as we discuss further in Section 3.4 below.
To spatially analyze the priority scores, we defined five classes: very low ≤ 0.25; low ]0.25–0.40]; moderate ]0.40–0.55]; high ]0.55–0.70]; very high > 0.70. Analyzing the spatial distribution of scores (Figure 7), all groups classified most of the area in the moderate class, with the forest owners classifying the largest area as moderate (60.5% of total area, corresponding to 791 MUs) and civil society classifying the smallest area as moderate (46.5% of total area, corresponding to 699 MUs). Among all groups, market agents classified the largest area to the very high priority class (0.9% of total area, corresponding to 11 MUs) and low (32.8% of total area, corresponding to 524 MUs) classes. The civil society group classified the largest area in the high priority class (39.5% of total area, corresponding to 492 MUs). In comparison, the public administration group classified the largest area in the very low priority class (1.3% of total area, corresponding to 42 MUs).

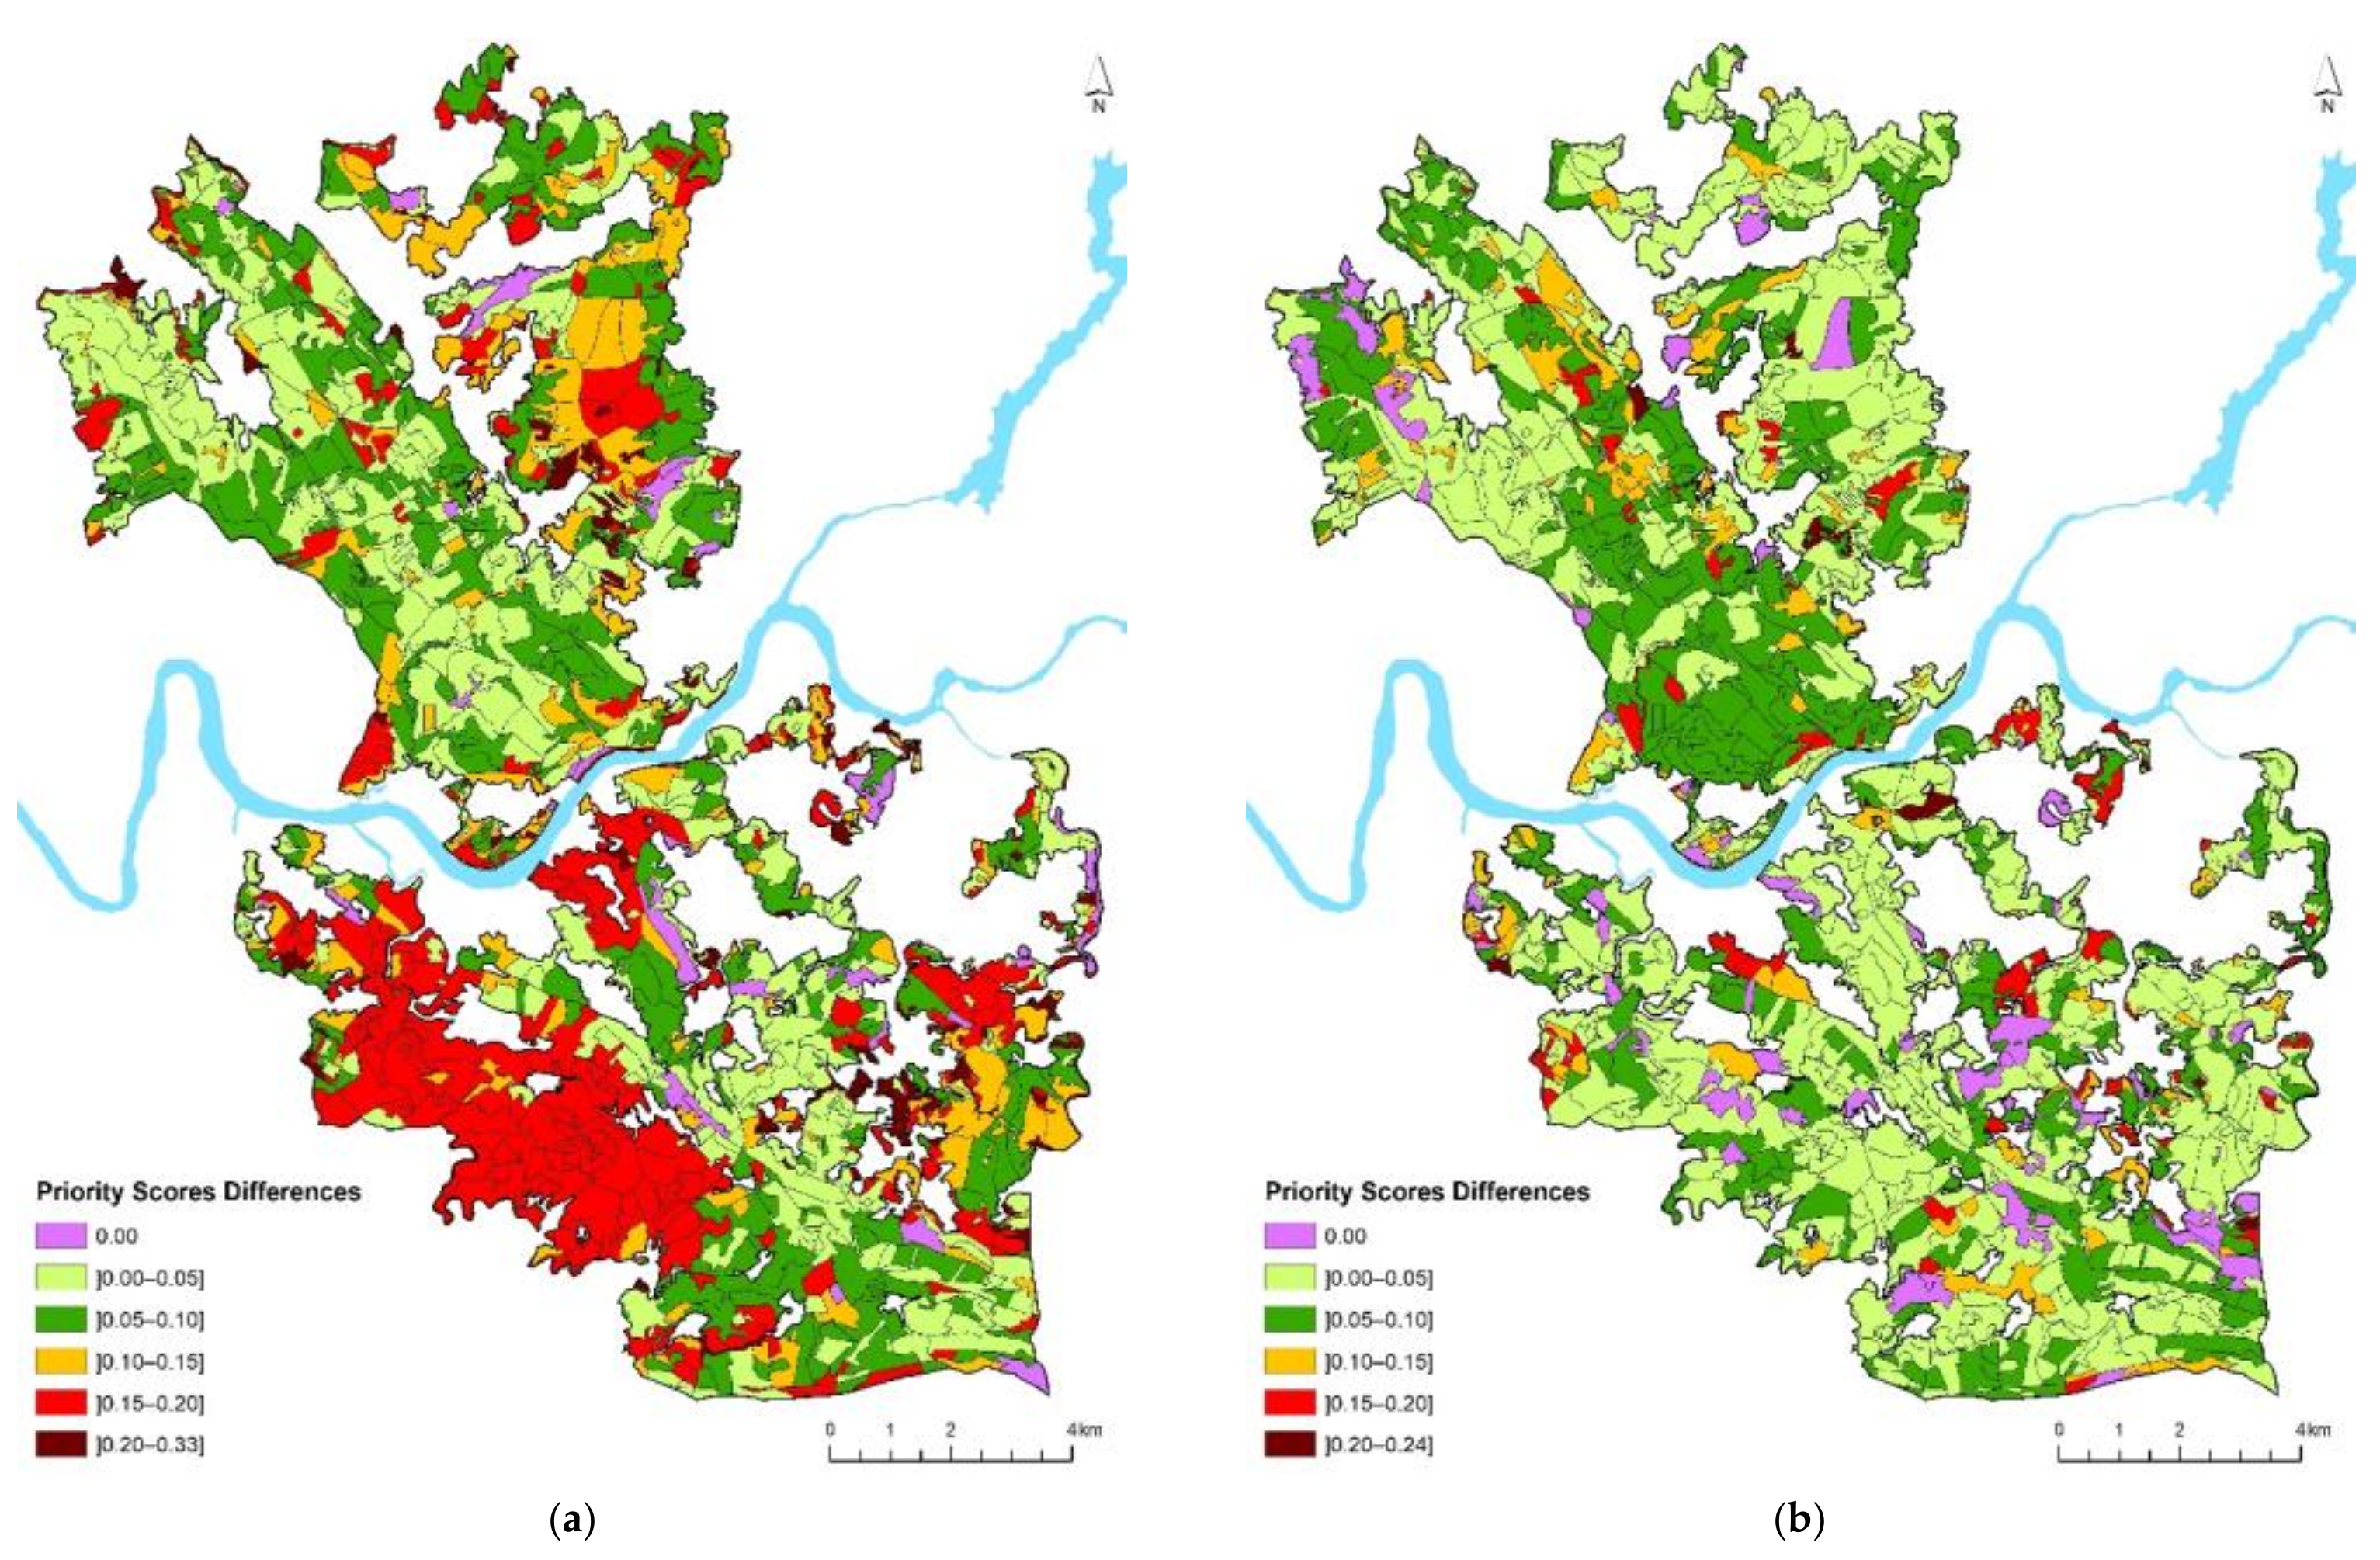
3.3. Differences between Interest Groups

The Kruskal–Wallis Rank Test revealed that the differences in priority scores of the allocation of the ESs to the MUs among groups were statistically significant (H(3) = 545.96, p-value = 0.000). The test also indicated civil society had the highest mean rank (3564.53), followed by forest owners (2689.83) and public administration (2500.85), while the market agents had the smallest mean rank (2230.80).
The post-hoc Mann–Whitney U-Test compared all pairs of interest groups, and the results demonstrated statistically significant differences in priority scores among all pairs of groups (Table 5). The most noteworthy differences were between civil society and the other three groups, highlighting the pair civil society and market agents (U(1373) = 507,800; z = −20.939; p-value < 0.05) as the most discordant groups, with a statistically large effect size (0.87). The sum of ranks for civil society was more significant than the sum of ranks for market agents. Conversely, the most concordant groups, with the smallest significant differences, were forest owners and public administration (U(1373) = 881,588; z = −2.937; p-value < 0.05), with a very small effect size (0.11), which means a negligible difference between these groups.
To spatially analyze and compare the differences of allocation priority scores between groups, we calculate the absolute difference for each MU by group pairs. As demonstrated by the Mann–Whitney U-Test, the groups civil society and market agents had the most extensive area with the largest differences in priority scores, i.e., above 0.20 difference (371.78 ha, corresponding to 91 MUs) and between 0.15 and 0.20 difference (2940.05 ha, corresponding to 286 MUs) (Figure 8a). In contrast, the forest owner and public administration groups had the largest concordant area, i.e., no differences between the priority scores of 1270.45 ha (corresponding to 70 MUs) (Figure 8b). The group pair with the next largest concordant area were market agents and public administration, with 815.75 ha (corresponding to 116 MUs) with no differences ( Supplement S4,Figure S4d).

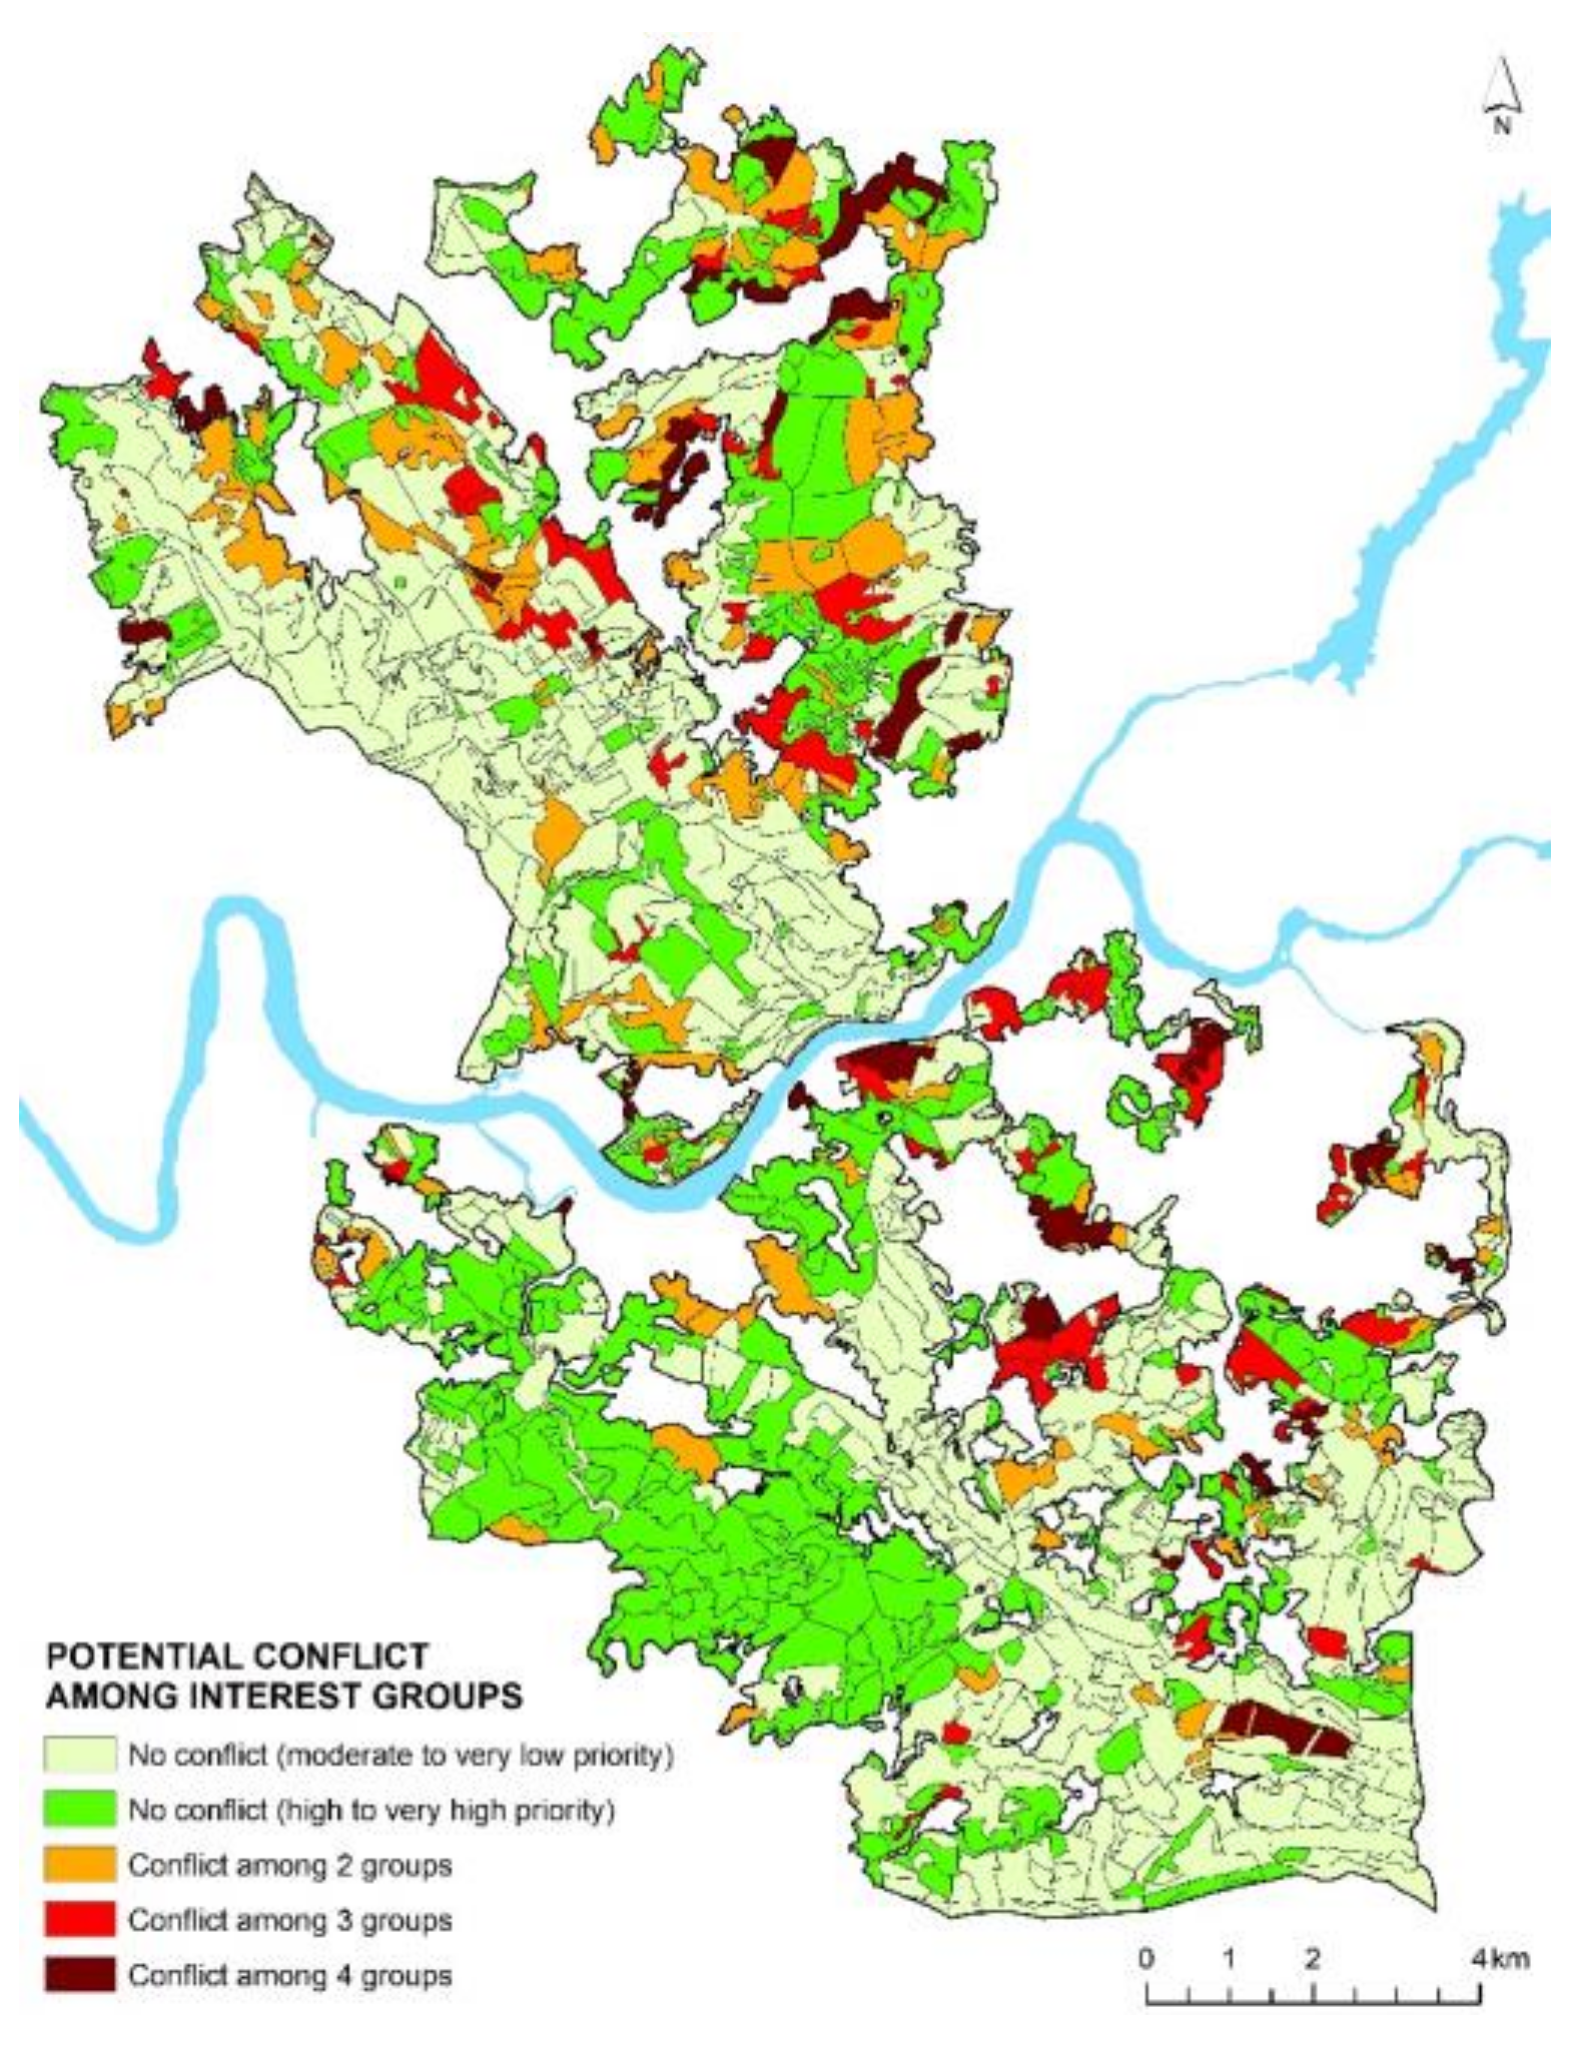
3.4. Opportunities to Minimize Conflicts among Interest Groups

MUs with high and very high priority scores were those that best matched the criteria and objectives of the interest groups. Based on the simple counts of group priority scores of high and very high in each MU, in Vale do Sousa, 30.4% of the total area (396 MUs) was classified as high to very high priority by only one group, and 51.3% (736 MUs) was classified as moderate to very low priority by all groups (Figure 9), both of which suggest low potential for conflict among the groups. The total percentage of the MU area with potential for conflict among the two, three, and four groups was 10.1% (136 MUs), 4.9% (71 MUs), and 3.2% (34 MUs), respectively.
The results of Case 1 from the logical model (Supplement S5, Figure S5a) showed that 3.1% of the total area (49 MUs) was compatible for forest owners and public administration. Cases 2 and 3 showed that 24.0% of the total area (292 MUs) was high or very high priority only for civil society (Supplement S5, Figure S5b), and 3.5% of the total area (60 MUs) was high or very high priority only for market agents (Supplement S5, Figure S5c). Case 4 corroborated that, for 51.3% of the total area, no group rated the priority high or very high in a MU (Supplement S5, Figure S5d). We also note that, in EMDS, users can query these maps to show which specific groups rate a MU as high or very high priority, and therefore, which specific groups are potentially in conflict.

4. Discussion

The combined Group Multicriteria Spatial Decision Support System approach allowed the successful integration of actors’ preferences, priorities, and objectives to prioritize the allocation of ESs to MUs at the landscape level, providing a more informed forest management plan. The results were four solutions at the landscape-level for Vale do Sousa, identifying the MUs according to each interest group ESs priorities. Civil society had the highest mean rank of priority scores, followed by forest owners, public administration, and market agents with the lowest value. The ZIF manager of Vale do Sousa can use these solutions as four proposed plans to present and discuss with ZIF forest owners’ members and select the solution that best represents the interests and objectives of the joint forest management, considering the broader perspectives of the four interest groups.

4.1. Convergence and Divergence among Interest Groups

The analysis of Pareto frontier solutions goals allowed a perception of each interest group’s priorities for Vale do Sousa. While the forest owners wanted to maintain current forest management, focused on wood provision, civil society proposed to change it in order to increase the diversification of ESs (more biodiversity and cork oak), and the trade-off was less wood provision. The other two groups had similar goals. In previous research [5,29], most actors supported the diversification of ESs. Even the forest owners group accepted the change to a multifunctional forest as long as this was profitable [30].
During the focus group discussion, the actors from the forest owners group reinforced the importance of a profitable forest. Otherwise, they would lose interest in forest management. Although cork is a non-wood forest product with a periodic income, the forest owners revealed some skepticism, as the recovery of investment in cork oak takes longer when compared to eucalypt. Conversely, market agents, who also manage forest areas in Vale do Sousa, had different goals, and considered a lower priority for wood provision to increase the priority of cork, revealing that they may be interested in diversifying forest market products in Vale do Sousa.
The iterative Pareto frontier method helped actors visualize and understand the impact of their preferences and goals and thus, facilitated negotiations to reach a consensus. However, the forest owners’ group had more difficulties arriving at a consensual solution and interpreting it than other groups, which is perhaps because forest owners have not used this type of tool in their forest management decisions heretofore. Indeed, after the focus group session, some forest owners contacted the research team asking to access this tool to support their forest management decisions or whether the ZIF manager could use it to help them in forest management decisions. Thus, the forest owners revealed interest and openness for enhancing the current forest management, diversifying the ESs so they can better understand the impact of their choices and ensure profitable forest management.
The priority scores resulting from the allocation of forest management models and the corresponding provision of ESs to MUs by interest group provided a perception of the convergence and divergence between their preferences and goals. We found significant differences in MUs priority scores between groups (Figure 8). The civil society group was the most discordant of the four groups because one of its main objectives was biodiversity, giving less importance to wood provision and income when compared to other groups. The differences of interests and goals among the groups suggest a need to continue participatory discussions among actors to understand each other’s priorities, goals, and preferences in order to minimize potential conflicts of interests and outline joint strategies for forest management.

4.2. Opportunities to Avoid Conflict

The identification of MUs with low potential conflict can facilitate negotiation among groups and thus, enable the implementation of forest management by avoiding, or at least minimizing, conflicts among groups. The ZIF forest owners may be more comfortable implementing forest management in MUs in which their priorities and goals are guaranteed, but not in conflict with the priorities of other groups. The results from this portion of the study also may present an opportunity for the ZIF manager to manage these MUs as model areas for building consensus by providing a way to explore the similarities and differences among interests and objectives. For the remaining area, the potential for conflict may be an opportunity to develop additional participatory discussion sessions among interest groups to explore the differences that may be the subject of conflict and to try to negotiate a consensus solution.
Our analysis of potential group conflicts was based on simple Boolean logic that identifies MUs in which multiple groups with potentially competing values rate a MU as being of high or very high priority. The results (Figure 9 and Supplement S5) are easy to understand, and thus may be a good starting point for negotiations among interest groups. However, the logic-based approach (Supplement 5, Figure S5.2) is also easily refined by use of fuzzy logic in the NetWeaver model, thus enabling a more quantitative evaluation based on degrees of conflict among groups.

4.3. Limitations of the Study and Future Improvements

Borges et al. [13] organized three groups of actors to reach a consensual solution, using the Pareto frontier method for five ESs of Vale do Sousa—eucalypt pulpwood, pine saw logs, chestnut saw logs, the volume of ending inventory, and average carbon stock. This research extends this approach to include biodiversity and wildfire resistance and to prioritize the allocation of ESs to MUs. Comparing our approach with similar studies ([2,19,20,21,22,23,24]), it innovates by developing a participatory process that involves actors in different stages of decision, and by integrating the solutions from a trade-off analysis and criteria weights from MCDA. The trade-off analysis allowed actors to have a greater sense of what they would sacrifice to maintain their goals.
We identified two main drawbacks of the methodology that can be improved. First, forest owners were not comfortable with the Pareto frontier method, and some of these actors did not express their doubts or concerns to the facilitator. Thus, this group took a long time to reach a consensus, compared to the other three groups. Forest owners also demonstrated difficulties analyzing the seven ESs on the Pareto frontier and understanding the solution. More research may be needed to simplify the analysis presented by the tool so that it is more intuitive for forest owners. Alternatively, training sessions with forest owners might be organized ahead of a broader actors meeting, using data from their forestland, to familiarize them with the Pareto frontier method analysis process.
Second, although the Pareto frontier method provides a spatial visualization of the solution [13,35], it was not practical to integrate the MCDA results [30] and the consensual Pareto frontier solution during the focus group session because it was necessary to normalize the Pareto solution database, which is the most time-consuming step of our methodology. Therefore, additional research into ways to optimize the integration of solution results in the Pareto frontier method would be useful for actors to see and discuss results in the same session.
We started by working with groups of actors with the same interests because sharing similar goals and concerns can promote empathy among actors and can facilitate discussions and negotiation, leading to consensus. Indeed, we found this to be generally true of the four groups involved in this study. Moreover, once a group of actors with the same interests understand each other’s points of view, it may be easier to work with groups of actors with different interests. Thus, a two-step participatory process that begins with seeking consensus within relatively homogeneous groups and proceeds to seeking consensus among groups with diverse interests and perspectives may be an effective way to deal with complex management problems involving diverse actors.
Another improvement that could be introduced in our methodology is creating portfolios of alternative sets of forest management actions based on a given budget (e.g., [58,59]). Thus, the MUs priority scores could be complemented by creating portfolios based on a specific budget, which could assist ZIF managers with managing the forest more efficiently with a specific budget in mind.
The analysis of potential conflicts revealed a significant area of MUs with low conflict for negotiation among interest groups. These results suggest that the group decision-making enhances understandings and convergence of interests. However, more participatory sessions are needed so that the actors’ interests and goals can be discussed and understood in greater depth, facilitating the negotiation, and thus contributing to the consensus of the allocation of ESs to MUs for Vale do Sousa.
In addition, aiming for a more transparent landscape evaluation and group decision-making, the four landscape priority scores, complemented with portfolios, could be presented as landscape forest management proposals and discussed in a wide-ranging event with ZIF’s forest owners’ members, asking them to vote on the proposal with which they identify most. So, the proposal that obtained the most votes would be integrated into the forest management plan of the Vale do Sousa ZIF. Thus, this plan combines different preferences, priorities, and objectives for a landscape that actors intend to be sustainable and multifunctional.
Moreover, the ZIF manager of Vale do Sousa was recognized as the most influential actor in forest management decisions when actors ask for forest management support [5]. ZIF managers in general may wish to consider applying or adapting our approach to negotiating consensus solutions for multi-objective landscape-level planning to integrate the different forest owners’ interests and goals, while providing a wide range of ESs.

5. Conclusions

This research successfully applied the Group Multicriteria Spatial Decision Support System approach, combining MCDA, focus groups, the Pareto frontier method, and EMDS spatial integration to prioritize the allocation of ESs to MUs, given the competing priorities of the four groups. The result was a map of MUs priorities by interest group, representing four consensus solutions for Vale do Sousa. This combined approach is a helpful tool in forest management because it integrates multiple criteria and objectives to spatially model different actors’ preferences, interests, and goals.
There were two key elements to success in applying this approach. First, the diversity of interests involved in the analysis enabled four solutions. ZIF managers can use the solutions as four proposals to be discussed with ZIF forest owners’ members to select the forest management plan for Vale do Sousa that is best suited to ZIF interests and goals. Second, the willingness and commitment of all actors to participate in the process with several steps (workshops, multicriteria questionnaire, and focus group), and the cooperation to reach consensus solutions in the focus groups session enabled social learning among the actors and the research team. Such participatory processes are rich in promoting understanding and sharing knowledge, interests, and experiences that allow forest management planning to be closer to those who implement it, thus promoting a feeling of sharing and a common good.
This Group Multicriteria Spatial Decision Support System approach can be applied by ZIF managers, forest owners, forest managers, and other decision makers dealing with different interests and goals to support decision making in forest management planning. Because the output spatially shows the priority MUs at the landscape scale, it is easier to visualize and understand by the forest owners and other actors.
In an era of new technologies, it is crucial that the ZIF managers in Portugal, or in other forest management situations dealing with actors with different interests, can support their forest management decisions with participatory techniques and apply these combined tools, contributing to an easier understanding of the impact of the decisions at the landscape level by forest owners and managers. This can increase the confidence of forest owners in forest management planning decisions, thus facilitating their implementation.

Supplementary Materials

The following is available online at https://www.mdpi.com/article/10.3390/land10070747/s1, Figure S1. Criteria and sub-criteria weights of the MCDA model. The following are available online at https://www.mdpi.com/article/10.3390/land10070747/s2, Figure S2.1. Data normalized from the Pareto frontier solution for the civil society group; Figure S2.2. Data normalized from the Pareto frontier solution for the forest owners’ group; Figure S2.3. Data normalized from the Pareto frontier solution for the market agents’ group; Figure S2.4. Data normalized from the Pareto frontier solution for the public administration group. The following are available online at https://www.mdpi.com/article/10.3390/land10070747/s3, Figure S3.1. Priority scores classified into two Boolean classes of “high and very high” (value 1) and “moderate to very low” (value 0) by interest group: (a) civil society; (b) forest owners; (c) market agents; (d) public administration; Figure S3.2. NetWeaver logic model: (a) arguments of conflict case 1, where priority scores are high for either forest owners and public administration or both, but priority scores are not high for civil society and market agents; (b) arguments of conflict case 2, where priority scores are only high for civil society; (c) arguments of conflict case 3, where priority scores are only high for market agents; (d) arguments of conflict case 4, where priority scores are not high for any interest group. The following is available online at https://www.mdpi.com/article/10.3390/land10070747/s4, Figure S4. Differences of priority scores between pairs of interest groups: (a) civil society and forest owners; (b) civil society and public administration; (c) forest owners and market agents; (d) market agents and public administration. The following is available online at https://www.mdpi.com/article/10.3390/land10070747/s5, Figure S5. The four cases of NetWeaver logic model: (a) case 1, the priorities of forest owners and public administrators are basically compatible; (b) case 2, high priority in only civil society and any other group’s high priority is a potential conflict; (c) case 3, high priority in only market agents and any other group’s high priority is a potential conflict; (d) case 4, no group rates the priority high or very high in a MU.

Author Contributions

Conceptualization, M.M. (Marlene Marques), K.M.R. and J.G.B.; methodology, M.M. (Marlene Marques), K.M.R., S.M., S.P., M.M. (Marco Marto) and J.G.B.; software, M.M. (Marlene Marques), K.M.R., S.M., S.P., M.M. (Marco Marto) and J.G.B.; validation, M.M. (Marlene Marques), K.M.R., S.M. and J.G.B.; formal analysis, M.M. (Marlene Marques) and K.M.R.; investigation, M.M. (Marlene Marques), K.M.R., S.M., M.M. (Marco Marto) and J.G.B.; resources, M.M. (Marlene Marques), K.M.R. and J.G.B.; writing—original draft preparation, M.M. (Marlene Marques); writing—review and editing, K.M.R., S.M., S.P., M.M. (Marco Marto) and J.G.B.; project administration, J.G.B. and S.M.; funding acquisition, J.G.B., M.M. (Marlene Marques), S.M. and M.M. (Marco Marto). All authors have read and agreed to the published version of the manuscript.

Funding

This research was funded by the European Union’s Horizon 2020 Research and Innovation Programme (grant agreement number 676754—ALTERFOR project and grant agreement number 773324—NOBEL project, which is part of the ERA-NET Cofund ForestValue), by the Marie Skodowska-Curie Research and Innovation Staff Exchange (RISE) within the H2020 Work Programme (H2020-MSCA-RISE-2015) (SUFORUN), by the Portuguese Science Foundation (FCT), Portugal, namely through the Ph.D. grant of Marlene Marques (PD/BD/128257/2016), the Ph.D. grant of Marco Marto (SFRH/BD/108225/2015), in the scope of Norma Transitória—DL57/2016/CP1382/CT15, the Forest Research Center Project UIDB/00239/2020, the BIOECOSYS project (grant number LISBOA-01-0145-FEDER-030391, PTDC/ASP-SIL/30391/2017) and the MODFIRE project (grant number PCIF/MOS/0217/2017).

Institutional Review Board Statement

Not applicable.

Informed Consent Statement

Not applicable.

Data Availability Statement

The data that support the findings of this study are available from the corresponding author upon request.

Disclaimer

The use of trade or firm names in this publication is for reader information and does not imply endorsement by the U.S. Department of Agriculture of any product or service.

Acknowledgments

We thank the researchers Brigite Botequim, Carlos Caldas, Catarina Tavares and Patrícia Pécurto for helping during the focus group session. We warmly thank all the actors who have participated in the focus group. Finally, we thank the journal’s reviewers who provided a number of very useful criticisms and helpful suggestions.

Conflicts of Interest

The authors declare no conflict of interest.

References

  1. Uhde, B.; Hahn, A.; Griess, V.C.; Knoke, T. Hybrid MCDA Methods to Integrate Multiple Ecosystem Services in Forest Management Planning: A Critical Review. Environ. Manag. 2015, 56, 373–388. [Google Scholar] [CrossRef] [Green Version]
  2. Caglayan, İ.; Yeşil, A.; Kabak, Ö.; Bettinger, P. A decision making approach for assignment of ecosystem services to forest management units: A case study in northwest. Turkey. Ecol. Indic. 2021, 121, 107056. [Google Scholar] [CrossRef]
  3. Bruña-García, X.; Marey-Pérez, M.F. Public participation: A need of forest planning. IForest 2014, 7, 216–226. [Google Scholar] [CrossRef] [Green Version]
  4. Kangas, A.; Saarinen, N.; Saarikoski, H.; Leskinen, L.A.; Hujala, T.; Tikkanen, J. Stakeholder perspectives about proper participation for Regional Forest Programmes in Finland. For. Policy Econ. 2010, 12, 213–222. [Google Scholar] [CrossRef]
  5. Marques, M.; Juerges, N.; Borges, J.G. Appraisal framework for actor interest and power analysis in forest management—Insights from Northern Portugal. For. Policy Econ. 2020, 111, 14. [Google Scholar] [CrossRef]
  6. Valente, S.; Coelho, C.; Ribeiro, C.; Soares, J. Forest Intervention Areas (ZIF): A New Approach for Non-Industrial Private Forest Management in Portugal. Silva Lusit. 2013, 21, 137–161. [Google Scholar]
  7. Tóth, S.F.; McDill, M.E.; Rebain, S. Finding the efficient frontier of a bi-criteria, spatially explicit, harvest scheduling problem. For. Sci. 2006, 52, 93–107. [Google Scholar] [CrossRef]
  8. Tóth, S.F.; McDill, M.E. Finding efficient harvest schedules under three conflicting objectives. For. Sci. 2009, 55, 117–131. [Google Scholar] [CrossRef]
  9. Lotov, A.V.; Bushenkov, V.A.; Kamenev, G.K. Interactive Decision Maps: Approximation and Visualization of Pareto Frontier; Kluwer Academic Publishers: Norwell, MA, USA, 2004. [Google Scholar]
  10. Marto, M.; Reynolds, K.M.; Borges, J.G.; Bushenkov, V.A.; Marques, S. Combining Decision Support Approaches for Optimizing the Selection of Bundles of Ecosystem Services. Forests 2018, 9, 438. [Google Scholar] [CrossRef] [Green Version]
  11. Reynolds, K.M.; Hessburg, P.F.; Bourgeron, P.S. Making Transparent Environmental Management Decisions. Applications of the Ecosystem Management Decision Support System; Springer: Berlin/Heidelberg, Germany, 2014; ISBN 978-3-642-31999-0. [Google Scholar]
  12. Borges, J.G.; Garcia-Gonzalo, J.; Bushenkov, V.; McDill, M.E.; Marques, S.; Oliveira, M.M. Addressing Multicriteria Forest Management With Pareto Frontier Methods: An Application in Portugal. For. Sci. 2014, 60, 63–72. [Google Scholar] [CrossRef] [Green Version]
  13. Borges, J.G.; Marques, S.; Garcia-Gonzalo, J.; Rahman, A.U.U.; Bushenkov, V.; Sottomayor, M.; Carvalho, P.O.; Nordström, E.-M. A Multiple Criteria Approach for Negotiating Ecosystem Services Supply Targets and Forest Owners’ Programs. For. Sci. 2017, 63, 49–61. [Google Scholar] [CrossRef]
  14. Marques, S.; Marto, M.; Bushenkov, V.; McDill, M.; Borges, J. Addressing Wildfire Risk in Forest Management Planning with Multiple Criteria Decision Making Methods. Sustainability 2017, 9, 298. [Google Scholar] [CrossRef] [Green Version]
  15. Marques, S.; Bushenkov, V.A.; Lotov, A.V.; Marto, M.; Borges, J.G. Bi-Level Participatory Forest Management Planning Supported by Pareto Frontier Visualization. For. Sci. 2020, 66, 490–500. [Google Scholar] [CrossRef]
  16. Marto, M.; Bushenkov, V.A.; Reynolds, K.M.; Borges, J.G.; Marques, S. A web-based approach for visualizing interactive decision maps. Information 2021, 12, 9. [Google Scholar] [CrossRef]
  17. Malczewski, J. Multiple criteria decision analysis and Geographic Information Systems. In Trends in Multiple Criteria Decision Analysis; Ehrgott, M., Figueira, J.R., Greco, S., Eds.; Springer Science: New York, NY, USA, 2010; pp. 369–395. [Google Scholar]
  18. Puente, M.C.R. Planning for Urban Growth and Sustainable Industrial Development. In Making Transparent Environmental Management Decisions; Reynolds, K.M., Hessburg, P.F., Eds.; Springer: Berlin/Heidelberg, Germany, 2014; pp. 253–276. ISBN 978-3-642-31999-0. [Google Scholar]
  19. Bottero, M.; Comino, E.; Duriavig, M.; Ferretti, V.; Pomarico, S. The application of a Multicriteria Spatial Decision Support System (MCSDSS) for the assessment of biodiversity conservation in the Province of Varese (Italy). Land Use Policy 2013, 30, 730–738. [Google Scholar] [CrossRef]
  20. Reinhardt, J.R.; Russell, M.B.; Lazarus, W.F. Prioritizing Invasive Forest Plant Management Using Multi-Criteria Decision Analysis in Minnesota, USA. Forests 2020, 11, 1213. [Google Scholar] [CrossRef]
  21. Povak, N.A.; Hessburg, P.F.; Giardina, C.P.; Reynolds, K.M.; Heider, C.; Salminen, E.; Salter, R.B.; MacKenzie, R.A. A watershed decision support tool for managing invasive species on Hawai’i Island, USA. For. Ecol. Manag. 2017, 400, 300–320. [Google Scholar] [CrossRef]
  22. Uribe, D.; Geneletti, D.; del Castillo, R.F.; Orsi, F. Integrating stakeholder preferences and GIS-based multicriteria analysis to identify forest landscape restoration priorities. Sustainability 2014, 6, 935–951. [Google Scholar] [CrossRef] [Green Version]
  23. Cannon, J.; Hickey, R.; Gaines, W.; Forest, N.; State, W.; Cannon, J.; Hickey, R.; Gaines, W. Using GIS and the Ecosystem Management Decision Support Tool for Forest Management on the Okanogan-Wenatchee National Forest, Washington State. J. For. 2018, 116, 460–472. [Google Scholar] [CrossRef]
  24. Reynolds, K.M.; Murphy, P.J.; Paplanus, S. Toward Geodesign for Watershed Restoration on the Fremont-Winema National Forest, Pacific Northwest, USA. Sustainability 2017, 9, 678. [Google Scholar] [CrossRef] [Green Version]
  25. ICNF. 6.o Inventário Florestal Nacional (IFN6). Relatório Final; ICNF–Instituto da Conservação da Natureza e das Florestas: Lisboa, Portugal, 2019. [Google Scholar]
  26. ICNF. Portugal Perfil Florestal; ICNF–Instituto da Conservação da Natureza e das Florestas: Lisboa, Portugal, 2021. [Google Scholar]
  27. ICNF. ZIF Constituídas e em Processo de Constituição no Final de 2020. Nota Informativa da DGVF/DGFC—Janeiro de 2021; ICNF–Instituto da Conservação da Natureza e das Florestas: Lisboa, Portugal, 2021. [Google Scholar]
  28. ICNF. geoCATALOGO—Catálogo com Informação Geográfica de Dados Abertos (Opendata), Territórios Ardidos. ICNF–Instituto da Conservação da Natureza e das Florestas. Available online: https://geocatalogo.icnf.pt/catalogo.html (accessed on 20 February 2021).
  29. Marques, M.; Oliveira, M.; Borges, J.G. An approach to assess actors’ preferences and social learning to enhance participatory forest management planning. Trees For. People 2020, 2, 100026. [Google Scholar] [CrossRef]
  30. Marques, M.; Reynolds, K.M.; Marto, M.; Lakicevic, M.; Caldas, C.; Murphy, P.J.; Borges, J.G. Multicriteria Decision Analysis and Group Decision-Making to Select Stand-Level Forest Management Models and Support Landscape-Level Collaborative Planning. Forests 2021, 12, 399. [Google Scholar] [CrossRef]
  31. Krueger, R.A.; Casey, M.A. Focus Groups: A practical Guide for Applied Research, 5th ed.; Krueger, R.A., Casey, M.A., Eds.; SAGE Publications: Los Angeles, CA, USA, 2015; ISBN 9781483365244. [Google Scholar]
  32. Garcia-Gonzalo, J.; Bushenkov, V.; McDill, M.E.; Borges, J.G. A decision support system for assessing trade-offs between ecosystem management goals: An application in Portugal. Forests 2015, 6, 65–87. [Google Scholar] [CrossRef] [Green Version]
  33. Saaty, T.L. The Analytic Hierarchy Process: Planning, Priority Setting, Resource Allocation; McGraw-Hill International Book Company: New York, NY, USA, 1980. [Google Scholar]
  34. Saaty, T.L. Decision making with the analytic hierarchy process. Int. J. Serv. Sci. 2008, 1, 83–98. [Google Scholar] [CrossRef] [Green Version]
  35. Marto, M.; Reynolds, K.M.; Borges, J.G.; Bushenkov, V.A.; Marques, S.; Marques, M.; Barreiro, S.; Botequim, B.; Tomé, M. Web-Based Forest Resources Management Decision Support System. Forests 2019, 10, 79. [Google Scholar] [CrossRef] [Green Version]
  36. Nunes, L.; Patrício, M.; Tomé, J.; Tomé, M. Modeling dominant height growth of maritime pine in Portugal using GADA methodology with parameters depending on soil and climate variables. Ann. For. Sci. 2011, 68, 311–323. [Google Scholar] [CrossRef] [Green Version]
  37. Nunes, L.; Tomé, J.; Tomé, M. Prediction of annual tree growth and survival for thinned and unthinned even-aged maritime pine stands in Portugal from data with different time measurement intervals. For. Ecol. Manag. 2011, 262, 1491–1499. [Google Scholar] [CrossRef]
  38. Alegria, C. PBIRROL Modelo de Crescimento e Produção para os Povoamentos de Pinheiro Bravo de Estrutura Irregular do Concelho de Oleiros. Agroforum 2007, 18, 13–17. [Google Scholar]
  39. Tomé, M.; Oliveira, T.; Soares, P.O. Modelo GLOBULUS 3.0—Dados e Equações; GIMREF - RC2/2006; Universidade Técnica de Lisboa. Instituto Superior de Agronomia. Centro de Estudos Florestais: Lisboa, Portugal, 2006. [Google Scholar]
  40. Barreiro, S.; Rua, J.; Tomé, M. StandsSIM-MD: A management driven forest SIMulator. For. Syst. 2016, 25, 5. [Google Scholar] [CrossRef] [Green Version]
  41. do Monteiro, M.L.R.M.; do Patrício, M.S.F. O castanheiro—Modelos de gestão. Rev. Florest. 1996, IX, 51–55. [Google Scholar]
  42. Gómez-García, E.; Crecente-Campo, F.; Barrio-Anta, M.; Diéguez-Aranda, U. A disaggregated dynamic model for predicting volume, biomass and carbon stocks in even-aged pedunculate oak stands in Galicia (NW Spain). Eur. J. For. Res. 2015, 134, 569–583. [Google Scholar] [CrossRef]
  43. Gómez-García, E.; Diéguez-Aranda, U.; Cunha, M.; Rodríguez-Soalleiro, R. Comparison of harvest-related removal of aboveground biomass, carbon and nutrients in pedunculate oak stands and in fast-growing tree stands in NW Spain. For. Ecol. Manage 2016, 365, 119–127. [Google Scholar] [CrossRef]
  44. Almeida, A.M.; Tomé, J.; Tomé, M. Development of a system to predict the evolution of individual tree mature cork caliber over time. For. Ecol. Manag. 2010, 260, 1303–1314. [Google Scholar] [CrossRef]
  45. Barreiro, S.; Tomé, M. Modeling growth of unknown age even-aged eucalyptus stands. In Proceedings of the International Conference Modeling Forest Production. Scientific Tools-data Needs and Sources. Validation and Application, Vienna, Austria, 19–22 April 2004; Hasenauer, H., Mäkelä, A., Eds.; pp. 34–43. [Google Scholar]
  46. Claessens, H.; Oosterbaan, A.; Savill, P.; Rondeux, J. A review of the characteristics of black alder (Alnus glutinosa (L.) Gaertn.) and their implications for silvicultural practices. Forestry 2010, 83, 163–175. [Google Scholar] [CrossRef] [Green Version]
  47. Paulo, J.A.; Tomé, M. Predicting mature cork biomass with t years of growth from one measurement taken at any other age. For. Ecol. Manag. 2010, 259, 1993–2005. [Google Scholar] [CrossRef]
  48. Paulo, J.A.; Palma, J.H.N.; Gomes, A.A.; Faias, S.P.; Tomé, J.; Tomé, M. Predicting site index from climate and soil variables for cork oak (Quercus suber L.) stands in Portugal. New For. 2015, 46, 293–307. [Google Scholar] [CrossRef] [Green Version]
  49. Paulo, J.A. Desenvolvimento de um Sistema para Apoio à Gestão Sustentável de Montados de Sobro. Ph.D. Thesis, Universidade Técnica de Lisboa, Instituto Superior de Agronomia, Lisboa, Portugal, 2011. [Google Scholar]
  50. Paulo, J.A.; Tomé, J.; Tomé, M. Nonlinear fixed and random generalized height-diameter models for Portuguese cork oak stands. Ann. For. Sci. 2011, 68, 295–309. [Google Scholar] [CrossRef] [Green Version]
  51. Rodríguez-González, P.M.; Stella, J.C.; Campelo, F.; Ferreira, M.T.; Albuquerque, A. Subsidy or stress? Tree structure and growth in wetland forests along a hydrological gradient in Southern Europe. For. Ecol. Manag. 2010, 259, 2015–2025. [Google Scholar] [CrossRef]
  52. Paulo, J.A.; Tomé, M. Equações para Estimação do Volume e Biomassa de duas Espécies de Carvalhos: Quercus Suber e Quercus Ilex; Publicações GIMREF -RC1/2006; Universidade Técnica de Lisboa. Instituto Superior de Agronomia. Centro de Estudos Florestais: Lisboa, Portugal, 2006. [Google Scholar]
  53. Botequim, B.; Bugalho, M.N.; Rodrigues, A.R.; Marques, S.; Marto, M.; Borges, J.G. Combining tree species composition and understory coverage indicators with optimization techniques to address concerns with landscape-level biodiversity. Land 2021, 10, 126. [Google Scholar] [CrossRef]
  54. Lundholm, A.; Black, K.; Corrigan, E.; Nieuwenhuis, M. Evaluating the Impact of Future Global Climate Change and Bioeconomy Scenarios on Ecosystem Services Using a Strategic Forest Management Decision Support System. Front. Ecol. Evol. 2020, 8, 1–21. [Google Scholar] [CrossRef]
  55. Rodrigues, A.R.; Botequim, B.; Tavares, C.; Pécurto, P.; Borges, J.G. Addressing soil protection concerns in forest ecosystem management under climate change. For. Ecosyst. 2020, 7. [Google Scholar] [CrossRef]
  56. Lenhard, W.; Lenhard, A. Calculation of Effect Sizes. Available online: https://www.psychometrica.de/effect_size.html (accessed on 10 April 2021).
  57. Sawilowsky, S.S. New Effect Size Rules of Thumb. J. Mod. Appl. Stat. Methods 2009, 8, 597–599. [Google Scholar] [CrossRef]
  58. Bivins, S.; Bible, M.J. Portfolio Decisions to Maximize Strategic Benefits. PM World J. 2015, IV, 1–20. [Google Scholar]
  59. Salo, A.; Keisler, J.; Morton, A. Portfolio Decision Analysis. Improved Methods for Resource Allocation; Salo, A., Keisler, J., Morton, A., Eds.; Springer: Berlin/Heidelberg, Germany, 2011; ISBN 9781441999429. [Google Scholar]
Figure 1. Vale do Sousa case study area: (a) location of ZIF of Entre-Douro-e-Sousa and ZIF of Paiva in northwestern Portugal; (b) forest land of 1373 management units by cover type; (c) burned area over the period of 2013 to 2018; (d) wildfires recurrence (2013 to 2018).
Land 10 00747 g001
Figure 2. General steps of the methodological process and techniques applied.
Land 10 00747 g002
Figure 3. Example of group solution considering the trade-offs for seven ecosystem services using the multicriteria Pareto frontier method. Madeira (wood) refers to the total amount of harvested wood in the case study area in the planning horizon (*106 m3), represented in the X axis; Agua (soil erosion) is the total soil loss caused by the rainfall (*105 t) (in Y axis). Each of the eight decision maps (in colors) represents Cortica (cork), being the amount of removed cork (*105 arroba; arroba = 14.7 kg); Biodivers (biodiversity) is the average biodiversity level represented in columns; Vulnerab (vulnerability) represents the average wildfire resistance represented in rows. In the scroll bars are represented the sixth and seventh ecosystem service (CarbMedio and Serv_Cult), where CarbMedio (average carbon) represents the average carbon stock for the whole landscape (*105 t), and Serv_Cult (cultural services) represents the leisure and recreation computed thru RAFL index. The plus sign represents a selected point in the frontier.
Land 10 00747 g003
Figure 4. Example of a normalized management units Pareto frontier solution database from 1 (very poor) to 5 (very good).
Land 10 00747 g004
Figure 5. Example of the EMDS assessment of an interest group: (a) map the management units database fields (column “DatabaseFieldName”) to the CDP decision model (column “ModelDecisionName”); (b) results of priority scores. Per Section 2.2.1, these priority scores have immediate application to ESs priorities.
Land 10 00747 g005
Figure 6. Boxplots of priority scores of the allocation of ecosystem services to management units by interest group. The middle line of the box represents the median between the first quartile (lower end of the box) and the third quartile (upper end of the box). The symbol × represents the mean. The lower and upper bars represent, respectively, the minimum and maximum values of the priority scores.
Land 10 00747 g006
Figure 7. Priority scores of the allocation of the ecosystem services to the management units by interest group: (a) civil society; (b) forest owners; (c) market agents; (d) public administration. The priority scores were classified into five classes: very low ≤ 0.25; low ]0.25–0.40]; moderate ]0.40–0.55]; high ]0.55–0.70]; very high > 0.70.
Land 10 00747 g007
Figure 8. Most meaningful differences in priority scores of the allocation of the ecosystem services to the management units between the most significant group pairs: (a) the most discordant groups, with the most significant differences—civil society and market agents; (b) the most concordant groups, with minor differences—forest owners and public administration.
Land 10 00747 g008
Figure 9. Most meaningful differences in priority scores of the allocation of the ecosystem services.
Land 10 00747 g009
Table 1. Criteria and sub-criteria weights of the MCDA model by interest group [30]. In each group, criteria weights sum to 1. At the sub-criterion level, criteria weights are shown as distributed to the sub-criteria under each criterion (e.g., the sub-criteria weights under a criterion sum to the criterion weight). Lowest level criteria evaluate the attributes of the alternatives. The priority score for an alternative (a management unit) is calculated as the sum of products of the lowest level criterion weights and the utility scores of each attribute for the alternative (note that biodiversity and soil erosion are also lowest level criteria).
Criteria/Sub-CriteriaCivil SocietyForest OwnersMarket AgentsPublic Administration
Income0.2210.3270.4000.405
Revenue0.0430.0660.1050.120
Revenue flow0.0680.1020.1440.073
Diversification of income sources0.1100.1590.1510.212
Wood0.0710.1490.1680.139
Sawtimber0.0520.0730.0680.080
Pulpwood and Small Roundwood0.0190.0760.1000.059
Biodiversity0.1850.0960.0890.093
Cultural Services0.0960.0770.0540.035
Personal benefit0.0270.0400.0180.012
Leisure and recreation activities0.0700.0370.0370.023
Soil Erosion0.1500.1900.1010.068
Risks0.2760.1610.1880.260
Pest and Diseases0.0480.0380.0530.044
Wildfires0.1600.0770.1050.193
Market0.0680.0460.0300.024
Table 2. Identification of the actors who attended the focus group session and number of iterations to reach a consensus solution by interest group.
Interest Group and Type of ActorAttended the Focus Group SessionNumber of Tested Solutions to Select a Consensus Solution
Civil Society43
Environmental NGO3
Forest Certification1
Forest Owners61
Forest Owners’ Association1
Forest Owners (Non-Industrial)4
Parish Council with Community Areas1
Market Agents54
Biomass Industry1
Forest Investment Fund1
Wood Industry 3
Public Administration44
Forest Authority3
Municipality1
Total1912
Table 3. Normalization of Pareto frontier database solutions into five classes for a 90-year planning horizon according to the lowest criteria.
CriterionSub-CriterionUnitsClassesData References
1 (Very Poor)2 (Poor)3 (Moderate)4 (Good)5 (Very Good)
IncomeRevenue€/ha≤0]0–4000]]4000–8000]]8000–12,000]>12,000Net Present Value (NPV) using 3% discount rate
Revenue flownr.[0, 1, 2, 3, 4, 5, 6, 7, 8, 9, 10]]10–20]]20–30]]30–40]>40Frequency of revenue
Diversification of income sourcesnr.0123≥4No. of profitable wood and non-wood forest products
WoodSawtimberm3/ha0]0–200]]200–400]]400–600]>600Species volume [36,37,38,39,40,41,42,43,44,45]
Pulpwood and small roundwoodm3/ha0]0–150]]150–300]]300–1000]>1000Species volume [46,47,48,49,50,51,52]
Biodiversity index *1 to 5
(where 1 is associated with less biodiversity and 5 more biodiversity)
Biodiversity scores [53]
Cultural ServicesPersonal benefitnr.1234≥5No. of recreational activities
Leisure and recreationindex *1 to 5
(where 1 is associated with less appealing for leisure and recreation and 5 more appealing for leisure and recreation)
Recreation aesthetics forest landscape (RAFL) index [54]
Soil Erosion t/year≥75[55–75[[25–55[[10–25[[0–10[Universal soil loss equation (USLE) [55]
RisksPest and diseasesnominalchestnut and eucalypt (elevation ≥ 500 m)eucalypt (elevation < 500 m)maritime pinecork oak and pedunculate oak riparian speciesSpecies according to actors’ interviews [5]
Wildfiresindex *1 to 5
(where 1 is associated with less fire resistance and 5 more fire resistance)
Wildfire resistance (RAit) index [14]
Marketnominalriparian specieschestnutpedunculate oakmaritime pineeucalypt and cork oakSpecies according to actors’ interviews [5]
* Continuous variable.
Table 4. Consensual Pareto frontier solutions for a 90-year period, by interest group.
Ecosystem ServicesUnitInterest Group
Civil SocietyForest OwnersMarket AgentsPublic Administration
Biodiversityindex: 0–73.263.073.143.20
Carbon stock 105 t/year54.0947.5153.8753.55
Cork106 arroba *3.302.153.263.19
Cultural servicesindex: 1–53.073.063.093.08
Soil erosion106 t20.3422.3621.9222.50
Wildfire risk resistanceindex: 1–53.673.013.843.50
Wood 106 m38.4411.109.399.84
* arroba = 14.7 kg.
Table 5. Results of the Mann–Whitney U-Test for ranks of priority scores for the 1373 management units and effect size (Cohen’s d) by pair of interest groups.
Interest Group PairsMean RankSum of RanksMann-Whitney UWilcoxon WZp-ValueEffect Size
(Cohen’s d) 1
Civil Society1604.892,203,508624,8721,568,123−15.3020.0000.61medium
Forest Owners1142.111,568,123
Civil Society1690.152,320,581507,8001,451,051−20.9390.0000.87large
Market Agents1056.851,451,051
Civil Society1643.492,256,514571,8671,515,118−17.8540.0000.72medium
Public Administration1103.511,515,118
Forest Owners1503.802,064,717763,6631,706,914−8.6170.0000.33small
Market Agents1243.201,706,914
Forest Owners1417.911,946,793881,5881,824,839−2.9370.0030.11very small
Public Administration1329.091,824,839
Market Agents1304.751,791,422848,1711,791,422−4.5460.0000.17small
Public Administration1442.251,980,210
1 Benchmarks according to the classification of Sawilowsky [57].
Publisher’s Note: MDPI stays neutral with regard to jurisdictional claims in published maps and institutional affiliations.

