Article

Net Ecosystem Exchange of Carbon Dioxide in Rice-Spring Wheat System of Northwestern Indo-Gangetic Plains

1
Center for Environment Science and Climate Resilient Agriculture (CESCRA), ICAR-IARI, New Delhi 110012, India
2
Central Muga Eri Research and Training Institute Lahdoigarh, Jorhat 785700, India
3
Agricultural Physics, ICAR-IARI, New Delhi 110012, India
4
IVCAR-National Institute of Abiotic Stress Management, Baramati 413115, India
*
Author to whom correspondence should be addressed.
Land 2021, 10(7), 701; https://doi.org/10.3390/land10070701
Submission received: 28 January 2021 / Revised: 11 March 2021 / Accepted: 16 March 2021 / Published: 2 July 2021

Abstract

:
Rice growing under anaerobic conditions followed by spring wheat under an aerobic environment differentially impact the net ecosystem exchange (NEE) of carbon dioxide (CO2) in rice-wheat systems of the north-western Indo-Gangetic Plains (IGP). This is the first estimation of the NEE in a rice-spring wheat sequence via the eddy covariance technique in the north-western Indo-Gangetic Plains, which was partitioned into gross primary productivity (GPP) and ecosystem respiration (RE) and correlated with the environmental variables. Higher CO2 uptake of −10.43 g C m−2 d−1 was observed in wheat during heading as compared to −7.12 g C m−2 d−1 in rice. The net uptake of CO2 was 25% lower in rice. The average daily NEE over the crop season was −3.74 and −5.01 g C m−2 d−1 in rice and wheat, respectively. The RE varied from 0.07–9.00 g C m−2 d−1 in rice and from 0.05–7.09 g C m−2 d−1 in wheat. The RE was positively correlated with soil temperature at 5 cm depth (0.543, p < 0.01) in rice and with air temperature (0.294, p < 0.01) in wheat. The GPP was positively correlated with air temperature (0.129, p < 0.05) and negatively correlated with vapor pressure deficit (VPD) (−0.315, p < 0.01) in rice. In wheat, GPP was positively correlated with air temperature (0.444, p < 0.01) and soil moisture (0.471, p < 0.01). The rate of GPP over the crop duration was nearly the same in both rice and wheat, however, the RE was higher in rice as compared to wheat, thus, the ratio of cumulative RE/GPP was 0.51 in rice and much lower at 0.34 in spring wheat. Rice contributed 46% and 43% to the annual totals of RE and GPP, respectively, while spring wheat contributed 36% and 51%. The NEE of CO2 was higher in spring wheat at −576 g C m−2 d−1 as compared to −368 g C m−2 in rice. Thus, while estimating the carbon sink potential in the intensively cultivated northern IGP, we need to consider that spring wheat may be a moderately stronger sink of CO2 as compared to rice in the rice-wheat system.

1. Introduction

Carbon dioxide (CO2) is an important greenhouse gas (GHG) that is emitted from agricultural fields [1]. The concentration of CO2 in the atmosphere has substantially exceeded, by about 40%, that of pre-industrial levels [1,2,3,4,5]. Forests, agricultural crops, soil and water bodies contribute towards the reduction in CO2 and act as major sinks [6,7,8,9]. Quantification of exchange of CO2 between agricultural soils and the atmosphere is important in order to assess the global carbon budgets as CO2 accounted for 76% of total anthropogenic GHG emissions in 2010 [1,2,3,4,5,10]. Rice (Oriyza sativa) and wheat (Triticum aestivum) are the two important crops that are essential for global food security. The rice–wheat cropping system is the largest agricultural production system in the world, occupying around 13.5 million hectares (M ha) in South Asia [11] and around 13 M ha in China [12]. In China, the rice harvest is followed by winter wheat (7–8 month duration), whereas in South Asia, where the winters are milder, the wheat grown during the winter is called spring wheat and is of shorter duration (4 months). In South Asia, 85% of the rice-wheat area lies in the Indo-Gangetic Plains (IGP) which produce about 50% of the total food grains from this region [13].
In the rice–wheat system of the study region, rice is grown during the summer months from July to October when the climate is warm and sub-humid, whereas the successive wheat is grown from December to April in a relatively dry winter [14]. There is a high level of variation in the temperatures and the amount of rainfall received between the rice and wheat crop growing seasons. Rice and wheat are grown not only in contrasting climatic conditions but the agricultural practices of tillage, manure, fertilizer, seeding, transplanting and water management also differ [15]. Rice is transplanted and grown in submerged anaerobic soil, whereas wheat is grown in upland aerobic soil [16]. Rice is a tropical crop, while wheat is a winter crop, with temperature playing a key role in their growth due to its influence on photosynthetic efficiency [17]. The contrasting soil environments influence the carbon and nitrogen dynamics, affecting the degradation of soil organic matter and, thus, the net ecosystem exchange (NEE) of CO2.
Net ecosystem exchange (NEE) is a measure of the net exchange of C between an ecosystem and per unit ground area of the atmosphere and is a primary gauge of ecosystem C sink strength [18]. GPP represents the gross CO2 uptake through photosynthesis by plants, whereas ecosystem respiration (RE) is the gross CO2 release from the ecosystem through both autotrophic and heterotrophic respiration [19]. Rice and wheat ecosystems may be significant sinks/sources of CO2, depending on the soil type, crop duration, management and the climate of the region. In Asian regions, measurements of net ecosystem CO2 exchange have been conducted in rice and wheat [12,20,21]. The crop duration of both rice and spring wheat in the South Asian region is about 100 to 120 days, unlike the winter wheat which has a much longer duration. Winter wheat is mostly grown as a rain-fed crop, whereas spring wheat is grown under irrigated conditions in the IGP [22].
Chen et al. [12] quantified the NEE of CO2 in a rice-winter wheat cropping system in the North China Plain, however, no measurements have been collected of NEE in South Asian rice-spring wheat systems, where two contrasting crops are grown in one annual cycle. The factors controlling CO2 gas exchange between the rice canopy and atmosphere are different from those in upland wheat fields, as rice is flooded during most of its cultivation period, thus, leading to a great deal of uncertainty in the net CO2 budgets [23]. Thus, to reduce the uncertainties that exist in the global CO2 budgets of rice-spring wheat systems, that occupy nearly 13.5 M ha of land area in South Asia, the present investigation was conducted with the objective to understand (1) the differences in NEE, RE and GPP between rice and spring wheat grown in rice-wheat rotation systems, (2) compare the characteristics of diurnal and daily variations in the CO2 flux, (3) analyze the environmental factors that affect these variations in NEE, RE and GPP in the north-western Indo-Gangetic Plains.

2. Material and Methods

2.1. Site Description

This study was conducted in a Typic Ustochrept soil at the experimental farm of the Indian Agricultural Research Institute (IARI) (latitude 28°38′37.7″ N, longitude 77°09′09.8″ E, 207 MSL) Delhi, India, where an eddy covariance (EC) flux tower was installed in a rice–wheat crop rotation system. The area provided a sufficient upwind fetch of homogenous vegetation required for measuring fluxes using the EC technique. The climatic variables during the rice and wheat season are shown in Figure 1.

2.2. Climatic Description

The climate of the region is subtropical and semi-arid, receiving about 750 mm of rainfall annually, 80% of which occurs during June to October. The mean maximum and minimum temperatures are 33 and 23 °C during the rice and 25 and 11 °C during the wheat growth periods.

2.3. Soil Properties

The alluvial soil of the study site had a bulk density of 1.42 g cm−3, pH (1:2 soil:water) of 8.0, electrical conductivity of 0.47 dS m−1, and was loamy in texture. It had total N, organic carbon, Olsen P, and ammonium acetate extractable K contents of 0.31, 4.6, 0.008, and 0.14 g kg−1, respectively.

2.4. Crop Management

A conventionally puddled rice field was uniformly transplanted on 11 July 2013, with a spacing of 20 cm (row to row) × 15 cm (hill to hill) distance. The field was irrigated whenever the moisture content dropped below the saturation level during the growing season, except during the last two weeks before harvesting. Wheat was sown on 16 December 2013, maintaining a plant spacing of 20 cm (row to row) × 5 cm (plant to plant) distance. Urea, at a rate of 120 kg N ha−1, was applied in three splits of 60, 30, and 30 kg N ha−1 at −1, 47, and 66 days after transplanting (DAT) in rice and −1, 25, and 67 days after sowing (DAS) in wheat. The wheat crop was irrigated at the crown root (22 DAS), tillering (44 DAS), late jointing (62 DAS), flowering (85 DAS) and milking (97 DAS). Phosphorus (26.2 kg ha−1) and K (50 kg ha−1) were incorporated into the soil at the time of sowing using single super phosphate (SSP) and muriate of potash (KCl), respectively, in both rice and wheat. No pesticides were applied during crop cultivation. The crop leaf area index was measured using a plant canopy analyzer (LAI-2000) at the key growth stages. The yield related parameters were measured at the harvest of the crops. Total plant biomass of 1335 and 1392 gm−2 was recorded at harvest in rice and wheat, respectively.

2.5. Eddy Covariance Measurements

Flux densities of CO2, momentum, as well as the friction velocities over the rice and wheat canopy were measured by the EC technique from 1 July 2013 to 30 June 2014 from pre-transplanting/sowing to harvesting in both the crops and also during the fallow periods after rice and wheat. A sonic anemometer (CSAT3, Campbell Scientific, Logan, UT, USA) measured the three-dimensional wind and the sonic, or virtual, temperature along the three non-orthogonal sonic axes. The fluctuations in CO2 and H2O density were measured using an LI-7200 (LI-COR, Lincoln, NE, USA) close-path infrared gas analyzer. The data from CSAT3 and LI-7200 were sampled at 10 Hz using a CR3000 (Campbell Scientific, Logan, UT, USA) data logger. The Edire software processed the data in real time and computed the CO2 flux and frictional velocity along with the covariance, standard deviations, and means on a half-hourly basis. NEE is usually calculated as the sum of eddy CO2 flux (Fc) and CO2 storage change (Fs) within the airspace below the flux-measuring height [24]. In this study, the Fs term was neglected for the NEE calculation as the canopy height was relatively low at less than 1 m. In the current study, we use the term NEE, which indicates CO2 flux only.

2.6. Auxiliary Measurements

The LI-7200 was installed at 2.05 m height with a northward, eastward and vertical sensor separation of −5.5 cm, +5.0 cm and 0 cm from the CSAT3, respectively. The north off set was 55°. A net radiometer (CNR4, Kipp&Zonan, Delft, the Netherlands), photosynthetically active radiation (PAR) sensor (PQS 1, Kipp&Zonan) were installed at 2.90 m height, whereas, the air temperature (AT) probe (Pt 100, Rotronic, Bassersdorf, Switzerland) and relative humidity (RH) probe (Hygro Clip S3, Rotronic) were installed at 2.0 m above the soil surface. Rainfall was measured with a tipping bucket rain gauge (TE-525, Texas Instruments, Dallas, TX, USA). Data of these slow sensors were averaged over a 30-minute period. The system received its power from four 12 V, 100AH DC batteries and was also supported by an AC connection in parallel on foggy and cloudy days. Vapor pressure deficit (VPD) was estimated from the vapor pressure monitored by the LI-7200. The leaf area index (LAI) was periodically measured by a canopy analyzer LI 2200 (LICOR, Lincoln, NE, USA) at the vegetative, reproductive and maturity stages. Half-hourly measurements of soil moisture (SM), heat flux (SHF) and temperature (ST) were taken at 5 cm soil depth using a water content reflectometer (CS 616-L), soil heat flux sensor (HFT3 transducer) and soil and water temperature probe (107 B), respectively.

2.7. Quality Control of Flux Data

The flux data were subjected to quality control checks to screen data for instrument malfunctions, rainfall, etc. A diagnostic output of LI-7200: automatic gain control (agc_li) was used to filter out half-hourly values when the instrument was performing poorly and for identification of outliers. Spike removal was carried out and then corrections for density fluctuations [25] were performed for variations in temperature and water vapor. The coordinate rotation correction was carried out following the method by Kaimal and Finnigan [26]. Sonic temperature correction for humidity was applied as per Van Dijk et al. [27]. The time lag compensations due to the sensor separations between CSAT-3 and LI-7200 were applied as per Fan et al. [28]. Data quality was checked by applying the stationarity test and integral turbulence characteristics test [29] to the computed covariance. The rejection rate was 40% (10% for non-stationary, 40% for integral turbulence characteristics and 14% for both tests) in rice and 40% (15% for non-stationary, 40% for integral turbulence characteristics and 16% for both tests) in wheat. The rejection rate of data was larger when the canopy was small due to lower magnitude of CO2 flux. The u* threshold of 0.1 m s−1 was estimated by plotting the nighttime CO2 flux (Fc) and frictional velocity (u*). Gap-filling of missing or discarded data was done by simple linear interpolation (1–3 consecutive missing data) and mean diurnal variation method (up to 4–6 consecutive missing data) and by look-up table approach for more than 6 h missing data using standard approach and available data points.

2.8. Partitioning NEE into GPP and RE

Net ecosystem productivity is the net gain or loss of C from the ecosystem and was the difference of gross primary production (GPP) and ecosystem respiration (RE).
NEP = GPP − RE
The net ecosystem production (NEP) is equivalent to net ecosystem exchange (NEE) but has an opposite sign [30]. Negative NEE or positive NEP indicates CO2 uptake by the ecosystem.
NEP = −NEE
GPP represents CO2 assimilation by photosynthesis of the plant during daytime, while RE represents the CO2 released through respiration from the soil, aboveground plant parts, and the roots of the plants during day and night. As plant respiration during the day is unknown, direct measurement of GPP and RE is difficult [31]. The plant respiration rate was assumed to be the same during the day and night [32]. We estimated the daytime respiration RE (D) using the nighttime average of respiration RE (N). To partition NEE into photosynthetic and respiratory components, we applied the conventional method of Falge et al. [33], in which GPP and RE (D) are expressed as empirical functions of air temperature. We estimated RE (D) using the relationship between nighttime NEE and air temperature. At nighttime, as GPP is zero, the NEE is taken to be equal to RE (N). The RE (N) increases as an exponential function of increasing temperature and is represented as:
RE = A . e BT
where, A and B are empirical constants; B is related to the temperature coefficient Q10, as B = ln(Q10)/10, and A indicates RE at 0 °C [24]. We divided the whole study period into different growth stages viz. early vegetative (EVS), tillering, stem elongation, booting, heading, ripening and harvesting. For each growth period, the nighttime RE (filtered using u* > 0.1 ms−1) was separated into 1 °C wide temperature bins and averaged, A and B constants were determined by fitting the nighttime NEE as a function of averaged air temperature using the least squares method. At each growth stage, a regression analysis was performed between GPP and PAR [34]. The data after gap filling were used for averaging the CO2 fluxes at different growth stages. The duration of each stage was used as the weight while computing the CO2 flux for the whole season. Linear Regression and partial correlation of the datasets were carried out using SPSS (16.0).

3. Results

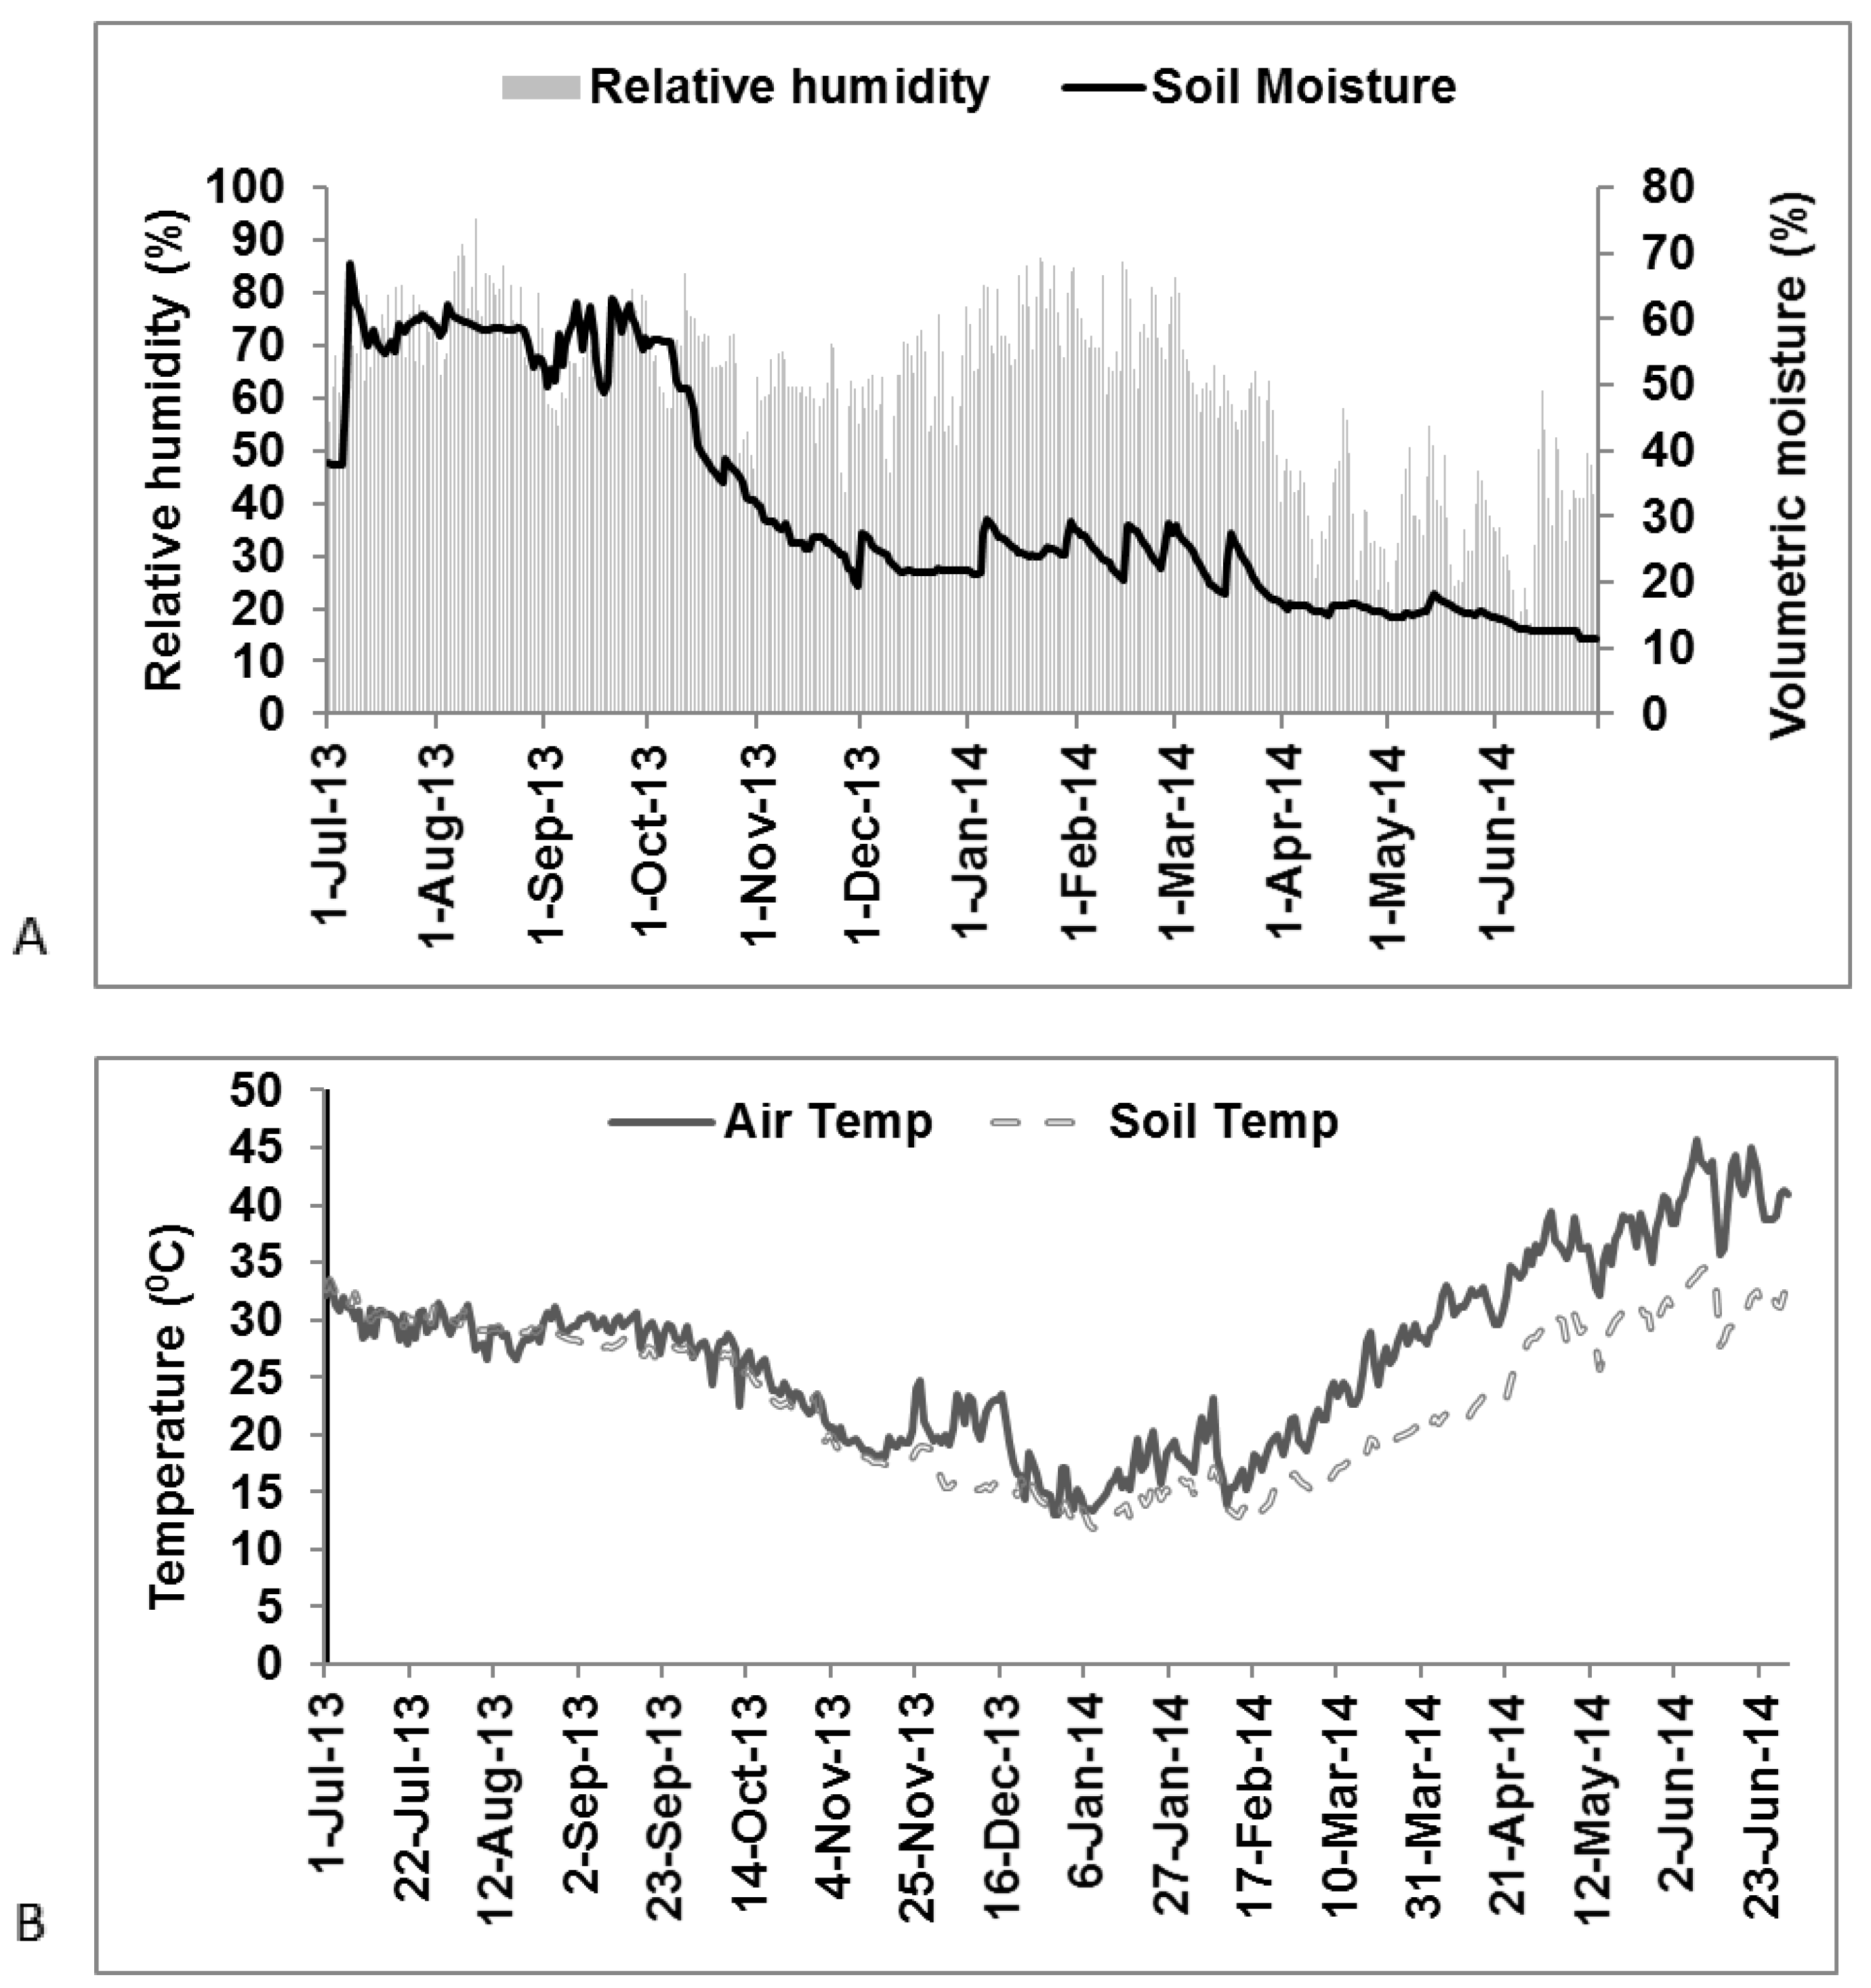
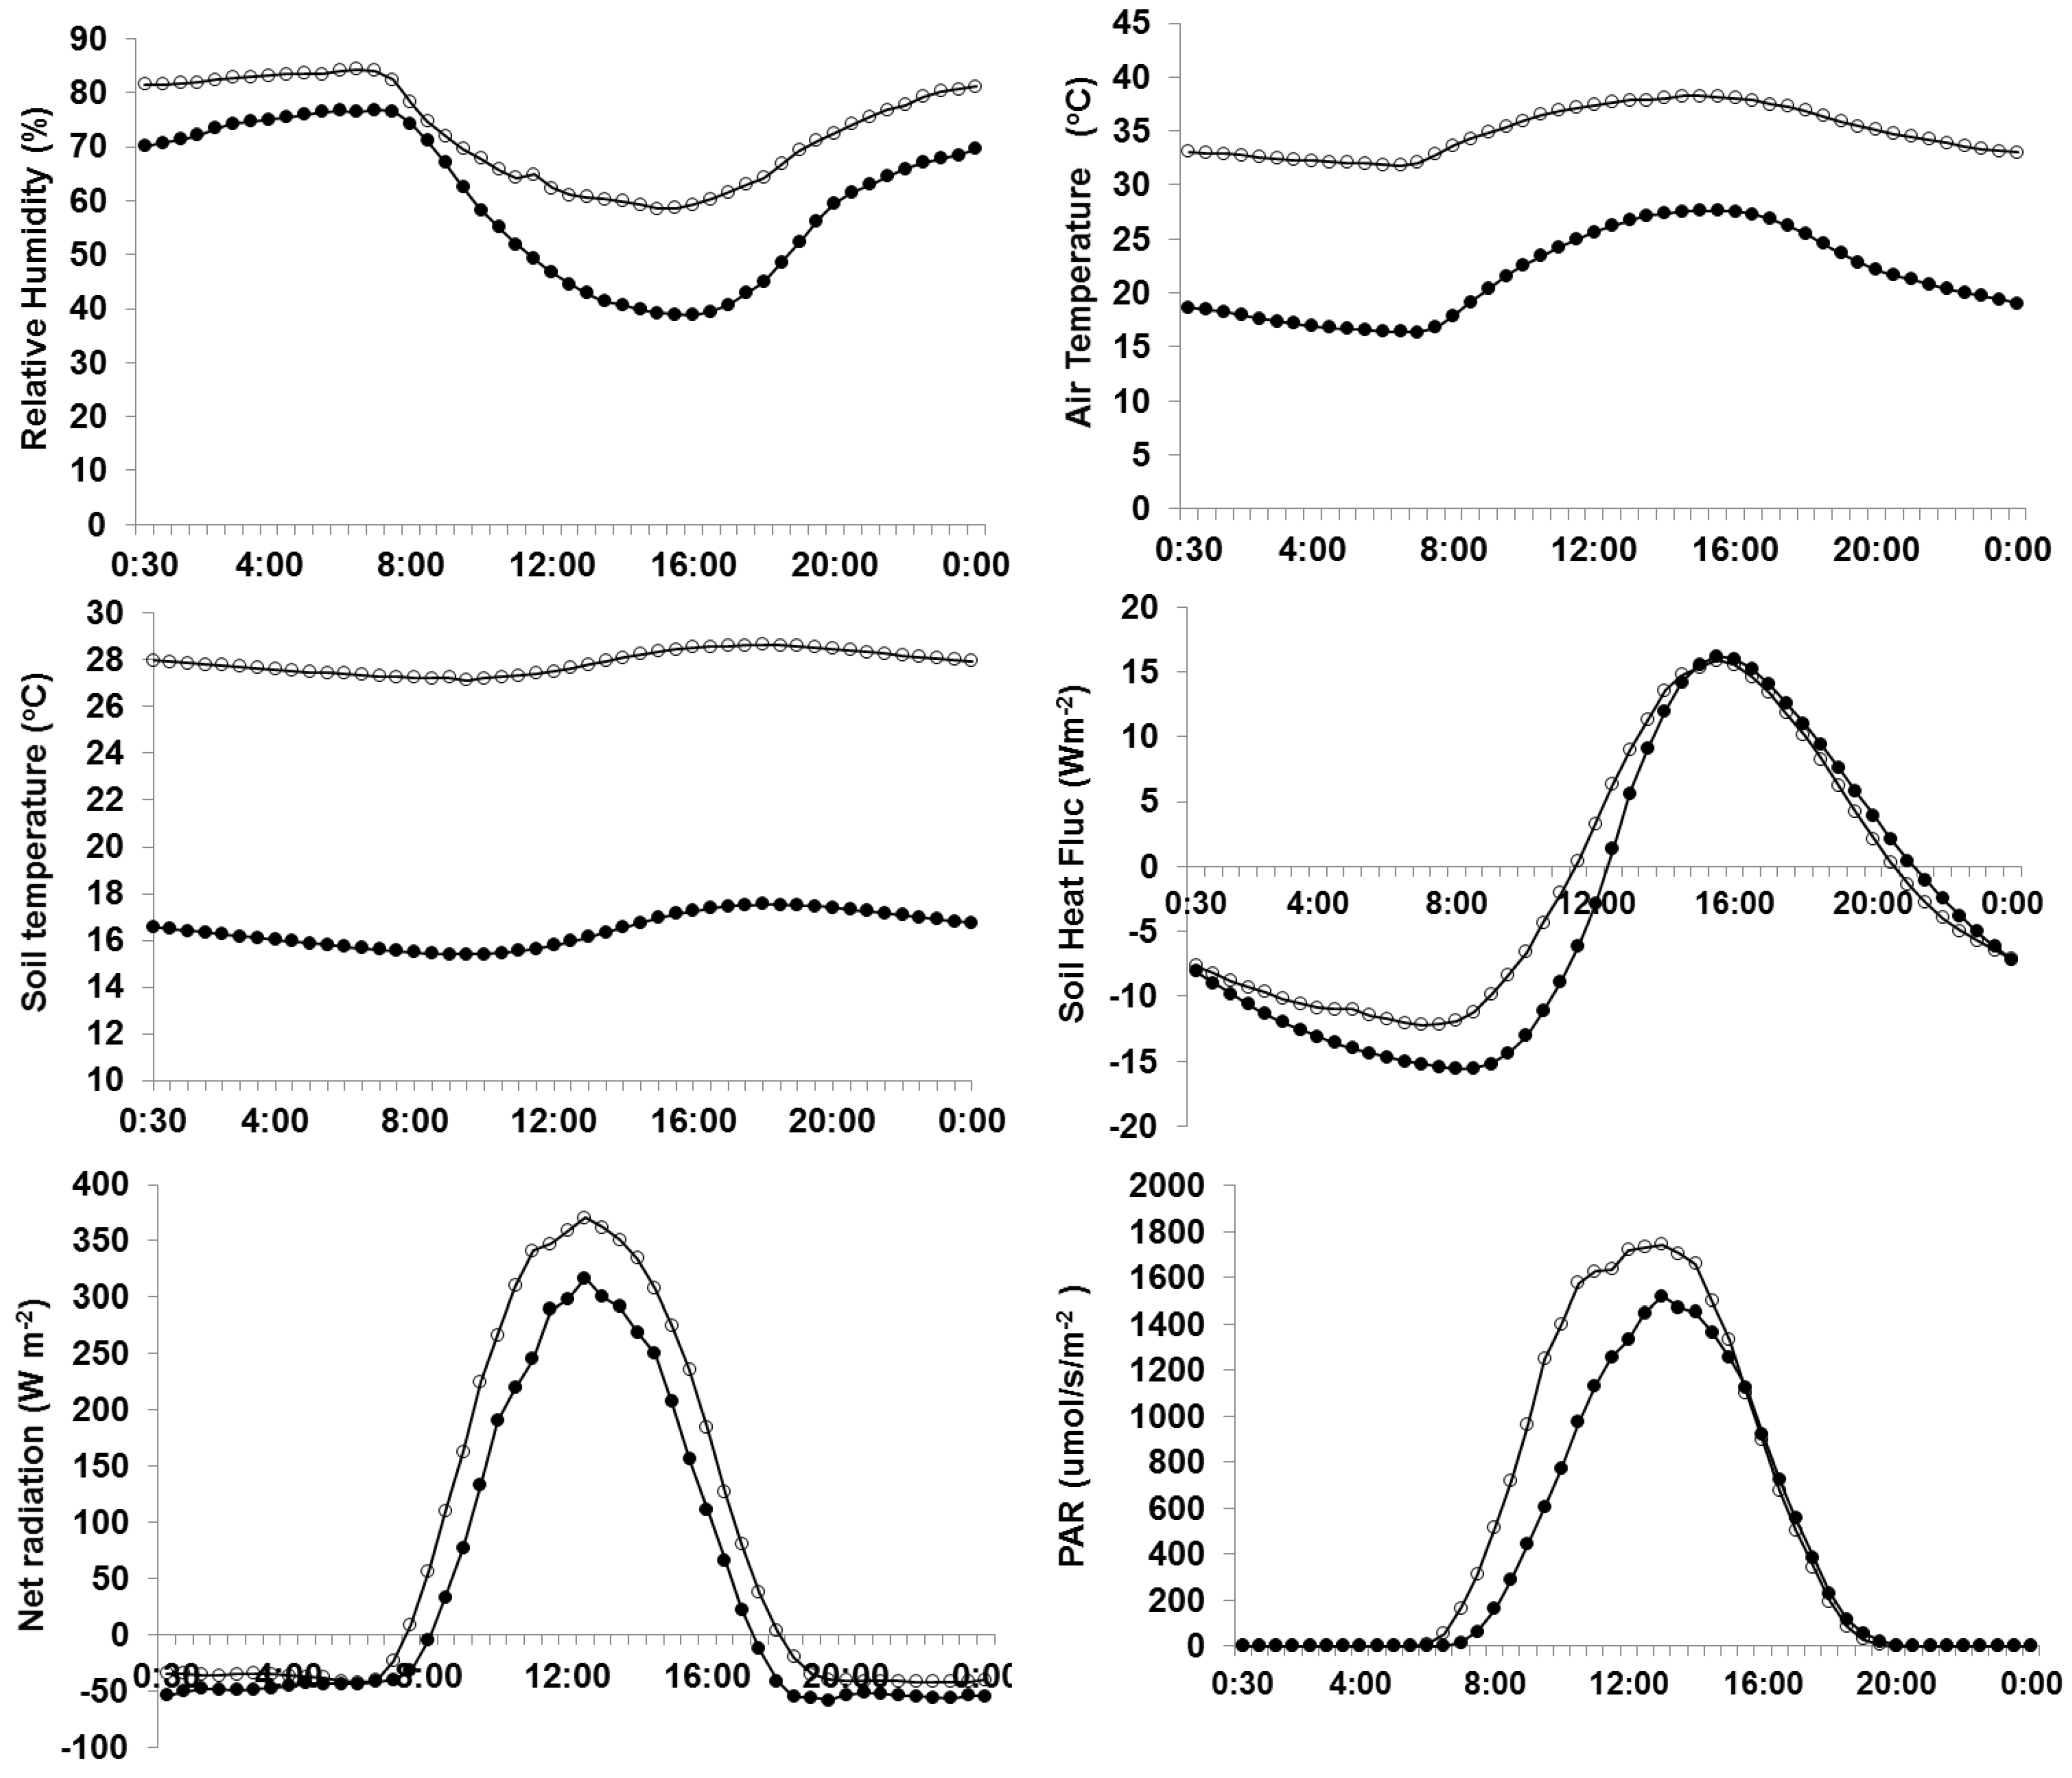
3.1. Climatic Variability during Rice and Wheat Growing Season

Climatic conditions differed considerably between the two seasons of the study (Figure 1). Solar radiation and wind speed were generally higher during the wheat season than in rice. Higher rainfall (above seasonal average) was recorded during the rice season in 2013 and total rainfalls of 1198 and 168 mm were recorded during the kharif (rice) and rabi (wheat) season, respectively. In rice, most of the rain occurred during July, August and September due to the south-west monsoon, while in wheat, it rained mostly in February and March (non-monsoonal rainfall) due to western disturbances. The maximum air temperature during the growth of rice was higher, while the minimum air temperature was lower in wheat. The average air temperature from 1 July to 31 October 2013, was 28.4 °C and from 1 December 2013, to 30 April 2014, was 17.7 °C and was higher by 1.0 and 0.9 °C in rice and wheat than the seasonal averages [35], respectively. The average air temperature was the highest at the post transplanting stage (30.5 °C) in rice and then decreased as crop growth progressed. It decreased to 28.9 °C at maximum tillering. This decrease was accompanied by an increase in precipitation. The average air temperature again increased at the booting stage in rice (29.8 °C). During wheat, air temperature decreased initially till early in the vegetative stage and then subsequently increased. Total rainfall varied significantly between the rice and wheat crops. A total of 1053 mm and 155 mm rainfall was received during rice and wheat crop growth periods, respectively (Figure 1). The maximum rainfall in rice was received corresponding to the maximum tillering till panicle initiation (425 mm) stage, and in wheat corresponding to the stem elongation stage (54.8 mm). Average wind speeds of 4.25 and 4.67 km h−1 were recorded during the rice and wheat growth periods, respectively. Wind from east (E) and east-northeasterly (ENE) directions prevailed during most of the rice crop growth period, while during the wheat period, northwest (NW) and west-northwesterly (WNW) winds prevailed. The average sunshine hours during rice and wheat growth periods were 4.76 and 5.08, respectively. Low levels of solar radiation during the rice and wheat crop were associated with the rainy and winter foggy seasons in northern India, respectively.

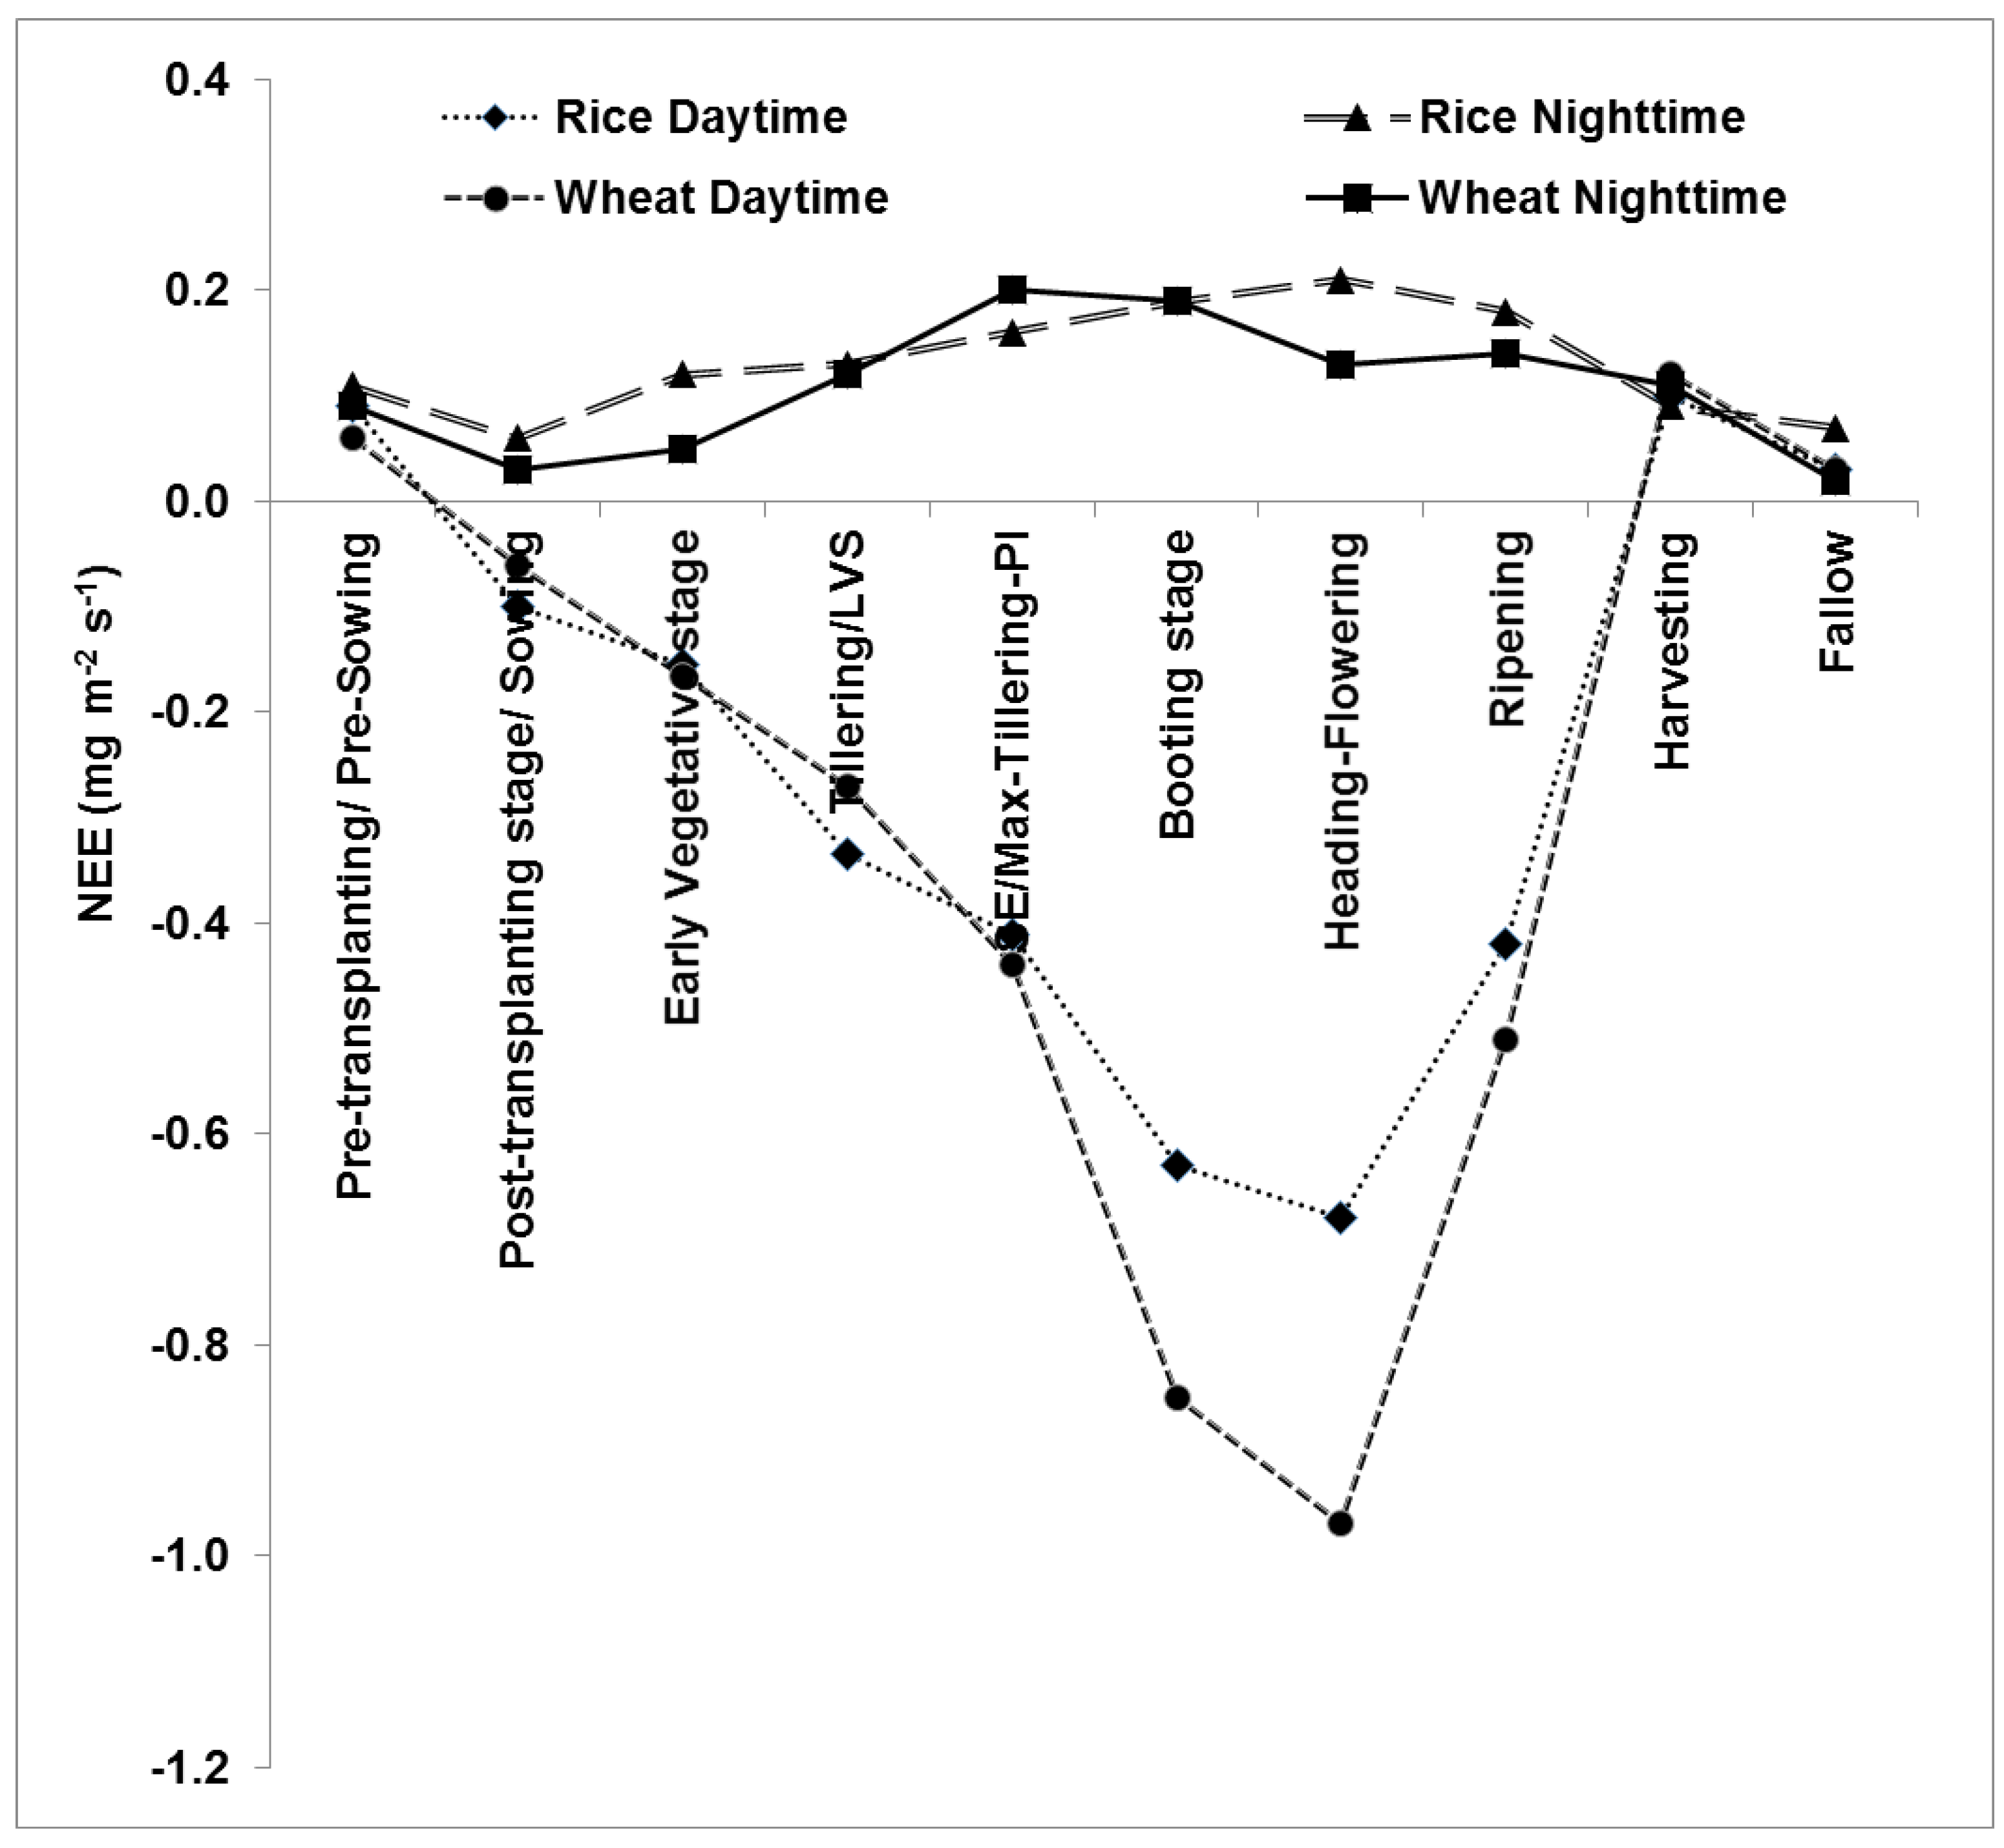
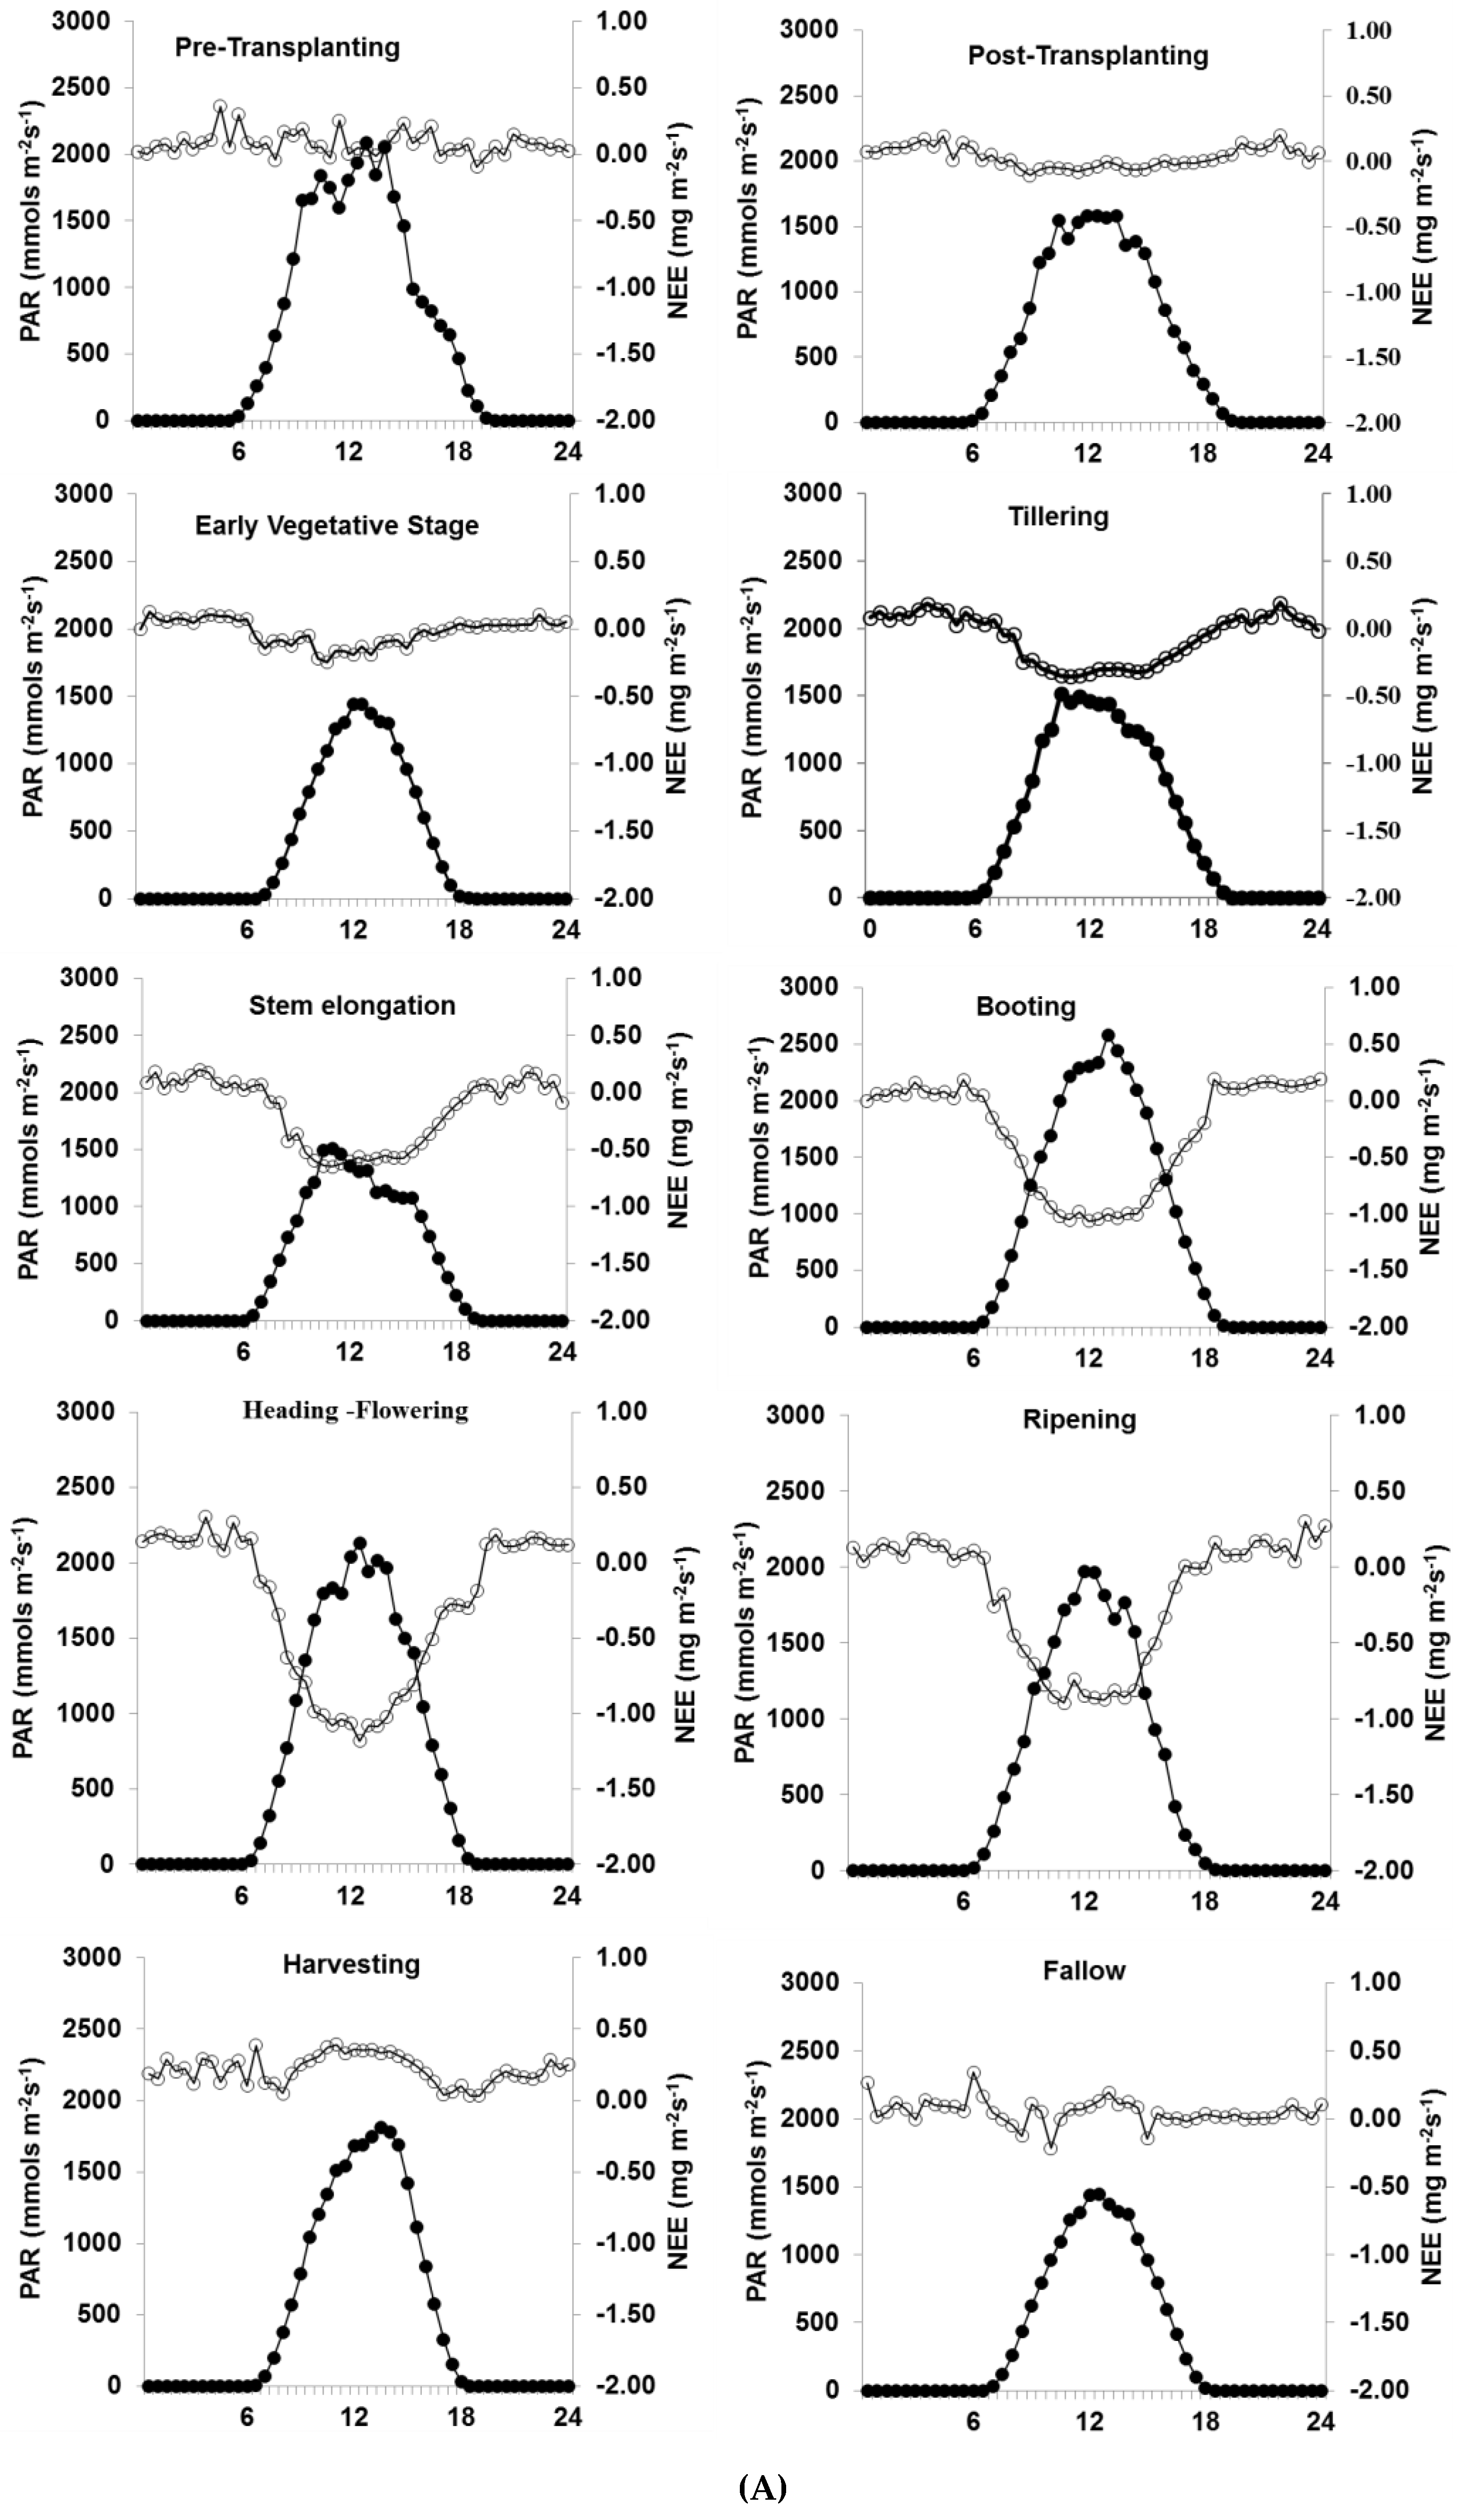
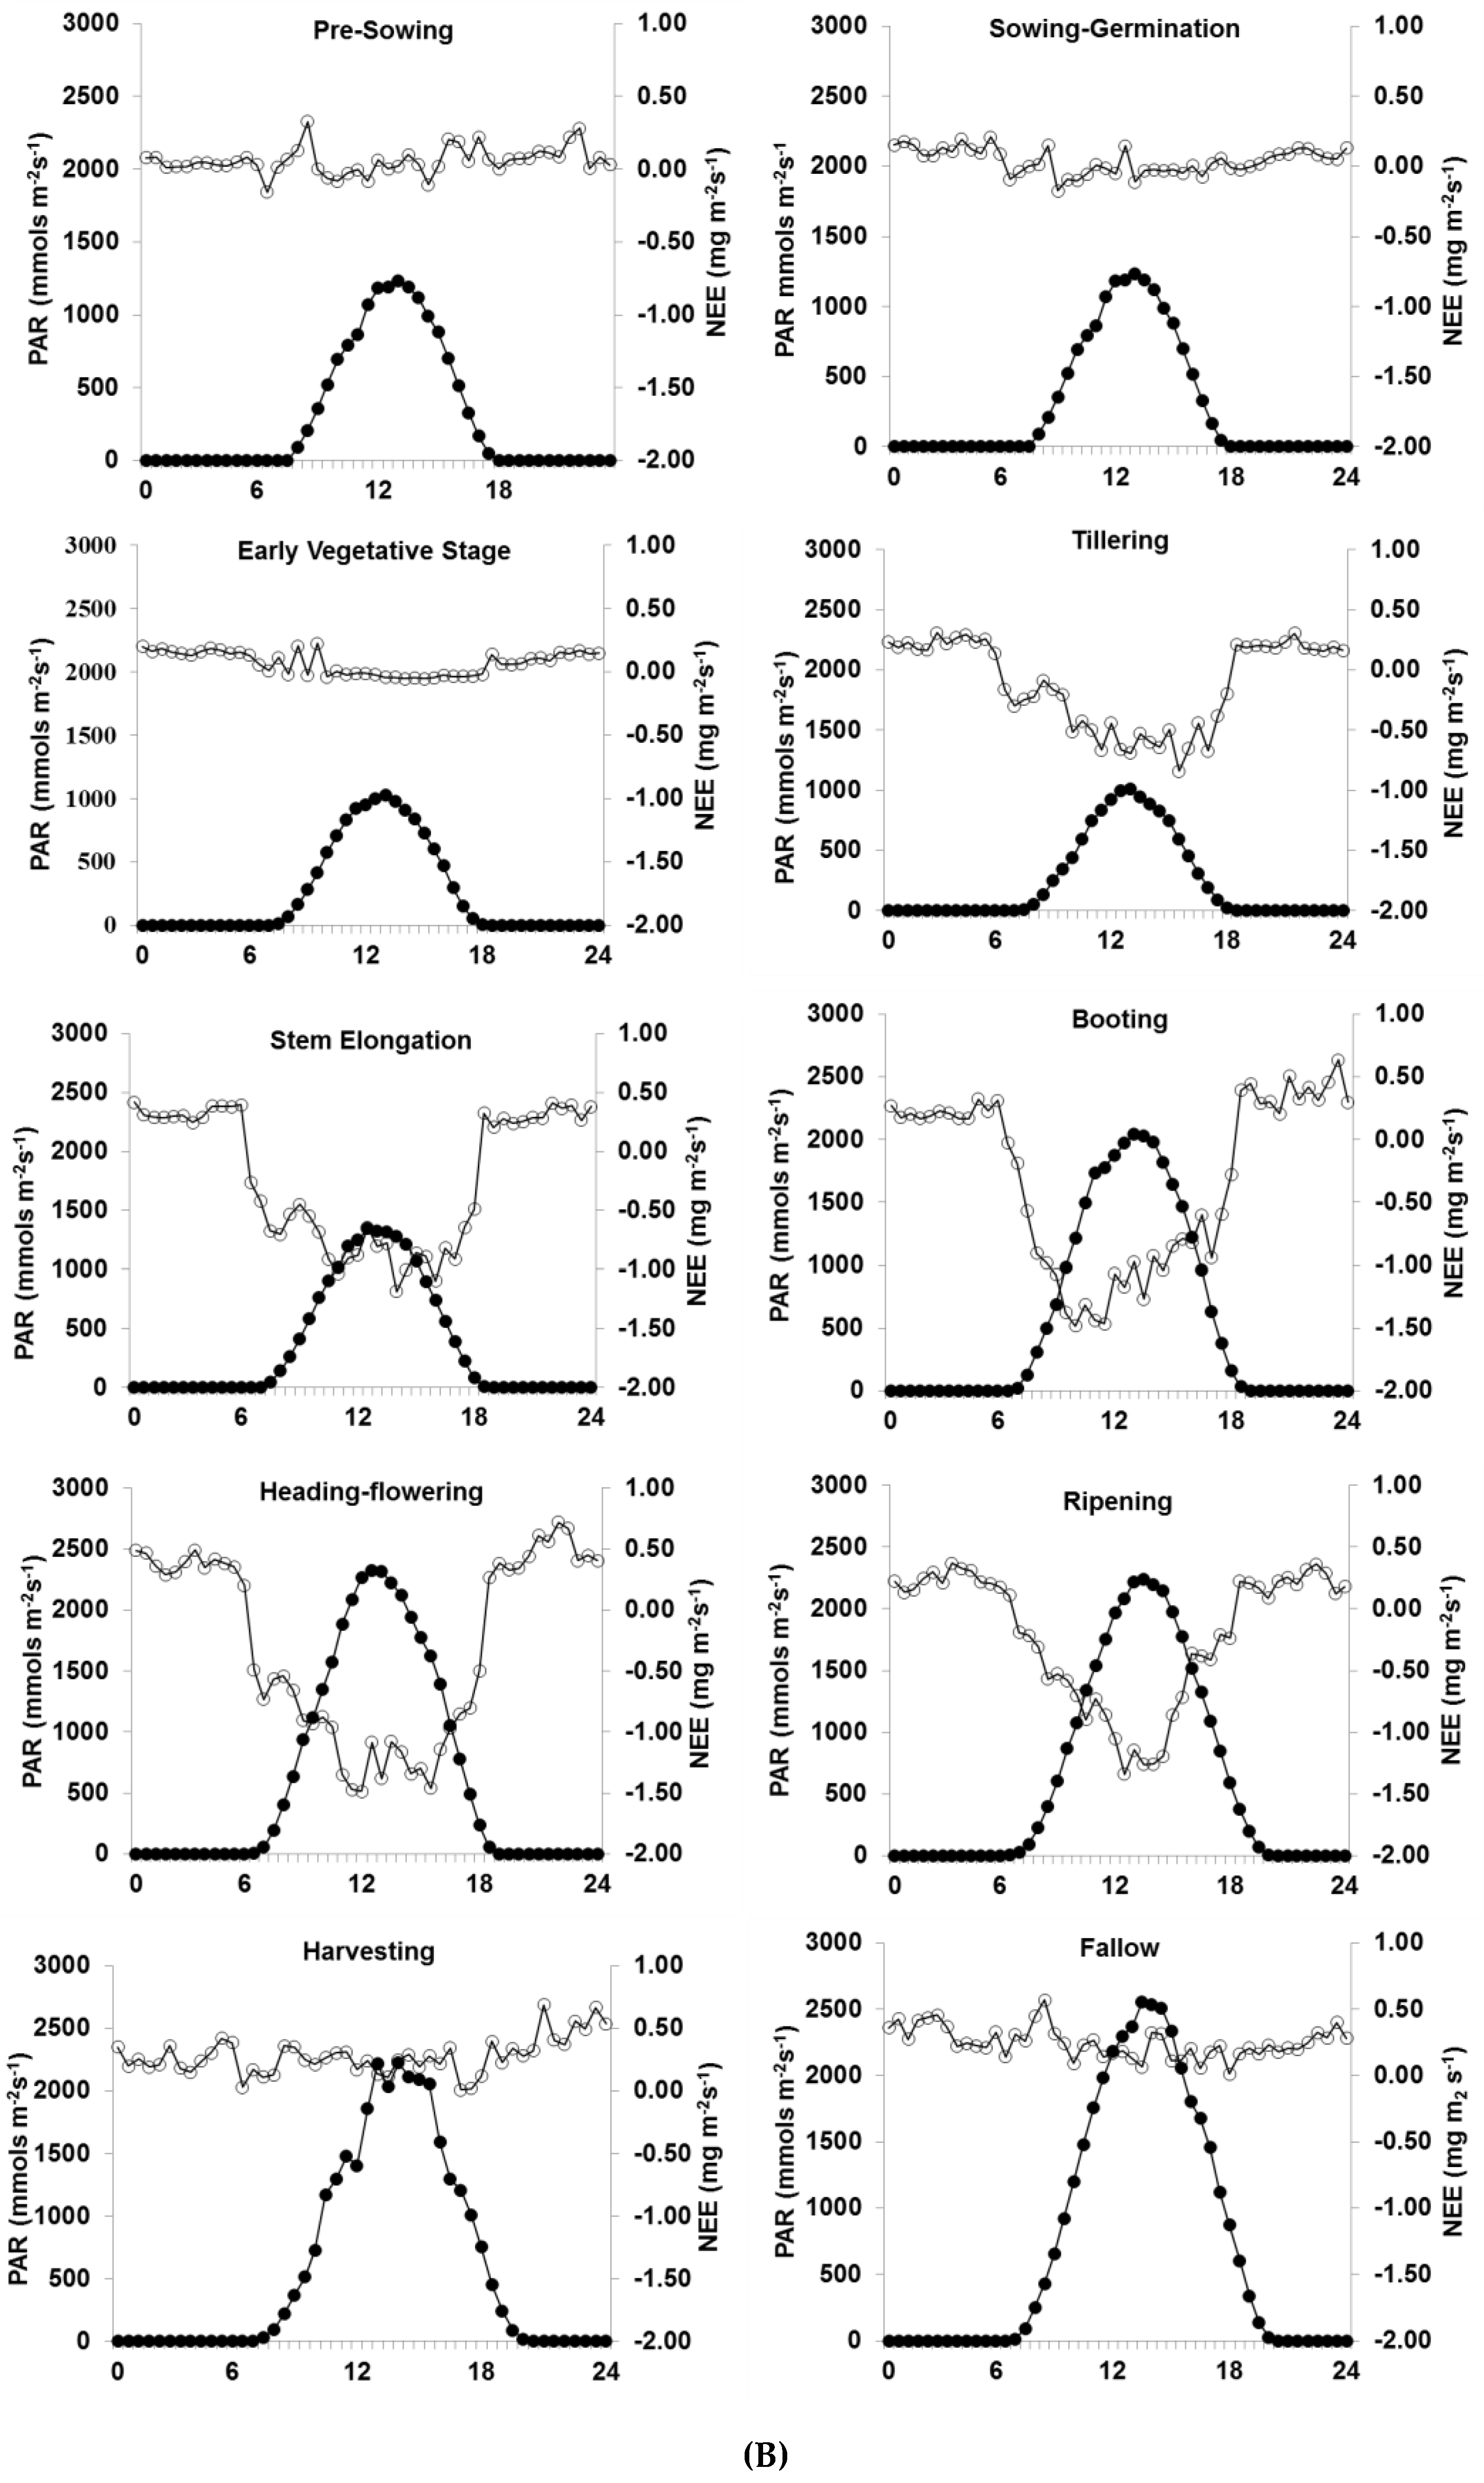
3.2. Diurnal Variation in NEE

Throughout the crop growth period, NEE was negative during the daytime (uptake) and positive during the nighttime (release) (Figure 2). A higher negative NEE was observed during the day in wheat as compared to rice. The average diurnal NEE varied between +0.21 to −0.70 in rice and between +0.20 to −0.97 mgm−2s−1 in the wheat crop. The daytime NEE decreased with the progress of the crop season in both rice and wheat, reaching a peak average NEE of −0.7 mgm−2s−1 in rice (booting-flowering) and −0.97 mgm−2s−1 in wheat (heading–ripening). The nighttime average NEE increased marginally during the booting to ripening stages in rice, however, in wheat it showed a steady increasing trend from the early vegetative stage, reaching a peak at the heading-ripening stage. A distinct diurnal pattern in NEE was observed from the early vegetative to ripening stage in rice and wheat, which followed a reverse pattern to that of the PAR during the daytime (Figure 3A,B).

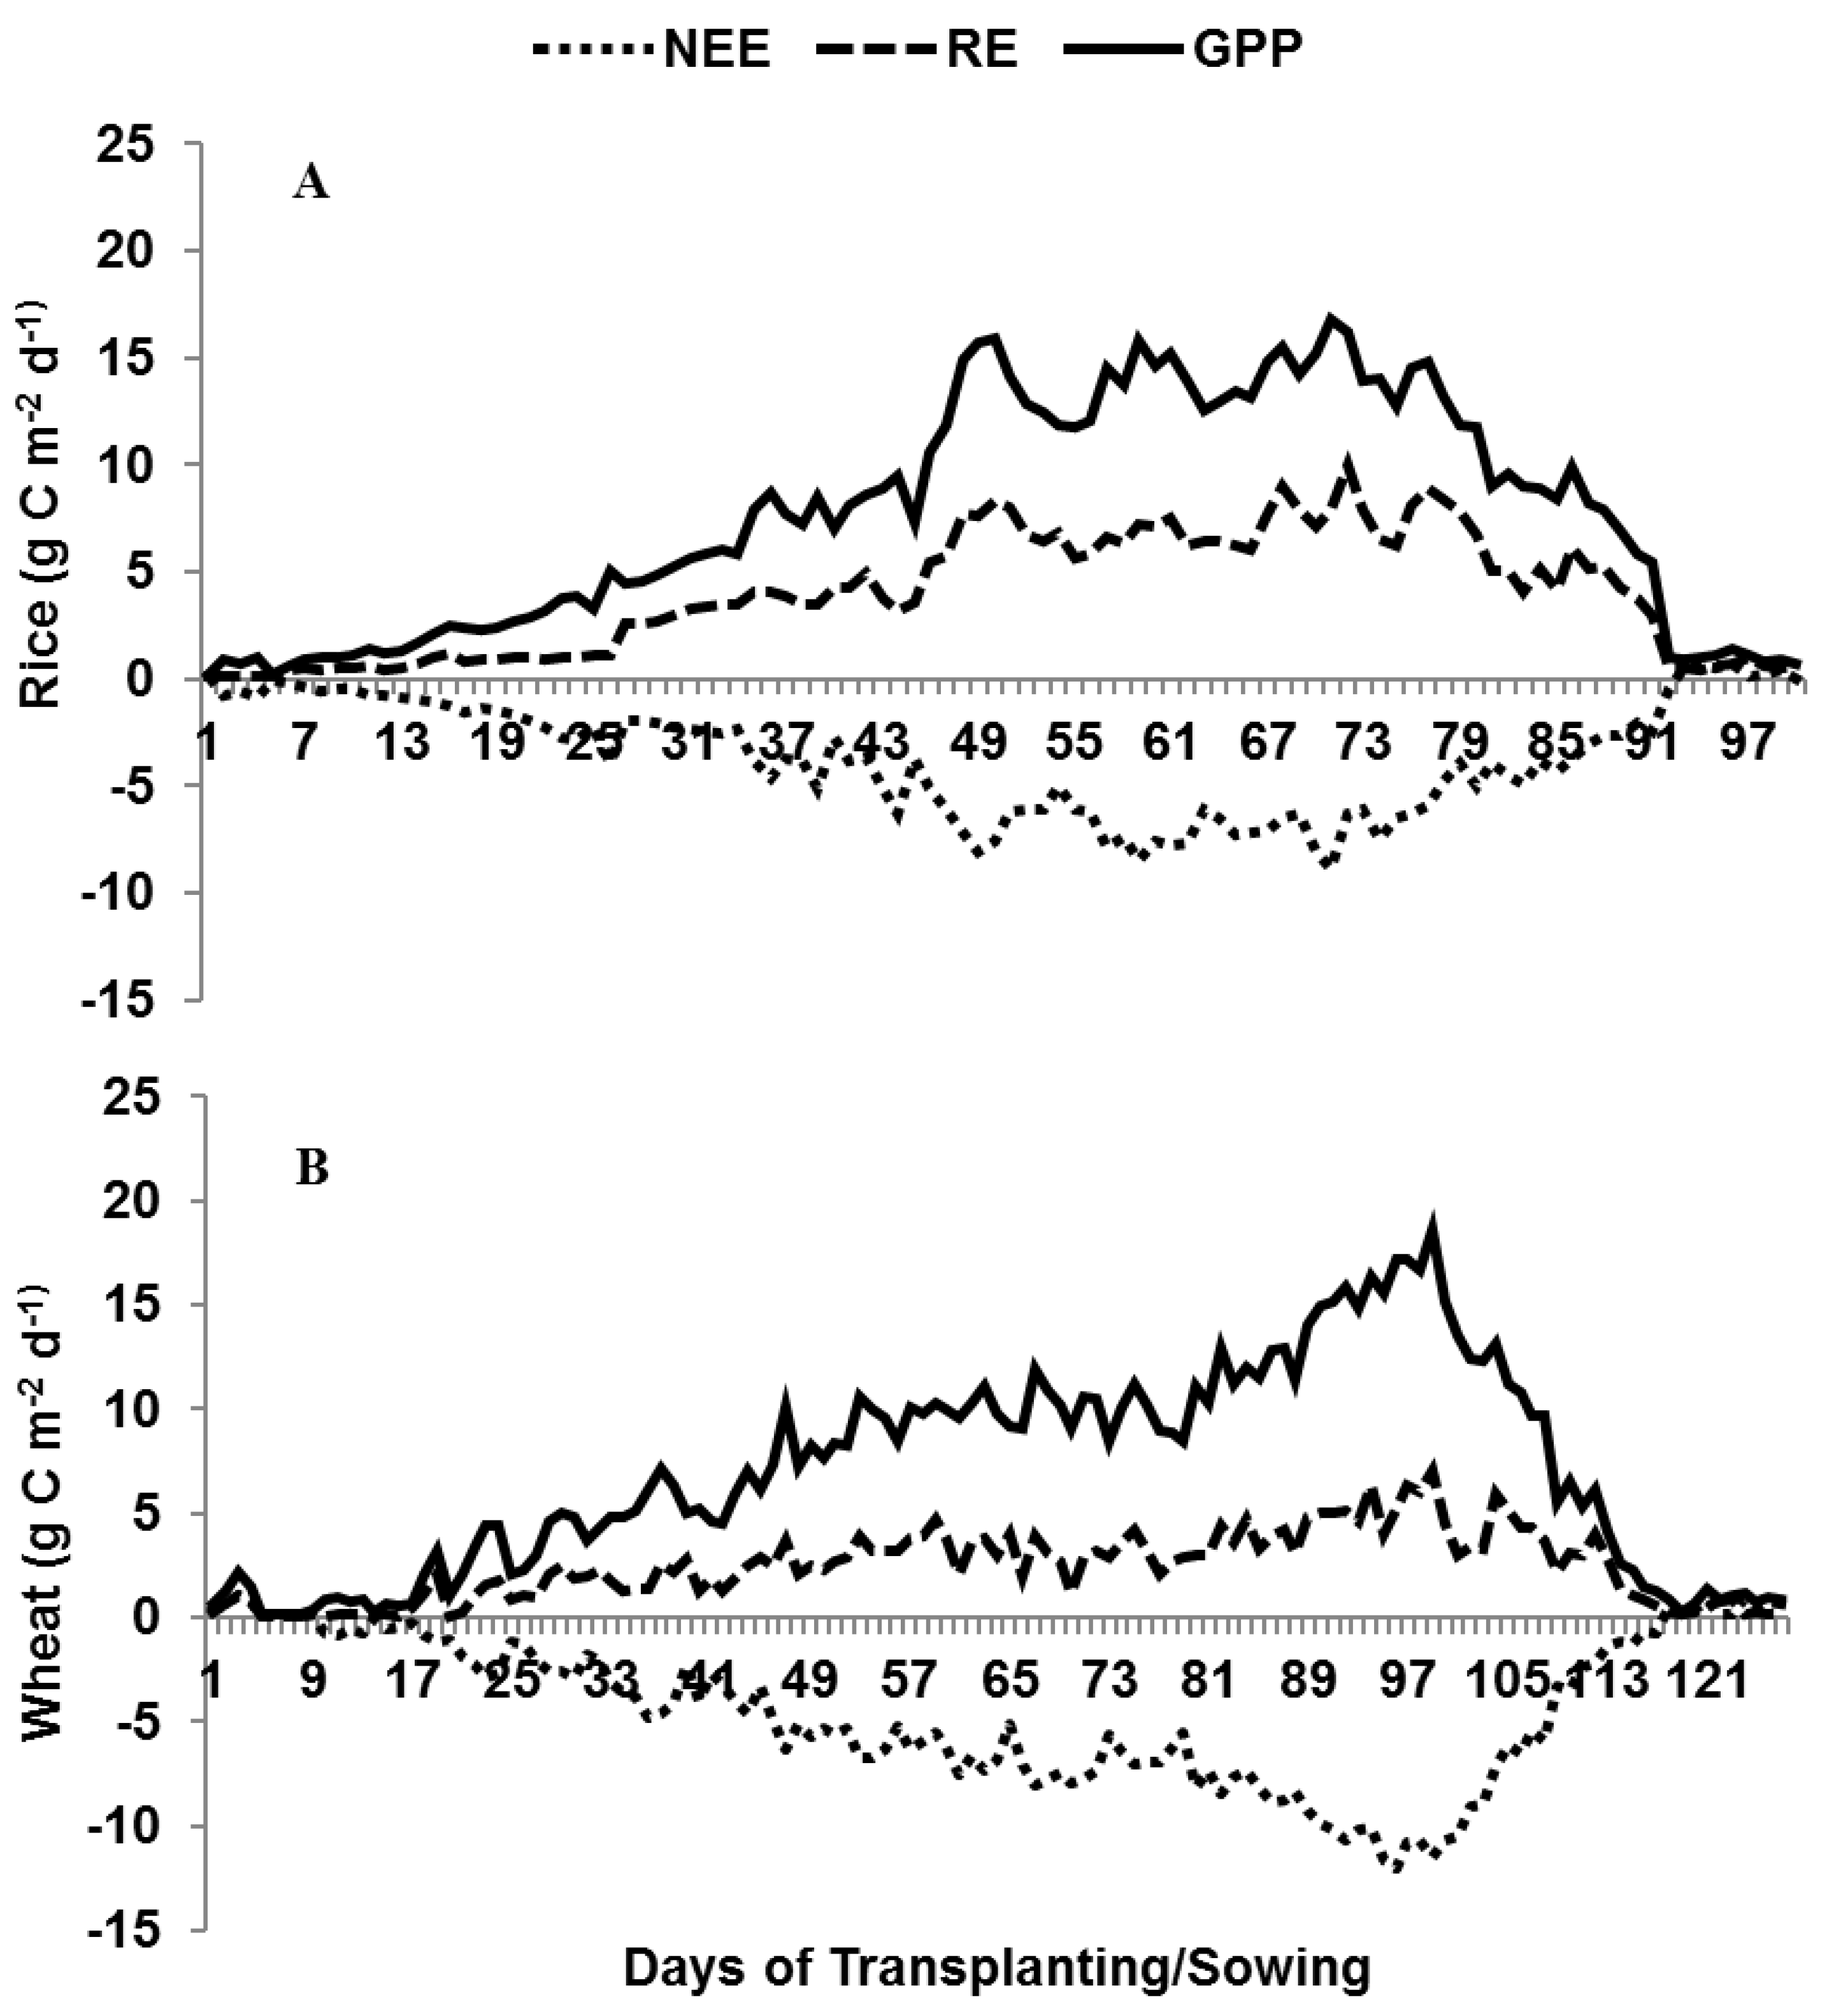
3.3. Seasonal Variation in Daily NEE

The daily average NEE over the crop season varied from+0.67 to −8.83 g C m−2 d−1 in rice (Figure 4A) and from +01.07 to −11.96 g C m−2 d−1 in wheat (Figure 4B). The daily average NEE increased with the rice growth stage and peaked during the reproductive stage. During the reproductive stage of heading–flowering, the NEE was −8.83 g C m−2 d−1 in rice and −11.96 g C m−2 d−1 in wheat. The average daily NEE for the crop season was 25% lower in rice at −3.74 g C m−2 d−1, as compared to −5.01 g C m−2 d−1 in wheat (Table 1). Wheat had a cumulative NEE of −576 g C m −2, as compared to rice at −368 g C m−2 (Table 1). The fallow period duration, after rice and wheat, was 61 and 91 days long, respectively. The NEE at the harvest of rice and wheat were 0.35 g C m−2 d−1 and 0.46 g C m−2 d−1, respectively (Table 1). The cumulative NEE was higher in the fallow period after wheat at 32.76 g C m−2, as compared to after rice at 17.08 g C m−2.

3.4. RE and GPP at Different Crop Growth Stages

The RE varied from 0.07 to 9.93 g C m−2 d−1 in rice and 0.04 to 7.08 g C m−2 d−1 in wheat depending upon the crop stage (Figure 4A,B). The rate of RE during the pre-transplanting and pre-sowing period in rice and wheat was observed to be 0.89 and 0.7 C g m−2 d−1, respectively (Table 1).
The average rate of GPP over the different growth stages varied from 0.32 to 14.42 g C m−2 d−1 in rice and 0.39 to 15.66 g C m−2 d−1 in wheat (Table 1). The highest GPP rate was observed during heading (14.42 and 15.66 g C m−2 d−1) in both of the crops. The cumulative GPP was much higher in wheat at −888 g C m−2 as compared to −753 g C m−2 in rice at our study site. Total plant biomasses of 1335 and 1392 gm−2 were removed at harvest in rice and wheat, respectively. The GPP rate increased with increasing LAI (vegetative stage: LAI 0.9, GPP 2.42 g C m−2 d−1; reproductive: LAI 4.3, GPP 13.83 g C m−2 d−1; maturity: LAI 1.9, GPP 7.18 g C m−2 d−1) in rice and in wheat (vegetative: LAI 1.3, GPP 4.51 g C m−2 d−1; reproductive: LAI 4.6, GPP 13.76 g C m−2 d−1; maturity: LAI 2.4, GPP 8.32 g C m−2 d−1).

3.5. Environmental Variables in Rice and Wheat

Differences in soil temperature at 5 cm depth were observed between rice and wheat. The diurnal average soil temperature varied between 27.74 to 28.92 °C in rice and from 15.38 to 17.53 °C in wheat (Figure 5), depending on the intensity of incident solar radiation. The diurnal mean air temperature ranged from 31.8 to 38.2 °C in rice and from 16.3 to 27.6 °C in wheat, respectively (Figure 5) and the diurnal RH varied between 60–85% in rice and 40–80% in wheat. The relative humidity (RH) and air temperature (AT) showed an opposite diurnal pattern with respect to each other. Soil heat flux (SHF) at 5 cm soil depth was positive from about 12:00 hr to 20:30 hr and was negative from 21:00 hr to 11:30 hr in both rice and wheat. The SHF ranged from −12.2 Wm−2 (7:00 hr) to +15.9 Wm−2 (15:30 hr) in rice and from −15.6 Wm−2 (8:00 hr) to +16.2 Wm−2 (15:30 hr) in wheat. The diurnal values of incident PAR and Net radiation (NR) were higher during the rice than in the wheat season (Figure 5). The peak NR value in rice was 370.3 Wm−2 and 316.7 Wm−2 in wheat, with corresponding incident PAR values of 1742 μ mol m−2s−1 in rice and 1519 μ mol m−2s−1 in wheat. The average VPD was 1.75 kPa in rice and 1.48 kPa in wheat.

4. Discussion

4.1. Diurnal and Seasonal Variation in NEE

The average nighttime NEE was, on average, 0.11 and 0.12 mgm−2s−1 during the rice and wheat growth periods, respectively. These values are close to those measured by Miyata et al. [36] in Japan (<0.2 mgm−2s−1) and Gao et al. [37] in China (0.12 mgm−2s−1) in intermittently flooded rice paddies. The mean diurnal variation of NEE showed that both rice and wheat crops acted as net CO2 sinks, as CO2 uptake during the day was higher than emission after daylight hours. The highest values of half-hourly NEE were observed during the reproductive stage and the variations in NEE followed those in incident PAR. Zhang et al. [38] also observed relatively large fluctuations in diurnal NEE in maize cropland, orchard, wetland and vegetable field ecosystems with highest CO2 uptake levels observed in maize crops due to the differences in the light saturation point (α) and carbon absorption capacities of the crops.
The highest leaf area index in rice (4.3) and wheat (4.6) was observed during the reproductive stages of heading to flowering. As PAR values increased beyond 2000 μ mol m−2 s−1, there was an increase in carbon assimilation in rice and wheat. As the wheat crop advanced to the heading stage, the peak NEE increased to −1.48 mg CO2 m−2 s−1 with a PAR of 2342 µ mol m−2 s−1. Higher positive values of NEE at harvesting could be attributed to increased CO2 emission from soil and plant respiration than uptake level by the plants.
The magnitude of NEE in rice was lower during the vegetative stages and reached its maximum during reproductive stages of heading-flowering at −8.83 g C m−2 d−1 in rice and −11.96 g C m−2 d−1 in wheat. Similar values of daily NEE between vegetative and reproductive stages were reported for rice [34,39] and wheat [40]. With the onset of senescence during ripening and maturity, the daily NEE became less negative in rice and turned positive at harvesting.
The daily average NEE during wheat and rice in our study was −5.01 and −3.74 g C m−2, respectively, showing that spring wheat was a stronger CO2 sink than rice. Chen et. al. [12], in a rice–winter wheat rotation system in China, observed a daily NEE of −2.35 and −3.96 g C m−2 in wheat and rice, respectively, even though (Table 4) the winter wheat field took up more CO2 on a seasonal basis as compared to the rice paddy fields because of the longer growing season. Much higher levels of CO2 uptake have been reported in maize as compared to soybean and wheat in other eddy covariance studies. Baker and Griffis [41] observed a maximum CO2 uptake of 51.3 g CO2 m−2 d−1 in a maize crop in maize/soybean ecosystem in the USA which was similar to the maximum CO2 uptake of 45.8 g CO2 m−2 d−1 in a maize ecosystem in the North China Plain [42]. The CO2 uptake levels are different for crops such as corn, as compared to soybean and wheat, due to biochemical and physiological differences between C3 (soybean, wheat) and C4 crops (maize).
Water management, duration and weather conditions are factors which differ in crops and lead to differences in the NEE and uptake of CO2. In our study, the soil and air temperatures were significantly different between the rice and wheat crop seasons impacting the NEE. The rice duration was 98 days and was irrigated every 2–3 days, whereas wheat irrigated for a duration of 115 days was irrigated five times. The cumulative NEE at our site in the rice–wheat system was higher in wheat (−576 g C m−2) as compared to rice (−368 g C m−2). A much higher NEE in rice of −448 g C m−2 was observed by Bhattacharya et al. [19] in eastern India in a rice-rice system. Alberto et al. [34] and Saito et al. [24] reported an NEE of −258 and −398 g C m−2 in rice. Higher NEE values have been reported in winter wheat in Germany by Schmidt et al. [43] at −627 and −537 g C m−2 in (Table 4) because of the longer crop growth duration compared to spring wheat.
The NEE at the harvest of rice was positive at 0.35 g C m−2 d−1 due to the respiration losses by the root residues (Table 1). The NEE was more positive at 0.46 g C m−2 d−1 after the wheat harvest due to higher soil temperatures resulting in higher respiration losses (1.04 g C m−2 d−1) in wheat as compared to rice. More weed growth in the fallow period after rice resulted in a higher average GPP at 0.74 g C m−2 d−1 as compared to 0.54 g C m−2 d−1 in the fallow period after wheat growth (Table 1). Higher soil temperatures and low soil moisture in the fallow period after wheat resulted in lower GPP values as compared to the fallow period after rice. Bhattacharya et al. [19] also reported a resultant NEE of 22 g C m−2 in the summer fallow period as the RE was balanced by photosynthetic CO2 assimilation. Moureaux et al. [44] reported a contribution of 20 g C m−2 due to residues, which represents 5% of the seasonal carbon budget. The RE and GPP during the fallow periods contributed to 17% and 5% of the annual cumulative RE and GPP.

4.2. Effect of Crop Growth, LAI and Air Temperature on GPP

The rate of GPP was significantly higher from booting to heading due to increased daytime CO2 uptake, resulting in higher NEE values of −6.54 and −8.10 at booting and −7.12 and −10.43 g C m−2 d−1 at heading in rice and wheat, respectively, due to increases in LAI which increased the canopy light interception efficiency. The GPP increased with LAI up to heading, but the GPP per unit leaf area later decreased because of increased shading of the lower leaves in the canopy.
The GPP was significantly correlated to AT in both rice (0.129, p < 0.05) and wheat (0.443, p < 0.01). Maximum CO2 uptake was observed at 26–31 °C and 10–26 °C in rice and wheat, respectively. The AT started to decrease after the reproductive stage in rice, thereby reducing the plant maintenance respiration, which produced a greater abundance of assimilates available for growth and yield [45]. The rate of GPP decreased after ripening in wheat. In wheat, higher temperatures after the reproductive stage stimulated photorespiration and the wheat plants reduced their photosynthetic activity, thereby lowering the GPP after ripening. Similar to our results, higher GPP levels from the vegetative to reproductive periods were reported in rice by Campbell et al. [39] and higher net assimilation fluxes ranging between −9 and −13 g C m−2 d−1 were reported in winter wheat by Béziat et al. [46]. Plants may reduce their photosynthetic activity, thereby lowering CO2 uptake at higher temperature due to stomatal closure in response to increased transpiration losses.

4.3. Effect of NR, PAR, SM, RH and VPD on GPP

After sunrise, the NR gradually increased, reaching its peak value at around noon and before starting to decline gradually. The same trend was also observed in PAR. During the daytime, the GPP increased as there was greater CO2 uptake with increasing PAR. A significant positive correlation was observed between PAR and GPP in both rice and wheat (0.225, 0.348; p < 0.01), respectively (Table 2). The GPP is mainly dependent on the amount of PAR absorbed (APAR) by green leaf area of the crop canopy [47].
When the PAR value was greater than 2500 μ mol m−2 s−1, the maximum carbon assimilation rate was observed at the booting stage in rice, whereas a PAR of more than 2000 μ mol m−2 s−1 in wheat led to a greater CO2 uptake in wheat. These differences in the rates of CO2 uptake were due to the different light response parameters of rice and wheat. Apparent quantum yield (α) and Pmax (maximum photosynthetic capacity at light saturation) varied at different growth stages according to the crop phenology (Table 3). The highest P max was observed at the booting stage in rice, whereas it was highest at the heading stage in wheat. The Pmax values ranged from 0.347 to 2.412 mg CO2 m−2s−1 for rice and from 0.461 to 2.841 mg CO2 m−2s−1 in wheat. The initial value of α was in the range of 0.0007 to 0.0008 mg CO2 μ mole photon−1 and started to increase at the vegetative stage as the plants started to grow rapidly. It was the highest at the heading stage in both rice and wheat. The average annual α and Pmax values in our study were a little lower than those reported by Bao et al. [48] in a maize–winter wheat rotation system and by Chen et al. [12] in a rice–winter wheat system. The ecosystem α and Pmax values, could be affected by the differences in air temperature, vapor pressure deficit (VPD), and other biotic factors, such as the green leaf area.
In the current investigation, the VPD was between 1.5 to 2.5 kPa and influenced the GPP in both the crops. The VPD increases with air temperature, increasing the plant respiration rate and leading to a reduction in CO2 uptake [34]. However, it was difficult to evaluate the effects of high VPD on overall photosynthesis and GPP because high VPD conditions mostly persist for a short duration around midday and the stress impact may not persist throughout the rest of the day [49]. The GPP was significantly negatively correlated with VPD in rice (−0.315, p < 0.01) (Table 2). An increase in VPD may cause partial closure of the stomata causing a reduction in photosynthesis and thereby reducing the GPP.
Soil moisture is another key parameter affecting plant productivity. It was positively correlated with GPP in wheat (0.471, p < 0.01), however, no significant correlation of SM with GPP was obtained in irrigated rice in our study as there was no moisture stress (Table 2). Soil moisture generally has a positive relation with LAI and phenology, thereby controlling the seasonal variation in GPP [30]. Limiting soil moisture constrains stomatal conductance, thereby lowering carbon uptake and plant water use. In wheat, as the water supply was limited and the RH was low (62.15%), water use was reduced as compared to rice, where the RH was higher (71.85%) and water was abundant.

4.4. Effect of Crop Stage, Environmental Variables on RE

The primary cause of seasonal change in RE was changes in the above-ground biomass with crop growth. The rate of RE during the pre-transplanting and pre-sowing periods in rice and wheat was mainly due to soil and weed respiration (Table 1). The RE increased in both rice and wheat until heading and then declined at the ripening stage following the senescence of the green leaf area and old roots [30]. Baldocchi [50] observed higher RE values during the ripening stage in wheat due to the differences in canopy’s radiative temperature after the heading stage subsequent to normalizing the LAI, which led to higher levels of canopy respiration. The respiration rate at the different growth stages in rice was relatively higher than in wheat, despite the higher biomass in wheat, due to higher air and soil temperature (ST) during rice. The higher value of RE during the pre-transplanting period in rice was because of the higher ST (31 °C) which enhanced the soil respiration and also due to the growth of weeds supported by rainfall and an increased number of sunshine hours. Our rice field was frequently irrigated and due to availability of dissolved oxygen in the irrigation water, there was microbial decomposition of soil organic matter leading to higher soil respiration levels in the frequently irrigated rice [34]. Mielnik and Dugas [51] observed that soil respiration increased as the soil water content decreased, but under very dry conditions the CO2 efflux decreased due to low root and microbial activity. In our study, there was no water stress at any stage in both the crops.
The RE was significantly positively correlated with ST in rice (0.543, p < 0.01) (Table 2). The diurnal range of ST was smaller in rice on account of standing water which acted as a barrier to ST changes [52]. The ST during most of the rice crop was nearly constant, except at the maturity stage, while it showed comparatively larger variation in the case of wheat and was influenced by changes in net solar radiation.
The RE was negatively correlated with soil moisture (SM) in both rice and wheat, however, it was significant only in wheat (−0.322, p < 0.01). The RE was positively correlated with RH in rice and negatively correlated in wheat; however, it was not significant in both the crops. The RE was positively correlated with AT in both rice and wheat, however, the correlation was significant only in wheat (0.294, p < 0.01) (Table 2). Increased AT stimulated respiration and photorespiration in plants and a decline in photosynthetic activity occurred as leaf temperatures increased [53]. The SHF influenced the soil temperature and transferred the energy to or from the soil for maintaining the optimum conditions for soil microbial respiration [54], however, the RE was not significantly correlated with SHF in both rice and wheat (Table 2).

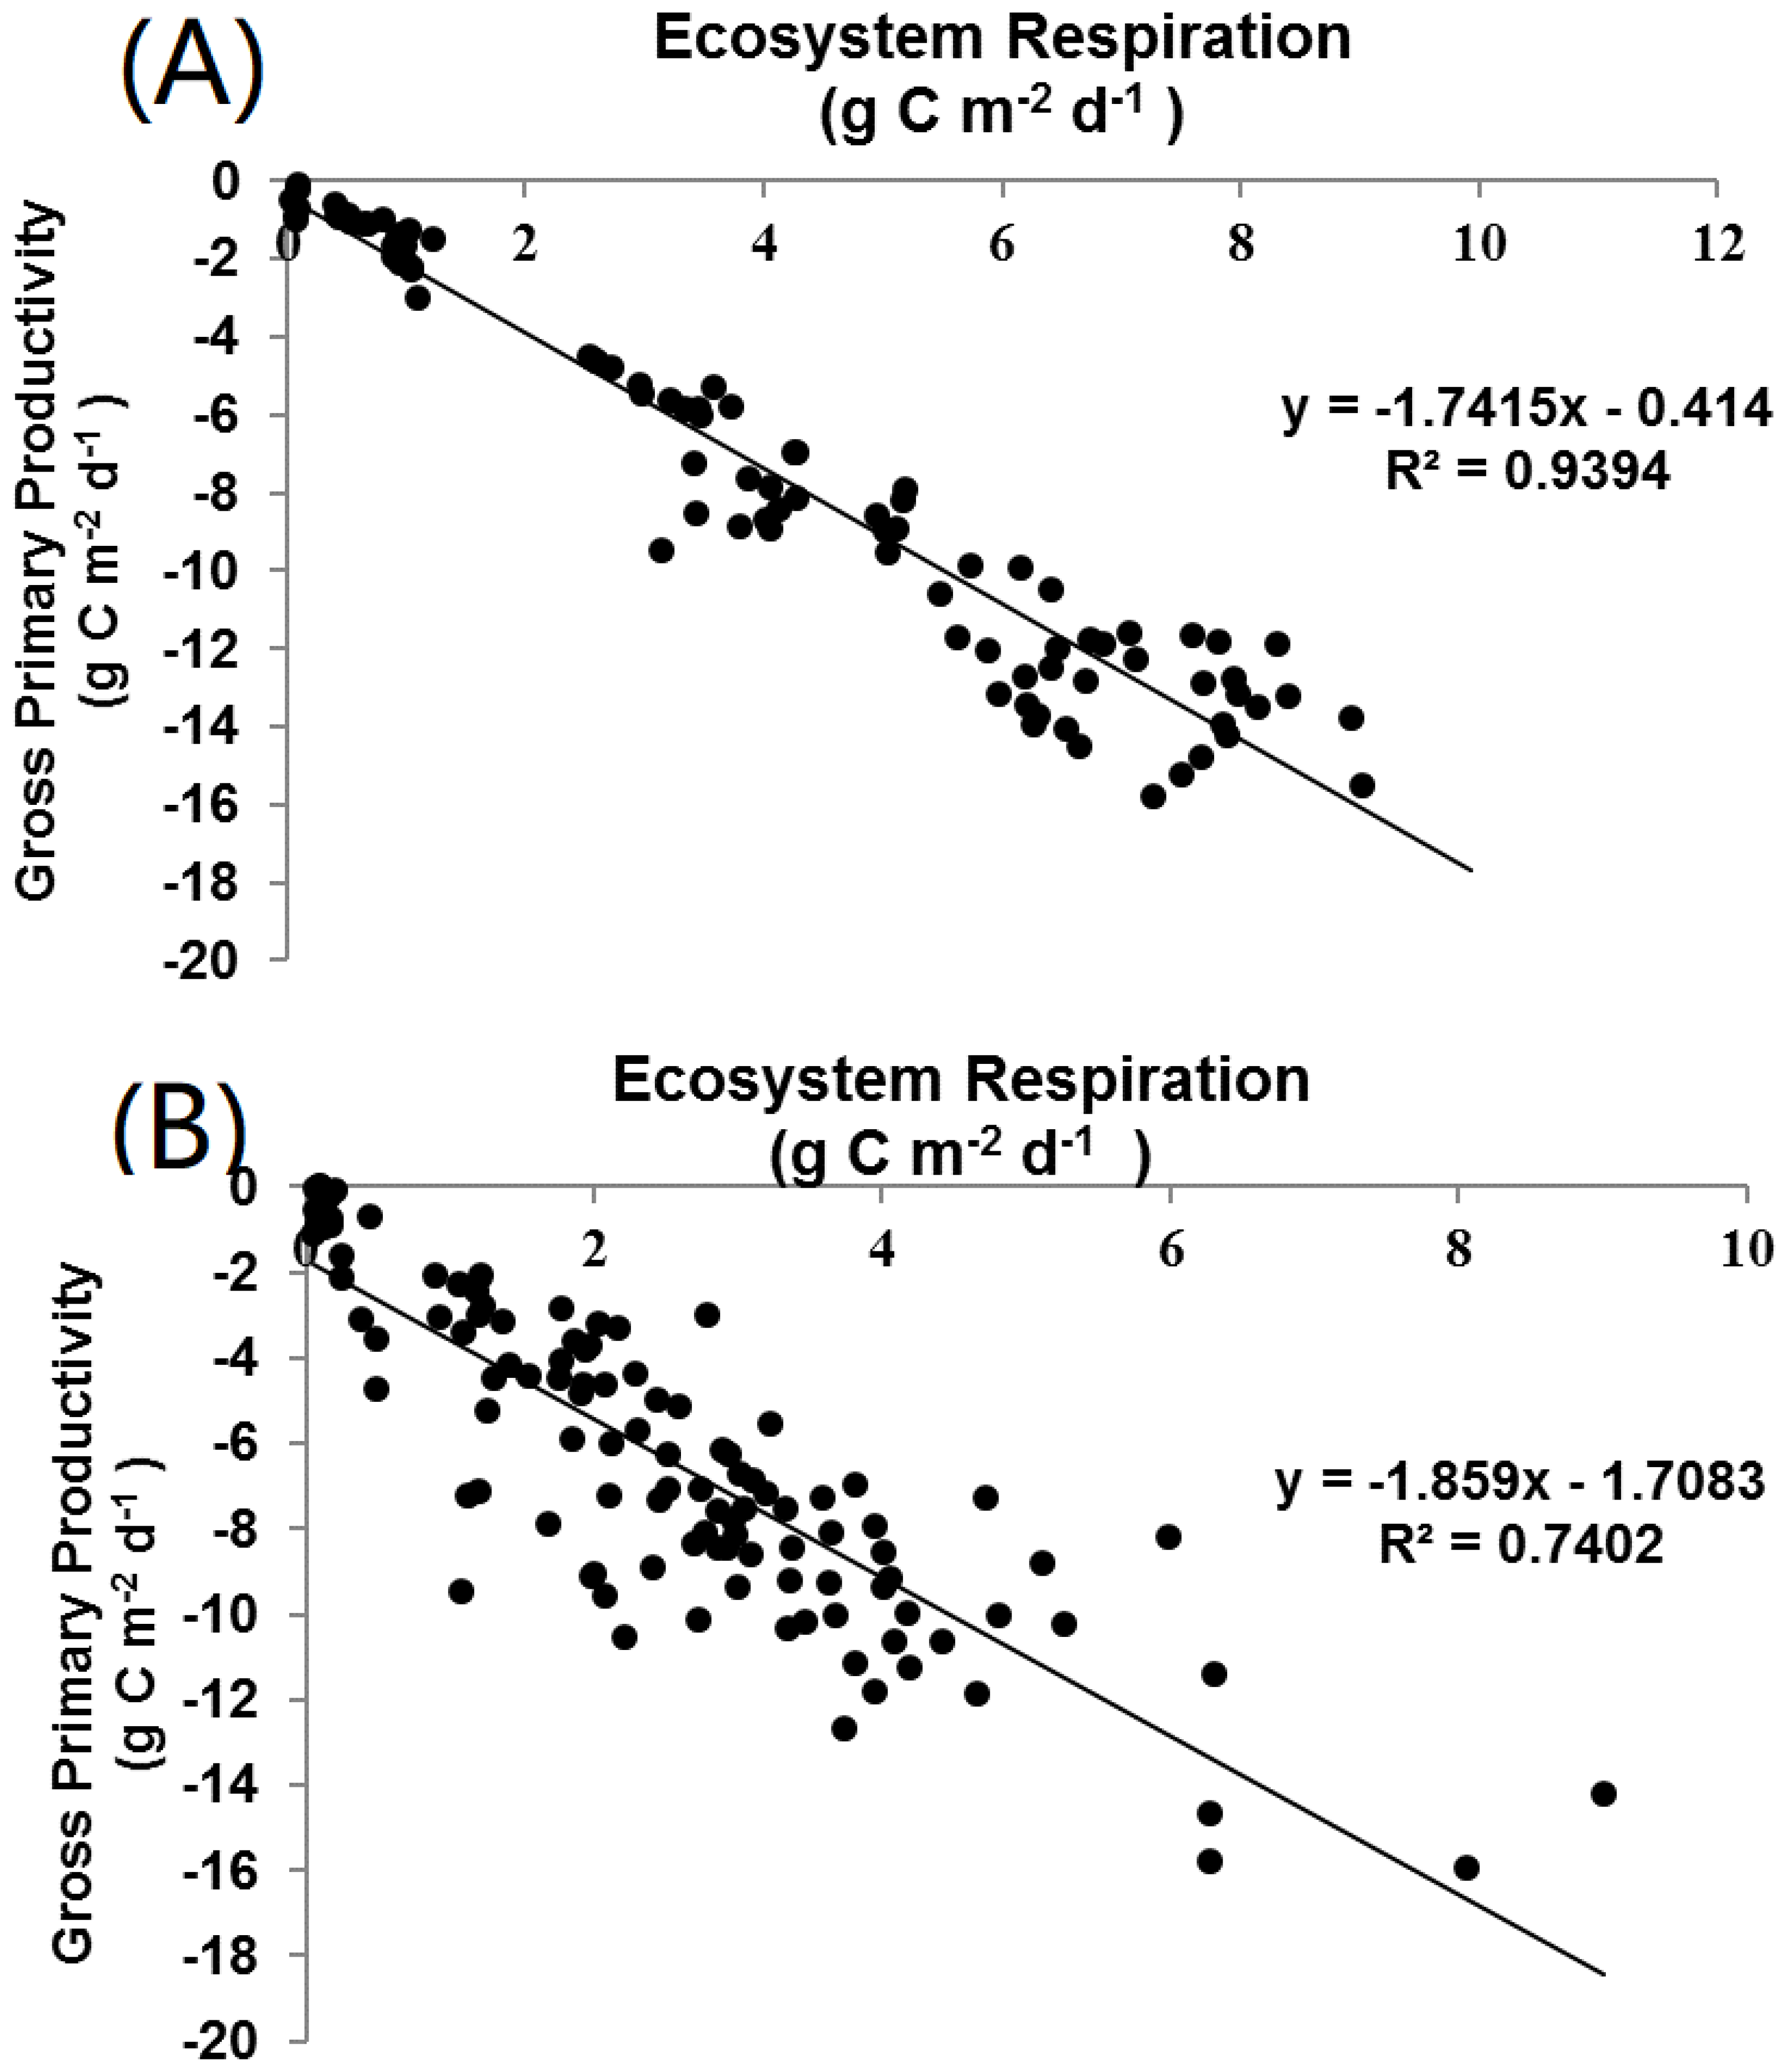
4.5. Relation between GPP and RE

The RE was positively correlated with GPP in both rice (0.917, p < 0.01) and wheat (0.698, p < 0.01) (Table 2). The regression relation between daily GPP and RE in rice and wheat over the crop season was positive, i.e., the higher the GPP (uptake of CO2) the higher the RE (CO2 release) (Figure 6). The strength of this relationship in both the crops was highly significant (p < 0.01), though a higher R2 of 0.94 was obtained in rice than the R2 of 0.74 in wheat. Thus, plants respire more with increased photosynthesis in order to achieve higher growth and maintenance, thereby increasing the GPP. The maximum GPP and RE rates of 14.42 and 5.23 g CO2 m−2 d−1 in rice and 15.66 g C m−2 d−1 and 7.3 g CO2 m−2 d−1, respectively, in wheat were observed at the heading stage in our study. These were much less as compared to the maximum GPP rates of 70.8, 59.8, 41.7, 41.8 g CO2 m−2 d−1 and the maximum RE rates of 27.5, 32.3, 19.4, 28.7 g CO2 m−2 d−1 observed in the maize cropland, orchard, wetland and vegetable field ecosystems, respectively, by Zhang et al. [38]. The higher GPP in maize was due to the greater carbon assimilation capacities at the different growth stages of the maize. With a greater leaf area, maize had a greater ability to absorb PAR and this increased its CO2 uptake capacity. The differences in RE were mainly due to the variations in air temperature, soil moisture and canopy radiative temperature.
The cumulative RE at our site was 386.81 g C m−2 in rice, whereas it was much lower at 303.89 g C m−2 in wheat (Table 4), even though wheat has a longer duration of growth. Higher cumulative RE in rice of 521 and 743 was reported in the Philippines [34] and Japan [24] (Table 4). The cumulative RE in wheat was reported to be 676 and 529 g C m−2 in winter wheat in Germany for two consecutive years by Schmidt et al. [43] (Table 4). The much higher RE at these locations was probably due to higher soil organic carbon and longer rice and winter wheat crop durations compared to at our study site.
The annual GPP and RE in our study in a subtropical semi-arid rice–wheat crop rotation system was −1725 and 832 g C m−2, whereas Bhattacharya et al. [19] recorded an annual GPP and RE of −1340 and +883 g C m−2, respectively, in a tropical humid rice–rice system. A lower annual GPP and RE of −1174, and810 g C m2, respectively, was reported in wheat and −1008, and 872 g C m2 in maize in the North China Plain by Zhang et al. [55].
The RE/GPP ratio at our study site was 0.51 in rice and 0.34 in spring wheat (Table 4). The ratio obtained for rice, in the range of 0.51–0.67, is comparable in magnitude to those reported by other researchers (Table 4). The GPP/RE ratio was higher than one, which implied that the most important factor affecting the GPP was PAR and the seasonal changes in PAR explained 69% and 81% of the variability in NEE in rice and wheat, respectively. The ratio obtained for spring wheat in this study was much lower than those reported by other researchers studying winter wheat. Gifford [56] reported an RE/GPP ratio of 0.35 for spring wheat grown in Australia, which is closer to the value obtained by us.
Carbon budgets have become a powerful tool in guiding climate policy and for identifying the mitigation measures required to keep the global temperatures below 2 °C, the global average temperature increase limits set out in the United Nations Paris Agreement [57]. The Indian IGP—occupying around 10.5 Mha of area under a rice–wheat system [11]—is a carbon sink, playing an important role in the global carbon budget estimation. The global carbon budget estimation in the northern IGP has—until now—been mostly extrapolated from closed-chamber measurements in this major rice–wheat growing region. The results of our study show that when estimating the carbon sink potential in this intensively cultivated northern IGP, it must be taken into consideration that spring wheat may be a moderately stronger sink of CO2 as compared to rice in the rice–wheat crop rotation system.

5. Conclusions

The cumulative uptake of CO2 from the atmosphere by the transplanted rice was 25% lower than wheat as the RE/GPP in wheat was much lower than that in rice. Increased respiratory losses were noted as compared to wheat due to the warmer and wetter conditions during the rice growing season. The RE in rice was significantly affected by the soil temperature, whereas the air temperature significantly affected the respiratory losses in wheat. Fluctuations in α and Pmax were the most important drivers of CO2 uptake at the different growth stages in both rice and wheat. The highest CO2 uptake levels were observed at the heading stage in both the crops. Seasonal changes in PAR explained 69% and 81% of the variability in the daytime NEE in rice and wheat, respectively. The seasonal NEE fluxes were strongly determined by the development of the crop canopy and CO2 uptake became dominant during the late vegetative to reproductive stages, turning the wheat and rice field into a carbon sink up until the ripening stage. The fields acted as a CO2 source around the late maturity and harvesting stage of rice and wheat, when the daily NEE turned positive due to declining photosynthetic activity and enhanced ecosystem respiration from the soil. Intercrop variability in NEE and GPP values were mainly controlled by PAR and AT. The GPP was observed to be positively correlated with RE in both rice and wheat. Rice contributed 39%, 55.9% and 46.2% to the annual totals of NEE, RE and GPP, respectively, while spring wheat contributed 61%, 44.1% and 53.8%. The integrated cumulative NEE, RE and GPP for the annual rice–spring wheat rotation including the fallow period were −894.16, 832.39 and 1724.55 g C m−2, respectively. The annual GPP/RE ratio for the rice-spring wheat sequence was observed to be 0.48. The RE/GPP ratio of spring wheat was lower as compared to earlier studies in winter wheat due to its shorter crop duration and irrigated conditions, which ensured the availability of soil moisture. The present results are most valuable in the context of the global carbon budget estimation, which, so far, have mostly been extrapolated from closed-chamber measurements in this major rice–wheat growing region.

Author Contributions

The authors have made the following declaration about their contributions. Conceptualization: A.B., H.P. and V.K.S.; methodology and structure: A.K., A.B. and V.K.S.; formal analysis of data: A.B., A.K. and V.K.S.; data curation and table preparation: A.B. and A.K.; contribution in their respective specialization in different sections: A.K., A.B. and V.K.S.; funding acquisition: H.P.; project administration: H.P. and A.B.; software: N.J.; the original draft preparation: A.K., A.B. and V.K.S.; edited and finalized the manuscript: A.B., A.K., V.K.S., H.P. and R.T.; All authors have read and agreed to the published version of the manuscript.

Funding

This research was funded by the Project No. IARI-12-115 titled “National Innovations in Climate Resilient Agriculture” financed by Indian Council of Agricultural Research, Ministry of Agriculture and Farmer’s Welfare, Government of India.

Acknowledgments

Authors thank the Director Indian Agricultural Research Institute, New Delhi and National Innovation on Climate Resilient Agriculture (NICRA) project, Indian Council of Agricultural research, Ministry for Environment, Forest and Climate Change, MOEFCC, Government of India for providing support to carry out this research.

Conflicts of Interest

The authors declare no conflict of interest.

References

  1. Bhatia, A.; Kumar, A.; Kumar, V.; Jain, N. Low carbon option for sustainable agriculture. Ind. Farm. 2013, 63, 18–22. [Google Scholar]
  2. IPCC, Climate Change. The Physical Science Basis. Contribution of Working Group I to the Fifth Assessment Report of the Intergovernmental Panel on Climate Change; Stocker, T.F., Qin, D., Eds.; Cambridge University Press: Cambridge, UK; New York, NY, USA, 2013; p. 1535. [Google Scholar]
  3. Kumar, A.; Bhatia, A.; Fagodiya, R.K.; Malyan, S.K.; Meena, B.L. Eddy Covariance Flux Tower: A Promising Technique for Greenhouse Gases Measurement. Adv. Plants Agric. Res. 2017, 7, 00263. [Google Scholar]
  4. Bhattacharyya, R.; Bhatia, A.; Das, T.K.; Lata, S.; Kumar, A.; Tomer, R.; Singh, G. Aggregate-associated N and global warming potential of conservation agriculture-based cropping of maize-wheat system in the north-western Indo-Gangetic Plains. Soil Till. Res. 2018, 182, 66–77. [Google Scholar] [CrossRef]
  5. Kumar, A.; Tomer, R.; Bhatia, A.; Jain, N.; Pathak, H. Greenhouse Gas Mitigation in Indian Agriculture in Agro-Technologies for Adaptation to Climate Change; Pathak, H., Chakrabarti, B., Eds.; CESCRA, IARI: New Delhi, India, 2015. [Google Scholar]
  6. Kumar, A.; Sharma, M.P.; Taxak, A.K. Effect of Vegetation Communities and Altitudes on the Soil Organic Carbon Stock in Kotli Bhel-1A Catchment, India. CLEAN Soil Air Water 2017, 45, 1600650. [Google Scholar] [CrossRef]
  7. Kumar, A.; Sharma, M.P. Carbon stock estimation in the catchment of Kotli Bhel 1A hydroelectric reservoir, Uttarakhand, India. Ecotoxicol. Environ. Saf. 2016, 134, 365–369. [Google Scholar] [CrossRef]
  8. Kumar, A.; Yang, T.; Sharma, M.P. Greenhouse gas measurement from Chinese freshwater bodies: A review. J. Clean. Prod. 2019, 233, 368–378. [Google Scholar] [CrossRef]
  9. Kumar, A.; Sharma, M.P.; Yang, T. Estimation of carbon stock for greenhouse gas emissions from hydropower reservoirs. Stoch. Environ. Res. Risk Assess. 2018. [Google Scholar] [CrossRef]
  10. Sándor, R.; Ehrhardt, F.; Grace, P.; Recous, S.; Smith, P.; Snow, V.; Soussana, J.-F.; Basso, B.; Bhatia, A.; Brilli, L.; et al. Ensemble modelling of carbon fluxes in grasslands and croplands. Field Crop Res. 2020, 252, 10779. [Google Scholar] [CrossRef]
  11. Ladha, J.K.; Pathak, H.; Tirol-Padre, A.; Dawe, D. Productivity trends in intensive rice–wheat cropping systems in Asia. In Productivity and Sustainability of Rice–Wheat Systems: Issues and Impacts; ASA Spec. Publ. 65; ASA, CSSA, and SSSA: Madison, WI, USA, 2003; pp. 45–76. [Google Scholar]
  12. Chen, C.; Dan, L.I.; Zhiqiu, G.; Tang, J.; Xiaofeng, G.; Linlin, W.; Bingcheng, W. Seasonal and interannual variations of carbon exchange over a rice–wheat rotation system on the north china plain. Advan. Atmos. Sci. 2015, 32, 1365–1380. [Google Scholar] [CrossRef]
  13. Gupta, D.K.; Bhatia, A.; Kumar, A.; Chakrabarti, B.; Jain, N.; Pathak, H. Global warming potential of rice–wheat cropping system of the IGP. Ind. J. Agric Sci. 2015, 85, 807–816. [Google Scholar]
  14. Bhatia, A.; Pathak, H.; Aggarwal, P.K.; Jain, N. Trade-off between productivity enhancement and global warming potential of rice and wheat in India. Nutr. Cycl. Agroecosys. 2010, 86, 413–424. [Google Scholar] [CrossRef]
  15. Gupta, D.K.; Bhatia, A.; Das, T.K.; Singh, P.; Kumar, A.; Jain, N.; Pathak, H. Economic analysis of different greenhouse gas mitigation technologies in rice–wheat cropping system of the IGP. Curr. Sci. 2016, 110, 867–874. [Google Scholar]
  16. Gupta, D.K.; Bhatia, A.; Kumar, A.; Das, T.K.; Jain, N.; Tomar, R.; Malyan, S.K.; Fagodiya, R.K.; Dubey, R.; Pathak, H. Mitigation of greenhouse gas emission from rice–wheat system of the IGP: Through tillage, irrigation and fertilizer management. Agric. Ecosyst. Environ. 2016, 230, 1–9. [Google Scholar] [CrossRef]
  17. Sage, R.F.; Kubien, D.S. The temperature response of C3 and C4 photosynthesis. Plant Cell Environ. 2007, 30, 1086–1106. [Google Scholar] [CrossRef]
  18. Kramer, K.; Leinonen, I.; Bartelink, H.H.; Berbigier, P.; Borghetti, M.; Bernhofer, C.; Cienciala, E.; Dolman, A.J.; Froer, O.; Gracia, C.A.; et al. Evaluation of six process-based forest growth models using eddy-covariance measurements of CO2 and H2O fluxes at six forest sites in Europe. Global Chang. Biol. 2002, 8, 213–230. [Google Scholar] [CrossRef]
  19. Bhattacharya, P.; Neogi, S.; Roy, K.S.; Dash, P.K.; Tripathi, R.; Rao, K.S. Net ecosystem CO2 exchange and carbon cycling in tropical lowland flooded-rice ecosystem. Nutr. Cycl. Agroecosys. 2013, 95, 133–144. [Google Scholar] [CrossRef]
  20. Alberto, M.C.R.; Hirano, T.; Miyata, A.; Wassmann, R.; Kumar, A.; Padre, A.; Amante, M. Influence of climate variability on seasonal and inter-annual variations of ecosystem CO2 exchange in flooded and non-flooded rice fields in the Philippines. Field Crops Res. 2012, 134, 80–94. [Google Scholar] [CrossRef]
  21. Tseng, K.H.; Tsai, J.L.; Alagesan, A.; Tsuang, B.J.; Yao, M.H.; Kuo, P.H. Determination of methane and CO2 fluxes during the rice maturity period in Taiwan by combining profile and eddy covariance measurements. Agric. For. Meteor. 2010, 150, 852–859. [Google Scholar] [CrossRef]
  22. Hobbs, P.R.; Gupta, R.K. Resource-Conserving Technologies for Wheat in Rice Wheat Systems; NRG Web Publication; CIMMYT: México-Veracruz, Mexico, 2001. [Google Scholar]
  23. Bhatia, A.; Agarwal, P.K.; Jain, N.; Pathak, H. Greenhouse gas emission from rice and wheat-growing areas in India: Spatial analysis and upscaling. Greenhouse Gas Sci. Technol. 2012, 2, 115–125. [Google Scholar] [CrossRef]
  24. Saito, M.; Miyata, A.; Nagai, H.; Yamada, T. Seasonal variation of CO2 exchange in rice paddy field in Japan. Agric. For. Meteor. 2005, 135, 93–109. [Google Scholar] [CrossRef]
  25. Webb, E.K.; Pearman, G.I.; Leuning, R. Correction of flux measurement for density effects due to heat and water vapour transfer. J. Roy Meteor. Soc. 1980, 106, 85–100. [Google Scholar] [CrossRef]
  26. Kaimal, J.C.; Finnigan, J.J. Atmospheric Boundary Layer Flows: Their Structure and Measurement; Oxford University Press: New York, NY, USA, 1994; Volume 289. [Google Scholar]
  27. Van Dijk, A.; Kohsiek, W.; de Bruin, H.A.R. The Principles of Surface Flux Physics: Theory, Practice and Description of the ECPACK Library; Meteorology and Air Quality Group, Wageningen University: Wageningen, The Netherlands, 2004. [Google Scholar]
  28. Fan, S.M.; Wofsy, S.C.; Bakwin, P.S. Atmosphere biosphere exchange of CO2 and O3 in the central Amazon forest. J. Geophys. Res. 1990, 95, 851–864. [Google Scholar]
  29. Foken, T.; Wichura, B. Tools for quality assessment of surface-based flux measurements. Agric. For. Meteor. 1996, 78, 83–105. [Google Scholar] [CrossRef]
  30. Zhang, X.; Fan, C.; Ma, Y. Two approaches for net ecosystem carbon budgets and soil carbon sequestration in a rice-wheat rotation system in China. Nutr. Cycl. Agroecosys. 2014, 100, 301–313. [Google Scholar] [CrossRef]
  31. Hirata, R.; Hirano, T.; Saigusa, N.; Fujinuma, Y.; Inukai, K.; Kitamori, Y.; Takahashi, Y.; Yamamoto, S. Seasonal and interannual variations in CO2 exchange of a temperate larch forest. Agric. For. Meteor. 2007, 147, 110–124. [Google Scholar] [CrossRef]
  32. Taiz, L.; Zeiger, E. Plant Physiology; The Benjamin/Cummings Publishing Co., Inc.: Redwood City, CA, USA, 1991; pp. 434–436. [Google Scholar]
  33. Falge, E.; Baldocchi, D.; Olson, R.; Anthoni, P.; Aubinet, M.; Bernhofer, C.; Burba, G.; Ceulemans, R.; Clement, R.; Dolman, H. Gap-filling strategies for defensible annual sums of net ecosystem exchange. Agric. For. Meteor. 2001, 107, 43–69. [Google Scholar] [CrossRef] [Green Version]
  34. Alberto, M.C.R.; Wassmann, R.; Hirano, T.; Miyata, A.; Kumar, A.; Padre, A.; Amante, M. CO2/heat fluxes in rice fields: Comparative assessment of flooded and non-flooded fields in the Philippines. Agric. For. Meteor. 2009, 149, 1737–1750. [Google Scholar] [CrossRef]
  35. Das, D.K.; Mukherjee, J.; Vashisth, A.; Sehgal, V.K.; Singh, J. Agro-climatic Manual of Indian Agricultural Research Institute New Delhi. Division of Agricultural Physics; ICAR: New Delhi, India, 2015. [Google Scholar]
  36. Miyata, A.; Leuning, R.; Denmead, O.W.; Kim, J.; Harazano, Y. CO2 and methane fluxes from an intermittently-flooded paddy field. Agr. For. Meteor. 2000, 102, 287–303. [Google Scholar] [CrossRef]
  37. Gao, Z.; Bian, L.; Zhou, X. Measurements of turbulent transfer in the near-surface layer over a rice paddy in China. J. Geophys. Res. 2003, 108, 4387. [Google Scholar] [CrossRef]
  38. Zhang, L.; Sun, R.; Xu, Z.; Qiao, C.; Jiang, G. Diurnal and Seasonal Variations in Carbon Dioxide Exchange in Ecosystems in the Zhangye Oasis Area, Northwest China. PLoS ONE 2015, 10, e0120660. [Google Scholar] [CrossRef] [Green Version]
  39. Campbell, C.S.; Heilman, J.L.; McInnes, K.J.; Wilson, L.T.; Medley, J.C.; Wu, G.W.; Cobos, D.R. Diel and seasonal variation in CO2 flux of irrigated-rice. Agric. For. Meteor. 2001, 108, 15–27. [Google Scholar] [CrossRef]
  40. Patel, N.R.; Dadhwal, V.K.; Saha, S.K. Measurement and Scaling of Carbon Dioxide Exchanges in Wheat Using Flux-Tower and Remote Sensing. J. Ind. Soc. Remote Sens. 2011, 39, 383–391. [Google Scholar] [CrossRef]
  41. Baker, J.M.; Griffis, T.J. Examining strategies to improve the carbon balance of corn/soybean agriculture using eddy covariance and mass balance techniques. Agric. Forest Meteorol. 2005, 128, 163–177. [Google Scholar] [CrossRef]
  42. Li, J.; Yu, Q.; Sun, X.M.; Tong, X.J.; Ren, C.Y.; Wang, J.; Liu, E.; Zhu, Z.; Yu, G. Carbon dioxide exchange and the mechanism of environmental control in a farmland ecosystem in North China plain. Sci. China Ser. D 2006, 49, 226–240. [Google Scholar] [CrossRef]
  43. Schmidt, M.; Reichenaua, T.G.; Fienerc, P.; Schneider, K. The carbon budget of a winter wheat field: An eddy covariance analysis of seasonal and inter-annual variability. Agric. For. Meteor. 2012, 165, 114–126. [Google Scholar] [CrossRef]
  44. Moureaux, C.; Debacq, A.; Bodson, B.; Heinesch, B.; Aubinet, M. Annual net ecosystem carbon exchange by a sugar beet crop. Agric. For. Meteorol. 2006, 139, 25–39. [Google Scholar] [CrossRef]
  45. Amthor, J.S. The McCree—de Wit—Penning de Vries—Thornley respiration paradigms: 30 years later. Ann. Bot. 2000, 86, 1–20. [Google Scholar] [CrossRef] [Green Version]
  46. Béziat, P.; Ceschia, E.; Dedieu, G. Carbon balance of a three crop succession over two cropland sites in South West France. Agric. For. Meteor. 2009, 149, 1628–1645. [Google Scholar] [CrossRef] [Green Version]
  47. Gitelsona, A.A.; Penga, Y.; Arkebauer, T.J.; Suyker, A.E. Productivity absorbed photosynthetically active radiation, and light use efficiency in crops: Implications for remote sensing of crop primary production. J. Plant. Physiol. 2015, 177, 100–109. [Google Scholar] [CrossRef] [Green Version]
  48. Bao, X.; Li, Z.; Xie, F. Environmental influences on light response parameters of net carbon exchange in two rotation croplands on the North China Plain. Sci. Rep. 2019, 9, 18702. [Google Scholar] [CrossRef]
  49. Shirke, P.A.; Pathre, U.V. Influence of leaf-to-air vapour pressure deficit (VPD) on the biochemistry and physiology of photosynthesis in Prosopis juliflora. J. Exp. Bot. 2004, 55, 2111–2120. [Google Scholar] [CrossRef]
  50. Baldocchi, D. A comparative-study of mass and energy-exchange rates over a closed C3 and an open C4 crop. Agric. For. Meteor. 1994, 67, 291–321. [Google Scholar] [CrossRef]
  51. Mielnik, P.C.; Dugas, W.A. Soil CO2 flux in a tall grass prairie. Soil Biol. Biochem. 2000, 32, 221–228. [Google Scholar] [CrossRef]
  52. Mowjood, M.I.M.; Ishiguro, K.; Kasubuchi, T. Effect of convection in ponded water on the thermal regime of a paddy field. Soil Sci. 1997, 162, 583–587. [Google Scholar] [CrossRef]
  53. Long, S.P. Modification of the response of photosynthetic productivity to rising temperature by atmospheric CO2 concentration: Has its importance been underestimated? Plant Cell Environ. 1991, 14, 729–739. [Google Scholar] [CrossRef]
  54. Atkin, O.K.; Edwards, E.J.; Loveys, B.R. Response of root-respiration to changes in temperature and its relevance to global warming. New. Phytol. 2008, 147, 141–154. [Google Scholar] [CrossRef]
  55. Zhang, Q.; Lei, H.; Yang, D.; Xiong, L.; Liu, P.; Fang, B. Decadal variation in CO2 fluxes and its budget in a wheat and maize rotation cropland over the North China Plain. Biogeosciences 2020, 17, 2245–2262. [Google Scholar] [CrossRef] [Green Version]
  56. Gifford, R.M. Whole plant respiration and photosynthesis of wheat under increased CO2 concentration and temperature: Long-term vs. short-term distinctions for modeling. Glob. Chang. Biol. 1995, 1, 385–396. [Google Scholar] [CrossRef]
  57. Rogelj, J.; Forster, P.M.; Kriegler, E.; Smith, C.J.; Séférian, R. Estimating and tracking the remaining carbon budget for stringent climate targets. Nature 2019, 571, 335–342. [Google Scholar] [CrossRef] [Green Version]
Figure 1. Variations in (A) relative humidity and soil moisture (B) air temperature and soil moisture during the study period.
Land 10 00701 g001
Figure 2. Daytime and nighttime net ecosystem exchange (NEE) in rice and wheat over the crop season.
Land 10 00701 g002
Figure 3. (A). Diurnal variation in NEE (empty circle) and incident photosynthetically active radiation (PAR) (filled circle) at half hourly interval, averaged for different rice growth stages. (B). Diurnal variation in NEE of CO2 (empty circle) and incident PAR (filled circle) at half hourly interval, averaged for different wheat growth stages.
Land 10 00701 g003aLand 10 00701 g003b
Figure 4. Daily mean net ecosystem exchange (NEE), gross primary productivity (GPP) and ecosystem respiration (RE) at different growth stages of rice (A) and wheat (B) in northwestern Indo-Gangetic Plains (IGP).
Land 10 00701 g004
Figure 5. Average diurnal pattern of relative humidity (RH), air temperature (AT), soil temperature (ST), soil heat flux (SHF), net radiation (NR)and PAR in rice (empty circle) and wheat (filled circle).
Land 10 00701 g005
Figure 6. Scatter plot of daily ecosystem respiration (RE) and gross primary productivity (GPP) in (A) rice and (B) wheat over the crop season.
Land 10 00701 g006
Table 1. NEE, RE and GPP at different rice and wheat growing stages.
Crop/StageCrop/Stage Duration (Days)Rate (g C m−2 d−1)Cumulative (g C m−2)
WheatRiceWheatRiceWheatRiceWheatRiceWheatRiceWheatRiceWheatRice
NEEREGPPNEEREGPP
Pre-sowing/Pre-transplanting440.690.880.70.890.010.012.763.522.83.560.040.04
Sowing-germination/Post-Transplanting96−0.27−0.210.120.110.390.32−2.43−1.261.080.663.511.92
Early Vegetative Stage1114−1.28−0.310.790.422.070.73−14.08−4.348.695.8822.7710.22
Tillering2711−3.6−2.252.010.995.613.24−97.2−24.7554.2710.89151.4735.64
Stem Elongation2819−6.63−3.413.213.539.846.94−185.64−64.7989.8867.07275.52131.86
Booting1013−8.1−6.543.776.7111.8713.25−64.8−85.0230.1687.2394.96172.25
Heading1518−10.43−7.125.237.315.6614.42−125.16−128.1662.76131.44187.92259.56
Ripening1517−4.34−3.42.854.927.188.32−86.8−57.857.0583.64143.6141.44
Harvest220.460.351.040.860.580.510.920.72.081.721.161.02
Average/Total (Crop period)11598−5.01−3.742.643.227.657.68−576−368304387880753
Fallow (after)91610.40.280.871.020.510.7432.7617.0879.1762.2246.4145.14
Table 2. Partial correlation coefficient between ecosystem respiration (RE), gross primary productivity (GPP) and related environmental variables.
Environmental VariablesEcosystem Respiration (RE)Environmental VariablesGross Primary Productivity (GPP)
Rice (N = 4712)Wheat (N = 5472)Rice (N = 4712)Wheat (N = 5472)
AT0.060 ns0.294 **AT0.129 *0.443 **
ST0.543 **0.010 nsPAR0.225 **0.348 **
SM−0.088 ns−0.322 **VPD−0.315 **−0.147 ns
SHF0.084 ns0.111 nsNR0.248 *0.099 ns
RH0.140 ns−0.121 nsSM0.172 ns0.471 **
GPP0.917 **0.698 **
For each pair of correlation all the other variables in the column are the covariates; * Significant at (p < 0.05); ** Significant at (p < 0.01); ns = non-significant; N is number of observations.
Table 3. Apparent ecosystem quantum yield (α), the hypothetical maximum of GPP (Pmax), at different growth stages in rice and wheat.
Growth StageRiceWheat
α (mg CO2 µmolephoton−1)Pmax (mg CO2 m−2s−1)R2α (mg CO2 µmole photon−1)Pmax (mg CO2 m−2s−1)R2
EVS0.00070.3470.670.00080.4610.61
LVS/Tillering0.00120.6420.840.00140.7070.69
SE/MT-PI0.00161.3340.700.00171.4690.73
Booting0.00222.4120.820.00222.2030.89
Heading0.00231.9090.910.00262.8410.70
Ripening0.00180.9380.760.00201.3180.88
Table 4. Net ecosystem exchange (NEE), ecosystem respiration (RE) and gross primary productivity (GPP) at different rice and wheat sites.
LocationClimateNEEGPPRERE/GPPReference
RiceInternational Rice Research Institute, PhilippinesTropical−258−7785210.67[34]
Mase paddy site, JapanTropical−396−11407430.65[24]
Central Rice Research Institute, Cuttak, IndiaSub-tropical monsoon−448−8113630.44[19]
North China Plain, ChinaSubtropical semi-humid monsoon−583
−512
−451
−1220
−1135
−859
637
623
459
0.52
0.54
0.53
[12]
Indian Agricultural Research Institute, New Delhi, IndiaSub-tropical, semi-arid−368−7533870.51Present study
WheatSelhausen test site, Germany (First Year)Temperate−627−13046760.51[43]
Selhausen test site, Germany (Second Year)Temperate−537−10675290.49[43]
North China Plain, ChinaSubtropical semi-humid monsoon climate−438
−431
−987
−966
552
538
0.56
0.56
[12]
Indian Agricultural Research Institute, New Delhi, IndiaSubtropical semi-arid−576−8883040.34Present study
Publisher’s Note: MDPI stays neutral with regard to jurisdictional claims in published maps and institutional affiliations.

