
Monitoring and Modeling the Patterns and Trends of Urban Growth Using Urban Sprawl Matrix and CA-Markov Model: A Case Study of Karachi, Pakistan

 ,
,  , ,
, ,  ,
,
Abstract
:1. Introduction
2. Study Area and Datasets
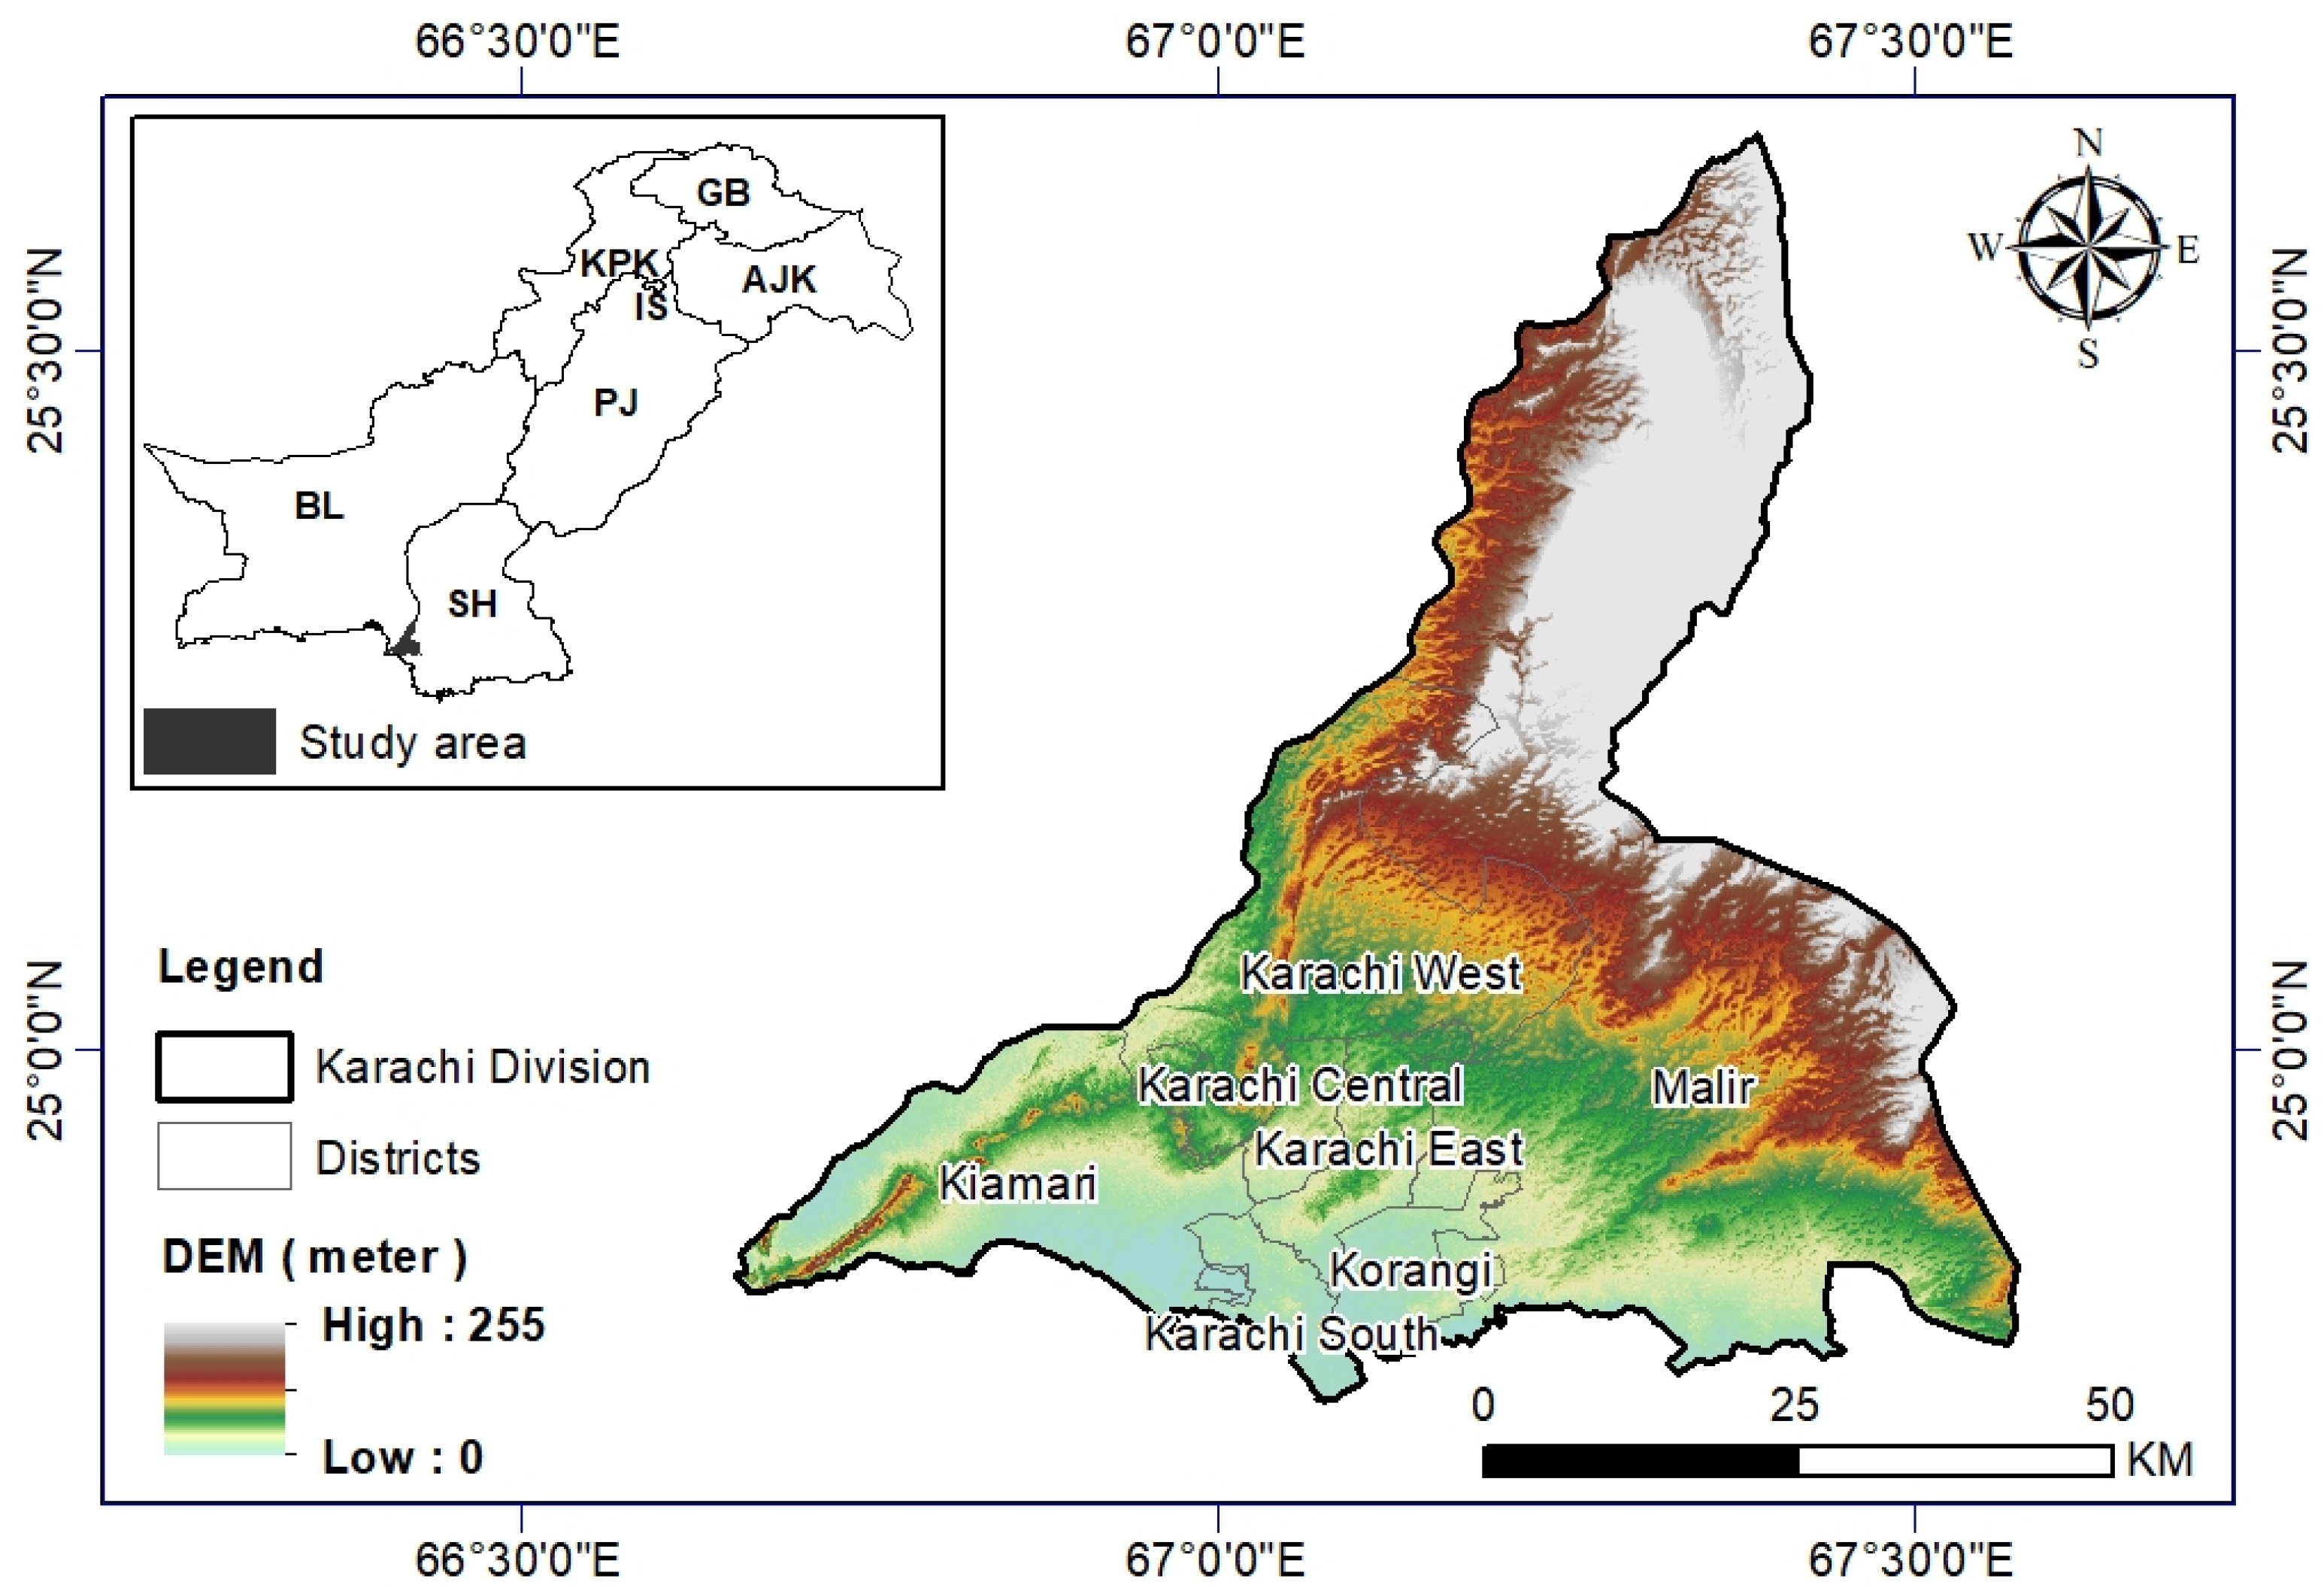
2.1. Study Area
2.2. Datasets
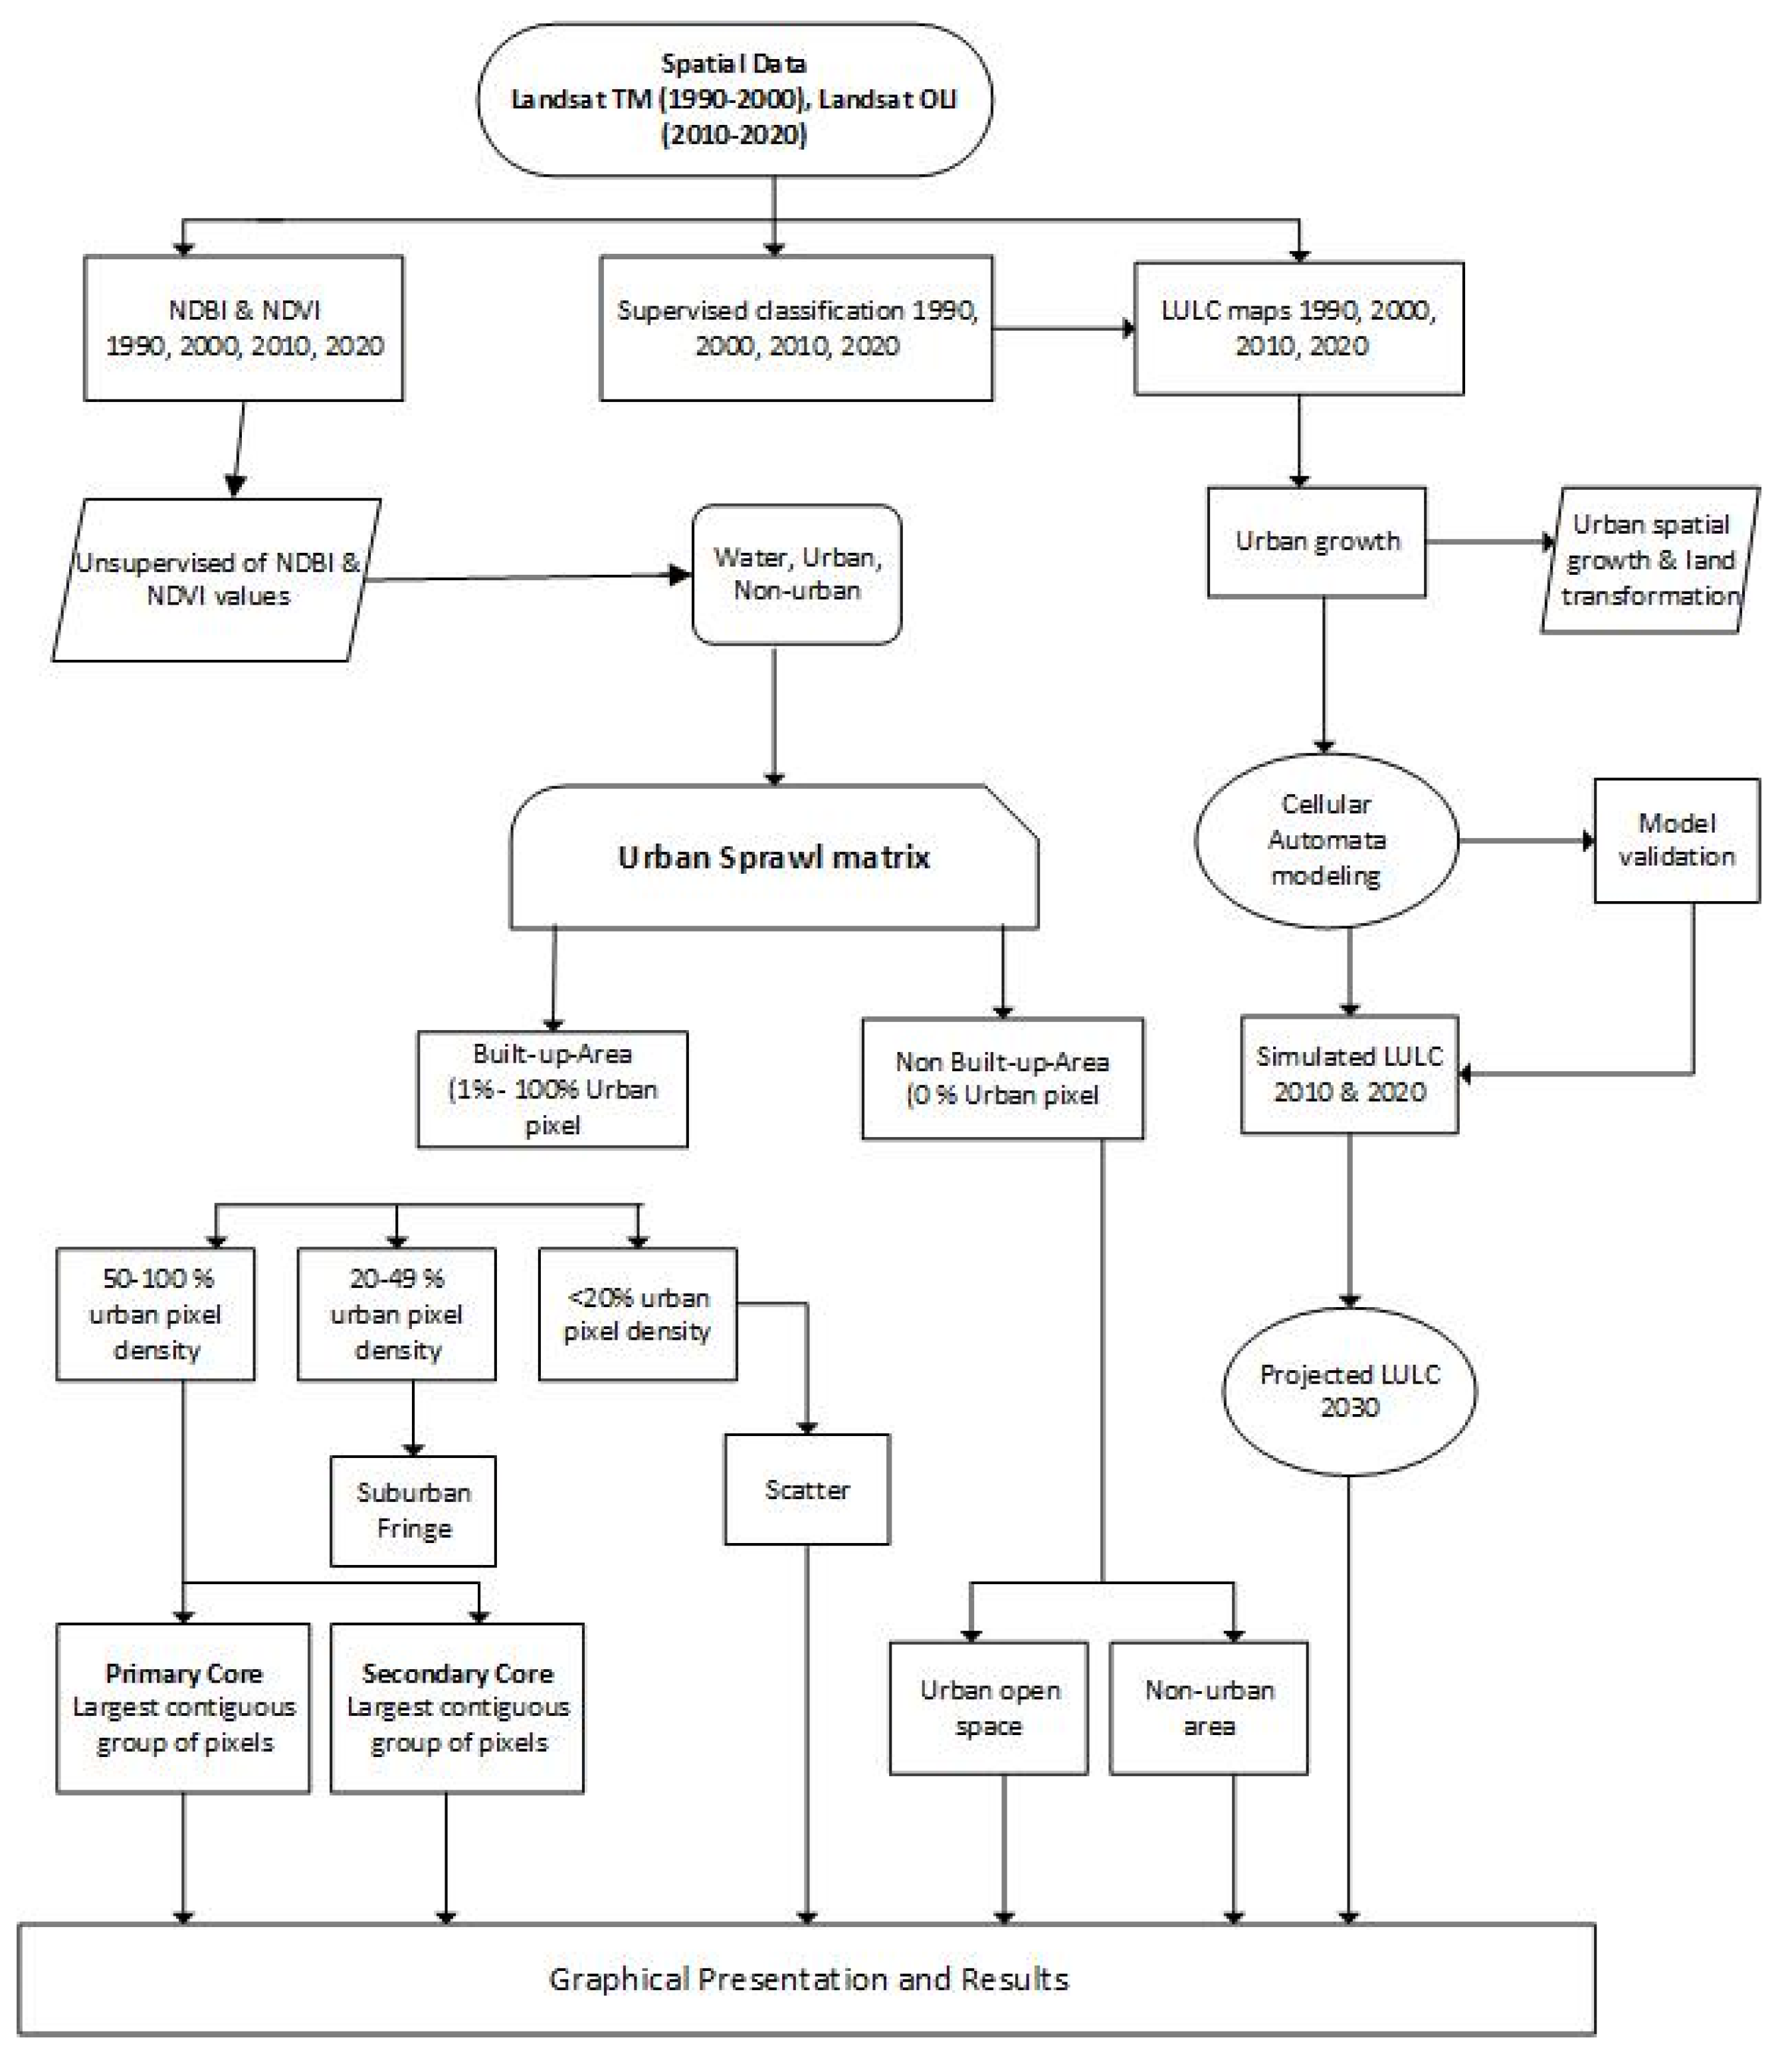
3. Methods
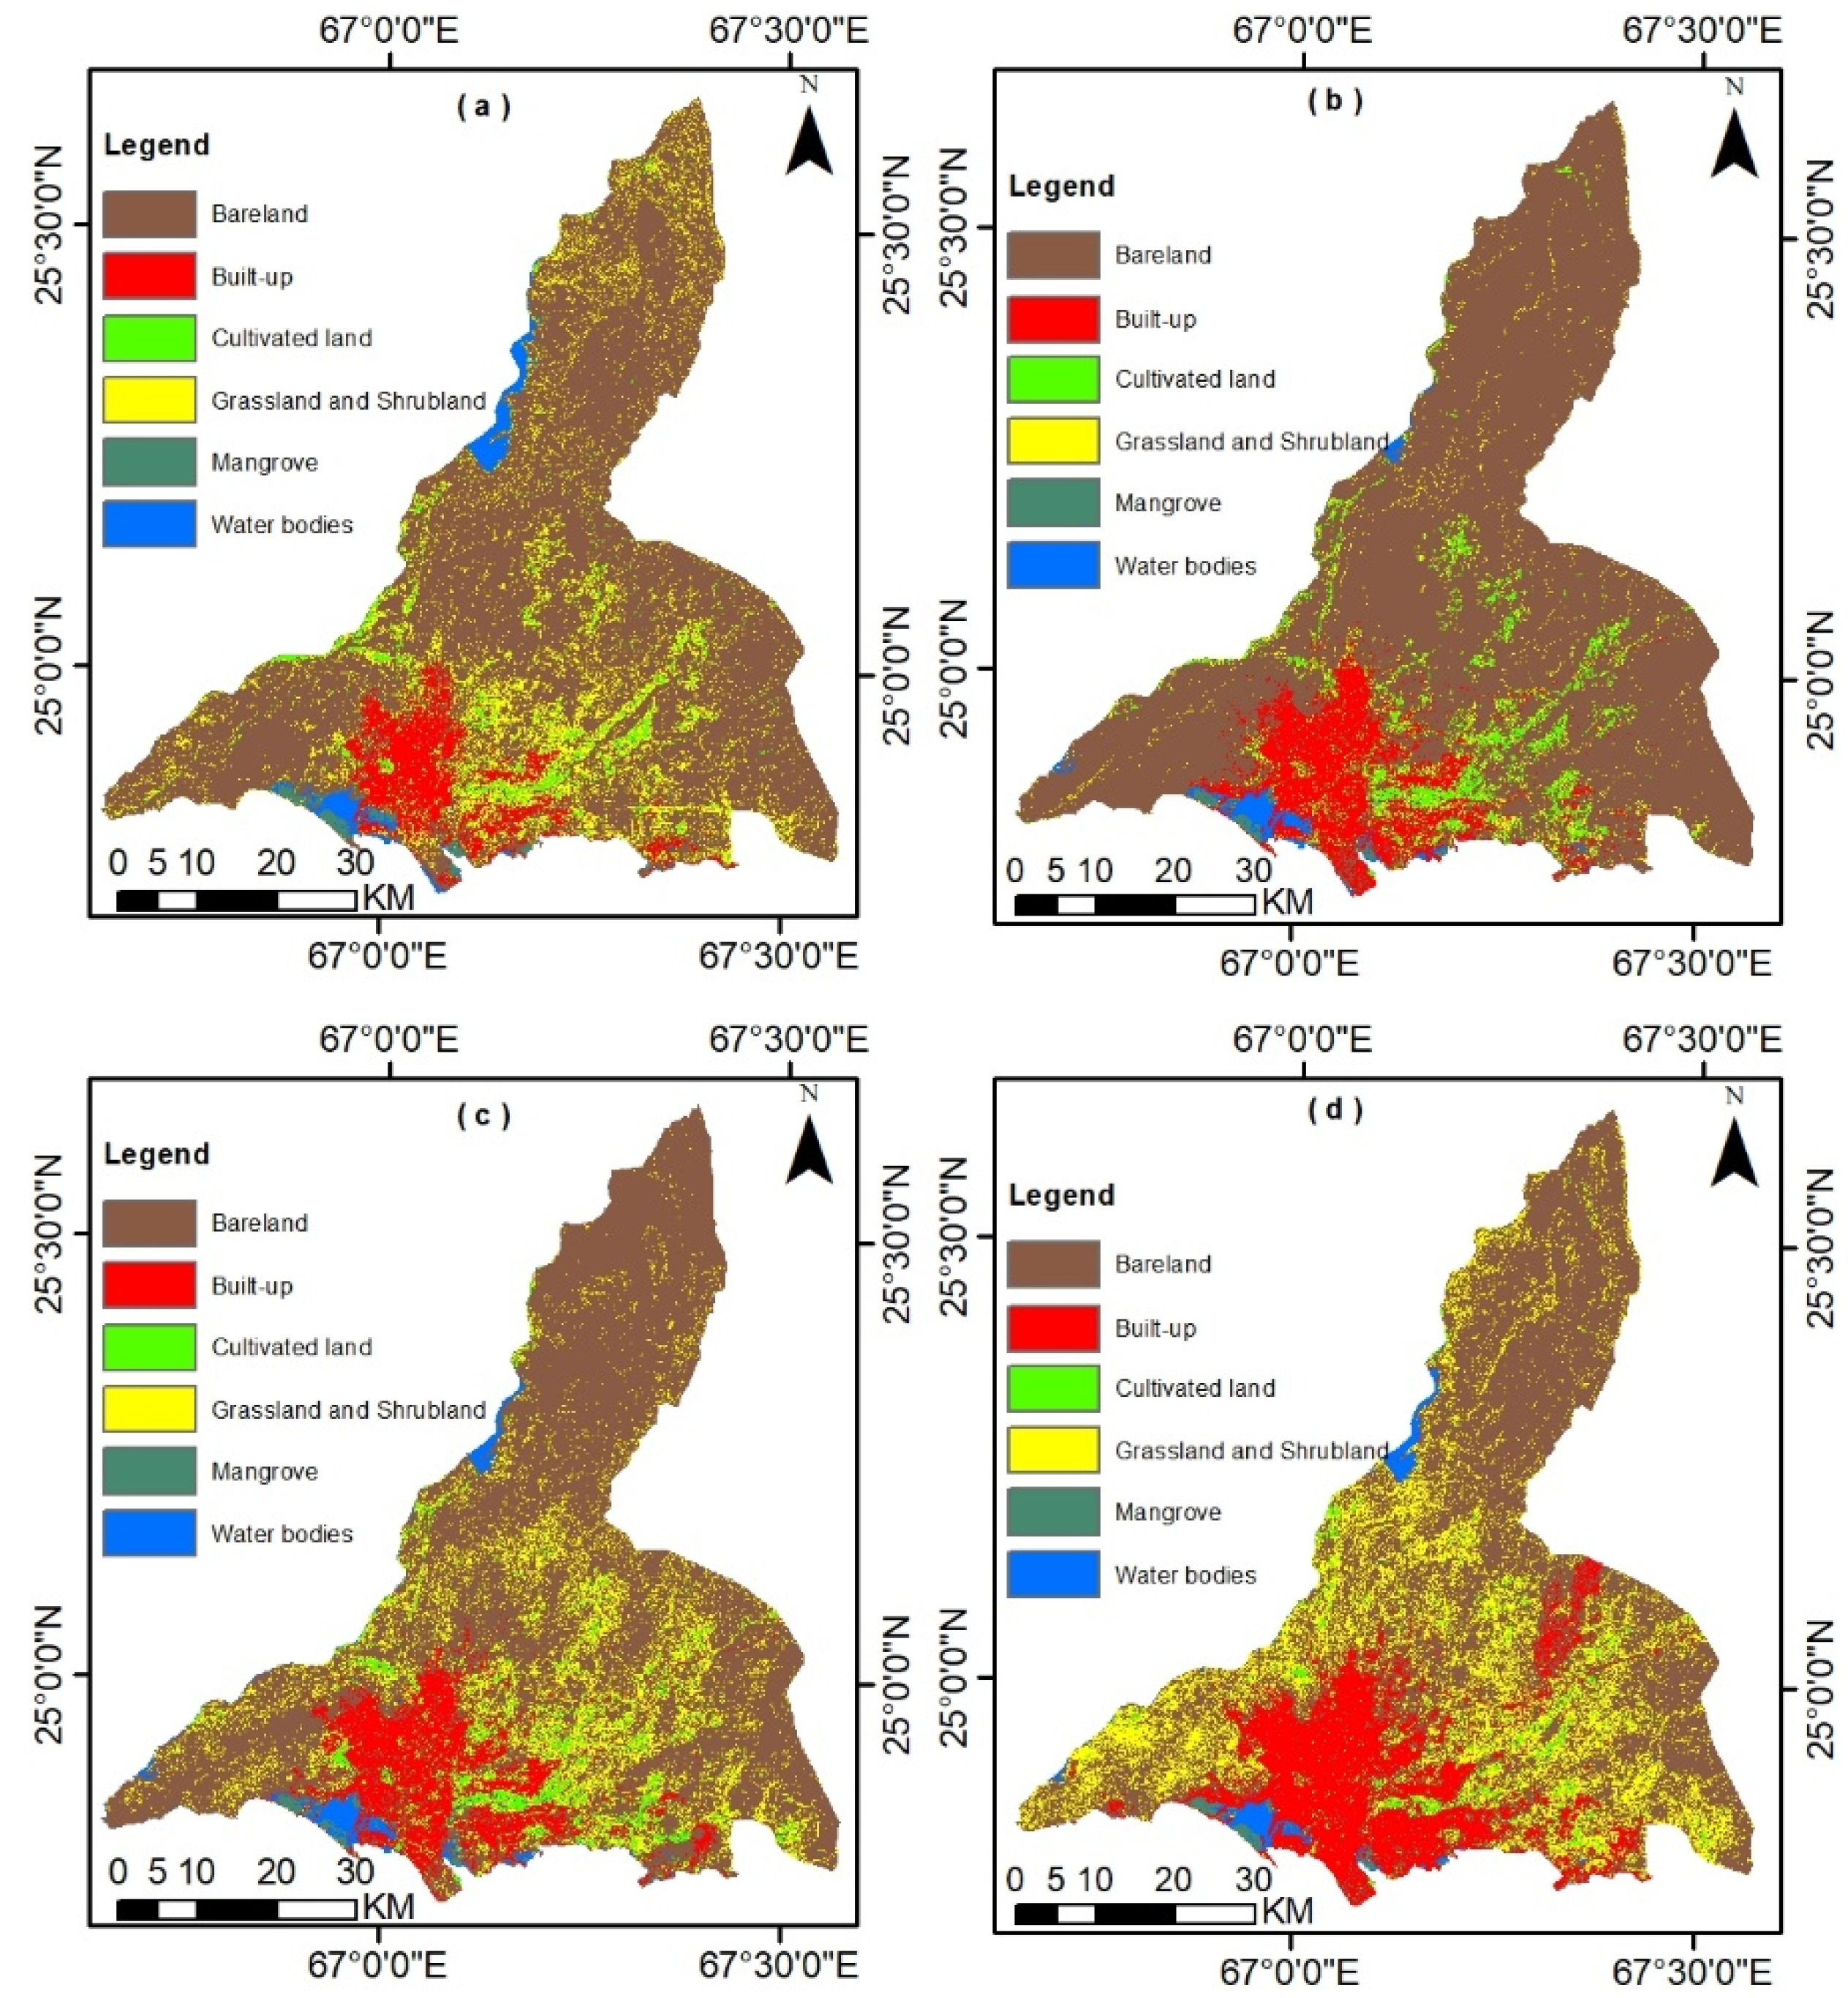
3.1. Land Use/Land Cover Classification
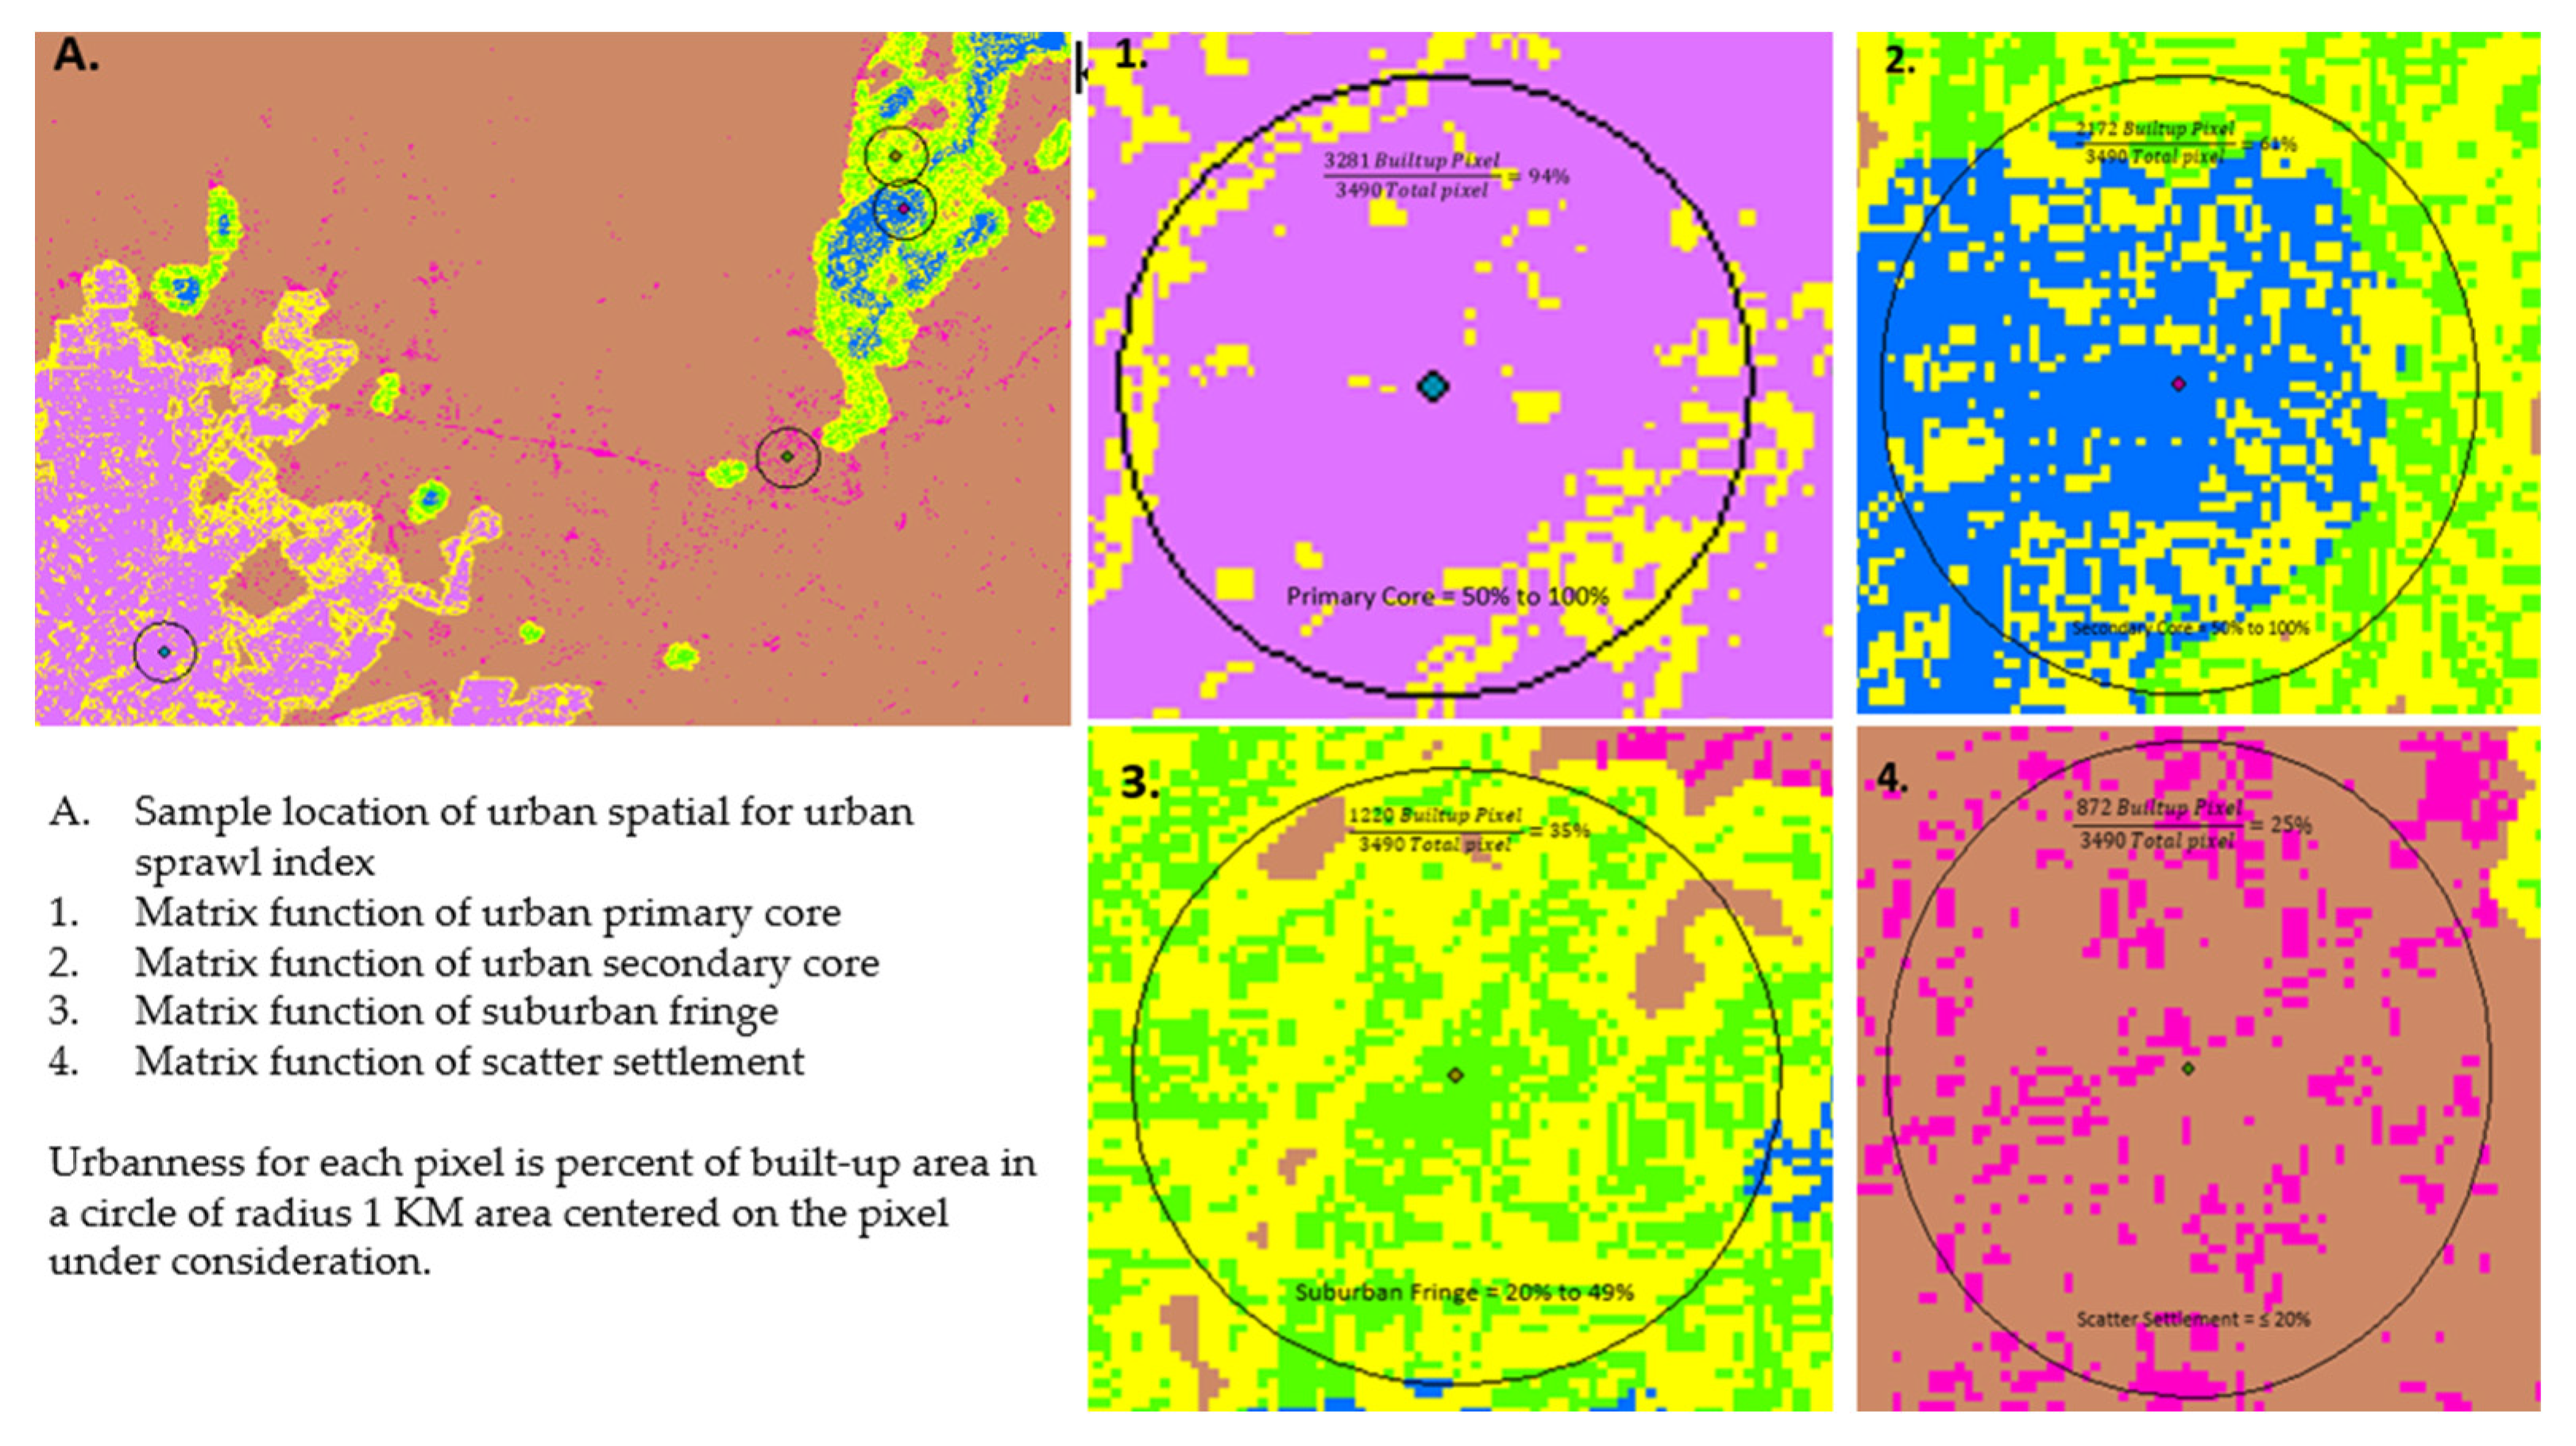
3.2. Urban Landscape Change Analysis
3.3. LULC Simulation
4. Results and Discussion
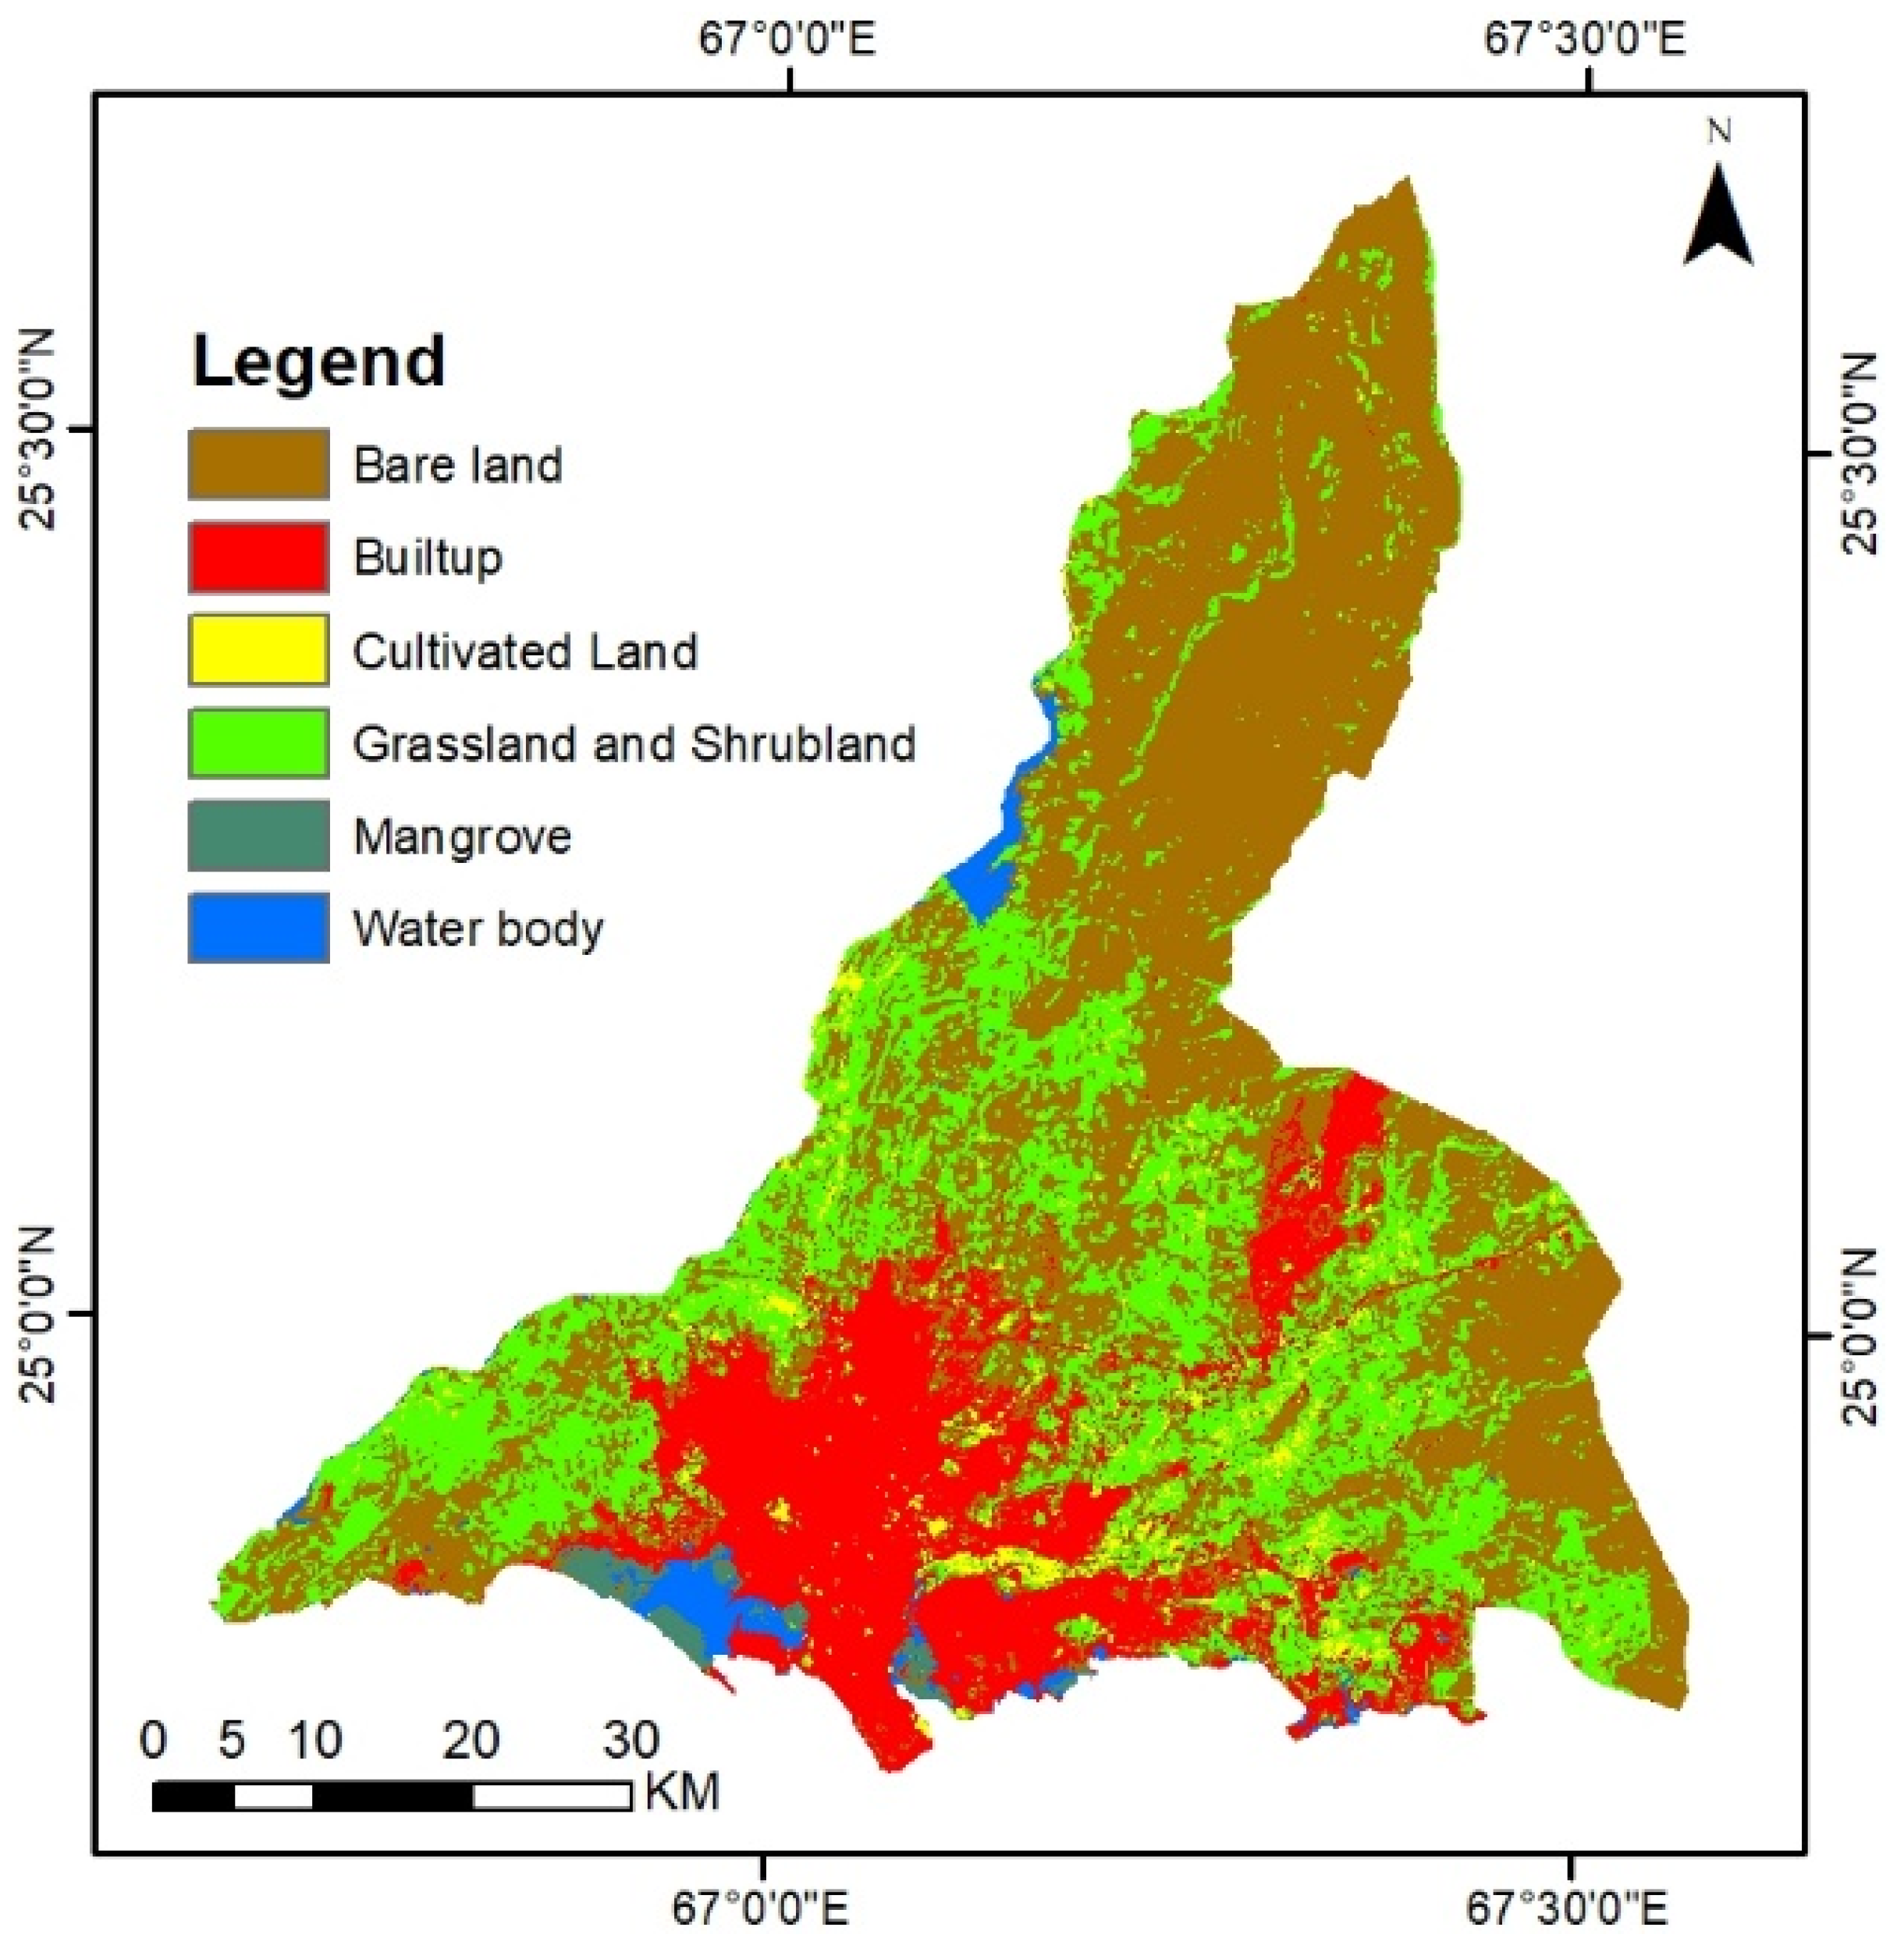
4.1. LULC Change
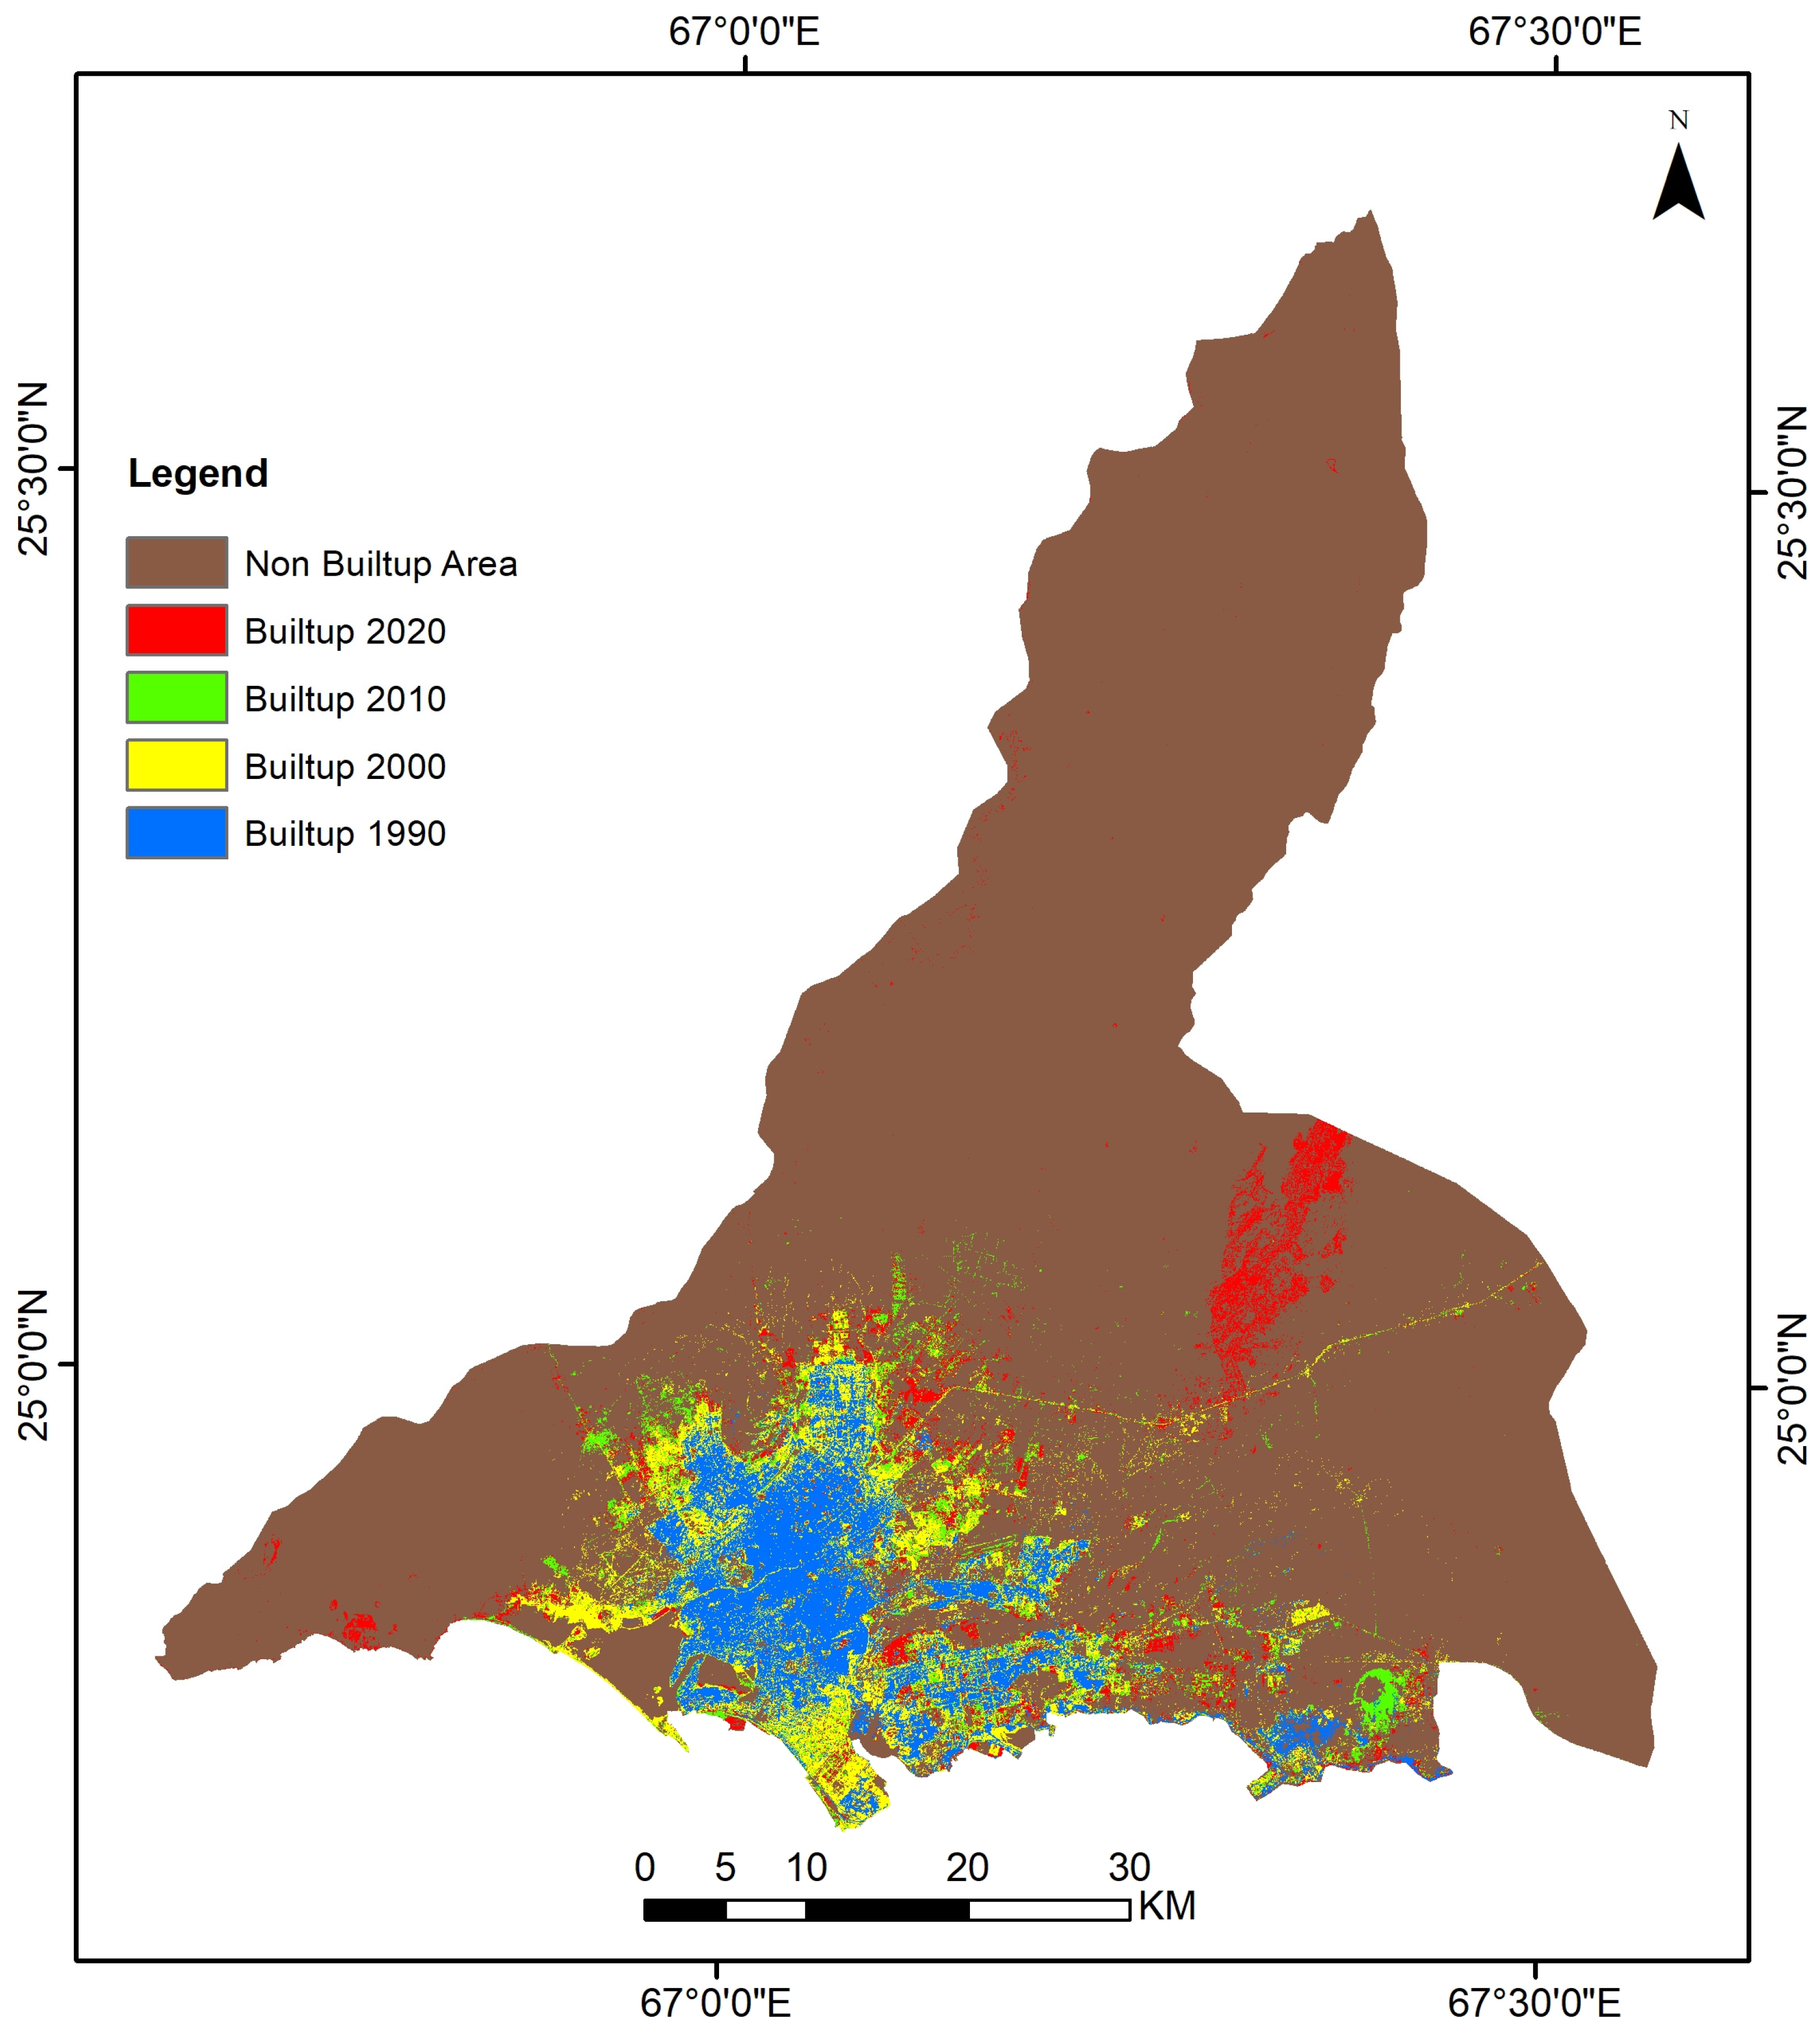
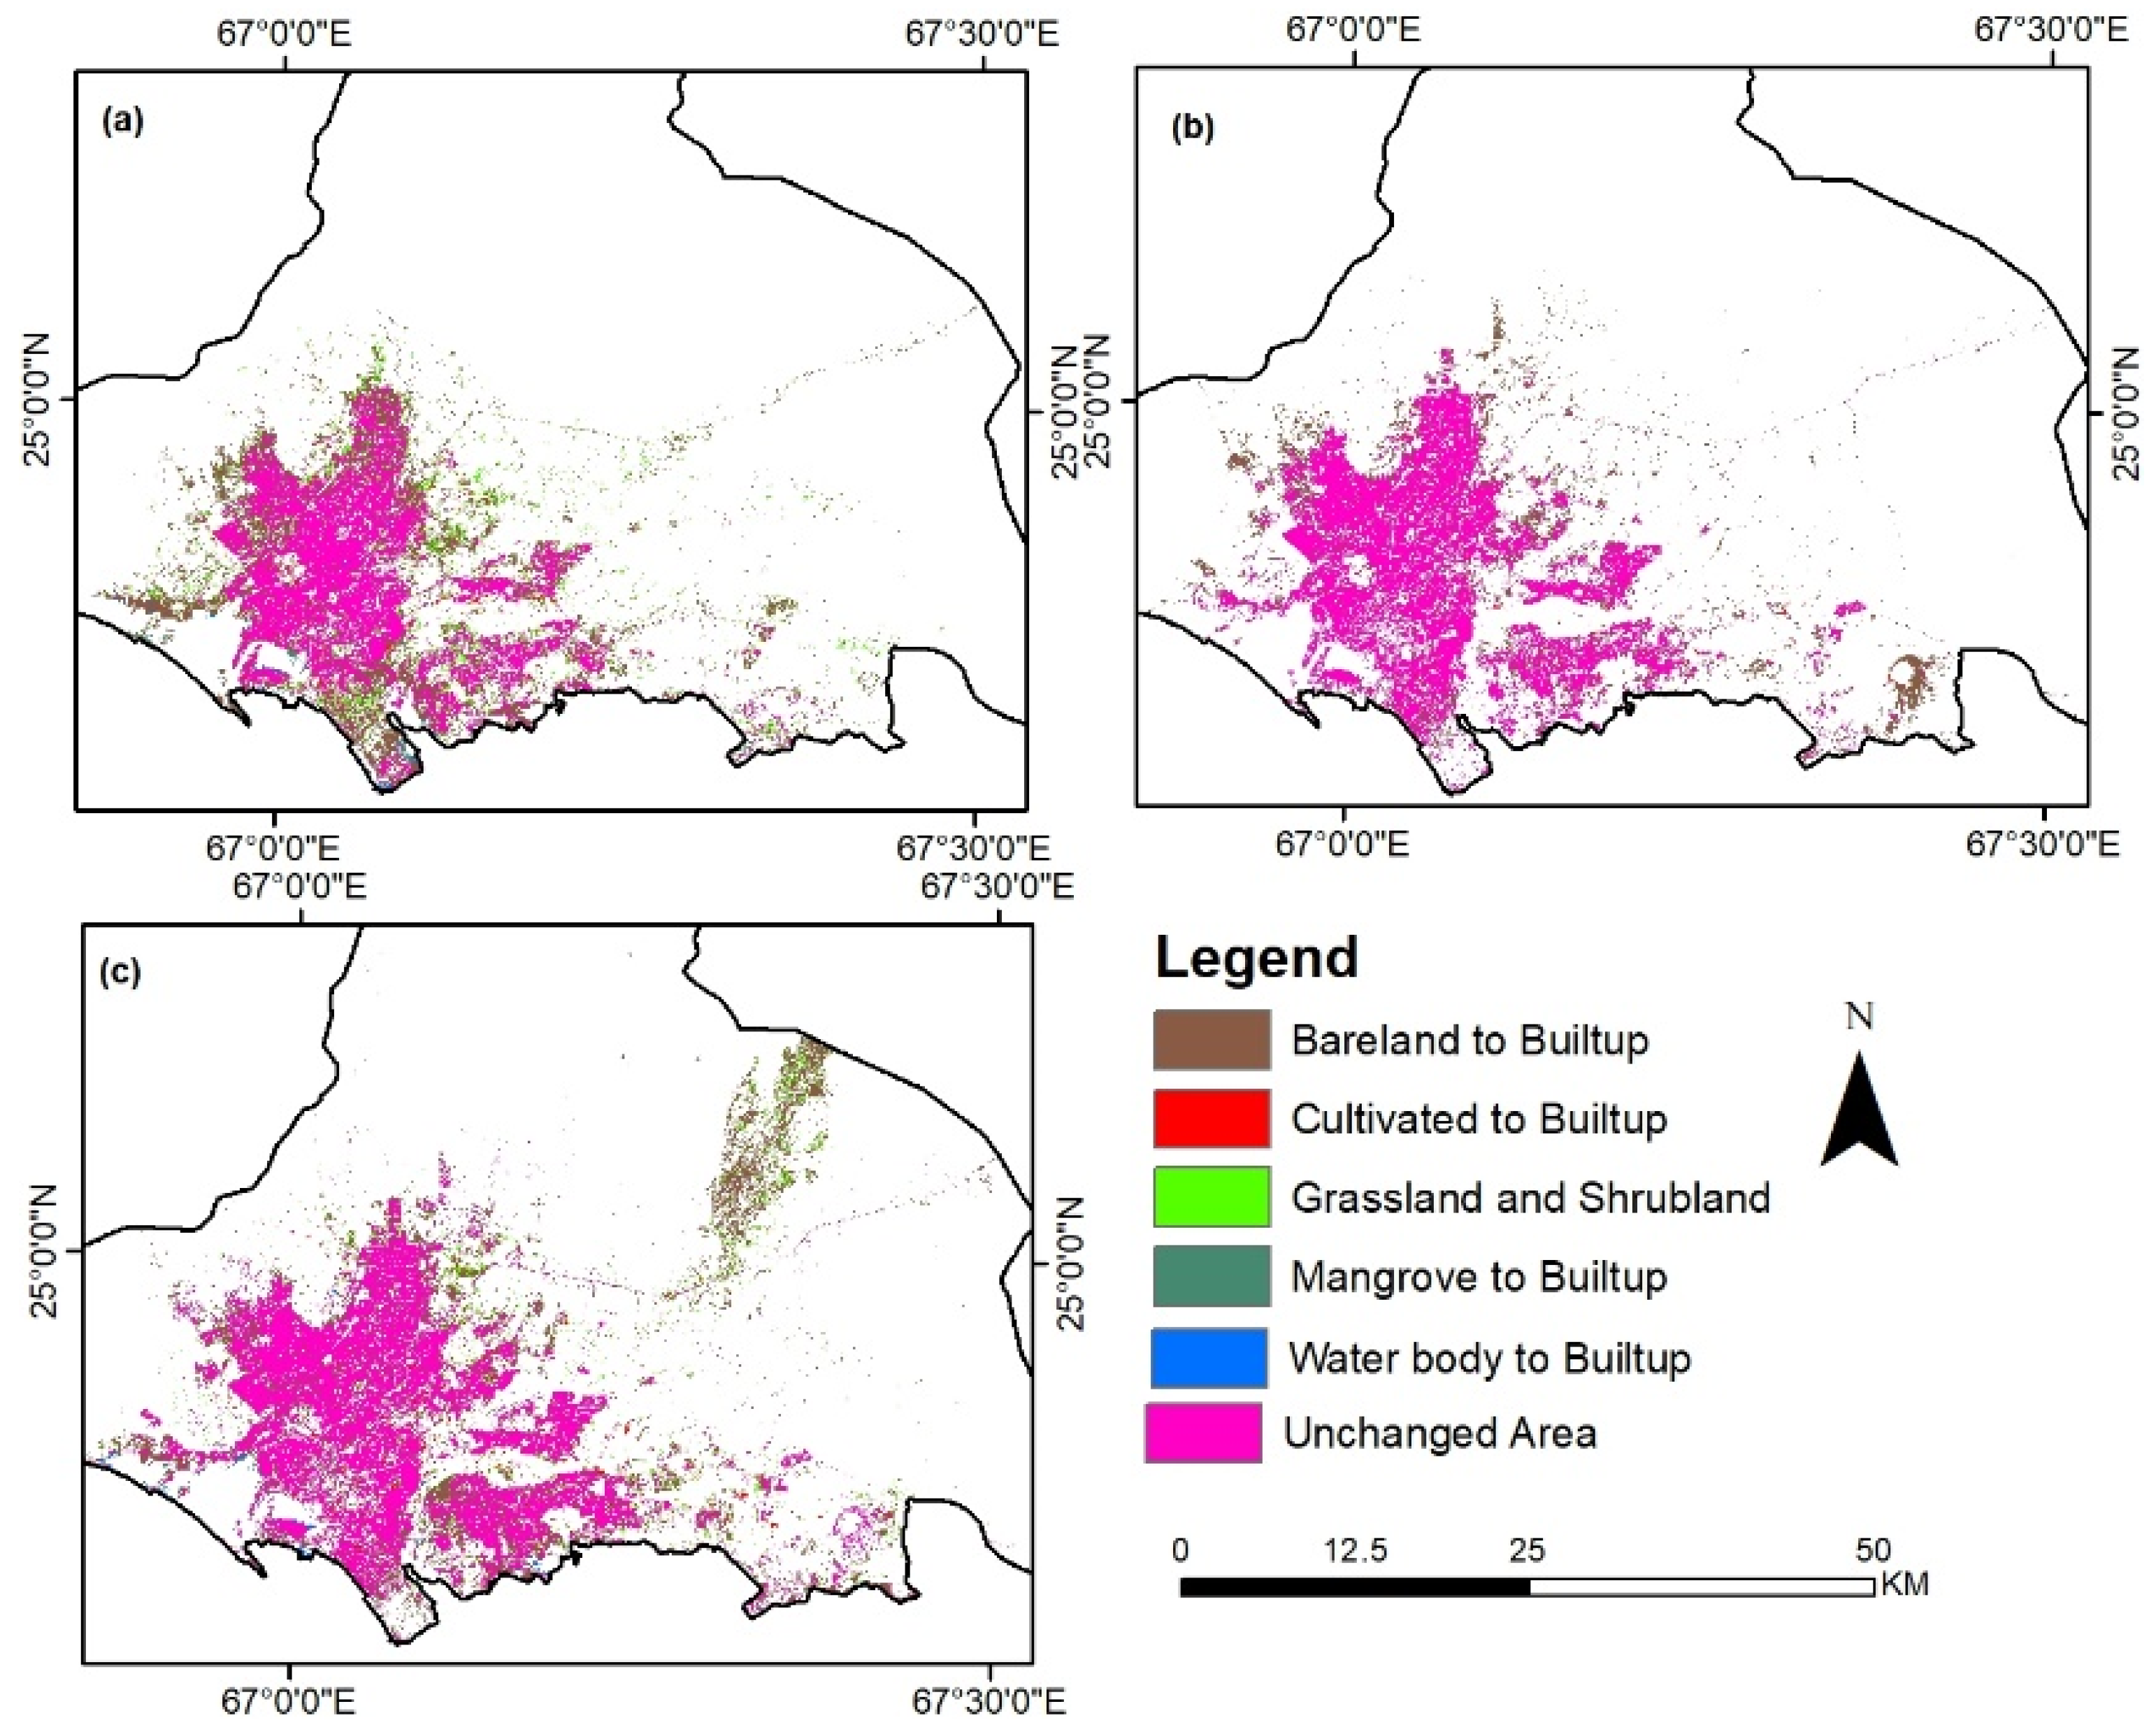
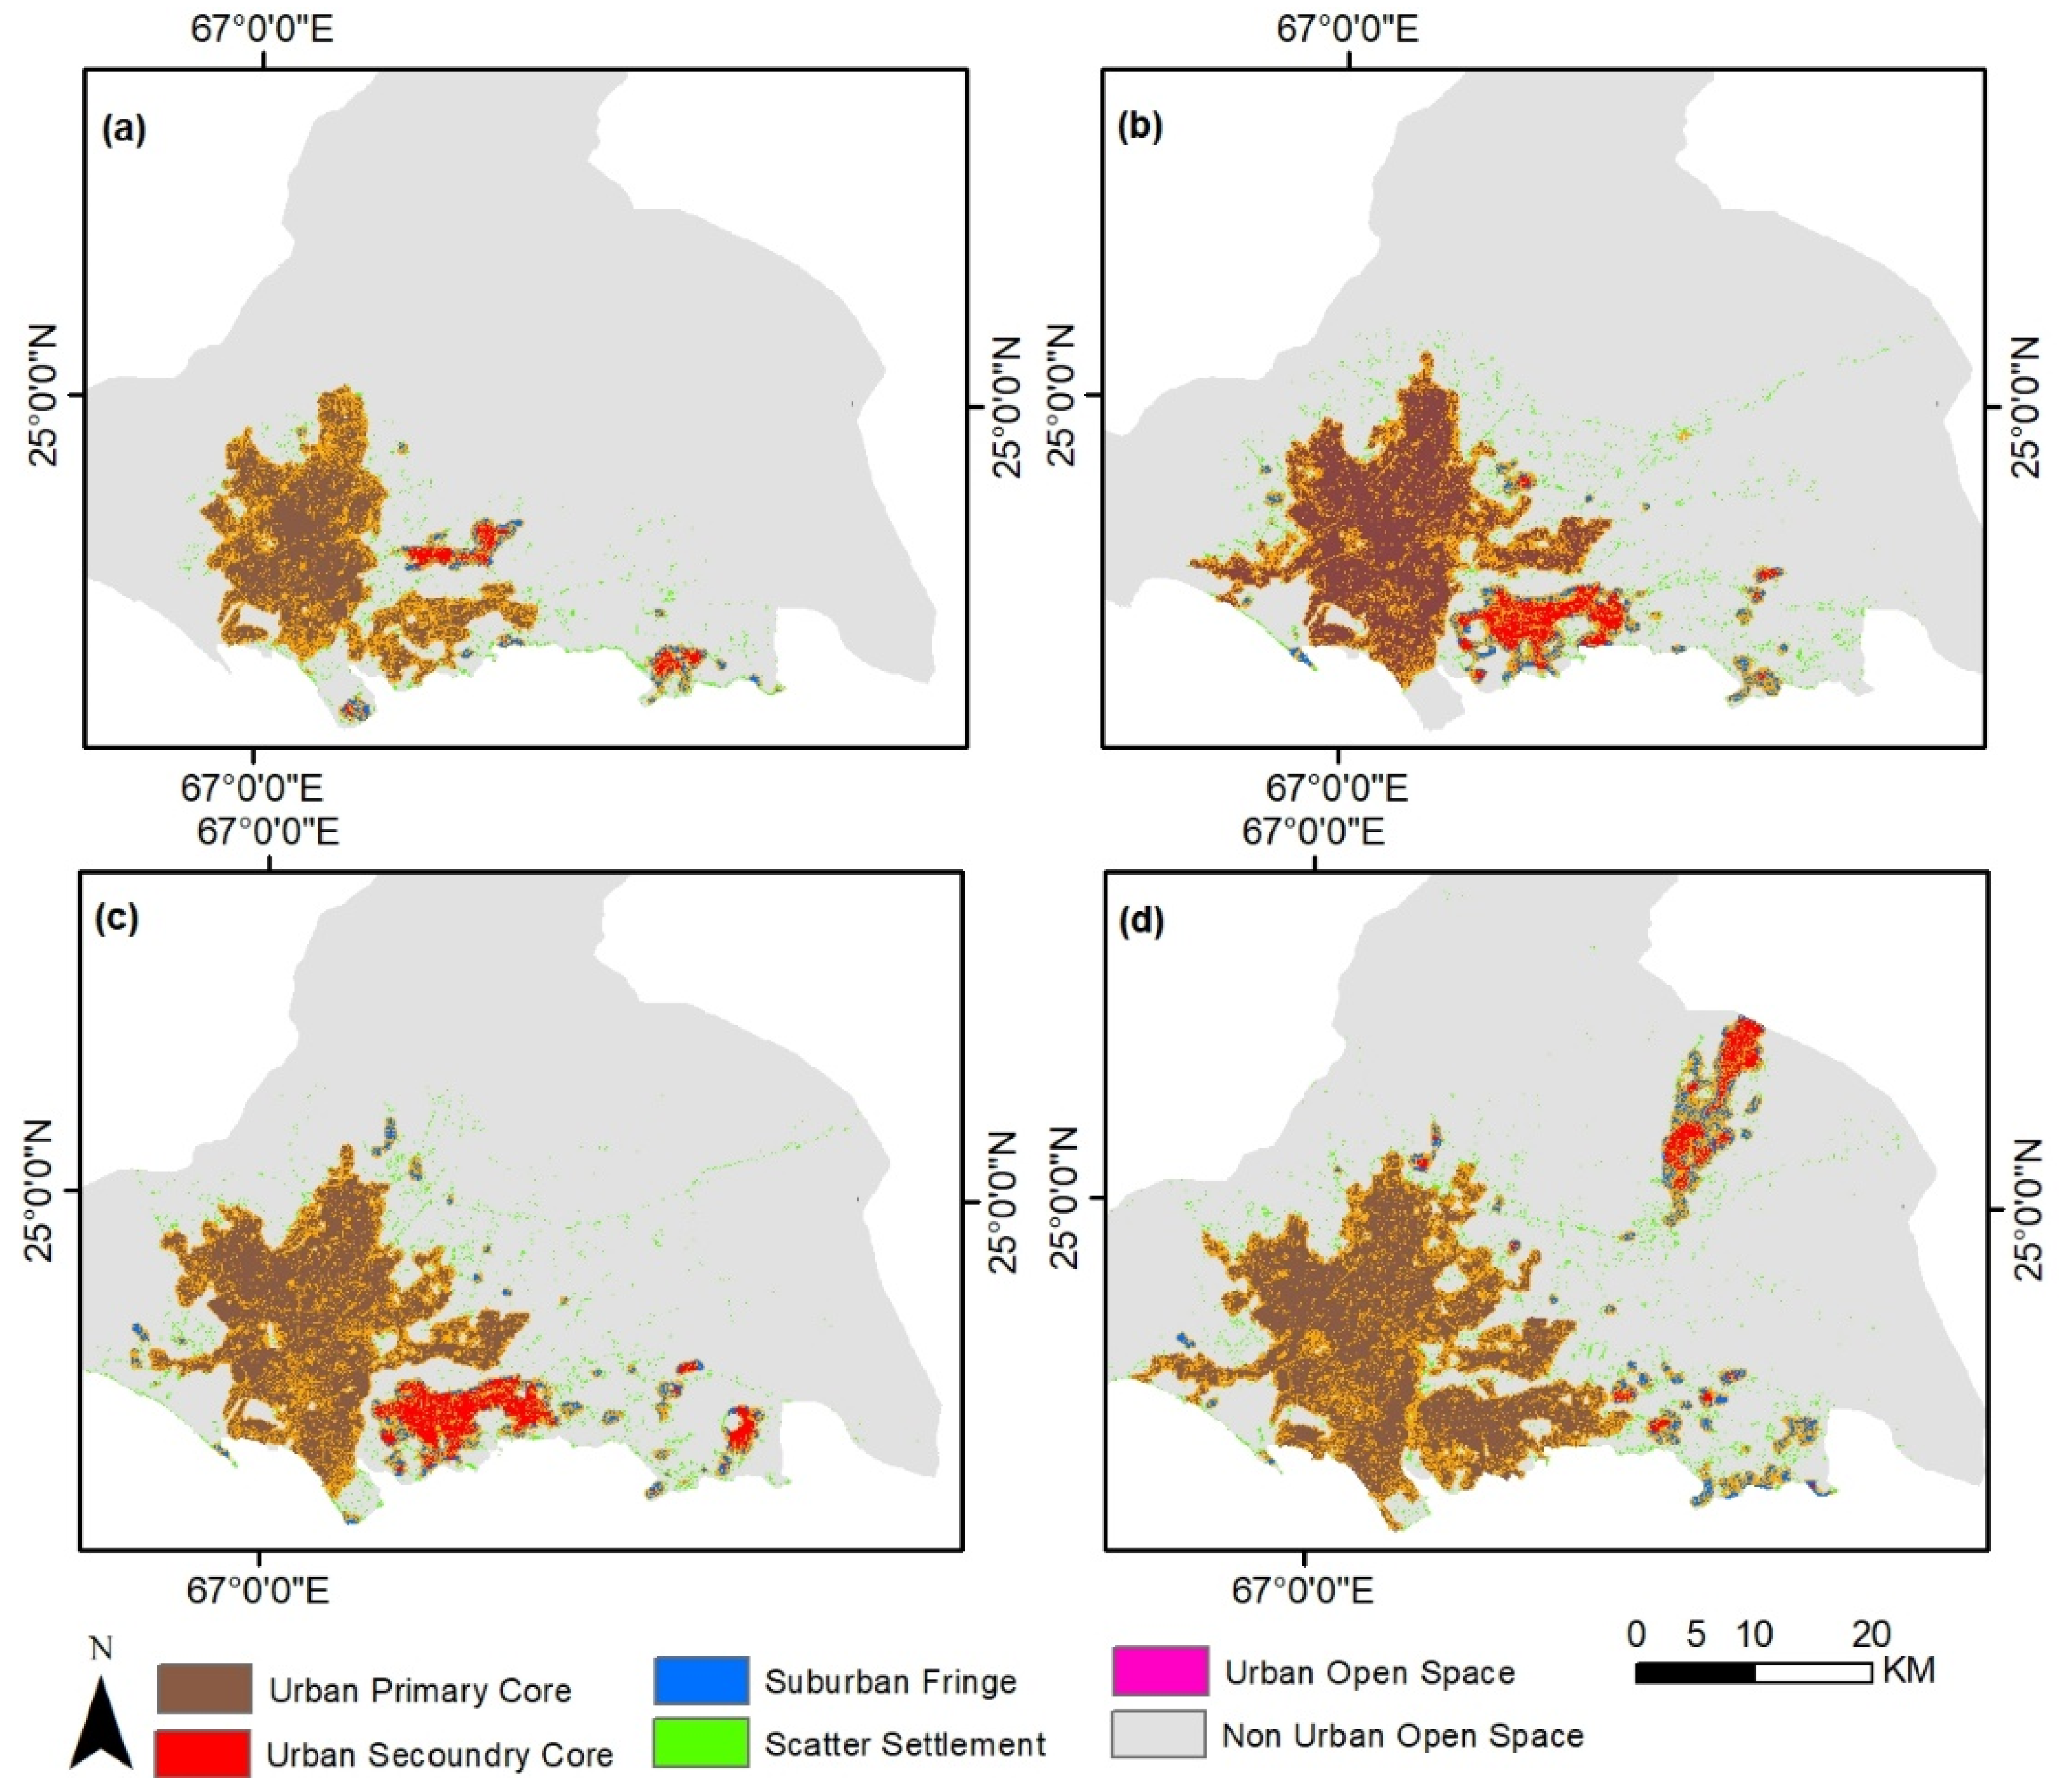
4.2. Urban Landscape Change
4.3. Transition Probability Matrix Analysis
4.4. LULC Simulation Results
5. Conclusions
Author Contributions
Funding
Institutional Review Board Statement
Informed Consent Statement
Data Availability Statement
Acknowledgments
Conflicts of Interest
References
- United Nations. World Population Prospects 2019: Highlights; Department of Economic and Social Affairs, Population Division: New York, NY, USA, 2019; Available online: https://population.un.org/wpp/Publications/Files/WPP2019_10KeyFindings.pdf (accessed on 10 March 2021).
- Foley, J.A.; DeFries, R.; Asner, G.P.; Barford, C.; Bonan, G.; Carpenter, S.R.; Chapin, F.S.; Coe, M.T.; Daily, G.C.; Gibbs, H.K. Global consequences of land use. Science 2005, 309, 570–574. [Google Scholar] [CrossRef] [Green Version]
- Grimm, N.B.; Faeth, S.H.; Golubiewski, N.E.; Redman, C.L.; Wu, J.; Bai, X.; Briggs, J.M. Global change and the ecology of cities. Science 2008, 319, 756–760. [Google Scholar] [CrossRef] [Green Version]
- Thapa, R.B.; Murayama, Y. Urban growth modeling of Kathmandu metropolitan region, Nepal. Comput. Environ. Urban Syst. 2011, 35, 25–34. [Google Scholar] [CrossRef]
- Pauleit, S.; Breuste, J.; Qureshi, S.; Sauerwein, M. Transformation of rural-urban cultural landscapes in Europe: Integrating approaches from ecological, socio-economic and planning perspectives. Landsc. Online 2010, 20, 1–10. [Google Scholar] [CrossRef]
- Lu, L.; Weng, Q.; Guo, H.; Feng, S.; Li, Q. Assessment of urban environmental change using multi-source remote sensing time series (2000–2016): A comparative analysis in selected megacities in Eurasia. Sci. Total Environ. 2019, 684, 567–577. [Google Scholar] [CrossRef] [PubMed]
- United Nations. Transforming Our World: The 2030 Agenda for Sustainable Development; United Nations, Department of Economic and Social Affairs: New York, NY, USA, 2015. [Google Scholar]
- Inostroza, L.; Hamstead, Z.; Spyra, M.; Qureshi, S. Beyond urban–rural dichotomies: Measuring urbanisation degrees in central European landscapes using the technomass as an explicit indicator. Ecol. Indic. 2019, 96, 466–476. [Google Scholar] [CrossRef]
- Hashem, N.; Balakrishnan, P. Change analysis of land use/land cover and modelling urban growth in Greater Doha, Qatar. Ann. GIS 2015, 21, 233–247. [Google Scholar] [CrossRef]
- Lu, L.; Guo, H.; Corbane, C.; Li, Q. Urban sprawl in provincial capital cities in China: Evidence from multi-temporal urban land products using Landsat data. Sci. Bull. 2019, 64, 955–957. [Google Scholar] [CrossRef] [Green Version]
- Li, X.; Liu, X.; Yu, L. A systematic sensitivity analysis of constrained cellular automata model for urban growth simulation based on different transition rules. Int. J. Geogr. Inf. Sci. 2014, 28, 1317–1335. [Google Scholar] [CrossRef]
- Ke, X.; Qi, L.; Zeng, C. A partitioned and asynchronous cellular automata model for urban growth simulation. Int. J. Geogr. Inf. Sci. 2016, 30, 637–659. [Google Scholar] [CrossRef]
- Mondal, B.; Das, D.N.; Bhatta, B. Integrating cellular automata and Markov techniques to generate urban development potential surface: A study on Kolkata agglomeration. Geocarto Int. 2017, 32, 401–419. [Google Scholar] [CrossRef]
- Pijanowski, B.C.; Pithadia, S.; Shellito, B.A.; Alexandridis, K. Calibrating a neural network-based urban change model for two metropolitan areas of the Upper Midwest of the United States. Int. J. Geogr. Inf. Sci. 2005, 19, 197–215. [Google Scholar] [CrossRef]
- Maithani, S. A neural network based urban growth model of an Indian city. J. Indian Soc. Remote Sens. 2009, 37, 363–376. [Google Scholar] [CrossRef]
- Tang, J.; Wang, L.; Yao, Z. Spatio-temporal urban landscape change analysis using the Markov chain model and a modified genetic algorithm. Int. J. Remote Sens. 2007, 28, 3255–3271. [Google Scholar] [CrossRef]
- Firozjaei, M.K.; Kiavarz, M.; Alavipanah, S.K.; Lakes, T.; Qureshi, S. Monitoring and forecasting heat island intensity through multi-temporal image analysis and cellular automata-Markov chain modelling: A case of Babol city, Iran. Ecol. Indic. 2018, 91, 155–170. [Google Scholar] [CrossRef]
- Mondal, B.; Das, D.N.; Dolui, G. Modeling spatial variation of explanatory factors of urban expansion of Kolkata: A geographically weighted regression approach. Model. Earth Syst. Environ. 2015, 1, 1–13. [Google Scholar] [CrossRef]
- Clarke, K.C.; Gaydos, L.J. Loose-coupling a cellular automaton model and GIS: Long-term urban growth prediction for San Francisco and Washington/Baltimore. Int. J. Geogr. Inf. Sci. 1998, 12, 699–714. [Google Scholar] [CrossRef] [Green Version]
- Dadashpoor, H.; Nateghi, M. Simulating spatial pattern of urban growth using GIS-based SLEUTH model: A case study of eastern corridor of Tehran metropolitan region, Iran. Environ. Dev. Sustain. 2017, 19, 527–547. [Google Scholar] [CrossRef]
- Bihamta, N.; Soffianian, A.; Fakheran, S.; Gholamalifard, M. Using the SLEUTH Urban Growth Model to Simulate Future Urban Expansion of the Isfahan Metropolitan Area, Iran. J. Indian Soc. Remote Sens. 2015, 43, 407–414. [Google Scholar] [CrossRef]
- Park, S.; Jeon, S.; Choi, C. Mapping urban growth probability in South Korea: Comparison of frequency ratio, analytic hierarchy process, and logistic regression models and use of the environmental conservation value assessment. Landsc. Ecol. Eng. 2012, 8, 17–31. [Google Scholar] [CrossRef]
- Xian, G.; Crane, M.; McMahon, C. Quantifying multi-temporal urban development characteristics in Las Vegas from Landsat and ASTER data. Photogramm. Eng. Remote Sens. 2008, 74, 473–481. [Google Scholar] [CrossRef]
- Bununu, Y.A. Integration of Markov chain analysis and similarity-weighted instance-based machine learning algorithm (SimWeight) to simulate urban expansion. Int. J. Urban Sci. 2017, 21, 217–237. [Google Scholar] [CrossRef]
- Angel, S.; Parent, J.; Civco, D. Urban sprawl metrics: An analysis of global urban expansion using GIS. In Proceedings of the ASPRS 2007 Annual Conference, Tampa, FL, USA, 7–11 May 2007. [Google Scholar]
- Sharma, R.; Joshi, P.K. Monitoring Urban Landscape Dynamics Over Delhi (India) Using Remote Sensing (1998–2011) Inputs. J. Indian Soc. Remote Sens. 2013, 41, 641–650. [Google Scholar] [CrossRef]
- Batty, M. Agents, Cells, and Cities: New Representational Models for Simulating Multiscale Urban Dynamics. Environ. Plan. A 2005, 37, 1373–1394. [Google Scholar] [CrossRef] [Green Version]
- Jokar Arsanjani, J.; Helbich, M.; Kainz, W.; Darvishi Boloorani, A. Integration of logistic regression, Markov chain and cellular automata models to simulate urban expansion. Int. J. Appl. Earth Obs. Geoinf. 2013, 21, 265–275. [Google Scholar] [CrossRef]
- Keshtkar, H.; Voigt, W. Potential impacts of climate and landscape fragmentation changes on plant distributions: Coupling multi-temporal satellite imagery with GIS-based cellular automata model. Ecol. Inform. 2016, 32, 145–155. [Google Scholar] [CrossRef]
- Rimal, B.; Zhang, L.; Keshtkar, H.; Haack, B.; Rijal, S.; Zhang, P. Land Use/Land Cover Dynamics and Modeling of Urban Land Expansion by the Integration of Cellular Automata and Markov Chain. ISPRS Int. J. Geo-Inf. 2018, 7, 154. [Google Scholar] [CrossRef] [Green Version]
- Akhtar, S.; Dhanani, M.R. Urban Sprawl in Karachi. Glob. Adv. Res. J. Geogr. Reg. Plan. 2013, 2, 160–171. [Google Scholar]
- Schetke, S.; Qureshi, S.; Lautenbach, S.; Kabisch, N. What determines the use of urban green spaces in highly urbanized areas?—Examples from two fast growing Asian cities. Urban For. Urban Green. 2016, 16, 150–159. [Google Scholar] [CrossRef]
- Qureshi, S. The fast growing megacity Karachi as a frontier of environmental challenges: Urbanization and contemporary urbanism issues. J. Geogr. Reg. Plan. 2010, 3, 306–321. [Google Scholar]
- Hamza, S.; Khan, I.; Lu, L.; Liu, H.; Burke, F.; Nawaz-ul-Huda, S.; Baqa, M.F.; Tariq, A. The Relationship between Neighborhood Characteristics and Homicide in Karachi, Pakistan. Sustainability 2021, 13, 5520. [Google Scholar] [CrossRef]
- D’Acci, L. A new type of cities for liveable futures. Isobenefit Urbanism morphogenesis. J. Environ. Manag. 2019, 246, 128–140. [Google Scholar] [CrossRef] [PubMed] [Green Version]
- Shaikh, A.; Gotoh, K. A Satellite Remote Sensing Evaluation of Urban Land Cover Changes and Its Associated Impacts on Water Resources in Karachi, Pakistan. J. Jpn. Soc. Photogramm. Remote Sens. 2006, 45, 41–55. [Google Scholar] [CrossRef]
- Mahboob, M.A.; Atif, I.; Iqbal, J. Remote Sensing and GIS Applications for Assessment of Urban Sprawl in Karachi, Pakistan. Sci. Technol. Dev. 2015, 34, 179–188. [Google Scholar] [CrossRef] [Green Version]
- City District Government Karachi. Karachi Strategic Development Plan 2020; CDGK (City District Government Karachi): Karachi, Pakistan, 2007; Available online: https://urckarachi.org/2020/07/19/karachi-strategic-development-plan-2020/ (accessed on 15 January 2021).
- Government of Pakistan. Pakistan Bureau of Statistics; 2017. Available online: https://www.pbs.gov.pk/ (accessed on 15 December 2020).
- Ahmed, Q.I.; Lu, H.; Ye, S. Urban transportation and equity: A case study of Beijing and Karachi. Transp. Res. Part A Policy Pract. 2008, 42, 125–139. [Google Scholar] [CrossRef]
- Government of Pakistan. Pakistan Economic Survey; 2017–2018. Available online: http://www.finance.gov.pk/survey_1718.html (accessed on 15 December 2020).
- World Bank. Transforming Karachi into a Livable and Competitive Megacity: A City Diagnostic and Transformation Strategy; The World Bank: Washington, DC, USA, 2018; Available online: https://openknowledge.worldbank.org/bitstream/handle/10986/29376/211211ov.pdf?sequence=8&isAllowed=y (accessed on 15 January 2021).
- Haq, U. The Rise of Karachi as a Mega-City: Issues and Challenges. Human Development Centre. Available online: http://www.mhhdc.org (accessed on 9 January 2021).
- Hasan, A.; Ahmed, N.; Raza, M.; Sadiq, A.; Ahmed, S.; Sarwar, M.B. Land Ownership, Control and Contestation in Karachi and Implications for Low-Income Housing; Human Settlements Group, International Institute for Environment and Development: London, UK, 2013. [Google Scholar]
- Lu, L.; Kuenzer, C.; Wang, C.; Guo, H.; Li, Q. Evaluation of Three MODIS-Derived Vegetation Index Time Series for Dryland Vegetation Dynamics Monitoring. Remote Sens. 2015, 7, 7597–7614. [Google Scholar] [CrossRef] [Green Version]
- Lu, L.; Weng, Q.; Xiao, D.; Guo, H.; Li, Q.; Hui, W. Spatiotemporal Variation of Surface Urban Heat Islands in Relation to Land Cover Composition and Configuration: A Multi-Scale Case Study of Xi’an, China. Remote Sens. 2020, 12, 2713. [Google Scholar] [CrossRef]
- Parent, J.; Civco, D.; Angel, S. Urban Growth Analysis: Calculating Metrics to Quantify Urban Sprawl; University of Connecticut: Storrs, CT, USA, 2008; Available online: https://proceedings.esri.com/library/userconf/proc08/papers/papers/pap_1692.pdf (accessed on 9 March 2021).
- Mas, J.-F.; Kolb, M.; Paegelow, M.; Olmedo, M.T.C.; Houet, T. Inductive pattern-based land use/cover change models: A comparison of four software packages. Environ. Model. Softw. 2014, 51, 94–111. [Google Scholar] [CrossRef] [Green Version]
- Kumar, S.; Radhakrishnan, N.; Mathew, S. Land use change modelling using a Markov model and remote sensing. Geomat. Nat. Hazards Risk 2014, 5, 145–156. [Google Scholar] [CrossRef]
- Guan, D.; Li, H.; Inohae, T.; Su, W.; Nagaie, T.; Hokao, K. Modeling urban land use change by the integration of cellular automaton and Markov model. Ecol. Model. 2011, 222, 3761–3772. [Google Scholar] [CrossRef]
- Tariq, A.; Shu, H. CA-Markov Chain Analysis of Seasonal Land Surface Temperature and Land Use Land Cover Change Using Optical Multi-Temporal Satellite Data of Faisalabad, Pakistan. Remote Sens. 2020, 12, 3402. [Google Scholar] [CrossRef]
- Lillesand, T.; Kiefer, R.W.; Chipman, J. Remote Sensing and Image Interpretation; John Wiley & Sons: Hoboken, NJ, USA, 2015. [Google Scholar]
- Shawul, A.A.; Chakma, S. Spatiotemporal detection of land use/land cover change in the large basin using integrated approaches of remote sensing and GIS in the Upper Awash basin, Ethiopia. Environ. Earth Sci. 2019, 78, 1–13. [Google Scholar] [CrossRef]
- Mahar, G.A.; Hussain, B.; Wagan, R.A.; Hussain, A.T.; Khan, S.H. Remote sensing (RS) monitoring of mangroves plantation against the guinness world record (GWR) of maximum plantation in indus delta. Pak. J. Bot. 2020, 52, 1497–1503. [Google Scholar] [CrossRef]
- Liu, Y.; He, Q.; Tan, R.; Liu, Y.; Yin, C. Modeling different urban growth patterns based on the evolution of urban form: A case study from Huangpi, Central China. Appl. Geogr. 2016, 66, 109–118. [Google Scholar] [CrossRef]


| Data | Details | Period | Source |
|---|---|---|---|
| Landsat images | 30 m resolution, Path/Row 152,042, 152/043, 153/043 | 1990–2020 | USGS |
| Base map | scale 1:25,000 | 2000 | SOP |
| Population | divisional level | 1990–2020 | COP |
| DEM | SRTM DEM and Slope | 2015 | USGS |
| Roads | Road Network | 2018 | OSM |
| Urban Spatial Patterns | Criteria |
|---|---|
| Urban primary core | The most densely packed set of pixels in which at least 50% of the surrounding neighborhood is densely populated. |
| Urban secondary core | It is at least 50% built-up in the same way as urban primary core although it is not part of it. |
| Suburban fringe | The built-up pixels with a 30–50% urbanness surrounded by primary and secondary core. |
| Scatter settlement | The built-up pixel is less than 20% built up and is located apart from the primary and secondary cores. |
| Urban open space | The non-urban regions encircled the primary and secondary urban cores. |
| Non-urban area | Apart from the primary and secondary urban cores, non-urban area. |
| LULC Classes | Area (sq.km) | Change Rate (%) | |||||
|---|---|---|---|---|---|---|---|
| 1990 | 2000 | 2010 | 2020 | 1990–2000 | 2000–2010 | 2010–2020 | |
| Bare land | 2663.7 | 2811 | 2491.7 | 2156.6 | 5.53 | −11.35 | −13.44 |
| Built-up area | 221.1 | 358.7 | 424.3 | 573.9 | 62.23 | 18.28 | 35.25 |
| Cultivated land | 112.2 | 159.3 | 148.4 | 81.5 | 41.97 | −6.84 | −45.08 |
| Grassland and shrub land | 534.3 | 370.5 | 563 | 867.7 | −30.65 | 51.95 | 54.12 |
| Mangroves | 65.9 | 13.8 | 14.2 | 17 | −79.05 | 2.89 | 19.71 |
| Water bodies | 23.8 | 46.5 | 54 | 56.8 | 95.37 | 16.12 | 5.18 |
| District | 1990–2000 | 2000–2010 | 2010–2020 | 1990–2020 |
|---|---|---|---|---|
| Kiamari | 118.49 | 3.08 | 14.13 | 257.05 |
| Central | 29.67 | −3.95 | 3.11 | 128.43 |
| South | 29.07 | −0.77 | 11.64 | 142.97 |
| West | 96.63 | 26.78 | 12.07 | 279.38 |
| East | 47.61 | 3.95 | 22.57 | 188.07 |
| Korangi | 29.91 | 10.75 | 28.98 | 185.59 |
| Malir | 66.16 | 19.13 | 111.12 | 417.92 |
| Urban Land Transformation | Area (km2) | Change Rate (%) | |||||
|---|---|---|---|---|---|---|---|
| 1990–2000 | 2000–2010 | 2010–2020 | 1990–2000 | 2000–2010 | 2010–2020 | 1990–2020 | |
| Bare land to Built-up | 114 | 68.7 | 134.2 | 4.28 | 2.44 | 5.38 | 117.71 |
| Cultivated land to Built-up | 8.4 | 9.7 | 12.5 | 3.79 | 2.70 | 2.94 | 148.81 |
| Grassland and Shrub land to Built-up | 42.6 | 13.1 | 30.2 | 37.96 | 8.22 | 20.35 | 70.89 |
| Water to Built-up | 3 | 0.1 | 0.9 | 0.56 | 0.02 | 0.16 | 30.00 |
| Mangroves to Built-up | 2.1 | 2 | 3.2 | 3.18 | 14.49 | 22.53 | 152.38 |
| Expansion of Built-up Area | 170.1 | 93.6 | 181 | 714.70 | 201.29 | 335.18 | 106.40 |
| Urban Spatial Patterns | Area (sq.km) | Change Rate (%) | |||||
|---|---|---|---|---|---|---|---|
| 1990 | 2000 | 2010 | 2020 | 1990–2000 | 2000–2010 | 2010–2020 | |
| Urban Primary Core | 145.9 | 248 | 255 | 363.5 | 69.979 | 2.823 | 42.549 |
| Urban Secondary Core | 25.9 | 29.3 | 40 | 22.3 | 13.127 | 36.519 | −44.250 |
| Suburban Fringe | 25.2 | 22 | 22.09 | 35.8 | −12.698 | 0.409 | 62.064 |
| Scatter Settlement | 16.7 | 32.8 | 33.9 | 42.2 | 96.407 | 3.354 | 24.484 |
| Urban Open Space | 121.8 | 152.5 | 168.2 | 234.3 | 25.205 | 10.295 | 39.298 |
| Non-Urban Open Space | 3272 | 3131 | 3089 | 2911 | −4.309 | −1.341 | −5.762 |
| District | Primary Core | Secondary Core | Suburban Fringe | Urban Open Space | ||||||||
|---|---|---|---|---|---|---|---|---|---|---|---|---|
| Phase 1 | Phase 2 | Phase 3 | Phase 1 | Phase 2 | Phase 3 | Phase 1 | Phase 2 | Phase 3 | Phase 1 | Phase 2 | Phase 3 | |
| Kiamari | 103.66 | 1.80 | 12.44 | 0.00 | 0.00 | 0.00 | 0.00 | 100.00 | 29.45 | 73.26 | −0.89 | 13.18 |
| Central | 30.77 | −3.86 | 3.25 | 0.00 | 0.00 | 0.00 | 0.00 | 0.00 | 0.00 | −52.39 | 24.26 | −15.33 |
| South | 44.86 | −5.02 | 15.44 | 0.00 | 0.00 | 0.00 | 0.00 | 0.00 | −100.00 | −12.23 | 60.64 | −7.21 |
| West | 98.47 | 16.87 | 11.42 | 0.00 | 0.00 | 2100.00 | 0.00 | 0.00 | −9.18 | 33.73 | 37.25 | 33.09 |
| East | 40.37 | 8.52 | 26.99 | 0.00 | −100.00 | 0.00 | 427.78 | 76.62 | 50.00 | 103.99 | 10.64 | 22.85 |
| Korangi | 5728.57 | 7.78 | 251.51 | 100.10 | 25.38 | −100.00 | 46.63 | −114.47 | −100.00 | 1.23 | 12.82 | 3.69 |
| Malir | 0 | 35.96 | 402.63 | −350.61 | 69.31 | 30.39 | 122.99 | 18.69 | 144.37 | 59.99 | 4.67 | 148.41 |
| Class | Time Period | Bare Land | Built-Up | Cultivated Land | Grassland and Shrub Land | Mangroves | Water Bodies |
|---|---|---|---|---|---|---|---|
| Bare land | Phase 1 | 0.77 | 0.10 | 0.40 | 0.06 | 0.00 | 0.00 |
| Phase 2 | 0.68 | 0.05 | 0.02 | 0.23 | 0.00 | 0.00 | |
| Phase 3 | 0.61 | 0.05 | 0.01 | 0.32 | 0.00 | 0.00 | |
| Built-up | Phase 1 | 0.14 | 0.70 | 0.05 | 0.08 | 0.00 | 0.00 |
| Phase 2 | 0.14 | 0.76 | 0.03 | 0.05 | 0.00 | 0.00 | |
| Phase 3 | 0.03 | 0.85 | 0.03 | 0.03 | 0.03 | 0.03 | |
| Cultivated land | Phase 1 | 0.39 | 0.88 | 0.32 | 0.18 | 0.00 | 0.00 |
| Phase 2 | 0.25 | 0.12 | 0.29 | 0.30 | 0.00 | 0.01 | |
| Phase 3 | 0.27 | 0.05 | 0.20 | 0.46 | 0.00 | 0.00 | |
| Grassland and shrub land | Phase 1 | 0.30 | 0.30 | 0.30 | 0.85 | 0.03 | 0.03 |
| Phase 2 | 0.54 | 0.14 | 0.10 | 0.20 | 0.00 | 0.00 | |
| Phase 3 | 0.55 | 0.04 | 0.04 | 0.34 | 0.00 | 0.00 | |
| Mangroves | Phase 1 | 0.09 | 0.14 | 0.02 | 0.01 | 0.41 | 0.30 |
| Phase 2 | 0.04 | 0.05 | 0.00 | 0.00 | 0.63 | 0.25 | |
| Phase 3 | 0.07 | 0.04 | 0.00 | 0.02 | 0.76 | 0.08 | |
| Water bodies | Phase 1 | 0.49 | 0.38 | 0.04 | 0.02 | 0.00 | 0.39 |
| Phase 2 | 0.12 | 0.12 | 0.00 | 0.00 | 0.05 | 0.67 | |
| Phase 3 | 0.13 | 0.05 | 0.01 | 0.02 | 0.09 | 0.66 |
| Year | Kappa Parameters | ||||
|---|---|---|---|---|---|
| 2020 | K-location | K-no | K-location Strata | K-standard | Overall Kappa Value |
| 0.91 | 0.91 | 0.91 | 0.87 | 0.87 | |
| LULC Class | Area (sq.km) | Change | ||
|---|---|---|---|---|
| 2020 | 2030 | Sq.km | % | |
| Bare land | 2031.74 | 1750.84 | −280.9 | −86.17% |
| Built-up | 584.78 | 652.59 | 67.81 | 111.60% |
| Cultivated land | 78.39 | 99.46 | 21.07 | 126.88% |
| Grassland and shrub land | 838.42 | 999.06 | 160.64 | 119.16% |
| Mangroves | 15.61 | 33.36 | 17.75 | 213.71% |
| Water bodies | 53.35 | 66.97 | 13.62 | 125.53% |
Publisher’s Note: MDPI stays neutral with regard to jurisdictional claims in published maps and institutional affiliations. |
© 2021 by the authors. Licensee MDPI, Basel, Switzerland. This article is an open access article distributed under the terms and conditions of the Creative Commons Attribution (CC BY) license (https://creativecommons.org/licenses/by/4.0/).
Share and Cite
Baqa, M.F.; Chen, F.; Lu, L.; Qureshi, S.; Tariq, A.; Wang, S.; Jing, L.; Hamza, S.; Li, Q. Monitoring and Modeling the Patterns and Trends of Urban Growth Using Urban Sprawl Matrix and CA-Markov Model: A Case Study of Karachi, Pakistan. Land 2021, 10, 700. https://doi.org/10.3390/land10070700
Baqa MF, Chen F, Lu L, Qureshi S, Tariq A, Wang S, Jing L, Hamza S, Li Q. Monitoring and Modeling the Patterns and Trends of Urban Growth Using Urban Sprawl Matrix and CA-Markov Model: A Case Study of Karachi, Pakistan. Land. 2021; 10(7):700. https://doi.org/10.3390/land10070700
Chicago/Turabian StyleBaqa, Muhammad Fahad, Fang Chen, Linlin Lu, Salman Qureshi, Aqil Tariq, Siyuan Wang, Linhai Jing, Salma Hamza, and Qingting Li. 2021. "Monitoring and Modeling the Patterns and Trends of Urban Growth Using Urban Sprawl Matrix and CA-Markov Model: A Case Study of Karachi, Pakistan" Land 10, no. 7: 700. https://doi.org/10.3390/land10070700