Article

Combining Traffic Microsimulation Modeling and Multi-Criteria Analysis for Sustainable Spatial-Traffic Planning

by
Irena Ištoka Otković
1,*,
Barbara Karleuša
2,
Aleksandra Deluka-Tibljaš
2,
Sanja Šurdonja
2 and
Mario Marušić
1
1
Faculty of Civil Engineering and Architecture Osijek, Josip Juraj Strossmayer University of Osijek, 31000 Osijek, Croatia
2
Faculty of Civil Engineering, University of Rijeka, 51000 Rijeka, Croatia
*
Author to whom correspondence should be addressed.
Land 2021, 10(7), 666; https://doi.org/10.3390/land10070666
Submission received: 14 June 2021 / Accepted: 21 June 2021 / Published: 24 June 2021
(This article belongs to the Special Issue Recent Progress in Urbanisation Dynamics Research)

Abstract

:
Spatial and traffic planning is important in order to achieve a quality, safe, functional, and integrated urban environment. Different tools and expert models were developed that are aimed at a more objective view of the consequences of reconstruction in different spatial and temporal ranges while respecting selection criteria. In this paper we analyze the application of the multi-criteria analysis method when choosing sustainable traffic solutions in the center of a small town, in this case Belišće, Croatia. The goal of this paper is to examine the possibility of improving the methodology for selecting an optimal spatial–traffic solution by combining the quantifiable results of the traffic microsimulation and the method of multi-criteria optimization. Socially sensitive design should include psychological and social evaluation criteria that are included in this paper as qualitative spatial–urban criteria. In the optimization process, different stakeholder groups (experts, students, and citizens) were actively involved in evaluating the importance of selected criteria. The analysis of stakeholders’ survey results showed statistically significant differences in criteria preference among three groups. The AHP (Analytic Hierarchy Process) multi-criteria analysis method was used; a total of five criteria groups (functional, safety, economic, environmental, and spatial–urban) were developed, which contain 21 criteria and 7 sub-criteria; and the weights of criteria groups were varied based on stakeholders’ preferences. The application of the developed methodology enabled the selection of an optimal solution for the improvement of traffic conditions in a small city with the potential to also be applied to other types of traffic–spatial problems and assure sustainable traffic planning.

1. Introduction

Reconstruction of segments of the existing traffic network according to the principles of sustainable urban mobility includes multidisciplinarity and consideration of spatial interventions through holistic criteria. Sustainable traffic and spatial planning should equally meet urban mobility development goals and the needs of traffic users, as well as understand and preserve the natural environment [1].
The European Commission has adopted a Sustainable Urban Mobility Plan (SUMP), a document that sets the framework for planning and managing urban mobility with the goal of improving the urban quality of life by creating a safe, reliable, integrated, multimodal, efficient, and environmentally friendly traffic system [2].
In order to positively influence the choice of movement modalities and encourage active and more environmentally friendly forms of urban mobility, it is necessary to provide accessible, safe, comfortable, and attractive traffic areas intended for pedestrians and cyclists, and various forms of micromobility and, at the same time, respect necessary requirements for motorized traffic. Planning and construction of traffic infrastructure was traditionally aimed at meeting traffic demand, but the analyses clearly show that the planning approach is changing and that the design of traffic infrastructure is effectively used to generate the desired forms of mobility [3]. The central parts of cities were spatially defined in the distant past, and the continuous increase of the degree of motorization and of the size of the population impose the need to meet numerous and often conflicting objectives during reconstruction, and the choice of an optimal solution becomes a question of multidisciplinary cooperation and the application of a multi-criteria optimization [4].
Microsimulations are a frequently used tool in assessing the functional (traffic) characteristics of alternative transport infrastructure solutions [5,6]. The assessment of alternative solutions based on traffic and cost criteria does not provide a sufficiently broad approach for sustainable and socially sensitive spatial planning, so it is necessary to include other aspects of potential solutions.
The aim of this paper is to give a methodological contribution to the evaluation of alternative solutions of transport infrastructure, including cost, microsimulations as quantitative indicators of traffic conditions, and spatial–urban criteria as qualitative criteria in a broader context that allows for the application of multi-criteria analysis methods. The methodology for evaluating alternative solutions applied in this research is to combine the multi-criteria analysis methods, traffic micro-simulations, and a socially sensitive spatial planning approach to develop a model that unites a conventional approach to traffic planning based on traffic demand of all modes of traffic and a sustainable approach in planning based on ensuring accessibility of space with active public participation in the assessment of alternative solutions and selection of the optimal solution.
In this paper, the Analytic Hierarchy Process (AHP) [7] multi-criteria analysis method is applied to a case study, selecting the optimal solution for the reconstruction of traffic areas at the level of a conceptual solution for part of the traffic network in the center of the town of Belišće in Croatia. The local inhabitants, as well as the professional and non-professional public, were involved in the process of choosing the optimal solution through several steps in the procedure, and the traffic microsimulation technique was used to verify future traffic needs.
After the introduction, the Section 2 of this paper provides an overview of the literature from the research topic. Section 3, entitled “Study Area,” describes the spatial and traffic characteristics of the selected case study, the central zone of the town of Belišće in Croatia. Section 4 explains in detail the methodological steps and their application in the selected case study—a combination of traffic microsimulation modeling and MCA. In the Section 5, the results of the application of the analyzed methodology are presented and discussed. The results of quantitative and qualitative criteria are analyzed, as well as different stakeholder preferences. Section 6 presents the concluding considerations arising from the application of the proposed innovative methodology for the assessment of alternative solutions for the reconstruction of transport infrastructure and selection of the optimal solution.

2. Literature Review
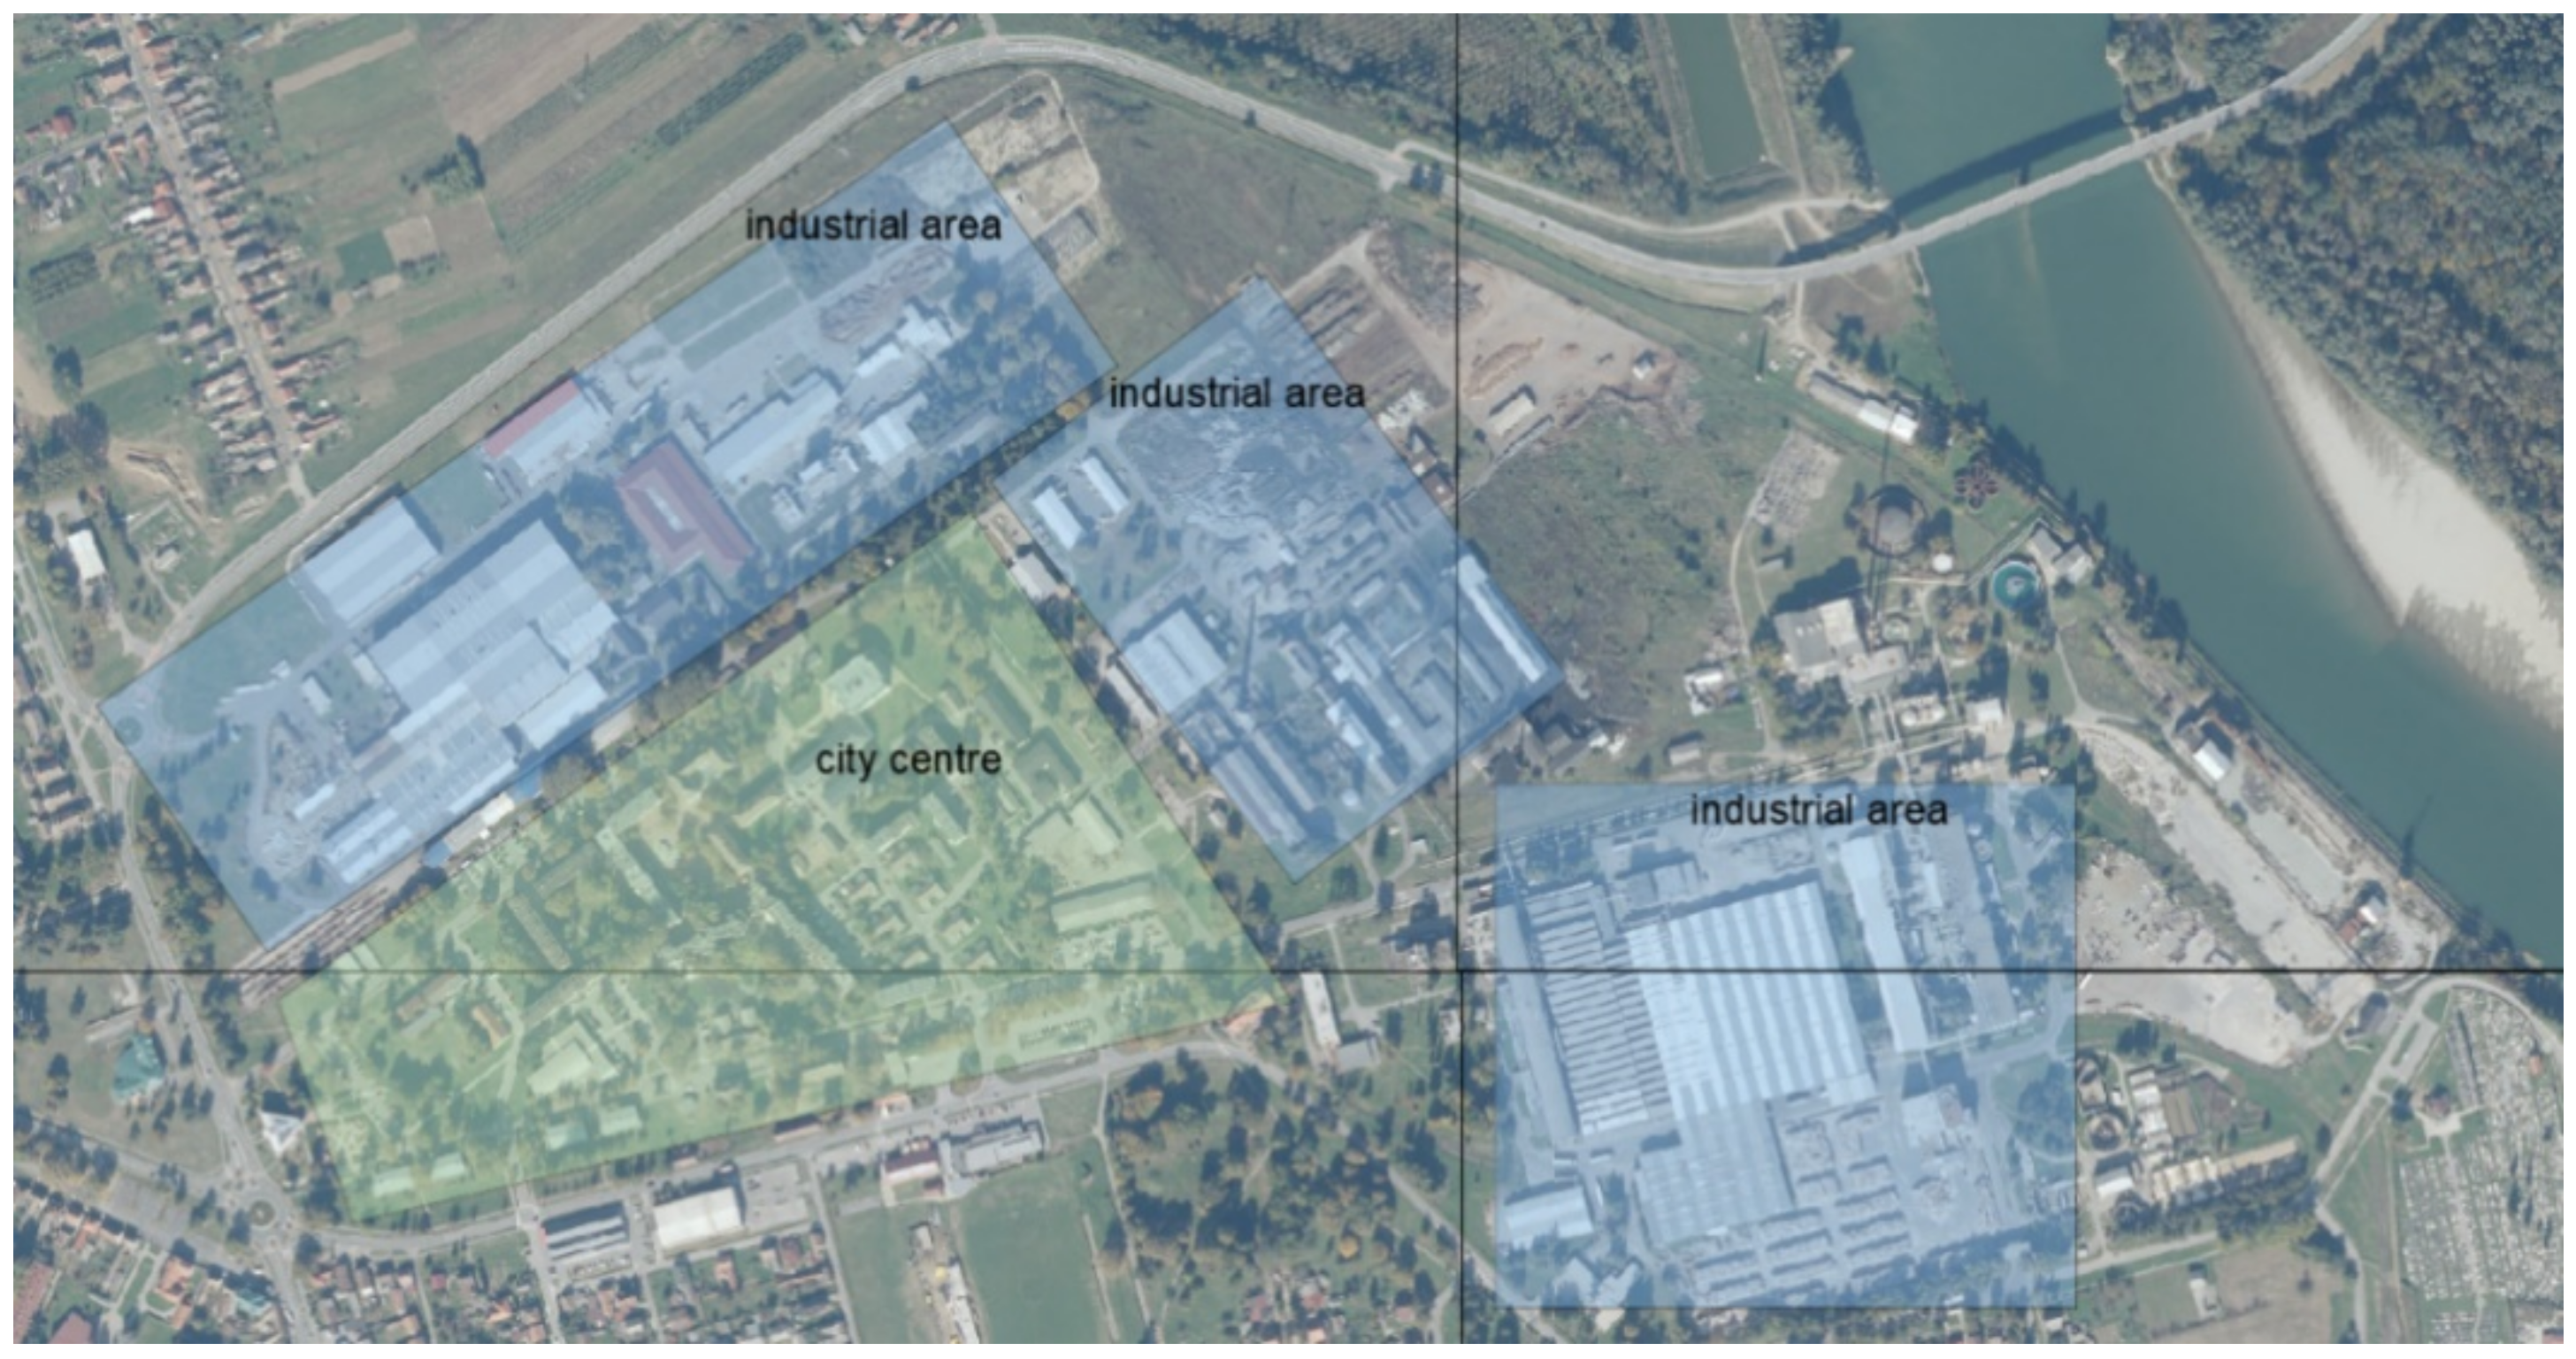
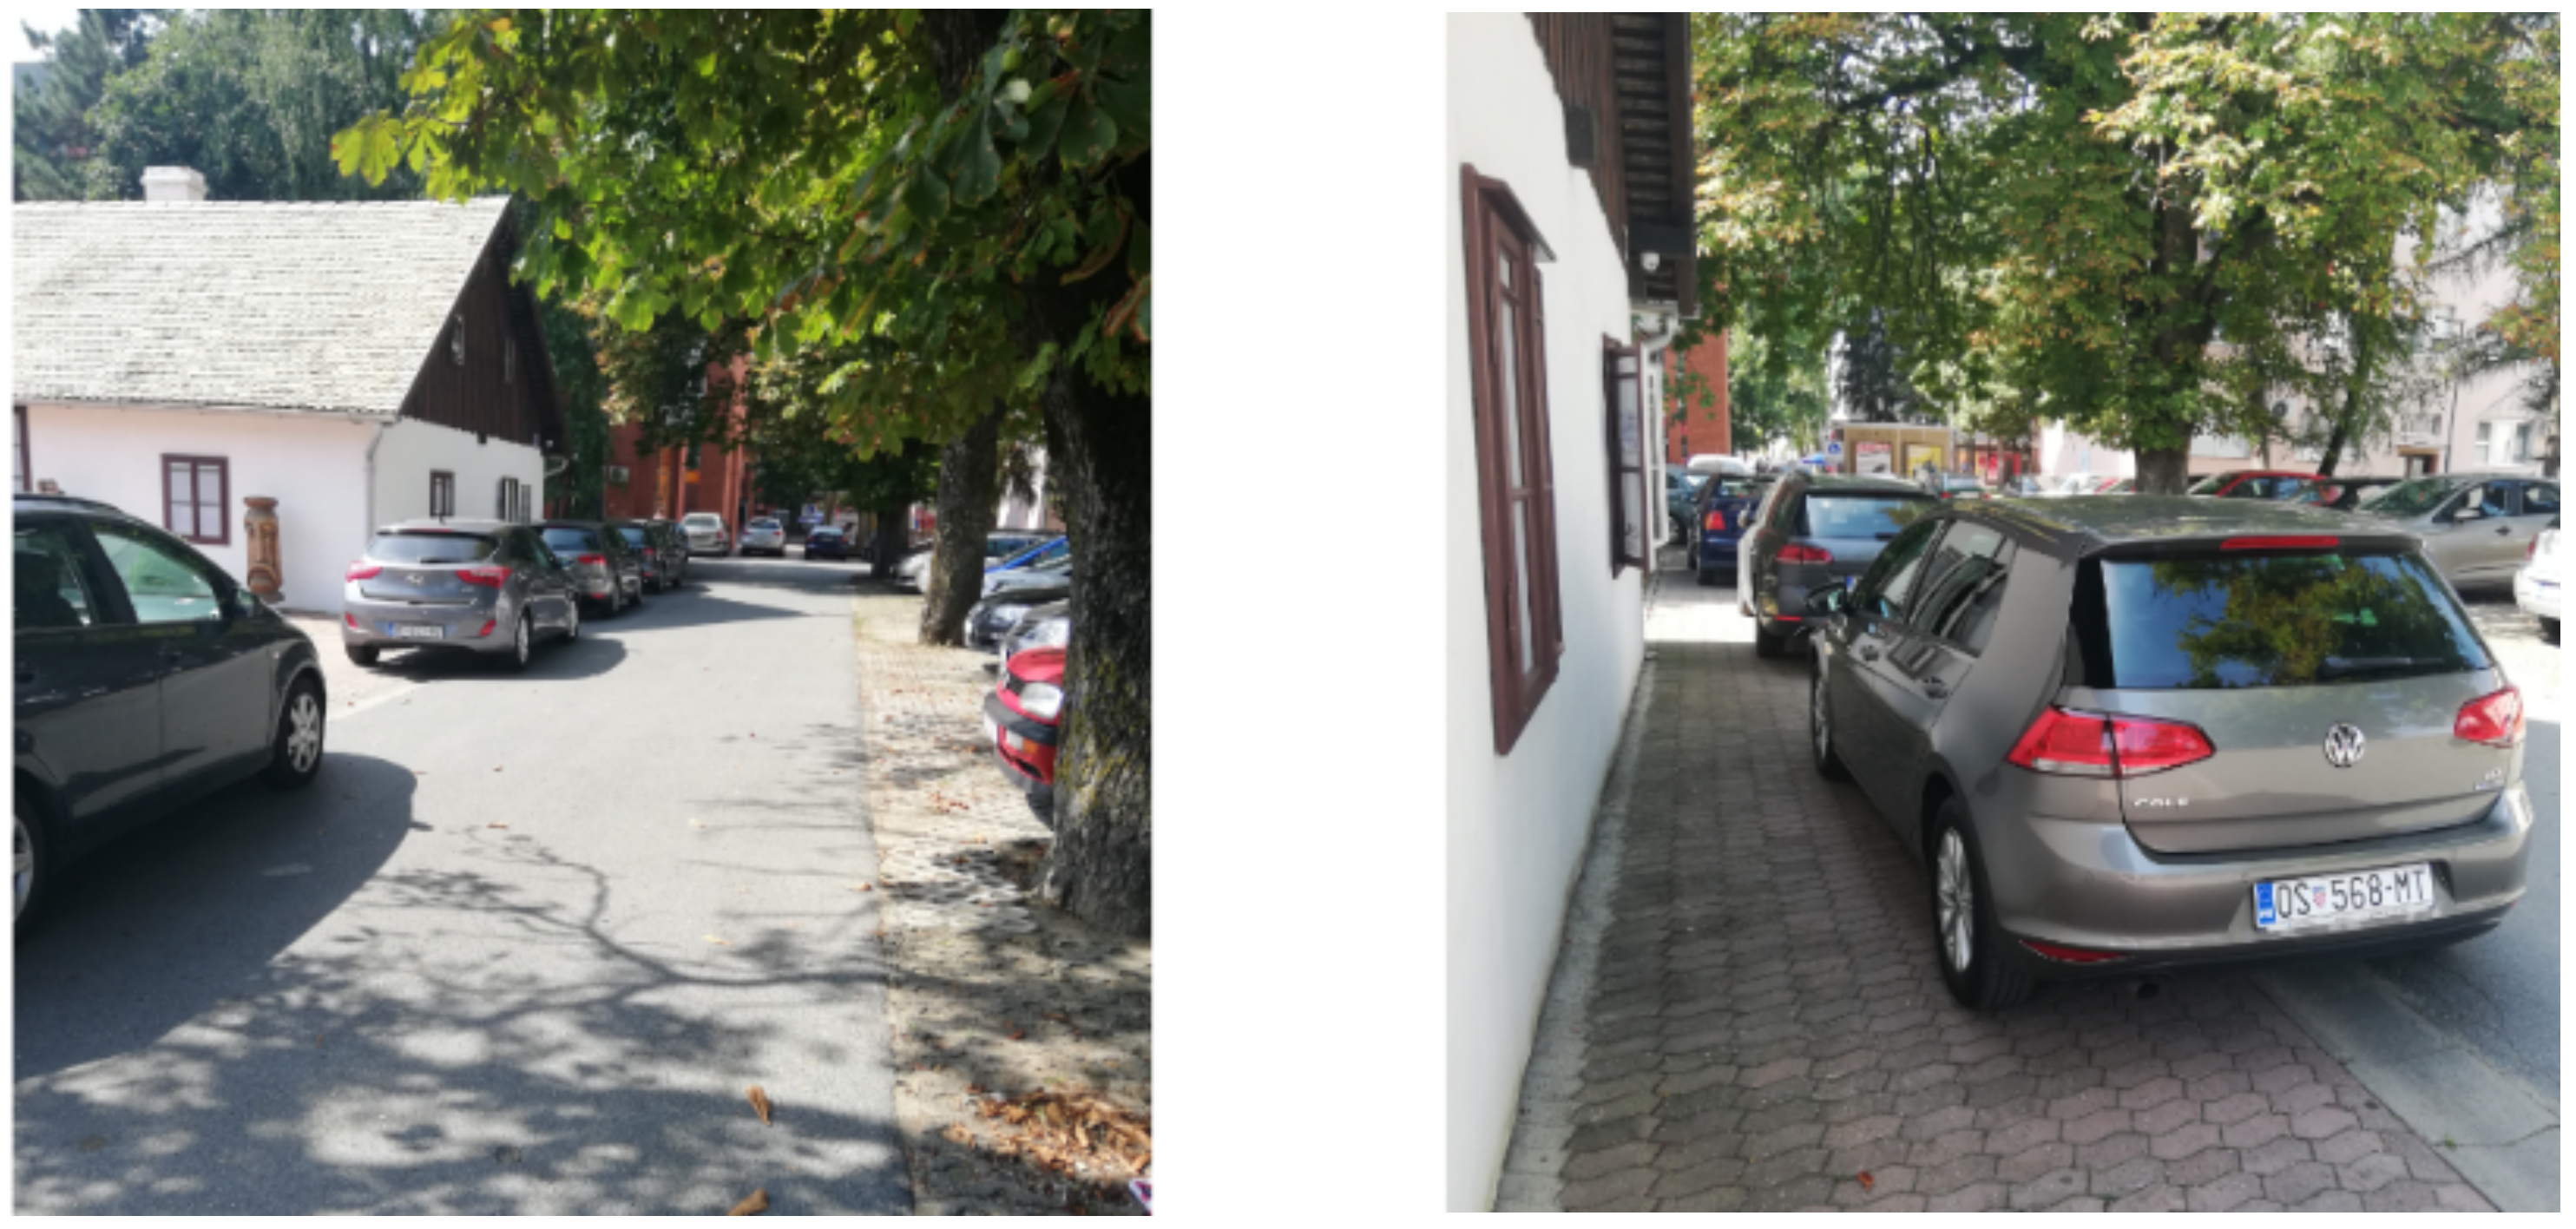
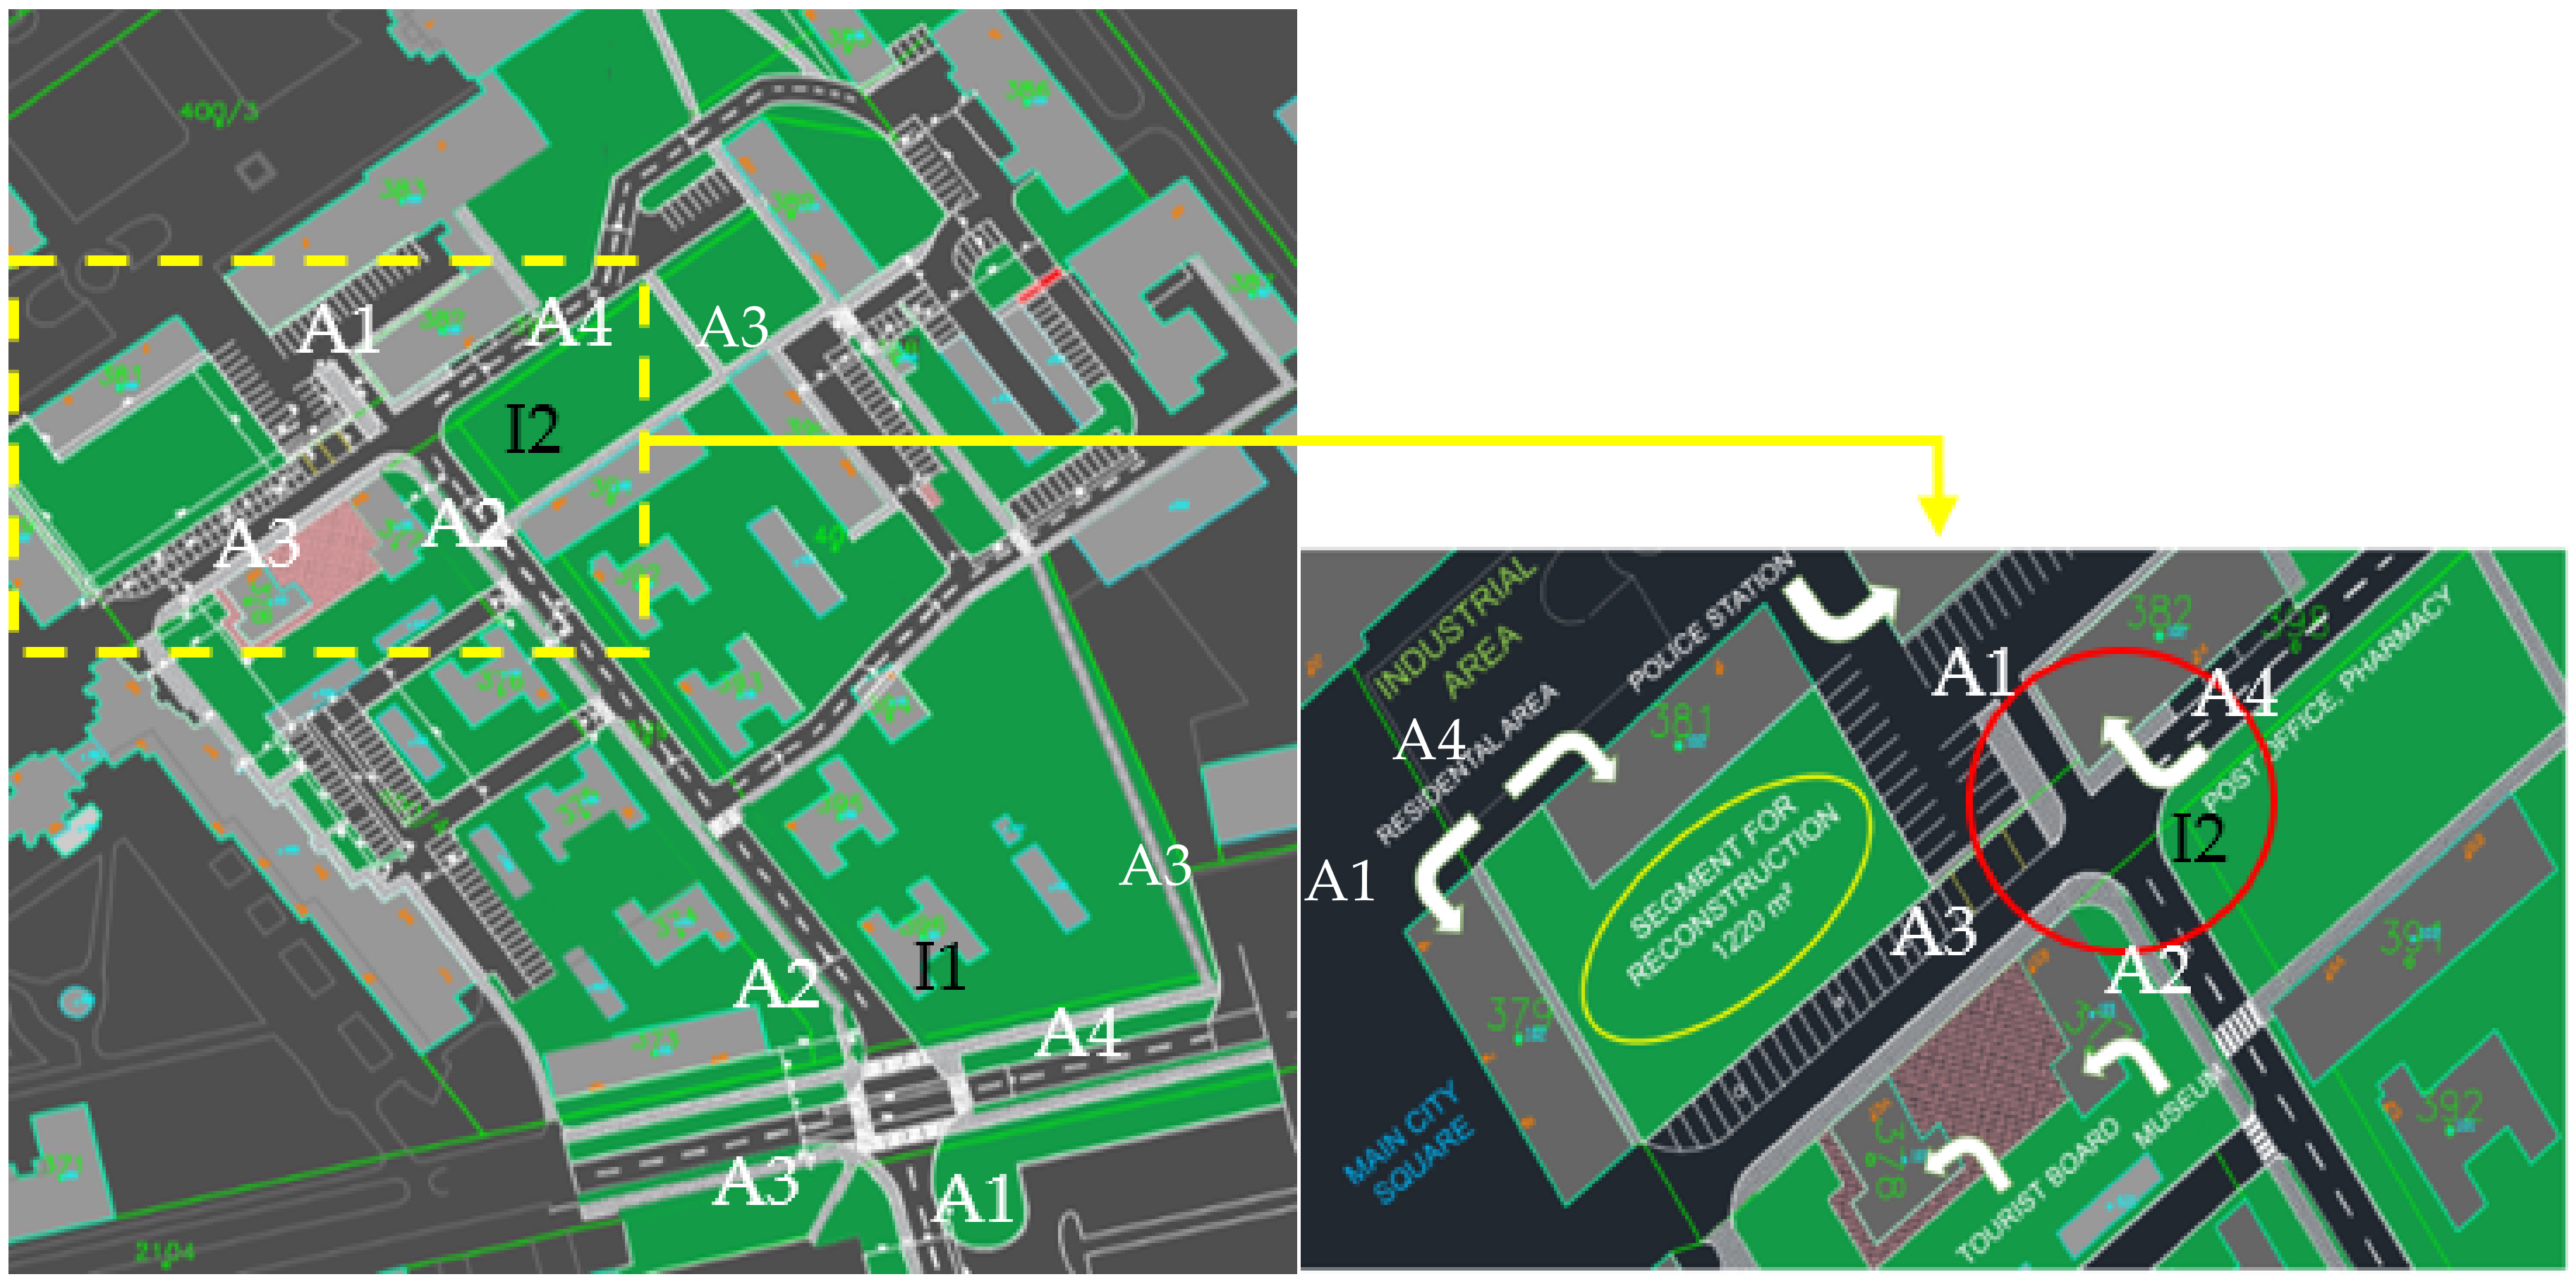
The reconstruction of traffic infrastructure in built and spatially defined urban zones according to the principles of sustainable urban mobility is a complex task. On the one hand, we have different transport users who have different mobility needs and modalities that include vehicle traffic demand, and on the other hand, there are traffic safety requirements, socially sensitive spatial design, environmental impact, and users and community costs that need to be reconciled in the limited available space. Active forms of mobility that are environmentally friendly have additional positive effects because they take up less space and are economically acceptable, so they are often the focus of designers when the reconstruction of transport infrastructure is planned in city centers.
Urban planners and analysts draw particular attention to the concept of urban “walkability”, which connects urban design and traffic infrastructure with wider objectives such as public health, ecological and economic objectives, and social equality. The very notion of walkability is complex and is used to describe quite different kinds of phenomena. Pikora et al. [8] presented the development of a framework of potential environmental influences on walking and cycling. The framework includes four features: functional, safety, aesthetic, and destination. Ewing and Handy [9] highlighted the five criteria for the evaluation of traffic infrastructure intended for pedestrian movement: imageability, enclosure, human scale, transparency, and complexity. Forsyth [10] analyzed walkability from three different points of view: conditions (walkable environments, infrastructure, quality, safety), outcomes (making places lively and sociable), and better urban places (walkability provides a holistic solution to a variety of urban problems). According to Ruiz-Padillo et al. [11], the concept of walkability refers to the extent to which a neighborhood is walking-friendly and defines three key influential factors: public security, traffic safety, and pavement quality.
The traffic safety of pedestrians is an important influential factor in selecting the modality of movement, and numerous studies have focused on the analysis of pedestrian behavior, particularly in the risky segments of the traffic network, such as zones of potential conflict between pedestrians and vehicle–pedestrian crossings. Various studies have been performed and models developed for predicting the behavior of pedestrians [12,13,14] and vulnerable groups such as children [15] and the elderly [16], with the aim of identifying the influential parameters on pedestrian behavior in the traffic safety analysis. The results of different studies show that pedestrian movement is under significant influence of the cultural heritage of a specific environment and traffic and spatial conditions; therefore, such models are not universally applicable [14,17].
The presence and optimal placement of functionally mixed urban contents in walking distance are the prerequisite for the choice of the pedestrian movement modality. Dovey and Pafka [18] analyzed density, functional mix, and access networks as key factors of urban pedestrian mobility, but highlighted a key distinction between walkability and walking. These factors ensure spatial prerequisites that can be motivating or demotivating, but do not directly cause walking.
Su et al. [19] identified the most common indicators in existing indicator classification frameworks—connectivity, accessibility, suitability, serviceability, and perceptibility—and established an indicator classification system through expert panel evaluation for auditing street walkability in China. Blečić et al. [20] presented a survey of operational methods for walkability analysis and evaluation that are potentially useful as tools for sustainability-oriented urban design.
Zuniga-Teran et al. [21] identified gaps and strengths in the Leadership in Energy and Environmental Design for Neighborhood Development (LEED-ND) certification system, through the lens of the nine categories of walkability—connectivity, land use, density, traffic safety, surveillance, parking, experience, greenspace, and community. Within this evaluation system, parking is mentioned as an important element in the evaluation of spatial potentials and shows a clear link between parking and pedestrian infrastructure planning.
A personal car spends around 5% of the total time in movement [22], so the planning approach to stationary traffic for personal vehicles, which adapts to the needs of users, was proven to be ineffective in the time perspective. Traffic infrastructure intended for stationary traffic is efficiently used as an influential factor when choosing movement modalities [23], and in the lack of space in urban-defined central parts of cities, urban areas should be ceded to more efficient traffic modalities.
Zahabi et al. [24] analyzed the impact of surface purpose, public urban transport offers, parking capacities, and parking prices on the choice of urban mobility modalities. The results of the study showed that a USD 1 increase in the hourly parking price would imply an increase of 5% in the probability of using public transport and a 10% increase in the public transport fare would represent a 10% average reduction in the probability of using public transport.
Available and quality transport infrastructure is a prerequisite, but not necessarily a decisive factor in choosing the modality of urban mobility, as shown by the comparison between mobility habits in different cities [25]. Motivational factors for the choice of mobility modalities include environmental [1], economic level, climate, available public transport services [24], etc. A deeper analysis of the complex psychological and sociological factors influencing mobility motivation is explored within the sociology of mobility [26]. Mobility can be analyzed as capital that has significant social implications. The mobility capital (motility) affects social integration and can be considered an analytical tool that allows the analysis of the relationship between the dynamics of spatial and social mobility [27].
In small towns (up to 10,000 inhabitants) [28], active traffic is traditionally present; however, the construction of traffic areas intended for motor traffic, particularly for fast traffic, jeopardizes the safety of such a manner of movement while the areas intended for stationary traffic are often organized in very attractive urban locations. During spatial and traffic planning and reconstruction, small towns should be observed through spatial particularities of such urban spaces [29]; however, the potential for preserving and revitalizing healthy and environmentally friendly movement lies exactly in the smaller urban areas.
The first step of analysis when planning road infrastructure reconstruction is to identify existing traffic demand; however, it is mandatory to look at the reconstruction solutions through the criteria of future traffic demand. The application of microsimulation traffic modeling enables the analysis of alternative reconstruction solutions in different time and space ranges [30], simulating the behavior of all traffic participants. The advantage of microsimulation modeling is that it enables the analysis of a significant number of traffic and spatial indicators of alternative solutions in the planning phase, as well as the possibility to analyze the reconstruction impacts on a wider network coverage and with future traffic demand [31]. Microsimulations allow for the comparison of variable solutions through numerically expressed functional parameters—driving time, delays, queue parameters, etc., and dynamic parameters—speed of each individual vehicle, average speed, and other indicators related to traffic flow. Microsimulations have proven to be a valuable tool in traffic infrastructure analysis [5,6], but their potential has not been sufficiently exploited in a broader spatial–traffic analysis, as enabled by multi-criteria analysis methods.
Considering the numerous criteria based on which an optimal spatial and traffic solution should be selected, in this paper we analyze the possibility of using multi-criteria analysis combined with the use of VISSIM for traffic microsimulations in the procedure of preliminary analysis of possible developments of the traffic system. Multi-criteria analysis was applied to select the best alternative for the restoration of areas and the reconstruction of systems.
During spatial planning and design, the multi-criteria analysis method is used to optimize the selection of a solution for different types of problems, and the application to big-scale problems has shown its effectiveness [32,33]. Although a significant aspect of scientific interest is developing in the direction of selecting the appropriate optimization method for a particular observed problem, taking into account different MCA methods (including the fuzzy approach), and comparing their adequacy regarding the specifics of the problem analyzed (as suggested by [34,35]), when it comes to planning and designing traffic infrastructure in urban areas, the most commonly used procedure is the Analytic Hierarchy Process (AHP) multi-criteria analysis method [4,36]. Based on the review of multi-criteria analysis method applications in decision-making about transport infrastructure from 2003 to 2012 done by Deluka-Tibljaš et al. [4], in 70% of analyzed scientific papers the AHP method was applied. Other applied methods, in a much lower percentage, were ELECTRE (Elimination and (Et) Choice Translating Reality), PROMETHEE (Preference Ranking Organization Method for Enrichment Evaluations), SAW (Simple Additive Weighting), TOPSIS (Technique for Order Preference by Similarity to Ideal Solution), etc.
Broniewicz and Ogrodnik [37], in their review of global literature from 2010 to 2019 conducted on the subject of MCDM/MCDA (Multi-Criteria Decision Making/Multi-Criteria Decision Analysis) methods used in transportation infrastructure, proved that the most popular method used to solve multi-criteria decision problems in the field of transport is the AHP method, followed by TOPSIS, DEMATEL (Decision Making Trial and Evaluation Laboratory), and PROMETHEE and ELECTRE.
The AHP method enables the optimization of solutions already in the planning phase when alternative solutions, in general, are not elaborated in detail, because besides the usual multi-criteria assessment of every alternative regarding each criterion separately, it also provides the possibility of pair-wise comparison of alternatives in relation to a specific criterion [38].
Alemdar et al. [39] used microsimulation and MCA (AHP and TOPSIS) to select the optimal corridor design and analyzed different solutions for three intersections on the Vatan Street corridor in İstanbul, Turkey. The evaluation criteria in the study were vehicle delay, queue length, stopped delay, stops, travel time, vehicle safety, CO emission, fuel consumption, and construction cost. In the study done by Bayrak and Bayata [40], three intersection types were modeled and tested using VISSIM software in line with parameters: capacity and level of service, travel time, average delay, queue length, fuel consumption, and vehicle exhaust emissions. Safety and construction costs were added. A new model was then generated using the VISSIM results and the AHP results. Du et al. [41] used a combination of VISSIM microsimulation and AHP methods to create a model to evaluate access management. Alemdar et al. [42] applied AHP and VIKOR methods to optimize the position of pedestrian crossings on the road corridor in a case study in Erzurum, Turkey. Microsimulations in VISSIM were applied in the assessment of the impact of individual scenarios of pedestrian movements on the traffic conditions of the observed coverage.
A review of the literature shows that in recent times the results of microsimulations have been used as input data of MCA methods (most often AHP methods). In doing so, functional indicators are predominantly used, with the addition of cost and safety parameters.
Functional indicators obtained by applying microsimulations represent one of the five groups of criteria on the basis of which alternative solutions are evaluated in this paper. Each group of criteria brings one specific aspect of the evaluation of the solution, and their importance was analyzed by different stakeholders. The addition of spatial–urban criteria introduces a set of qualitative parameters that are psychologically and socially oriented and focused on the subjective experience of different stakeholders. Involving stakeholders in the evaluation of alternative solutions is not a completely new approach, but, like the application of microsimulations, it is insufficiently used in the broader context of the evaluation of alternative solutions. In this paper, the MCA (AHP method) and microsimulation methods are combined in order to achieve sustainable traffic goals in making decisions for a small city area, respecting relevant criteria for socially sensitive design but also local conditions by including local inhabitants as relevant stakeholders.

3. Study Area

The town of Belišće is an industrial town with around 10,000 inhabitants, is one of seven towns in Osijek-Baranja County, and covers a surface area of 68.75 km2. The geographical and traffic position of Belišće makes this town the intersection of important regional road corridors.
The town of Belišće is associated with a 130-year-long industrial tradition of the production and processing of packaging paper, which plays an important role in the economic development of the region. Since 1998, a hydraulic press factory for the production of car tires has been operating in the inner city center of Belišće. The factory is predominantly export oriented and represents an important social and traffic pull factor. Industrial zones located near the town center (Figure 1) generate several major problems in the urban traffic network of the town of Belišće. The insufficient hierarchical structure of the urban network brings freight traffic to the very periphery of the secondary network, which is a significant functional and traffic safety problem.
In addition, increased traffic of trucks and heavy freight vehicles cause economic problems by means of accelerated deterioration of the pavement structure and environmental problems such as noise and air pollution. The observed problem should be seen in the context that Belišće does not offer public city passenger transport, except for a taxi service, and the choice of modalities is reduced to a private car or taxi car and active forms of mobility.
The reconstruction zone is a central city zone, which, with 86 existing parking spaces in the observed coverage, cannot meet the requirements of stationary traffic. The city center is an administrative center with a number of public facilities (post office, police, health center, pharmacy, museum) that generate the need for a greater dynamic of stationary traffic (stopping and short-term parking). Within the considered segment of the traffic network, there is also a residential zone with long-term parking requirements. The vicinity of the industrial zones puts an additional pressure to the infrastructure intended for stationary traffic and a large number of workers who come to work cannot park their cars near the factories (Figure 2).
The wider analyzed coverage of the secondary network is shown in Figure 3 (left). The subject of reconstruction are the traffic areas of the secondary network, parking lots, and pedestrian paths shown in Figure 3 (right). The intersection on the access road marked in red is, according to the traffic count results, a critical point of the narrower secondary network reconstruction area, which is included in the model and analysis of functional characteristics of the alternative solutions.
Traffic was recorded and counted several times in May 2019 under standard conditions—Tuesdays and Wednesdays at peak hour, from 2 to 3 pm, and the mean value of the total monitored motor traffic network coverage expressed in the equivalent units of a personal car (PCU) distributed on the traffic routes is shown in Table 1. The access points (A1–A4) for both intersections are marked in Figure 3 for the intersection located at the periphery of the reconstruction zone (I1) and for the intersection within the reconstruction zone (I2). In the mixed flow with motor vehicles, there were cyclists who were not counted in equivalent units, to highlight the frequency of this form of mobility (Table 1). The same table contains the existing traffic demand for pedestrian movements.

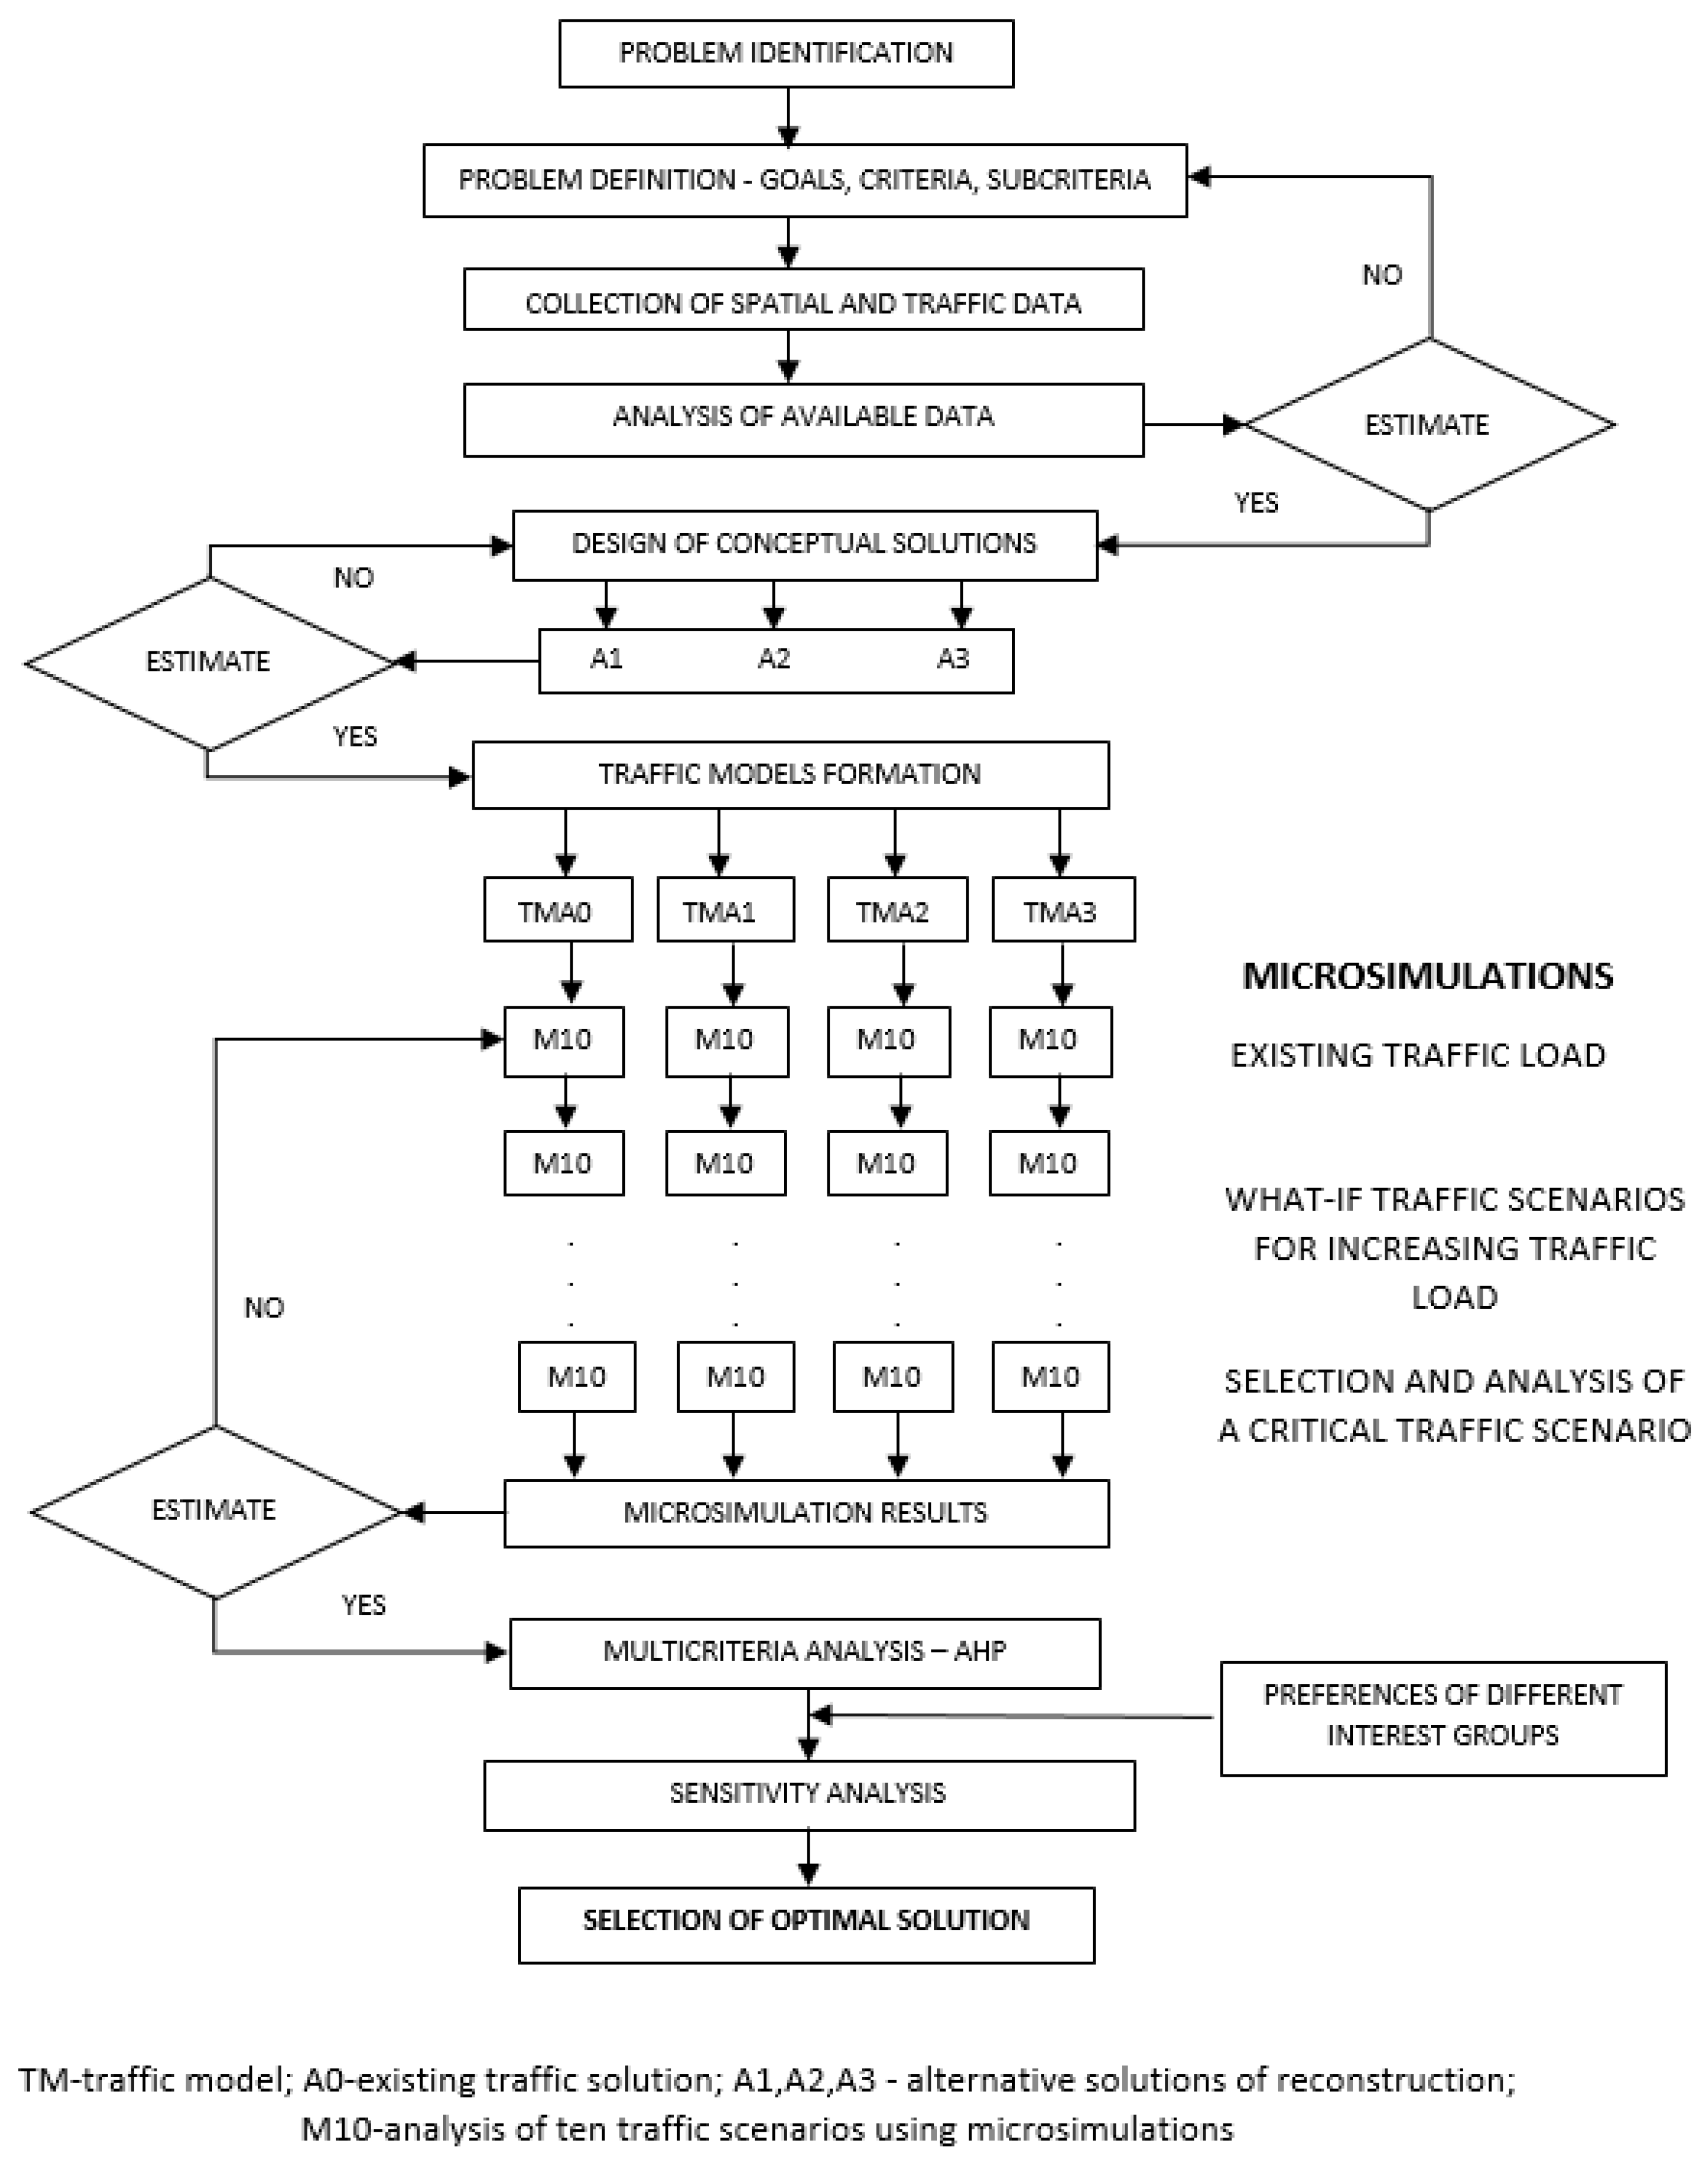
4. Materials and Methods

To select the optimal traffic solution for Belišće town center, the multi-criteria analysis (MCA) method was used in combination with the traffic micro-simulation method for preliminary screening of traffic development alternatives based on the expected traffic demand in the project period.
The MCA is applicable if a choice must be made between several solutions based on a larger number of criteria and different, both quantitative and qualitative, measures [44,45]. Although the problem of decision-making related to different infrastructure in urban areas is based largely on common principles, there are certain specifics for different types of infrastructure planning, so for a more detailed analysis, each infrastructure should be observed separately with the definition of specific criteria.
The selection of criteria in the multi-criteria analysis is a sensitive step in particular when quantitative and qualitative indicators are combined. A large number of criteria can be confusing for decision-makers and a small number of criteria does not provide an analysis of all relevant information [46]. The application of quantitative indicators contributes to the objectification of multi-criteria analysis, but the problem is that the selection of the optimal solution is done at the early project stages, when there is not enough detailed data, so the quantification of indicators is a challenging task. The criteria groups, criteria, and sub-criteria for the subject case study are explained in more detail in Section 4.1.
Significant support for decision-makers is provided by the tools of traffic modeling—traffic micro-simulations, which are used to analyze and compare alternative reconstruction solutions. Modeling results are functional traffic indicators such as travel time, delays, length of the vehicle queue, number of stops, delays related to stopping, level of service, dynamic characteristics, etc. Within the modeling results, it is possible to obtain environmental indicators (emissions of harmful gases, etc.), as well as economic indicators expressed through fuel consumption. Keeping in mind that this is a microsimulation model, said traffic indicators can be obtained for each specific entity within the simulation (personal vehicle, public transport vehicle, truck, cyclist, pedestrian) and also as mean values of indicators for individual traffic flows or in total for the observed network coverage. At each second of the simulation, the model calculates the spatial positions and dynamic characteristics of each entity and their interactions defined through the input parameters of traffic regulation, priority rules, and characteristics of the behavior of traffic participants. The modeling results are quantitative indicators, and the advantage of the model lies in its high-quality graphic interpretation, so it is possible to make a movie in 3D mode on the operationalization of the observed spatial solution, which enables a realistic insight of the spatial solution for decision-makers and the general public.
Due to the requirements of the analysis of alternative solutions (alternatives), the mean values of traffic indicators were analyzed, which provided a sufficiently realistic insight into the quality of the alternatives for the purposes of their comparison and evaluation. The calibration of the VISSIM model was not done specifically for Belišće, but the application of the VISSIM model on roundabouts in the city of Osijek, Croatia, made a difference between modeled and measured data in situ: around 10% for the uncalibrated and less than 5% for the calibrated model [47]. The town of Belišće is in the immediate vicinity of the city of Osijek, so the input parameters of the VISSIM model associated with driver behavior were shown to be applicable. The selected functional indicators for this analysis level were total delays, maximum queue length, number of stops, delays caused by stopping, and level of service (LOS). Functional indicators were analyzed for the existing traffic demand (determined by the traffic counting) and for the various scenarios of future (presumed) traffic demand, which includes an increase in the traffic load of vehicles, cyclists, and pedestrians. A larger offer of parking spaces, cycling paths, and a well-maintained pedestrian promenade are the pull-factors of the traffic load that were taken into account when evaluating the alternatives of reconstruction.
Traffic is stochastic by nature, so in order to get the modeling results to be as realistic as possible, 10 different driving scenarios of vehicle arrivals were analyzed, and the considered traffic indicators are the average values of functional indicators of each analyzed traffic scenario. The initial value of the random number generator (random seed) was a default value and the set increment was 10. The same 10 traffic scenarios were analyzed for the current state and for each alternative solution of reconstruction in order to ensure comparable simulation results.
Within this study, the microsimulation traffic models for the secondary road network for the existing situation (solution zero—A0) and for alternative reconstruction solutions (A1, A2, A3) were developed in VISSIM. The aim of the application of the microsimulation traffic models was to analyze alternative reconstruction solutions and to evaluate them based on the available simulation results according to the selected functional criteria, which were incorporated into the procedure of the multi-criteria analysis of alternatives.
In addition to functional indicators, the simulation results provided information regarding an environmental criterion—the emissions of harmful gases, and an economic criterion—user costs through fuel consumption, which was included in the evaluation through the defined criteria. The results of the microsimulation were sufficiently accurate as relative indicators for the purpose of comparing alternatives, but we could not use them as absolute values, so more sensitive models with more spatial input data [48] should be used to model air pollution.
Multi-criteria optimization methods are applied to ill-structured problems, including those related to planning and designing traffic infrastructure. Ill-structured problems are those with very complex objectives, often vaguely formulated, with many uncertainties, and the nature of the observed problem gradually changes during the process of problem solving [49]. The results of ill-structured problems are different dimensions’ criteria for the evaluation of solutions and variable constraints.
The alternative solutions in the case study were analyzed using the AHP multi-criteria analysis methodology [7,44,46,49].
AHP is a priority method applicable to problems that can be represented by a hierarchical structure [7]. The top of the hierarchy is represented with the goal, one level lower are criteria, with more levels of (sub)criteria possible, while the lowest level is represented by alternatives.
The basic methodological steps applied in this research are shown in Figure 4.
The AHP method is based on estimating relative priorities (weights) of criteria and alternatives on which a pair-wise comparison matrix for criteria and pair-wise comparison matrices for alternatives (one matrix for each criterion) are generated. The pair-wise comparison of alternatives regarding their importance with respect to each criterion or pair-wise comparison of criteria respect to the goal is done using the pair-wise comparison scale shown in Table 2.
The result of the AHP method is the overall priority vector that defines the priority (weight/importance) of each alternative with respect to the goal so the ranking of alternatives can be made.
The advantage of this multi-criteria method is that it can be used when just the pair-wise comparison of alternatives according to each criterion and the pair-wise comparison of criteria towards the goal are known, but also when the alternatives are exactly valued in regard to each criterion separately—that is, if the importance of every single criterion is exactly defined, but it also gives the possibility to combine these two approaches in the same analysis. This was applied in our research.
In this case study, the application of the AHP methodology was based on a total of 5 criteria groups: functional criteria, traffic safety criteria, economic criteria, environmental criteria, and spatial–urban criteria. Each alternative was evaluated according to each criterion and sub-criterion defined within the specified criterion group. Within each of these groups, part of the (sub)criteria were defined by measurable values except in a group of spatial–urban criteria assessed based on the collected subjective evaluations of criteria given by different categories of stakeholders—local population, experts, and students—whereas economic criteria of construction and maintenance costs were analyzed by alternative pair-wise comparison.

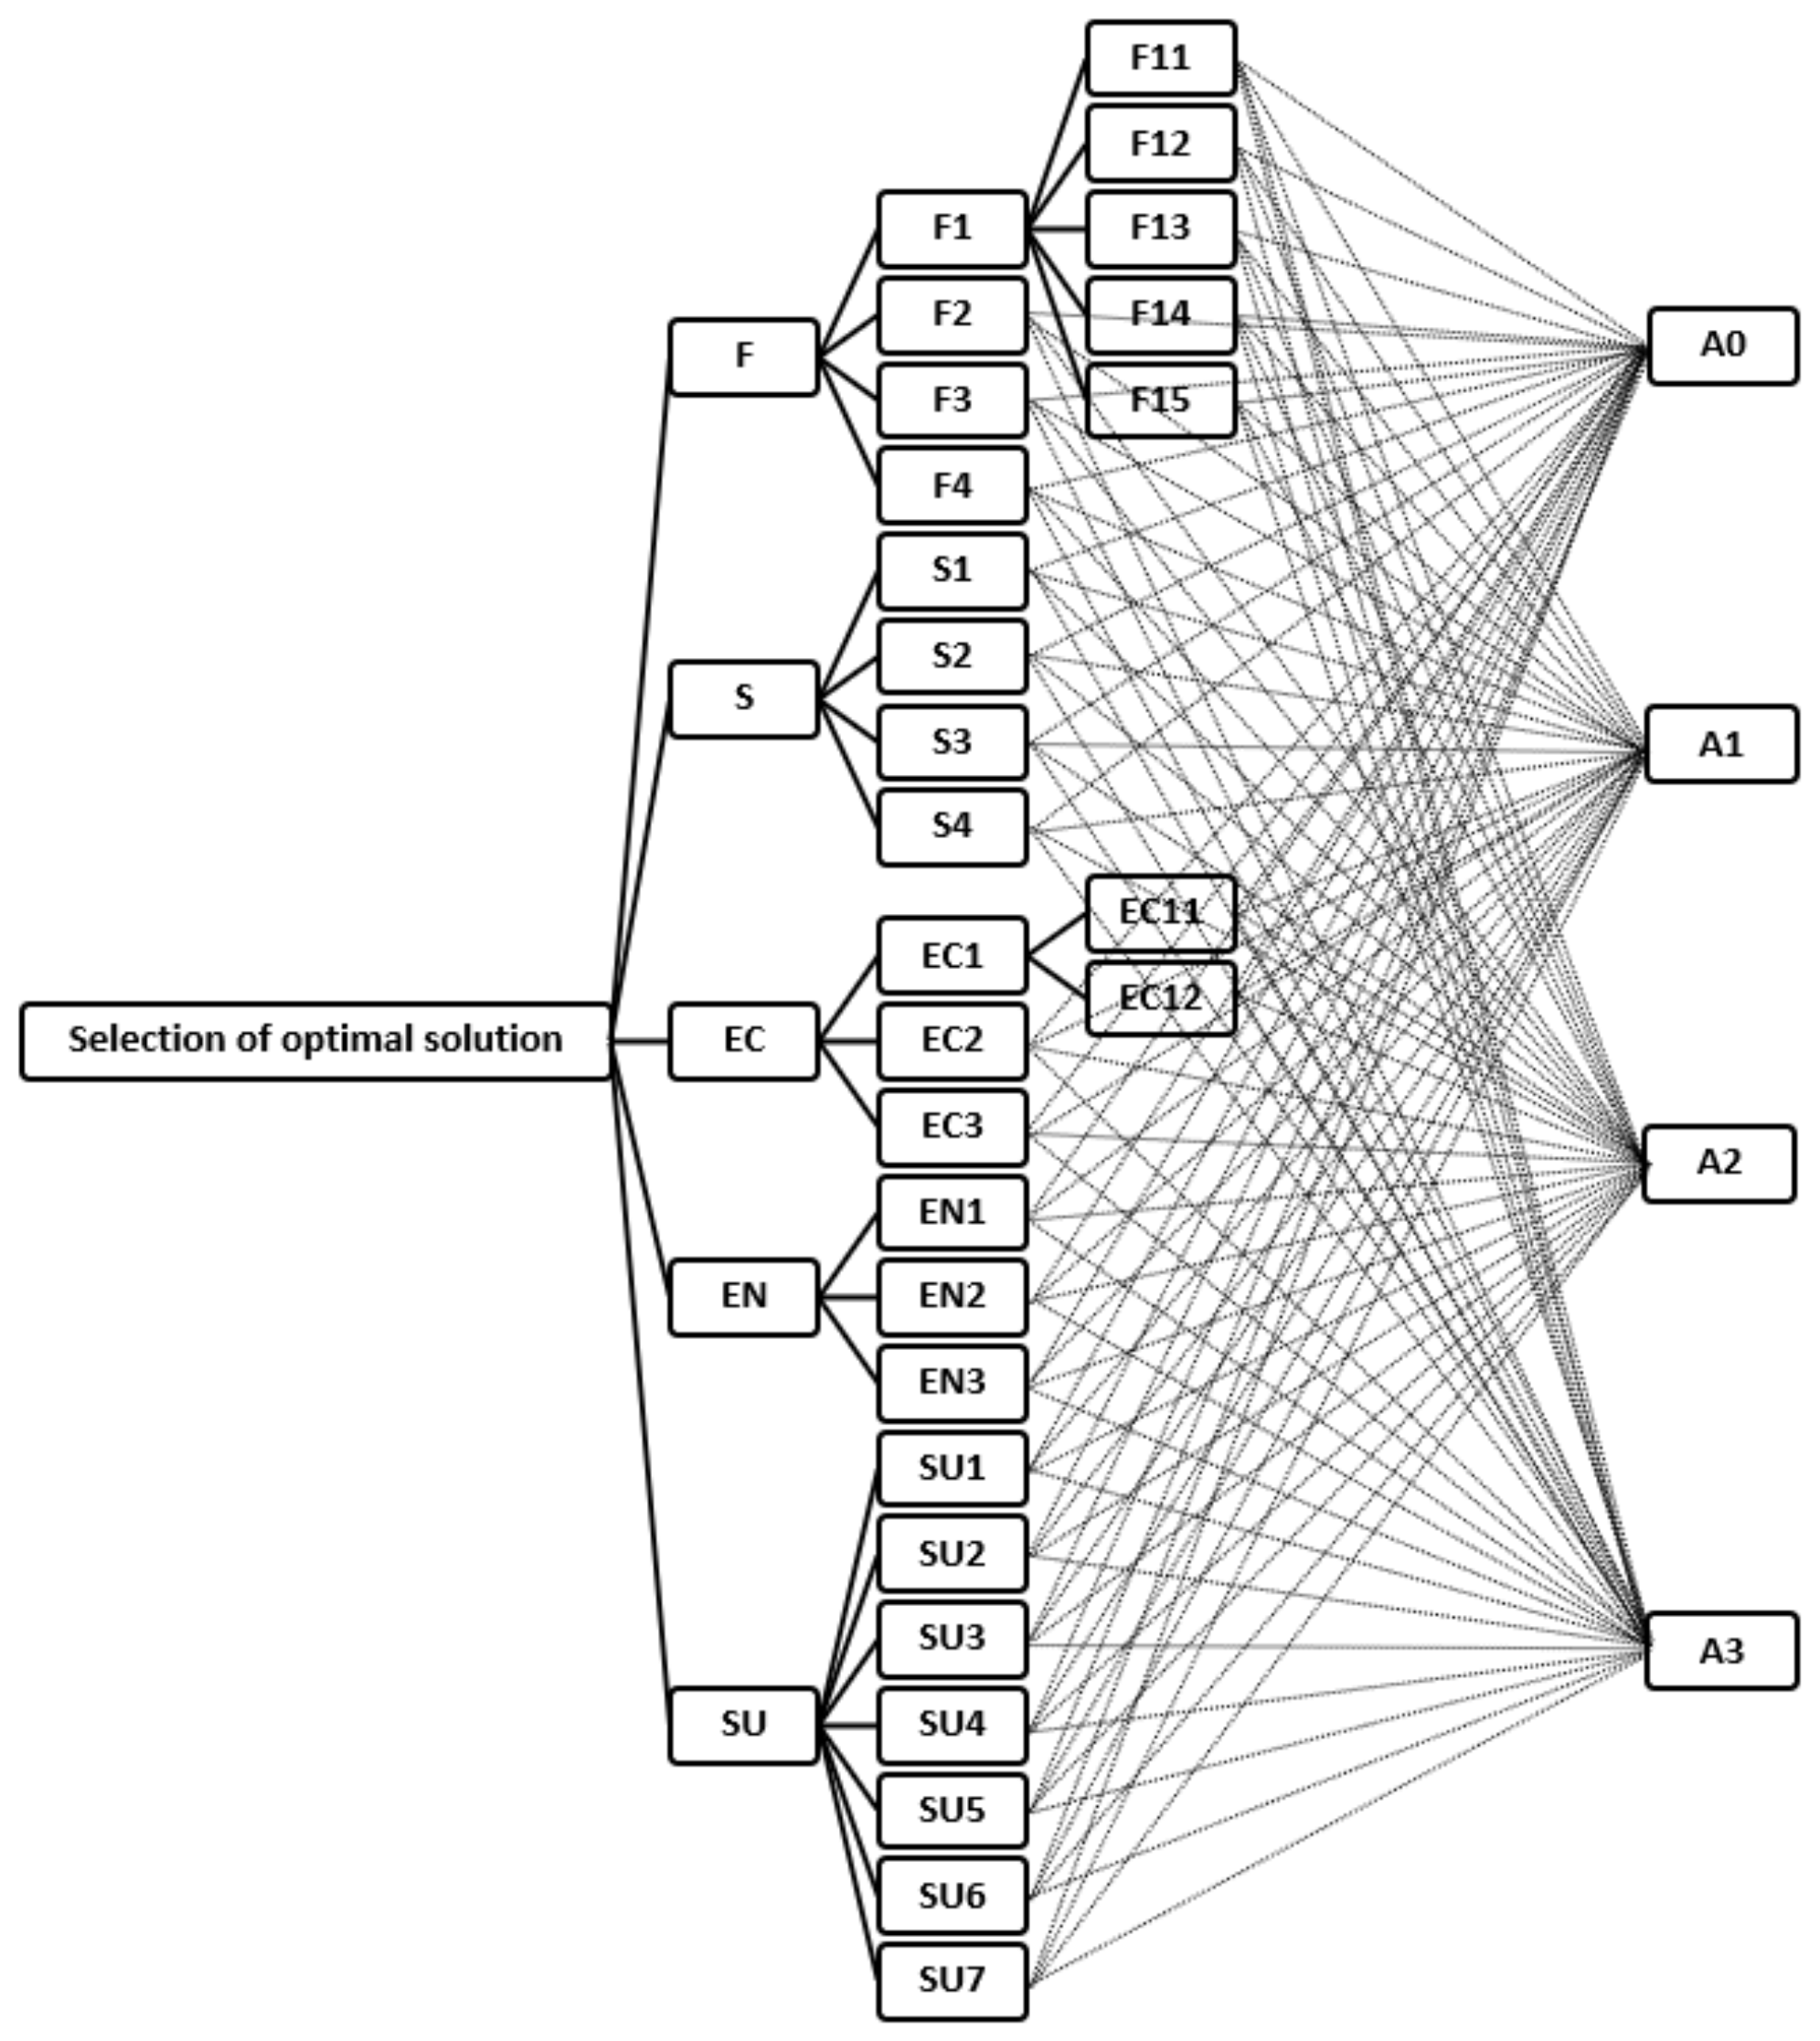
4.1. Problem Definition

In the process of spatial and traffic planning, the definition of solutions starts with a clear identification and definition of the problem by defining the basic elements needed for the implementation of the procedure: expected outputs—goals, required input data, definition of expected limitations, and criteria according to which the alternative solutions will be evaluated.
The goal of the project was to meet the traffic demand of different traffic users in Belišće town center, according to the principles of sustainable urban mobility. The data collected from field research and from the existing documentation related to the coverage area served as a basis for the development of alternative solutions [50].
The selected criteria for the assessment of the alternatives using MCA are briefly explained below:

4.1.1. Functional Criteria—F

The functional criteria were used to evaluate the extent to which a particular alternative solution meets the traffic multimodal requirements of certain categories of users, as visible from the selected criteria and sub-criteria. The requirements and quality of traffic flow needed to be analyzed for the current and future traffic load, which, by analyzing different scenarios for increasing traffic load, would be evaluated as critical. Traffic requirements of cycling and pedestrian traffic as well as of stationary traffic were analyzed. The traffic conditions and the interaction of multimodal traffic in conflict zones was evaluated through five of the functional criteria for future traffic demand.
  • F1—functional traffic criteria of motor vehicles and integrated flows and traffic interactions for a critical traffic scenario of future traffic demand, obtained as a result of the application of traffic microsimulations in VISSIM.
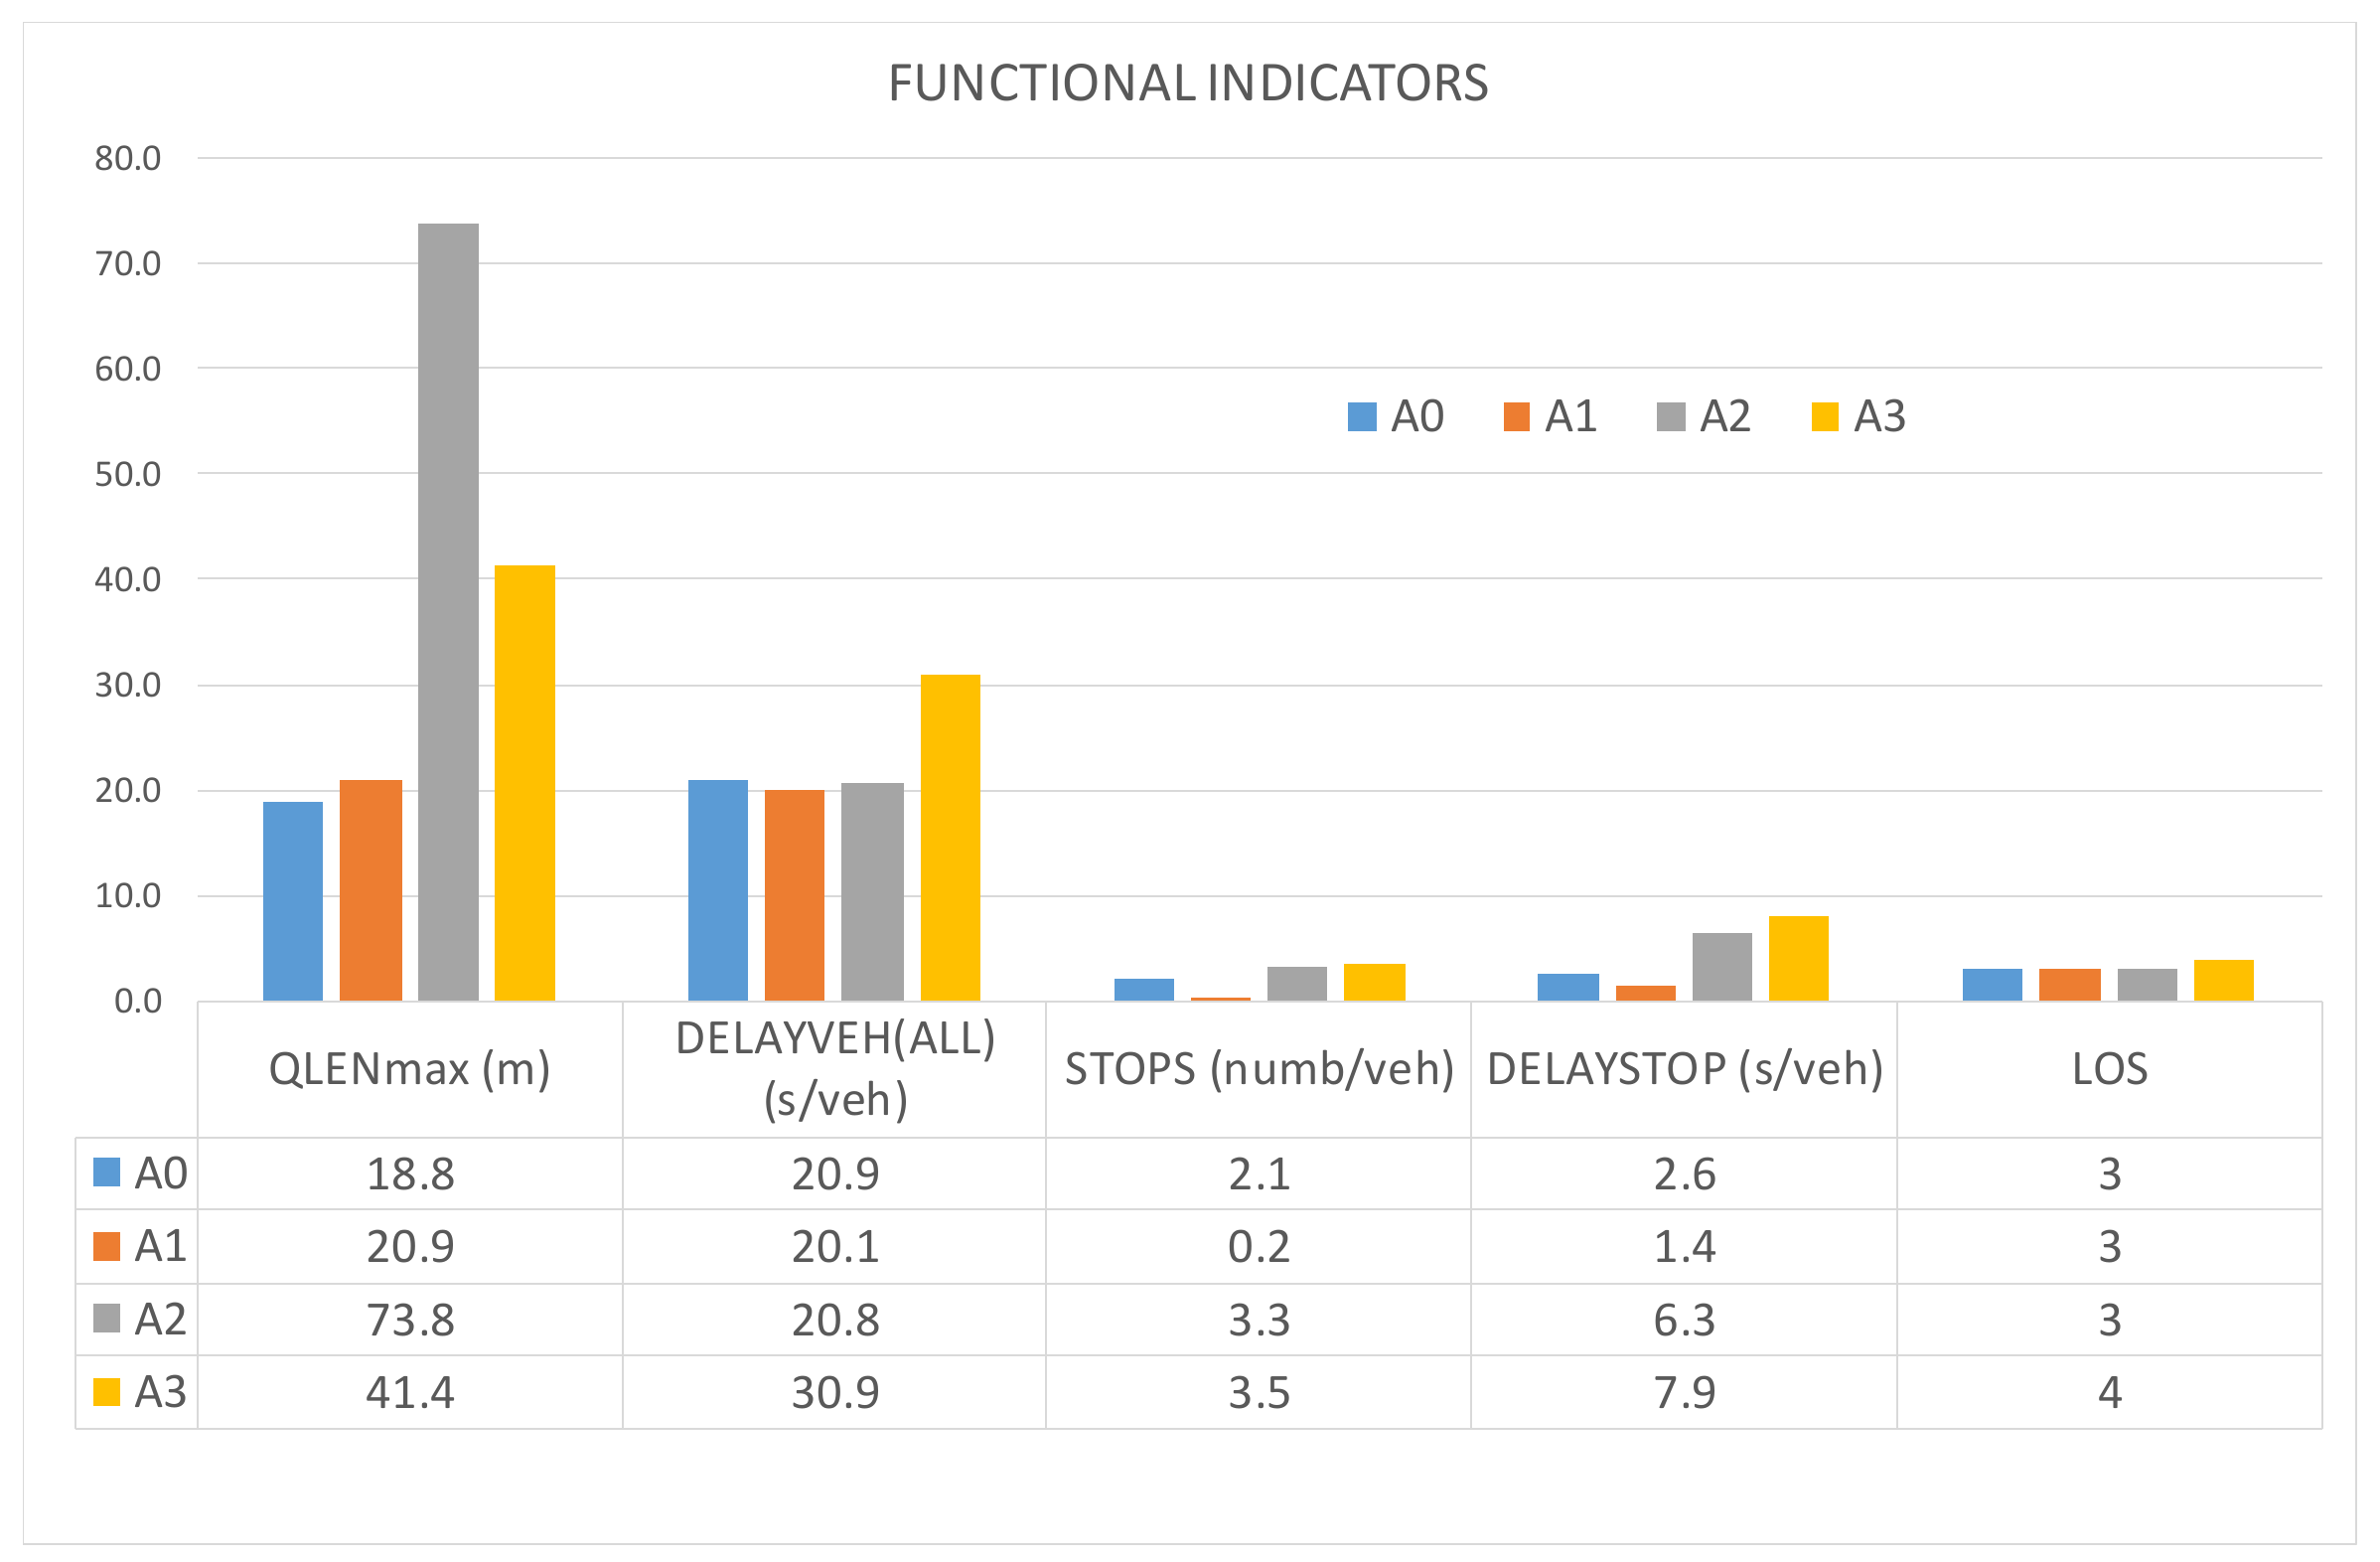
    • F11—the maximum queue length (m) is the longest line that appears within the traffic simulation and the traffic conditions of the peak load are simulated for 3600 s, i.e., 1 h.
    • F12—total mean delays per vehicle (sec/veh) are time losses caused by all influential parameters, such as traffic load, traffic structure, type of conflict flows, traffic regulation, reaction time of traffic participants, dynamic conditions of each entity (driving speed, acceleration, deceleration, pedestrian speed), safety clearance, the influence of infrastructure elements, etc.
    • F13—the average number of stops of each vehicle (number) in the traffic flow caused by traffic conditions, traffic regulation, conflict flows, parking/unparking, etc.
    • F14—the average delays caused by stopping per vehicle (sec/veh) are a measure of the complexity of individual traffic situations and interactions, because there may be traffic scenarios in which there are more short stops, or traffic scenarios in which there are fewer stops, but traffic circumstances are complex and stops last longer.
    • F15—the level of service (LOS) demonstrated categorically from A to F is a qualitative indicator of traffic conditions and is ranked in six levels, where the conditions of traffic flow of level A are the best and consistent with the movement of vehicles in free flow, and level F practically means standing or very slow forced movement in a line of vehicles. The basis for evaluation of the level of service is the user-oriented parameter expressed through the mean delays, unlike the previously used theoretical criteria of reserve capacity.
  • F2—functional traffic criterion of bicycle traffic expressed through the length of bicycle paths (m).
  • F3—functional traffic criterion of pedestrian traffic expressed through the length of pedestrian infrastructure (m).
  • F4—functional traffic criterion for stationary traffic expressed through the number of parking spaces.
F2, F3, and F4 are defined in the project for alternative solutions (Section 4.2).

4.1.2. Safety Criteria—S

Direct traffic safety indicators such as the number of traffic accidents and the number of severe traffic accidents (with a dead or seriously injured person) could be analyzed only for the existing traffic solution (A0), so the safety criteria were analyzed through indirect indicators.
  • S1—speed (km/h) is correlated with the number of traffic accidents and is highly correlated with outcomes, i.e., the severity of traffic accidents, especially in the vehicle–pedestrian interaction. The increase in speed from 30 km/h to 50 km/h increases the likelihood of fatal and severe outcomes for pedestrians from the range of 5–22% to the range of 45–85% [51]. The mean speed is obtained by applying the traffic microsimulations in VISSIM.
  • S2—the degree of segregation (expressed through the number of separated traffic flows) is an indicator of how many traffic flows have separate areas for movement. The pedestrian flows are the last to be integrated into the common traffic area, and this must be hierarchically (secondary network, access street), safety-wise (vehicle speeds adjusted to pedestrian walking speed), and functionally (low traffic load) justified.
  • S3—the number of potential conflict points (number) of opposing vehicle–vehicle traffic flows.
  • S4—the number of potential conflict points (number) of opposing vehicle–pedestrian traffic flows.
S2, S3, and S4 are assessed from the project for alternative solutions (Section 4.2).

4.1.3. Economic Criteria—EC

The economic criteria are usually assessed through the cost of construction, maintenance, the value of the facility at the beginning and at the end of the planned period, the direct and indirect costs of users, etc. Due to the level of project documentation, the cost of construction and maintenance costs could not be expressed in numerical terms, but were analyzed by comparing the solution pairs as one of the options, i.e., benefits of the AHP methodology.
  • EC1—construction cost–pair-wise comparison.
    • EC11—reconstructed area in m2.
    • EC12—use of modern technologies (camera/displays with data about the number of available parking spaces)
  • EC2—maintenance cost–pair-wise comparison.
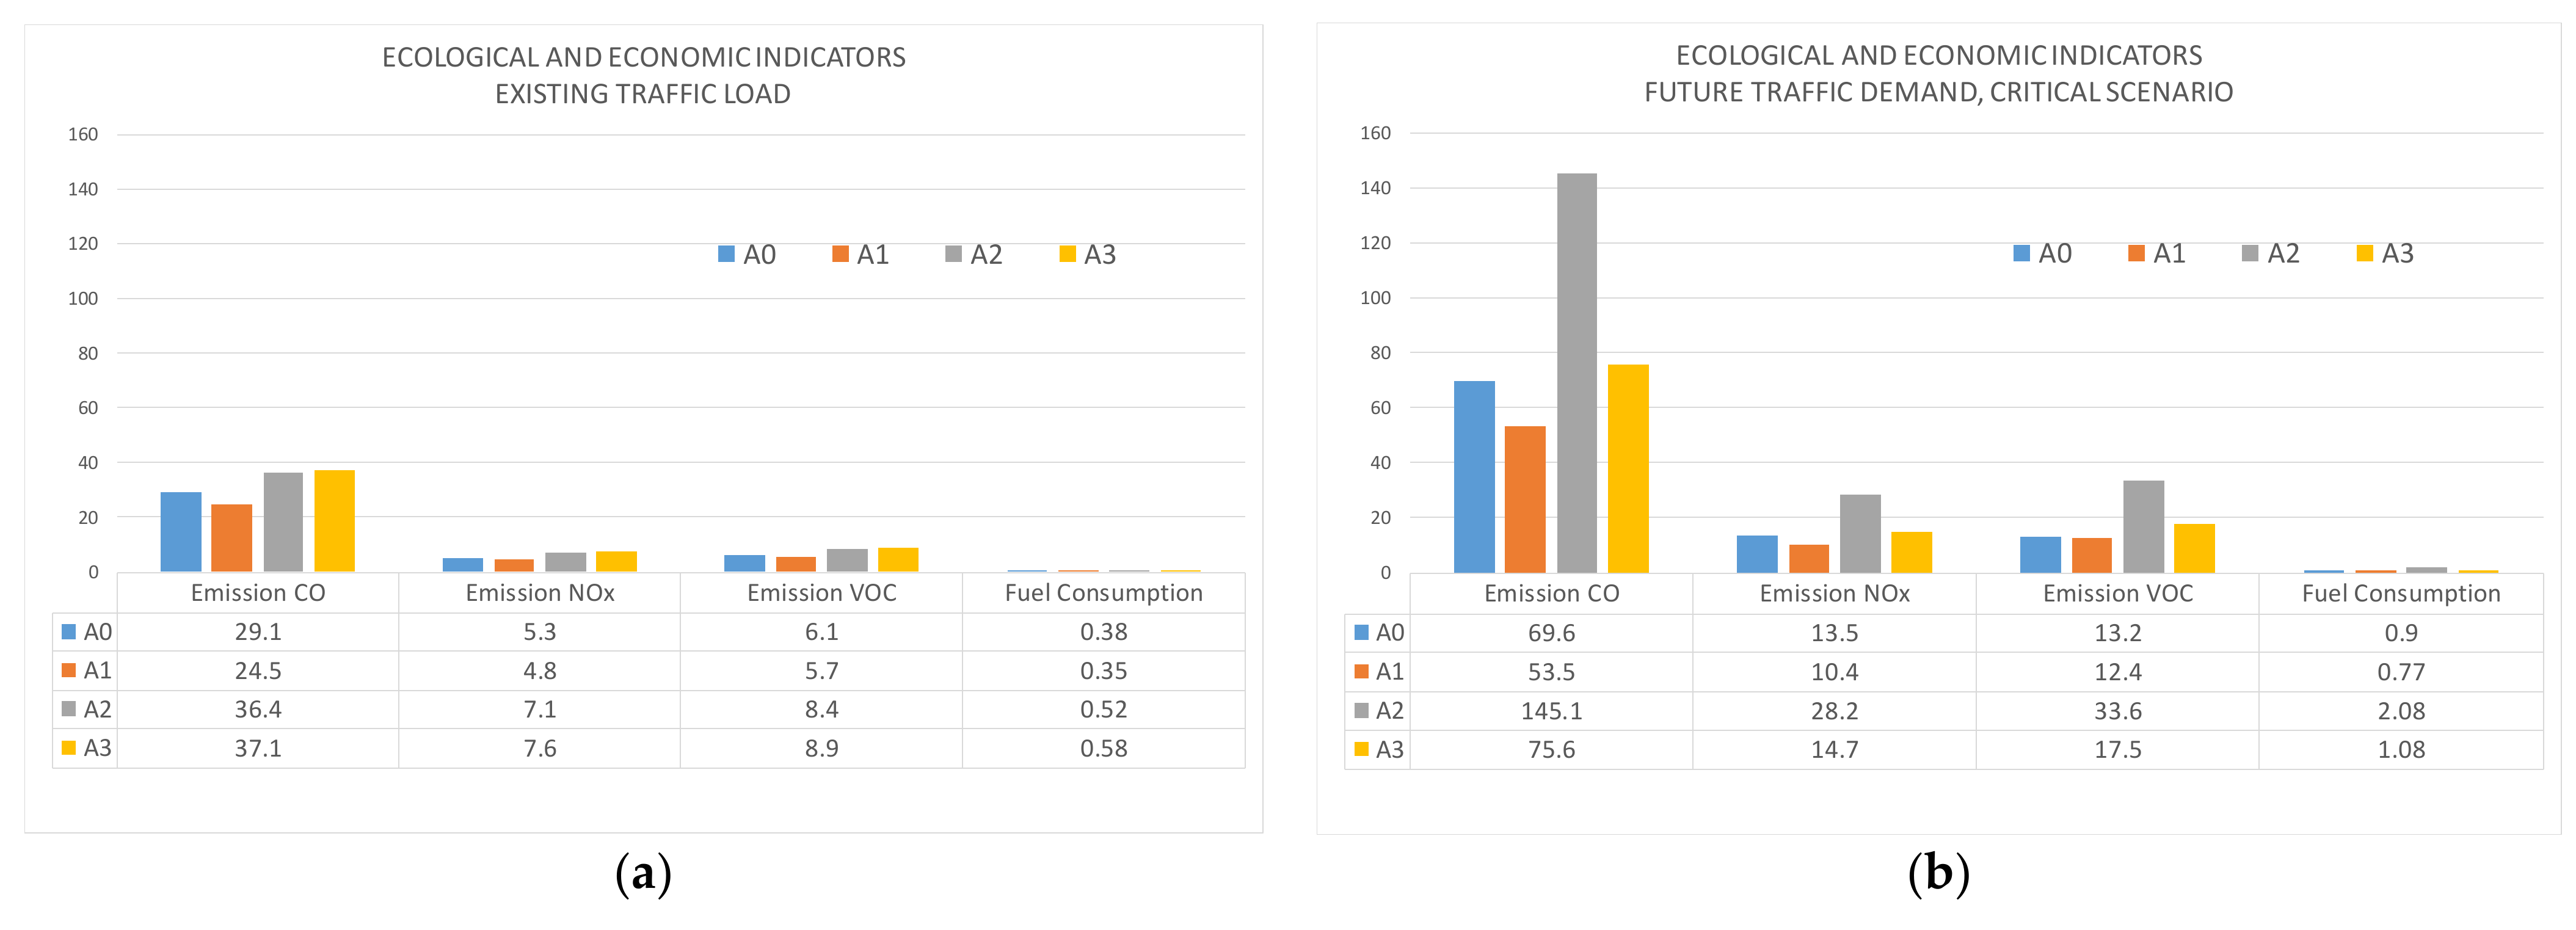
  • EC3—fuel consumption (US gal lqd) for a critical traffic scenario of future demand, obtained as a result of micro-simulations in VISSIM.

4.1.4. Environmental Criteria—EN

Environmental criteria were assessed through the quantity of exhaust gases in grams for a critical scenario of future traffic demand, and were derived from the results of micro-simulations in VISSIM. The reported numerical indicators could not be used as an absolute, but rather as relative indicators for analysis and comparison of alternative solutions.
  • EN1—carbon monoxide (CO) emission in grams.
  • EN2—nitrogen oxide emission (NOx) in grams.
  • EN3—volatile organic compounds (VOC) in grams.

4.1.5. Spatial–Urban Criteria—SU

The spatial–urban criteria are qualitative indicators expressed through the selected criteria describing the attractiveness of the solution and the spatial potential. These qualitative indicators include a subjective experience, and in this study, we analyzed subjective evaluations of performance of alternative solutions according to the criteria expressed in surveys by different target groups.
  • SU1—walkability potential and spatial motivation for pedestrian movement.
  • SU2—potential and spatial motivation for cycling.
  • SU3—attractiveness.
  • SU4—potential for social interactions.
  • SU5—assessment of a sense of comfort.
  • SU6—assessment of a sense of safety for the most vulnerable traffic groups.
  • SU7—parking policy—adequate attitude toward a stationary traffic solution (how much space we agree to spend on parking lots).
The importance of the criteria for evaluation of alternative solutions, i.e., the weight coefficients of individual criteria, reflect the preferences of the decision-makers and have an impact on the optimization process and on the final outcome of the alternative solution selection. Within this study, three groups of stakeholders were involved in the survey. They analyzed the relevance of criteria and gave their evaluation of alternative solutions in relation to qualitative criteria (SU). The similarities and differences of the relevance of the criteria between different stakeholder groups were statistically analyzed.

4.2. Case Study Description—Alternative Reconstruction Solutions/Alternatives

As input parameters for the design of a possible manner of reconstruction of the traffic network, data on movement for all types of traffic and data on existing traffic infrastructure as well as on all land uses in the wider coverage zone (Section 3) were collected.
Three alternative solutions (A1, A2, A3) for the reconstruction of traffic areas in the center of Belišće were developed and further analyzed, and were conceptually different according to the solution of all relevant elements of traffic demand—pedestrian traffic, cycling traffic, motor vehicle traffic, and stationary traffic. All three alternatives were designed to preserve the three large chestnut trees that are a symbol of the town and are within the reconstruction coverage. The comparison of alternatives [50] is given in Table 3.

4.3. Formation of Traffic Models

For the analysis of functional indicators, microsimulation traffic models for the existing situation (A0) and for the considered alternative solutions (A1, A2, A3) were formed. Traffic load and traffic distribution data for existing traffic demand were entered into the models, after which a number of what-if scenarios of traffic load increase were analyzed in order to verify whether alternative reconstruction solutions could meet functional traffic demand requirements in the future. The input data of the model are the dynamic characteristics of the vehicles, speed, acceleration, deceleration, type, and engine power of the individual vehicles, as well as characteristics associated with driver behavior, such as reaction time, frequency, and length of scanning traffic situations, etc. The model approaches the stochastic nature of the traffic flow by using a random number generator and distributions, and the entered data, for example for the speed of individual vehicle categories, are used in the model as the median of the speed distribution. Of the 10 different traffic scenarios of the arrival of vehicles within the same traffic load, the mean values of functional and other traffic indicators were analyzed.

5. Results and Discussion

5.1. Microsimulation Results

The formed microsimulation traffic models for the existing traffic solution and all alternative reconstruction solutions enabled the analysis of different traffic loads and traffic structures. The existing traffic requirements were the first scenario analyzed, but the future traffic requirements were adopted as a relevant traffic load. The projection of the future traffic load is based on economic growth and development of industrial production, for which there is a significant market demand and which would also generate an increase in traffic demand. Scenarios for increasing traffic demand of 50, 75, and 100% for all modes of traffic and in combination were analyzed and a critical scenario was found to be a 100% increase in motor vehicle traffic, without a significant impact on functional indicators of different increases in other modes of traffic. A comparison of functional indicators for a critical traffic scenario for the future traffic load is shown in the diagram in Figure 5. The maximum queue length is expressed in meters; the total delays of vehicles are reported as the mean value in seconds per vehicle. The average number of stops is expressed as the number of stops per vehicle and the delays caused by the stops are expressed in seconds per vehicle. Level of service is a qualitative indicator of the operating conditions of the traffic that is user-oriented and related to delays.
The simulation results show that all alternative solutions could meet the presumed increase in traffic with a satisfactory level 3 (or C) of service, with the exception of A3, which showed a greater sensitivity to traffic increase due to frequent parking and unparking maneuvers causing higher time losses and level 4 (or D) of service). Service level D is considered an acceptable level in the conditions of the secondary urban traffic network. The alternative solution with shared space (A2) proved to be sensitive to an increase in traffic according to the criterion of the maximum queue, but this solution is designed to demotivate the use of personal vehicles as the primary form of mobility, as per the spatial concept and the number of available parking spaces. However, in order for the alternative solution to be comparable, it was analyzed for the same increase in traffic and pointless entry into the share-space zone, without the possibility of parking the vehicle.
Figure 6 shows the simulation results of carbon monoxide (CO), nitrogen oxides (NOx), and volatile organic compounds (VOC) for the existing traffic load Figure 6a and for future traffic demand in a critical scenario Figure 6b.
The results clearly show the difference between the alternative reconstruction solutions in conditions of future demand, which justifies the use of microsimulation traffic modeling in the evaluation of alternative solutions.

5.2. Results of the Analysis of Qualitative Spatial–Urban Criteria

An online survey involving 120 participants formed of different groups of stakeholders was used to assess the quantitative spatial–urban criteria. They were presented with the current condition of the traffic areas of the town of Belišće in the coverage area of a secondary traffic network and three alternative reconstruction solutions. Three groups of 40 participants were surveyed, including experts, students, and citizens. The experts were mostly members of the academic community, and the students included in the survey were equally divided among students in their final years of study in civil engineering and architecture and urbanism. Citizens who participated in the survey were selected by a random sample of residents of Belišće. All respondents were over 20 years of age, and all surveyed students were between 20 and 30 years of age. The gender and age structure of the respondents is shown in Table 4.
Seven spatial–urban criteria were selected that are applicable to a specific problem and arose from the analysis of research and urban studies [8,9,20].
Respondents subjectively evaluated the existing situation and each reconstruction solution with scores from 1 to 5 according to seven spatial–urban criteria (Table 5). Score 1means that the solution does not meet the spatial criteria at all, and score 5 means that the solution fully meets the spatial criteria.
The subjective evaluation of all groups of respondents was that according to the spatial–urban criterion, the existing solution is the worst, and the best solution is the alternative with a pedestrian promenade and separate parking (A1) according to all criteria except the cycling potential. The shared space alternative (A2) received high scores for cycling potential, walkability, attractiveness, and social interactions, but experts and students gave it a poor score for parking policy. What is interesting is that the citizens gave this solution a good score for the parking policy and recognized the potential of this solution in promoting active forms of mobility while limiting parking in the zone. Experts were skeptical about this solution, because the successful application of such a solution is related to a shift in the paradigm of personal mobility in people’s minds, and the experience shows that it is a longer process than the implementation of the solution. Ultimately, it often happens that such solutions in the local environment do not contribute to the motivation of active forms of mobility to the expected extent, but to the relocation of stationary traffic problems to another, close location. It is interesting that the solution of longitudinal parking in the collector street (A3), which offers the largest increase in the number of parking spaces, was not the best rated solution according to the criteria of parking policy in any group of respondents. The fact that alternative A3 was the worst rated solution according to the criterion of feeling of traffic safety in all three groups of respondents speaks in favor of the fact that respondents rated longitudinal parking in the road profile as a functionally and safety-wise worse solution than the others. Alternative solution A3 was also rated the worst by the criterion of social interactions, because it does not enrich the space with areas that people would use for mutual encounters, although it effectively increases the number of parking spaces in the coverage area.

5.3. Application of the AHP Method

Table 6 shows criteria groups, criteria, and sub-criteria (explained in detail in Section 4.1) with numerical values derived from design solutions or obtained as a result of microsimulation traffic modeling, and for spatial–urban criteria they are obtained as a result of the subjective evaluation of respondents, with scores from 1 to 5.
Economic criteria, construction, and maintenance costs due to the level of project documentation were analyzed by alternatives pair-wise comparison based on the reconstruction area and the application of advanced technological solutions according to the data from Table 6.
The pair-wise comparison of alternative solutions in regard to economic criteria, construction, and maintenance cost is shown in Table 7 using the AHP pair-wise comparison scale shown in Table 2.
The consistency of pair-wise comparison matrices of alternatives, criteria, and also of overall priority matrix should be analyzed by calculating the inconsistency index. The inconsistency index should be lower than 0.1, in which case the evaluations are consistent [7]. This was the case of pair-wise comparison of alternatives for EC11, EC12, and EC2 (Table 7).
The hierarchy of criteria groups, criteria, and sub-criteria is shown in Figure 7.

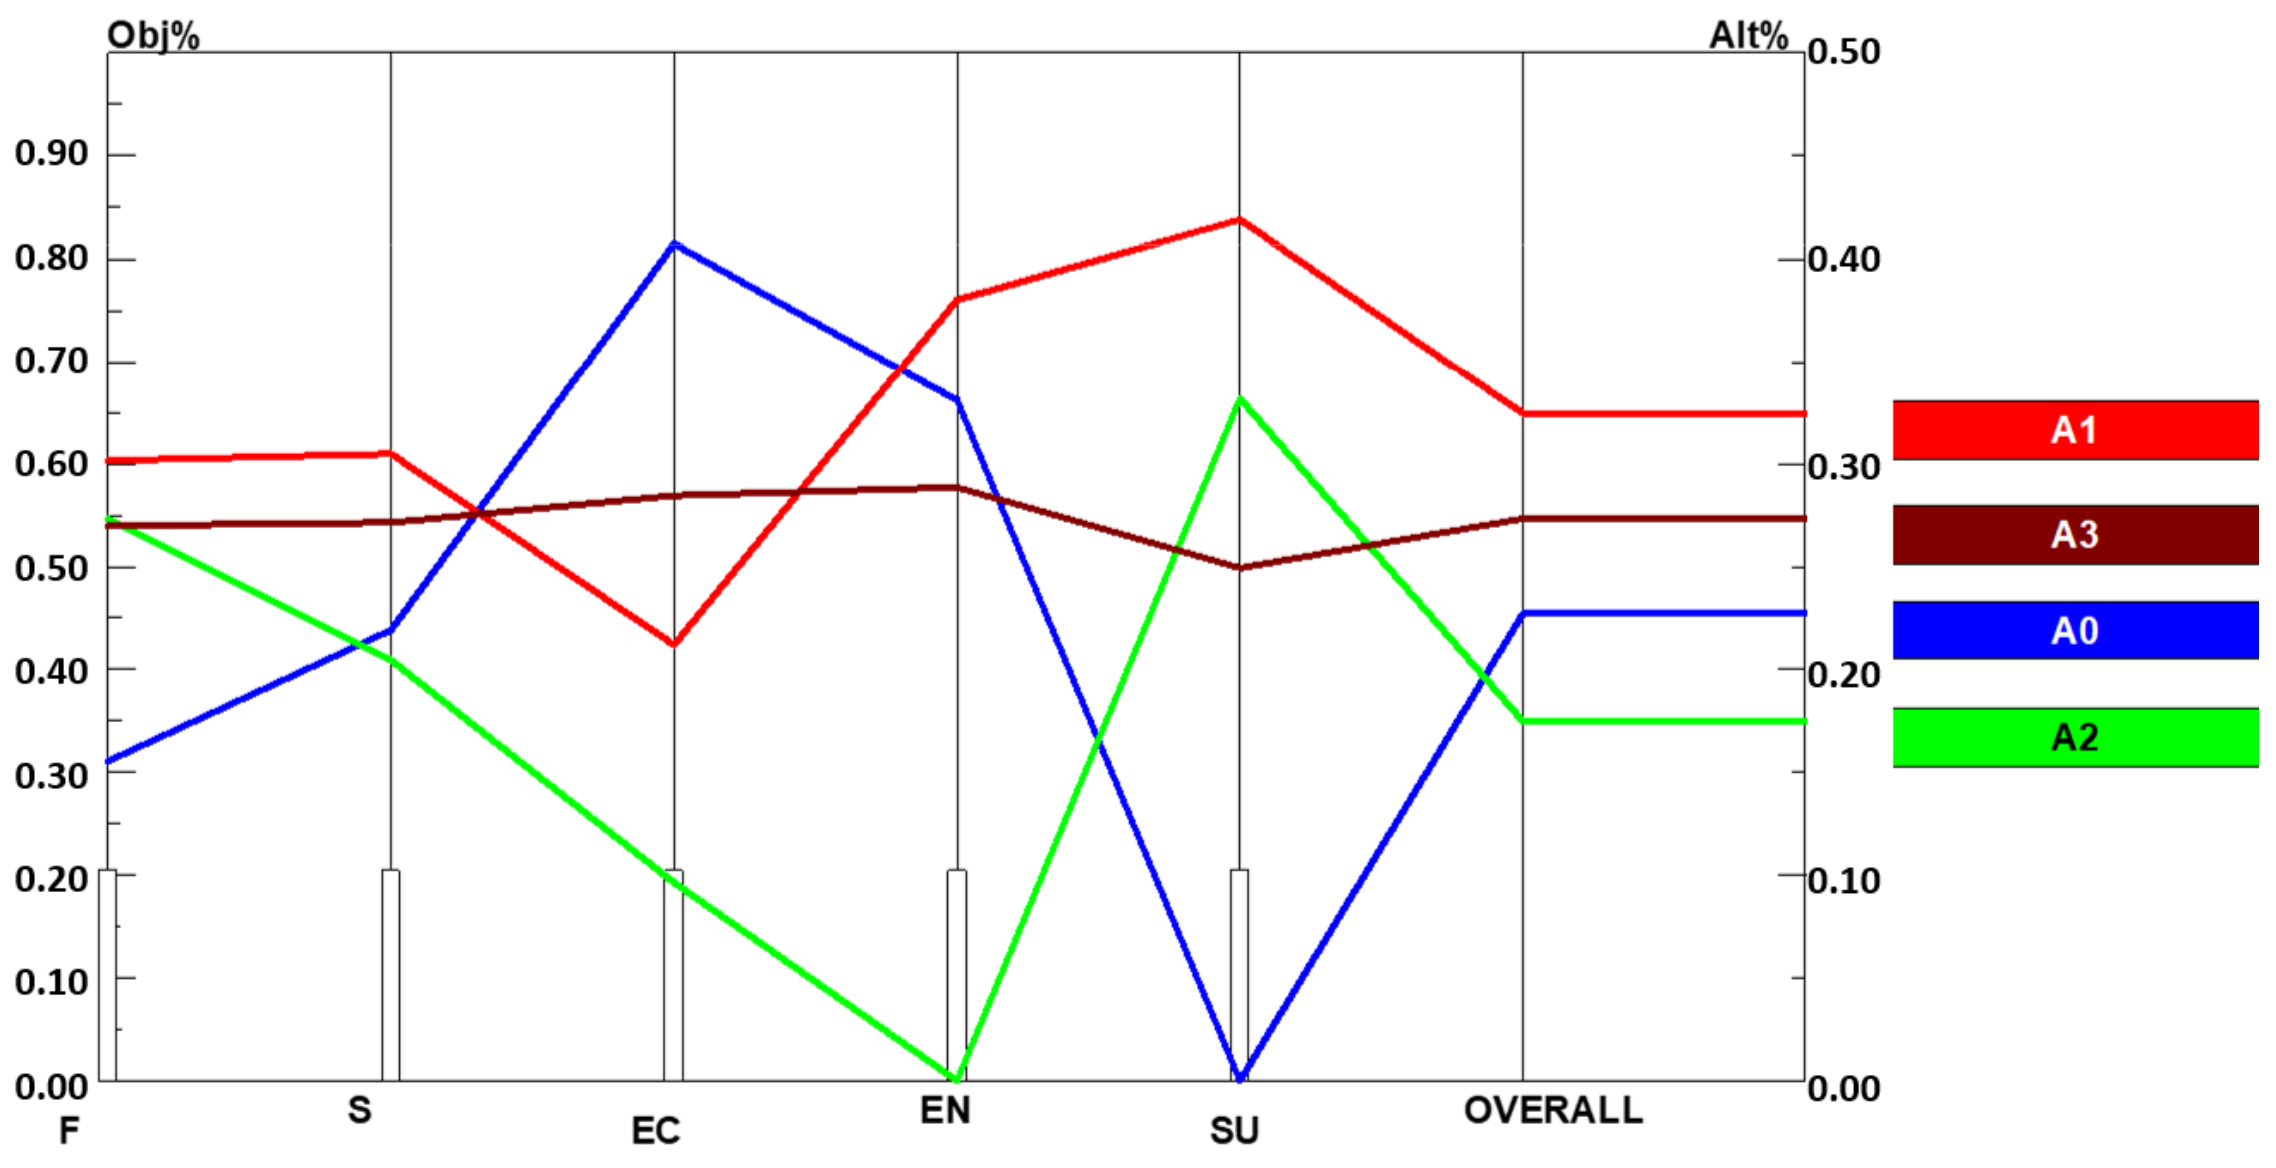
The Analysis of Preferences

The evaluation of the importance of five selected criteria groups applied in the AHP method was included in a survey in which three groups of respondents participated (experts, students, citizens), and the total database contains the results of the evaluation of 120 respondents. Table 8 shows the criteria scores as evaluated by individual groups of respondents, but also the scores obtained on the entire database. Criteria scores ranked from 1 to 10, with score 1 meaning the criteria are not at all relevant, score 5 meaning the criteria are neither relevant nor irrelevant, and score 10 meaning the criteria are very relevant.
Table 8 shows that none of the criteria were evaluated as irrelevant, and all mean scores of criteria groups had values greater than 7. By analyzing the mean values of each criteria group, the highest mean score is assigned to the safety criteria in total and by the citizens. Experts and students gave a slightly higher score to the functional criteria, but the citizens put the functional criteria in third place. Economic criteria were assigned with the lowest scores by all groups, and the lowest mean score was assigned to them by the citizens. The environmental criteria were evaluated by experts and students as third by relevance of the criteria, but citizens thought they were in fourth place. Spatial–urban criteria were the second most important to citizens, after the safety criteria, and other groups rated these criteria as the fourth most relevant.
The basic statistical indicators of the database for each group of respondents are shown in Table 9.
According to the results from Table 9, the evaluations of economic and environmental criteria had the largest standard deviations and the largest range.
According to the Anderson–Darling test for all groups of respondents and all evaluation criteria, the data did not follow a normal distribution. Non-parametric Bonett and Levene tests were used to evaluate the preferences of individual groups of respondents and to analyze the relationship between variance and standard deviations [52,53]. The null hypothesis is that there is no statistically significant difference between groups of respondents (σ(G1)/σ(G2) = 1) and set significance level α = 0.05. The results are shown in Table 10.
Statistically significant differences between the preferences of individual groups of respondents are given in Table 10 (bold). There were statistically significant differences in preferences for functional criteria group between experts and citizens and students and citizens, but there was no statistically significant difference in evaluations between experts and students, which was the expected result. The result clearly shows that experts considered functional criteria to be as equally important as safety criteria, whereas citizens assigned them a slightly lower score. The economic criteria were best evaluated by students and their score was statistically significantly different from the other groups of respondents. There was no statistically significant difference between experts and citizens in the ranking of the economic criteria group. All groups of respondents gave high scores to the safety criteria. There was no statistically significant difference in preferences between individual groups of respondents for safety and environmental criteria. For spatial–urban criteria, there was a statistically significant difference among preferences between experts and citizens, and a comparison of evaluations of other groups did not show statistical significance in the difference in scores. This result clearly shows that the spatial potential of the solution that contains social and psychological components of the evaluation was important to the citizens and that they gave it more importance than the profession that preferred functional criteria.
The inclusion of preferences in the AHP method was done through the analysis of five different scenarios with different weighting coefficients, thus leading to a sensitivity analysis. The weights were assigned only to criteria groups, not to lower levels of criteria. A description of individual scenarios is shown in Table 11.
The ranking results according to the above scenarios are shown in Table 12.
Results of the AHP analysis for Scenarios 1 and 2 are shown in Figure 8 and Figure 9.
The results of the AHP analysis for the preferences of individual groups of respondents are shown in Figure 10a for experts, Figure 10b for students, and Figure 10c for citizens of Belišće.
Regardless of the selected scenario and preferences, A1 stands out as the best alternative solution for reconstruction, followed by A3, A0, and A2 as the worst. The overall priority vector values for alternatives and selected scenarios ranged for A1 from 0.325 to 0.330, for A0 from 0.217 to 0.227, and for A2 from 0.125 to 0.181, while for A3 the value was the same at 0.273. It can be noticed that the introduction of preferences (weights of criteria groups) in Scenario 2 resulted in minor changes in the overall priority vector values for A0 and A2, whereas for A1 this difference was extremely small. The difference between Scenarios 2, 3, and 4 was also negligible, whereas for Scenario 5 A1 had the highest overall priority vector values, and the difference between the overall priority vector values for A0 and A2 was the lowest.
In order to avoid the rank reversal phenomenon, the “ideal mode” AHP was used to rank alternatives according to all scenarios [54]. Then the ranking results were tested by decomposing the initial problem into sub-problems. First the alternatives were compared two at a time and then based on removing one alternative at a time from the whole group [55,56]. The results show that in all cases the ranking remained the same.
All groups pointed out functional criteria (experts, students) or traffic safety criteria (citizens) as the most important two groups of criteria, which, taking into account different scenarios, is best reconciled by alternative A1. Alternative A1 is based on the well-known concept of the pedestrian zone, which contributes to the quality of pedestrian traffic and space in general. At the same time, the solution for motor traffic (including stationary) does not jeopardize the standard of motor traffic because it offers even more parking spaces than those that already exist. A more innovative concept of the A2 alternative—shared space, is, perhaps as expected, a less desirable solution because it raises the issue of traffic safety in the area shared by all road users, and also significantly reduces the number of parking spaces in the zone. This is something to which the tenants living in this zone were particularly sensitive. Alternative A3—calm traffic, as estimated, does not make visible improvements to existing spatial–traffic conditions, as it continues to favor motor traffic by increasing the total number of parking spaces in the road profile. Longitudinal parking in the road profile was rated by all groups of respondents as worse in terms of the feeling of safety, and even worse than the shared space (A2) alternative solution.

6. Conclusions

Key decisions about traffic infrastructure reconstruction, such as choosing an alternative solution that has direct implications on the quality of the planned reconstruction, are made in the early design stages when the level of project detail is such that decisions are traditionally based on the evaluation and experience of the designers. In order to prevent subjectivity in selecting the optimal solution, the application of microsimulation traffic modeling is a logical choice, as it allows a numerically based analysis of traffic conditions for planned alternative reconstruction solutions for different spatial and time-related ranges. The traditional approach of selecting the best solution, along with the analysis of traffic conditions, is based on the cost estimation of solution implementation. This approach is especially present when it comes to spatial and traffic interventions in smaller urban environments. On the other hand, sustainable and socially sensitive traffic planning must take into account a wider range of criteria as well as the subjective criteria of different stakeholders involved in the planning process, and equally important of future users—citizens—so this pointed in the direction of MCA application.
In this paper, we presented the results of the application of the AHP multi-criteria analysis method, which is the most common method in traffic analysis, to the selection of the optimal solution for the reconstruction of a segment of the secondary traffic network in the center of the small town of Belišće in Croatia.
Traffic microsimulations were used to define a critical scenario for future traffic demand before applying the MCA. However, in order to choose among three alternative solutions, other than functional, we defined four more criteria groups with a greater number of criteria on lower levels. The AHP methodology use enabled us to combine different manners of assessing the criteria in the next step: numerically expressed sub-criteria obtained from microsimulation; pair-wise comparison of alternatives in relation to a specific criterion, which was used to evaluate economic criteria, since at this stage it was not possible to exactly define the costs of construction and maintenance; and assessment of preferences of the criteria of the various stakeholders involved in the process, which was used to evaluate the spatial–urban criteria.
The AHP analysis was performed according to the preferences of each of the groups involved—experts, citizens, and students. The sensitivity analysis for selecting the optimal reconstruction solution for all combinations of the weight coefficients of the criteria groups ultimately gave the same ranking order of alternative reconstruction solutions, although statistically significant differences were shown for the relevance of the evaluation criteria themselves for different groups of respondents. The ranking was also analyzed for the rank reversal phenomenon, which did not occur in this case.
Experts and students highlighted functional criteria as the most important criteria, and citizens highlighted traffic safety criteria as most important, which was expected. The next most important criteria for citizens were spatial–urban criteria, which they ranked with a very high weight, which indicates their interest in the manner in which they will use their everyday space in the future and the justification for their active involvement in this analysis with the aim of information and education.
Compared to existing studies, this research brings a methodological contribution through a holistic approach to the evaluation of alternative solutions, which in addition to quantitative introduces socially oriented qualitative parameters and involves stakeholders in the decision-making process.
The described methodology of the application of MCA in combination with traffic micro-simulations in spatial–traffic planning, although applied to problems of larger spatial coverage, proved to be justified when applied in a smaller urban settlement. Alternative A1, which was chosen as optimal, best reconciles the requirements of future traffic demand with environmental impacts and the expectations of future users related to traffic safety and the quality of space.
The methodology for selecting the optimal reconstruction solution presented in this paper is applicable to different segments of the urban traffic network of larger and smaller cities and should be validated in future research.
A potential challenge for the future is the application of the developed methodology to a wider urban area with more complex traffic and spatial situations. A potential issue is whether the large area should be analyzed as one zone or divided into smaller network segments. As for the traffic microsimulation, one larger zone would give a better understanding of the future functionality of the network and the implication of the reconstruction to the whole area. The partialization of large spatial coverage is justified in terms of traffic, due to the temporary regulation of traffic, and also in terms of construction, due to the dynamic plan of reconstruction work.
In larger urban areas, real potential users should be taken into account and a representative sample of citizens should be included in the evaluation of alternative solutions. In the continuation of this research, the influence of different weight factors on the lower-level criteria on the final result of the selection of the optimal alternative should be analyzed, and the needs of vulnerable traffic users, such as children and the elderly and people with disabilities, should be analyzed in the evaluation of alternative reconstruction solutions, too.
The selected MCA that was applied in this research was AHP, so further research should take into account other MCA methods, including the fuzzy approach, and compare their adequacy regarding the specifics of the problem analyzed.

Author Contributions

Conceptualization, I.I.O., B.K., A.D.-T., S.Š. and M.M.; methodology, I.I.O., B.K. and A.D.-T.; software, I.I.O., B.K. and M.M.; validation, B.K., A.D.-T. and S.Š.; formal analysis, I.I.O., B.K. and M.M.; investigation, I.I.O., B.K., A.D.-T., S.Š. and M.M.; data curation, I.I.O., B.K. and M.M.; writing—original draft preparation, I.I.O., B.K. and A.D.-T.; writing—review and editing, A.D.-T. and S.Š.; visualization, I.I.O., B.K. and M.M.; supervision, I.I.O., B.K. and A.D.-T. All authors have read and agreed to the published version of the manuscript.

Funding

This research was co-funded by the University of Rijeka projects: “Transport infrastructure in the function of sustainable mobility” (uniri-tehnic-18-143) and “Implementation of innovative methodologies, approaches and tools for sustainable river basin management” (uniri-tehnic-18-129).

Institutional Review Board Statement

The study was conducted according to the guidelines of the Declaration of Helsinki, and approved by the Faculty of Civil Engineering and Architecture Osijek Ethics Committee, Approval number: 003-06/21-05/04 from 5 February 2021.

Informed Consent Statement

Informed consent was obtained from all subjects involved in the study.

Data Availability Statement

Not applicable.

Conflicts of Interest

The authors declare no conflict of interest.

References

  1. Yli-Pelkonen, V.; Kohl, J. The role of local ecological knowledge in sustainable urban planning: Perspectives from Finland. Sustain. Sci. Pract. Policy 2005, 1, 3–14. [Google Scholar] [CrossRef] [Green Version]
  2. Wefering, F.; Rupprecht, S.; Bührmann, S.; Böhler-Baedeker, S.; Granberg, M.; Vilkuna, J.; Saarinen, S.; Backhaus, W.; Laubenheimer, M.; Lindenau, M.; et al. Developing and Implementing a Sustainable Urban Mobility Plan Guidelines—Developing and Implementing a Sustainable Urban Mobility Plan; European Commission: Brussels, Belgium, 2014. [Google Scholar]
  3. Wen, L.; Kenworthy, J.; Guo, X.; Marinova, D. Solving traffic congestion through street renaissance: A perspective from dense Asian cities. Urban Sci. 2019, 3, 18. [Google Scholar] [CrossRef] [Green Version]
  4. Deluka-Tibljaš, A.; Karleuša, B.; Dragičević, N. Review of multicriteria-analysis methods application in decision making about transport infrastructure. Građevinar 2013, 65, 619–631. [Google Scholar]
  5. Giuffrè, T.; Trubia, S.; Canale, A.; Persaud, B. Using microsimulation to evaluate safety and operational implications of newer roundabout layouts for European road networks. Sustainability 2017, 9, 2084. [Google Scholar] [CrossRef] [Green Version]
  6. Tollazzi, T.; Jovanović, G.; Renčelj, M. New type of roundabout: Dual One-lane roundabouts on two levels with right-hand turning bypasses–“Target Roundabout”. Promet Traffic Transp. 2013, 25, 475–481. [Google Scholar] [CrossRef]
  7. Saaty, T.L. The Analytic Hierarchy Process, 2nd ed.; RWS Publications: Pittsburg, PA, USA, 1996. [Google Scholar]
  8. Pikora, T.; Giles-Corti, B.; Bull, F.; Jamrozik, K.; Donovan, R. Developing a framework for assessment of the environmental determinants of walking and cycling. Soc. Sci. Med. 2003, 56, 1693–1703. [Google Scholar] [CrossRef]
  9. Ewing, R.; Handy, S. Measuring the unmeasurable: Urban design qualities related to walkability. J. Urban Des. 2009, 14, 65–84. [Google Scholar] [CrossRef]
  10. Forsyth, A. What is a walkable place? The walkability debate in urban design. Urban Des. Int. 2015, 20, 274–292. [Google Scholar] [CrossRef]
  11. Ruiz-Padillo, A.; Pasqual, F.M.; Larranaga-Uriarte, A.M.; Cybis, H.B.B. Application of multi-criteria decision analysis methods for assessing walkability: A case study in Porto Alegre, Brazil. Transp. Res. Part D Transp. Environ. 2018, 63, 855–871. [Google Scholar] [CrossRef]
  12. Zeng, W.; Chen, P.; Nakamura, H.; Iryo-Asano, M. Application of social force model to pedestrian behavior analysis at signalized crosswalk. Transp. Res. Part Emerg. Technol. 2014, 40, 143–159. [Google Scholar] [CrossRef]
  13. Zhang, S.; Abdel-Aty, M.; Yuan, J.; Li, P. Prediction of Pedestrian Crossing Intentions at Intersections Based on Long Short-Term Memory Recurrent Neural Network. Transp. Res. Rec. 2020, 2674, 57–65. [Google Scholar] [CrossRef]
  14. Gruden, C.; Ištoka Otković, I.; Šraml, M. Neural Networks applied to microsimulation: A prediction model for pedestrian crossing time. Sustainability 2020, 12, 5355. [Google Scholar] [CrossRef]
  15. Ištoka-Otković, I.; Deluka-Tibljaš, A.; Šurdonja, S.; Campisi, T. Development of models for children—Pedestrian crossing speed at signalized crosswalks. Sustainability 2021, 13, 777. [Google Scholar] [CrossRef]
  16. Neider, M.B.; Gaspar, J.G.; Mccarley, J.S.; Crowell, J.A.; Kaczmarski, H.; Kramer, A.F. Walking & talking: Dual-task effects on street crossing behavior in older adults. Psychol. Aging 2011, 26, 260–268. [Google Scholar] [CrossRef] [Green Version]
  17. Deluka-Tibljaš, A.; Ištoka Otković, I.; Campisi, T.; Šurdonja, S. Comparative analyses of parameters influencing children pedestrian behavior in conflict zones of urban intersections. Safety 2021, 7, 5. [Google Scholar] [CrossRef]
  18. Dovey, K.; Pafka, E. What is walkability? The urban DMA. Urban Stud. 2019, 57, 93–108. [Google Scholar] [CrossRef]
  19. Su, S.; Zhou, H.; Xu, M.; Ru, H.; Wang, W.; Weng, M. Auditing street walkability and associated social inequalities for planning implications. J. Transp. Geogr. 2019, 74, 62–76. [Google Scholar] [CrossRef]
  20. Blečić, I.; Congiu, T.; Fancello, G.; Trunfio, G.A. Planning and design support tools for walkability: A guide for urban analysts. Sustainability 2020, 12, 4405. [Google Scholar] [CrossRef]
  21. Zuniga-Teran, A.A.; Orr, B.J.; Gimblett, R.H.; Chalfoun, N.V.; Going, S.B.; Guertin, D.P.; Marsh, S.E. Designing healthy communities: A walkability analysis of LEED-ND. Front. Archit. Res. 2016, 433–452. [Google Scholar] [CrossRef] [Green Version]
  22. Button, K. The political economy of parking charges in “first” and “second-best” worlds. Transp. Policy 2006, 13, 470–478. [Google Scholar] [CrossRef]
  23. Kimpton, A.; Pojani, D.; Ryan, C.; Ouyang, L.; Sipe, N.; Corcoran, J. Contemporary parking policy, practice, and outcomes in three large Australian cities. Prog. Plan. 2020, 100506, 100506. [Google Scholar] [CrossRef]
  24. Zahabi, S.A.H.; Miranda-Moreno, L.F.; Patterson, Z.; Barla, P. Evaluating the effects of land use and strategies for parking and transit supply on mode choice of downtown commuters. J. Transp. Land Use 2012, 5, 103–119. [Google Scholar] [CrossRef] [Green Version]
  25. Kaufmann, V. Modal practices: From the rationales behind car & public transport use to coherent transport policies. Case studies in France & Switzerland. World Transp. Policy Pract. 2000, 6, 8–17. [Google Scholar]
  26. Kaufmann, V. Re-Thinking Mobility: Contemporary Sociology; Ashgate Pub Ltd.: Surrey, UK, 2002. [Google Scholar]
  27. Kaufmann, V.; Bergman, M.M.; Joye, D. Motility: Mobility as capital. Int. J. Urban Reg. Res. 2004, 28, 745–756. [Google Scholar] [CrossRef]
  28. Zimmermann, R. Prijedlog određivanja srednjih gradova u Hrvatskoj. Društvena Istraživanja 1999, 1, 21–43. [Google Scholar]
  29. Kehagia, F. Transforming small towns by remedial street design. Transp. Res. Proc. 2017, 24, 507–514. [Google Scholar] [CrossRef]
  30. Fang, F.C.; Elefteriadou, L. Some guidelines for selecting microsimulation models for interchange traffic operational analysis. J. Transp. Eng. 2005, 131, 535–543. [Google Scholar] [CrossRef] [Green Version]
  31. Flötteröd, G.; Chen, Y.; Nagel, K. Behavioral calibration and analysis of a large-scale travel microsimulation. Netw. Spat. Econ. 2012, 12, 481–502. [Google Scholar] [CrossRef]
  32. Τsolaki-Fiaka, S.; Bathrellos, G.D.; Skilodimou, H.D. Multi-criteria decision analysis for an abandoned quarry in the Evros Region (NE Greece). Land 2018, 7, 43. [Google Scholar] [CrossRef] [Green Version]
  33. Shahumyan, H.; Williams, B.; Petrov, L.; Foley, W. Regional development scenario evaluation through land use modelling and opportunity mapping. Land 2014, 3, 1180. [Google Scholar] [CrossRef] [Green Version]
  34. Sałabun, W.; Wątróbski, J.; Shekhovtsov, A. Are MCDA methods benchmarkable? A comparative study of TOPSIS, VIKOR, COPRAS, and PROMETHEE II methods. Symmetry 2020, 12, 1549. [Google Scholar] [CrossRef]
  35. Rehman, A.U.; Shekhovtsov, A.; Rehman, N.; Faizi, S.; Sałabun, W. On the analytic hierarchy process structure in group decision-making using incomplete fuzzy information with applications. Symmetry 2021, 13, 609. [Google Scholar] [CrossRef]
  36. Yannis, G.; Kopsacheili, A.; Dragomanovits, A.; Petraki, V. State-of-the-art review on multi-criteria decision-making in the transport sector. J. Traffic Transp. Eng. Engl. Ed. 2020, 7, 413–431. [Google Scholar] [CrossRef]
  37. Broniewicz, E.; Ogrodnik, K. Multi-criteria analysis of transport infrastructure projects. Transp. Res. Part D Transp. Environ. 2020, 83, 102351. [Google Scholar] [CrossRef]
  38. Deluka-Tibljaš, A.; Karleuša, B.; Benac, Č. AHP methodology application in garage-parking facility location selection. Promet Traffic Transp. 2011, 23, 303–313. [Google Scholar] [CrossRef] [Green Version]
  39. Alemdar, K.D.; Tortum, A.; Kaya, Ö.; Atalay, A. Interdisciplinary evaluation of intersection performances—A microsimulation-based MCDA. Sustainability 2021, 13, 1859. [Google Scholar] [CrossRef]
  40. Bayrak, O.Ü.; Bayata, H.F. Multi-criteria decision-based safety evaluation using microsimulation. Proc. Inst. Civ. Eng. Transp. 2020, 173, 345–357. [Google Scholar] [CrossRef]
  41. Du, Y.; Zhao, C.; Zhang, X.; Sun, L. Microscopic simulation evaluation method on access traffic operation. Simul. Model. Pract. Theory 2015, 53, 139–148. [Google Scholar] [CrossRef]
  42. Alemdar, K.D.; Kaya, Ö.; Çodur, M.Y. A GIS and microsimulation-based MCDA approach for evaluation of pedestrian crossings. Accid. Anal. Prev. 2020, 148, 105771. [Google Scholar] [CrossRef]
  43. Geoportal of the National Spatial Data Infrastructure (City of Belišće). Available online: https://geoportal.dgu.hr/ (accessed on 20 April 2021).
  44. Opricović, S. Višekriterijumska Optimizacija; Naučna knjiga: Beograd, Serbia, 1986. [Google Scholar]
  45. Triantaphyllou, E. Multi-Criteria Decision Making Methods: A Comparative Study; Springer: Boston, MA, USA, 2000. [Google Scholar] [CrossRef]
  46. Morales, F., Jr.; de Vries, W.T. Establishment of land use suitability mapping criteria using analytic hierarchy process (AHP) with practitioners and beneficiaries. Land 2021, 10, 235. [Google Scholar] [CrossRef]
  47. Ištoka-Otković, I.; Tollazzi, T.; Šraml, M. Calibration of microsimulation traffic model using neural network approach. Expert. Syst. Appl. 2013, 40, 5965–5974. [Google Scholar] [CrossRef]
  48. Abou-Senna, H.; Radwan, E.; Westerlund, K.; Cooper, C.D. Using a traffic simulation model (VISSIM) with an emissions model (MOVES) to predict emissions from vehicles on a limited-access highway. J. Air Waste Manag. Assoc. 2013, 63, 819–831. [Google Scholar] [CrossRef] [PubMed] [Green Version]
  49. Đorđević, B. Vodoprivredni Sistemi; Naučna knjiga: Beograd, Serbia, 1990. [Google Scholar]
  50. Marušić, M. Assessment of Urban Transport Network Segment Reconstruction. Master’s Thesis, Civil Engineering, Faculty of Civil Engineering and Architecture Osijek, Josip Juraj Strossmayer University of Osijek, Osijek, Croatia, 2019. [Google Scholar]
  51. Han, Y.; Yang, J.; Mizuno, K.; Matsui, Y. Effects of vehicle impact velocity, vehicle front-end shapes on pedestrian injury risk. Traffic Inj. Prev. 2012, 13, 507–518. [Google Scholar] [CrossRef] [PubMed]
  52. Montgomery, D.C. Applied Statistics and Probability for Engineers; John Wiley & Sons, Inc.: Hoboken, NJ, USA, 2003. [Google Scholar]
  53. Bonett, D.G.; Seier, E. Confidence interval for a coefficient of dispersion in nonnormal distributions. Biom. J. 2006, 48, 144–148. [Google Scholar] [CrossRef]
  54. Saaty, T.L.; Vargas, L.G. Models, Methods, Concepts and Applications of the Analytic Hierarchy Process; Kluwer Academic Publishers: Boston, MA, USA, 2001. [Google Scholar]
  55. Triantaphyllou, E. Two new cases of rank reversals when the AHP and some of its additive variants are used that do not occur with the multiplicative AHP. J. Multi-Criteria Decis. Anal. 2001, 10, 11–25. [Google Scholar] [CrossRef]
  56. Wang, X.; Triantaphyllou, E. Ranking irregularities when evaluating alternatives by using some ELECTRE methods. Omega 2008, 36, 45–63. [Google Scholar] [CrossRef]
Figure 1. Area use layout—industrial zones (blue) and town center (green) [43].
Land 10 00666 g001
Figure 2. Stationary traffic problems in Belišće town center.
Land 10 00666 g002
Figure 3. Observed secondary network coverage (left) and narrower area of reconstruction (right).
Land 10 00666 g003
Figure 4. The flow diagram of the basic methodology steps.
Land 10 00666 g004
Figure 5. Comparison of functional indicators for critical traffic load. A0—existing solution, A1–A3—alternative reconstruction solutions.
Land 10 00666 g005
Figure 6. Comparison of gas emissions and fuel consumption for the existing traffic load (a) and for future traffic demand (b).
Land 10 00666 g006
Figure 7. The AHP hierarchy of the problem (top left is the goal; on the bottom right are the alternatives).
Land 10 00666 g007
Figure 8. The AHP analysis for Scenario 1.
Land 10 00666 g008
Figure 9. The AHP analysis for Scenario 2.
Land 10 00666 g009
Figure 10. The AHP analysis for Scenarios 3 (a), Scenarios 4 (b) and Scenarios 5 (c).
Land 10 00666 g010aLand 10 00666 g010b
Table 1. Traffic count results.
PCU/hCyclist/hPed/h
StraightRightLeftStraightRightLeftRoute 1Route 2
I1Access 1594178171722
Access 26916613142217
Access 312221510531512
Access 41212820821923
I2Access 140101223331822
Access 218221411452420
Access 3252063521215
Access 452557541814
Table 2. AHP pair-wise comparison scale [7].
Intensity of Weight, Importance, PreferenceDefinition
1
3
5
7
9
Equal importance (no preference)
Moderate importance (moderate preference)
Strong importance (strong preference)
Very strong importance (very strong preference)
Extreme importance (extreme preference)
2, 4, 6, 8Intermediate values
Table 3. Comparison of proposed alternatives.
Alternative A1: PEDESTRIAN STREET
Construction of a parking lot and of a pedestrian promenade and repurposing of the road into access to the parking lot using modern technological solutions—cameras in parking lots and a display with the number of free parking spaces on each access road in the wider coverage of the secondary network. Cycling traffic is in the mixed flow together with vehicles, but due to low speeds and elimination of the vehicles that are entering the parking zone inefficiently, the traffic conditions are better.
Land 10 00666 i001Reconstructed area: 1630 m2
Parking places: 109 (20 new)
New pedestrian paths: 130 m
New bicycle paths: 0 m
Intersection: three-leg
Alternative A2: SHARED SPACE
Concept with full integration of traffic flows on a common surface designed to meet the needs of pedestrian and cycling movements, with fewer parking spaces than the existing solution, in order to influence the selection of active modalities of urban mobility and demotivate the choice of personal cars as the primary modality. An addition to the solution is the construction of a network of bicycle paths in the coverage area that provides greater safety to bicycle flows.
Land 10 00666 i002Reconstructed area: 3880 m2
Parking places: 48 (38 fewer)
New pedestrian paths: 160 m
New bicycle paths: 535 m
Intersection: four-leg
Alternative A3: TRAFFIC-CALMING ZONE
Reconstruction of the existing collector road leading to the inner city center, in a reduced speed zone (“30 zone”), with 31 new longitudinal parking spaces. The existing traffic areas for pedestrians and cyclists, along with the areas intended for stationary traffic (82 parking spaces), remain the same.
Land 10 00666 i003Reconstructed area: 1150 m2
Parking places: 116 (31 new)
New pedestrian paths: 145 m
New bicycle paths: 210 m
Intersection: four-leg
Table 4. Gender and age structure of respondents.
Distribution by Gender (%)Distribution by Age (%)
RespondentsFemaleMale<4040–60>60
Experts485235578
Citizens5050454510
Students3862
Table 5. Subjective evaluation of the alternative solution according to spatial–urban criteria.
Evaluation
Criteria
A0A1A2A3
ExpertsWalkability2.24.33.93.1
Cycling1.93.44.03.4
Attractiveness1.94.13.92.9
Social interactions2.14.24.13.1
Pleasure2.04.33.92.8
Sense of safety2.24.23.73.3
Parking policy2.24.32.83.6
MEAN SCORE2.14.13.83.2
StudentsWalkability2.44.63.93.3
Cycling2.03.54.53.8
Attractiveness2.04.54.03.2
Social interactions2.24.74.23.2
Pleasure2.24.63.83.3
Sense of safety2.14.53.43.2
Parking policy2.24.52.94.0
MEAN SCORE2.14.13.83.2
CitizensWalkability2.24.54.03.4
Cycling2.13.84.23.9
Attractiveness2.14.54.03.5
Social interactions2.24.64.03.7
Pleasure2.34.44.03.5
Sense of safety2.04.03.73.4
Parking policy1.84.23.63.8
MEAN SCORE2.14.33.93.6
MEAN OVERALL SCORE2.14.33.83.4
Table 6. Criteria and sub-criteria.
CriterionSub-CriterionTargetUnitsA0A1A2A3
F—FUNCTIONAL CRITERIA
F1—Functional indicators/critical scenarioF11—Queuemaxminm18.820.973.841.4
F12—Delays veh(all)minsec/veh20.920.120.830.9
F13—Stopsminnumber/veh2.10.23.33.5
F14—Delaysstopsminsec/veh2.61.46.37.9
F15—Level of serviceminratingC(3)C(3)C(3)D(4)
F2—Parking—number of spacesmaxnumber8610948116
F3—Cyclists—length of bike pathsmaxm--535210
F4—Pedestrians-length of pedestrian pathsmaxm570700730715
S—SAFETY CRITERIA
S1—Speed minkm/h40402030
S2—Segregation of traffic flowsmaxnumber2203
S3—Number of conflict points veh/vehminnumber752542105
S4—Number of conflicting points pedes/vehminnumber16143016
EC—ECONOMIC CRITERIA
EC1—ConstructionEC11—Reconstruction of the areaPair-wise comparison
EC12—Advanced technologyPair-wise comparison
EC2—Maintenance Pair-wise comparison
EC3—Fuel consumption minUS gal lqd0.900.772.081.08
EN—ENVIRONMENTAL CRITERIA—EXHAUST GASES
EN1—CO
EN2—NOx
EN3—VOC
mingrams69.653.5145.175.6
mingrams13.510.428.214.7
mingrams13.212.433.617.5
SU—SPATIAL–URBAN CRITERIA
SU1—Walkability 1maxscore2.34.53.93.3
SU2—Cycling 2maxscore2.03.64.23.7
Su3—Attractiveness of the solutionmaxscore2.04.44.03.2
SU4—Social interactionmaxscore2.24.54.13.3
SU5—Comfort scoremaxscore2.24.43.93.2
Su6—Safety scoremaxscore2.14.23.63.3
SU7—Parking policy 3maxscore2.14.33.13.8
A0—existing solution, A1–A3—alternative reconstruction solutions. 1 Potential and motivation for walking. 2 Potential and motivation for cycling. 3 Does not apply to the number of parking spaces, but rather to adequate/efficient planning of space intended for stationary traffic.
Table 7. Pair-wise comparison for construction and maintenance costs.
EC11—Construction
(Area)
EC12—Construction (Technology)EC2—Maintenance
A0A1A2A3A0A1A2A3A0A1A2A3
A0 593 911 362
A1 3−2 −9−9 3−2
A2 −4 1 −4
A3In=0.01 In=0.0 In=0.01
Table 8. Mean values of marks and rank of criteria (criteria groups).
NFunctional CriteriaSafety
Criteria
Economic CriteriaEcological CriteriaSpatial
Urban
Experts409.559.537.208.138.08
Students409.639.587.688.558.43
Citizens408.659.336.808.459.05
Total1209.289.487.238.388.58
Rank21543
Table 9. Basic statistical indicators.
Criteria GroupGroups of RespondentsNMeanStDevMedianMinMax
Functional criteriaExperts409.550.7110810
Students409.630.6710710
Citizens408.651.259610
Safety
criteria
Experts409.530.7010710
Students409.580.9310610
Citizens409.331.0510610
Economic criteriaExperts407.201.517410
Students407.680.89859
Citizens406.801.867110
Ecological criteriaExperts408.131.738.5310
Students408.551.209510
Citizens408.451.729110
Spatial urban criteriaExperts408.251.558410
Students408.431.248.5510
Citizens409.050.8769710
Table 10. Comparison of preferences of individual groups of respondents—statistical analysis.
Criteria GroupTestExperts/StudentsExperts/CitizensStudents/Citizens
Statist. Testp-ValueStatist. Testp-ValueStatist. Testp-Value
Functional criteriaBonett0.070.79515.430.0014.480.00
Levene0.240.62517.580.0023.440.00
Safety
criteria
Bonett0.640.4251.630.2020.140.706
Levene0.170.6852.660.1071.270.263
Economic criteriaBonett9.180.0021.140.2868.380.004
Levene5.770.0190.930.3389.940.002
Ecological criteriaBonett2.710.0990.000.9941.040.307
Levene2.750.1010.200.6560.990.322
Spatial–urban criteriaBonett1.320.2507.130.0083.320.068
Levene1.310.2567.990.0063.640.060
Table 11. Assignment of different preferences—analysis of 5 scenarios.
Scenario 1All criteria groups’ weights are equal.
Scenario 2Weights are assigned to criteria groups according to the ranking of all respondents (the entire database).
Scenario 3Weights are assigned to criteria groups according to the experts’ ranking.
Scenario 4Weights are assigned to criteria groups according to the students’ ranking.
Scenario 5Weights are assigned to criteria groups according to the citizens’ ranking.
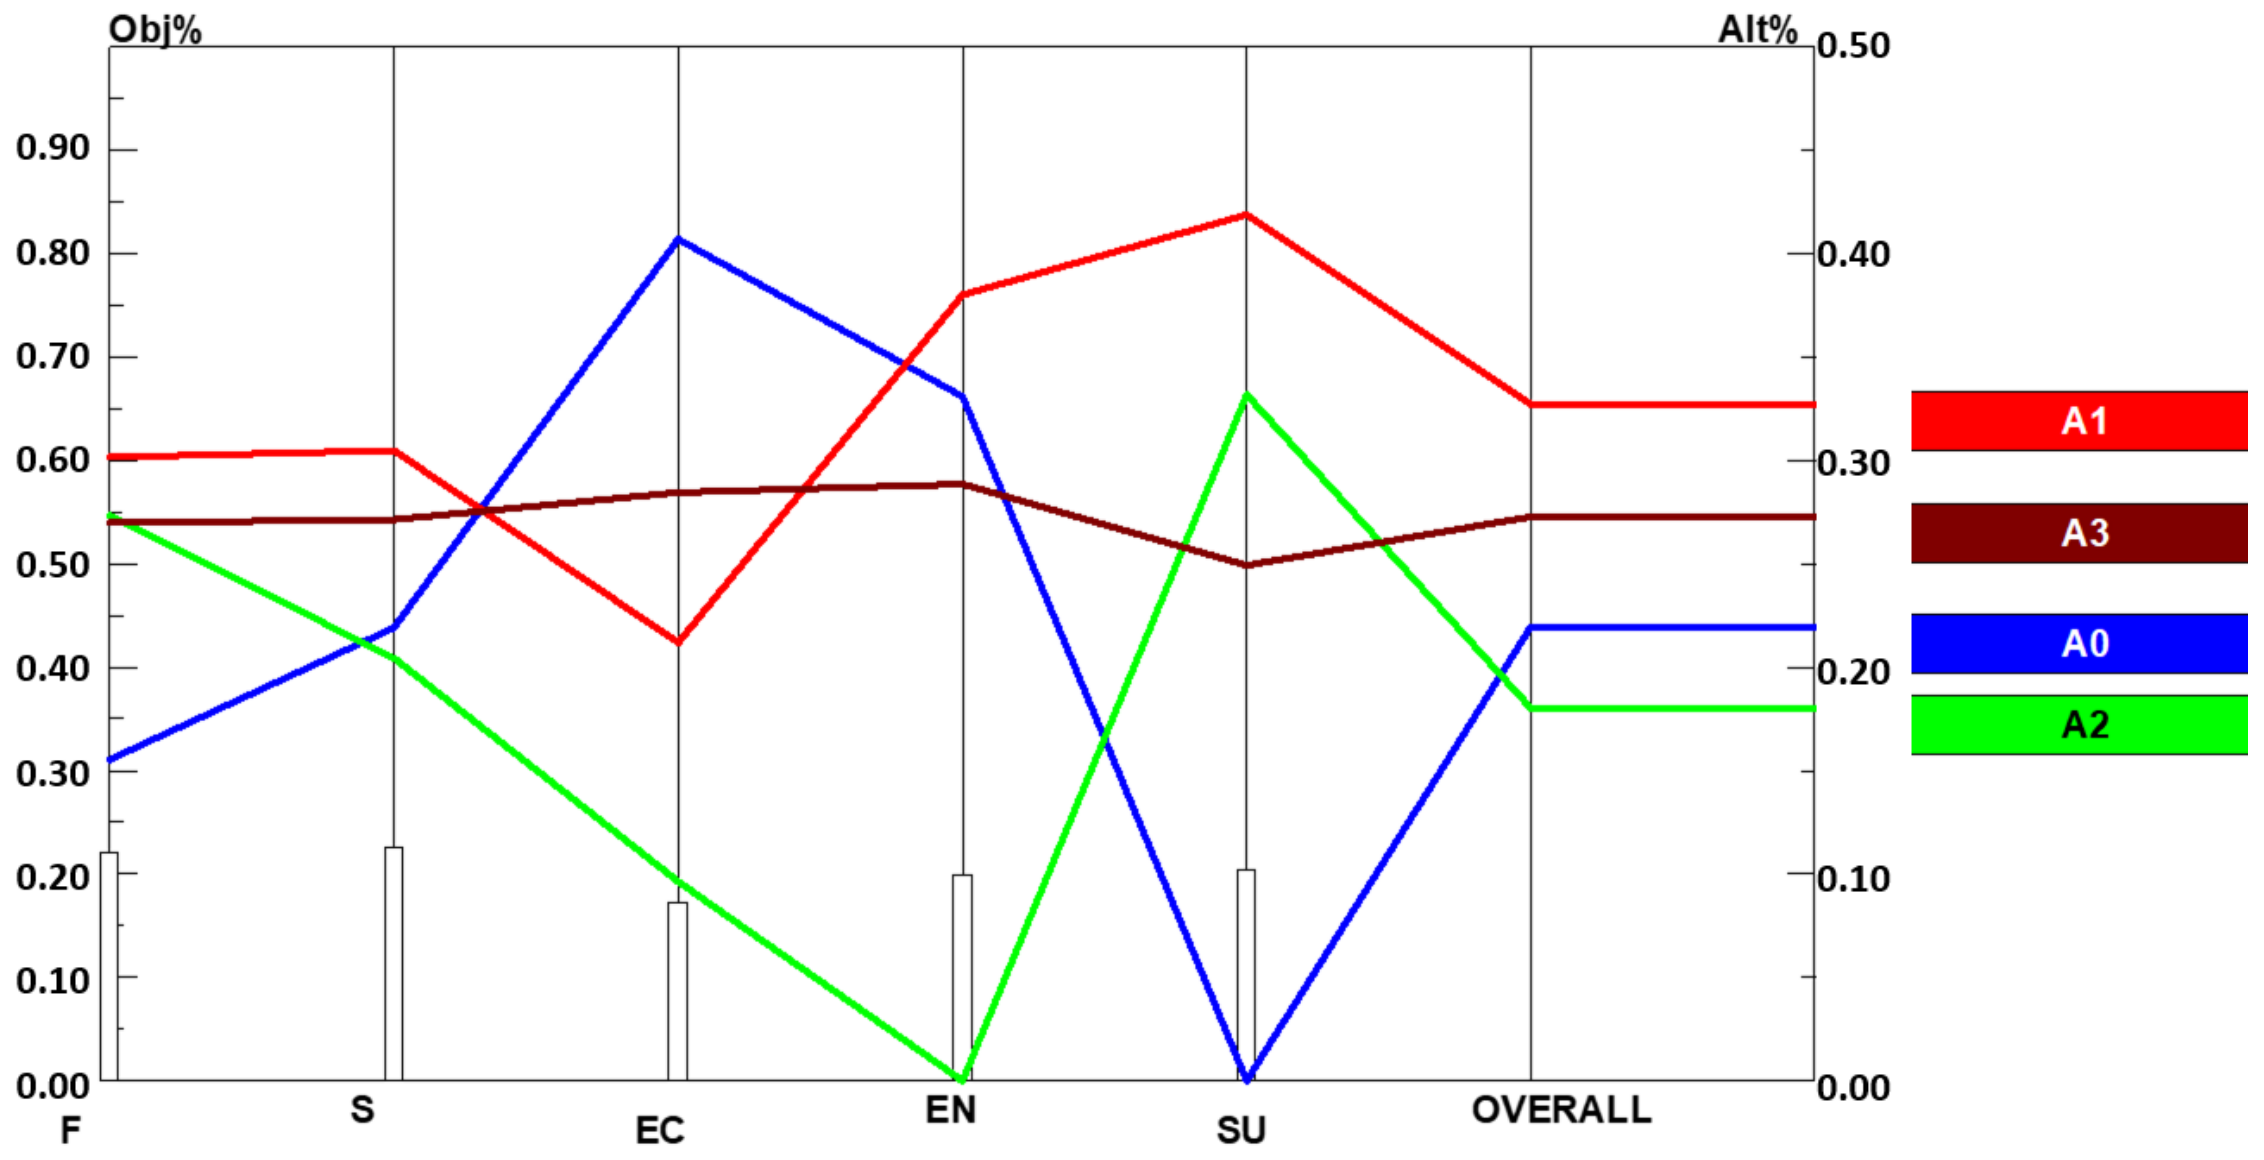
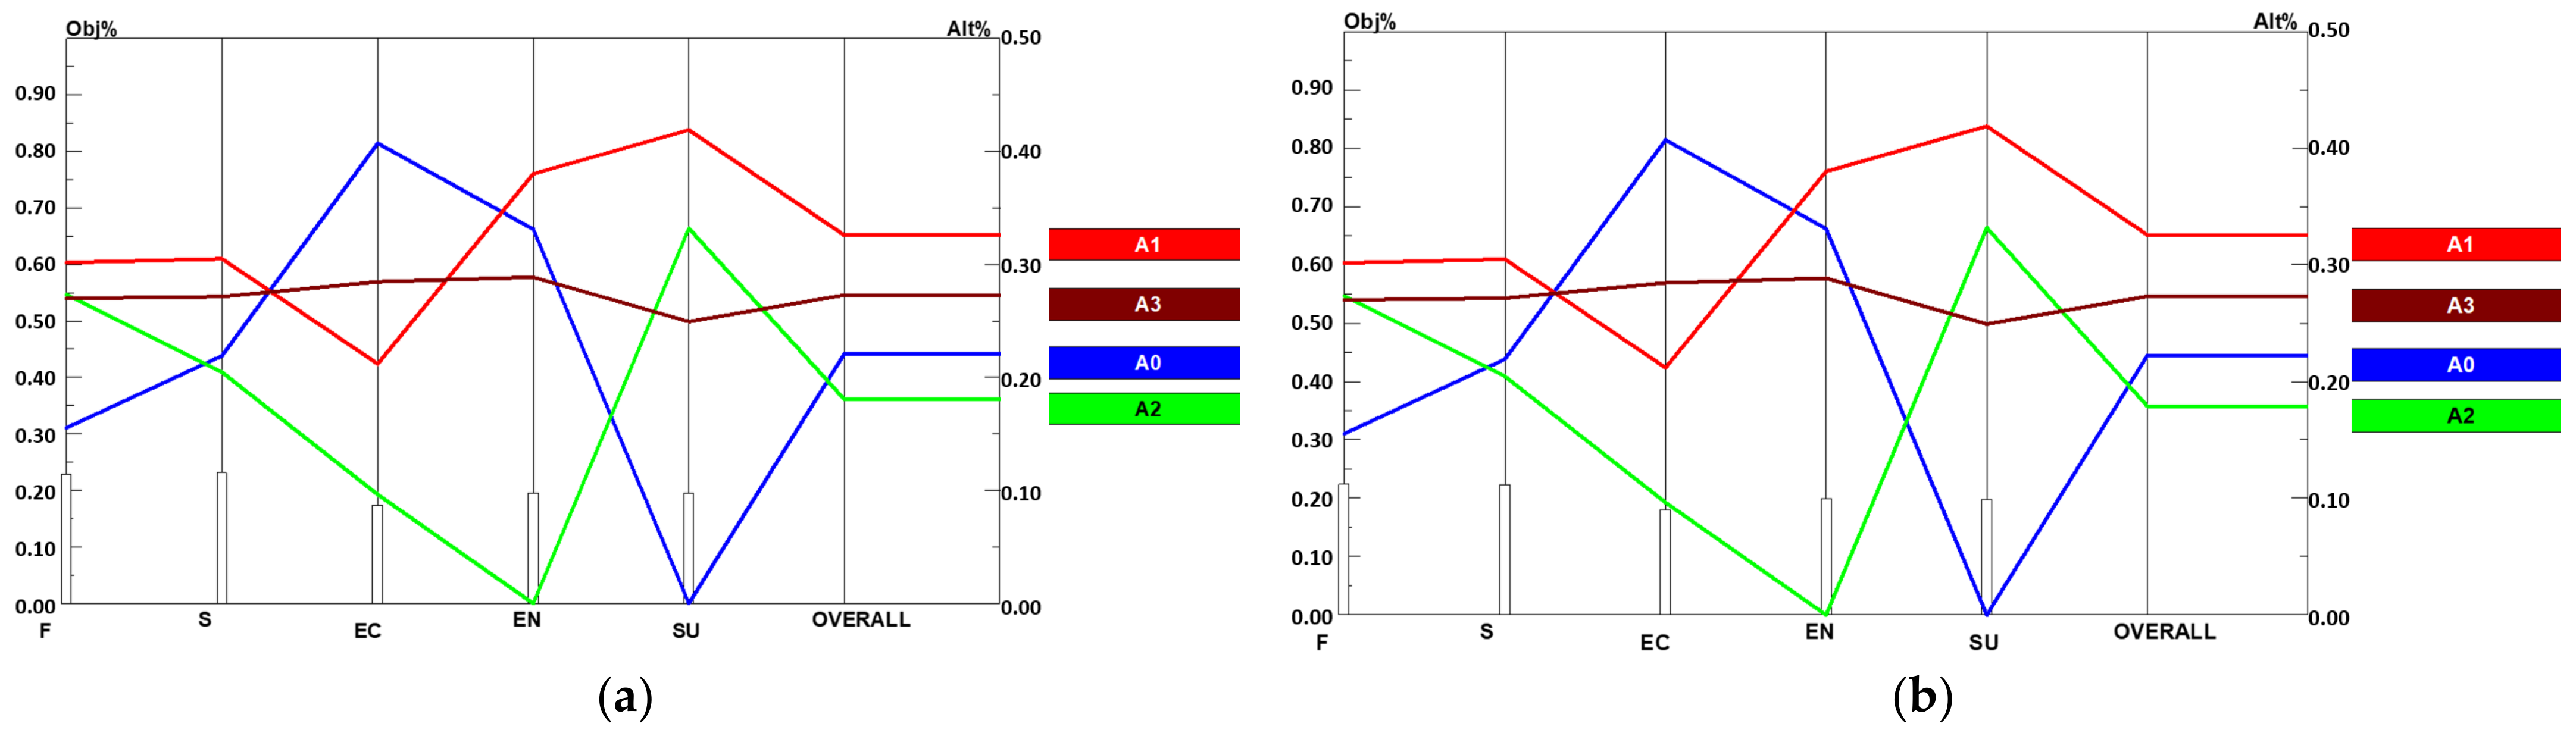
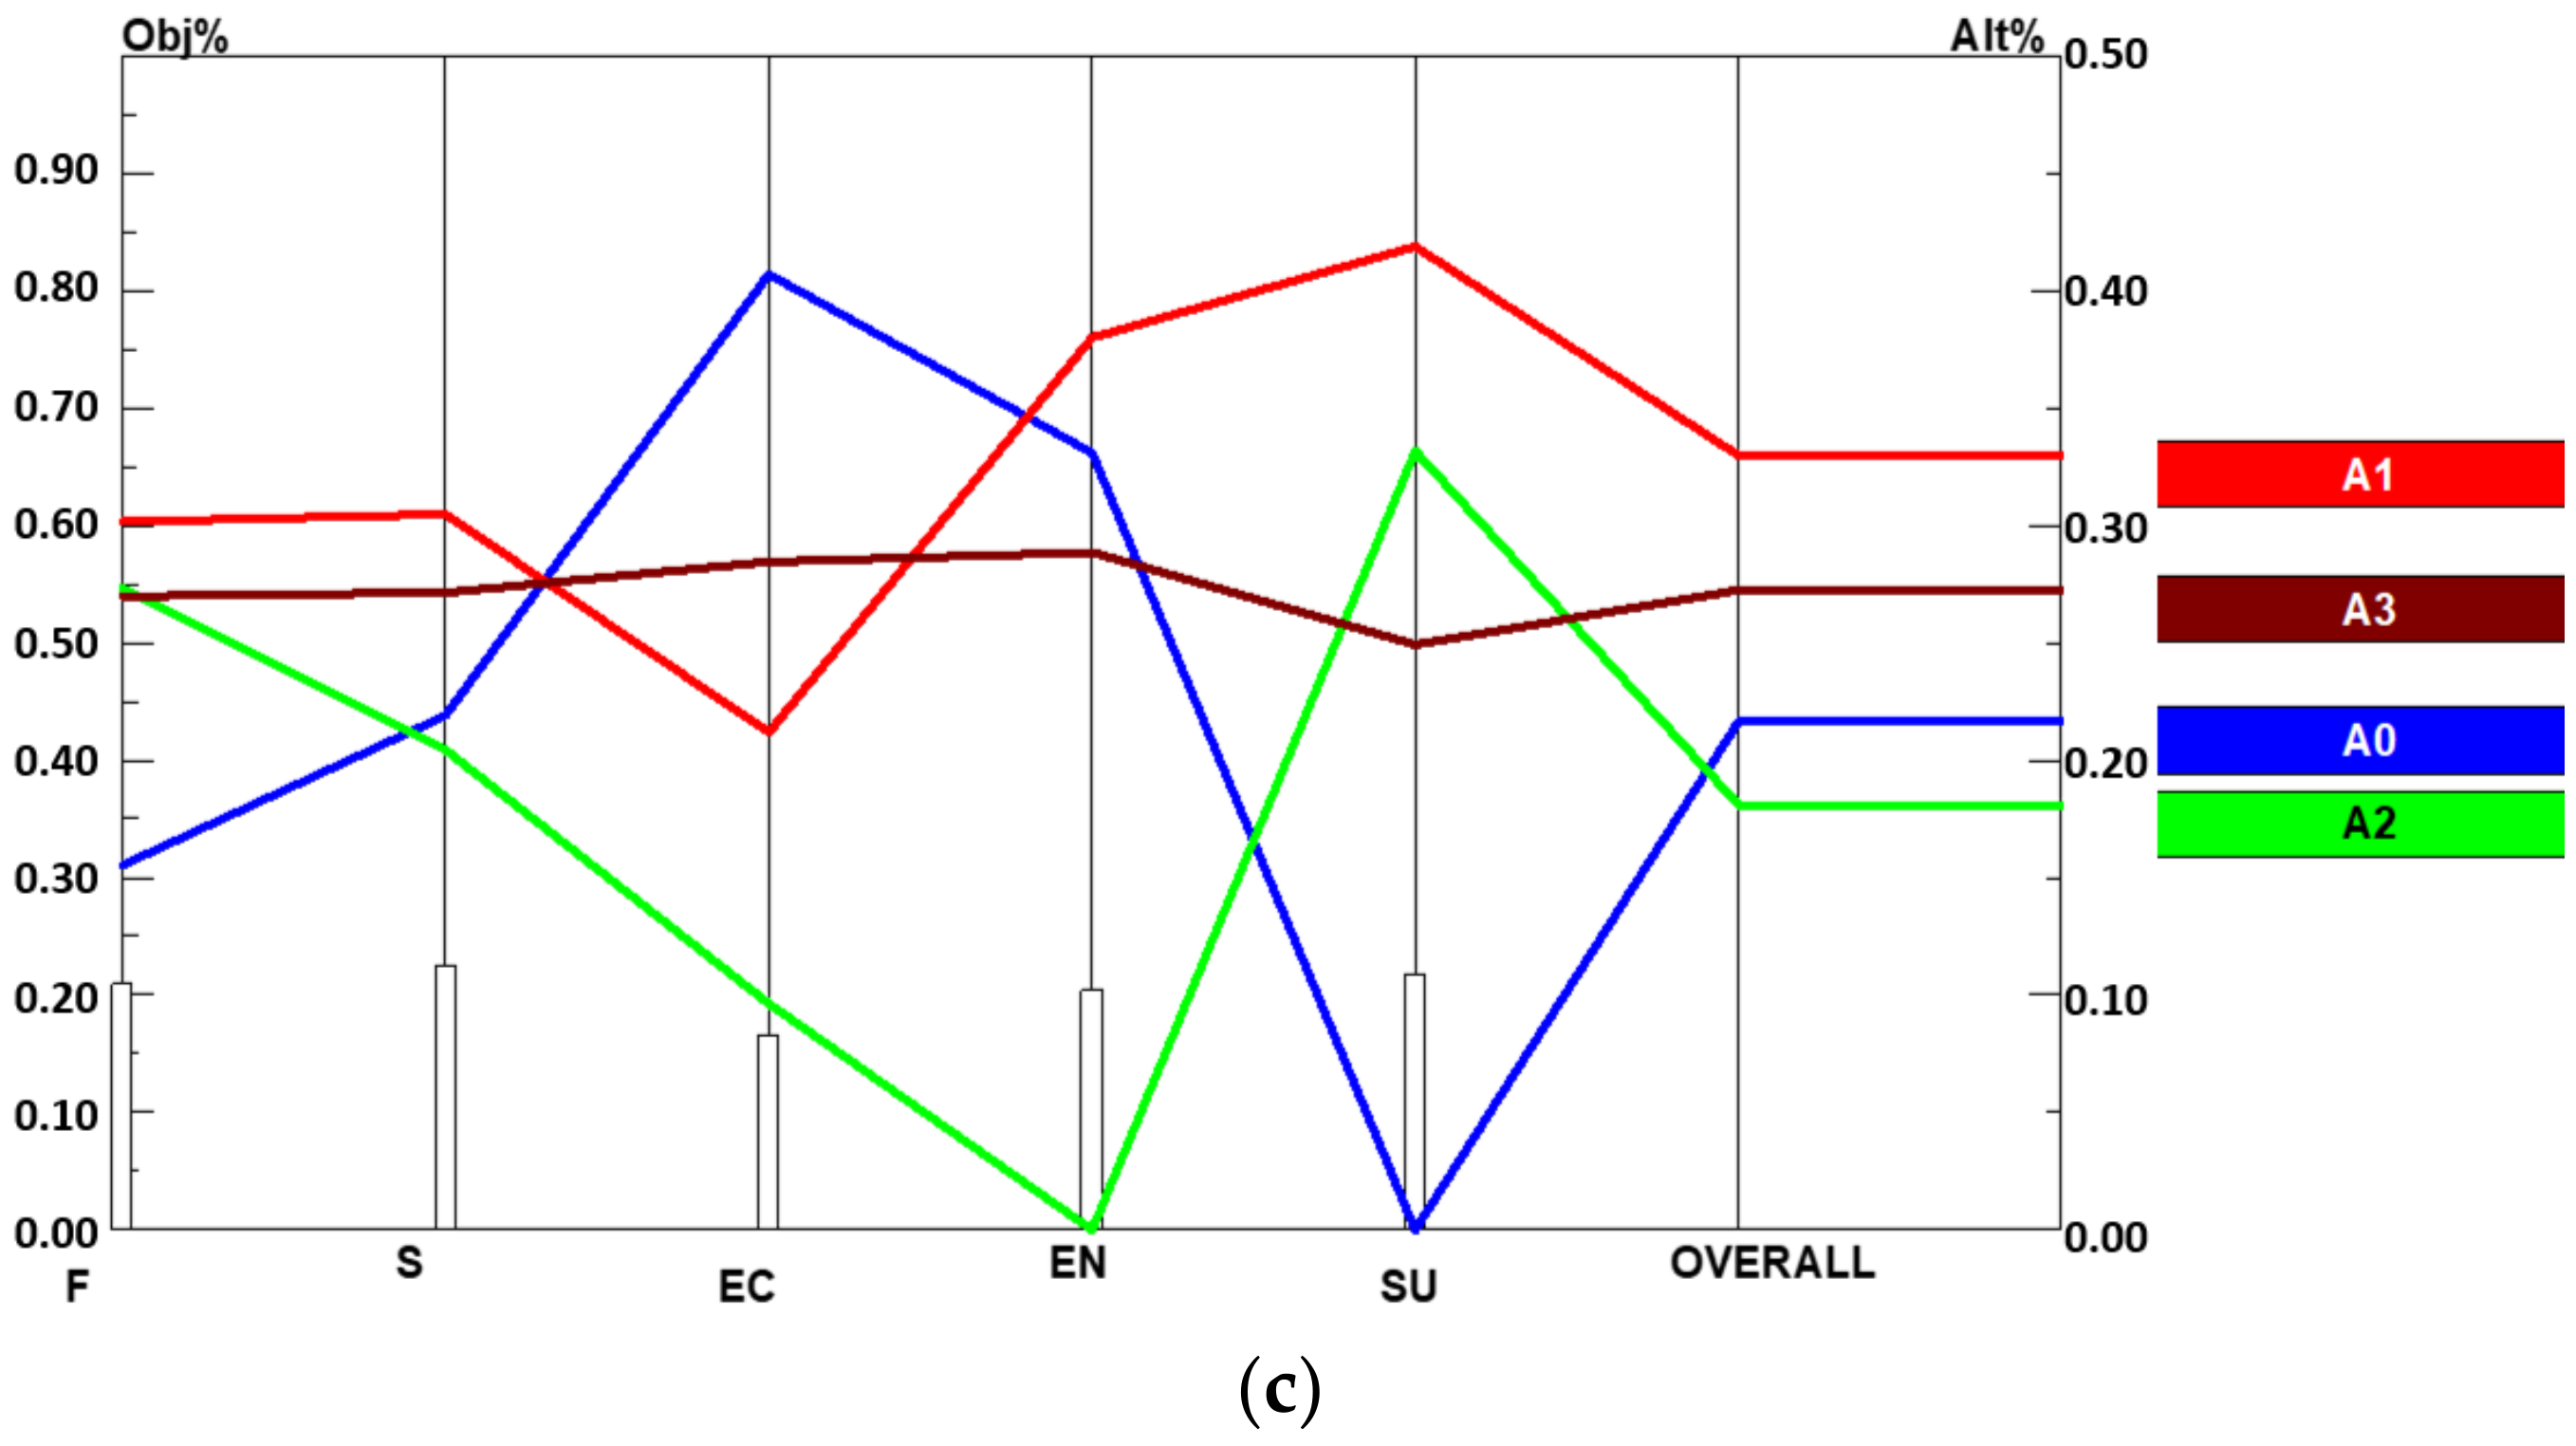
Table 12. The results of ranking according to the analyzed scenarios.
RankScenario 1Scenario 2Scenario 3Scenario 4Scenario 5
1A1 (0.325)A1 (0.327)A1 (0.326)A1 (0.326)A1 (0.330)
2A3 (0.273)A3 (0.273)A3 (0.273)A3 (0.273)A3 (0.273)
3A0 (0.227)A0 (0.220)A0 (0.221)A0 (0.222)A0 (0.217)
4A2 (0.125)A2 (0.180)A2 (0.180)A2 (0.179)A2 (0.181)
Inconst:0.030.060.060.060.06
Publisher’s Note: MDPI stays neutral with regard to jurisdictional claims in published maps and institutional affiliations.

