Article

The Imprint of Built-Up Land Expansion on Cropland Distribution and Productivity in Shandong Province

1
School of Geography and Tourism, Qufu Normal University, Rizhao 276800, China
2
Center for Land Studies, Qufu Normal University, Rizhao 276800, China
3
State Key Laboratory of Resources and Environment Information System, Institute of Geographical Sciences and Natural Resources Research, Chinese Academy of Sciences, Beijing 100101, China
*
Author to whom correspondence should be addressed.
Land 2021, 10(6), 639; https://doi.org/10.3390/land10060639
Submission received: 13 May 2021 / Revised: 7 June 2021 / Accepted: 12 June 2021 / Published: 16 June 2021

Abstract

:
Grain self-sufficiency is a national food security target of China. The way that built-up land expansion impacts upon cropland loss and food provision needs to be explored in the major grain producing areas. Shandong Province is an important agricultural food production region, which is also experiencing rapidly urbanizing. Here we assessed the spatiotemporal distribution of cropland loss due to built-up land expansion and landscape dynamics of cropland during 2000–2020, by using 30 m resolution land cover data. We also analyzed the potential yield change influenced by cropland loss. The results showed that the area of built-up land expanded by 5199 km2 from 2000–2010, and 11,949 km2 from 2010–2020. Approximately 95% of the new built-up land was from cropland during the two stages, and the primary mode of built-up land expansion was the edge expansion. The patch density and the patch size of cropland kept increasing and decreasing, respectively, and the aggregation index kept decreasing from 2000 to 2020, indicating increased cropland fragmentation. The proportion of occupied cropland with potential yield greater than 7500 kg/ha was 25% and 37% during the former and the latter period. Thus, higher quality cropland was encroached in the recent period. The findings could provide meaningful implications for making sustainable land use development strategies in the study area and other similar regions.

1. Introduction

Global projections of future urban land expansion have revealed that global urban land will continue to expand until the 2040s, and 50–60% of the newly expanded urban land will occur on current croplands [1]. The built-up land expansion was the primary land use/land cover change type during the past two decades in many countries, and the occupation of high quality cropland was one of the significant negative effects of built-up land expansion. Previous studies show that the expansion of built-up land occurs almost everywhere on high quality cropland in many region, such as study area in China [2,3,4,5], USA [6], Europe [7], and Africa [8]. The cropland area per capita in China is less than half of the average level worldwide [9]. The dietary change, population growth, and environmental damage created additional pressure for agricultural land system. As a result, the loss of cropland imposed a challenge on the food security. Shandong Province is one of the major food production regions in China, and it is also experiencing unprecedented economic growth. The land use conversions from built-up land to the cropland here are attracting more attention. On one hand, the area of cropland is decreasing. On the other hand, built-up land expansion affects the fragmentation of cropland, which would also influence the cropland productivity. Therefore, Shandong Province is facing the dilemma of the increasing demand on built-up land to sustain economic development and the protecting of high-quality cropland for food provision. Understanding the trajectories of cropland change due to built-up land expansion is significant to solve this dilemma.
The existing studies on built-up land expansion and cropland variation include cropland intensification and area change [10,11], intensity analysis of land use conversion [12,13], displacement [14,15,16], abandonment [17,18], projections of future change [19,20,21,22,23] and so on. At the global scale, Bren d’Amour et al. (2017) projected future urban expansion and the implications for cropland. This study found that urban expansion will result in a 1.8–2.4% loss of croplands by 2030, and approximately 80% of global cropland loss from urban expansion will take place in Asia and Africa [24]. Huang et al. (2020) analyzed global urban expansion and its influence on cropland area and the implications on net primary productivity (NPP) during the period from 1992 to 2016 at the national, continental, and global scales [25]. This study analyzed the results taking each country as a whole, and less attention has been given to the spatial explicitly patterns within countries. At the national level, He et al. (2017) evaluated the cropland NPP decrease caused by urban expansion in China from 1992 to 2015 based on the CASA model and the urban land derived from multi-source remote sensing data [26]. The results showed that urban expansion from 1992 to 2015 in China led to a decrease in the grain self-sufficiency and brought stress on food security. One limitation of this study is that the urban land data have a low spatial resolution of 1 km, and some detailed information about the land use transition at a finer spatial resolution remains unclear. Song et al. (2017) compared the land quality converted from and to cropland from 1986 to 2005 quantitatively. They indicated that the average land quality decreased caused by the increase in low quality land and the increase of high-quality land during 1986–2005 in China, and they suggested that the maintaining of overall quality of cropland in China should be a concern [27]. In addition, some studies compared the characteristics of urban expansion and cropland shrinkage between different cities [28,29]. Liu et al. (2019) calculated cropland loss due to the urban expansion trend in China since the 1970s based on the Landsat imagery choosing 75 typical cities as samples across the country. Only three cities in Shandong Province were studied in study, including Jinan, Qingdao, and Zaozhuang city [30]. However, some previous studies claimed that the expansion of small towns, villages, and rural residential land also occupied large areas of cropland [31].
The tradeoffs between cropland conversions and land productivity in Shandong province during 1985 and 2010 was studied using the estimation system of land production model, and the results presented that the overall land productivity showed a declining trend, and land productivity was lower where cropland conversion occurred [9]. Chao et al. (2018) analyzed the impacts of urbanization on cropland change from 2001 to 2010 in Shandong Province, and they further assessed the relationship between the pressure index of cropland and the NPP simulated by the Carnegie Ames Stanford Approach (CASA) [32]. However, these studies only analyzed the data before 2010, and the situation after 2010 is still unknown. In addition, the NPP simulated by light use efficiency models was used to proxy cropland productivity, which is difficult to indicate the actual crop yield accurately.
Under the background of rapid urbanization, both of the quantity and the quality of cropland are threatened in Shandong Province. As one of the important breadbaskets in China, the detailed analyses of cropland production variation influenced by built-up land expansion in Shandong need to be performed urgently. However, the existing studies are still insufficient, and further studies are needed. Therefore, this study aimed to address the following questions: (1) To what extent has urbanization impacted the spatial distribution of the losses of cropland during different stages? (2) How do the landscape features of cropland change during 2000 and 2020? (3) How did the built-up land encroachment of cropland affect cropland productivity? Based on the results of these analyses, several policy suggestions will be put forward.

2. Materials and Methods
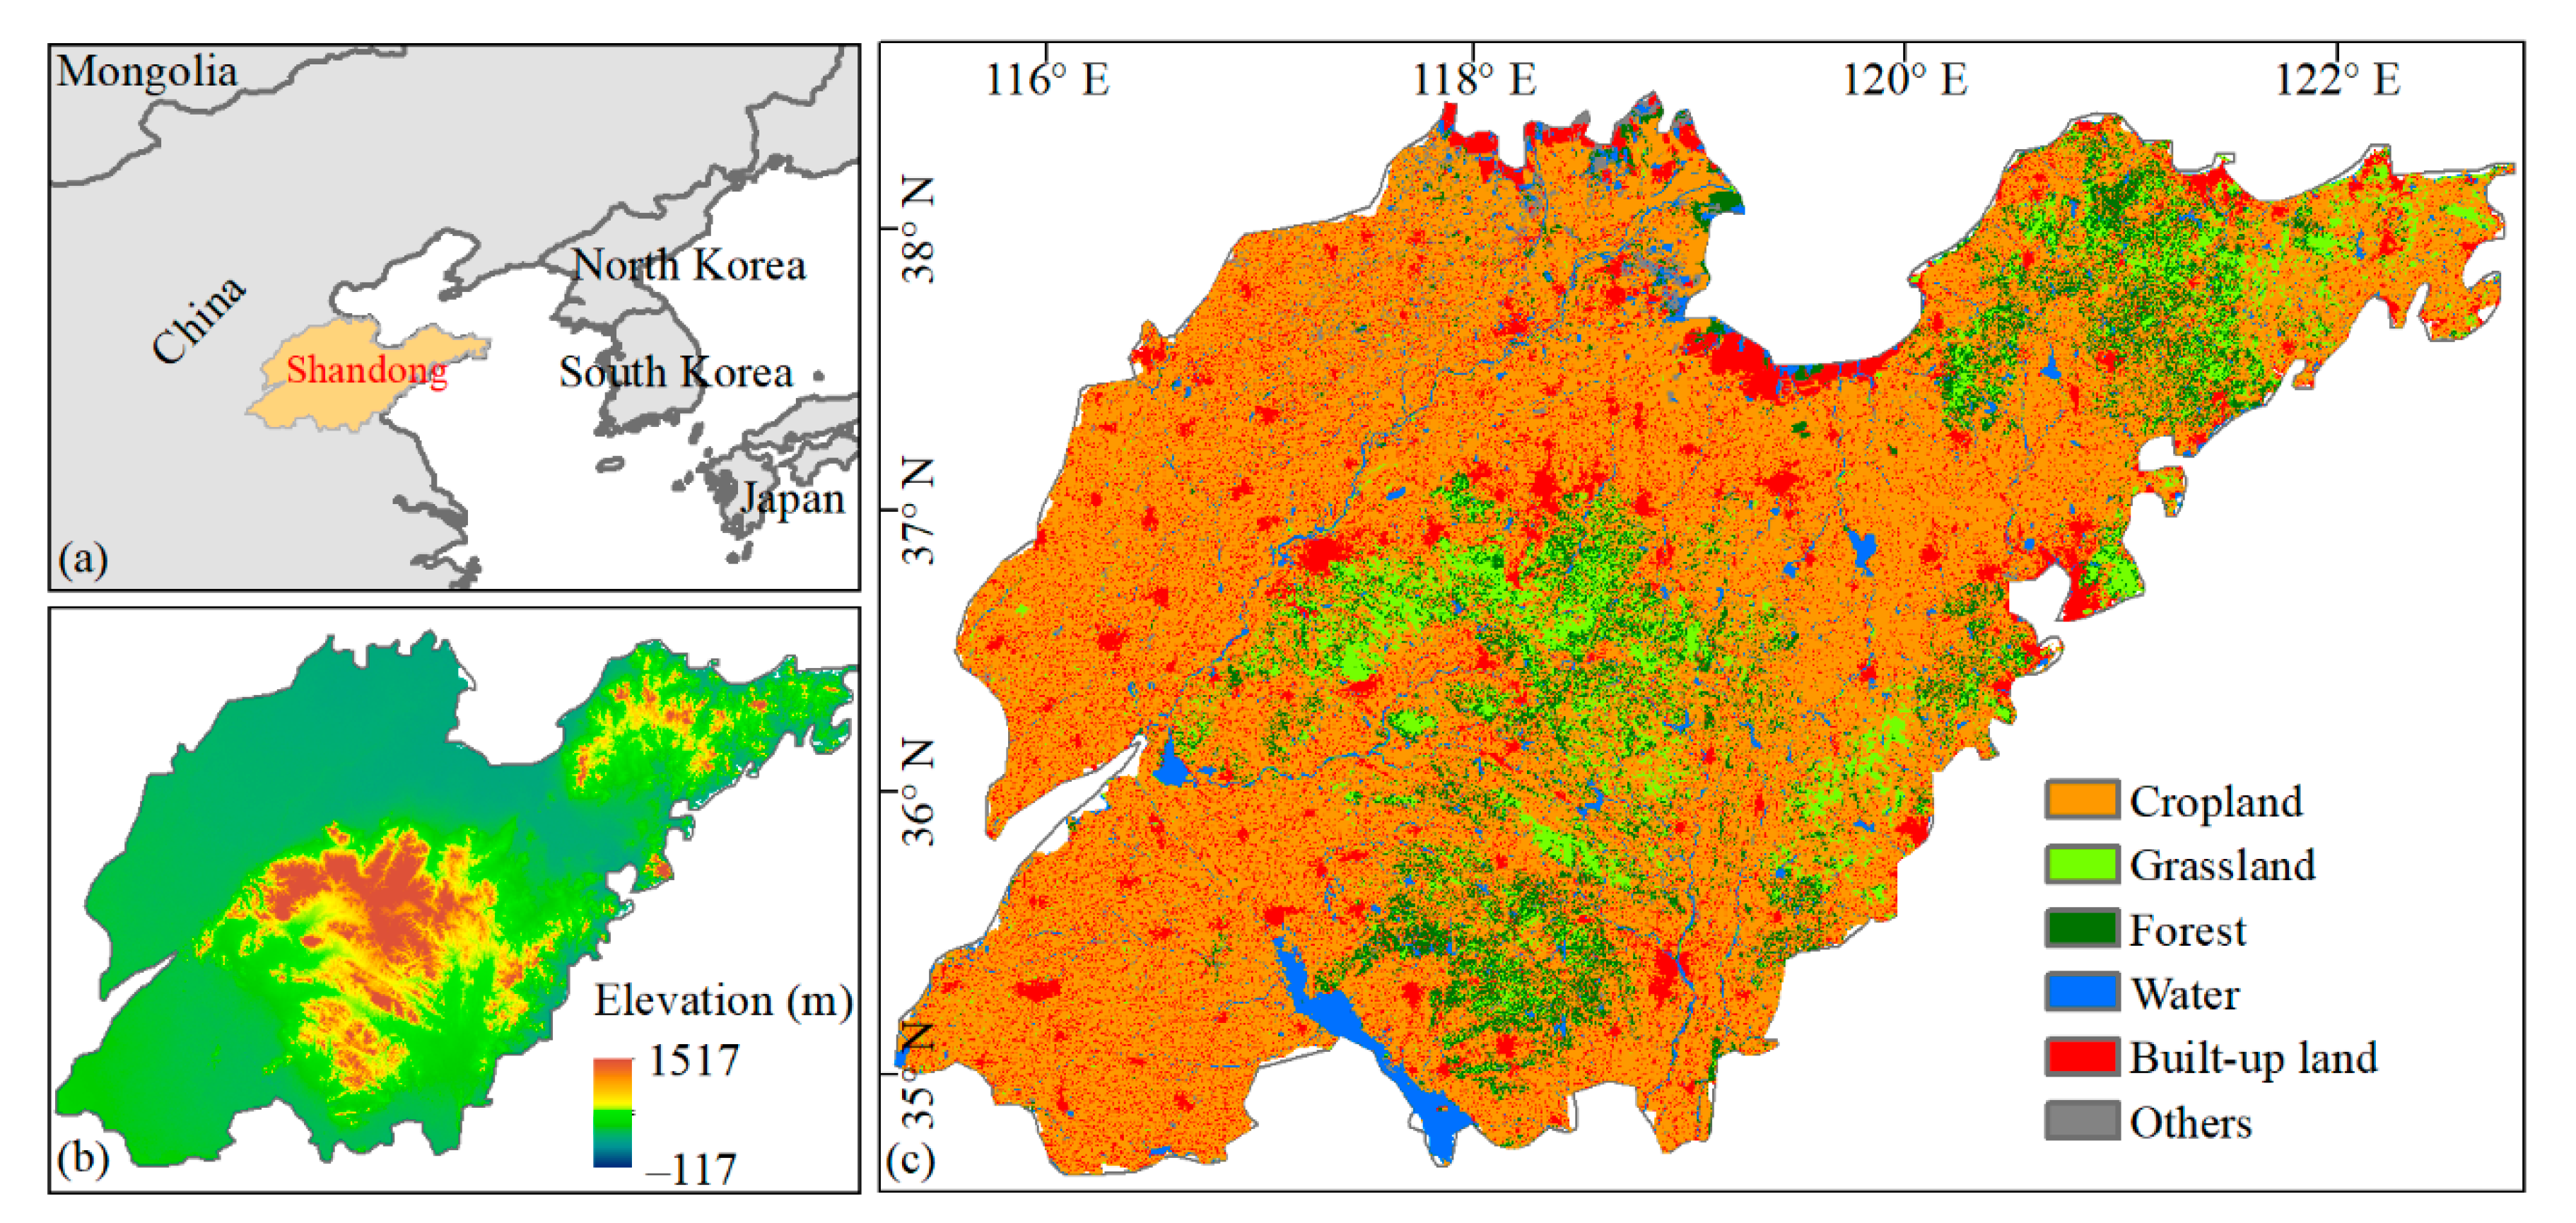
2.1. Study Area

Shandong Province is located in the eastern of China (114°19′–122°43′ E, 34°22′–38°15′ N), which has a land area of 1.57 × 10⁴ km2 (Figure 1). The proportion of cropland in Shandong Province is approximately 65% [33]. On the one hand, Shandong Province plays important roles in agricultural products provision, and on the other hand, economic growth of Shandong is also fast. The gross domestic product (GDP) was 73,129 billion RMB in 2020, which was 8.77 times higher than that in 2000 (8337 billion RMB). The population was 100.70 million in 2020, increased from 89.98 million in 2000. The urbanization rate of Shandong Province was 61.8% in the end of 2019, which was 38% in 2000.

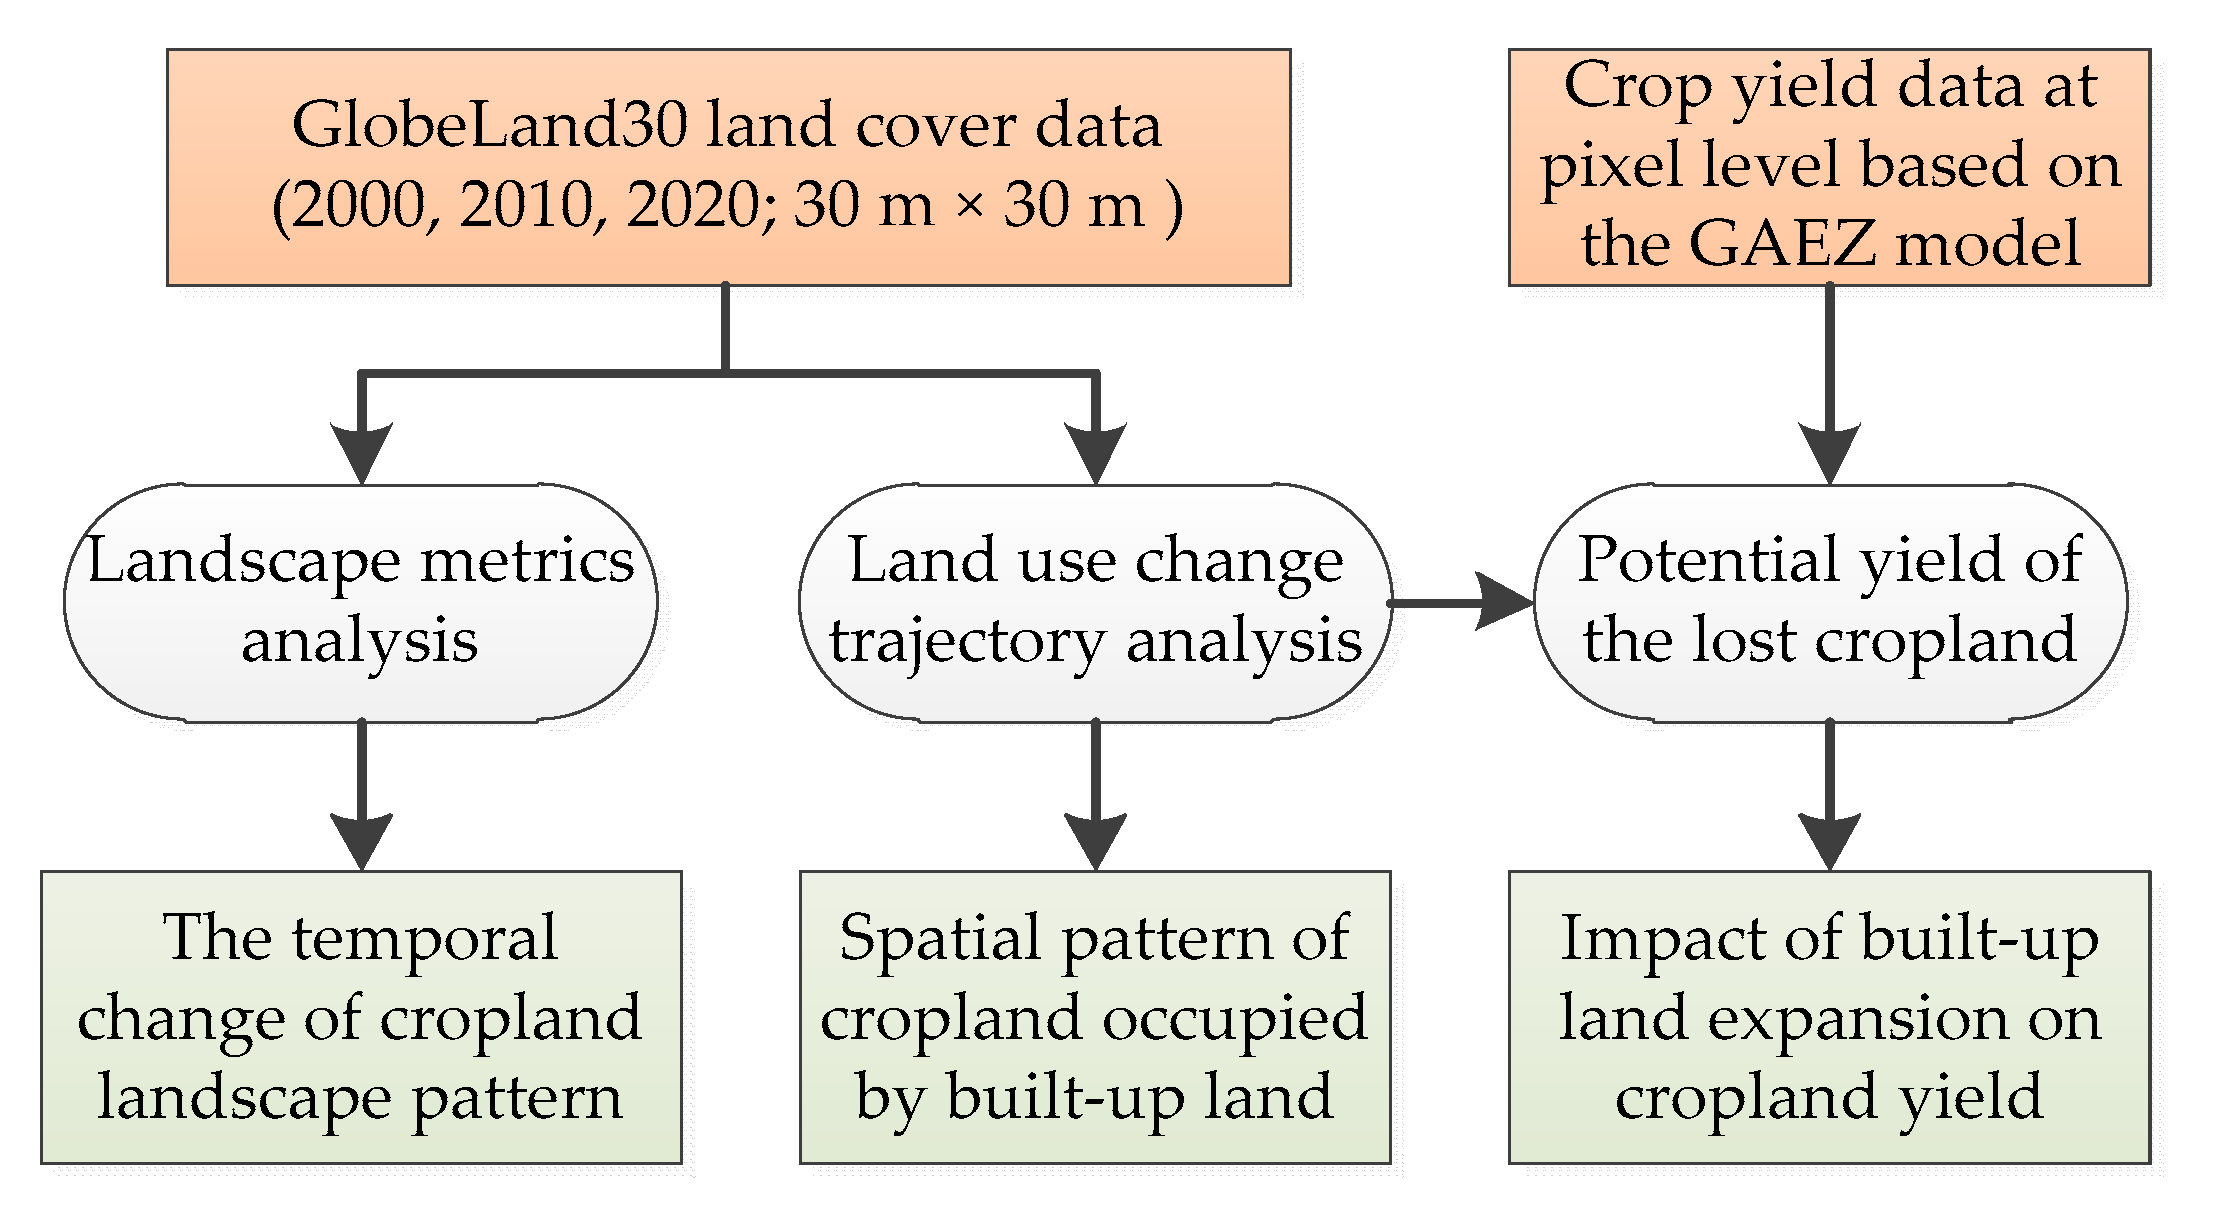
2.2. Land Use and Land Cover Data

The GlobeLand30 dataset was shown to be reliable in capturing urban land, with an accuracy approximately ten times greater than some prior land cover datasets [34]. We extracted the land use/cover data sets for 2000, 2010, and 2020 from GlobeLand30 [35]. Each of the time point is composed of 3 tiles (number: N50_30, N50_35, N51_35) that were retrieved from http://www.globallandcover.com/home.html?type=data (accessed on 17 January 2021). We mosaicked the tiles of each year and re-projected them to the Albers projection. The GlobeLand30 land cover data with a 30 m resolution was derived from Landsat and HJ-1 satellite images. The accuracy of this data was evaluated in some countries through comparing with other land cover products or through sample based validation [35]. Furthermore, the overall accuracy was assessed to be 82.4% for China [35]. Seven land cover datasets for China was compared in a previous study, and the results showed that GlobeLand30 has higher accuracy than the other six land cover products [36].
There are ten land cover types in the GlobeLand30 land cover data, including water bodies, wetland, artificial surfaces, cultivated land, forest, shrubland, grassland, bare land, permanent snow and ice, and tundra [37]. In this study, we reclassified the land cover data based on the regional characteristics of Shandong Province. The reclassified land cover data includes six types, which are cropland, grassland, forest, water, built-up land, and others.

2.3. Data Analysis

This study consisted of three steps (Figure 2). In the first step, we analyzed the spatial pattern of the cropland loss due to the built-up land expansion based on the trajectory analysis method. The spatial relationship between the cropland expansion and existing built-up land uncovered. Second, several landscape metrics were calculated to reveal the variation of landscape pattern and the degree of fragmentation of the cropland from 2000 to 2020. Finally, in the third step, the land cover type data and the pixel level potential crop yield data was combined to explore the imprint of built-up land expansion on cropland yield during 2000 and 2020.

2.3.1. Analyzing Cropland Occupation by Built-Up Land Expansion

The spatial pattern of croplands occupied by built-up land expansion were extracted for the period of 2000–2010 and the period of 2010–2020 respectively. The transition was identified using the land use change trajectory analysis method. The method was illustrated in detail in [38].

2.3.2. Quantifying the Change of the Landscape Pattern for Cropland

In addition, the variation of landscape pattern was also assessed. Four landscape level landscape metrics were calculated in this study, including mean patch size, patch size CV (coefficient of variation), patch density, and aggregation index [39]. Patch size is the total area of the patch, and mean patch size is based on the average area of patches at the landscape level. The cropland with a smaller mean patch size value might be considered more fragmented. For example, a mean patch size of 100 m2 could represent cropland with 70 or 100 m2 patches, or cropland with 30, 50, 70, and 200 m2 patches, and this difference could be important and meaningful. Patch size CV indicate the patch size variability. Therefore, the mean patch size could be interpreted better together with the patch size CV value. The patch density measures the density of patches for cropland in the entire study area. Within the same region, the value of patch density increases as the number of patches increases. The aggregation index is the number of like adjacencies involving the cropland, and it is calculated as a percentage based on the ratio of the observed number of like adjacencies to the maximum possible number of like adjacencies. A larger aggregation index value means a more aggregated and compact patch [40].
P a t c h   d e n s i t y = 1 A j = 1 M n i
A g g r e g a t i o n   i n d e x = [ g i i max g i i ] × 100
where A is the area of Shandong Province, ni is the number of patch i. gii represents the number of like adjacencies between pixels of patch types i based on the single-count method. max g i i represents the maximum number of like adjacencies between pixels of patch type i based on the single count method.
The landscape metrics of cropland patches were calculated applying the R package “landscapemetrics” [41].

2.3.3. Measuring the Imprint of Built-Up Land Expansion on Cropland Productivity

The potential yield of cropland simulated by the Global Agro-Ecological Zones Model (GAEZ) was used to assess the cropland quality in this study. The GAEZ model was developed by the Food and Agriculture Organization (FAO) of the United Nations and the International Institute for Applied Systems Analysis (IIASA) [42]. This model includes maize, soybean, wheat, and so on. The potential yields simulated by this model can reflect the cropland quality and food provision ability in Shandong Province. In this study, the potential crop yield data was released by Liu et al (2015). The potential yield is influenced by climate variation. To eliminate the effects of climate fluctuations and remove the errors in the assessment of the effect of built-up land expansion on the cropland productivity, the potential yield in the middle of the study period was used. The potential productivity simulated by GAEZ reflects long term characteristics instead of instantaneous situation [43]. The accuracy of the data was verified based on the actual yield data from the provincial bureau of statistics. The correlation between the simulated potential crop yield and the actual yield data was shown to be 0.82 and the standard deviation was 7400 tons [44]. The area where cropland occupied by the built-up land expansion was extracted firstly. Then, together with the potential crop yield data, the yield potential of the occupied cropland was explored at the pixel level.

3. Results

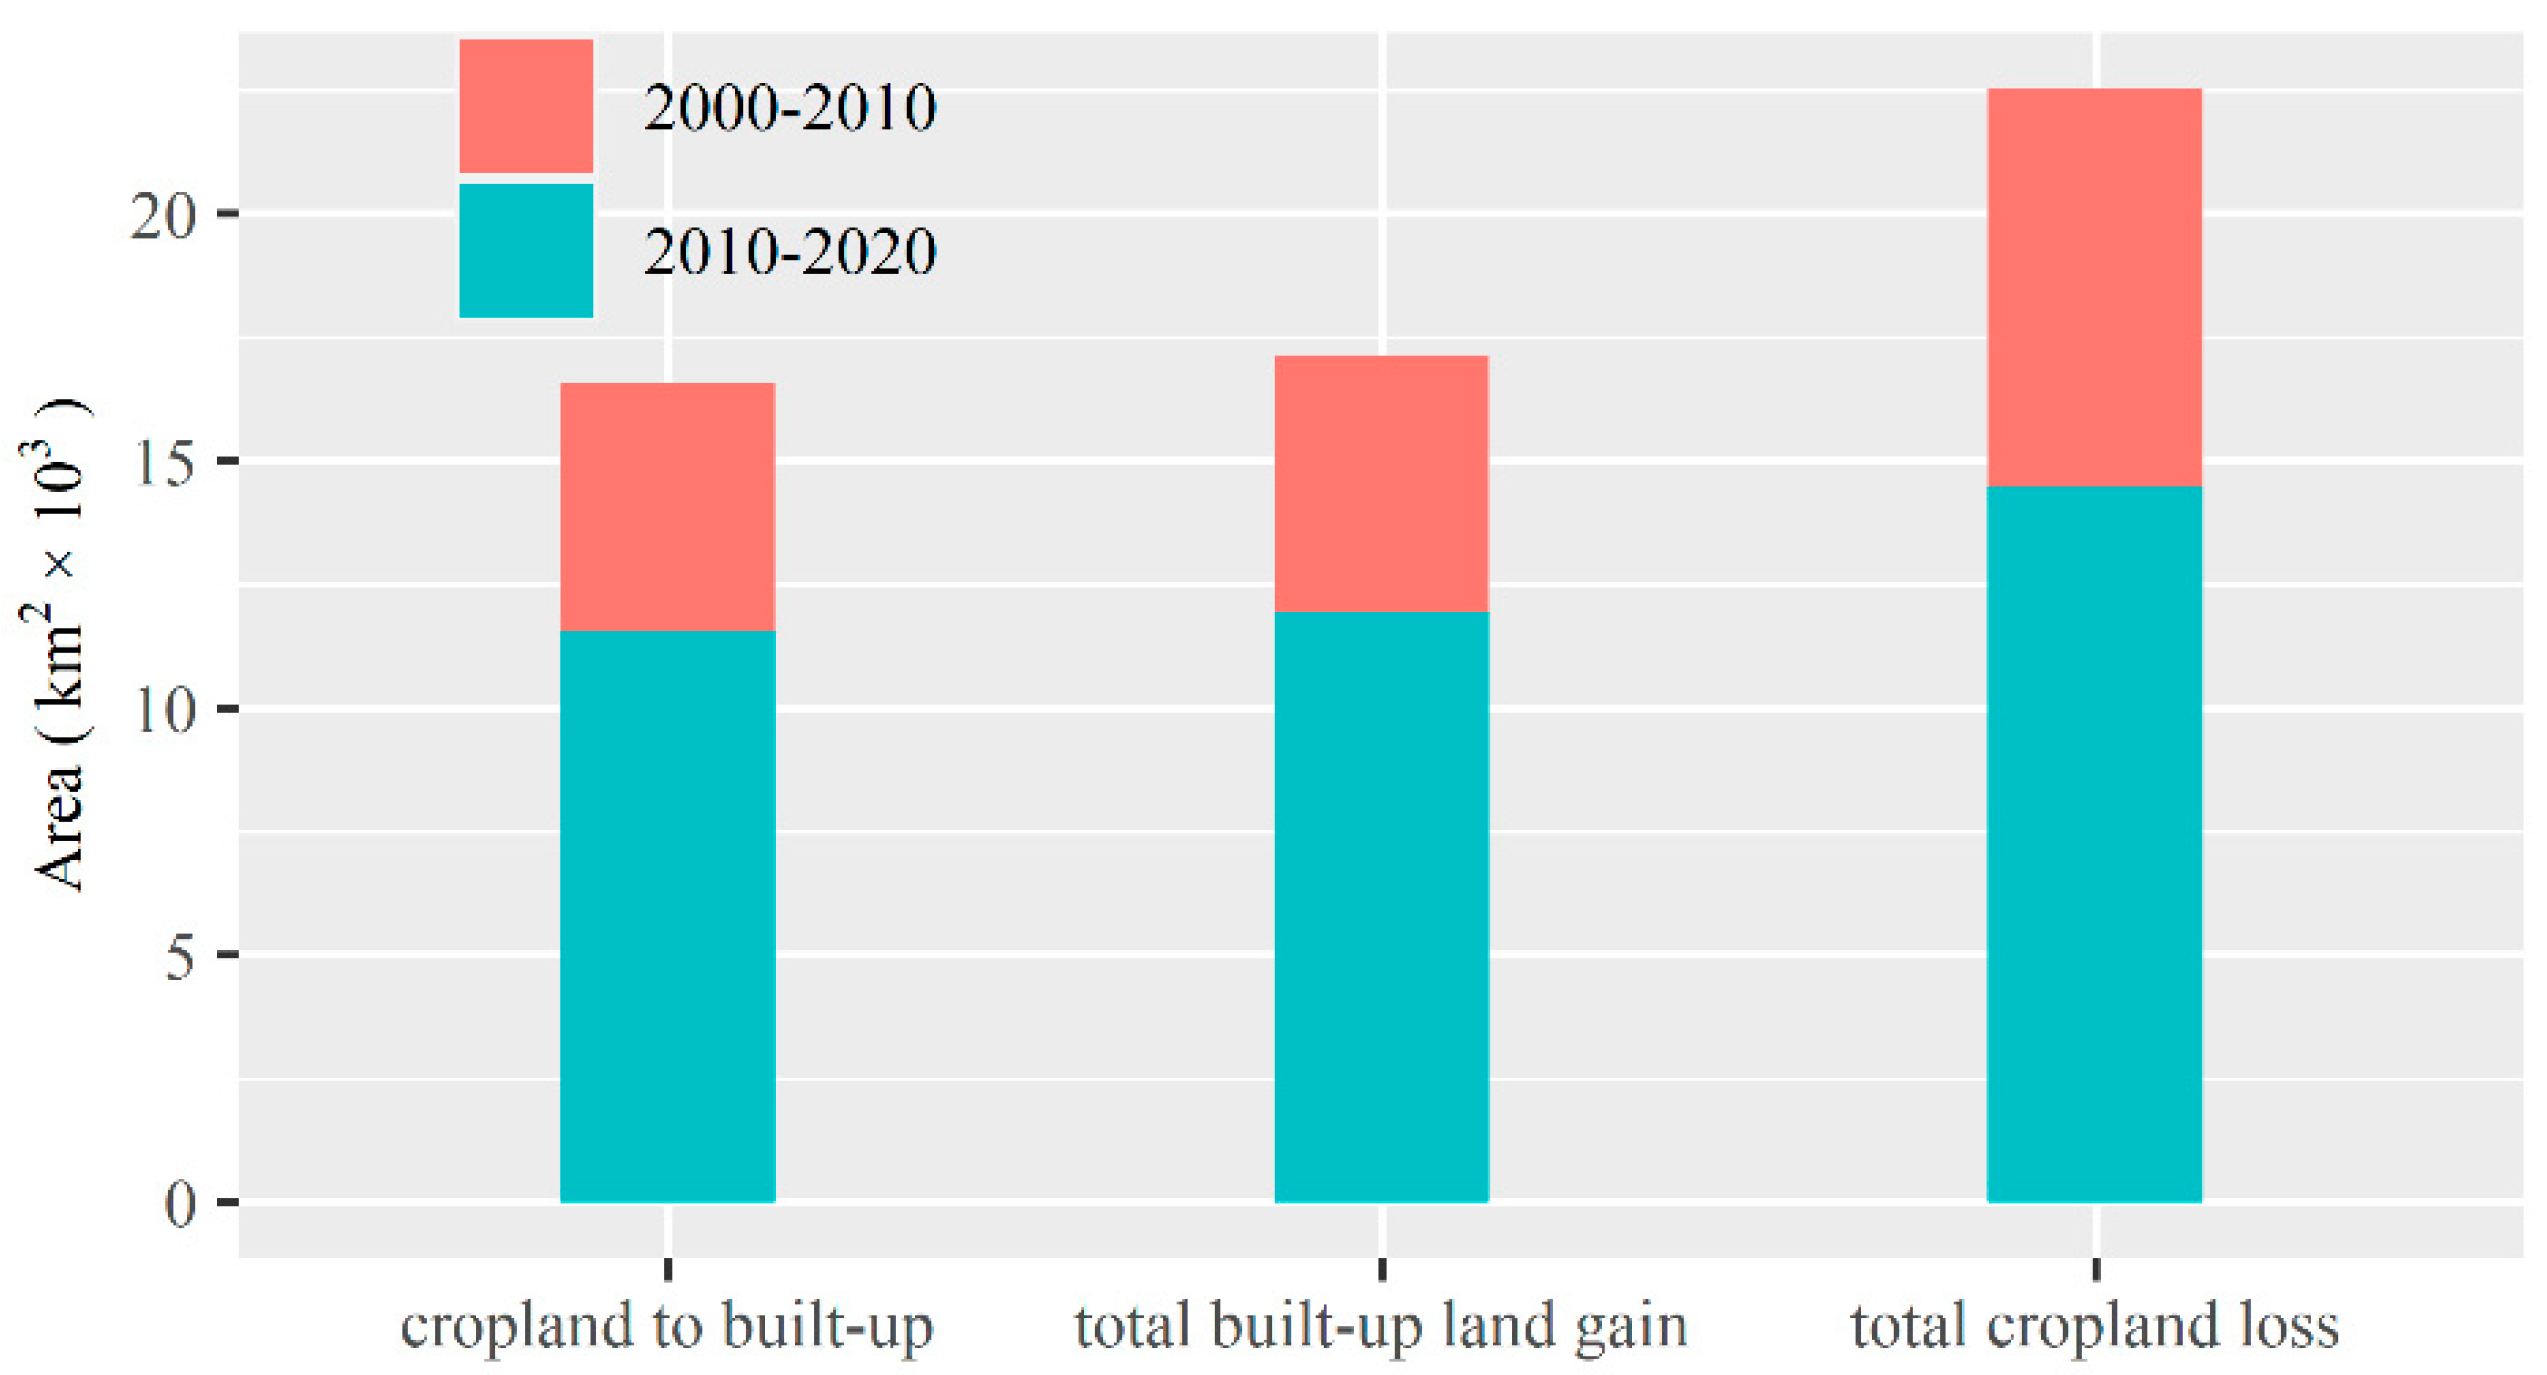
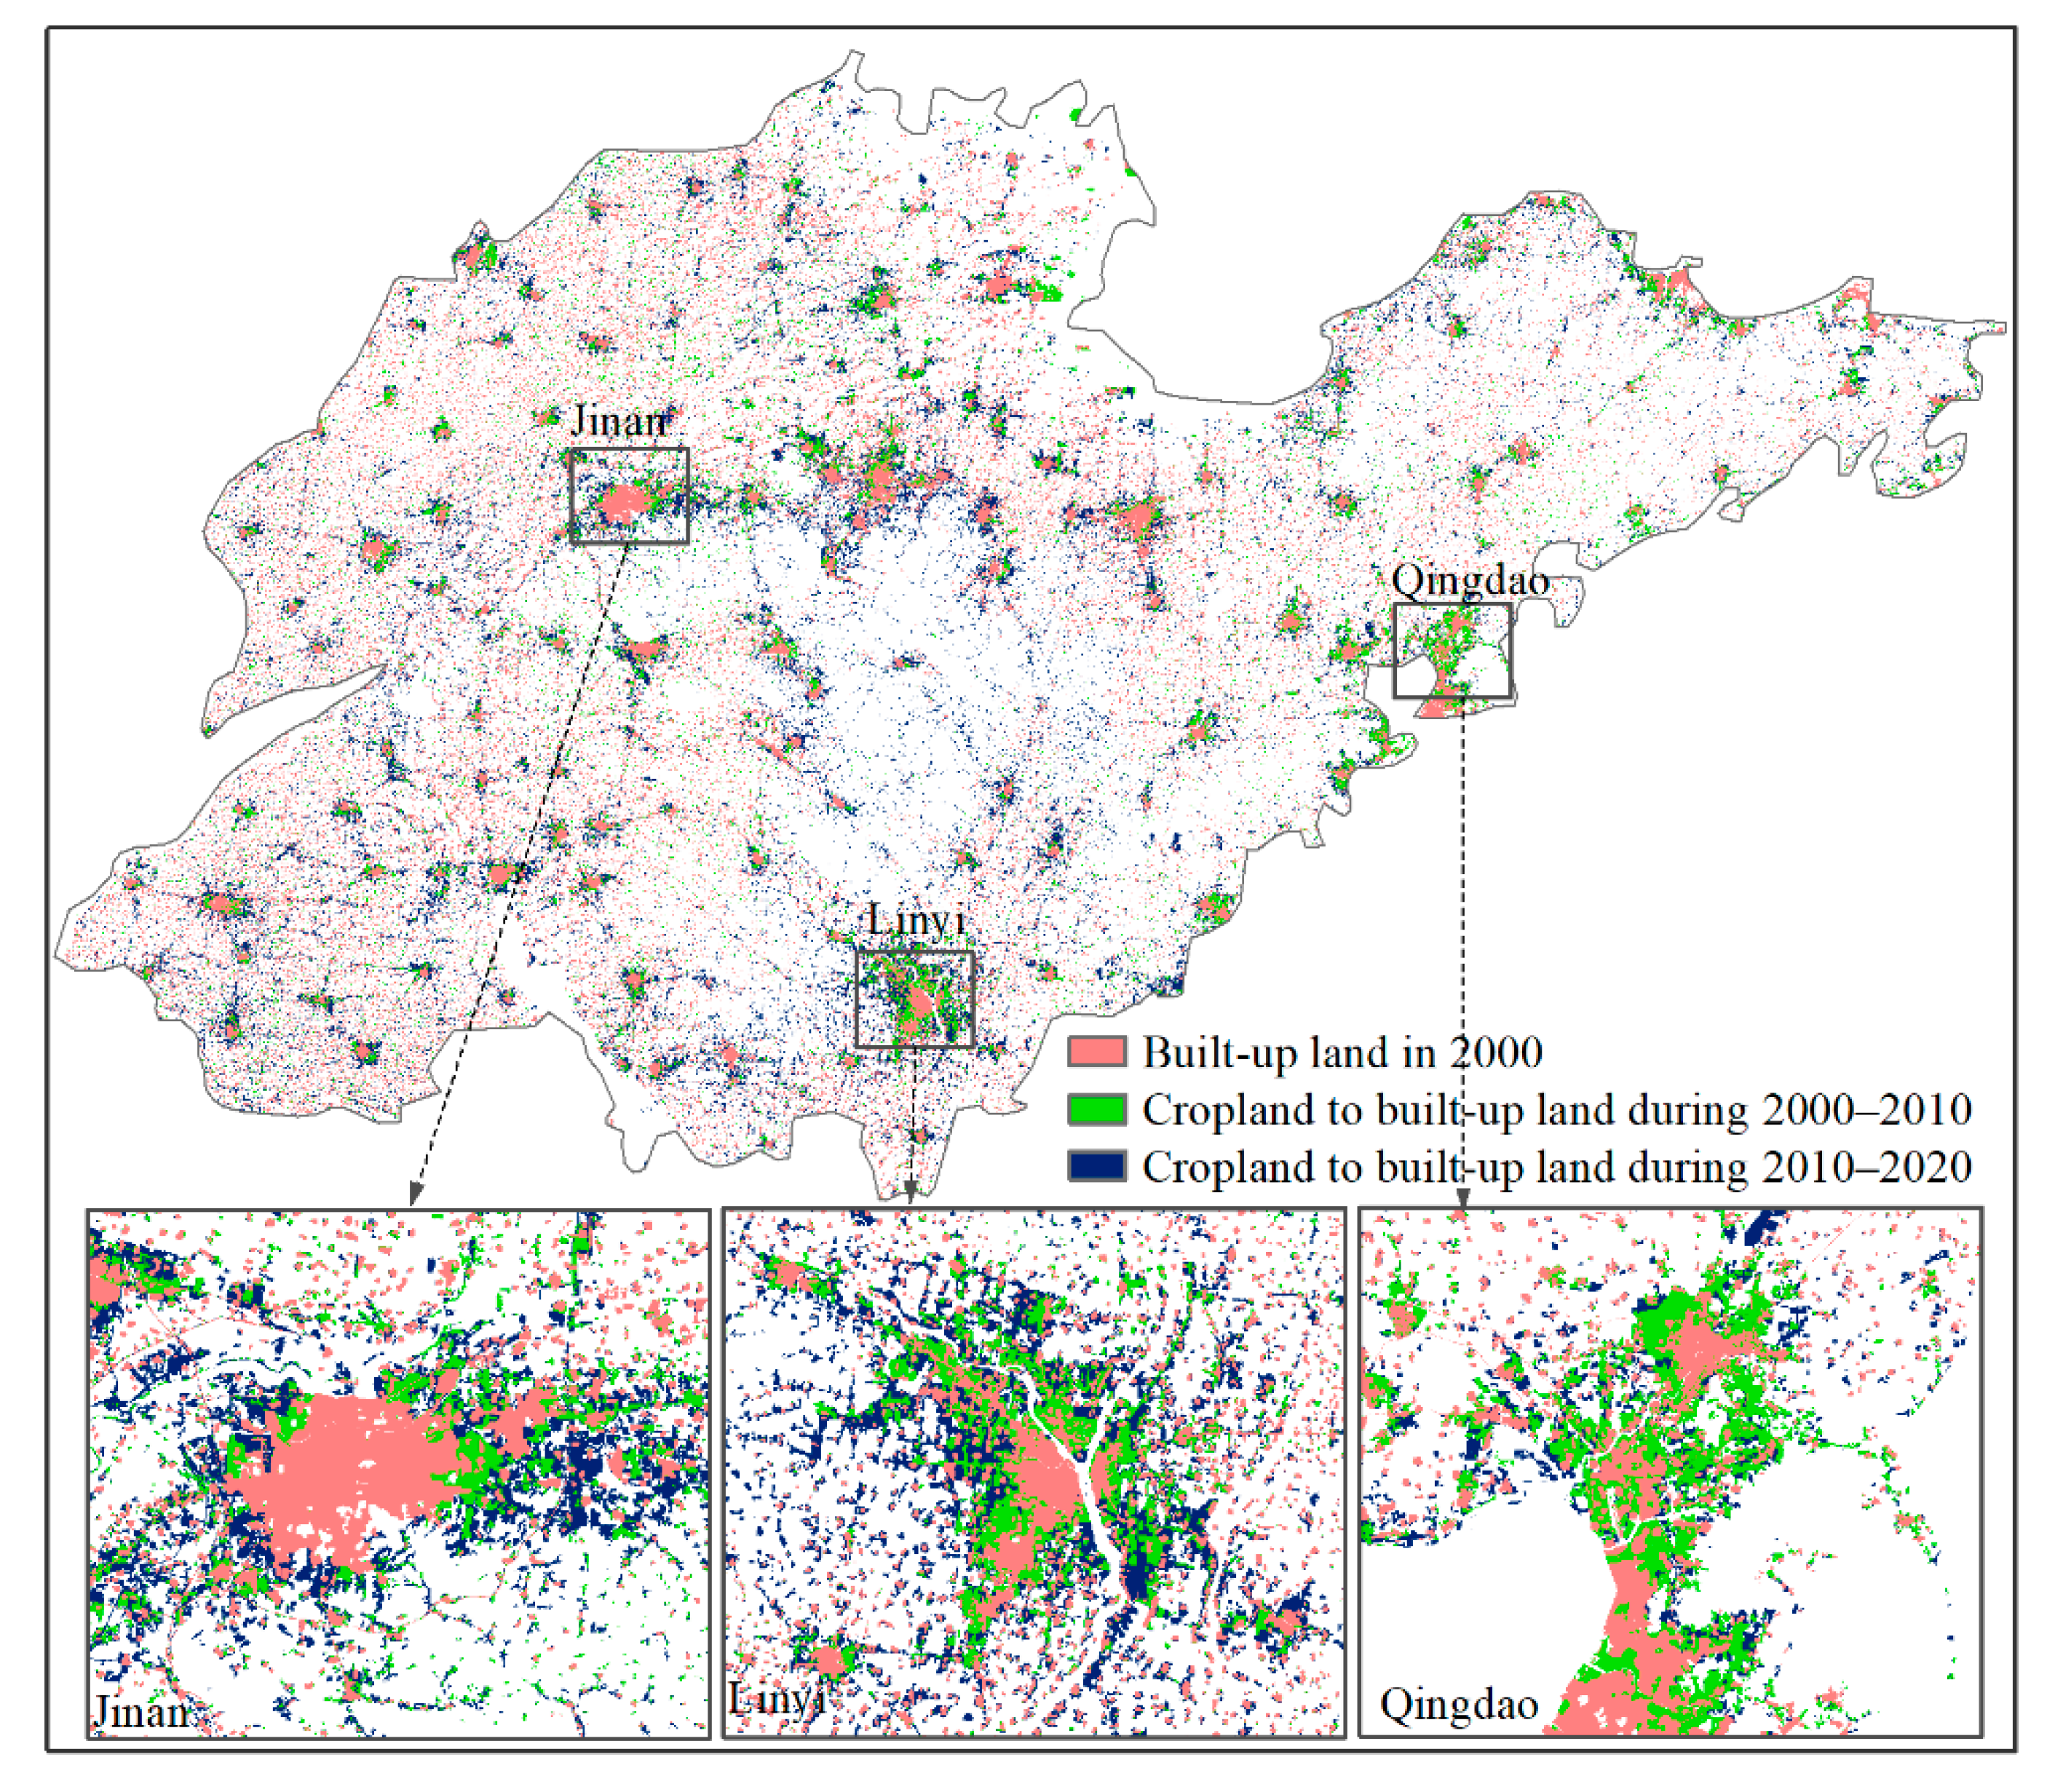
3.1. Spatial Explicitly Analysis of Cropland Loss Due to Built-Up Land Expansion

The land changes in the whole study area were dominated by increasing losses of cropland and persistent gains of built-up land. The occupation of cropland was mainly from built-up land, especially during 2010 and 2020. During 2000–2010, the area cropland occupied by built-up land expansion was 4987 km2, which represents 95.9% of the total expanded built-up land and 61.9% of the cropland loss in Shandong Province. While during 2010–2020, the built-up land encroachment of cropland was 11,571 km2, accounting for 96.8% of the total expanded built-up land and 79.9% of the total cropland occupation respectively (Figure 3). Therefore, the conversion rate from cropland to built-up land was faster during the second period.
The spatial distribution of cropland occupied by built-up land during 2000–2010 and 2010–2020 is shown in Figure 4. The occupation of cropland by built-up land expansion concentrated around the existing built-up land. Higher tier cities in Shandong Province such as Jinan, Qingdao, and Linyi witnessed remarkable cropland losses from built-up land expansion (the bottom of Figure 4). This means the urbanization of mega-city has resulted in considerable cropland loss. In addition, some tiny scale cropland loss also appeared around the small towns or villages. Compared with the period of 2000–2010, the cropland loss to built-up land had expanded from the core of cities to the periphery during the period of 2010–2020.

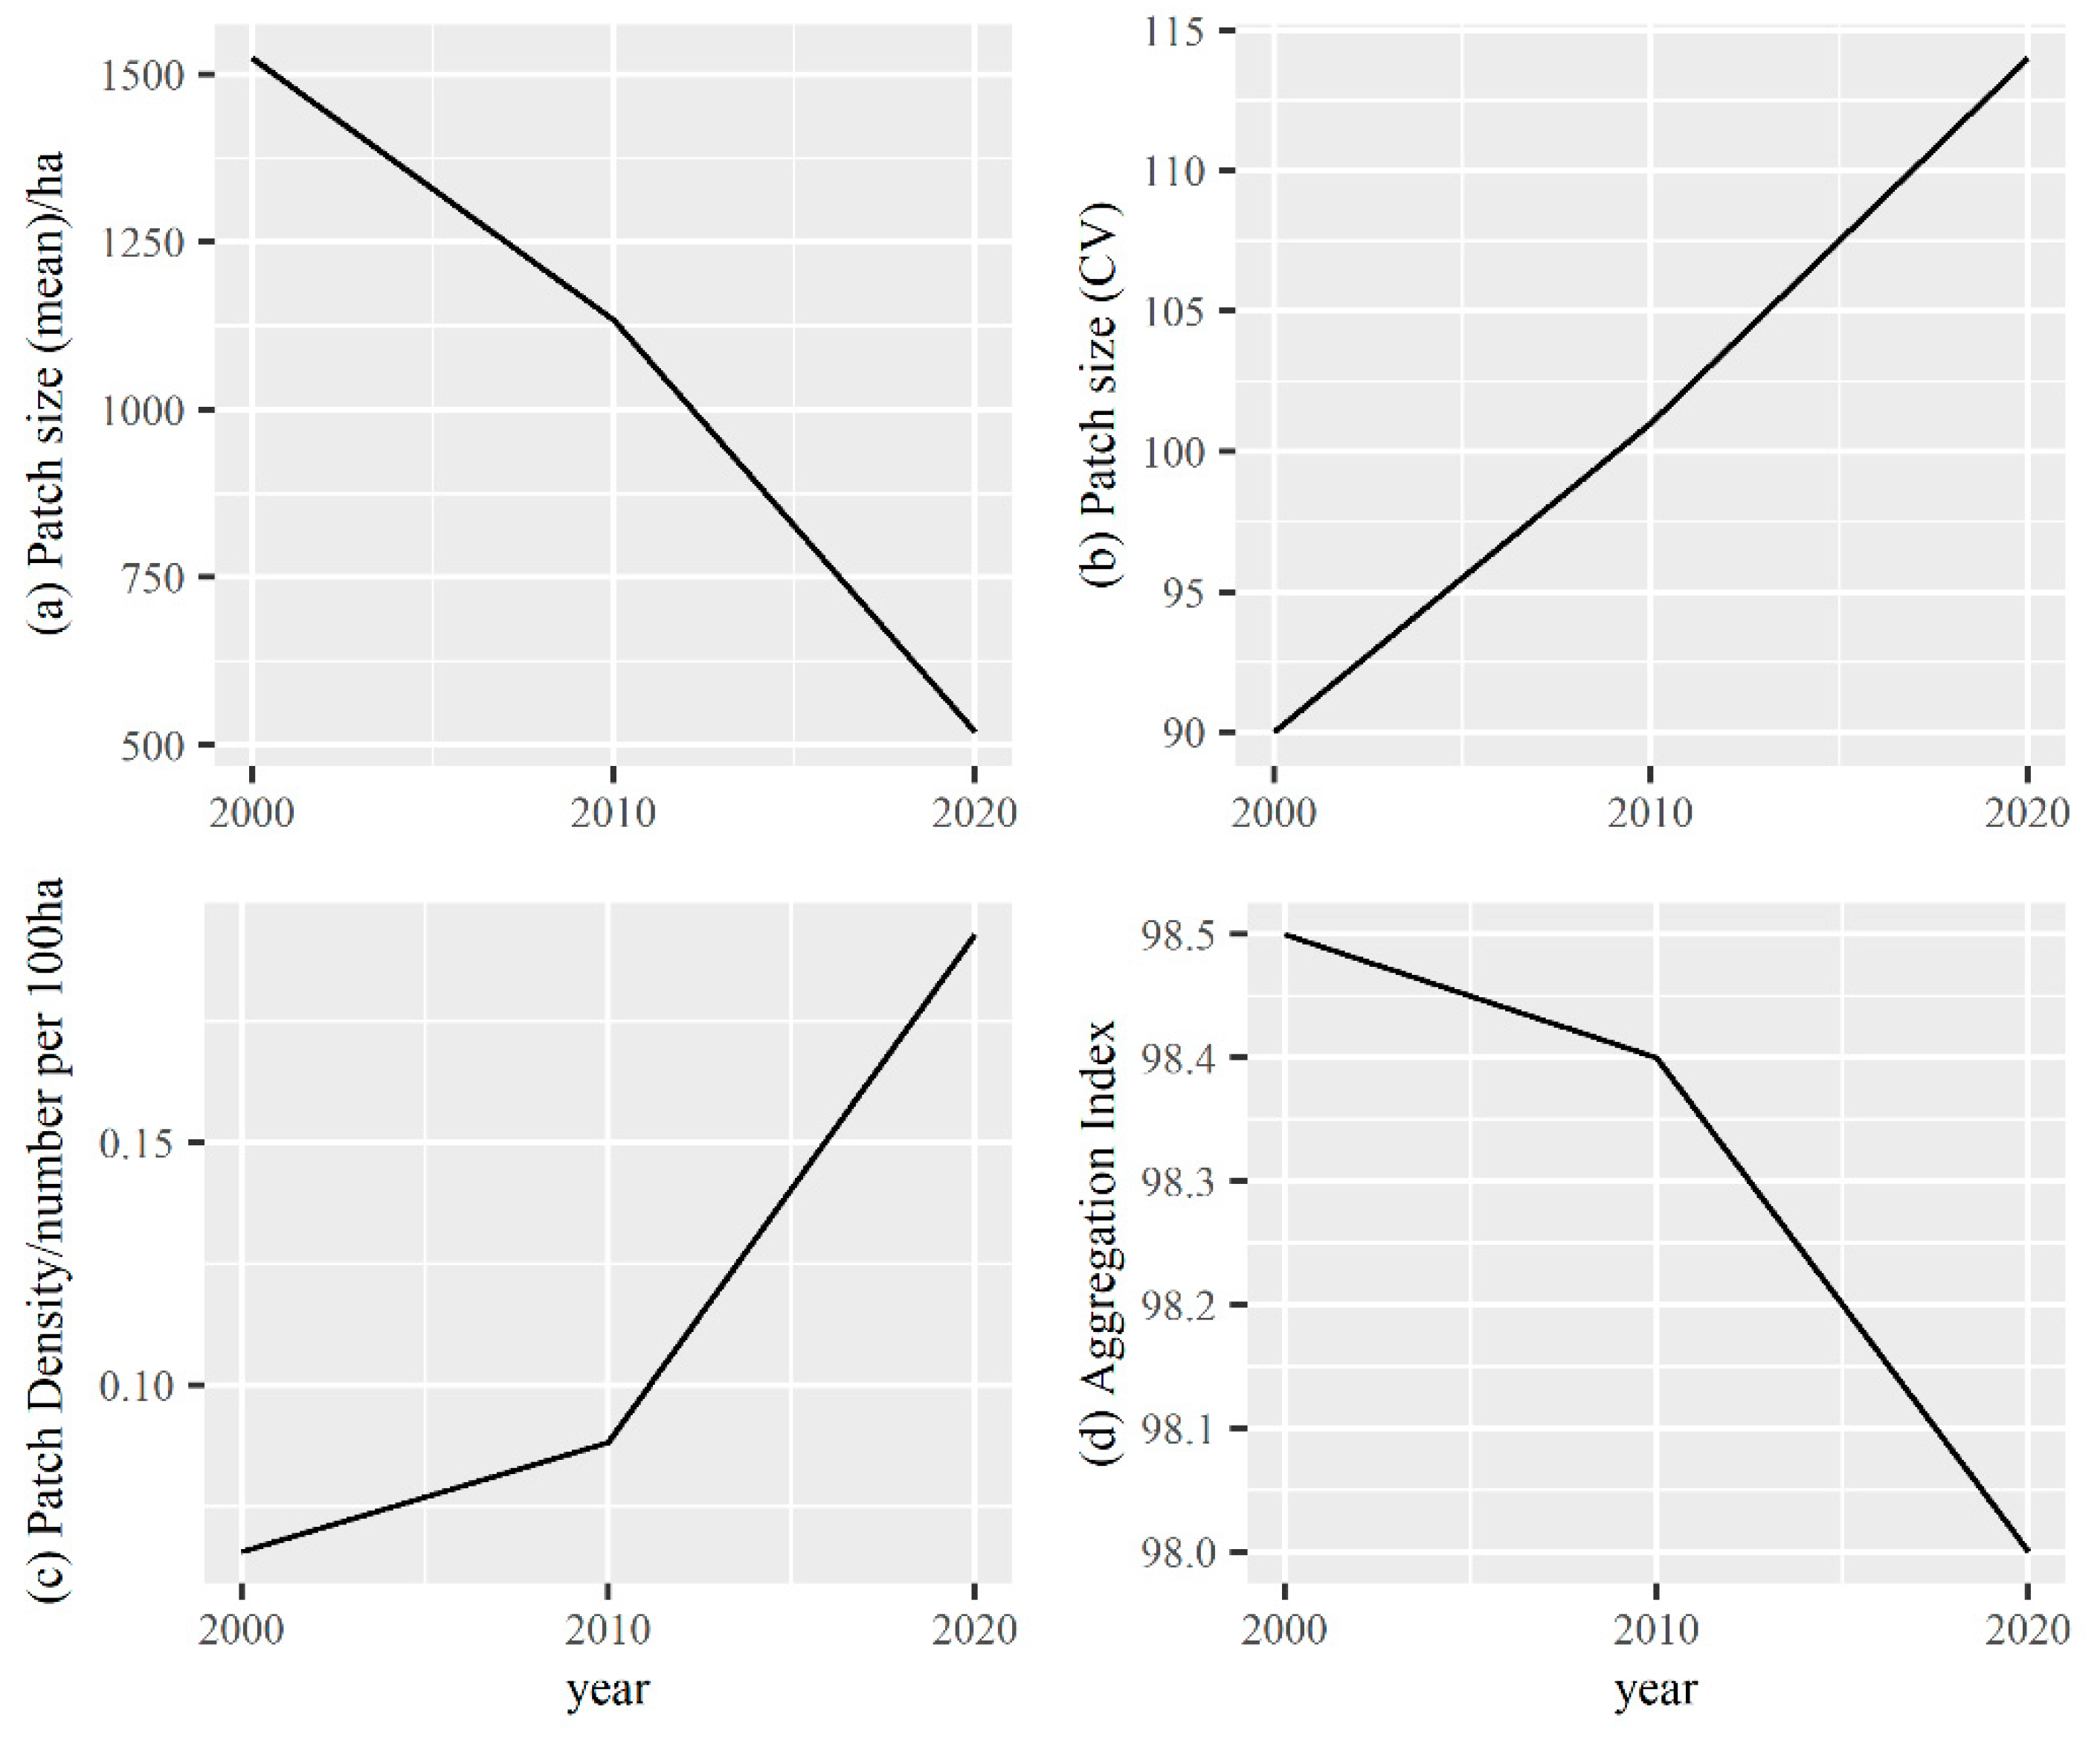
3.2. Landscape Pattern Changes of Cropland during 2000 and 2020

In addition to the cropland loss area, the expansion of built-up land usually caused the de-intensification of cropland. In this part, the landscape patterns of the cropland in 2000, 2010, and 2020 were assessed. Four representative landscape metrics of cropland were calculated for the whole region, including the mean patch size, the coefficient of variation of patch size, the patch density, and the aggregation index (Figure 5). The mean patch size of cropland decreased from 1524 ha in 2000 to 519 ha in 2020. The coefficient of variation of cropland patch size was 90, 101, and 114 for the year 2000, 2010, and 2020 respectively. The cropland patch density showed a notable increase trend from 2000 to 2020. Contrastingly, the aggregation index decreased over time. These results reflected that cropland had become smaller in patch size, and more isolated between patches throughout the two periods.

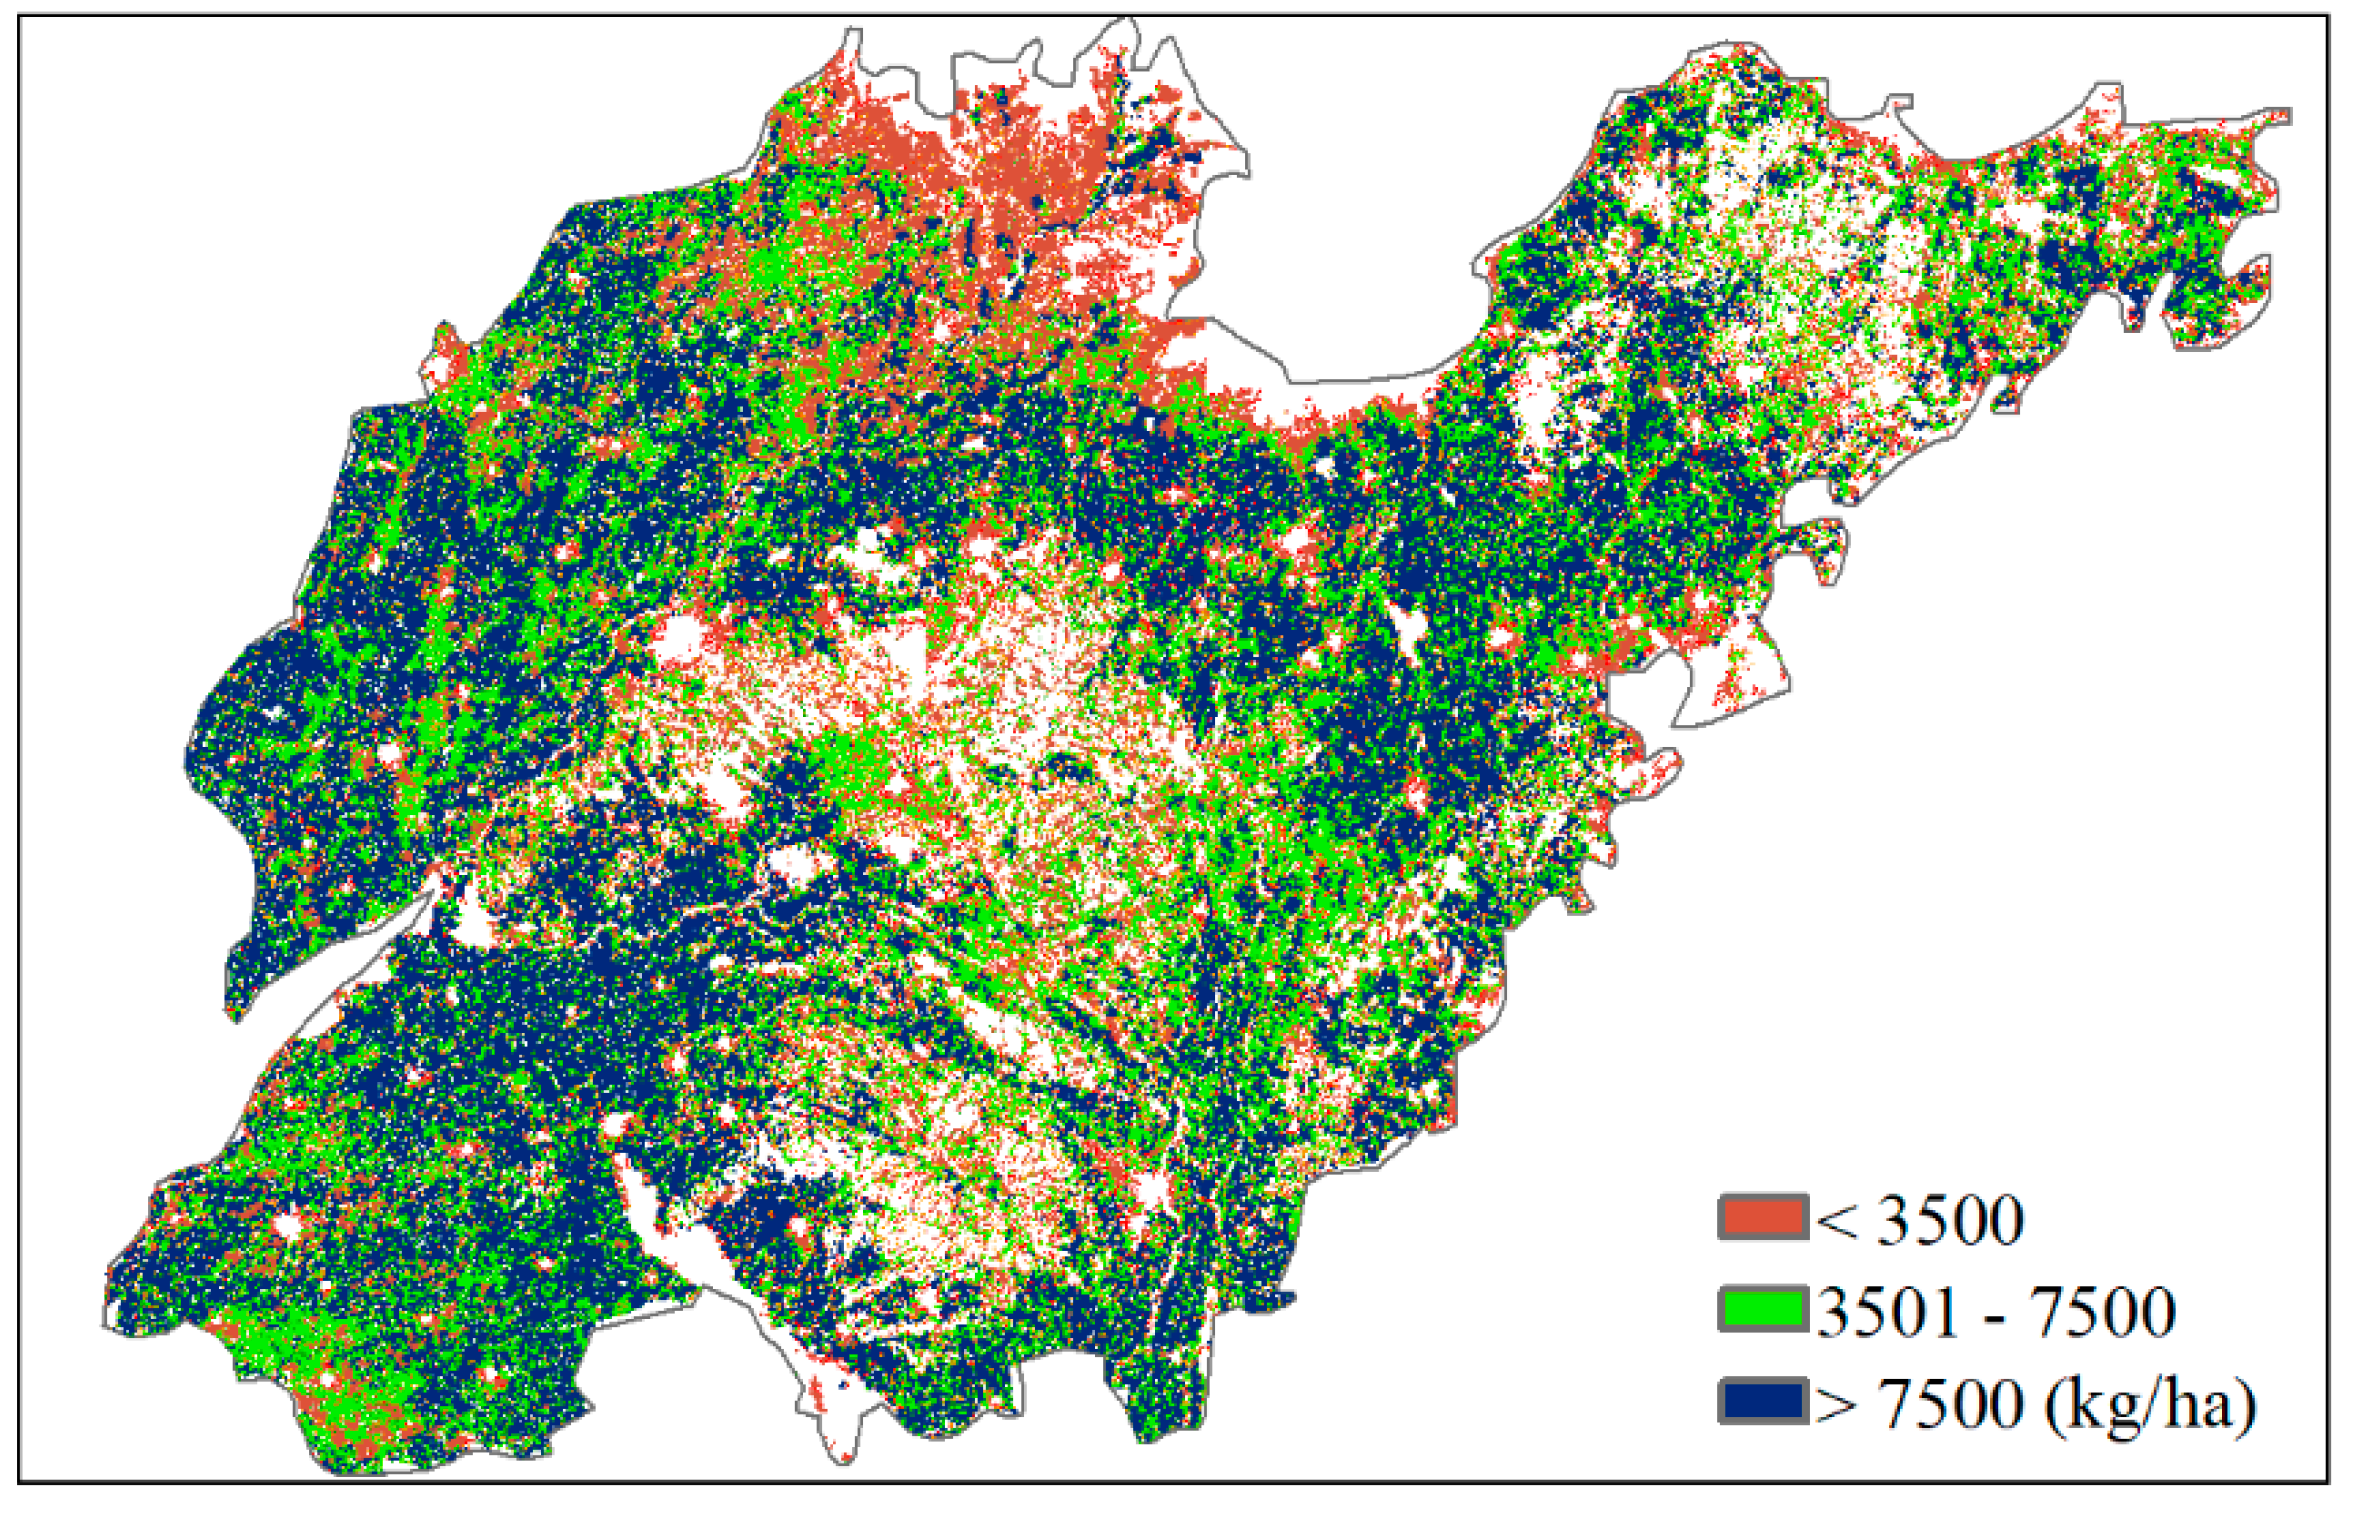
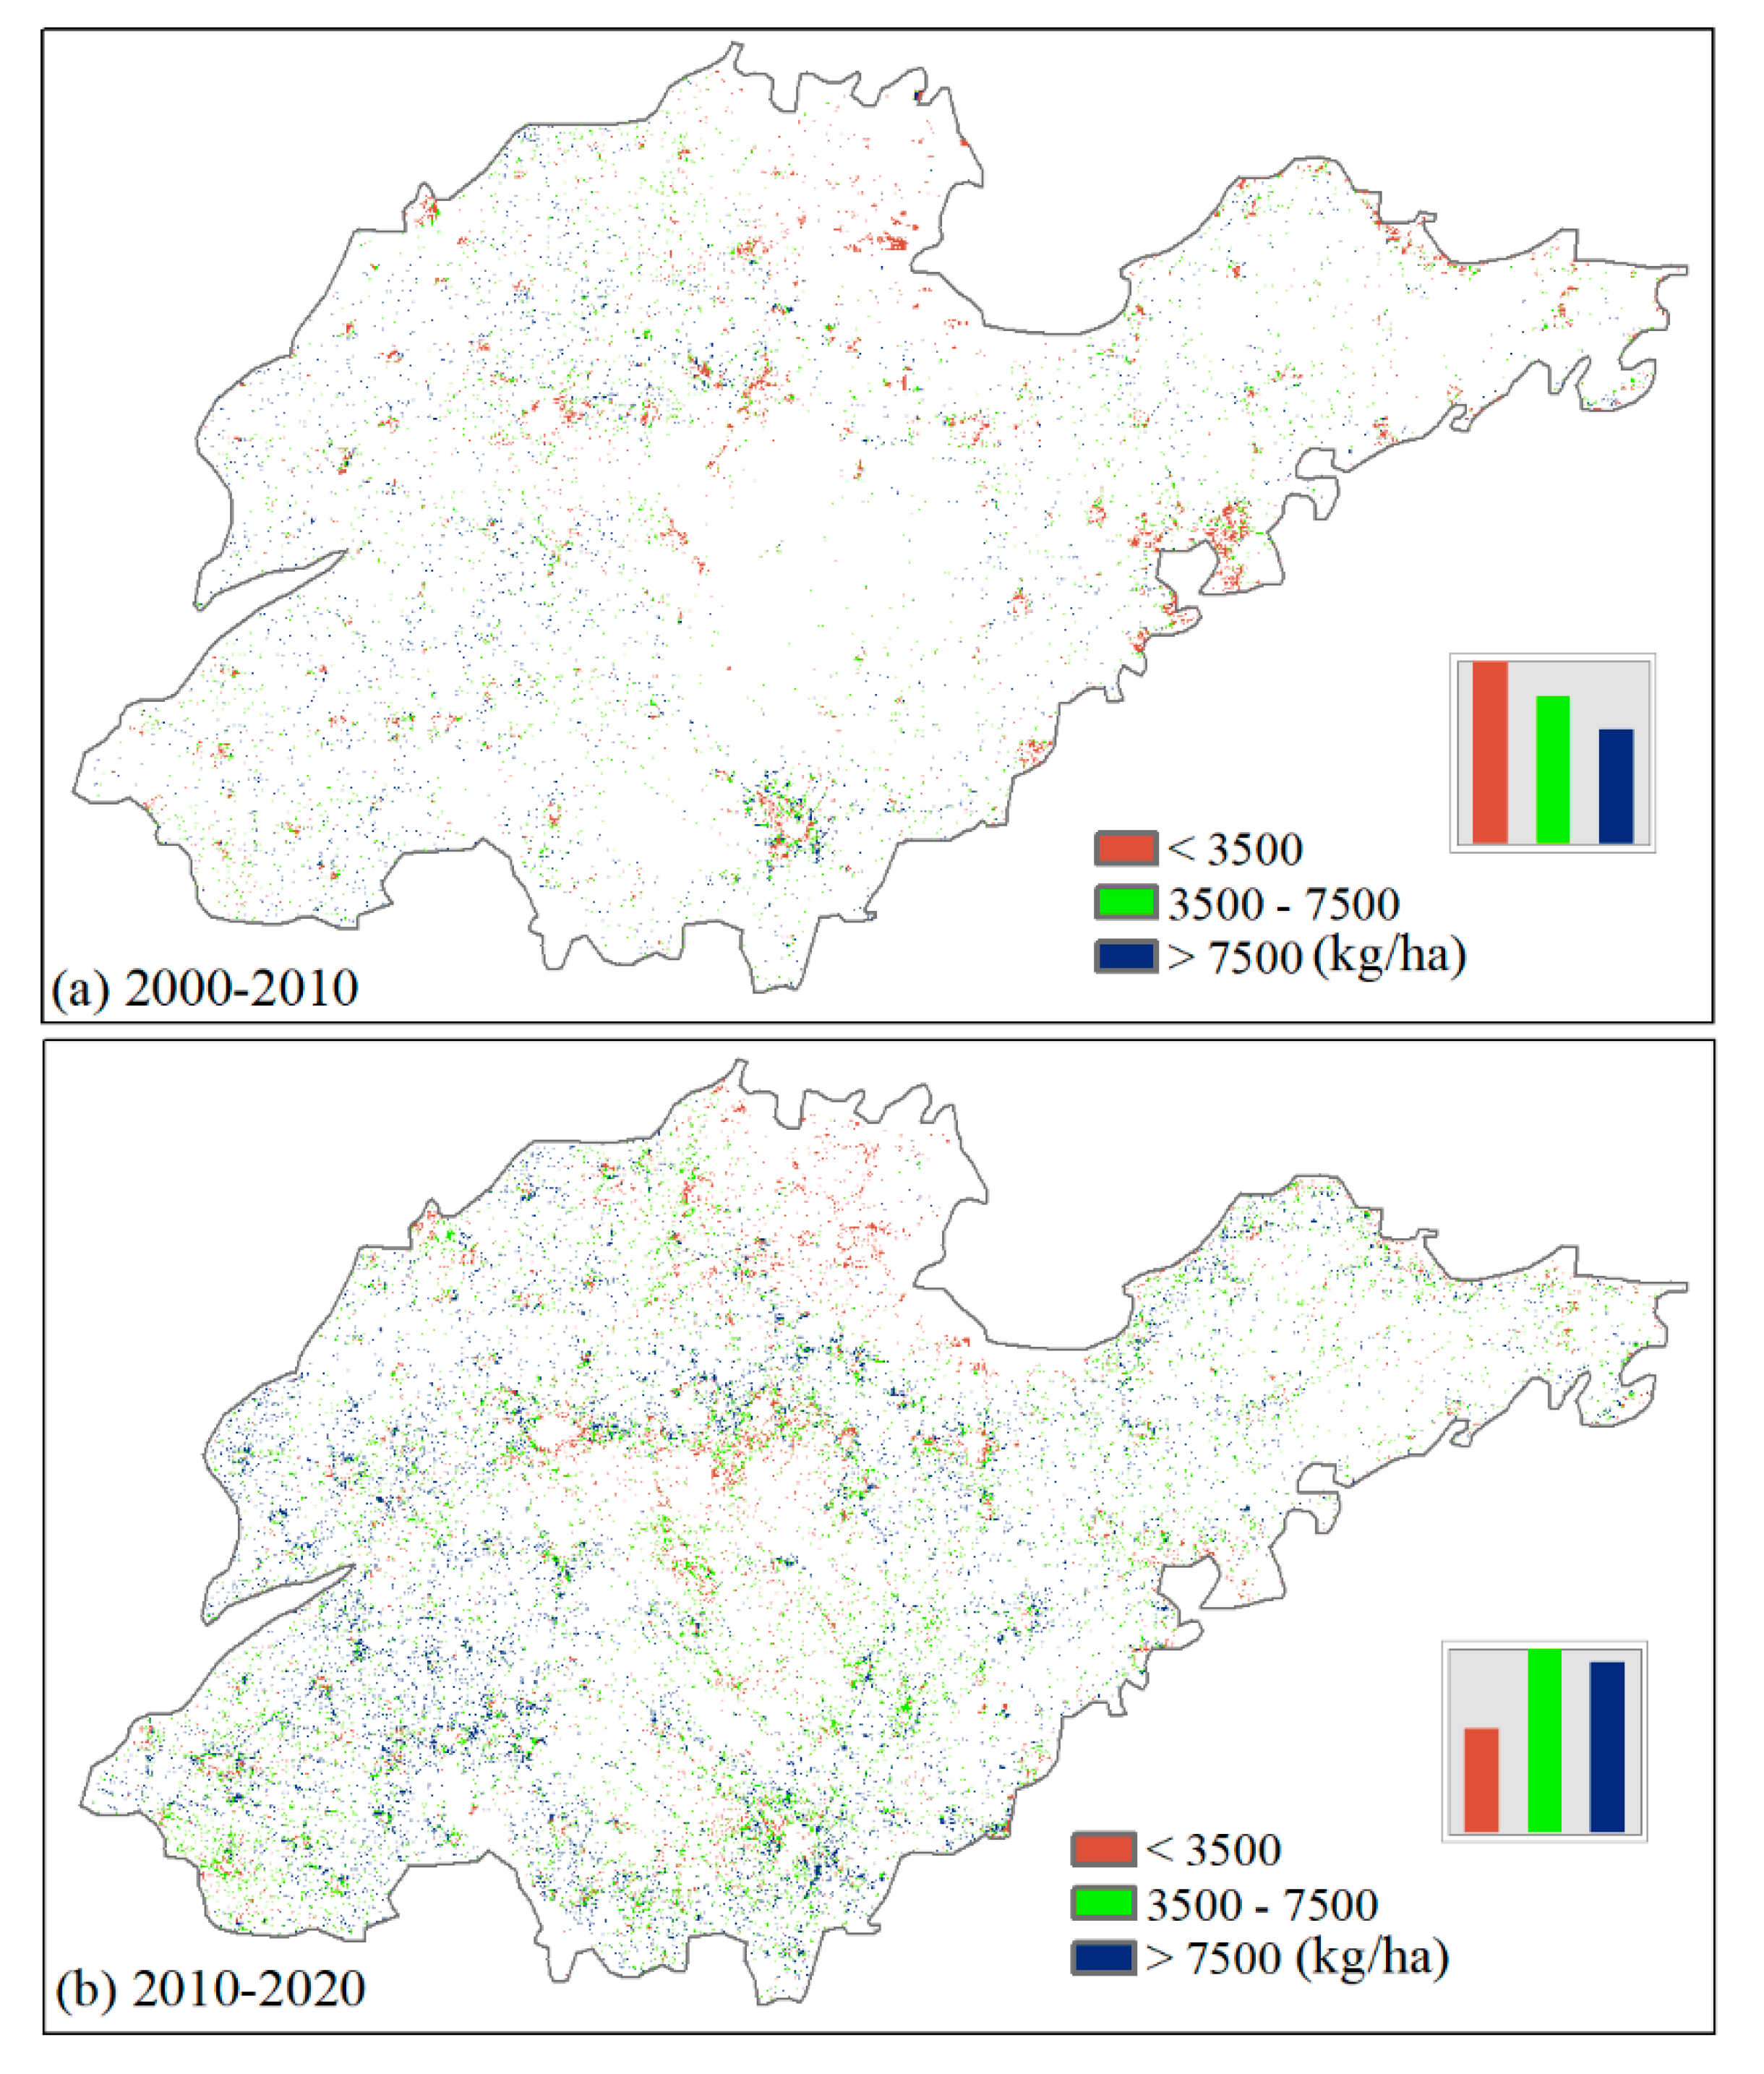
3.3. Imprint of Built-Up Land on Cropland Yield during 2000 and 2020

The spatial distribution of the potential yield of cropland simulated by the GAEZ model was shown in Figure 6. It can be found that the potential yield of cropland occupied by built-up land expansion showed noticeable spatiotemporal variations (Figure 7). From 2000 to 2010, the potential yield of cropland lost by built-up land was lower compared with that in the following decade (from 2010 to 2020). The lost cropland with potential yield lower than 3500 kg/ha occupied 41% and 22% of the total area of the cropland occupied by built-up land during the first and the second period respectively. While the proportions of high quality cropland (with the potential yield more than 7500 kg/ha) lost was 25% and 37% during the first and the later period respectively. Therefore, the proportion of higher quality cropland that occupied by built-up land was higher in the second period. In addition to the proportion, the area of high-quality cropland lost by built-up land increase from 1274 km2 during the first stage to 4305 km2 during the second stage. The area of middle quality cropland (between 3500 kg/ha and 7500 kg/ha) lost by built-up land increased from 1652 km2 during the first stage to 4619 km2 during the second stage.

4. Discussion

4.1. Special Attention Should Be Paid to Protecting Cropland in the Context of Urbanization

This study found that more than ninety percent of built-up land expansion involved an encroachment onto cropland in Shandong Province. This proportion is much larger than that in other regions. A previous study found that the proportion of cropland occupied by built-up land in the total built-up land expansion was 46% at the global level, and was 58%, 64%, 24%, and 29% for China, Europe, USA, and Africa respectively from 1992 to 2016 [22]. The amount of cropland loss and built-up land gain increased in the latter period than the first period due to the development of socioeconomic. Although strict cropland protection policies such as the cropland balance policy were adopted in China, the options to supplement cropland are constrained. The reason is that in the Shandong Province and some major cereal producing regions of China, much of the suitable land is under intensive farming. The Chinese government tried to find the way to compensate for the loss of cropland and associated food production via land consolidation [45,46,47]. There are three types of consolidation, including cropland reclamation, cropland exploitation, and cropland consolidation. Among them, the cropland reclamation and exploitation can increase crop yield through increasing the area of available cropland; whereas cropland consolidation refers to improving the productivity of the existing cropland. Du et al. (2018) found that the increases of cereal production were mainly benefited from the cropland area growth. The effectiveness of some cropland consolidation projects was lacking, which was mainly caused by problems of construction, engineering, and management [46]. Therefore, the strict protection of cropland is required for maintaining stable cropland areas and realizing sustainable cereal production. In addition, more attention should be paid at the edges of the big cities, where the encroachment of cropland by built-up land is especially serious.

4.2. The Changes in the Landscape Pattern and in the Land Productivity

Since 2000, cropland had become smaller in patch size and more isolated between patches. This is in correspondence with the existing studies, that revealed that urbanization led to greater cropland fragmentation in China [48]. Similar results have also been reported in this study. Past studies have shown that cropland fragmentation has a negative effect on cereal production [49,50,51,52]. Increased fragmentation was a key factor in the abandonment and devaluation of cropland, caused by the increase of the labor cost share. In addition, an inverted U-shaped relationship was found between cropland scale and production cost in two counties in Chongqing [53]. Despite the widely documented evidence that spatial fragmentation decreased agricultural outputs, some other studies showed that the fragmentation did not decrease the production [54]. The confliction could be associated with the different socioeconomic and natural environmental background, and the different geomorphology among different study areas. In addition, the datasets and approaches they employed were also different. The effects of increasing fragmentation on cropland production in Shandong province need to be studied extensively in the next step.
The high quality cropland with potential productivity of more than 7500 kg/ha accounts for 51% of the total cropland area in Shandong Province, mainly distributed in plain areas. At the same time, the new emerging built-up land is also inclined to located on the area with gentle slopes. Therefore, newly built-up land and high productive cropland are often in direct competition for land. Prior research found that high quality cropland was occupied by built-up land expansion in many regions [55]. A similar situation has also been revealed in Shandong Province in this study, especially during the latter period. More low quality cropland was occupied during the early phase, and more high quality cropland was encroached in the latter period. The possible reason is that the less-suitable croplands take precedence over the high quality croplands when they are converted to built-up land. Under the context of rapid urbanization, the less-suitable cropland was encroached gradually and became insufficient. As a result, new built-up lands tend to occupy cropland with higher productivity in the latter period. van Vliet et al. (2017) quantified the displacement of crop production from urbanization at the global scale, and they also found that urban land is more than proportionally located in areas that are suitable for cropland [56]. Furthermore, the model simulation results showed that future urban expansion is mainly in areas that are available for cropland globally [56]. The results of this study correspond with the situation in some other regions of the world. For example, an inter-country comparison between the world’s major cereal producer found that almost all the countries with net cropland decrease have lost more primary croplands than marginal cropland [43]. In addition, some countries including USA, South Africa, and the Philippines experienced a net decrease of primary cropland, while the total cropland area increased. Therefore, in these countries the loss of primary cropland is compensated by the gain of marginal cropland [43].

4.3. Limitations and Future Perspectives

Together, this study provides a comprehensive analysis of the effects of urban expansion on cropland. However, multiple uncertainties still remain in the results. Firstly, the GlobeLand30 product only consists of land cover data in 2000, 2010, and 2020. Consequently, some detailed temporal information may be omitted. For example, as reported in a previous study performed in Tongling City in Anhui Province, the temporal trends of landscape features changed in the year 2005, echoed by the changed trend in machinery use intensity [57]. A change-point for the socioeconomic regime was also detected around 2007 in this area. In the future, we will attempt to generate land cover data with both high spatial resolution and high temporal resolution to acquire more detailed land cover dynamics information. Secondly, besides a resource issue, the cropland loss is also an economic issue. In this sense, the underlying socioeconomic rationale of cropland loss and related scientific and political implications would be analyzed in the next research step. A previous study performed in the United States showed that cropland expansion produced marginal yields at high expanse to wildlife habitat [58]. The tradeoff between food production and environmental conservation of the newly added cropland in Shandong Province would be analyzed in the future using the methods to deal with conflicts and tradeoffs [59,60]. The impacts of different city levels (polycentric metropolitan areas, city, and town) on cropland loss still need to be analyzed in the future. Despite the limitations mentioned above, this research is still worthwhile in view of its spatially explicit indication of the cropland loss and the productivity of the lost cropland over the past two decades.

5. Conclusions

This study analyzed built-up land expansion and its impact on cropland loss during 2000 and 2020 in Shandong Province. We begin by tracking the pixel-level spatiotemporal land cover changes at a 30 m resolution. We then assessed the changes of landscape patterns of cropland in the whole study area. Finally, we pair the land cover change pattern with the modeled potential agricultural yield to evaluate the influence of built-up land expansion on cereal production. The increased built-up land was transferred primarily from cropland during 2000 and 2020, and the built-up land encroachment of cropland appeared mostly in the edge-expanding pattern. The encroachment was more drastic during the period of 2010–2020 than it was in 2000–2010. Regarding the changing trends of cropland landscape features, the study area had generally decreasing cropland patch size, and this increased cropland patch isolation over time. Hence cropland in the study area experienced increased fragmentation over time. To achieve the twin goals of economic development and to preserve high quality cropland, it is imperative to guide future urbanization in a more sustainable way. This study could help to provide a reference for land managers to formulate policies towards sustainable development. For example, it can inform that croplands with high potential productivity require stricter protection policy. By contrast, marginal cropland that is recognized based on potential productivity can be transferred to the built-up expansion required by economic development. Moreover, intervention of reducing cropland fragmentation might be helpful to improve the efficiency of cereal production practices. For future studies, our results highlight the necessity of extracting high spatial and high temporal resolution land cover data. The direct occupation and indirect influence of urbanization on cropland should be analyzed in future research. Since GlobeLand30 is a global 30 m wall to wall land cover data product, it can also be used to identify the land cover changes in other countries based on the methods applied in this study.

Author Contributions

Conceptualization, M.W.; Methodology, X.S.; Software, Q.X.; Validation, Z.F.; Formal Analysis, M.W.; Resources, M.W.; Data Curation, Q.X.; Writing—Original Draft Preparation, M.W.; Writing—Review and Editing, X.S.; Supervision, Z.F.; Funding Acquisition, M.W. All authors have read and agreed to the published version of the manuscript.

Funding

This research was funded by the Humanities and Social Sciences Foundation of the Ministry of Education in China, grant number (16YJCZH098).

Institutional Review Board Statement

Not applicable.

Informed Consent Statement

Not applicable.

Data Availability Statement

The GlobeLand30 land cover type products are available from http://www.globallandcover.com/home_en.html. The potential yield data sets simulated by GAZE model are available from https://www.resdc.cn/DOI/doi.aspx?DOIid=43. All relevant data generated during the study are available from the corresponding author upon reasonable request.

Conflicts of Interest

The authors declare no conflict of interest.

References

  1. Chen, G.; Li, X.; Liu, X.; Chen, Y.; Liang, X.; Leng, J.; Xu, X.; Liao, W.; Qiu, Y.; Wu, Q.; et al. Global projections of future urban land expansion under shared socioeconomic pathways. Nat. Commun. 2020, 11. [Google Scholar] [CrossRef] [Green Version]
  2. Deng, X.; Huang, J.; Rozelle, S.; Zhang, J.; Li, Z. Impact of urbanization on cultivated land changes in China. Land Use Policy 2015, 45, 1–7. [Google Scholar] [CrossRef]
  3. Kong, X. China must protect high-quality arable land. Nature 2014, 506, 7. [Google Scholar] [CrossRef]
  4. Kuang, W. National urban land-use/cover change since the beginning of the 21st century and its policy implications in China. Land Use Policy 2020, 97. [Google Scholar] [CrossRef]
  5. Qiu, B.; Li, H.; Tang, Z.; Chen, C.; Berry, J. How cropland losses shaped by unbalanced urbanization process? Land Use Policy 2020, 96. [Google Scholar] [CrossRef]
  6. Imhoff, M.L.; Lawrence, W.T.; Elvidge, C.D.; Paul, T.; Levine, E.; Privalsky, M.V.; Brown, V. Using nighttime DMSP/OLS images of city lights to estimate the impact of urban land use on soil resources in the United States. Remote Sens. Environ. 1997, 59, 105–117. [Google Scholar] [CrossRef]
  7. Salvati, L. Monitoring high-quality soil consumption driven by urban pressure in a growing city (Rome, Italy). Cities 2013, 31, 349–356. [Google Scholar] [CrossRef]
  8. Afifi, A.A.; Elsemary, M.A.; Wahab, M.A. Urban sprawl of greater Cairo and its impact on the agricultural land using remote sensing and digital soil map. J. Appl. Sci. Res. 2013, 9, 5159–5167. [Google Scholar]
  9. Deng, X.; Gibson, J.; Wang, P. Management of trade-offs between cultivated land conversions and land productivity in Shandong Province. J. Clean. Prod. 2017, 142, 767–774. [Google Scholar] [CrossRef]
  10. Hu, Q.; Xiang, M.; Chen, D.; Zhou, J.; Wu, W.; Song, Q. Global cropland intensification surpassed expansion between 2000 and 2010: A spatio-temporal analysis based on GlobeLand30. Sci. Total Environ. 2020, 746. [Google Scholar] [CrossRef] [PubMed]
  11. Ye, S.; Song, C.; Shen, S.; Gao, P.; Cheng, C.; Cheng, F.; Wan, C.; Zhu, D. Spatial pattern of arable land-use intensity in China. Land Use Policy 2020, 99, 104845. [Google Scholar] [CrossRef]
  12. Sun, X.; Li, G.; Wang, J.; Wang, M. Quantifying the Land Use and Land Cover Changes in the Yellow River Basin while Accounting for Data Errors Based on GlobeLand30 Maps. Land 2021, 10, 31. [Google Scholar] [CrossRef]
  13. Pontius, R.G., Jr. Component intensities to relate difference by category with difference overall. Int. J. Appl. Earth Obs. Geoinf. 2019, 77, 94–99. [Google Scholar] [CrossRef]
  14. van Vliet, J. Direct and indirect loss of natural area from urban expansion. Nat. Sustain. 2019, 2, 755–763. [Google Scholar] [CrossRef]
  15. Ke, X.; van Vliet, J.; Zhou, T.; Verburg, P.H.; Zheng, W.; Liu, X. Direct and indirect loss of natural habitat due to built-up area expansion: A model-based analysis for the city of Wuhan, China. Land Use Policy 2018, 74, 231–239. [Google Scholar] [CrossRef]
  16. Yang, B.; Ke, X.; van Vliet, J.; Yu, Q.; Zhou, T.; Verburg, P. Impact of cropland displacement on the potential crop production in China: A multi-scale analysis. Reg. Environ. Chang. 2020, 20. [Google Scholar] [CrossRef]
  17. Zhu, X.; Xiao, G.; Zhang, D.; Guo, L. Mapping abandoned farmland in China using time series MODIS NDVI. Sci. Total Environ. 2021, 755, 142651. [Google Scholar] [CrossRef] [PubMed]
  18. Zhou, B.-B.; Aggarwal, R.; Wu, J.; Lv, L. Urbanization-associated farmland loss: A macro-micro comparative study in China. Land Use Policy 2021, 101, 105228. [Google Scholar] [CrossRef]
  19. Gomes, E.; Inácio, M.; Bogdzevič, K.; Kalinauskas, M.; Karnauskaitė, D.; Pereira, P. Future scenarios impact on land use change and habitat quality in Lithuania. Environ. Res. 2021, 197, 111101. [Google Scholar] [CrossRef] [PubMed]
  20. Dong, N.; You, L.; Cai, W.; Li, G.; Lin, H. Land use projections in China under global socioeconomic and emission scenarios: Utilizing a scenario-based land-use change assessment framework. Glob. Environ. Chang. 2018, 50, 164–177. [Google Scholar] [CrossRef]
  21. Ke, X.; Zheng, W.; Zhou, T.; Liu, X. A CA-based land system change model: LANDSCAPE. Int. J. Geogr. Inf. Sci. 2017, 31, 1798–1817. [Google Scholar] [CrossRef]
  22. Wang, M.; Sun, X.; Fan, Z.; Yue, T. Investigation of Future Land Use Change and Implications for Cropland Quality: The Case of China. Sustainability 2019, 11, 3327. [Google Scholar] [CrossRef] [Green Version]
  23. Martellozzo, F.; Amato, F.; Murgante, B.; Clarke, K.C. Modelling the impact of urban growth on agriculture and natural land in Italy to 2030. Appl. Geogr. 2018, 91, 156–167. [Google Scholar] [CrossRef] [Green Version]
  24. d’Amour, C.B.; Reitsma, F.; Baiocchi, G.; Barthel, S.; Güneralp, B.; Erb, K.-H.; Haberl, H.; Creutzig, F.; Seto, K.C. Future urban land expansion and implications for global croplands. Proc. Natl. Acad. Sci. USA 2017, 114, 8939. [Google Scholar] [CrossRef] [PubMed] [Green Version]
  25. Huang, Q.; Liu, Z.; He, C.; Gou, S.; Bai, Y.; Wang, Y.; Shen, M. The occupation of cropland by global urban expansion from 1992 to 2016 and its implications. Environ. Res. Lett. 2020, 15, 084037. [Google Scholar] [CrossRef] [Green Version]
  26. He, C.; Liu, Z.; Xu, M.; Ma, Q.; Dou, Y. Urban expansion brought stress to food security in China: Evidence from decreased cropland net primary productivity. Sci. Total Environ. 2017, 576, 660–670. [Google Scholar] [CrossRef] [PubMed]
  27. Song, W.; Liu, M. Farmland Conversion Decreases Regional and National Land Quality in China. Land Degrad. Dev. 2017, 28, 459–471. [Google Scholar] [CrossRef]
  28. Tu, Y.; Chen, B.; Yu, L.; Xin, Q.; Gong, P.; Xu, B. How does urban expansion interact with cropland loss? A comparison of 14 Chinese cities from 1980 to 2015. Landsc. Ecol. 2020. [Google Scholar] [CrossRef]
  29. Fei, W.; Zhao, S. Urban land expansion in China’s six megacities from 1978 to 2015. Sci. Total Environ. 2019, 664, 60–71. [Google Scholar] [CrossRef]
  30. Liu, F.; Zhang, Z.; Zhao, X.; Wang, X.; Zuo, L.; Wen, Q.; Yi, L.; Xu, J.; Hu, S.; Liu, B. Chinese cropland losses due to urban expansion in the past four decades. Sci. Total Environ. 2019, 650, 847–857. [Google Scholar] [CrossRef]
  31. Long, H.; Liu, Y.; Wu, X.; Dong, G. Spatio-temporal dynamic patterns of farmland and rural settlements in Su–Xi–Chang region: Implications for building a new countryside in coastal China. Land Use Policy 2009, 26, 322–333. [Google Scholar] [CrossRef]
  32. Chao, Z.; Zhang, P.; Wang, X. Impacts of Urbanization on the Net Primary Productivity and Cultivated Land Change in Shandong Province, China. J. Indian Soc. Remote Sens. 2018, 46, 809–819. [Google Scholar] [CrossRef]
  33. Sun, X.; Yu, C.; Wang, J.; Wang, M. The Intensity Analysis of Production Living Ecological Land in Shandong Province, China. Sustainability 2020, 12, 8326. [Google Scholar] [CrossRef]
  34. Liu, X.; Pei, F.; Wen, Y.; Li, X.; Wang, S.; Wu, C.; Cai, Y.; Wu, J.; Chen, J.; Feng, K.; et al. Global urban expansion offsets climate-driven increases in terrestrial net primary productivity. Nat. Commun. 2019, 10, 5558. [Google Scholar] [CrossRef] [Green Version]
  35. Chen, J.; Cao, X.; Peng, S.; Ren, H. Analysis and Applications of GlobeLand30: A Review. ISPRS Int. J. Geo-Inf. 2017, 6, 230. [Google Scholar] [CrossRef] [Green Version]
  36. Yang, Y.; Xiao, P.; Feng, X.; Li, H. Accuracy assessment of seven global land cover datasets over China. ISPRS J. Photogramm. Remote Sens. 2017, 125, 156–173. [Google Scholar] [CrossRef]
  37. Chen, J.; Chen, J.; Liao, A.; Cao, X.; Chen, L.; Chen, X.; He, C.; Han, G.; Peng, S.; Lu, M.; et al. Global land cover mapping at 30m resolution: A POK-based operational approach. ISPRS J. Photogramm. Remote Sens. 2015, 103, 7–27. [Google Scholar] [CrossRef] [Green Version]
  38. Lu, X.; Shi, Y.; Chen, C.; Yu, M. Monitoring cropland transition and its impact on ecosystem services value in developed regions of China: A case study of Jiangsu Province. Land Use Policy 2017, 69, 25–40. [Google Scholar] [CrossRef]
  39. Riitters, K. Pattern metrics for a transdisciplinary landscape ecology. Landsc. Ecol. 2019, 34, 2057–2063. [Google Scholar] [CrossRef] [Green Version]
  40. He, H.S.; DeZonia, B.E.; Mladenoff, D.J. An aggregation index (AI) to quantify spatial patterns of landscapes. Landsc. Ecol. 2000, 15, 591–601. [Google Scholar] [CrossRef]
  41. Hesselbarth, M.H.K.; Sciaini, M.; With, K.A.; Wiegand, K.; Nowosad, J. Landscapemetrics: An open-source R tool to calculate landscape metrics. Ecography 2019, 42, 1648–1657. [Google Scholar] [CrossRef] [Green Version]
  42. Liu, Y.; Feng, Y.; Pontius, R.G. Spatially-Explicit Simulation of Urban Growth through Self-Adaptive Genetic Algorithm and Cellular Automata Modelling. Land 2014, 3, 719–738. [Google Scholar] [CrossRef] [Green Version]
  43. Yu, Q.; Xiang, M.; Wu, W.; Tang, H. Changes in global cropland area and cereal production: An inter-country comparison. Agric. Ecosyst. Environ. 2019, 269, 140–147. [Google Scholar] [CrossRef]
  44. Liu, L.; Xu, X.; Chen, X. Assessing the impact of urban expansion on potential crop yield in China during 1990–2010. Food Secur. 2015, 7, 33–43. [Google Scholar] [CrossRef] [Green Version]
  45. Zhou, J.; Cao, X. What is the policy improvement of China’s land consolidation? Evidence from completed land consolidation projects in Shaanxi Province. Land Use Policy 2020, 99. [Google Scholar] [CrossRef]
  46. Du, X.; Zhang, X.; Jin, X. Assessing the effectiveness of land consolidation for improving agricultural productivity in China. Land Use Policy 2018, 70, 360–367. [Google Scholar] [CrossRef]
  47. Xie, H.; Huang, Y.; Chen, Q.; Zhang, Y.; Wu, Q. Prospects for Agricultural Sustainable Intensification: A Review of Research. Land 2019, 8, 157. [Google Scholar] [CrossRef] [Green Version]
  48. Yu, Q.; Hu, Q.; van Vliet, J.; Verburg, P.H.; Wu, W. GlobeLand30 shows little cropland area loss but greater fragmentation in China. Int. J. Appl. Earth Obs. Geoinf. 2018, 66, 37–45. [Google Scholar] [CrossRef]
  49. Heider, K.; Lopez, J.M.R.; Avilés, J.M.G.; Balbo, A.L. Land fragmentation index for drip-irrigated field systems in the Mediterranean: A case study from Ricote (Murcia, SE Spain). Agric. Syst. 2018, 166, 48–56. [Google Scholar] [CrossRef]
  50. Looga, J.; Jürgenson, E.; Sikk, K.; Matveev, E.; Maasikamäe, S. Land fragmentation and other determinants of agricultural farm productivity: The case of Estonia. Land Use Policy 2018, 79, 285–292. [Google Scholar] [CrossRef]
  51. Veljanoska, S. Can Land Fragmentation Reduce the Exposure of Rural Households to Weather Variability? Ecol. Econ. 2018, 154, 42–51. [Google Scholar] [CrossRef] [Green Version]
  52. Yucer, A.A.; Kan, M.; Demirtas, M.; Kalanlar, S. The importance of creating new inheritance policies and laws that reduce agricultural land fragmentation and its negative impacts in Turkey. Land Use Policy 2016, 56, 1–7. [Google Scholar] [CrossRef]
  53. Wang, Y.; Li, X.; Lu, D.; Yan, J. Evaluating the impact of land fragmentation on the cost of agricultural operation in the southwest mountainous areas of China. Land Use Policy 2020, 99. [Google Scholar] [CrossRef]
  54. Ali, D.A.; Deininger, K.; Ronchi, L. Costs and Benefits of Land Fragmentation: Evidence from Rwanda. World Bank Econ. Rev. 2018, 33, 750–771. [Google Scholar] [CrossRef]
  55. Song, W.; Pijanowski, B.C.; Tayyebi, A. Urban expansion and its consumption of high-quality farmland in Beijing, China. Ecol. Indic. 2015, 54, 60–70. [Google Scholar] [CrossRef]
  56. van Vliet, J.; Eitelberg, D.A.; Verburg, P.H. A global analysis of land take in cropland areas and production displacement from urbanization. Glob. Environ. Chang.-Hum. Policy Dimens. 2017, 43, 107–115. [Google Scholar] [CrossRef]
  57. Zhou, B.-B.; Lv, L. Understanding the dynamics of farmland loss in a rapidly urbanizing region: A problem-driven, diagnostic approach to landscape sustainability. Landsc. Ecol. 2020, 35, 2471–2486. [Google Scholar] [CrossRef]
  58. Lark, T.J.; Spawn, S.A.; Bougie, M.; Gibbs, H.K. Cropland expansion in the United States produces marginal yields at high costs to wildlife. Nat. Commun. 2020, 11, 4295. [Google Scholar] [CrossRef] [PubMed]
  59. Chikumbo, O.; Goodman, E.; Deb, K. Triple Bottomline Many-Objective-Based Decision Making for a Land Use Management Problem. J. Multi-Criteria Decis. Anal. 2015, 22, 133–159. [Google Scholar] [CrossRef]
  60. Schwaab, J.; Deb, K.; Goodman, E.; Kool, S.; Lautenbach, S.; Ryffel, A.; van Strien, M.J.; Grêt-Regamey, A. Using multi-objective optimization to secure fertile soils across municipalities. Appl. Geogr. 2018, 97, 75–84. [Google Scholar] [CrossRef]
Figure 1. The location (a) and the elevation (b) of Shandong province, and the land use map in Shandong province in 2020 (c).
Land 10 00639 g001
Figure 2. The framework of this study. The orange rectangles on the upper are input data, the green rectangles on the bottom are outputs, and the grey ellipse in the middle are methods and middle output.
Land 10 00639 g002
Figure 3. The areas of cropland loss and built-up land gain during the two periods.
Land 10 00639 g003
Figure 4. The spatial distribution of cropland occupied by built-up land during the period of 2000–2010 and 2010–2020.
Land 10 00639 g004
Figure 5. Pattern change of cropland from 2000 to 2020 for the Shandong Province. (a) Mean patch size; (b) patch size CV (coefficient of variation); (c) patch density; (d) aggregation index.
Land 10 00639 g005
Figure 6. Potential yield of Shandong Province simulated by the GAEZ model.
Land 10 00639 g006
Figure 7. Potential yield of the cropland occupied by built-up land during 2000–2010 (a) and 2010–2020 (b).
Land 10 00639 g007
Publisher’s Note: MDPI stays neutral with regard to jurisdictional claims in published maps and institutional affiliations.

