
Multi-Function Tradeoffs of Land System in Urbanized Areas—A Case Study of Xi’an, China

Abstract
:1. Introduction
2. Materials and Methods
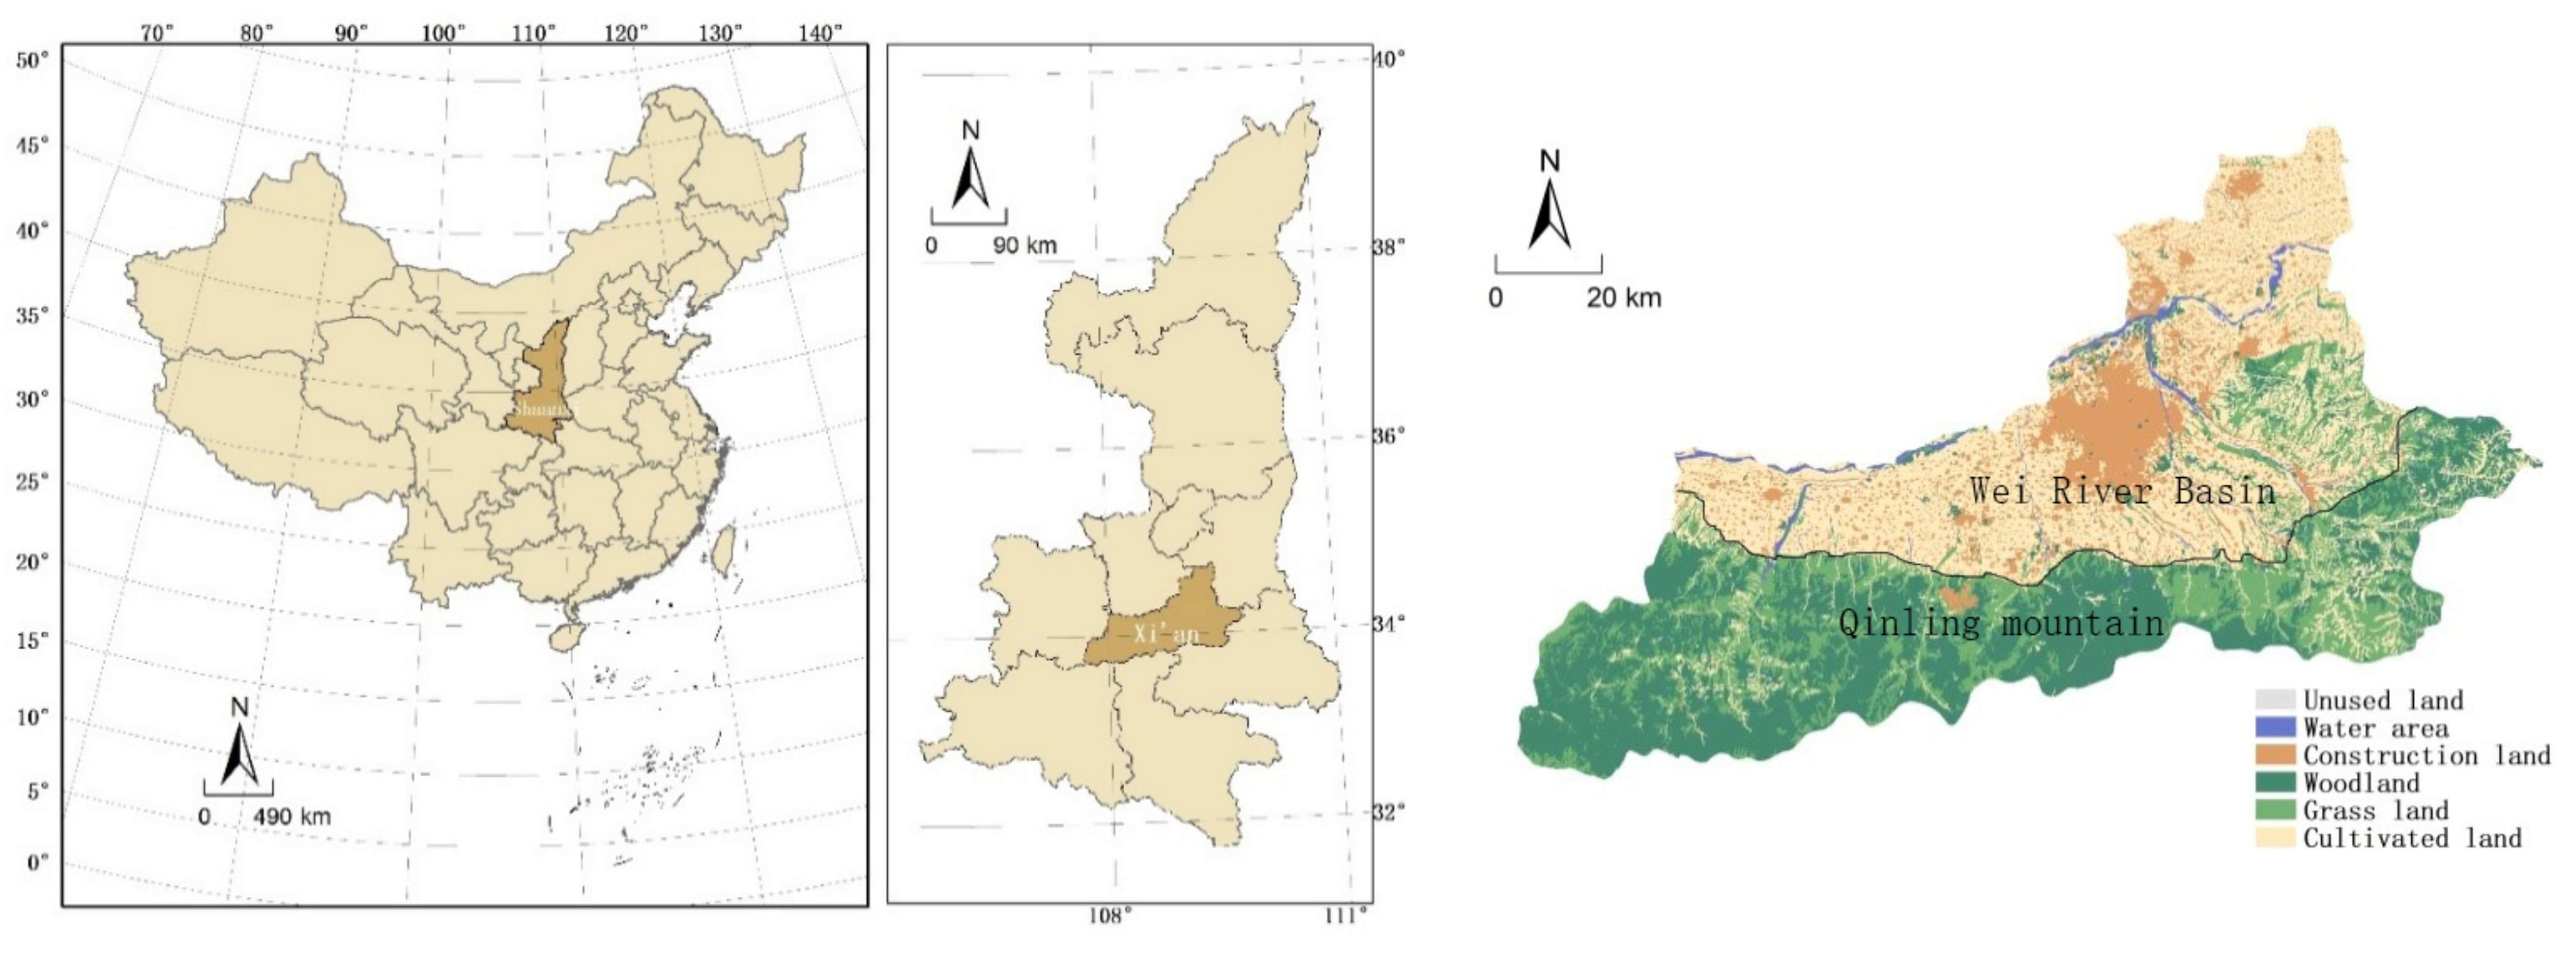
2.1. Study Sites
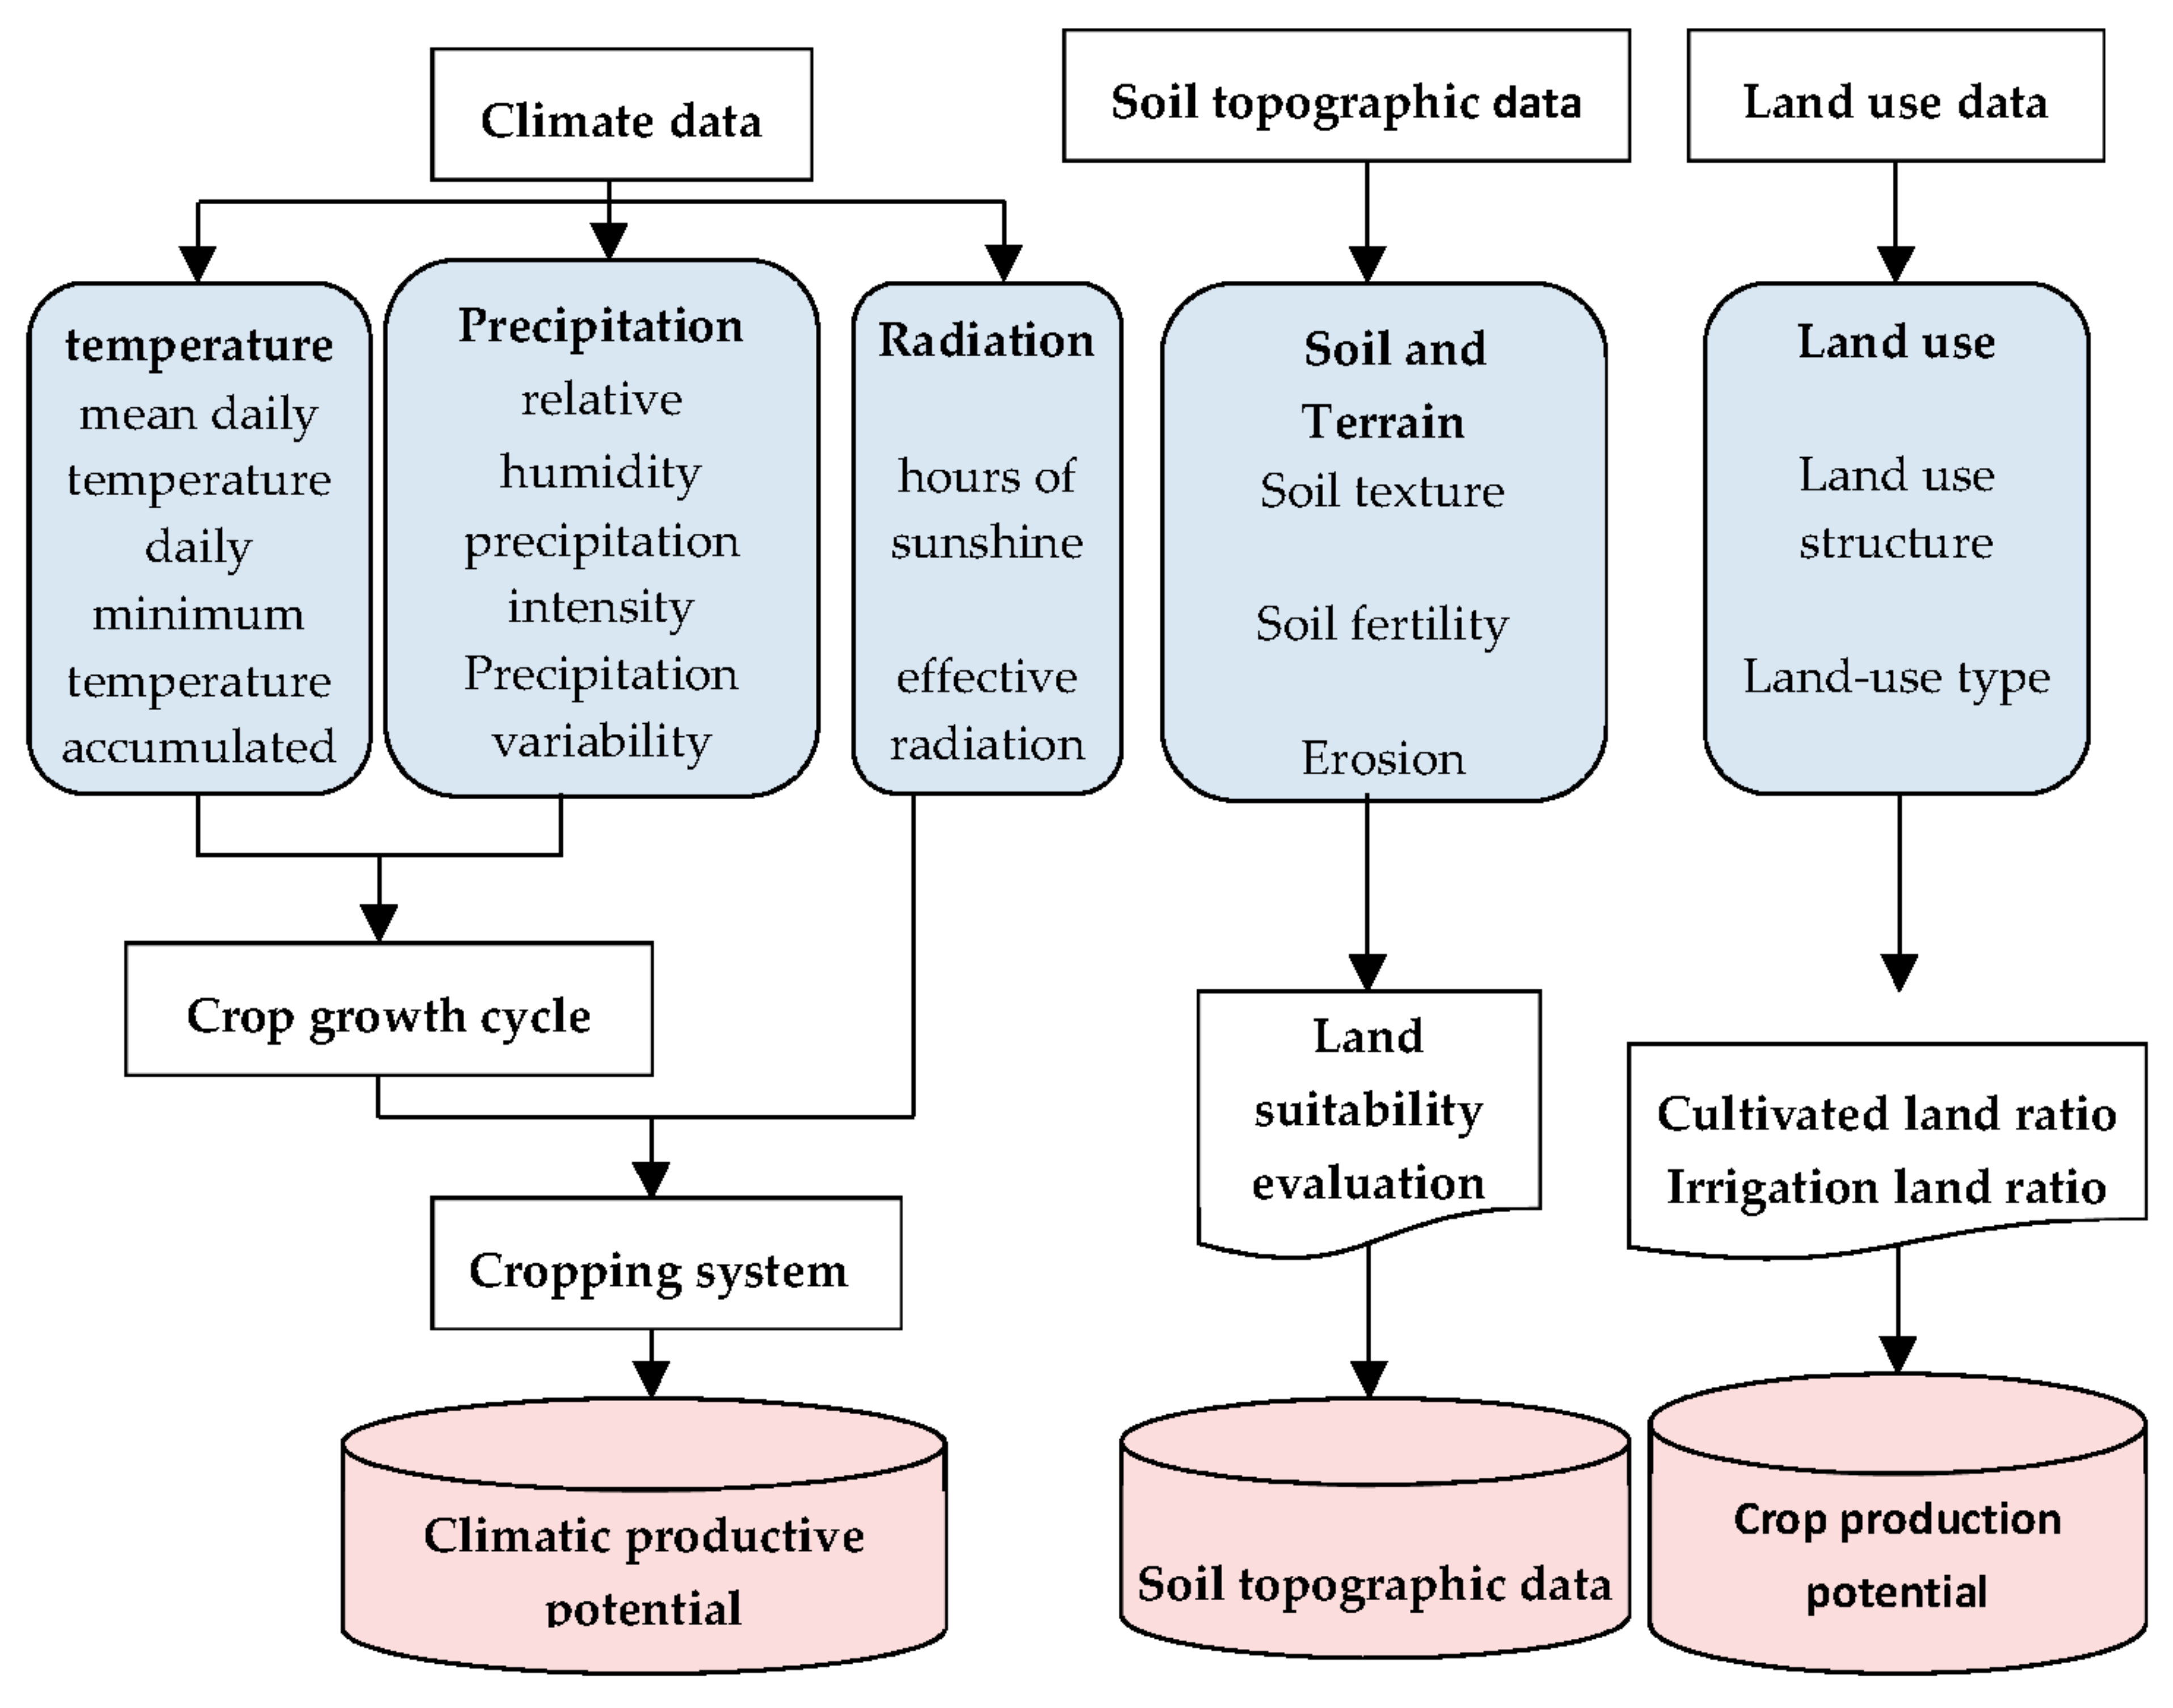
2.2. Data Sources
2.3. Evaluation of Land System Function Value
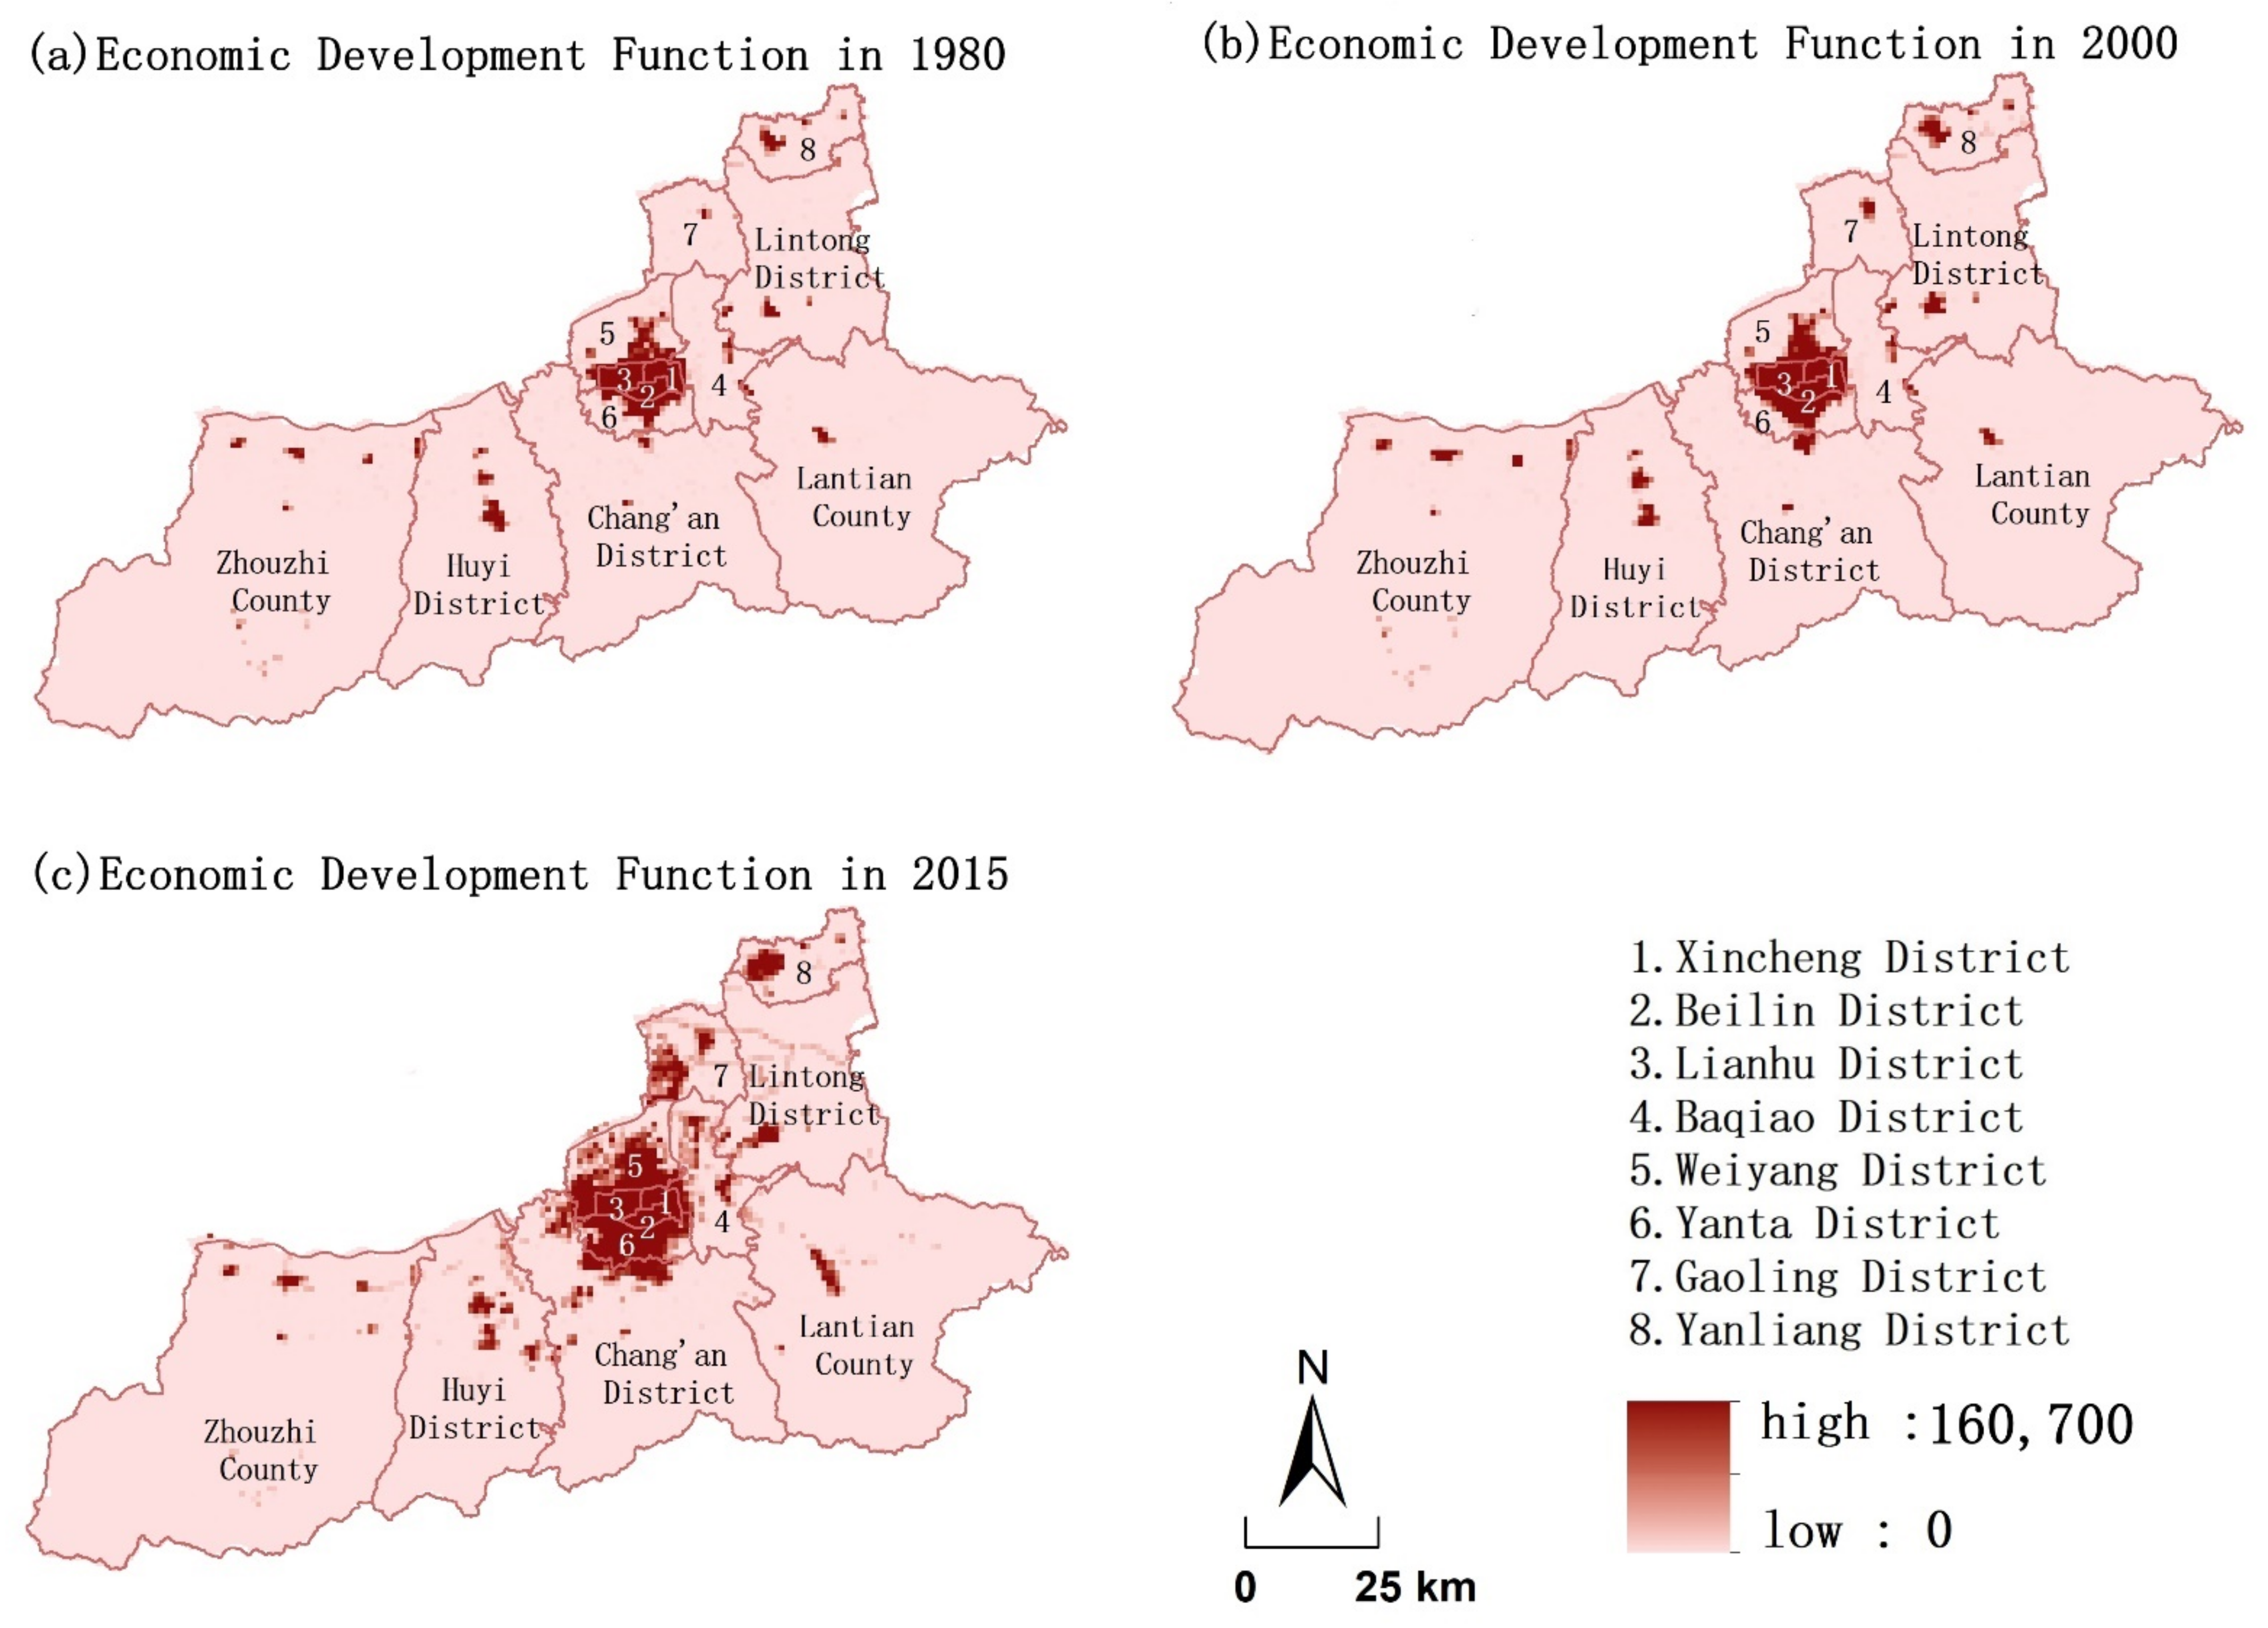
2.3.1. Functional Value Evaluation of Economic Development (ED)
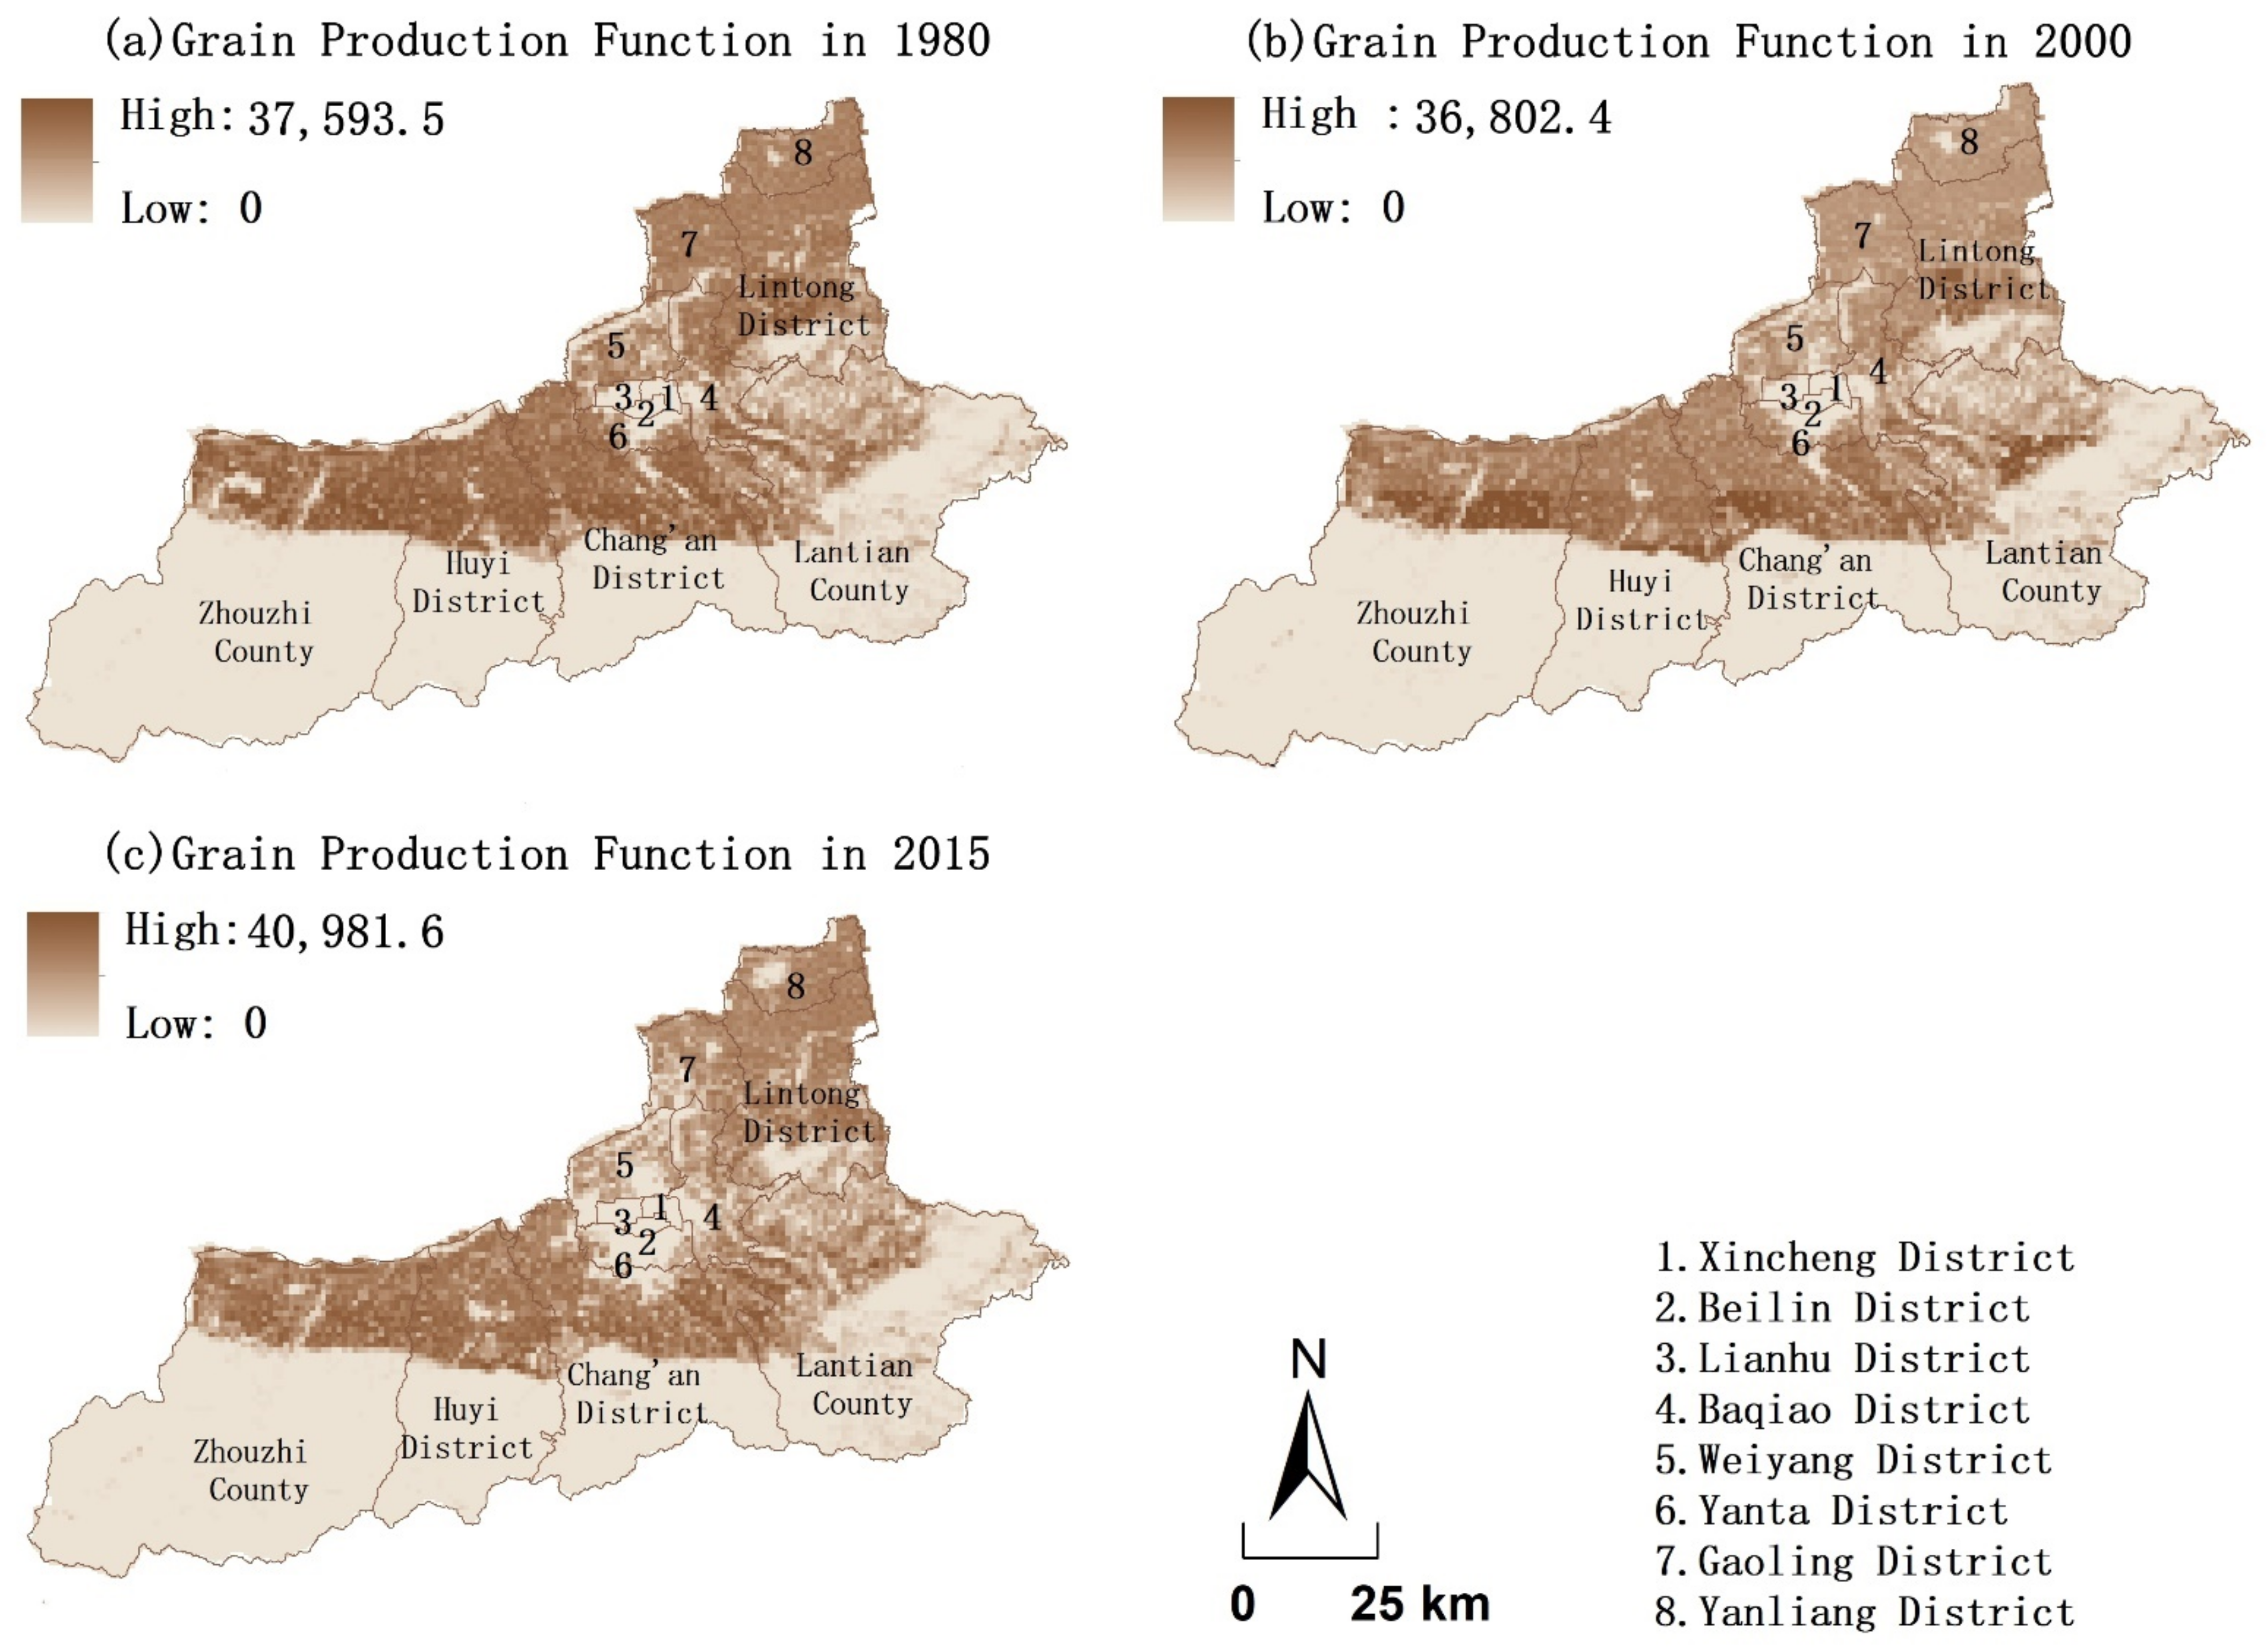
2.3.2. Functional Value Evaluation of Grain Production (GP)
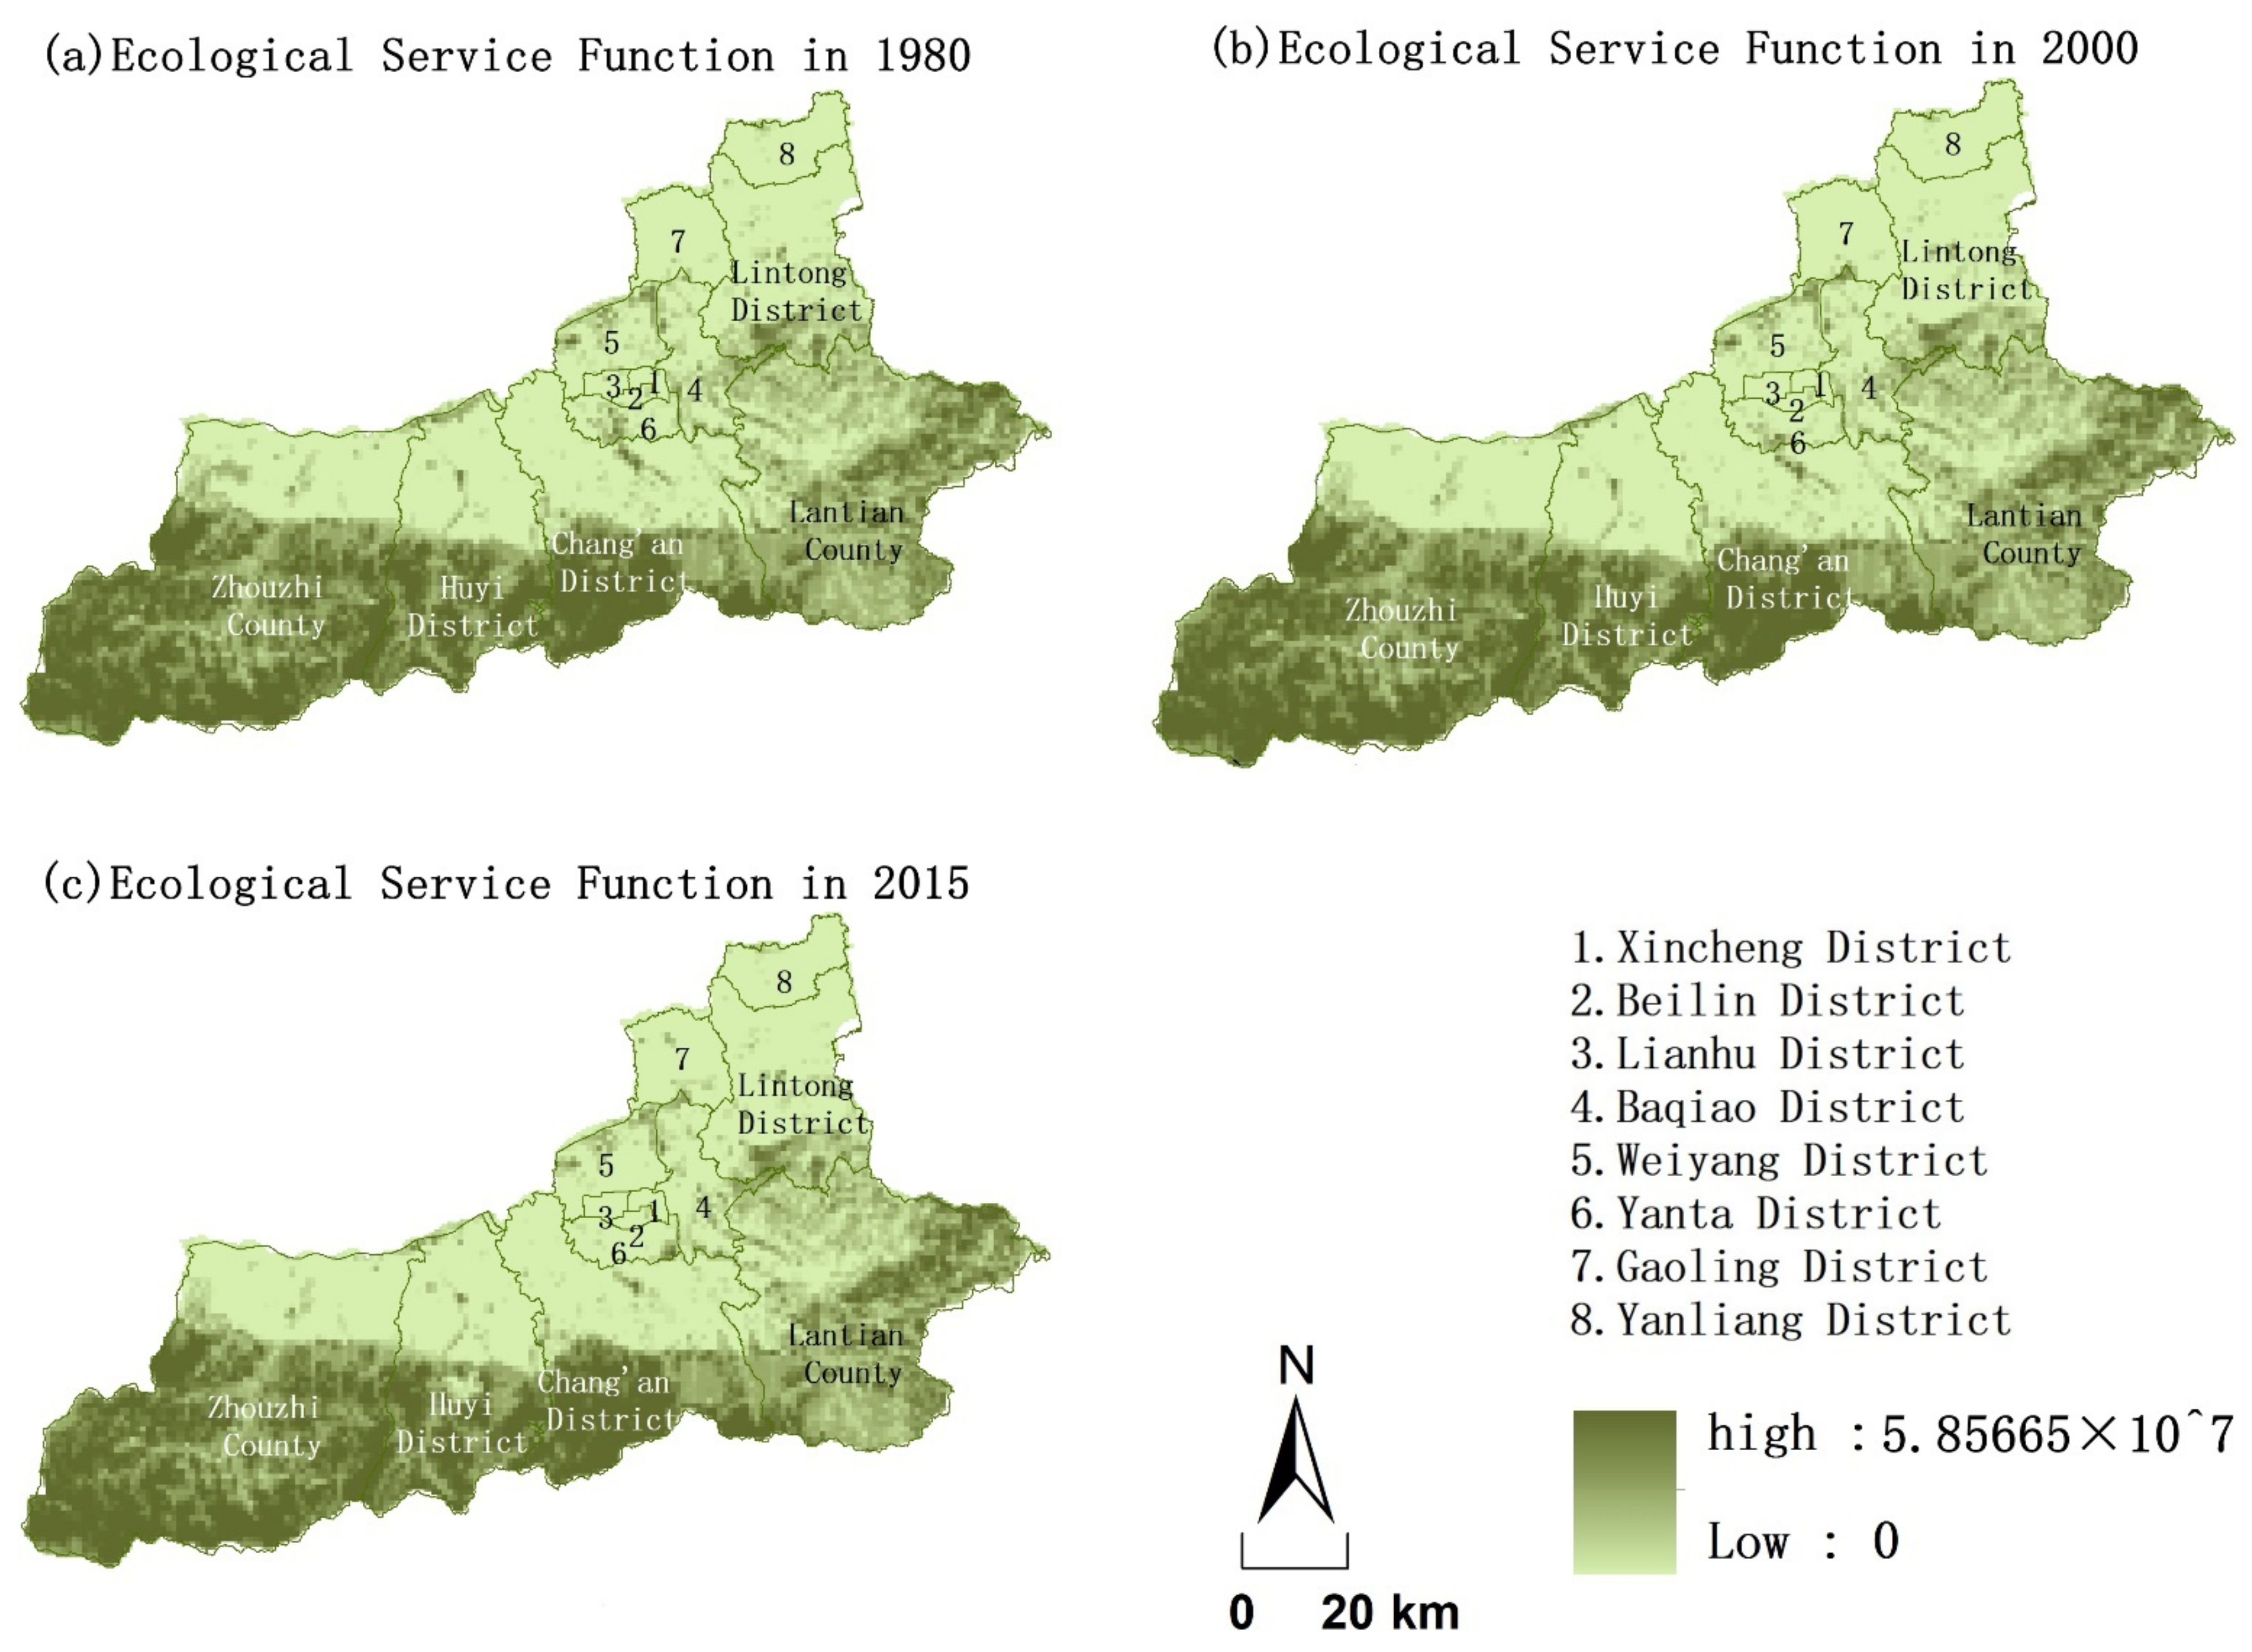
2.3.3. Functional Value Evaluation of Ecological Service (ES)
- High temperature regulation value (ES1)
- 2.
- Air purification value (ES2)
- 3.
- Carbon storage value (ES3)
- 4.
- Water conservation value (ES4)
- 5.
- Tourism and leisure value (ES5)
2.4. Correlation Analysis
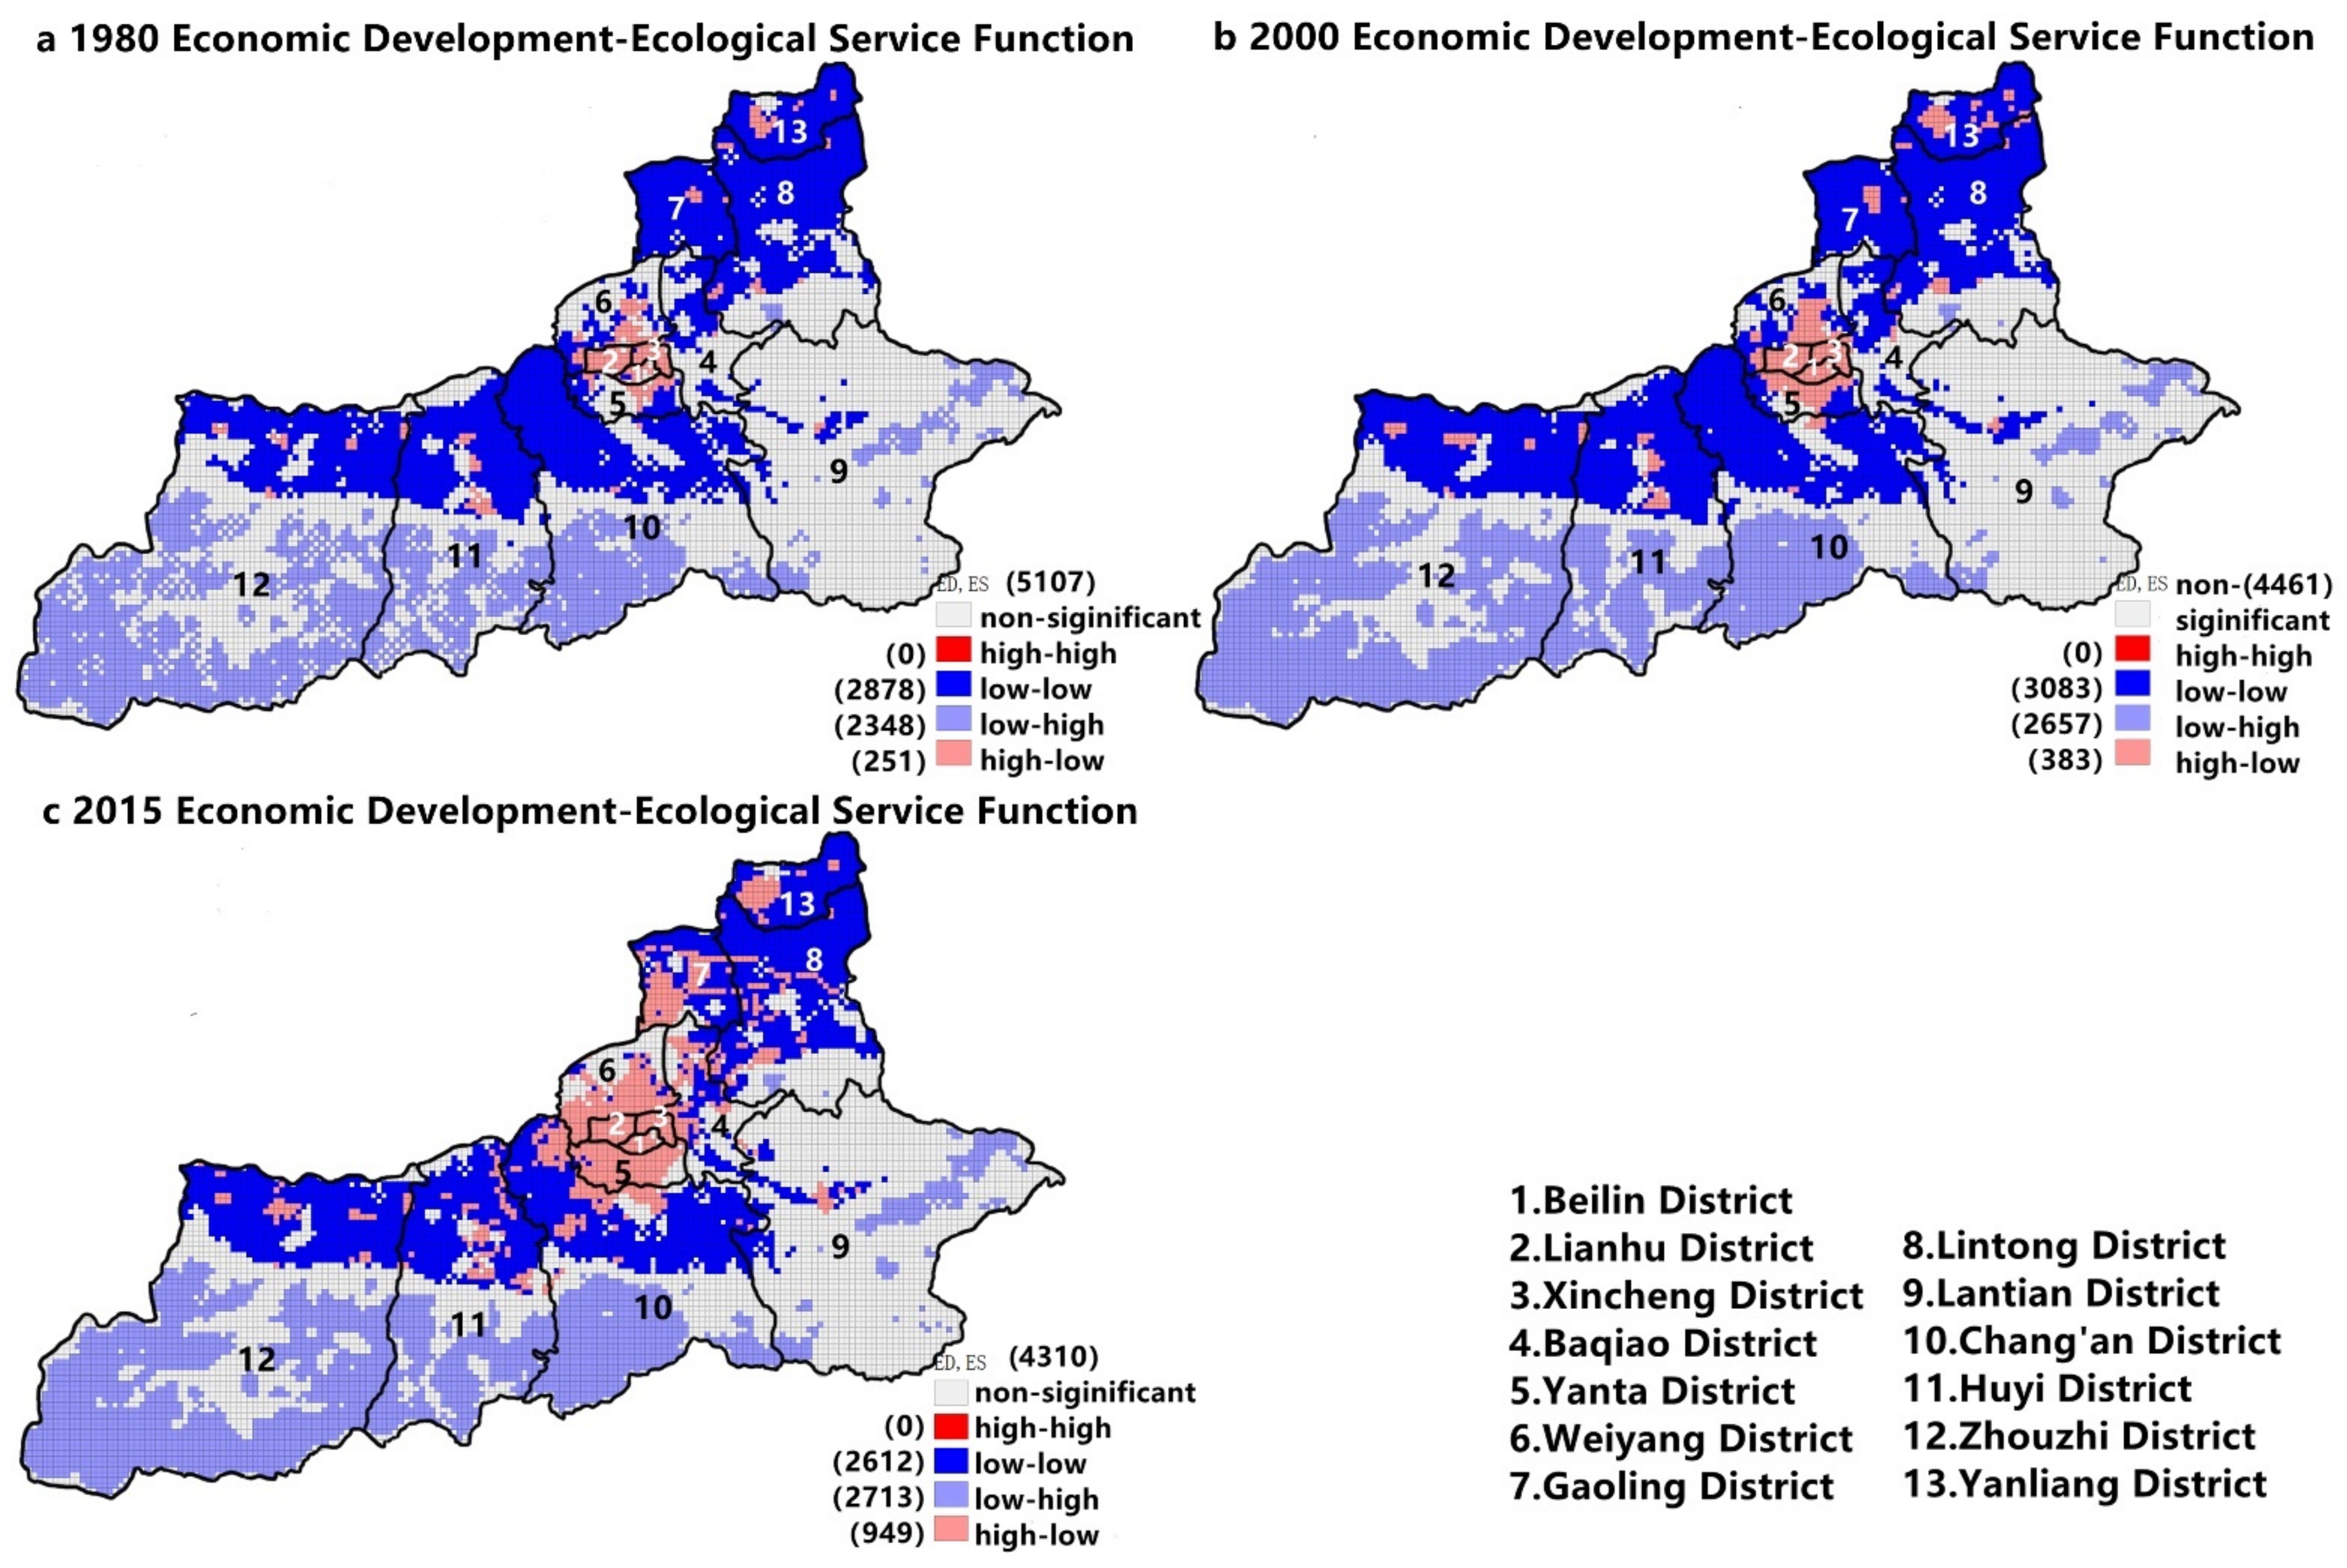
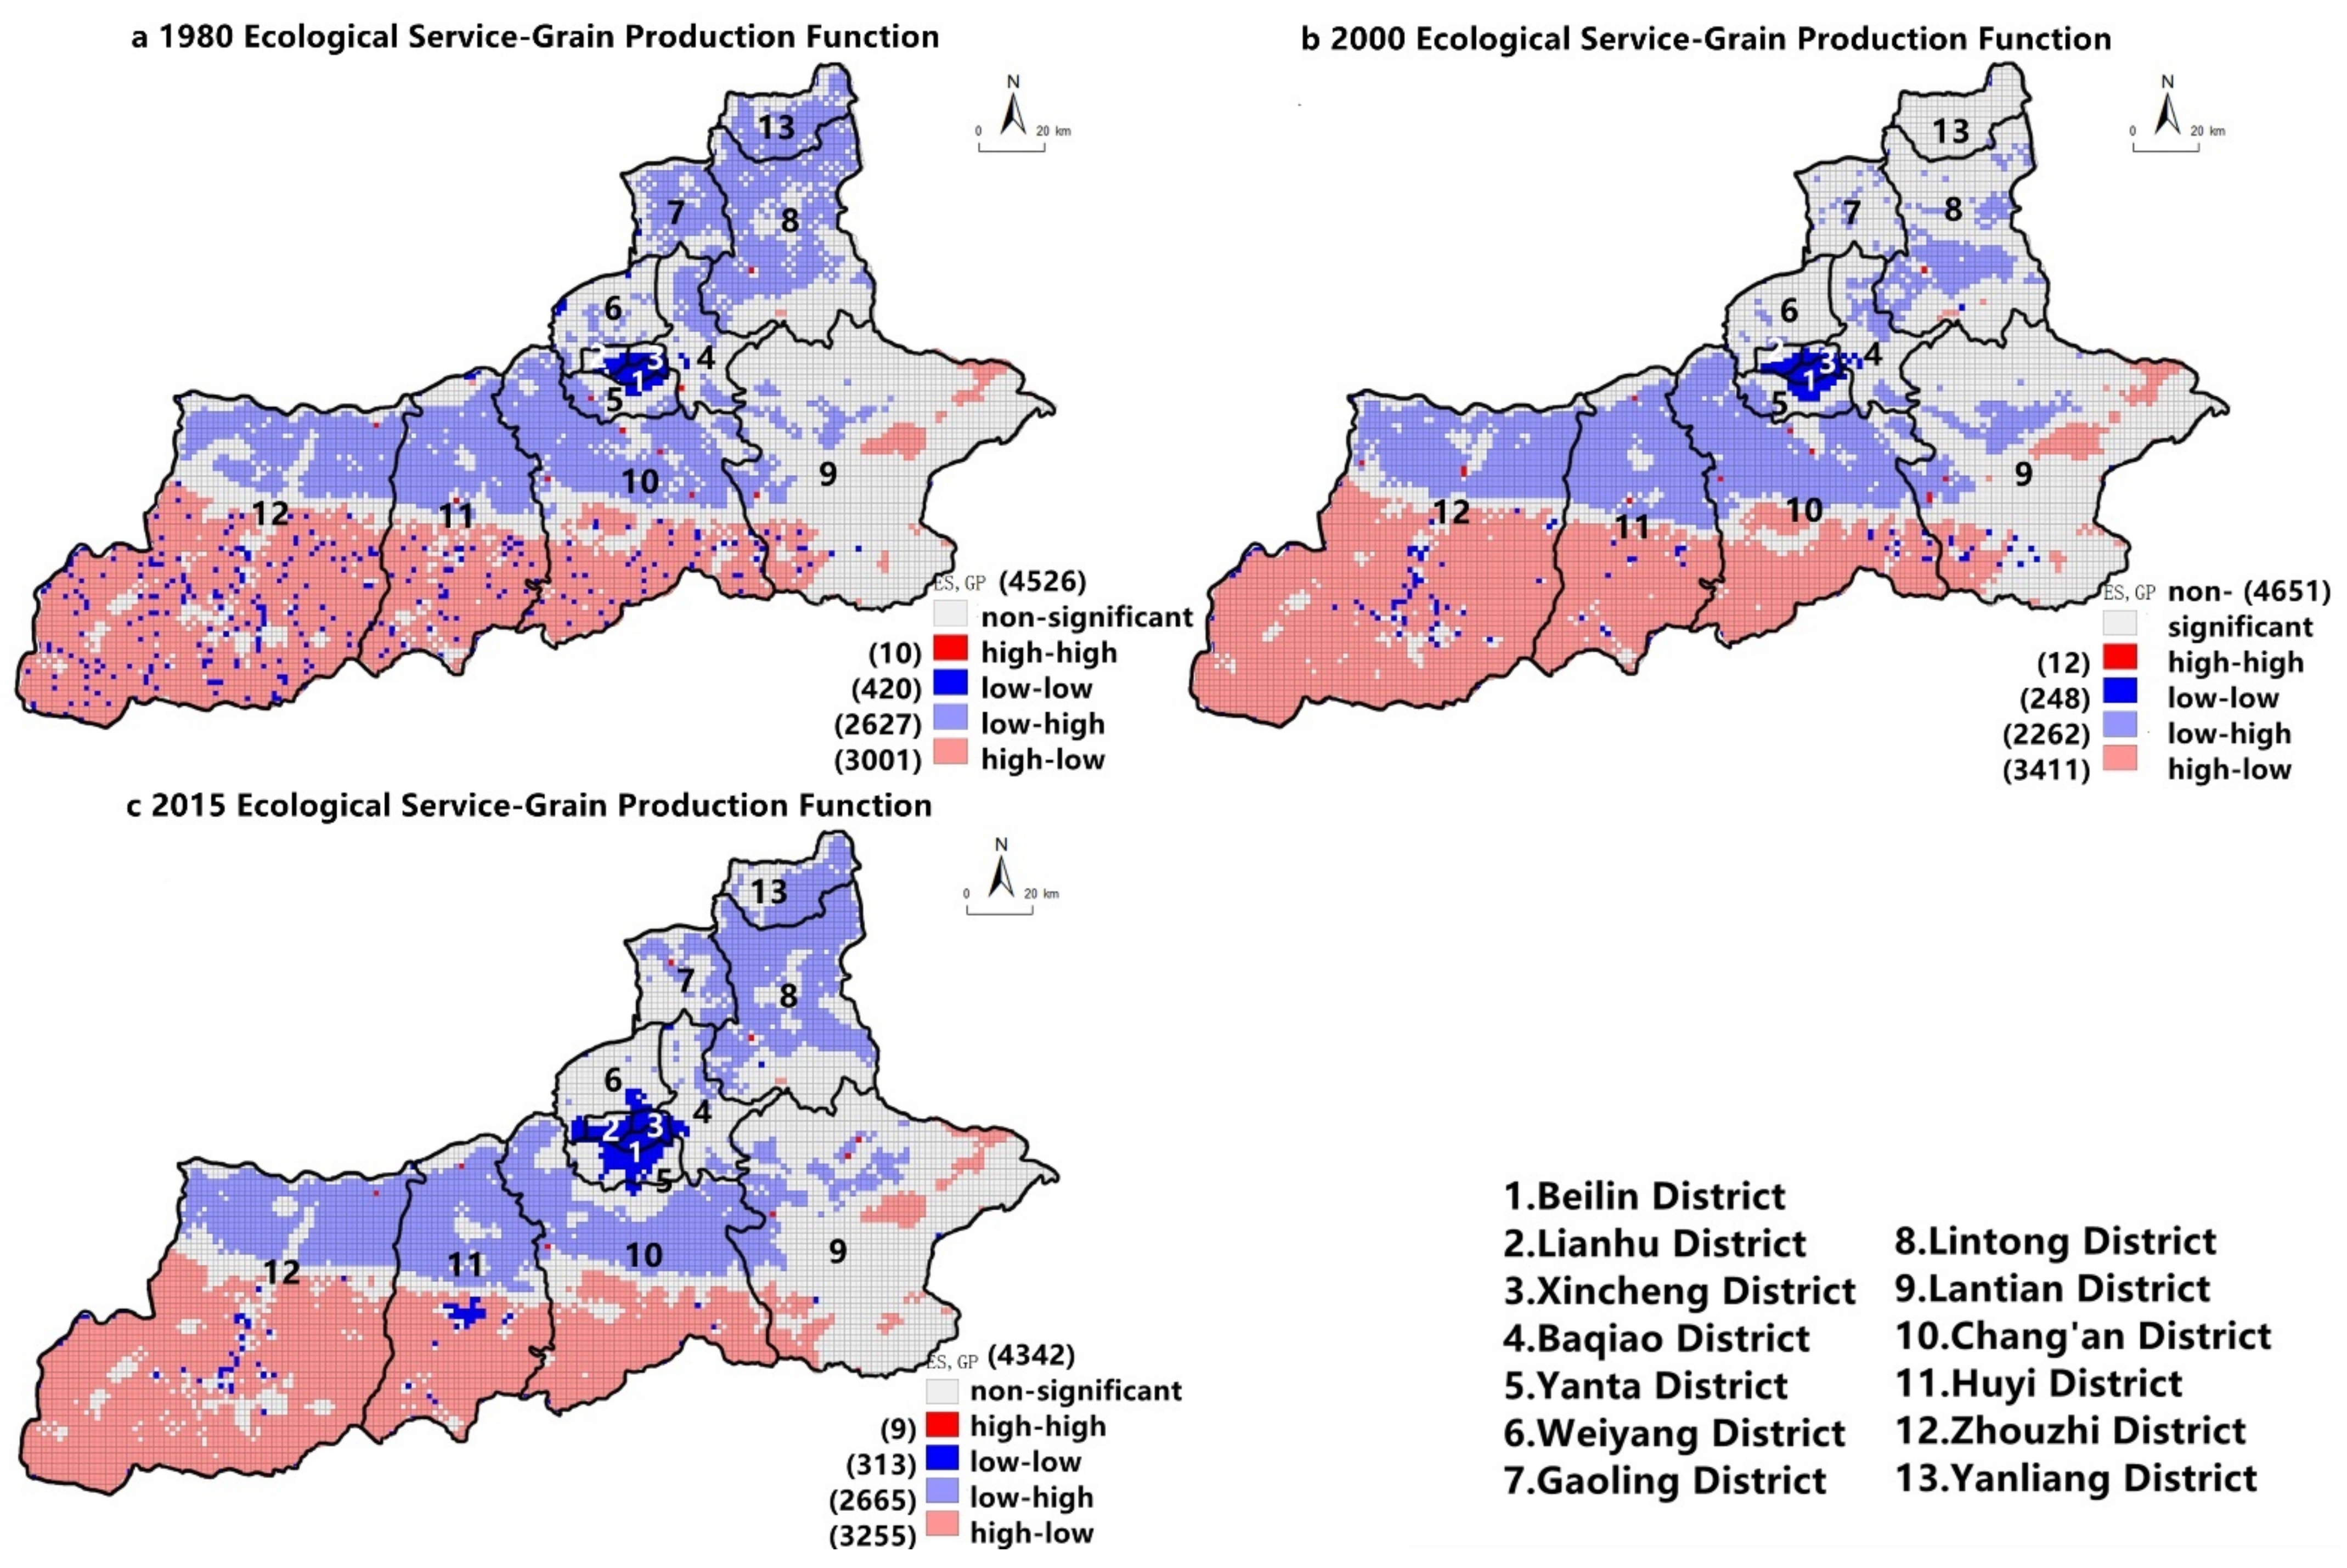
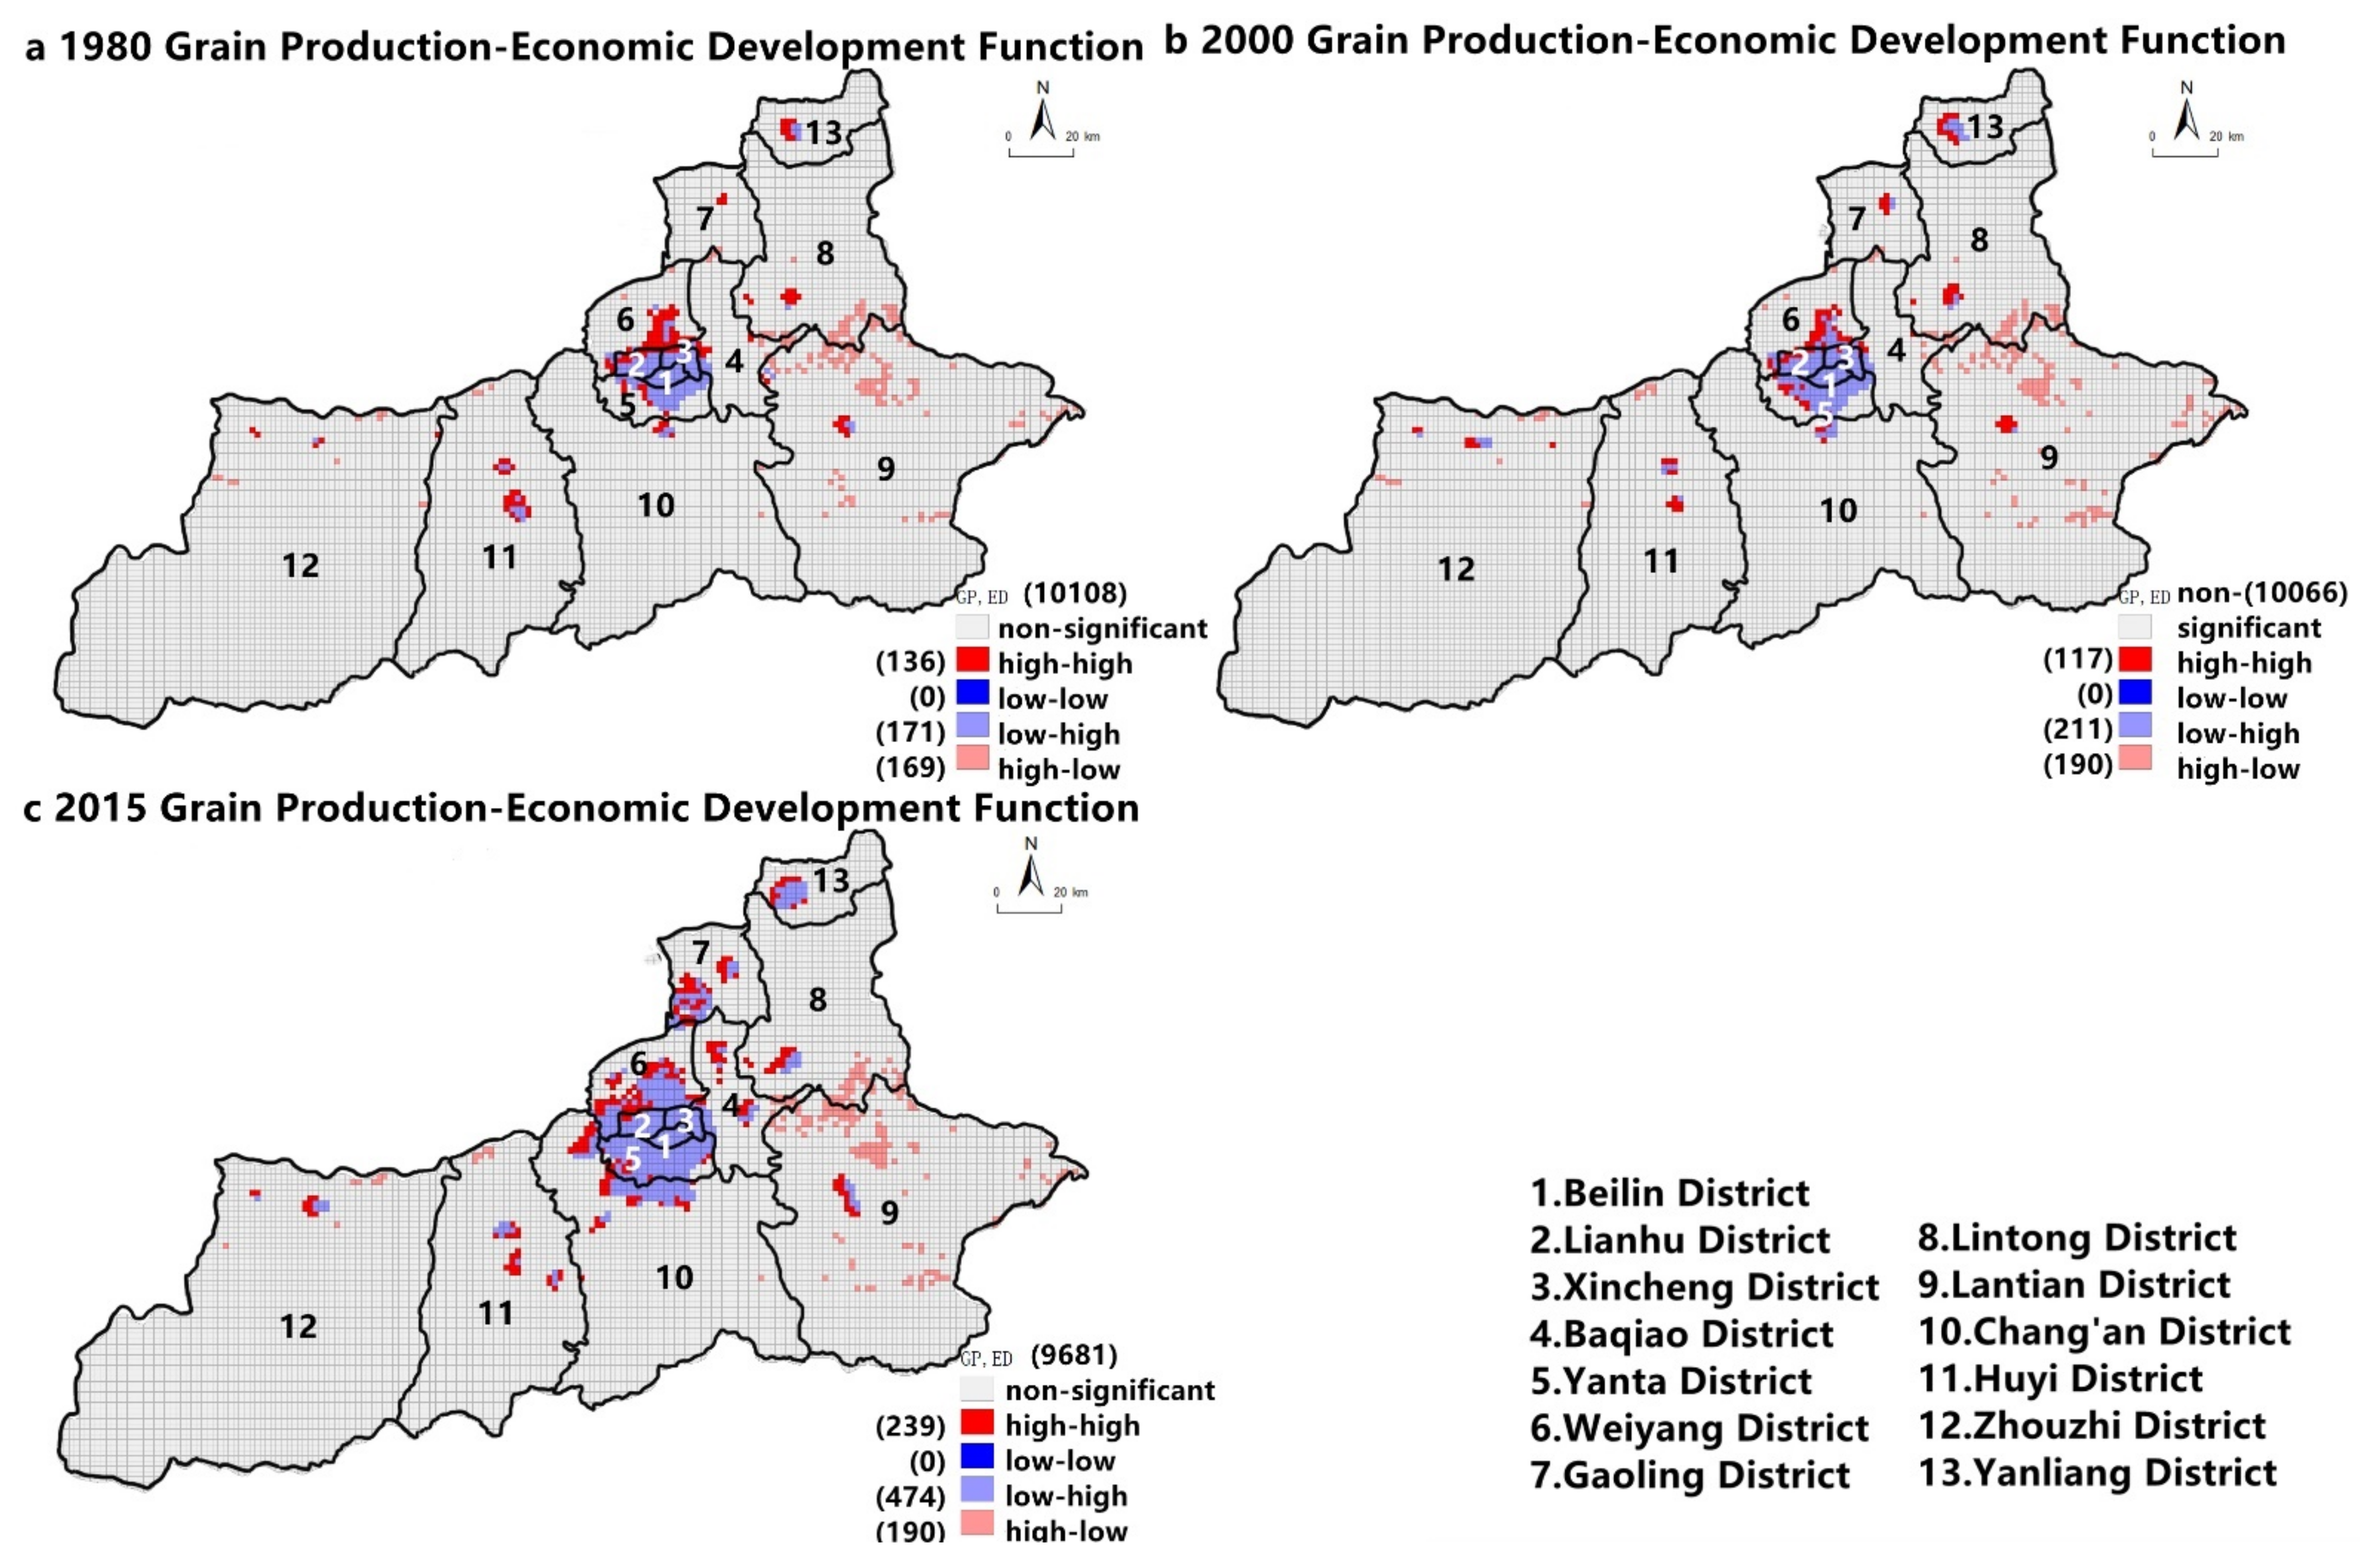
2.5. Bivariate Local Spatial Autocorrelation Analysis
3. Results
3.1. Spatio-Temporal Pattern of Land System Functions
3.2. The Trade-Off and Synergy between the Functions of the Land System
3.2.1. Correlation Coefficient Analysis
3.2.2. Space Trade-Offs and Synergy
4. Discussion
4.1. The Impact of Urban Expansion on the Temporal and Spatial Patterns of Functions
4.2. The Impact of Urban Expansion on Functional Trade-Offs
4.3. Implications, Applications, and Limitations
4.4. Explanation of the FOUR Research Gaps
5. Conclusions
Author Contributions
Funding
Data Availability Statement
Conflicts of Interest
References
- Verburg, P.H.; Overmas, K.P.; Milne, E. Combining top-down and bottom-up dynamics in land use modeling: Exploring the future of abandoned farmlands in Europe with the Dyna-CLUE mode. Landsc. Ecol. 2009, 24, 1667. [Google Scholar] [CrossRef]
- Zhang, L.; Zheng, X.; Meng, C.; Zhang, P. Spatio-Temporal Difference of Coupling Coordination Degree of Land Use Functions in Hunan Province. China Land Sci. 2019, 33, 85–94. [Google Scholar]
- Liu, J.; Kuang, W.; Zhang, Z.; Xu, X.; Qin, Y.; Ning, J.; Zhou, W.; Zhang, S.; Li, R.; Yan, C.; et al. Spatiotemporal characteristics, patterns, and causes of land-use changes in China since the late 1980s. J. Geogr. Sci. 2014, 24, 195–210. [Google Scholar] [CrossRef]
- Ning, J.; Liu, J.; Kuang, W.; Xu, X.; Zhang, S.; Yan, C.; Li, R.; Wu, S.; Hu, Y.; Du, G.; et al. Spatiotemporal patterns and characteristics of land-use change in China during 2010–2015. J. Geogr. Sci. 2018, 28, 547–562. [Google Scholar] [CrossRef] [Green Version]
- Huang, A.; Xu, Y.; Hao, J.; Liu, C.; Zheng, W. Progress Review on Land Use Functions Evaluation and Its Prospects. China Land Sci. 2017, 31, 88–97. [Google Scholar]
- Perez-Soba, M.; Overmas, K.P.; Petit, S.; Jones, L.; Bertrand, N.; Brique, V. Land use functions: A multifunctionality approach to assess the impact of land use changes on land use sustainability. In Sustainability Impact Assessment of Land Use Changes; Springer: Berlin/Heidelberg, Germany, 2008; pp. 374–403. [Google Scholar]
- Niu, H.; Zhang, A. Method of measuring ecological and social benefits of cultivated land and its application. Trans. Chin. Soc. Agric. Eng. 2010, 26, 316–323. [Google Scholar]
- Song, X.; Ou, Y. Route of Multifunctional Cultivated Land Management in China. J. Nat. Resour. 2012, 27, 540–551. [Google Scholar]
- Groot, R. Function-analysis and valuation as a tool to assess land use conflicts in planning for sustainable, multi-functional landscapes. Landsc. Urban Plan. 2006, 75, 175–186. [Google Scholar] [CrossRef]
- Reidsma, P.; König, H.J.; Feng, S.; Bezlepkina, I.; Nesheim, I.; Bonin, M.; Sghaier, M.; Purushothaman, S.; Sieber, S.; van Ittersum, M.K.; et al. Methods and Tools for Integrated Assessment of Land use Policies on Sustainable Development in Developing countries. Land Use Policy 2011, 28, 604–617. [Google Scholar] [CrossRef]
- Schößer, B.; Helming, K.; Wiggering, H. Assessing land use change impacts: A comparison of the SENSOR land use function approach with other frameworks. J. Land Use Sci. 2010, 5, 159–178. [Google Scholar] [CrossRef]
- Wang, C. Discuss the structure and function of land. Study Cent. Plains Geogr. 1984, 2, 12–21. [Google Scholar]
- Song, X.; Ou, Y. Connotation of Multifunctional Cultivated Land and Its Implications for Cultivated Land Protection. Prog. Geogr. 2012, 31, 859–868. [Google Scholar]
- Hong, Y.; Jiang, F.; Liu, S.; Cai, J. The Multifunction of Agricultural Land Use and Its Evolvement in Beijing. J. Arid Land Resour. Environ. 2007, 21, 18–23. [Google Scholar]
- Chen, R.; Cai, Y.; Yan, X.; Li, H. The Functions of Land System and Its Sustainability Assessment. China Land Sci. 2011, 25, 8–16. [Google Scholar]
- Zhen, L.; Cao, S.; Wei, Y.; Xie, G.; Li, F.; Yang, L. Land Use Functions: Conceptual Framework and Application for China. Resour. Sci. 2009, 31, 544–551. [Google Scholar]
- Liu, Y.; Liu, Y.; Chen, Y. Territorial Multi-functionality Evaluation and Decision-making Mechanism at County Scale in China. Prog. Geogr. 2011, 66, 1379–1389. [Google Scholar]
- Li, D.; Zhang, S.; Lv, X.; Dong, L. Changing Detection Method of Land Use Functions Based on Geographical Grid. J. Nat. Resour. 2011, 26, 1279–1305. [Google Scholar]
- Chen, J.; Shi, P. Discussion on functional land ue classification stystem. J. Beijing Norm. Univ. (Nat. Sci.) 2005, 41, 536–540. [Google Scholar]
- Wang, F.; Dong, Y. Spatial differences and influencing factors of land use function in Guangzhou. Resour. Sci. 2015, 37, 2179–2192. [Google Scholar]
- Wang, F.; Dong, Y. Dynamic Evaluation of Land Use Functions Based on Grey Relation Projection Method and Diagnosis of Its Obstacle Indicators: A Case Study of Guangzhou City. J. Nat. Resour. 2015, 30, 1698–1713. [Google Scholar]
- Chen, Y.; Xu, H.; Chen, Y.; Men, M. Analysis of land function classification and transformation in county based on remote sensing image. Trans. Chin. Soc. Agric. Eng. 2016, 32, 263–272. [Google Scholar]
- Tao, J.; Fu, M.; Sun, J.; Zheng, X.; Zhang, J.; Zhang, D. Multifunctional assessment and zoning of crop production system based on set pair analysis-A comparative study of 31 provincial regions in mainland China. Commun. Nonlinear Sci. Numer. Simul. 2014, 19, 1400–1416. [Google Scholar] [CrossRef]
- Xie, G.; Lin, Z.; Zhang, C.; Deng, X.; Koenig, H.J.; Tscherning, K.; Helming, K. Assessing the Multifunctionalities of Land Use in China. J. Resour. Ecol. 2010, 1, 311–318. [Google Scholar]
- Zhao, T.; Ouyang, Z.; Wang, X.; Miao, H.; Wei, Y. Ecosystem services and their valuation of terrestrial surface water system in China. J. Nat. Resour. 2003, 18, 443–452. [Google Scholar]
- Zhen, L.; Wei, Y.; Xie, G.; Helming, K.; Cao, S.; Yang, L.; Pan, Y.; Koenig, H. Regional analysis of dynamic land use functions in China. Acta Ecol. Sin. 2010, 30, 6749–6761. [Google Scholar]
- Yang, L. Evaluation of intensive land use in Xi’an. South China Agric. 2019, 13, 185–187. [Google Scholar]
- Li, F.; Shi, H.; Feng, X.; Liu, M.; Xu, W.; Li, M. Study of Land Use Dynamic Evolution and Driving Factors in Xi’an. Bull. Surv. Mapp. 2015, 12, 41–45, 56. [Google Scholar]
- Zhang, Y.; Liu, X.; Ren, J.; Xu, Y. Study on cultivated land use transformation based on multifunctional trade-offs and collaborative analysis of arable land—Taking Beijing as an example. Chin. J. Agric. Resour. Reg. Plan. 2020, 41, 25–33. [Google Scholar]
- Dong, P.; Zhao, H. Study on Trade-off and Synergy Relationship of Cultivated Land Multifunction: A Case of Qingpu District, Shanghai. Resour. Environ. Yangtze Basin 2019, 28, 368–375. [Google Scholar]
- Liang, X.; Jin, X.; Han, B.; Sun, R.; Zhang, X.; Zhou, Y. Landscape multifunctionality change in rapidly urbanized areas of the Yangtze River Delta: A case study of Suzhou City. Prog. Geogr. 2021, 40, 207–219. [Google Scholar] [CrossRef]
- Liu, X.; Li, J.; Liang, X.; Shi, H.; Ou, J. Simulating the Change of Terrestrial Carbon Storage in China Based on the FLUS-InVEST Model. Tropical Geogr. 2019, 39, 397–409. [Google Scholar]
- Duan, Y.; Lei, Y.; Wu, B.; Peng, D.; Tian, G. Evaluation and dynamic study on the ecological service value for urban green space system in Zhengzhou. Ecol. Sci. 2016, 35, 81–88. [Google Scholar]
- Xie, G.; Zhen, L.; Lu, C.; Xiao, Y.; Chen, C. Expert Knowledge Based Valuation Method of Ecosystem Services in China. J. Nat. Resour. 2008, 23, 911–919. [Google Scholar]
- Kasanko, M.; Barredo, J.; Lavalle, C.; McCormick, N.; Demicheli, L.; Sagris, V.; Brezger, A. Are European cities becoming dispersed?: A comparative analysis of 15 European urban areas. Landsc. Urban Plan. 2006, 77, 111–130. [Google Scholar] [CrossRef]
- Qian, Z. Research on the Change and Innovation of China’s Rural Land System. China Land Sci. 1998, 12, 30–33. [Google Scholar]
- Wu, S.; Zhou, S.; Pan, X.; Zhao, Q. Quantitative partitioning of impacts of urban sprawl process on heavy metal accumulation in Yixing, China. Acta Pedol. Sin. 2011, 48, 496–505. [Google Scholar]
- Shao, N.; Liu, X.; Qu, X. Evaluation of Yinchuan Lake Wetland Ecosystem Service Value. Chin. J. Ecol. 2008, 9, 1625–1630. [Google Scholar]
- Ma, X.; Han, S.; Wang, L.; Wang, J.; Xu, X. Spatial and temporal evolution of land use types in the greater Xi’an area. Arid Land Geogr. 2020, 43, 499–507. [Google Scholar]
- Wang, C.; Tang, N. Spatio-temporal characteristics and evolution of rural productionliving-ecological space function coupling co-ordination in Chongqing Municipality. Geogr. Res. 2018, 37, 22–29. [Google Scholar]
- Jia, S.; Zhang, H. Research on the Process and Mechanism of Land Conversion in China; China Agriculture Press: Beijing, China, 2000. [Google Scholar]
- Xu, L. The Reference and Enlightenment of American and Japanese Agricultural Large-scale Operation and Management to my country. Agric. Econ. 2017, 4, 9–11. [Google Scholar]
- Xiao, Z.; Hao, L.; He, H. A Study on the Adaptive Protection and Utilization of Ecological Environment along the Northern Foot of Qinling Mountainsin Xi’an Section. Ecol. Econ. 2014, 30, 187–192. [Google Scholar]
- Masek, J.G.; Lindsay, F.E.; Goward, S.N. Dynamics of Urban Growth in the Washington DC Metropolitan Area, 1973–1996, from Land Sat Observations. Int. J. Remote Sens. 2000, 21, 3473–3486. [Google Scholar] [CrossRef]
- Song, Y.; Shi, Z.; Yu, S.; Hao, R. Influence of urbanization on the characters of plants composition in urban green space in Shenzhen, China. Ecol. Environ. Sci. 2010, 19, 6. [Google Scholar]
- Panatotou, T. Empirical Tests and Policy Analysis of Environmental Degradation at Different Stages of Economic Development; Working Paper; International Labour Organization: Geneva, Switzerland, 1993; Volume 238. [Google Scholar]
- An, X.; Wang, Y. International experience of food security and economic development. World Agric. 1997, 5, 3–5, 17. [Google Scholar]
- Liu, P.; Sun, B. The spatial pattern of urban production-living-ecologicalspace quality and its related factors in China. Geogr. Res. 2020, 39, 13–24. [Google Scholar]
- Dong, J. Value Comparison Between Sloping Fields And Forestland—Discussing the Benef its of Converting from Farmland to Forest Simultaneously. China Popul. Resour. Environ. 2003, 13, 86–88. [Google Scholar]
- Zhou, Z. Impact of the agricultural landscape change on ecosystem services in the process of rapid urbanization region: A case study of Xi’an metropolitan zone. Arid Land Geogr. 2015, 38, 1004–1013. [Google Scholar]
- Tang, Q.; He, P. Analysis of Coupling Coordination Development among the Agricultural Environment-Grain Production-Agricultural Subsidy: A Case Study of Hubei Province. Ecol. Econ. 2019, 35, 116–120. [Google Scholar]
- Qin, Y.; Shi, P.; He, W.; Huo, C.; Li, P.; Li, Z.; Yang, S.; Feng, C. Influence of urbanization on landscape pattern and ecosystem service value in Xi’an City. Acta Ecol. Sin. 2020, 40, 8239–8250. [Google Scholar]
- Jia, S.; Sun, R.; Xia, X.; Zhang, T. Estimation on the Cultivated Land Ecological Security of Xi’an and Analysis on Its Influence Factors. Res. Soil Water Conserv. 2016, 23, 164–169. [Google Scholar]
- Yang, H.; Li, X. Cultivate land and food supply in China. Land Use Policy 2000, 17, 73–78. [Google Scholar] [CrossRef]
- Miler, J.S.; Hoel, L.A. The “smart growth” debate: Best practice for urban transportation planning. Socio-Econ. Plan. Sci. 2002, 36, 1–24. [Google Scholar] [CrossRef]
- Zhang, H.; Feng, S.; Qu, F. Research on Coupling Coordination among Cultivated Land Protection, Construction Land Intensive Use and Urbanization. J. Nat. Resour. 2017, 32, 1002–1015. [Google Scholar]


| Type of Pollution | Forest | Grassland | Water | Unused Land |
|---|---|---|---|---|
| SO2 | 291.03 | 21.7 | 427.15 | 0 |
| Oxynitride | 215.36 | 16.06 | 316.17 | 0 |
| HF | 9.94 | 1.2 | 3.56 | 0 |
| Other dust | 44300 | 120 | 8.86 | 0 |
| Land-Use Type | Carbon Density of the above-Ground Biomass | Carbon Density of the Underground Biomass | Carbon Density of the Soil |
|---|---|---|---|
| Forest | 4.24 × 10⁴ | 1.16 × 10⁵ | 2.37 × 10⁵ |
| Grassland | 3.53 × 10⁴ | 0.87 × 10⁵ | 0.99 × 10⁵ |
| Water | 0 | 0 | 0 |
| Cultivated land | 0.57 × 10⁴ | 0.81 × 10⁵ | 1.08 × 10⁵ |
| Land-Use Type | The Litter is Dry and Heavy (t/hm2) | Saturated Percent Sorption (%) | Canopy Interception (%) | Noncapillary Porosity (%) |
|---|---|---|---|---|
| Forest | 24.56 | 276.45 | 19.35 | 13.46 |
| Grassland | 4.43 | 40.74 | 4.1 | 6.07 |
| Land-Use Type | Forest | Grassland | Water | Unused Land |
|---|---|---|---|---|
| Value (yuan/hm2) | 934.13 | 390.72 | 1994.00 | 107.78 |
| ES Function Value (yuan) | High Temperature Adjustment | Air Purification | Carbon Storage | Water Conservation | Travel and Leisure |
|---|---|---|---|---|---|
| 1980 | 4665 | 212,971 | 20,199,020 | 3,423,101 | 64,687 |
| 2000 | 4564 | 211,744 | 20,052,318 | 3,403,714 | 63,076 |
| 2015 | 4539 | 214,483 | 19,904,660 | 3,425,488 | 63,748 |
| ES | GP | |||||
|---|---|---|---|---|---|---|
| 1980 | 2000 | 2015 | 1980 | 2000 | 2015 | |
| ED | −0.156 ** | −0.177 ** | −0.275 ** | −0.028 ** | −0.048 ** | −0.063 ** |
| ES | −0.741 ** | −0.714 ** | −0.697 ** | |||
Publisher’s Note: MDPI stays neutral with regard to jurisdictional claims in published maps and institutional affiliations. |
© 2021 by the authors. Licensee MDPI, Basel, Switzerland. This article is an open access article distributed under the terms and conditions of the Creative Commons Attribution (CC BY) license (https://creativecommons.org/licenses/by/4.0/).
Share and Cite
Shao, J.; Li, F. Multi-Function Tradeoffs of Land System in Urbanized Areas—A Case Study of Xi’an, China. Land 2021, 10, 640. https://doi.org/10.3390/land10060640
Shao J, Li F. Multi-Function Tradeoffs of Land System in Urbanized Areas—A Case Study of Xi’an, China. Land. 2021; 10(6):640. https://doi.org/10.3390/land10060640
Chicago/Turabian StyleShao, Jiaqi, and Fei Li. 2021. "Multi-Function Tradeoffs of Land System in Urbanized Areas—A Case Study of Xi’an, China" Land 10, no. 6: 640. https://doi.org/10.3390/land10060640