Article

Detection of Archaeological Surface Ceramics Using Deep Learning Image-Based Methods and Very High-Resolution UAV Imageries

by
Athos Agapiou
1,2,*,
Athanasios Vionis
3 and
Giorgos Papantoniou
4
1
Earth Observation Cultural Heritage Research Lab, Department of Civil Engineering and Geomatics, Faculty of Engineering and Technology, Cyprus University of Technology, Limassol 3036, Cyprus
2
Eratosthenes Centre of Excellence, Limassol 3036, Cyprus
3
Archaeological Research Unit, University of Cyprus, Nicosia 1678, Cyprus
4
Department of Classics, School of Histories and Humanities, Trinity College Dublin, The University of Dublin, D02 PN40 Dublin, Ireland
*
Author to whom correspondence should be addressed.
Land 2021, 10(12), 1365; https://doi.org/10.3390/land10121365
Submission received: 20 November 2021 / Revised: 4 December 2021 / Accepted: 8 December 2021 / Published: 10 December 2021
(This article belongs to the Special Issue Land: 10th Anniversary)

Abstract

:
Mapping surface ceramics through systematic pedestrian archaeological survey is considered a consistent method to recover the cultural biography of sites within a micro-region. Archaeologists nowadays conduct surface survey equipped with navigation devices counting, documenting, and collecting surface archaeological potsherds within a set of plotted grids. Recent advancements in unmanned aerial vehicles (UAVs) and image processing analysis can be utilised to support such surface archaeological investigations. In this study, we have implemented two different artificial intelligence image processing methods over two areas of interest near the present-day village of Kophinou in Cyprus, in the Xeros River valley. We have applied a random forest classifier through the Google Earth Engine big data cloud platform and a Single Shot Detector neural network in the ArcGIS Pro environment. For the first case study, the detection was based on red–green–blue (RGB) high-resolution orthophotos. In contrast, a multispectral camera covering both the visible and the near-infrared parts of the spectrum was used in the second area of investigation. The overall results indicate that such an approach can be used in the future as part of ongoing archaeological pedestrian surveys to detect scattered potsherds in areas of archaeological interest, even if pottery shares a very high spectral similarity with the surface.

1. Introduction

Scatters of fragmented pottery found on the surface are considered as archaeological proxies, evidence of past human activity, and indicators for sub-surface archaeological features [1,2]. As a non-destructive method, intensive surface survey has been widely adopted by archaeologists since the 1960s to record potsherds, lithics, and architectural features [3,4,5,6]. Since the late 1970s, ‘new wave surveys’ in Greece and other parts of the Mediterranean moved away from earlier topographical approaches and the extensive survey tradition and formed the first generation of intensive regional surveys [7,8]. A regional survey, however, faces clear difficulties when one attempts to compare survey data in relation to the variables of each project, such as the area covered, its methodology, and scope [9]. Archaeological survey is rigorous and multidisciplinary, while the main characteristics of most surface survey projects are the close-order field-walking and recording of surface artefacts, collection of representative samples, data analysis, digital archiving, and self-criticism [7,8]. The exploration and understanding of landscape evolution, human interaction with the landscape, and settlement history from early prehistory to early modern times remains of paramount importance, and a common aim between different survey projects across the Mediterranean, from Spain and Italy to Greece and Cyprus [4,10,11,12,13,14,15]. As Orengo and Garcia-Molsosa [16] argue, surface survey, along with remote sensing and geophysics, are considered as some of “the most popular and reliable approaches for the detection and characterisation of archaeological sites”.
Although this may vary between different projects, archaeologists usually investigate rectangular units (e.g., transects sized 100 × 100 m, sampling surface potsherds and other artefacts every 10 m at the x-axis). Nowadays, with the aid of handheld navigation units (i.e., Global Navigation Satellite Systems, GNSS), field surveyors record potsherds, lithics, and architectural remains during systematic field-walking. This method is considered quite efficient, especially when field-walkers are trained or as they become familiar with the archaeological context of the area (in cases when there has been previous archaeological exploration of some kind, when there are obvious indications about the chronology of the site, etc.). However, some limitations do exist beyond subjective observation, as the method can be time-consuming, determined by the extent of the surface that needs to be surveyed in a certain (usually limited) amount of time, the intensity of field-walking, and the interval between field-walkers, which can potentially increase the coverage [1,2].
Over the past few years, especially after the democratisation of photogrammetric tools and equipment [17,18,19], with the availability of open-source or low-cost photogrammetric software, high-resolution imagery with centimetre resolution has revolutionised archaeological practices [20,21,22,23,24,25]. Digital camera sensors embedded in low-cost unmanned aerial vehicles (UAVs) can collect very high-resolution stereo pairs of images in a short time. Thus, orthophotos can be generated over specific areas of interest, minimising elevation and camera distortions [26]. UAVs have been widely adopted for archaeological purposes in the recent past, as indicated by the relevant literature [27,28,29].
In parallel, artificial intelligence image-based methods have also been populated in the relevant literature, while their use is considered a hot topic for supporting archaeological research [30,31,32,33,34,35,36]. The recently published work of Orengo and Garcia-Molsosa [16] comprises a milestone in this direction. Orengo and Garcia-Molsosa [16] have demonstrated the great potential using the Google Earth Engine big data cloud platform, already mentioned in [37], for detecting potsherds at the archaeological site of Abdera (ca. 7th to 3rd C BC). Their work was based on the acquisition of high-resolution UAVs red–green–blue (RGB) images and the application of the random forest classification. Recently, the authors also improved their previous work by developing a novel framework for the detection of surface pottery [38].
The scope of our study is twofold: on the one hand, it aims at evaluating the initial approach of Orengo and Garcia-Molsosa [16], providing further insights regarding the robustness of their approach, while on the other, we aim to push research by integrating multispectral cameras, covering images beyond the visible part of the spectrum, and applying deep learning detection methods. In order to achieve the aforementioned objectives, two areas in the Xeros River valley in Cyprus were selected, where intensive archaeological survey was conducted by the Artefact and Landscape Studies Laboratory (ArtLandS Lab) in the framework of the Settled and Sacred Landscapes of Cyprus archaeological project (SeSaLaC) of the Archaeological Research Unit of the University of Cyprus [39]. SeSaLaC comprises an inter- and multi-disciplinary field project conducted between 2014 and 2020 in the Xeros valley (Larnaca District), an area of 2500 ha in size, situated 20 kilometres south-west of Larnaca and 7 km inland from the south coast of the island. The aim was to identify, map, and interpret traces of human activity in the Xeros valley from early prehistory to early modern times in order to examine the interaction of secular and religious space with the natural environment. The ultimate objective has been to investigate the political, religious, and settlement identities of the island through the application of advanced field methodologies and techniques. In addition to the widely employed methods of intensive surface survey, such as the systematic counting of pottery finds and the recording of pottery densities, a range of informed methods and interdisciplinary approaches were employed, including geophysical prospection, geoarchaeology, digital Humanities and Anthropology, in order to explore relevant research questions. Along with previous systematic survey projects in Cyprus, such as those on the Troodos and Pyla-Koutsopetria [14,15], SeSaLaC constitutes one of the new generation intensive surface survey programmes, adopting a more systematic methodology in landscape archaeology and developing a more intensive approach to surface coverage, collection, and recording of archaeological data and finds. Thanks to the topographical characteristics of the Xeros valley, SeSaLaC’s fundamental difference to previous surveys on the island [14] was that it did not cover surveyable patches of the landscape but its totality, as it is defined by a continuous series of hills to the east, the foothills of Troodos to the north, and Pentaschoinos River to the west. Moreover, the absence of collection limitations [15] allowed the careful sampling of representative and sufficient numbers of ceramic artefacts for detailed study and analysis.
The current work is organised as follows: the selected two cases studies, and the archaeological context is first provided, following by a description of the overall methodology implemented here. Section 3 describes the results obtained from the two case studies, while the next section (Section 4) aims to discuss the overall results, indicating potential further investigations for the future. The paper ends with the Section 5.

2. Case Studies and Methodology

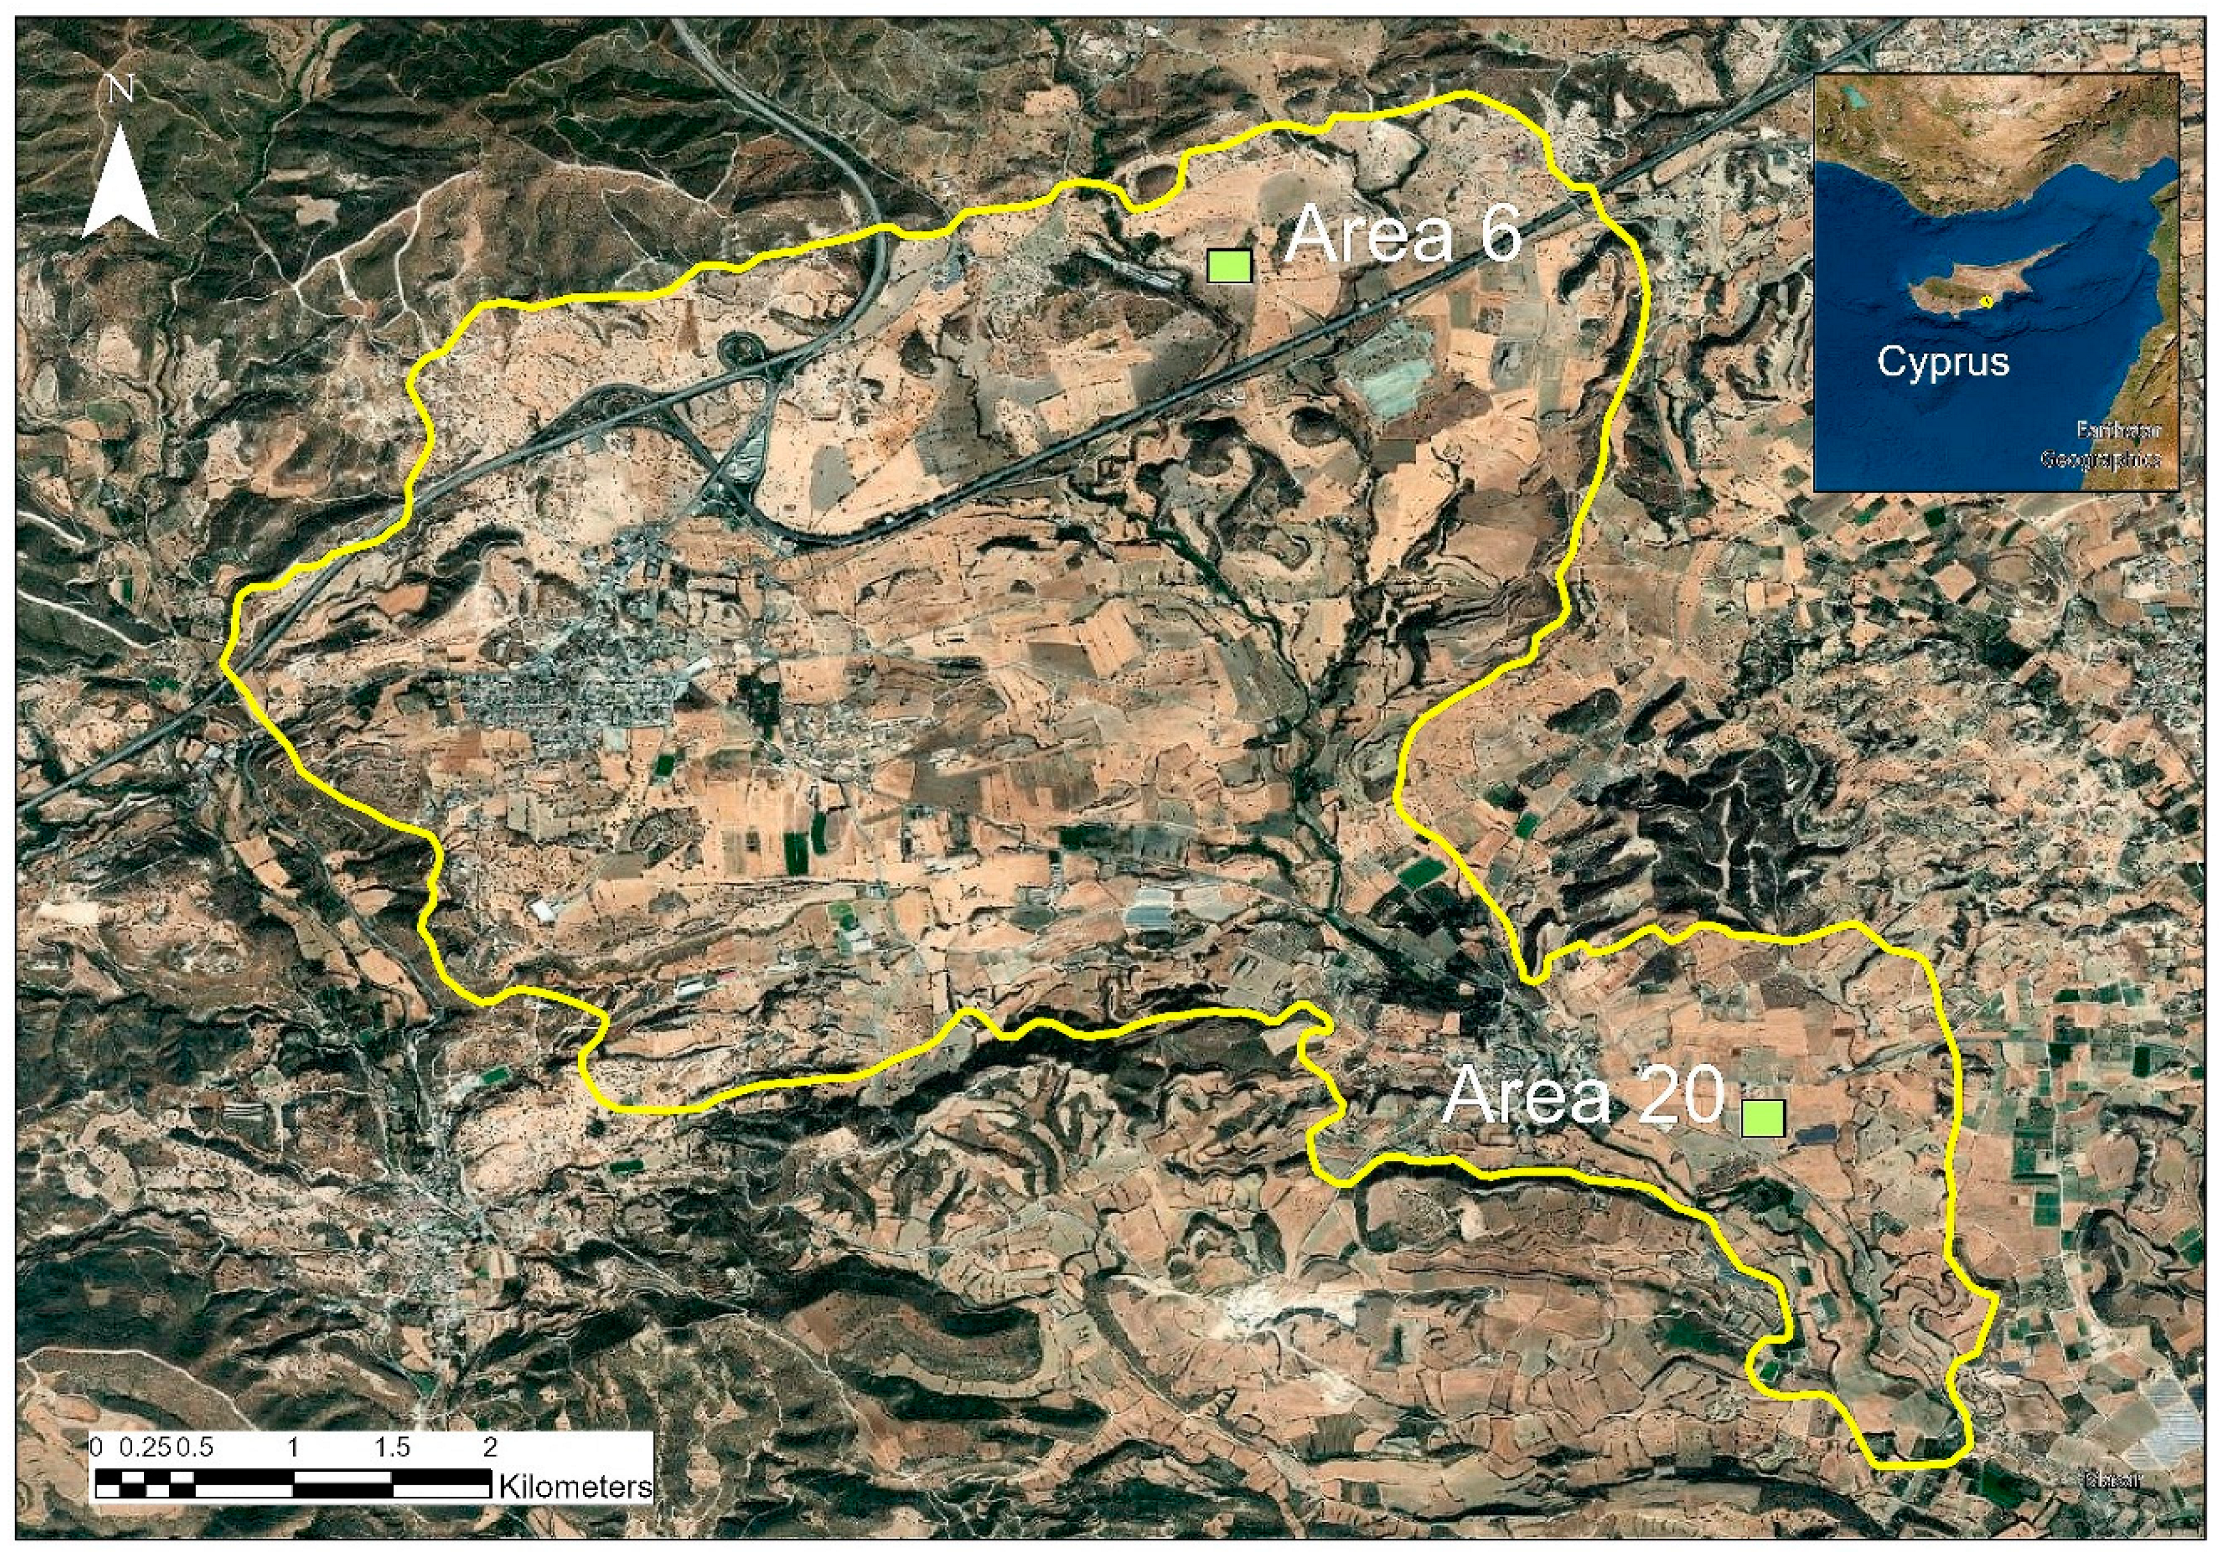
2.1. Case-Study Areas
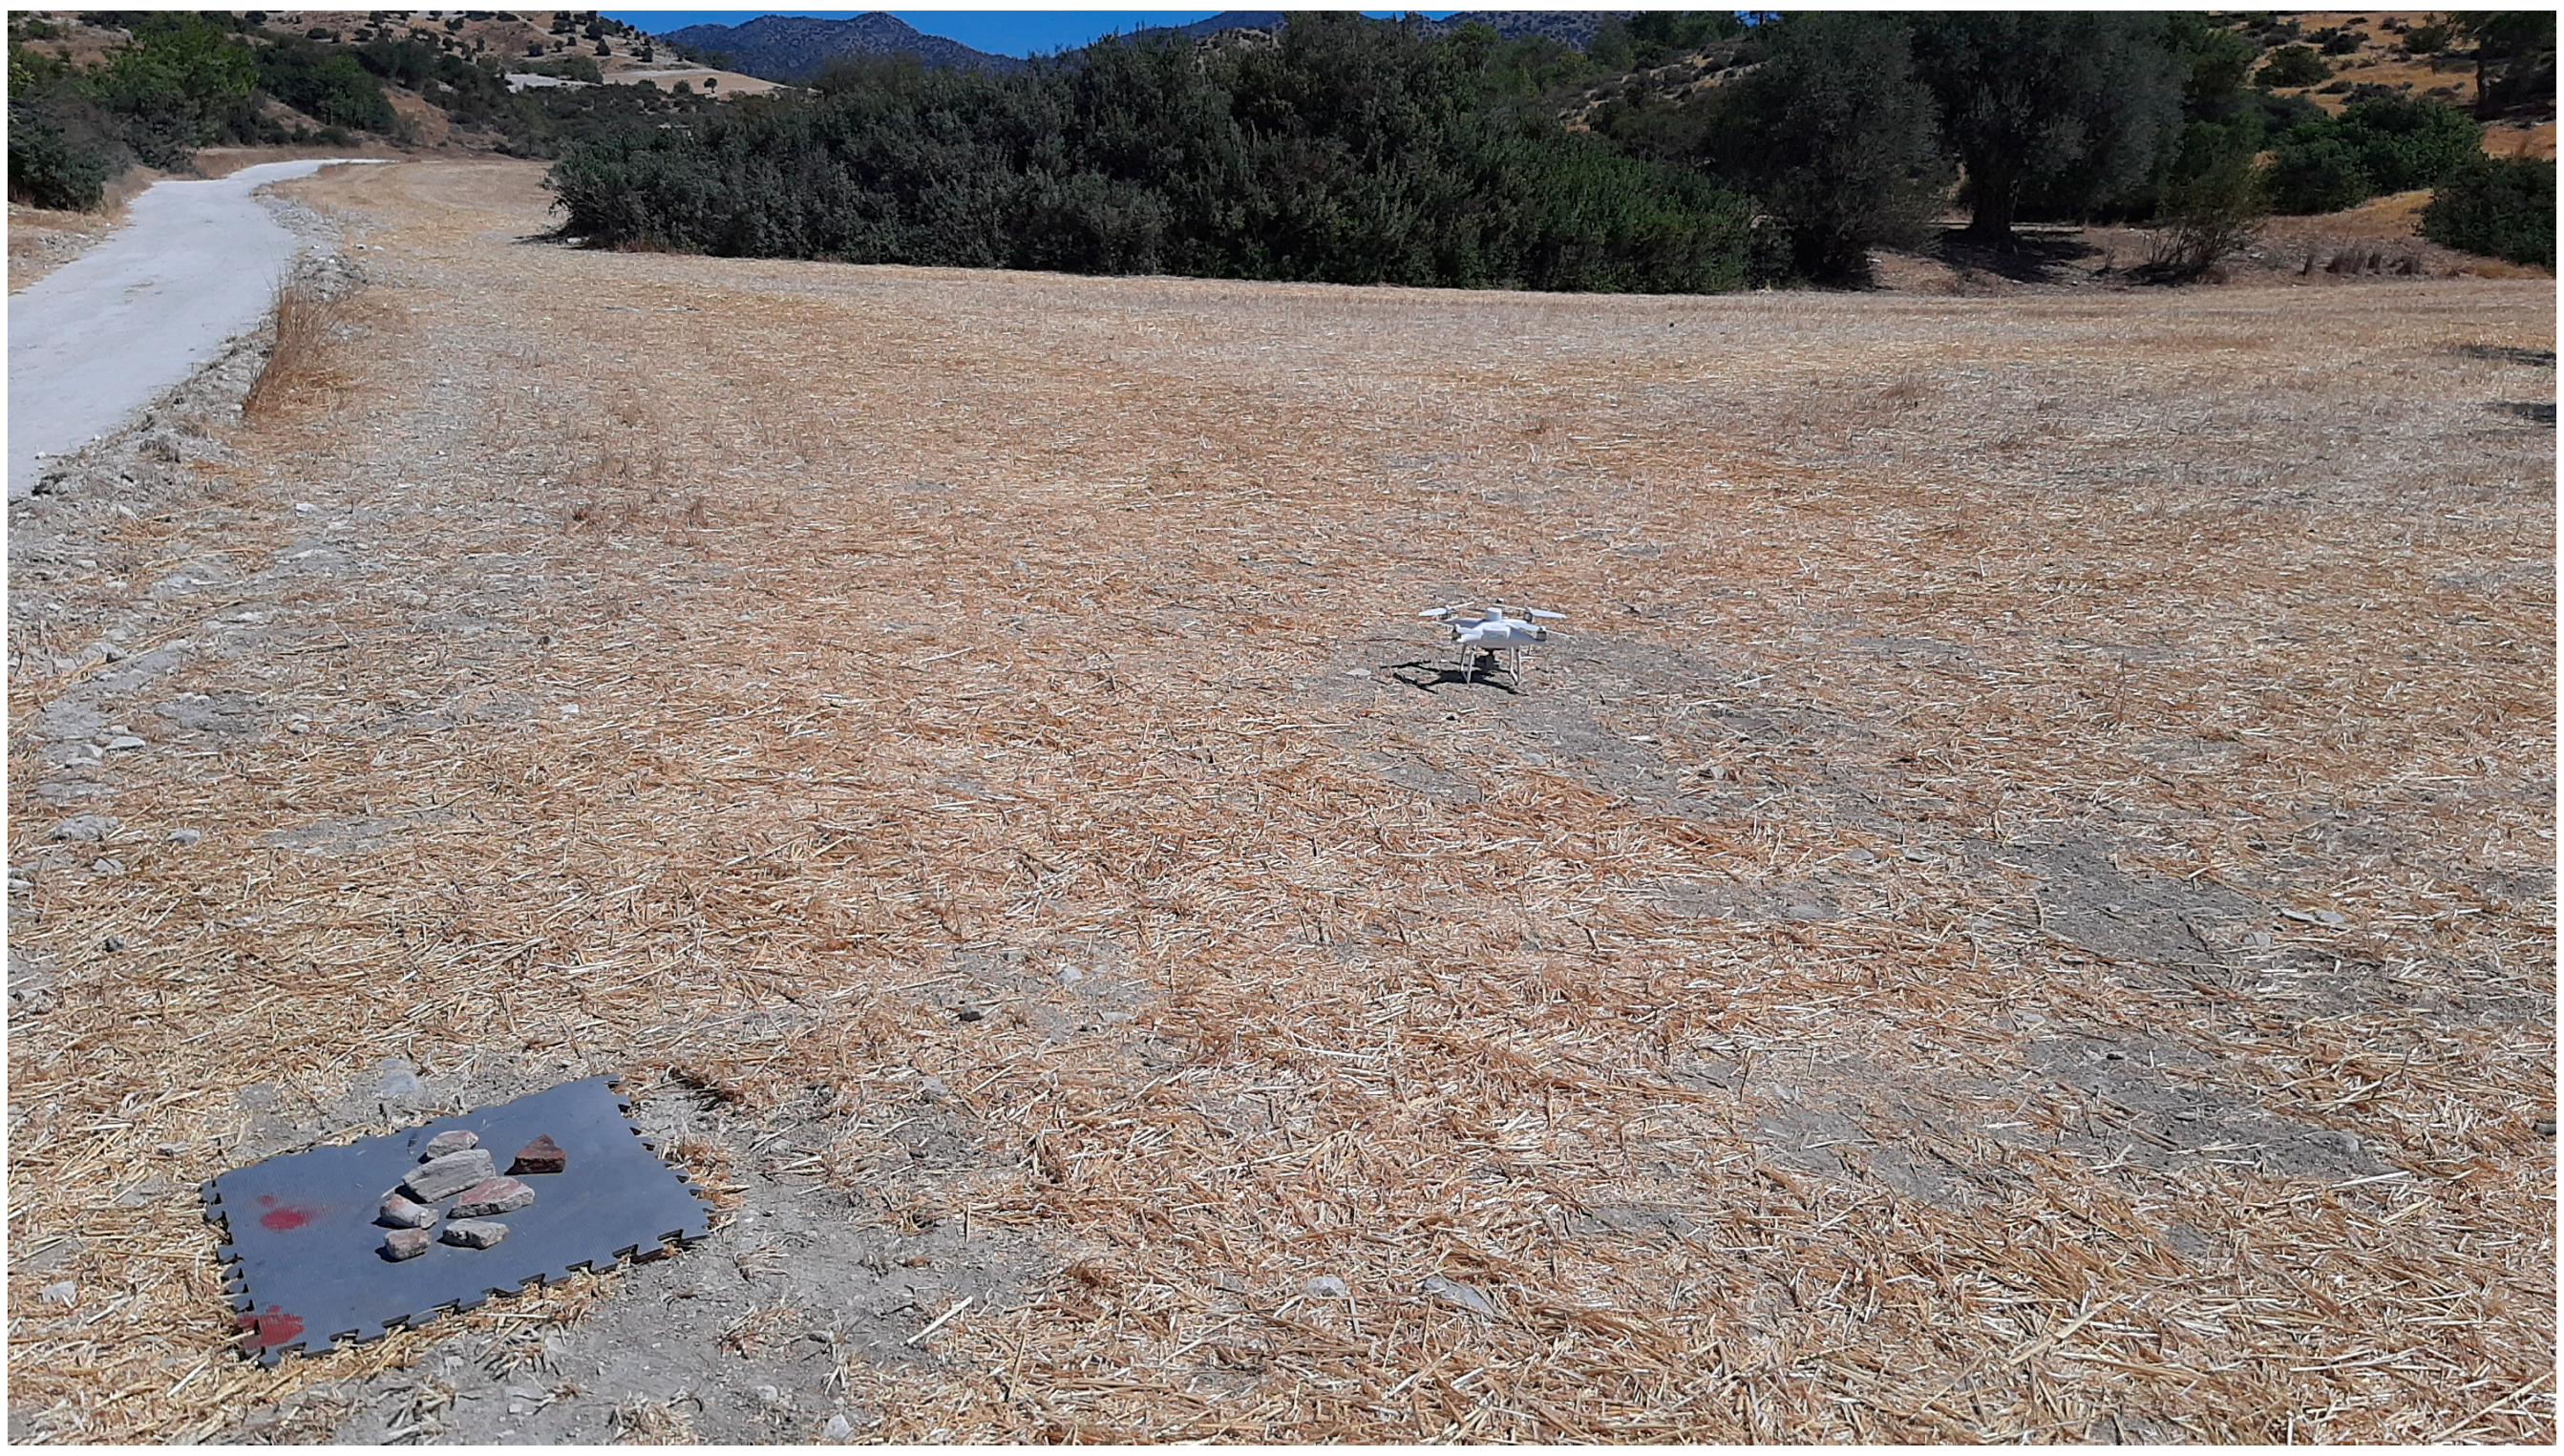
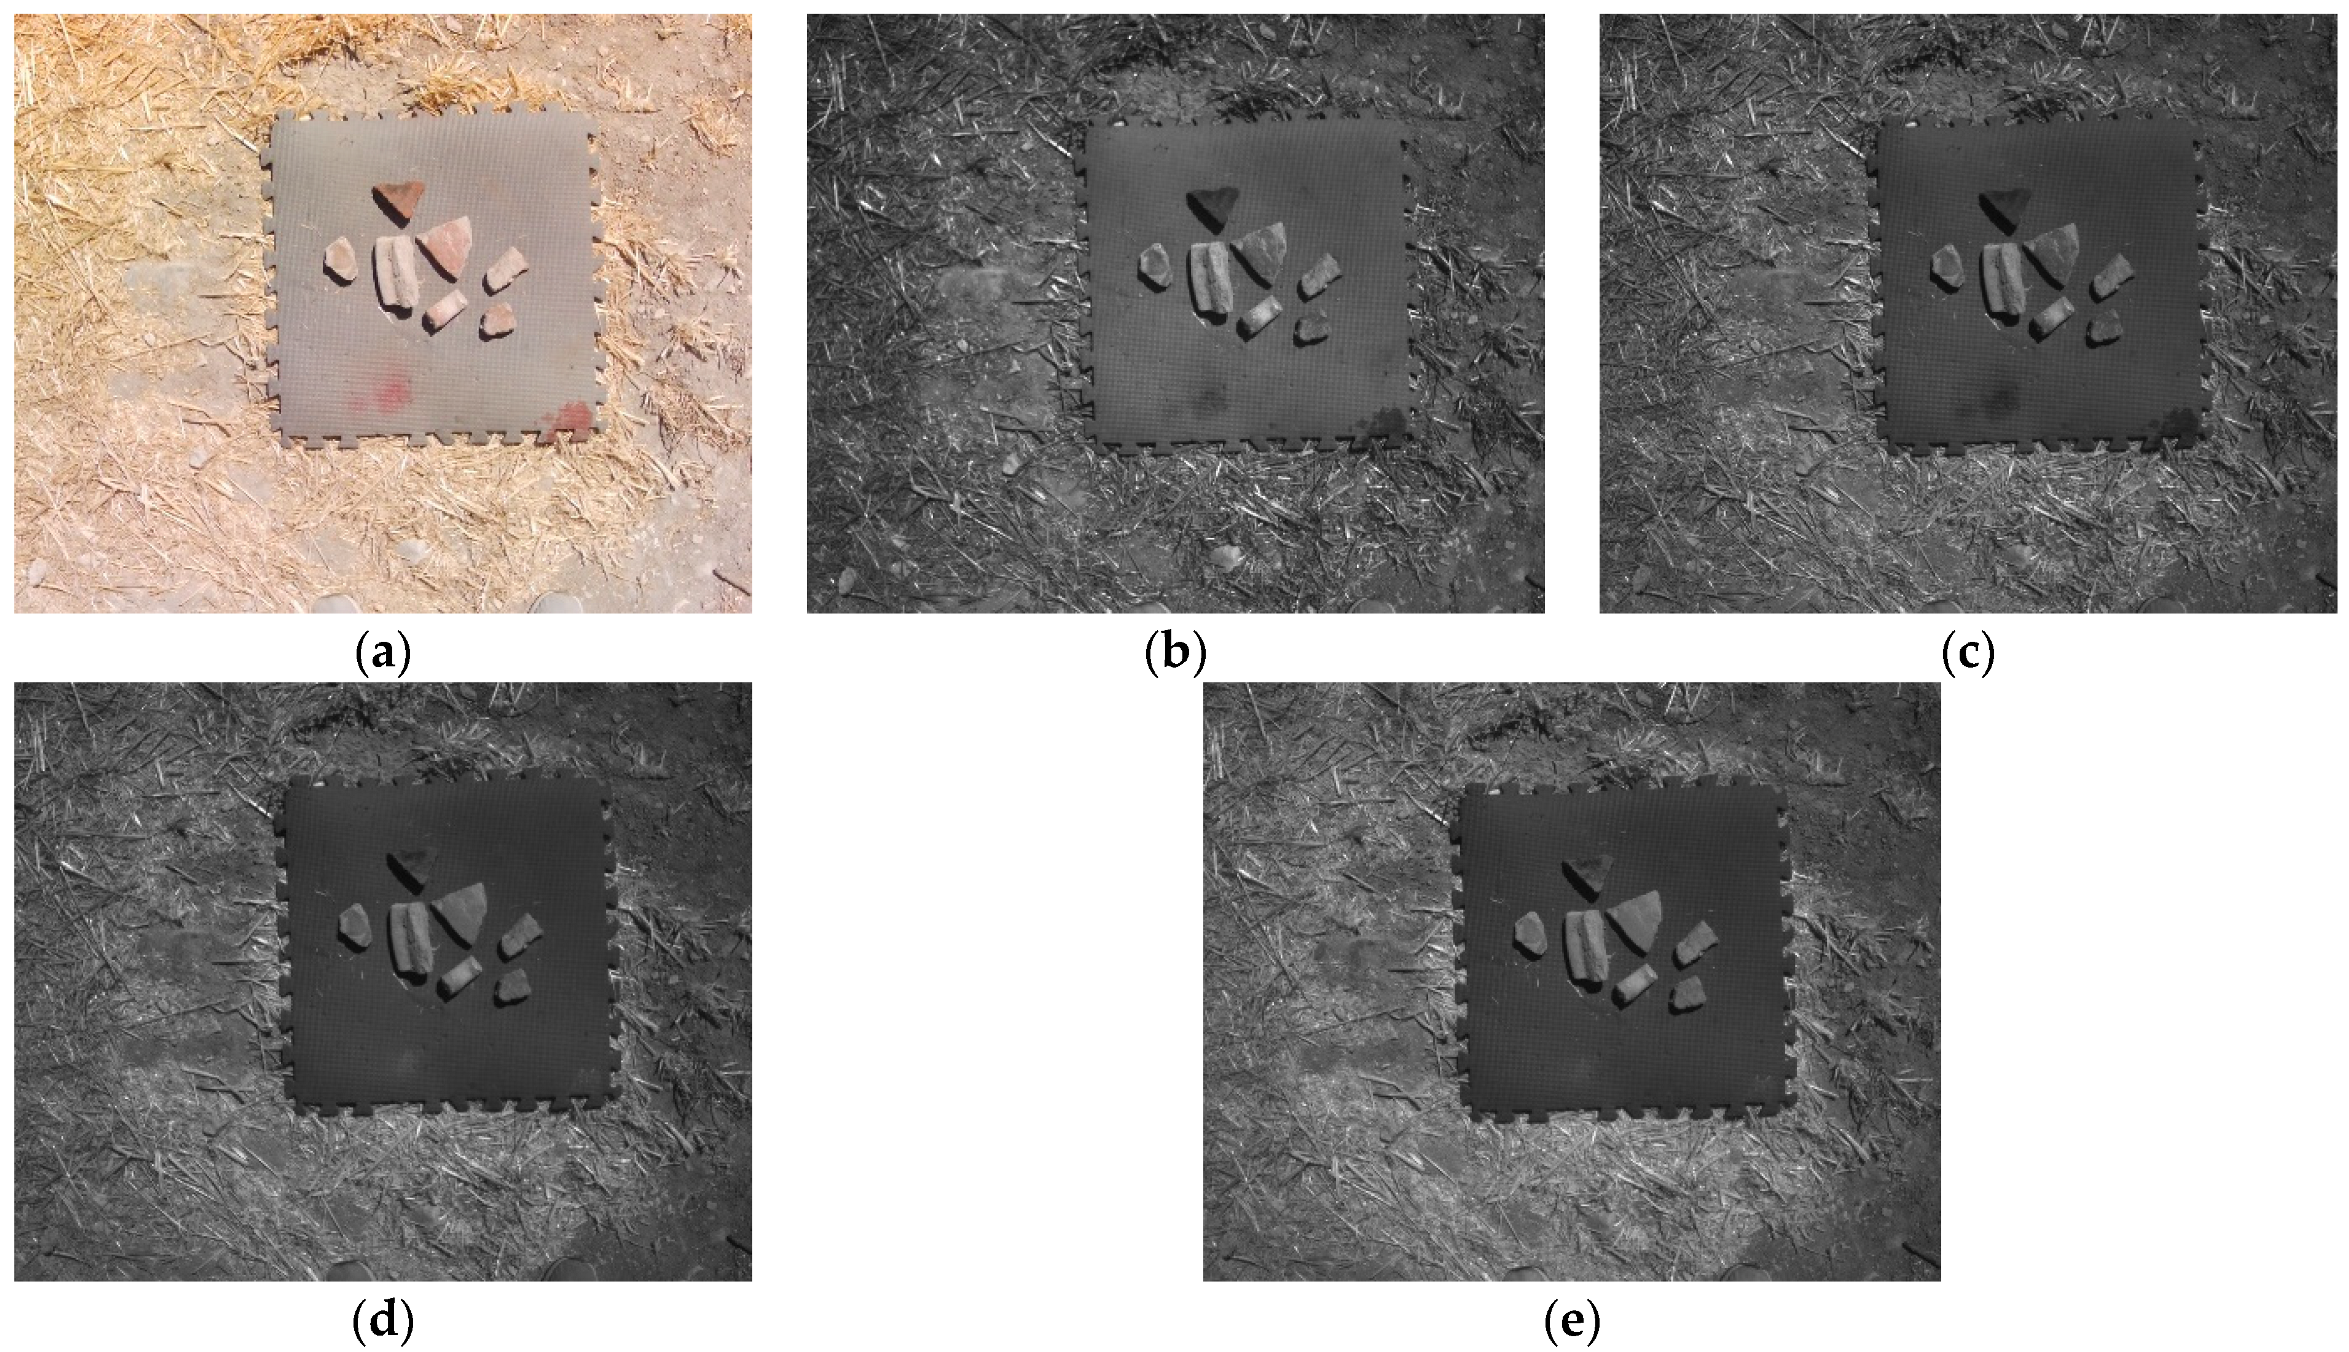
The archaeological field project in the Xeros River valley has employed a range of informed methods of intensive field survey. These include the systematic counting of pottery densities in transects running north–south throughout the survey area, aerial photography, micro-topographical surveys, and the in situ digital recording of archaeological information and monuments [4,5], using the technical equipment of ArtLandS Lab. The transects plotted throughout the Xeros valley comprise continuous zones of 150 m in width at 150 m intervals; walkers, lined up within each transect-unit (150 × 150 m), were spaced 15 m from one another. The survey team of each unit recorded the number of ceramic finds and lithics visible on the surface, along with potential architectural remains and the degree of visibility. Concentrations of surface archaeology identified and recorded by the survey team in the transects were regarded as places of special archaeological interest, they were revisited and divided into smaller units or grids of 25 × 25 m, and a finer survey was conducted by a group of field-walkers spaced at 5 m from one another [4,5].
The sample unit (175 × 175 m) in Area 6, and the one in Area 20 (25 × 25 m), shown in Figure 1, were selected due to their high pottery distribution and density. According to the results of the archaeological field campaigns in Area 6, the team of archaeologists counted approximately 2400 pottery fragments, while in area 20 the field-walkers identified and counted 300 potsherds. The largest preserved width of the identified surface pottery fragments ranges from approximately 3 cm to 20 cm, while the colour of their surface also varies, from reddish-orange to brown, depending on firing (Figure 2).

2.2. Methodology

Initially, regular UAV flights were undertaken using the DJI Phantom 3 Professional system attached with the FC300X_3.6_4000x3000 (RGB) camera. The specific system was used as part of the wider flight campaign to create an overall mosaic of the entire survey area in the Xeros valley. The flights were performed in different periods for supporting the general needs of ArtLandS Lab’s research activities. A subset of this mosaic over Area 20—taken in the summer of 2020—was used for the needs of this pilot study. A year later, in summer 2021, a new campaign over Area 6 was performed, using the DJI P4 Multispectral system and the FC6360_5.7_1600x1300 camera. Figure 3 shows a photo taken during the latest campaign using the DJI P4 multispectral camera.
Stereo pairs from the high-resolution images were collected from both campaigns and then processed to create orthomosaics over the two case studies. Ground control points using Global Navigation Satellite Systems (GNSS) were used to estimate the cameras’ internal and external orientation parameters. The Digital Surface Model (DSM) was initially produced in commercial software, namely ArcGIS Drone2Map (powered by Pix4D) for Area 20 and the Pix4Dmapper (v.4.6.4) for Area 6, using Structure from Motion (SfM) techniques. Consequently, a textured RGB and a multispectral mosaic were generated for Areas 20 and 6, respectively. The latest mosaic (over Area 6) was a four-spectral band imagery, covering both the visible part of the spectrum (RGB) and the near-infrared part of the spectrum (NIR). For the first mosaic, the Intel(R) Core (T.M.) i7-9700K CPU, with 32GB RAM, was used, while for the second we used the Intel(R) Core (T.M.) i7-8700 CPU with 64GB RAM. The processing time was more than 2 h for both mosaics. The results (textured mosaics) from both Areas (20 and 6) are shown in Figure 4. The spatial resolution (pixel size) of the orthomosaics for Area 20 was estimated to be at 3.5 cm with a mean reprojection error of 0.274 pixels while for Area 6 this was estimated to be at 9.5 cm with a mean reprojection error of 0.193 pixels.
Once the mosaics were generated, image-processing techniques may be applied to detect potsherds scattered on the ground. For the purposes of this article, we followed two different approaches for each case-study area. For Area 20, which was shot with an RGB sensor camera, the Random Forest classifier at the Google Earth Engine big data cloud platform was used after Orengo and Garcia-Molsosa’s published study [16]. At the environment of the Google Earth Engine, a training sample was given to the model by selecting areas of interest (points) for two classes: ‘ceramics’ (class 1) and ‘other’ (class 0). Once the training sampling was performed, the random forest classifier was applied—the results were then exported to a local computer. For the second case study, the ArcGIS Deep Learning tools of the ArcGIS Pro were used. The multispectral image was inserted into the ArcGIS Pro environment, and training samples were selected as before. Then, the Single Shot Detector (object-based) algorithm was trained using a RES-Net 152 network. The (trained) algorithm was applied for the entire multispectral image. We should also mention that the training and evaluation process was carried out continually for improving the overall detection rate.
The outcome (binary image) was compared with the result of intensive archaeological surface exploration, i.e., the number of potsherds recorded by field-walkers during the archaeological field campaigns. A direct comparison was also made for pattern distribution analysis correspondence. The results are presented in the following paragraph.

3. Results

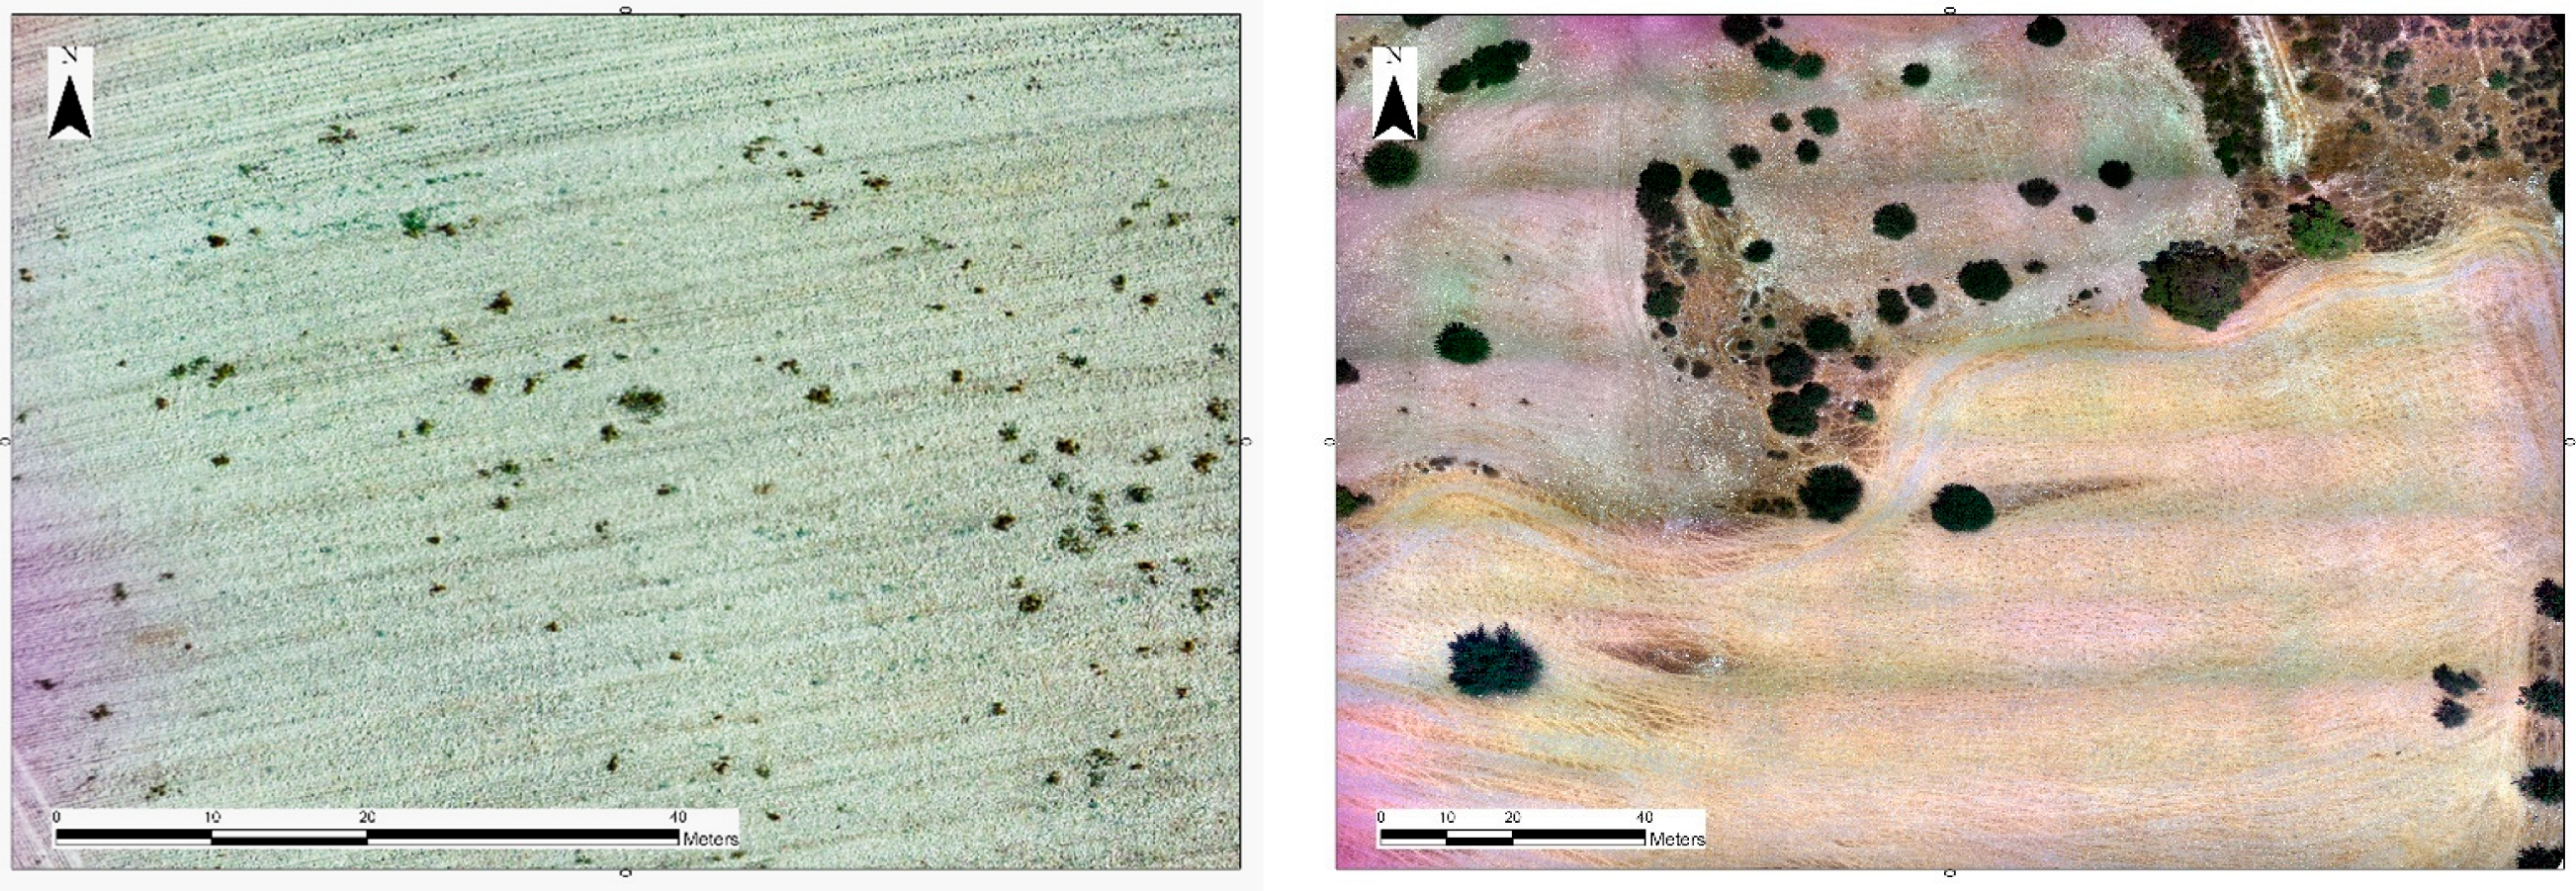
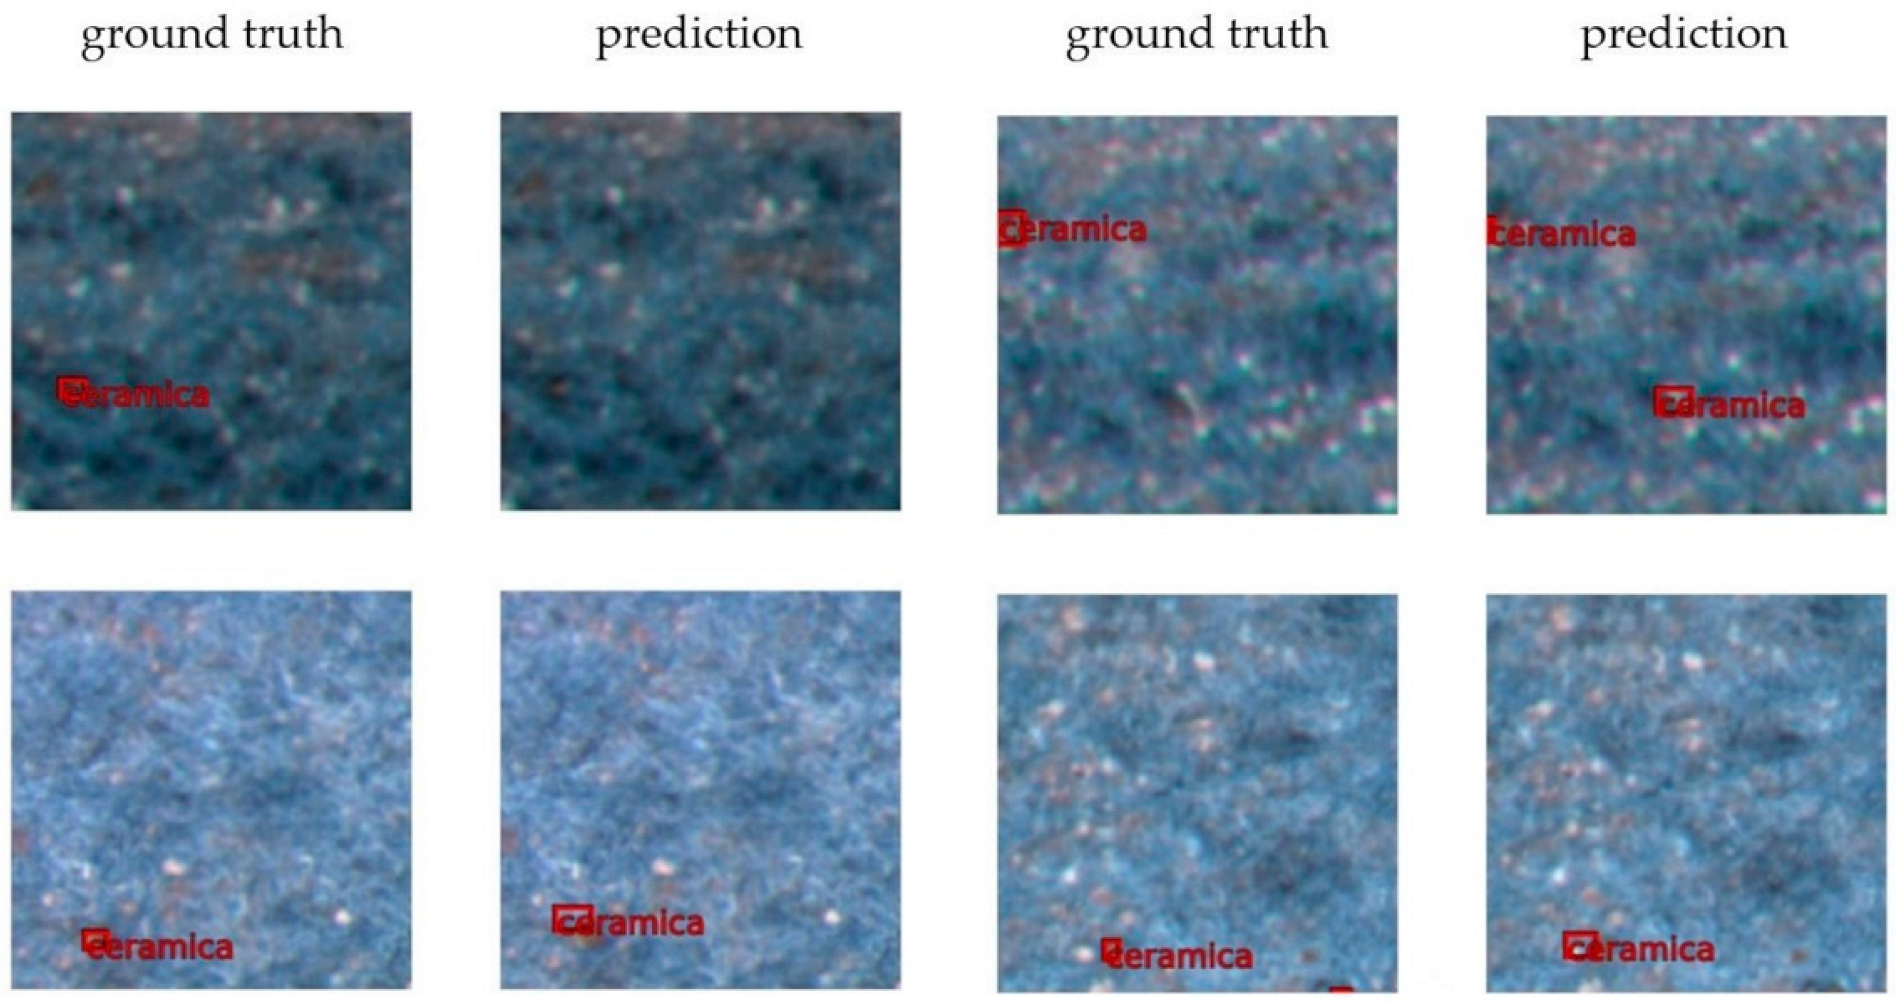
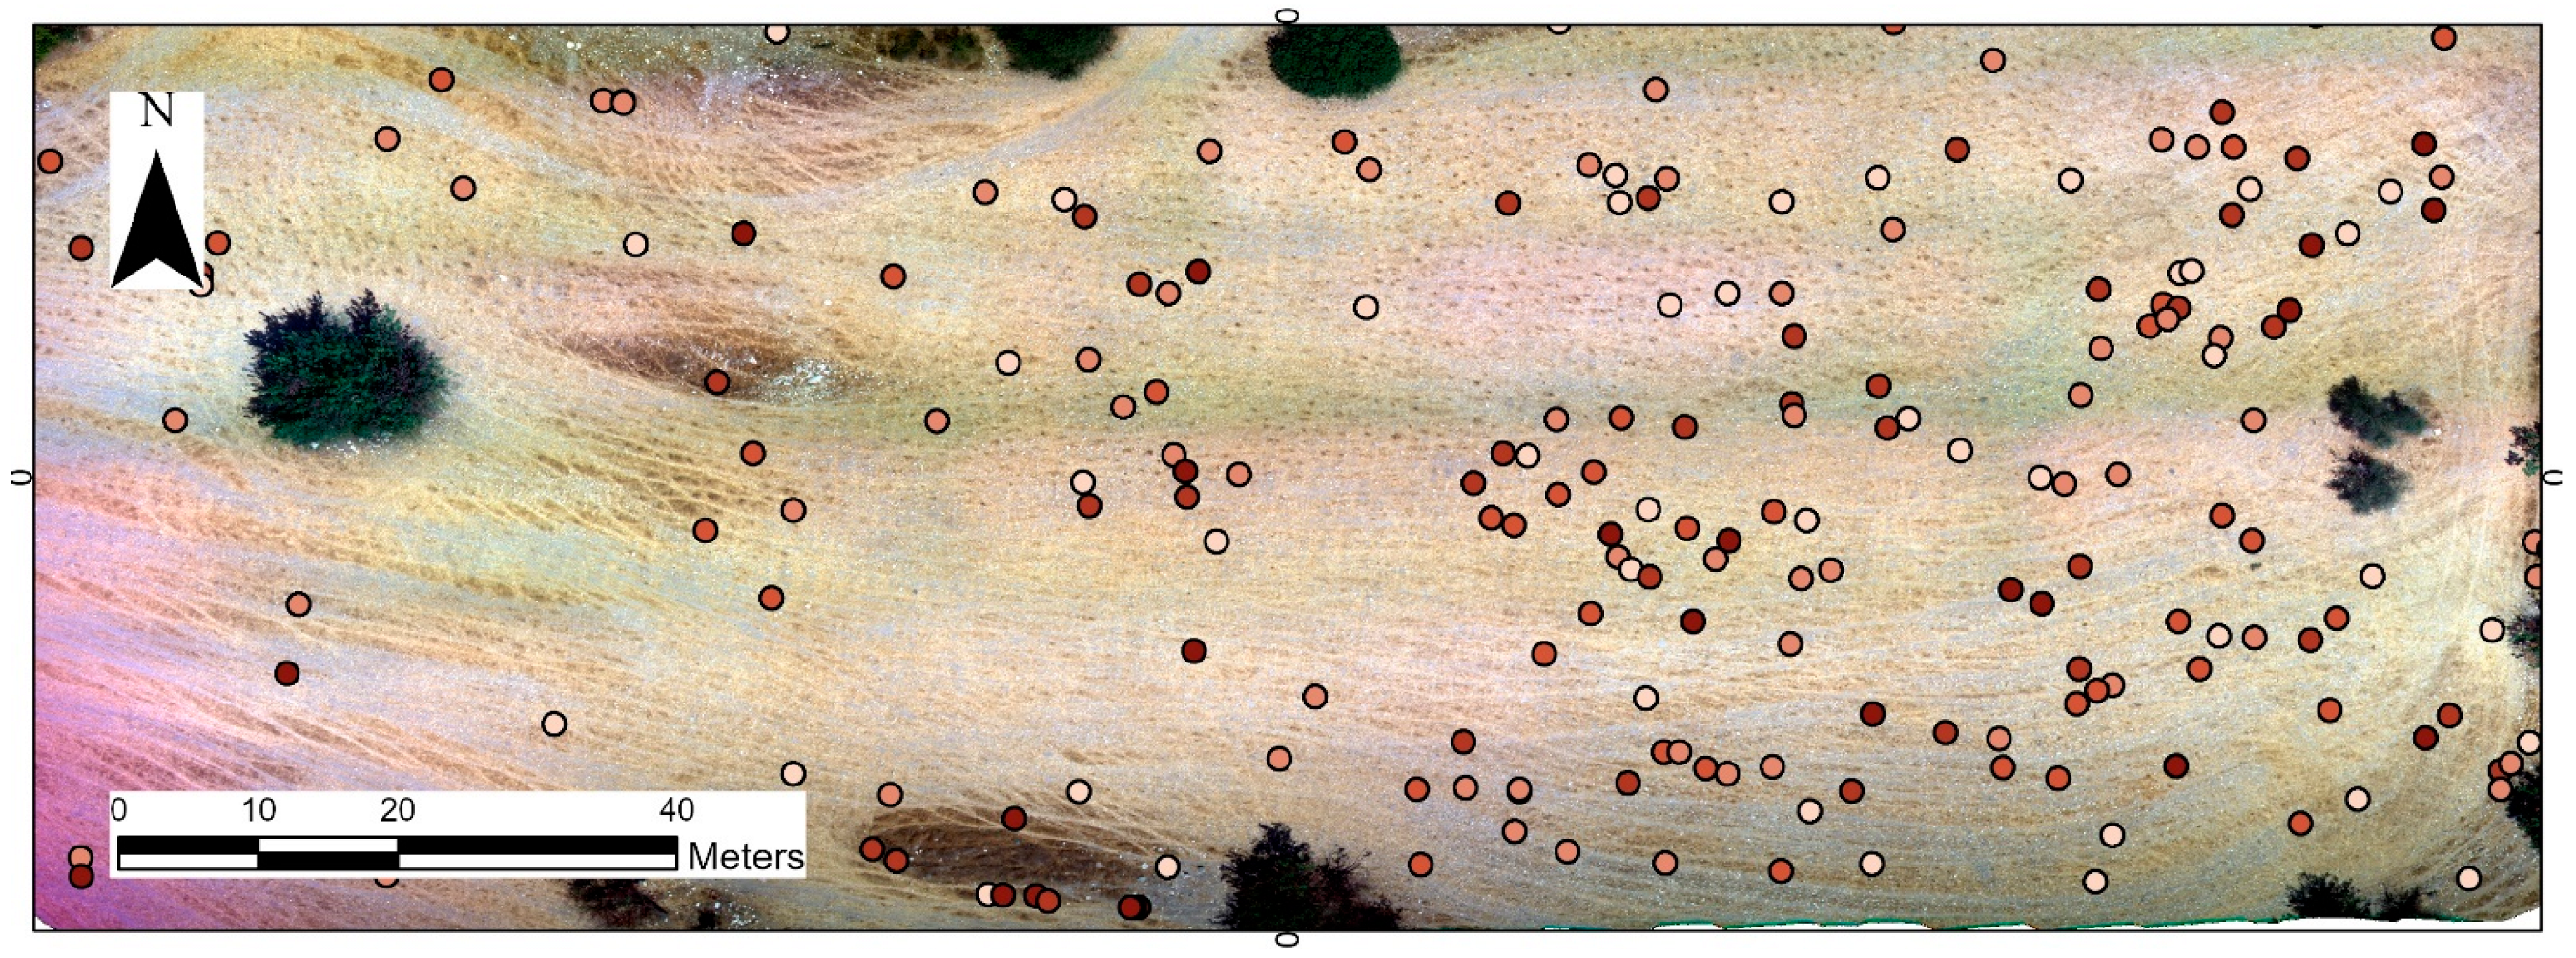
3.1. Detection of Potsherds in RGB High-Resolution Mosaic (Area 20)

Using the Google Earth Engine code by Orengo and Garcia-Molsosa [16], the random forest classifier (number of trees = 100) was applied to Area 20 in the Xeros valley. As noted above, the classifier was trained using image samples for two classes: ‘ceramics’ as class 1 and ‘other’ as class 0. Beyond the RGB spectral bands, additional bands were also generated using texture and gradient analysis (see more in [16]). The random forest probability map was produced, providing the similarity (confidential level) of a pixel being in class 1 (ceramics). Setting a value of 0.7 as a threshold at the confidential level, the binary map was exported (0 = other and 1 = ceramics). The image was then converted into a vector (points) for better visualisation and processing.
Figure 5 (left) shows the probability map of the distribution of the potsherds detected in Area 20, using the random forest classification. Higher probability (i.e., closer to class 1 rather than class 0) is indicated with blue, while lower probability (i.e., class 0) is shown in light yellow. Figure 5 (right) shows the final binary classification outcomes using as a threshold the value 0.7. Pixels identified as ‘ceramics’ (class 1) are shown in darker shades. The red square indicates the boundaries of the area of interest.
As the area of interest (Area 20) was relatively homogenous, with no significant noise (except for certain spots with low vegetation, see Figure 4, left), the fragmented ceramics were easily marked during image interpretation for the needs of the training purposes. In addition, the background noise was relatively uniform (white textured soil), minimising potential errors in the classification process.
The results, after converting the raster binary classification into vector point data, are shown in Figure 5 (right). Using the GIS environment (ArcGIS Pro), it was calculated that the overall number of fragmented surface ceramics in Area 20 is 383, while the pedestrian survey results reported 300 counts. Thus, the correspondence between the image-based approach with the data recovered by the archaeological field-team was more than 78%, providing a high level of agreement with the field-surface datasets. However, we should also note that this difference in the number of potsherds counted through both methods is minimal, considering that a field-walker, even in cases when members of a field-team are spaced at 5 m from each other, has an effective high-resolution visibility of only 1–2 m in width [2]. Therefore, in terms of observable variable against predicted value we have the following numbers: observable variable from foot surveys equals to 300 ceramics, however the predicted number of ceramics—given the foot survey characteristics—raises this number to 375. This number is close to the number detected by the random forest classification (97% match).
In addition, the density of the sherds detected in these areas can be calculated using spatial analysis tools in the GIS environment. A higher density of potsherds is highlighted in Figure 6 with dark purple colour.

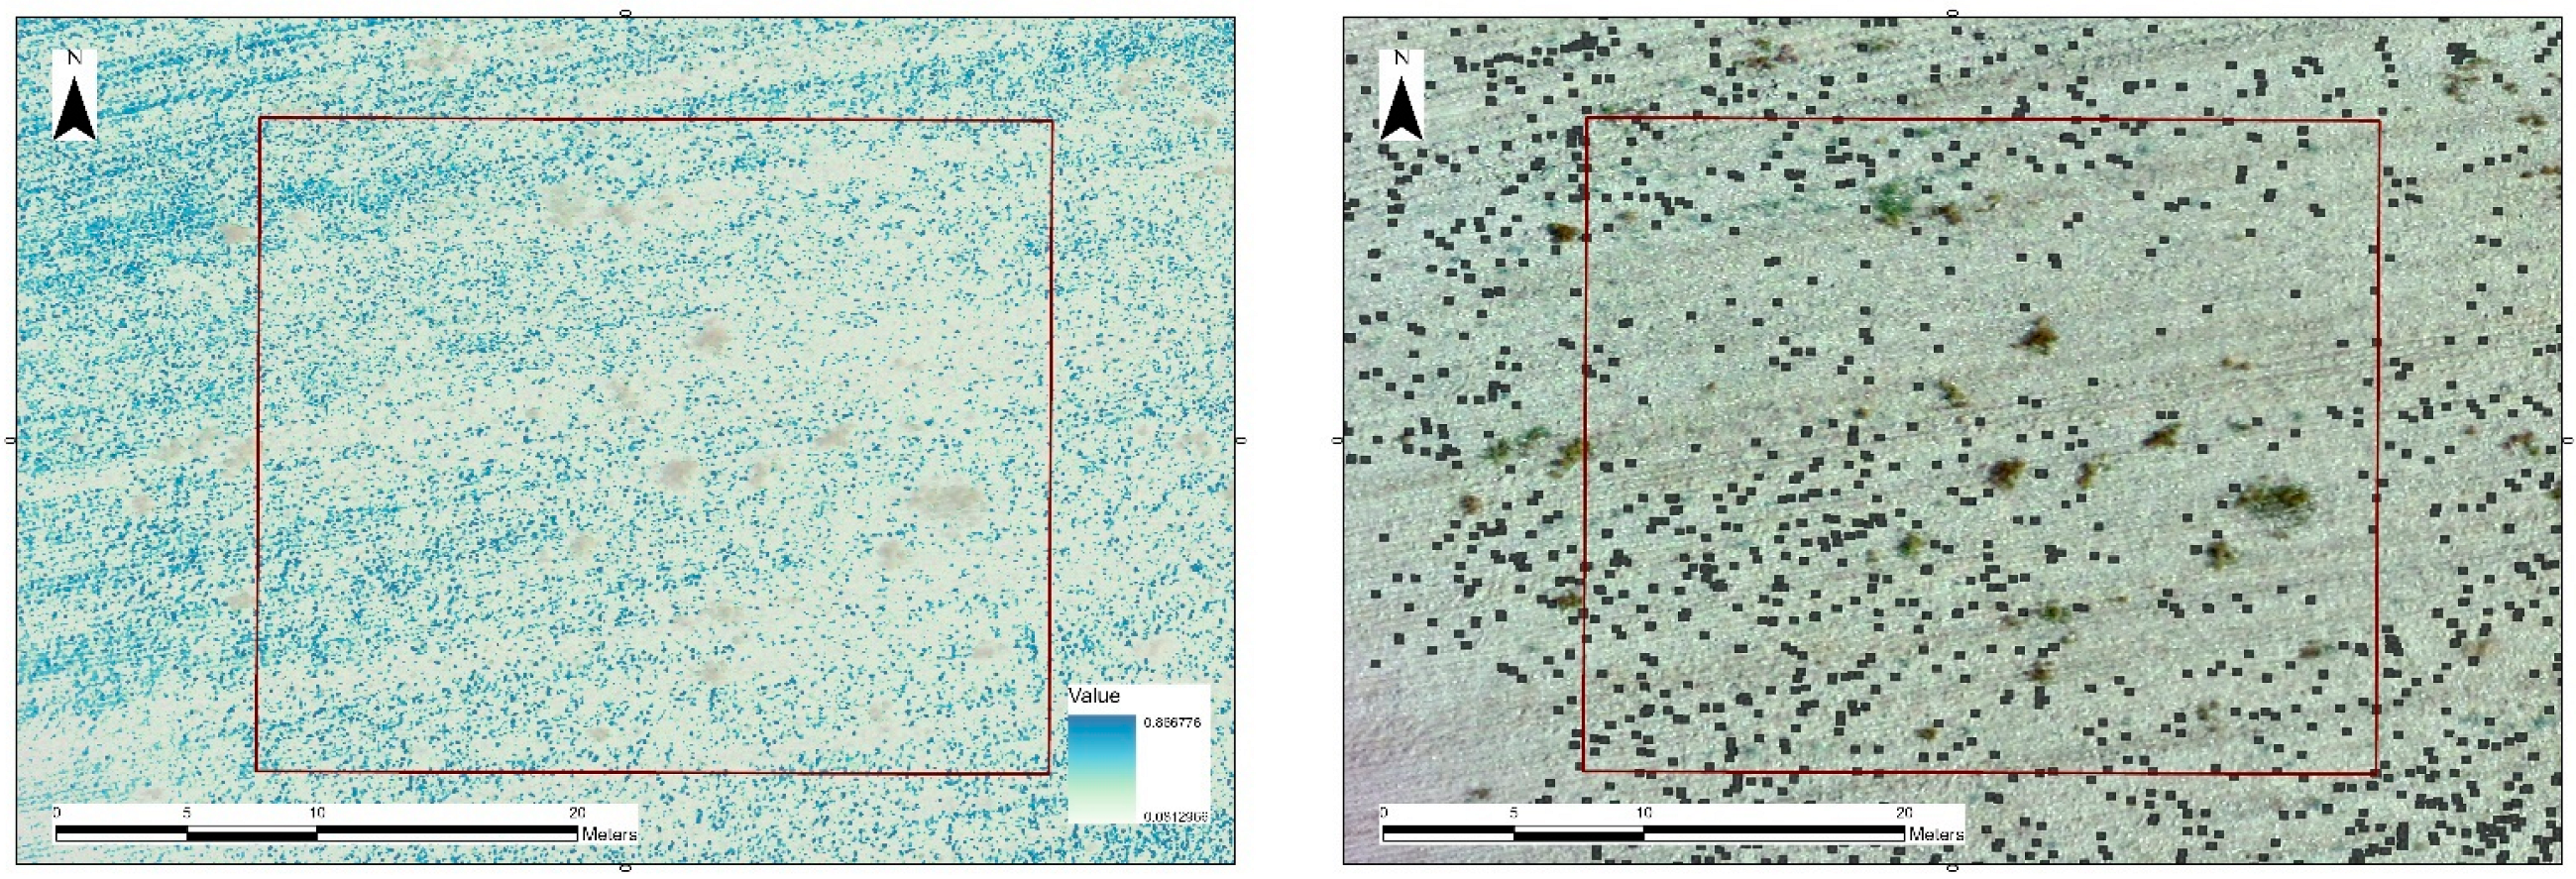
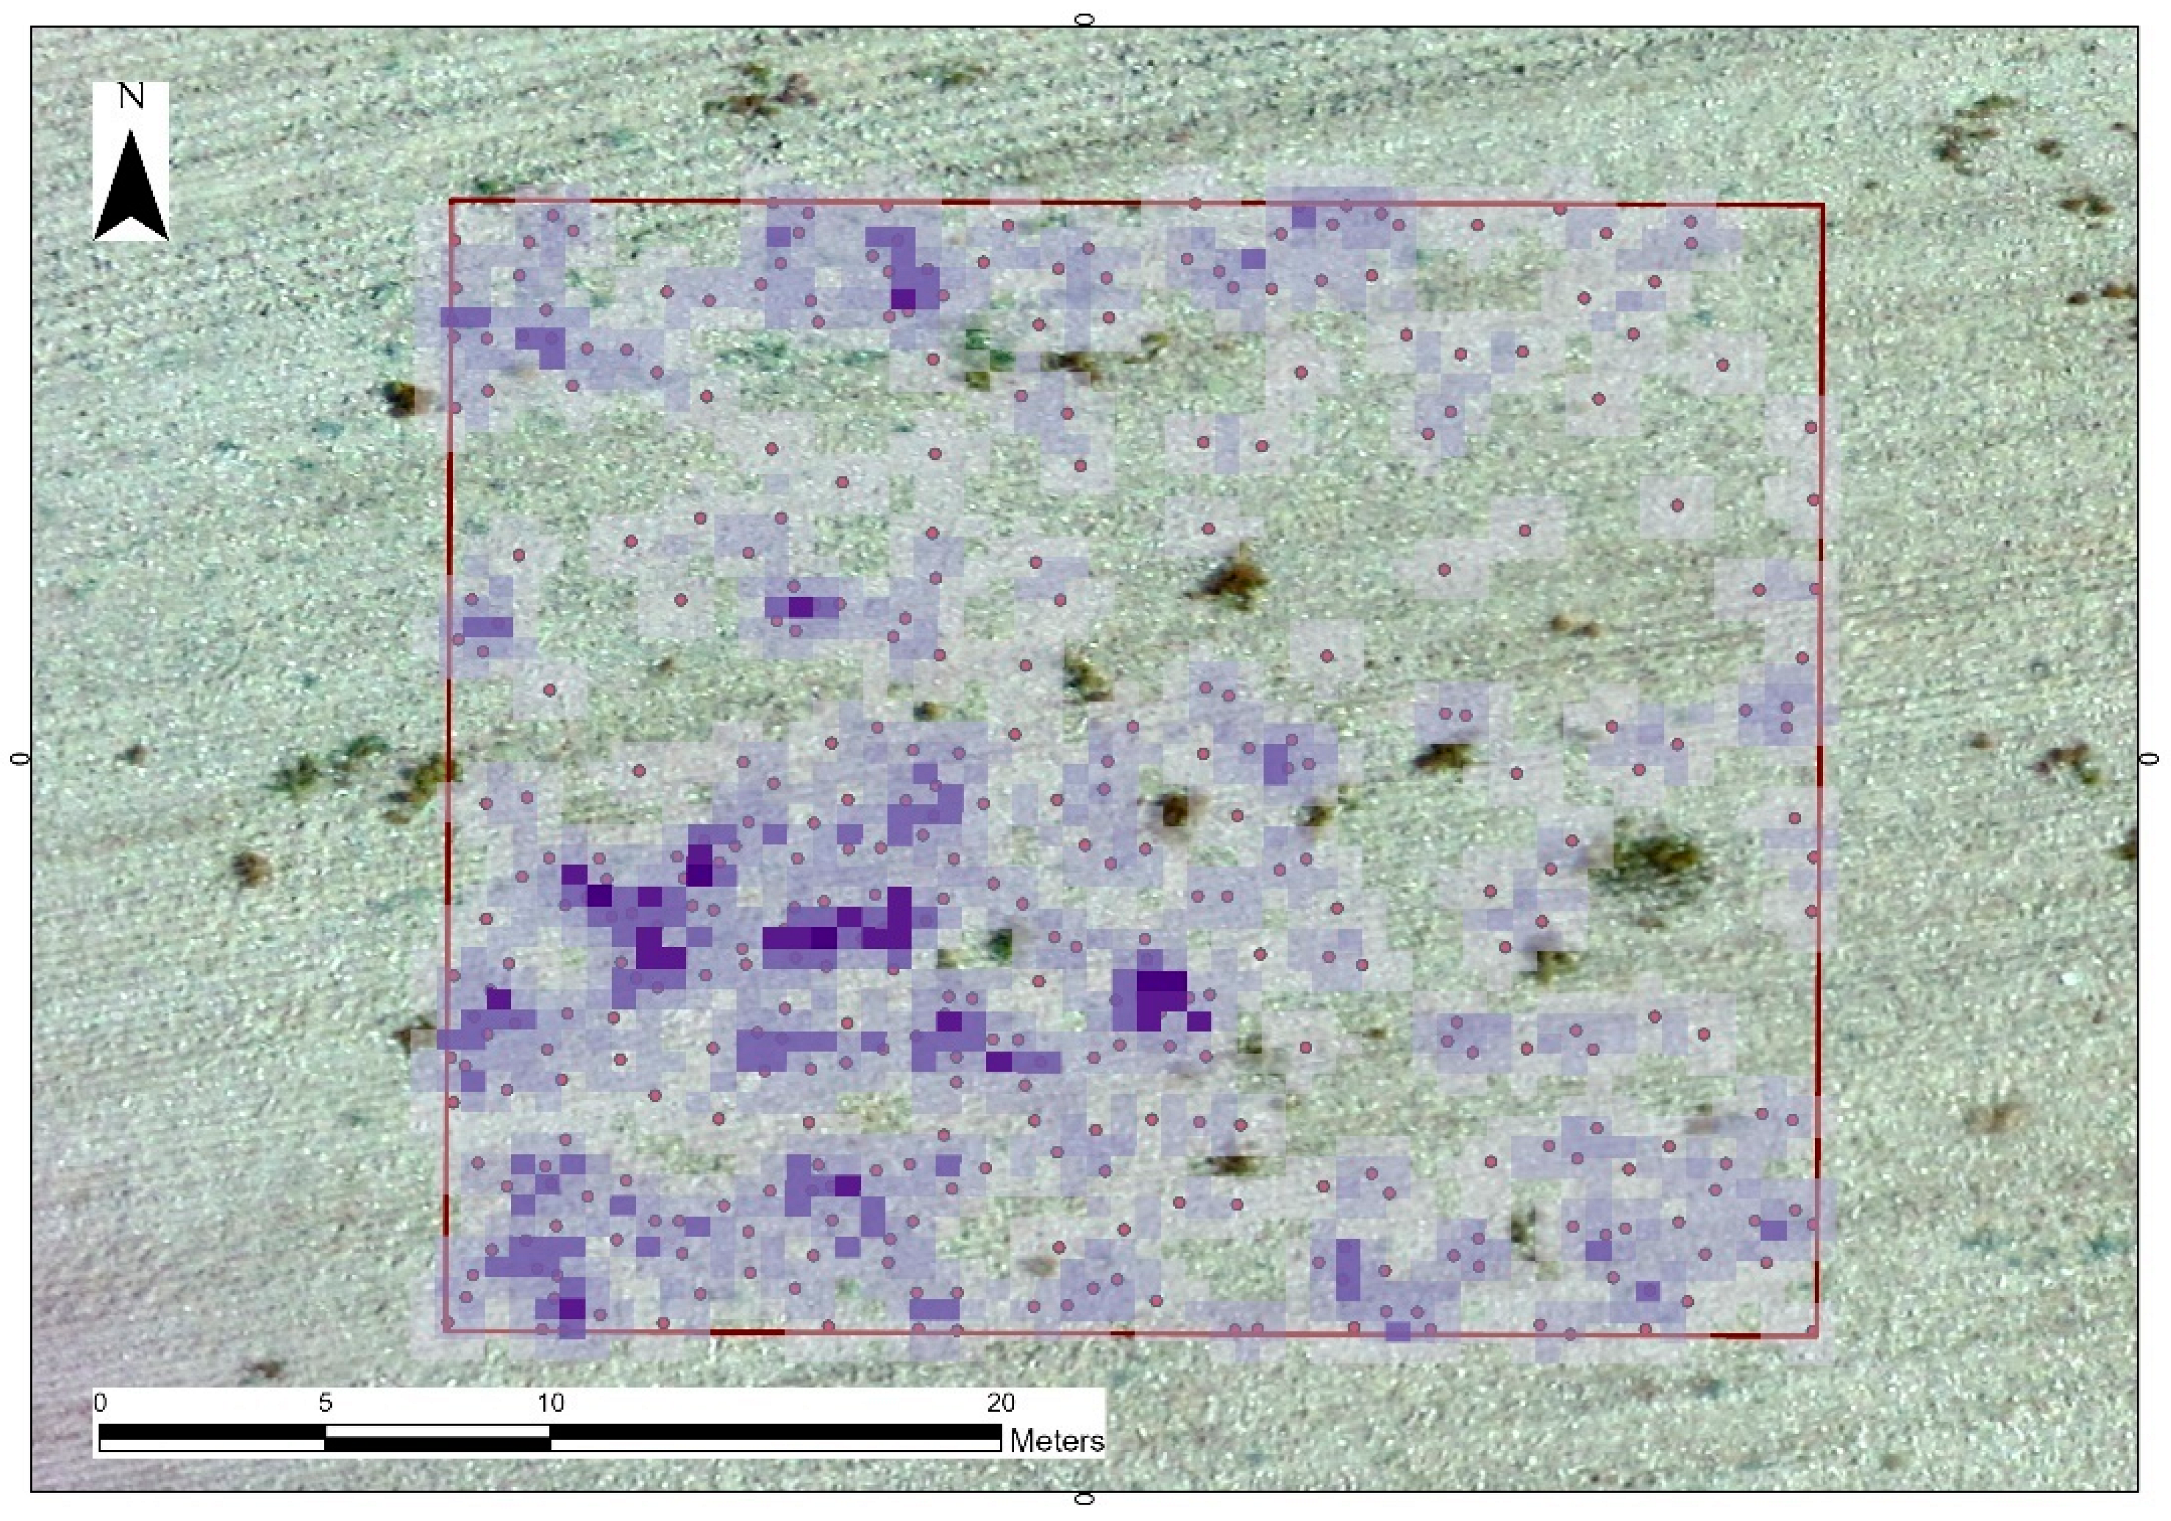
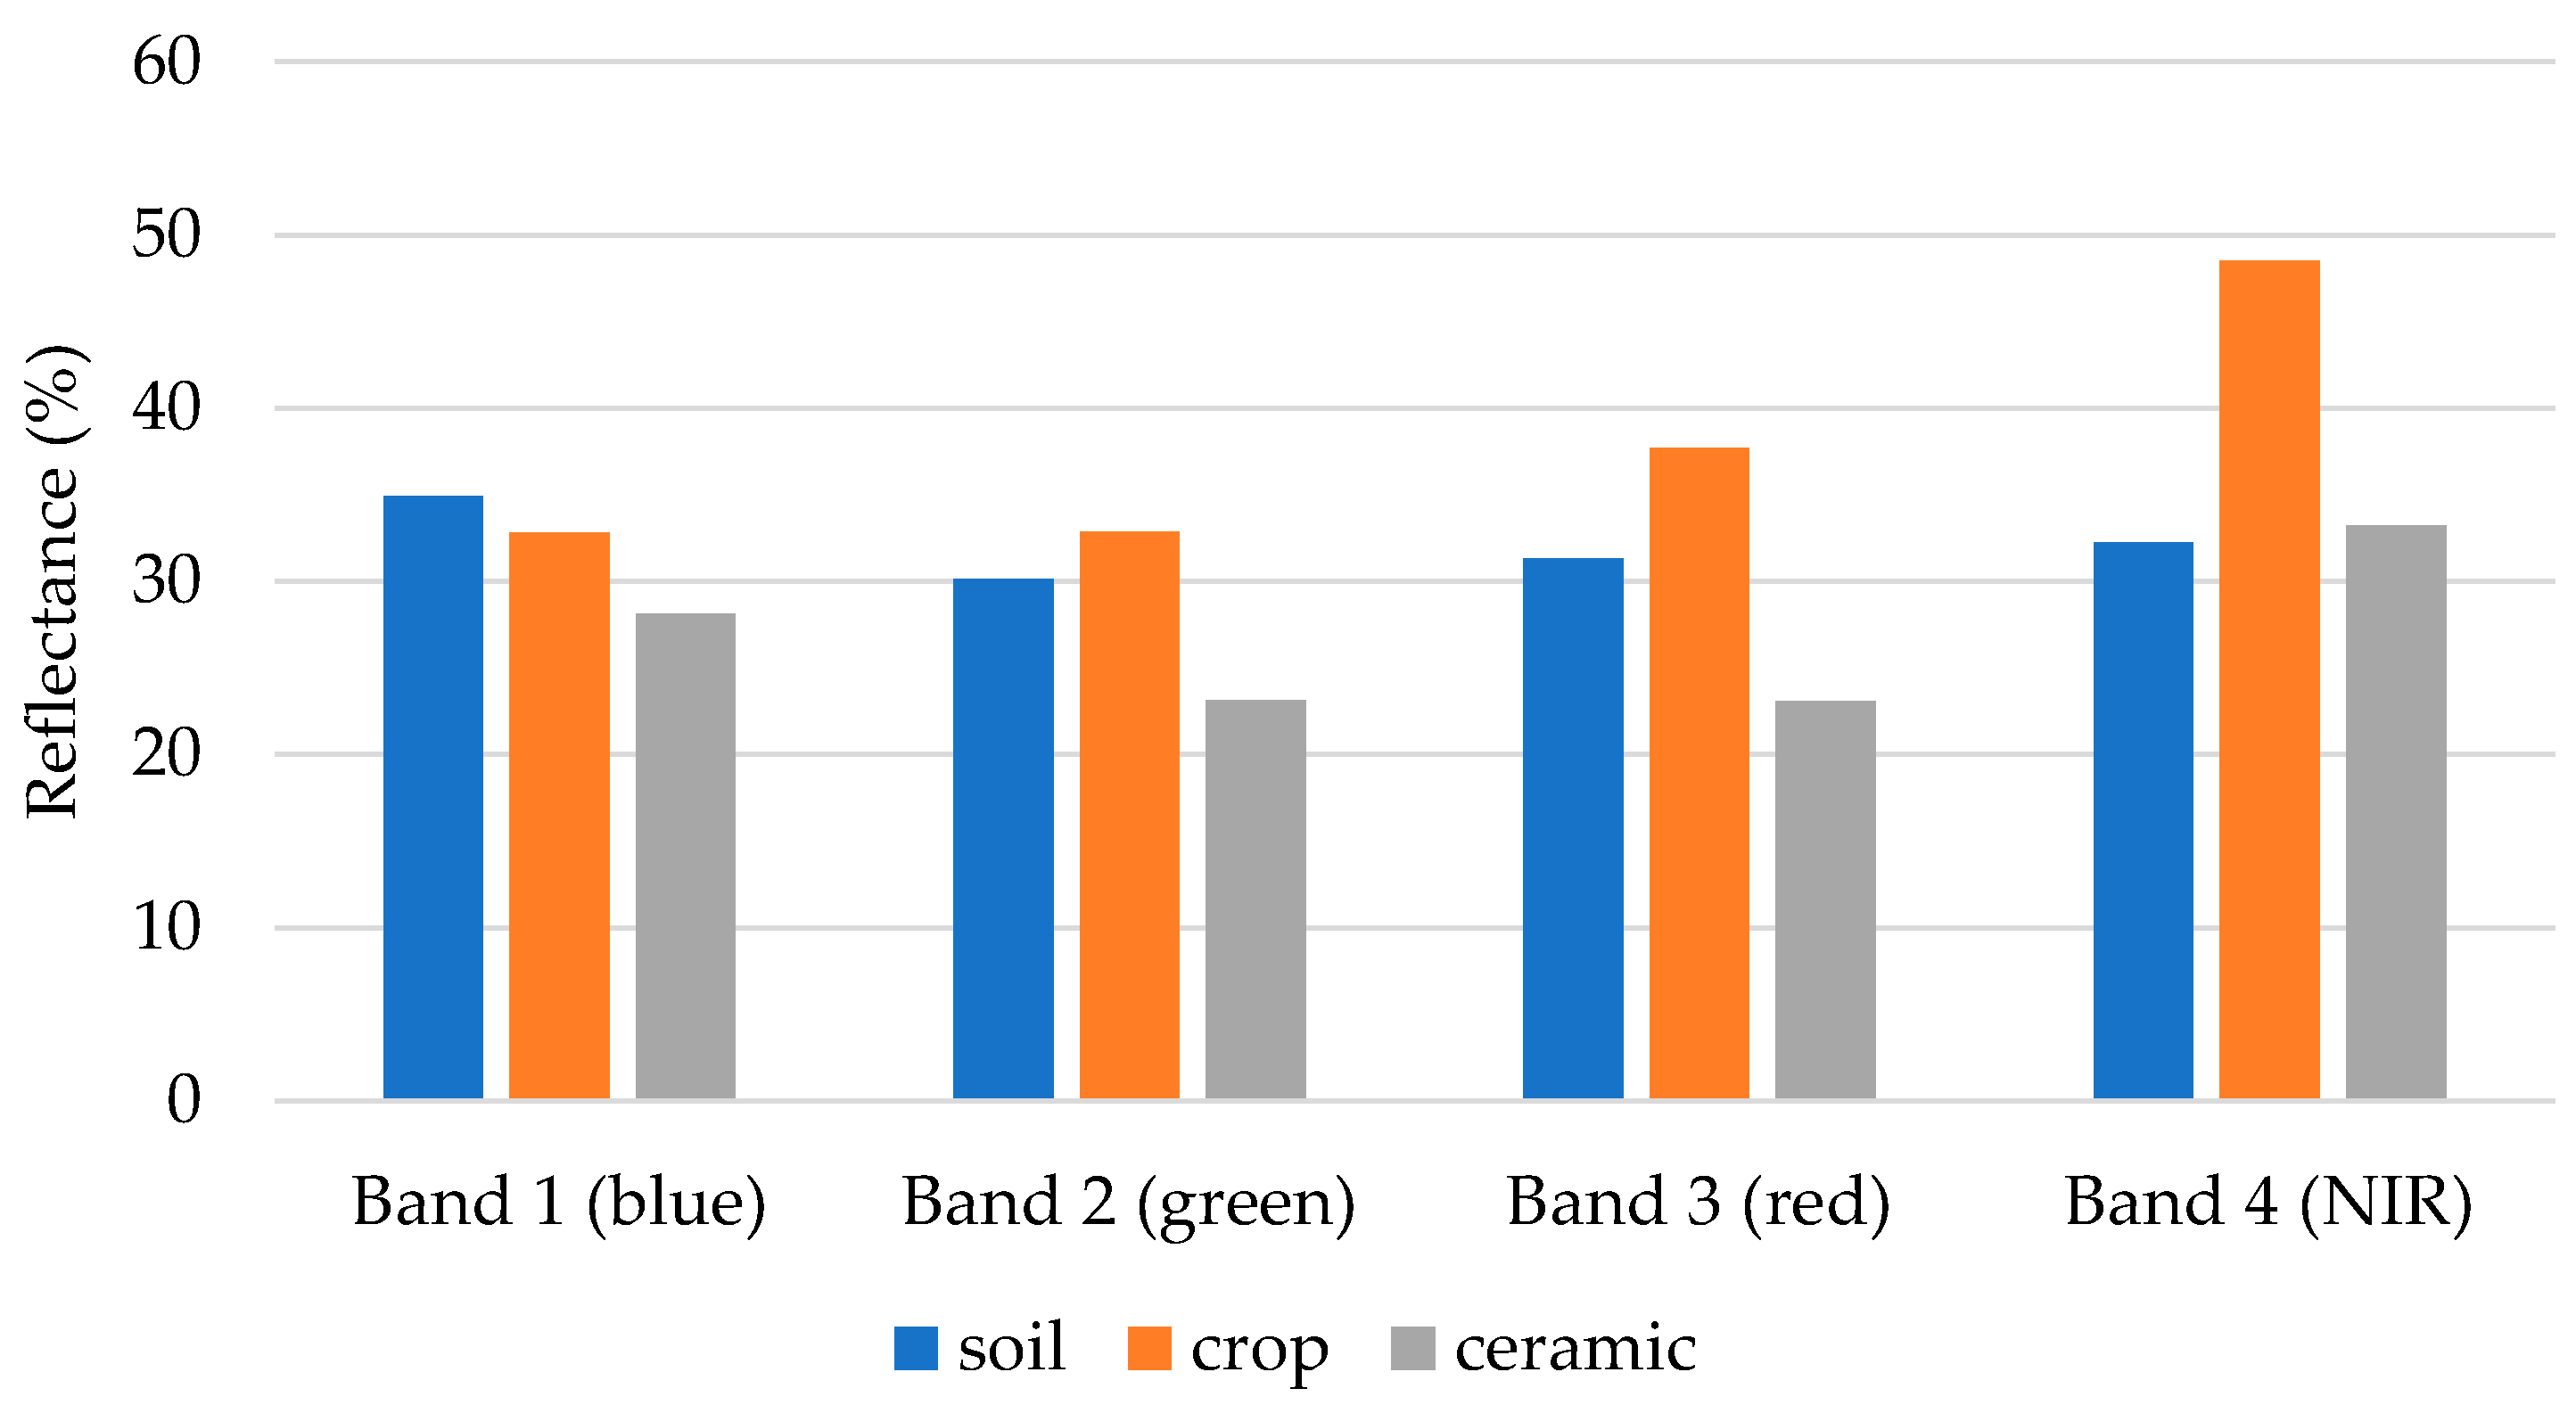
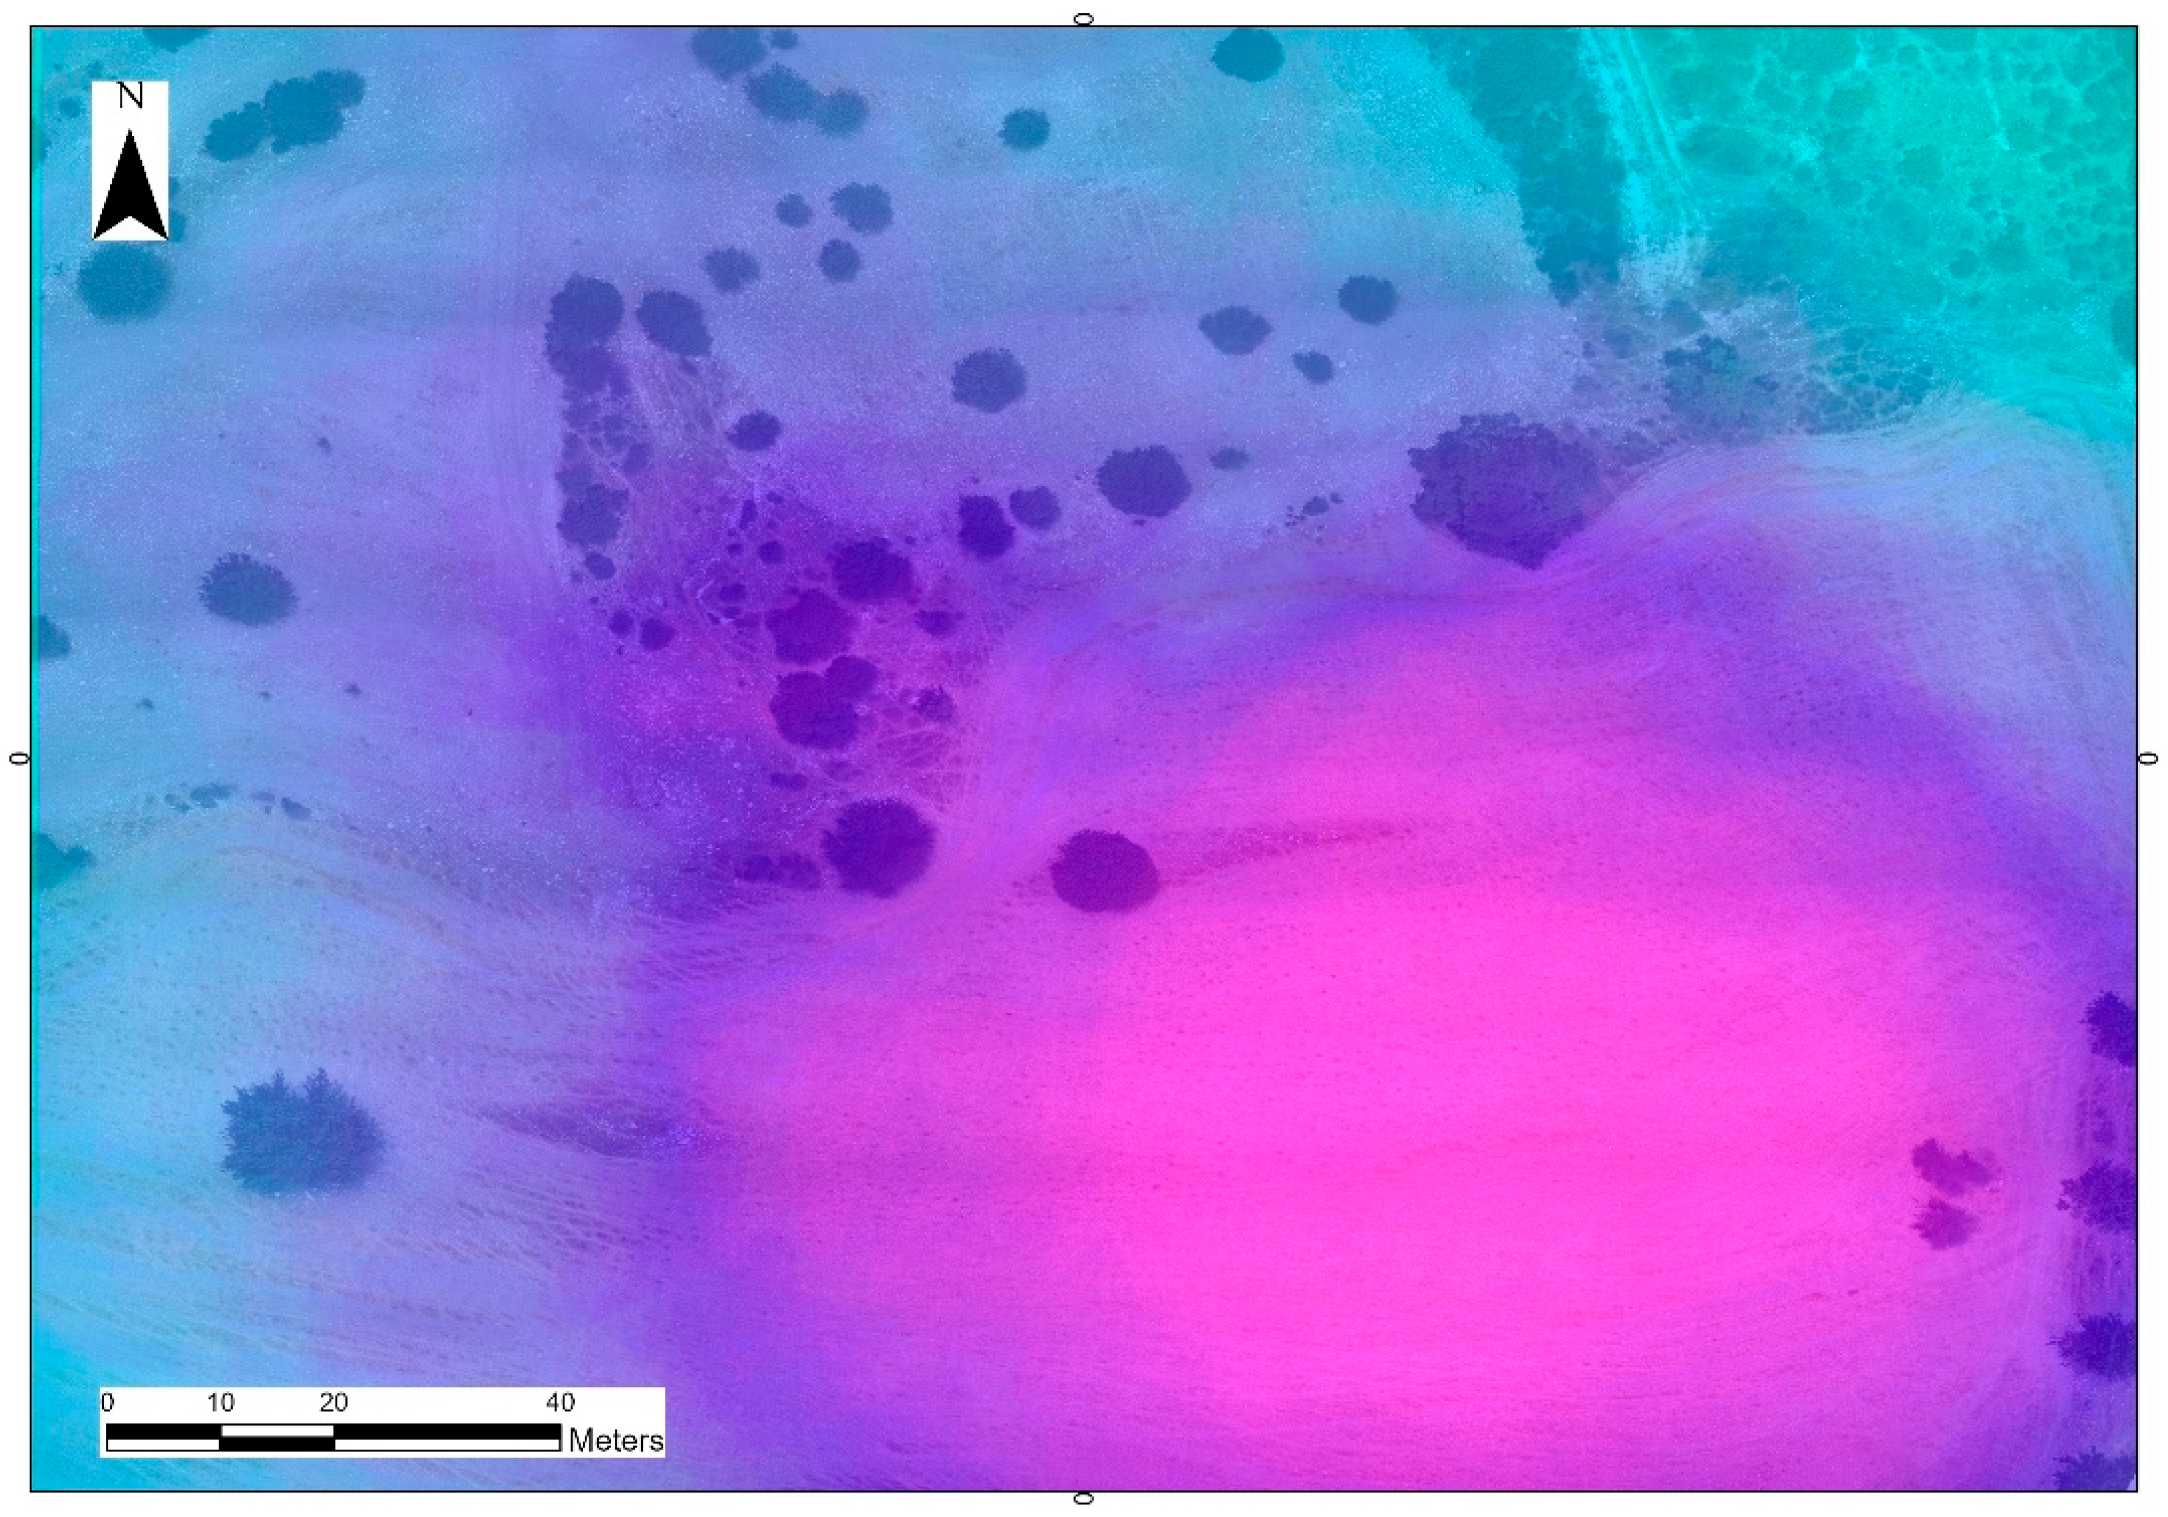
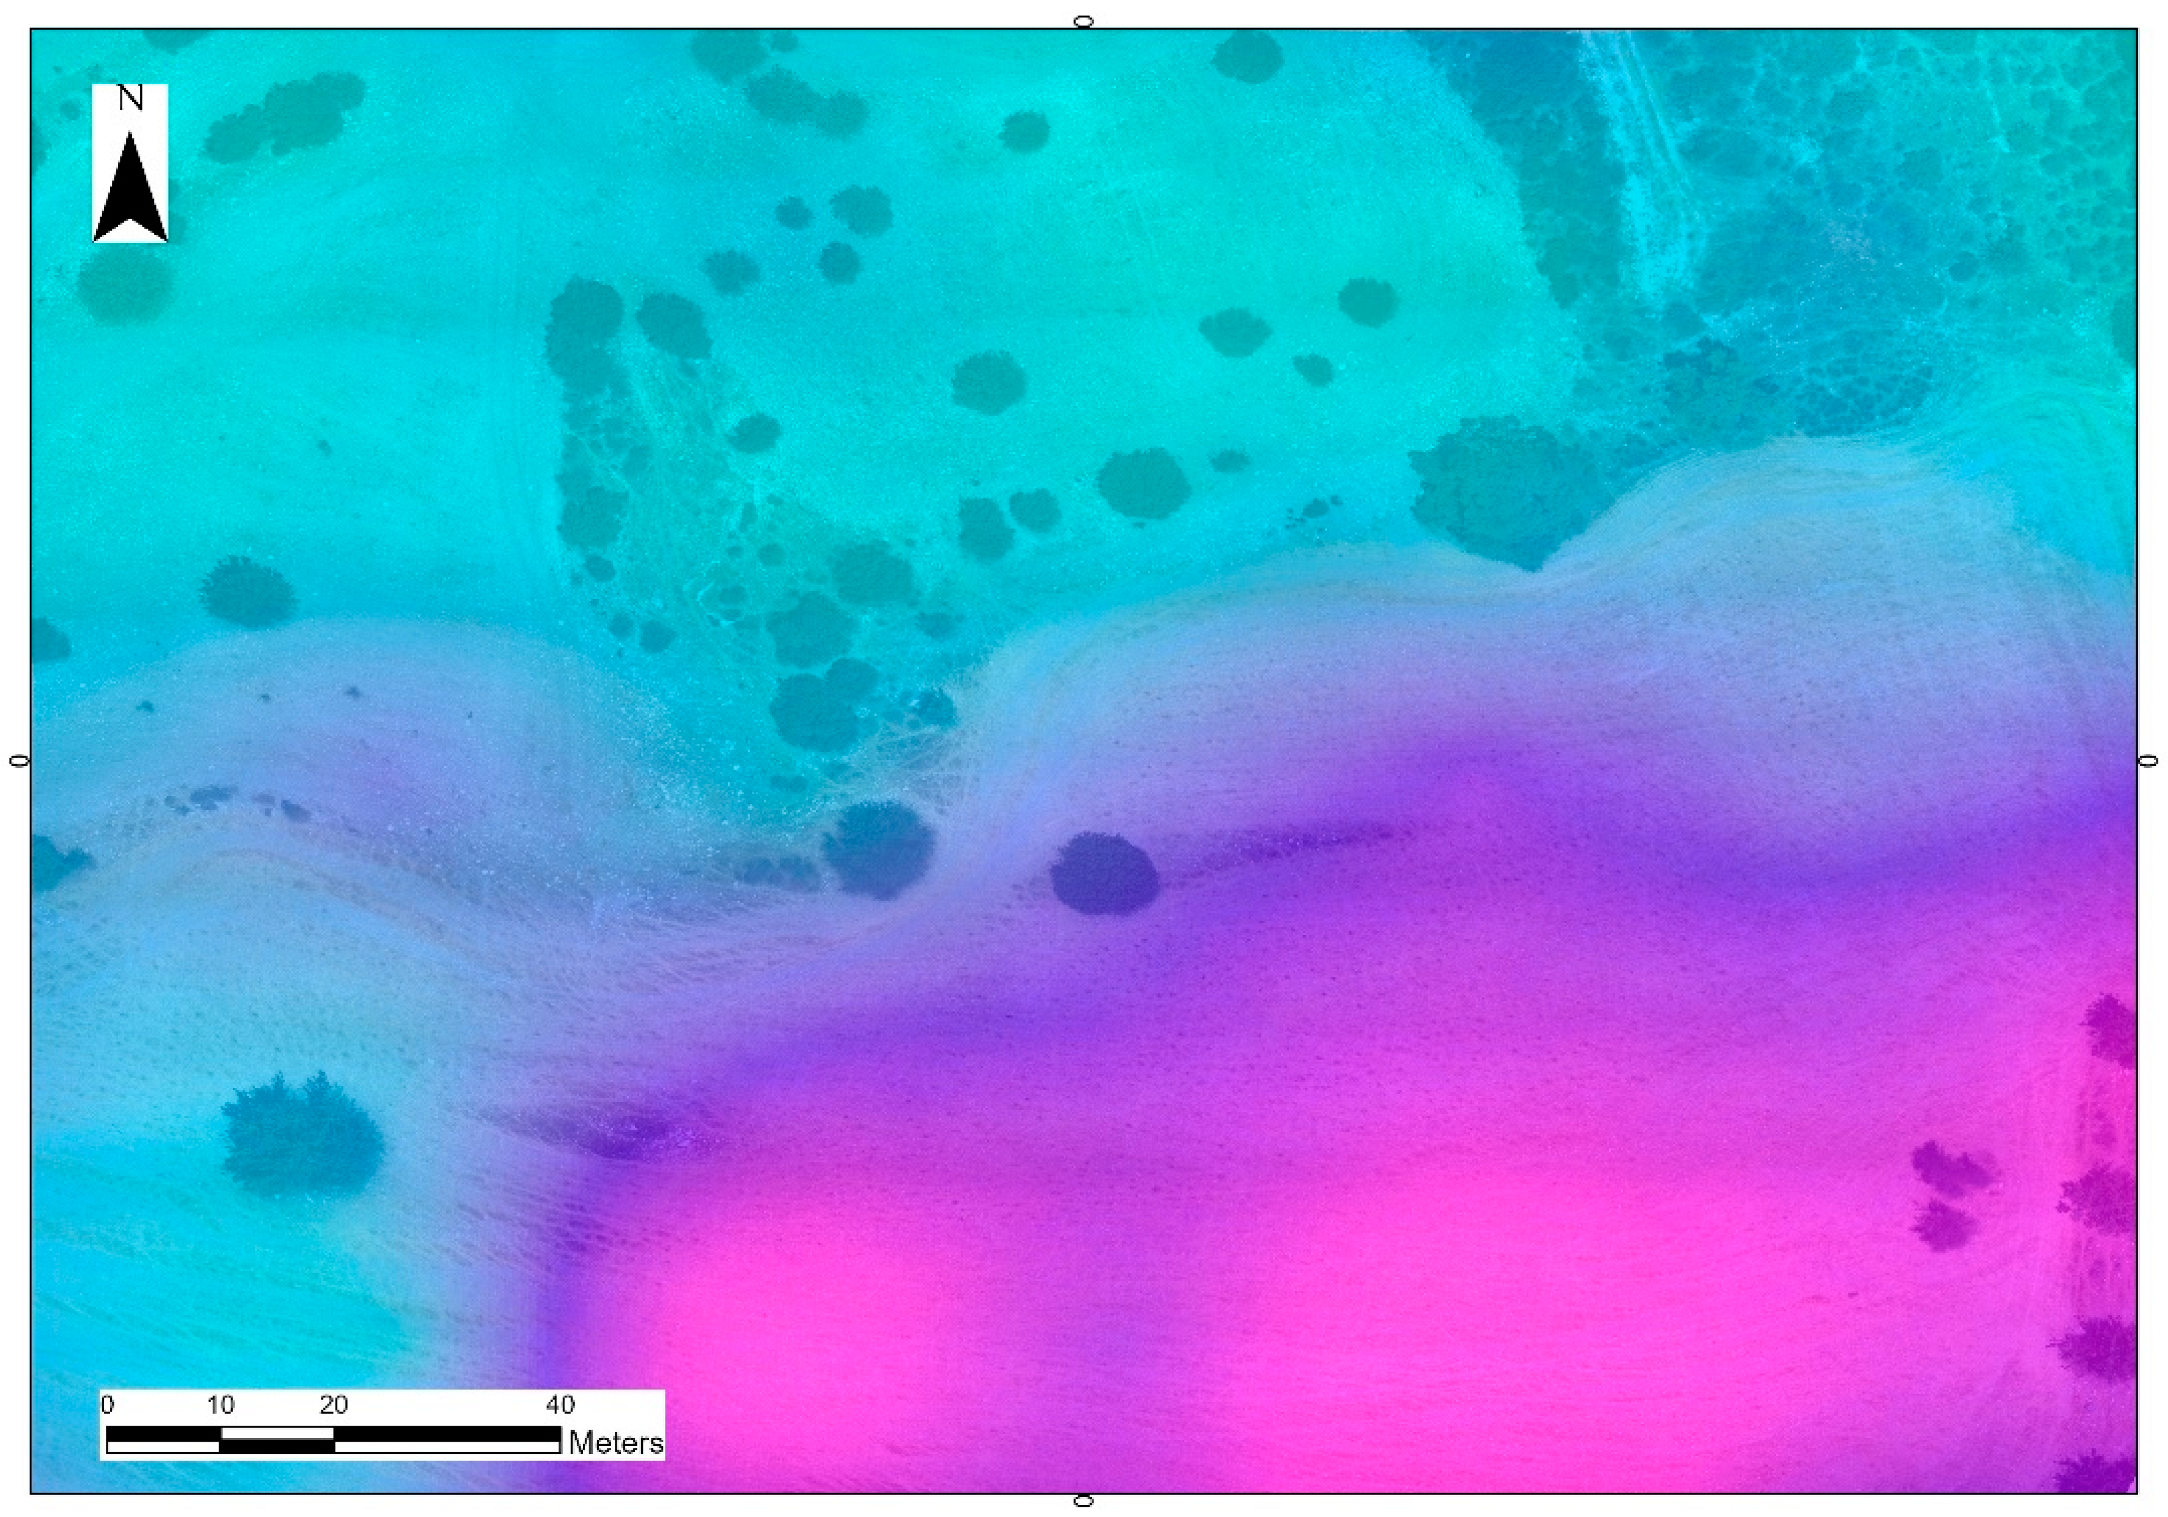
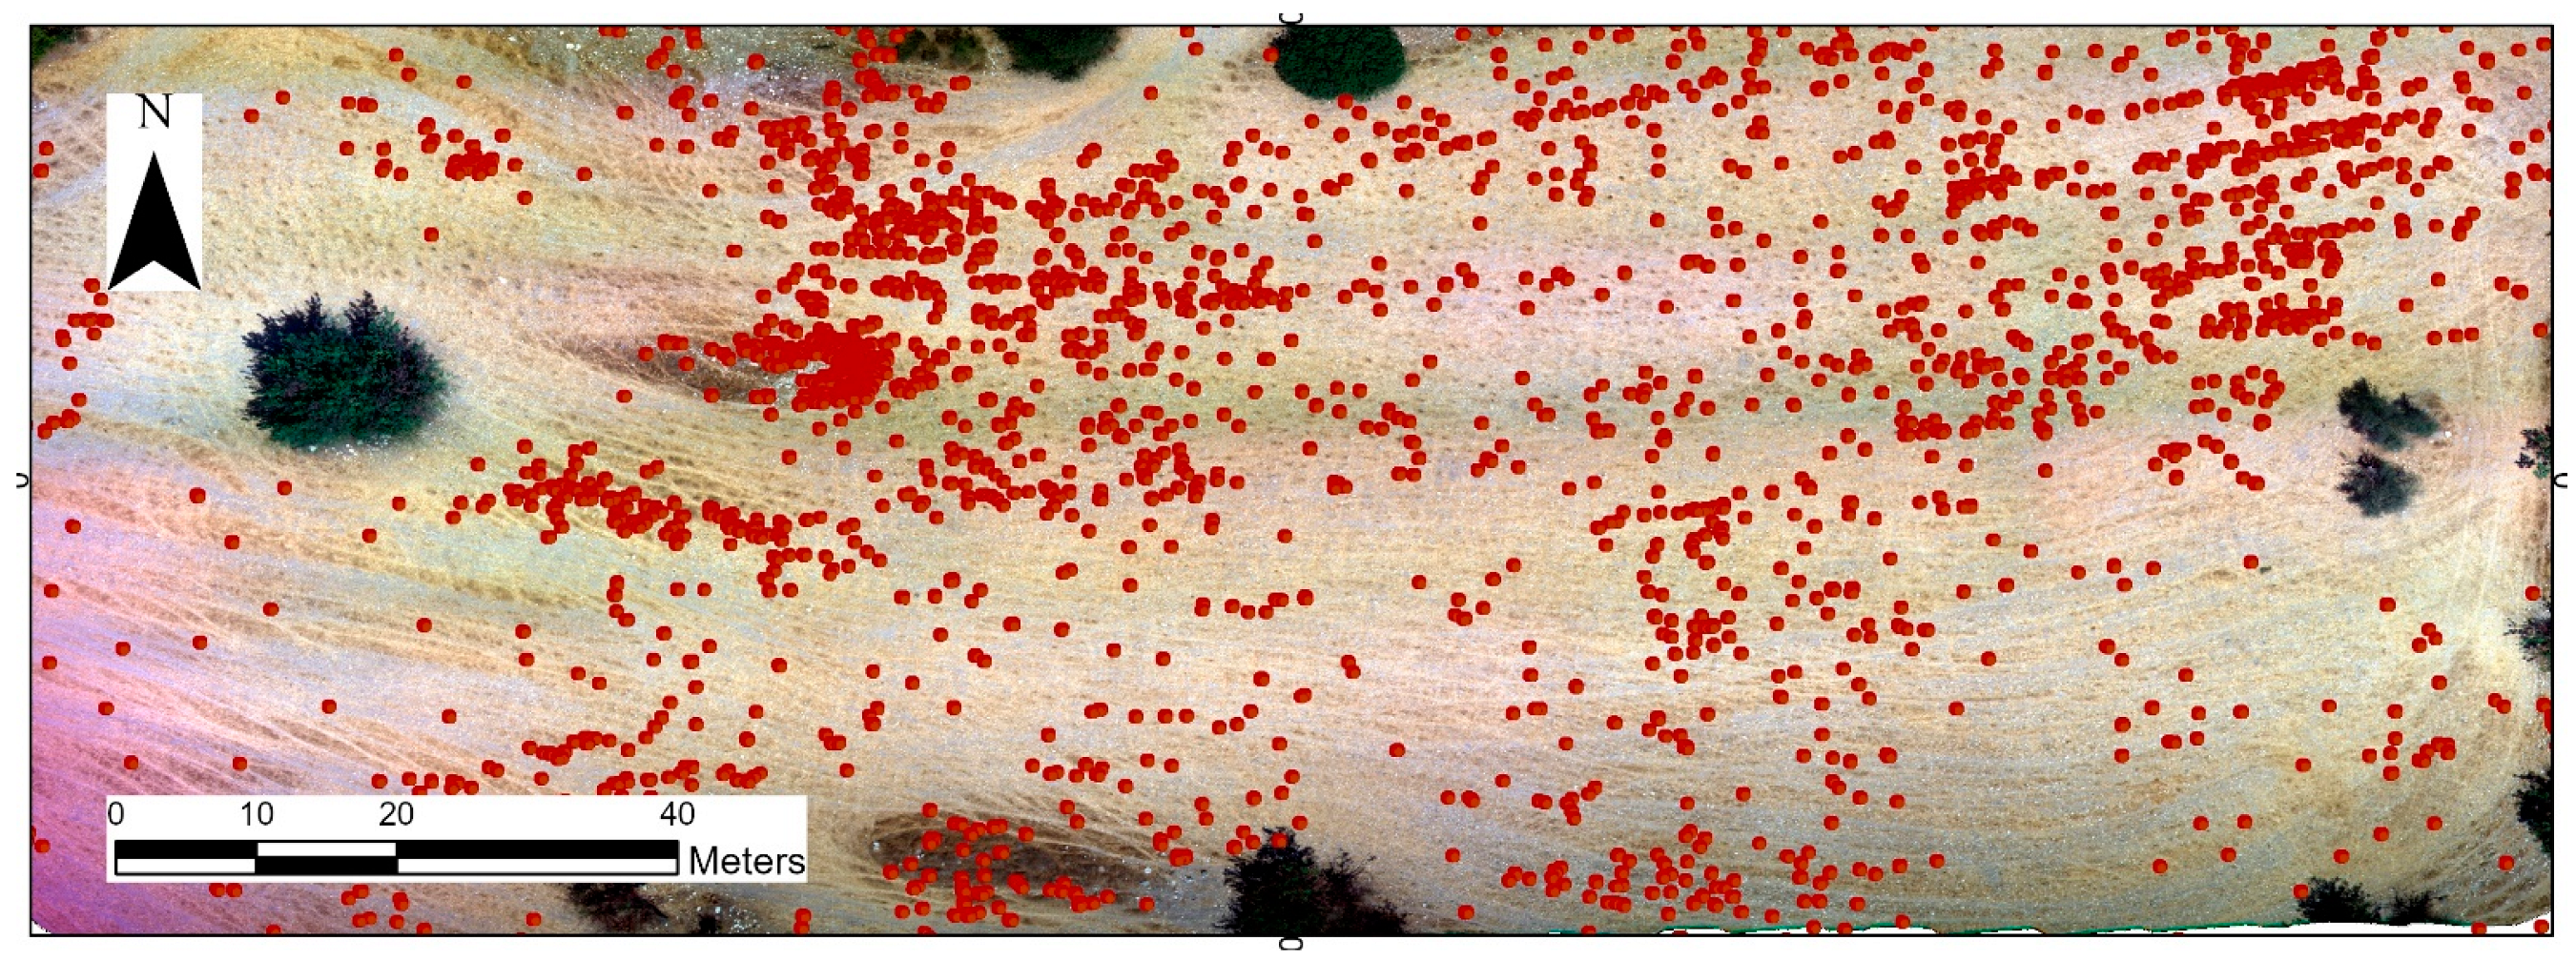
3.2. Detection of Potsherds in High-Resolution Multispectral Mosaic (Area 6)

In the second case study (Area 6), an initial approach as those of Area 20 was implemented using the RGB orthophoto. However, the results were not encouraging, as the false detection rate—compared to the ground truthing—was very high. The results from this analysis are shown in the Annex (Figure A1 in Appendix A). The low performance of the approach, was already indicated in the work of [16] and can be associated with the different environmental and archaeological context of Area 6 (see also Section 4).
To further investigate the potential detection of archaeological surface ceramics, an alternative approach was investigated here, as already described before. Instead of an RGB high resolution mosaic, a multispectral UAV orthomosaics was analysed in the ArcGIS Pro environment, using deep learning approaches. In this area, the Single Shot Detector neural network algorithm was applied. This method uses a fully convolutional approach in which the network can identify all objects within the image in one pass, using a pre-trained image classification network [40]. Examples from the training process are shown in Figure 7. The authors have manually selected ground-truthing, while the prediction images show the results after the overall training. On the top left of Figure 7, we can see a true–false example, while a false–true detection is shown on the top right of Figure 7. In the rest of the examples given in Figure 7, we can observe a true–true detection. As stated above, this process was repeated several times by selecting appropriate samples from the multispectral image. In addition, in the case of the Single Shot Detector, we only used a single class (‘ceramics’), in contrast to the previous example (in Area 20), where we used two classes (‘ceramics’ and ‘other’).
Once we trained the detector using images’ samples, the algorithm was applied to the whole dataset. The outcomes of this analysis are shown in Figure 8. Potsherds are shown as red dots, whereas the different colours indicate the confidence value of the detection. More than 300 potsherds were found scattered mainly on the southeast corner of the area of interest. In contrast, the results from the pedestrian field-survey indicated a rather more significant number of potsherds (observed ceramics through foot surveys: 2406, predicted count for ceramics for the area: 3007). This difference observed between the detection and the ground truthing is discussed in the following section.

4. Discussion

The results from Area 20 confirm previous outcomes and attempts by Orengo and Garcia-Molsosa [16]. For the specific case study, we have replicated the approach proposed by them [16], and the findings presented are very close to the results reported for plot 591 (see results and discussion section in [16]). Therefore, the analysis of the sampled unit in Area 20 in the Xeros valley confirms—in a different environment and archaeological context from the one used in [16]—that automatisation and machine learning approaches can be used to detect scattered potsherds. However, as also noted by [16], limitations still exist, and further improvements can be made, which has been also reported for the Area 6.
In this direction, we have used a multispectral camera instead of an RGB sensor, aiming to capture the near-infrared part of the spectrum. Near-infrared has been widely used for agricultural [41] and archaeological purposes, especially for detecting archaeological cropmarks [42,43,44,45,46]. In addition, a deep learning method is applied, aiming to detect potsherds automatically in a single class. Despite the several attempts made through the parametrisation of the Single Shot Detector algorithm and the training samples, the detection rate remained relatively low compared to the ground-truthing record (300 against 2406 potsherds in Area 6). Table 1 summarizes the results (detection of ceramics) per case study.
The differences observed in Table 1 for Area 6, between the image processing results and the ground-truthing probably link with two parameters. The first regards the spatial resolution of the multispectral mosaic, which was estimated at 9.5 cm. This resolution could be improved by shifting the height of the flight (from approximately 20 m to 10 m above the surface). However, this would affect the size of the coverage in a single flight. The second, more critical, aspect concerns the potsherds (spectral) signatures in the ground surface of Area 6, where their reflectance is not so distinguishable from the colour of the soil in the background (in contrast to Area 20). That is, Area 20 comprises a multi-period site, with the majority of the surface ceramics dated to the Early Middle Bronze Age; the colour of Cypriot Bronze Age pottery ranges from dark red to brown, thus, very different and distinguishable from the local soil (pale/light brown during the dry summer months). Along with fragments of Bronze Age pottery, potsherds of other periods present in Area 20, including coloured glazed-wares of the medieval to early modern eras, constituting a multi-coloured carpet of scattered ceramics that are notably different from the soil in the background. On the contrary, Area 6 comprises a single-period site, dated to Late Antiquity, with a large concentration of well-fired table- and storage-wares in two or three main fabrics, the colour of which ranges from pale orange to light brown, thus remarkably similar to the colour of the soil.
Figure 9a shows a sample of unwashed potsherds found scattered in Area 6, collected during the UAV flight campaign of 2021, while Figure 9b–e show the reflectance of the image, at the blue (Figure 9b), green (Figure 9c), red (Figure 9d), and near-infrared (Figure 9e) bands, as captured from the DJI P4 Multispectral system. The spectral confusion between the potsherds with the background soil is evident in the diagram of Figure 10. The diagram shows the backscattered reflectance of three main classes of the area, namely soil, crops, and ceramics (potsherds), over the different parts of the spectrum (blue–green–red–near infrared). The spectral distance of the ceramics with the rest of the classes is relatively low, less than 10% (e.g., ceramics and soil at band 4), thus, prohibiting a clear spectral pattern of surface ceramics for the given Area.
Despite this limitation, it should be emphasised that the spectral confusion between potsherds and the background soil is not uncommon in archaeological research. We should note here that the same confusion is sometimes noted amongst field-walkers, when vegetation cover, geological materials (e.g., stones and pebbles), and, most importantly, dust and light confine potsherd visibility [2]. Therefore, the detection of potsherds through high-resolution images could be further improved by expanding the spectral capacity of the camera sensors.
Beyond the total number of ceramic fragments counted through the different methods, the distribution of potsherds can be estimated from the image analysis. The distribution of potsherds and their density across the surface of Area 6 is shown in Figure 11. A higher concentration of the detected potsherds is indicated in purple in Figure 11, while the thinner density of potsherds is highlighted in blue. As evidenced from this analysis, a high density, indicating a higher number of surface potsherds, is mapped in the southeast part of the unit under investigation, covering almost one-quarter of the total surface. On the contrary, the northern half of the unit in Area 6 presents a very low concentration. A remarkably similar pattern is reported from the archaeological field-survey, as shown in Figure 12. This conclusion is highly important as, despite the relatively small number of potsherds detection using the Single Shot Detector algorithm, the distribution of the surface finds is very similar to the situation recorded by the team of archaeologists during field survey, enabling further experiments and improvements in the future.

5. Conclusions

The aim of this study has been to investigate the potential of RGB and multispectral high-resolution UAV orthomosaics to detecting fragmented ceramics at archaeological sites or larger areas of potential archaeological interest. Thus, advanced image processing methods have been implemented, namely the random forest classifier (for Area 20) and Single Shot Detector (for Area 6). The overall results were compared with the archaeological surface-survey records.
For Area 20, a similar approach proposed by Orengo and Garcia-Molsosa [16] was adopted and implemented. The results were found very encouraging as the overall detection rate was nearly 80%, and more than 97% if we consider the predicted counts given the foot survey properties (i.e., distance of the members of the field team). On the contrary, the detection rate at Area 6 was relatively low. This can be explained through two different reasons, as elaborated above (see Discussion), indicating that the archaeological context and the spectral similarity of the fragments can play a critical role in the overall accuracy.
Nevertheless, an interesting outcome was the image-based approach’s ability to define potsherd distribution over Area 6 remarkably successfully, despite the confined number of detections. The simulated distribution (Figure 11) fits well with the ground-truthing outcomes (Figure 12).
The overall findings, along with those published by Orengo and Garcia-Molsosa ([16] and [38]), showcase that low altitude remote sensing sensors can be revolutionary in the domain of archaeological field survey. Such methodologies have the great potential to support future archaeological field projects by being truly cost-effective, especially in cases when there is a limited research timescale and an urgent need for recording fast disappearing archaeo-landscapes due to modern development in the Euro-Mediterranean region. However, preparations should be taken before flight operations with the UAV sensors (e.g., spatial resolution, the spectral resolution of the camera, etc.) and during image analysis for ceramic detection.
Further improvements can be made in this direction in the future, enabling the coverage of even larger areas with a higher success rate. Potsherd detection can be further increased by developing sophisticated remote sensing algorithms for better spectral enhancement, minimising background noise. In addition, light detection and ranging (LiDAR) or colour-infrared (CIR) datasets collected from UAV sensors can be further elaborated, as this approach can provide centimetre 3D products, corresponding thus to practical needs of archaeological surveys and documentation practices.

Author Contributions

Conceptualisation, A.A. and A.V.; methodology, A.A.; software, A.A.; validation, A.A., A.V. and G.P.; formal analysis, A.A., A.V. and G.P.; investigation, A.A. and A.V.; resources, A.A., A.V. and G.P.; data curation, A.A., A.V. and G.P.; writing—original draft preparation, A.A.; writing—review and editing, A.A., A.V. and G.P.; visualisation, A.A.; project administration, A.A., A.V. and G.P.; and funding acquisition, A.A., A.V. and G.P. All authors have read and agreed to the published version of the manuscript.

Funding

Part of this work falls under the Unlocking the Sacred Landscapes of Cyprus (UnSaLa-CY) research project, co-funded by the European Regional Development Fund and the Republic of Cyprus through the Research and Innovation Foundation (EXCELLENCE/1216/0362).

Institutional Review Board Statement

Not applicable.

Informed Consent Statement

Not applicable.

Data Availability Statement

The Random Forest classifier implemented in the Google Earth Engine can be accessed through the work of Orengo and Garcia-Molsosa [16], while the Single Shot Detector was implemented within the ArcGIS Pro environment. The RGB mosaic of the Xeros area can be accessed upon request to A.V., (created under the UnSaLa-CY and SeSaLaC projects) while the multispectral imagery can be accesses upon request to A.A. (created under the ENSURE project).

Acknowledgments

The authors would like to acknowledge Vasilis Trigkas for his support in surveying Area 20 using the RGB camera sensor, Michalis Christoforou for the multispectral data collection over Area 6 and Dimitris Kakoullis for the multispectral image processing of the mosaic of Area 6. A.A. would like to acknowledge the ENSURE project (Innovative survey techniques for detection of surface and sub-surface archaeological remains, CUT internal funding). A.V. also acknowledges the assistance and collaboration of Charalambos Paraskeva, manager of the UnSaLa-CY and SeSaLaC databases.

Conflicts of Interest

The authors declare no conflict of interest.

Appendix A

Figure A1. Potsherd detection (points) using the Single Shot deep learning algorithm over Area 6 (southern part) (top) and the relevant results from the random forest classification (bottom).
Land 10 01365 g0a1aLand 10 01365 g0a1b

References

  1. Renfrew, C.; Bahn, P. Archaeology: Theories, Methods and Practice; Thames and Hudson: London, UK, 1991. [Google Scholar]
  2. Attema, P.; Bintliff, J.; van Leusen, M.; Bes, P.; de Haas, T.; Donev, D.; Jongman, W.; Kaptijn, E.; Mayoral, V.; Menchelli, S.; et al. A guide to good practice in Mediterranean surface survey projects. J. Greek Archaeol. 2020, 5, 1–62. [Google Scholar] [CrossRef]
  3. Fitzsimmons, E.K.; Stern, N.; Murray-Wallace, V.K. Depositional history and archaeology of the central Lake Mungo lunette, Willandra Lakes, southeast Australia. J. Archaeol. Sci. 2014, 41, 349–364. [Google Scholar] [CrossRef] [Green Version]
  4. Papantoniou, G.; Vionis, A.K. The river as an economic asset: Settlement and society in the Xeros valley in Cyprus. Land 2018, 7, 157. [Google Scholar] [CrossRef] [Green Version]
  5. Papantoniou, G.; Vionis, A.K. Landscape archaeology and sacred space in the Eastern Mediterranean: A glimpse from Cyprus. Land 2017, 6, 40. [Google Scholar] [CrossRef] [Green Version]
  6. Given, M.; Knapp, A.B.; Meyer, N.; Gregory, E.T.; Kassianidou, V.; Noller, S.J.; Wells, L.; Urwin, N.; Wright, H. The Sydney Cyprus Survey Project: An interdisciplinary investigation of long-term change in the north central Troodos, Cyprus. J. Field Archaeol. 1999, 26, 19–39. [Google Scholar]
  7. Bintliff, J.L. Beyond dots on the map: Future directions for surface artefact survey in Greece. In The Future of Surface Artefact Survey in Europe; Kuna, M., Venclová, N., Eds.; Sheffield Archaeological Monographs 13; Sheffield Academic Press: Sheffield, UK, 2000; pp. 3–20. [Google Scholar]
  8. Bintliff, J.L. Intra-site artefact surveys. In Good Practice in Archaeological Diagnostics: Non-Invasive Survey of Complex Archaeological Sites; Corsi, C., Slapšak, B., Vermeulen, F., Eds.; Springer International Publishing: Cham, Switzerland, 2013; pp. 193–207. [Google Scholar] [CrossRef]
  9. Alcock, S.E.; Cherry, J.F. Introduction. In Side-by-Side Survey: Comparative Regional Studies in the Mediterranean World; Alcock, S.E., Cherry, J.F., Eds.; Oxbow: Oxford, UK, 2004; pp. 1–9. [Google Scholar]
  10. Mayoral, V.; Barrera, F.B.; Barrera, C.B.; del Pozo, J.Á.M.; de Tena, M. The evolution of an agrarian landscape: Methodological proposals for the archaeological study of the alluvial plain of Medellin (Guadiana basin, Spain). In Landscape Archaeology between Art and Science; Kluiving, S.J., Guttmann-Bond, E., Eds.; Amsterdam University Press: Amsterdam, The Netherlands, 2018; pp. 97–114. [Google Scholar] [CrossRef]
  11. De Neef, W.; Armstrong, K.; van Leusen, M. Putting the spotlight on small Metal Age pottery scatters in northern Calabria (Italy). J. Field Archaeol. 2017, 42, 283–297. [Google Scholar] [CrossRef] [Green Version]
  12. Bintliff, J.L.; Howard, P.; Snodgrass, A.M. (Eds.) Testing the Hinterland. The Work of the Boeotia Survey (1989–1991) in the Southern Approaches to the City of Thespiai; McDonald Institute: Cambridge, UK, 2007. [Google Scholar]
  13. Bevan, A.; Connelly, J. Mediterranean Islands, Fragile Communities and Persistent Landscapes. Antikythera in Long-Term Perspective; Cambridge University Press: Cambridge, UK, 2013. [Google Scholar]
  14. Given, M.; Knapp, A.B.; Noller, J.; Sollars, L.; Kassianidou, V. (Eds.) Landscape and Interaction. The Troodos Archaeological and Environmental Survey Project, Cyprus. Volume 1: The TAESP Landscape; Oxbow: Oxford, UK, 2013. [Google Scholar]
  15. Caraher, W.R.; Moore, R.S.; Pettegrew, D.K. Pyla-Koutsopetria I: Archaeological Survey of an Ancient Coastal Town; American Schools of Oriental Research: Boston, MA, USA, 2014. [Google Scholar]
  16. Orengo, H.A.; Garcia-Molsosa, A. A brave new world for archaeological survey: Automated machine learning-based potsherd detection using high-resolution drone imagery. J. Archaeol. Sci. 2019, 112, 105013. [Google Scholar] [CrossRef]
  17. Murtiyoso, A.; Grussenmeyer, P.; Börlin, N.; Vandermeerschen, J.; Freville, T. Open source and independent methods for Bundle Adjustment Assessment in Close-Range UAV Photogrammetry. Drones 2018, 2, 3. [Google Scholar] [CrossRef] [Green Version]
  18. Pierrot-Deseilligny, M.; Clery, I. Apero, an Open Source Bundle Adjusment Software for Automatic Calibration and Orientation of Set of Images. Int. Arch. Photogramm. Remote Sens. Spat. Inf. Sci. 2012, XXXVIII, 269–276. [Google Scholar] [CrossRef] [Green Version]
  19. González-Aguilera, D.; López-Fernández, L.; Rodriguez-Gonzalvez, P.; Guerrero, D.; Hernandez-Lopez, D.; Remondino, F.; Menna, F.; Nocerino, E.; Toschi, I.; Ballabeni, A.; et al. Development of an all-purpose free photogrammetric tool. Int. Arch. Photogramm. Remote Sens. Spat. Inf. Sci. 2016, 41, 31–38. [Google Scholar] [CrossRef] [Green Version]
  20. Adamopoulos, E.; Rinaudo, F. UAS-Based Archaeological Remote Sensing: Review, meta-analysis and state-of-the-art. Drones 2020, 4, 46. [Google Scholar] [CrossRef]
  21. Megarry, W.; Graham, C.; Gilhooly, B.; O’Neill, B.; Sands, R.; Nyland, A.; Cooney, G. Debitage and drones: Classifying and characterising Neolithic stone tool production in the Shetland Islands using High Resolution Unmanned Aerial Vehicle imagery. Drones 2018, 2, 12. [Google Scholar] [CrossRef]
  22. Cowley, D.C.; Moriarty, C.; Geddes, G.; Brown, G.L.; Wade, T.; Nichol, C.J. UAVs in context: Archaeological airborne recording in a national body of survey and record. Drones 2018, 2, 2. [Google Scholar] [CrossRef] [Green Version]
  23. Abate, N.; Frisetti, A.; Marazzi, F.; Masini, N.; Lasaponara, R. Multitemporal–Multispectral UAS Surveys for Archaeological Research: The Case Study of San Vincenzo Al Volturno (Molise, Italy). Remote Sens. 2021, 13, 2719. [Google Scholar] [CrossRef]
  24. Bobáľ, P.; Sipina, S.; Škultéty, F. Aspects of Aerial Laser Scanning when exploring unknown archaeological sites (Case study). Transp. Res. Procedia 2017, 28, 37–44. [Google Scholar] [CrossRef]
  25. Waagen, J. New technology and archaeological practice. Improving the primary archaeological recording process in excavation by means of UAS photogrammetry. J. Archaeol. Sci. 2019, 101, 11–20. [Google Scholar] [CrossRef]
  26. Barba, S.; Barbarella, M.; Di Benedetto, A.; Fiani, M.; Gujski, L.; Limongiello, M. Accuracy Assessment of 3D Photogrammetric Models from an Unmanned Aerial Vehicle. Drones 2019, 3, 79. [Google Scholar] [CrossRef] [Green Version]
  27. Ronchi, D.; Limongiello, M.; Barba, S. Correlation among earthwork and cropmark anomalies within archaeological landscape investigation by using LiDAR and Multispectral Technologies from UAV. Drones 2020, 4, 72. [Google Scholar] [CrossRef]
  28. James, K.; Nichol, C.J.; Wade, T.; Cowley, D.; Gibson Poole, S.; Gray, A.; Gillespie, J. Thermal and Multispectral Remote Sensing for the detection and analysis of archaeologically induced crop stress at a UK site. Drones 2020, 4, 61. [Google Scholar] [CrossRef]
  29. Gasparini, M.; Moreno-Escribano, J.C.; Monterroso-Checa, A. Photogrammetric acquisitions in diverse archaeological contexts using drones: Background of the Ager Mellariensis Project (North of Córdoba-Spain). Drones 2020, 4, 47. [Google Scholar] [CrossRef]
  30. Gualandi, M.L.; Gattiglia, G.; Anichini, F. An Open System for collection and automatic recognition of pottery through Neural Network Algorithms. Heritage 2021, 4, 140–159. [Google Scholar] [CrossRef]
  31. Berganzo-Besga, I.; Orengo, H.A.; Lumbreras, F.; Carrero-Pazos, M.; Fonte, J.; Vilas-Estévez, B. Hybrid MSRM-Based Deep Learning and Multitemporal Sentinel 2-Based Machine Learning Algorithm Detects near 10k archaeological tumuli in North-Western Iberia. Remote Sens. 2021, 13, 4181. [Google Scholar] [CrossRef]
  32. Somrak, M.; Džeroski, S.; Kokalj, Ž. Learning to classify structures in ALS-Derived Visualizations of ancient Maya settlements with CNN. Remote Sens. 2020, 12, 2215. [Google Scholar] [CrossRef]
  33. Davis, D.S.; Gaspari, G.; Lipo, C.P.; Sanger, M.C. Deep learning reveals extent of Archaic Native American shell-ring building practices. J. Archaeol. Sci. 2021, 132, 105433. [Google Scholar] [CrossRef]
  34. Menze, B.H.; Ur, J.A. Mapping patterns of long-term settlement in Northern Mesopotamia at a large scale. Proc. Natl. Acad. Sci. USA 2012, 109, E778–E787. [Google Scholar] [CrossRef] [Green Version]
  35. Garcia-Molsosa, A.; Orengo, H.A.; Lawrence, D.; Philip, G.; Hopper, K.; Petrie, C.A. Potential of deep learning segmentation for the extraction of archaeological features from historical map series. Archaeol. Prospect. 2021, 28, 187–199. [Google Scholar] [CrossRef]
  36. Trier, Ø.D.; Cowley, D.C.; Waldeland, A.U. Using deep neural networks on airborne laser scanning data: Results from a case study of semi-automatic mapping of archaeological topography on Arran, Scotland. Archaeol. Prospect. 2019, 26, 165–175. [Google Scholar] [CrossRef]
  37. Agapiou, A. Remote Sensing Heritage in a petabyte-scale: Satellite Data and Heritage Earth Engine© applications. Int. J. Digit. Earth 2017, 10, 85–102. [Google Scholar] [CrossRef] [Green Version]
  38. Orengo, H.A.; Garcia-Molsosa, A.; Berganzo-Besga, I.; Landauer, J.; Aliende, P.; Tres-Martínez, S. New developments in drone-based automated surface survey: Towards a functional and effective survey system. Archaeol. Prospect. 2021, 28, 519–526. [Google Scholar] [CrossRef]
  39. ArtLandS Lab—Artefact and Landscape Studies Laboratory. Available online: https://www.ucy.ac.cy/artlands/en/ (accessed on 8 November 2021).
  40. Liu, W.; Anguelov, D.; Erhan, D.; Szegedy, C.; Reed, S.; Fu, C.-Y. SSD: Single Shot MultiBox Detector. arXiv 2016, arXiv:1512.02325. [Google Scholar]
  41. Liu, J.; Xiang, J.; Jin, Y.; Liu, R.; Yan, J.; Wang, L. Boost Precision Agriculture with Unmanned Aerial Vehicle Remote Sensing and Edge Intelligence: A survey. Remote Sens. 2021, 13, 4387. [Google Scholar] [CrossRef]
  42. Noviello, M.; Ciminale, M.; de Pasquale, V. Combined application of pansharpening and enhancement methods to improve archaeological cropmark visibility and identification in QuickBird imagery: Two case studies from Lucera, southern Italy. J. Archaeol. Sci. 2013, 40, 3604–3613. [Google Scholar] [CrossRef]
  43. Sarris, A.; Papadopoulos, N.; Agapiou, A.; Salvi, M.C.; Hadjimitsis, D.G.; Parkinson, A.; Yerkes, R.W.; Gyucha, A.; Duffy, R.P. Integration of geophysical surveys, ground hyperspectral measurements, aerial and satellite imagery for archaeological prospection of prehistoric sites: The case study of Vésztő-Mágor Tell, Hungary. J. Archaeol. Sci. 2013, 40, 1454–1470. [Google Scholar] [CrossRef]
  44. Agapiou, A.; Hadjimitsis, D.G.; Alexakis, D.D. Evaluation of Broadband and Narrowband Vegetation Indices for the identification of archaeological crop marks. Remote Sens. 2012, 4, 3892–3919. [Google Scholar] [CrossRef] [Green Version]
  45. Gallo, D.; Ciminale, M.; Becker, H.; Masini, N. Remote sensing techniques for reconstructing a vast Neolithic settlement in southern Italy. J. Archaeol. Sci. 2009, 36, 43–50. [Google Scholar] [CrossRef]
  46. Agapiou, A.; Lysandrou, V.; Lasaponara, R.; Masini, N.; Hadjimitsis, D.G. Study of the variations of archaeological marks at Neolithic site of Lucera, Italy using High-Resolution Multispectral Datasets. Remote Sens. 2016, 8, 723. [Google Scholar] [CrossRef] [Green Version]
Figure 1. The survey area in the Xeros River valley (marked with the yellow line) under investigation by SeSaLaC and ArtLandS Lab (University of Cyprus), with the selected Areas 6 and 20 used as pilot case-studies for detecting surface pottery scatters using high-resolution UAV images.
Land 10 01365 g001
Figure 2. Examples of unwashed surface potsherds as recovered from the field in Areas 20 and 6, respectively (Photos: A. Vionis, ArtLandS Lab©).
Land 10 01365 g002
Figure 3. A photo taken during the UAV multispectral campaign over Area 6 in 2021.
Land 10 01365 g003
Figure 4. Mosaics used in this study: Area 20 (left) and Area 6 (right).
Land 10 01365 g004
Figure 5. The probability map indicates areas with a potential potsherd concentration in Area 20 (left) using the random forest classifier and the final binary classification outcomes (right).
Land 10 01365 g005
Figure 6. Potsherd distribution as estimated from the UAV orthomosaic in Area 20. A higher density is indicated in dark purple.
Land 10 01365 g006
Figure 7. Single Shot Detector training process. Examples from four different samples with a true–false detection (top left), false–true detection (top right) and true–true detection (bottom).
Land 10 01365 g007
Figure 8. Potsherd detection (points) using the Single Shot deep learning algorithm over Area 6. The various colours indicate confidence level.
Land 10 01365 g008
Figure 9. Example of photo taken from the UAV multispectral sensor: (a) RGB image; (b) blue band; (c) green band; (d) red band; (e) NIR band.
Land 10 01365 g009
Figure 10. Reflectance values (in %) for three main classes of Area 6: background soil, crops, and ceramics, for the visible (blue–green–red) and near-infrared part of the spectrum.
Land 10 01365 g010
Figure 11. Potsherd distribution using the Single Shot Detector algorithm in Area 6. Areas indicated with purple colour show a higher concentration of potsherds, while those in blue indicate thinner ceramic concentrations.
Land 10 01365 g011
Figure 12. Potsherd distribution from the ground-truthing pedestrian survey in Area 6. Areas indicated with purple colour show a higher concentration of potsherds, while those in blue indicate thinner ceramic concentrations.
Land 10 01365 g012
Table 1. Summarized results from Area 20 and Area 6.
Foot SurveysUAV Detection
CountPrediction 1
Area 20300375383
Area 624063007300
1 Estimated number if the area was fully covered from the archaeologists during the survey.
Publisher’s Note: MDPI stays neutral with regard to jurisdictional claims in published maps and institutional affiliations.

