Article

Impact of Industrial Pollution of Cadmium on Traditional Crop Planting Areas and Land Management: A Case Study in Northwest China

1
State Key Laboratory of Grassland Agro-Ecosystems, College of Pastoral Agriculture Science and Technology, Lanzhou University, Lanzhou 730020, China
2
Hebei Key Laboratory of Agroecological Safety, Hebei University of Environmental Engineering, Qinhuangdao 066102, China
3
Resources and Environment College, Chengdu University of Information Technology, Chengdu 610225, China
4
Key Laboratory of Cold Regions Restoration Ecology, Northwest Institute of Plateau Biology, Chinese Academy of Sciences, Xining 810008, China
5
Department of Life Sciences, Qinghai Normal University, Xining 810008, China
*
Author to whom correspondence should be addressed.
Land 2021, 10(12), 1364; https://doi.org/10.3390/land10121364
Submission received: 28 October 2021 / Revised: 4 December 2021 / Accepted: 7 December 2021 / Published: 10 December 2021

Abstract

:
Cadmium in soils not only reduces crop yield and quality but also threatens the safety of human health and wildlife due to bioaccumulation. Baiyin City, a typical industrial region located in northwest China, was evaluated to examine the spatial distribution of cadmium. We simulated soil cadmium concentrations in the laboratory, based on levels found at local sampling sites, to examine how both Medicago sativa and Zea mays plants accumulate cadmium. The experimental results revealed that cadmium in all soil samples exceeded China’s national standard levels for general farmland; in addition, cadmium accumulation in all tissues of M. sativa and Z. mays exceeded the national fodder standards. Therefore, M. sativa and Z. mays from the study area should not be used for fodder. However, about 36% of the planting area of M. sativa and Z. mays can be used for phytoextraction because of cadmium accumulation. For soil pollution management, we suggest dividing the study area into three different regions, including a non-planting region, a phytoremediation region, and a planting region. Our soil management model can effectively help local people to avoid food safety risks and to realize sustainable development of soil utilization in contaminated areas.

1. Introduction

With rapid global economic and industrial development, pollutants have been released into the environment in many countries around the world [1]. In particular, heavy metals, due to their biotoxicity and non-degradability, are especially problematic [2]. Heavy metal pollution in industrial regions requires environmental management and remediation and must be considered in the context of agricultural land use and development [3,4]. Cadmium is an example of a heavy metal that is highly toxic for plant growth [5,6]. Specifically, cadmium uptake in plants occurs in the roots via essential metal transporters and is partly translocated aboveground [7,8,9]. Cadmium in soils not only reduces crop yield and quality but also threatens both animal and human health because this metal can bioaccumulate within a food chain [10,11]. Although efforts have been made to prevent such pollution, heavy metals, nonetheless, pose a risk to food safety in areas where metal mining takes place, such as our study area in Northwest China [12].
Phytoremediation has gained more attention in recent times as an alternative technology for environmental restoration in these contaminated sites with heavy metal [13,14,15]. Several methods have been proposed to examine phytoremediation. New methods, such as ultramicroscopic, radioautographic, fourier-transform infrared spectroscopy (FTIR), and energy dispersive X-ray microanalysis (EMAX), following glutaraldehyde fixation with sulfide supplements or freezing of plant samples, have been used to examine where cadmium is located within plants [16,17,18]. However, these methods are applied at a microscopic scale to examine cadmium localization at a cellular, tissue, or organ level but do not describe the larger scale distribution of cadmium in an area [19,20]. Alternatively, for macroscopic-scale research, a GIS-based multivariate analysis approach can be used to interpret field-based geochemical data [21,22]. In particular, this type of GIS-based multivariate analysis approach can be used to monitor the spatial distribution of heavy metals [23,24,25] and construct a spatial distribution map [26,27]. This type of approach is an effective method that has previously been successfully applied to the examination of spatial patterns in heavy metal pollution [28,29,30]. Overall, the majority of existing research focuses on toxicology and a systematic macro-scale evaluation of cadmium distribution is lacking [31]. However, many questions have seldom been addressed, such as whether crops can be planted in heavy metal-contaminated soil, what types of crops can be planted, how to determine the planting area of crops, and how to classify the planting areas of contaminated soil [32]. Therefore, we designed an integrated model comprising toxicology, food safety, and spatial analysis to achieve classified management of contaminated soils and reduce the risks of food and fodder safety.
Baiyin City is part of an inland industrial region, located in the middle of the Gansu province of northwest China. This study area was chosen as being typical of agricultural food environments in northwest China; the northwest farming area is mostly in the Loess Plateau river flow area. This region is rich in non-ferrous metals such as Cu, Pb, Zn, Co, Au, and Ag, which are locally mined and processed in smelting factories; however, these heavy metals frequently contaminate streams and rivers in this area [25,27]. With the development of the mining and metallurgical industry, arable land in this region has been polluted by Cd, Cu, Pb, and Zn [33,34] because of the usage of polluted river water for irrigation [25]. Crop plants take up such heavy metals and consumption of contaminated crops by humans and/or livestock can result in human/livestock exposure. In this study, we examine cadmium bioaccumulation in maize (Zea mays) and alfalfa (Medicago sativa), both of which are widely planted in the Baiyin City area and are used as forage feedstock for cattle, sheep, and pigs. Furthermore, the outcomes and recommendations for food safety should be broadly applicable irrespective of the specifics of the natural geographical environment or traditional human agricultural activities. The primary objective of this study is to determine the spatial distribution of cadmium in the soils of the Yellow River irrigation region of Baiyin City. This study can be used in the classified management of contaminated soils and for establishing a corresponding application model (Figure 1). The deep soil utilization management model can be used as an example of soil utilization in mining areas and may help to achieve soil utilization, environmental governance, and sustainable development.

2. Materials and Methods
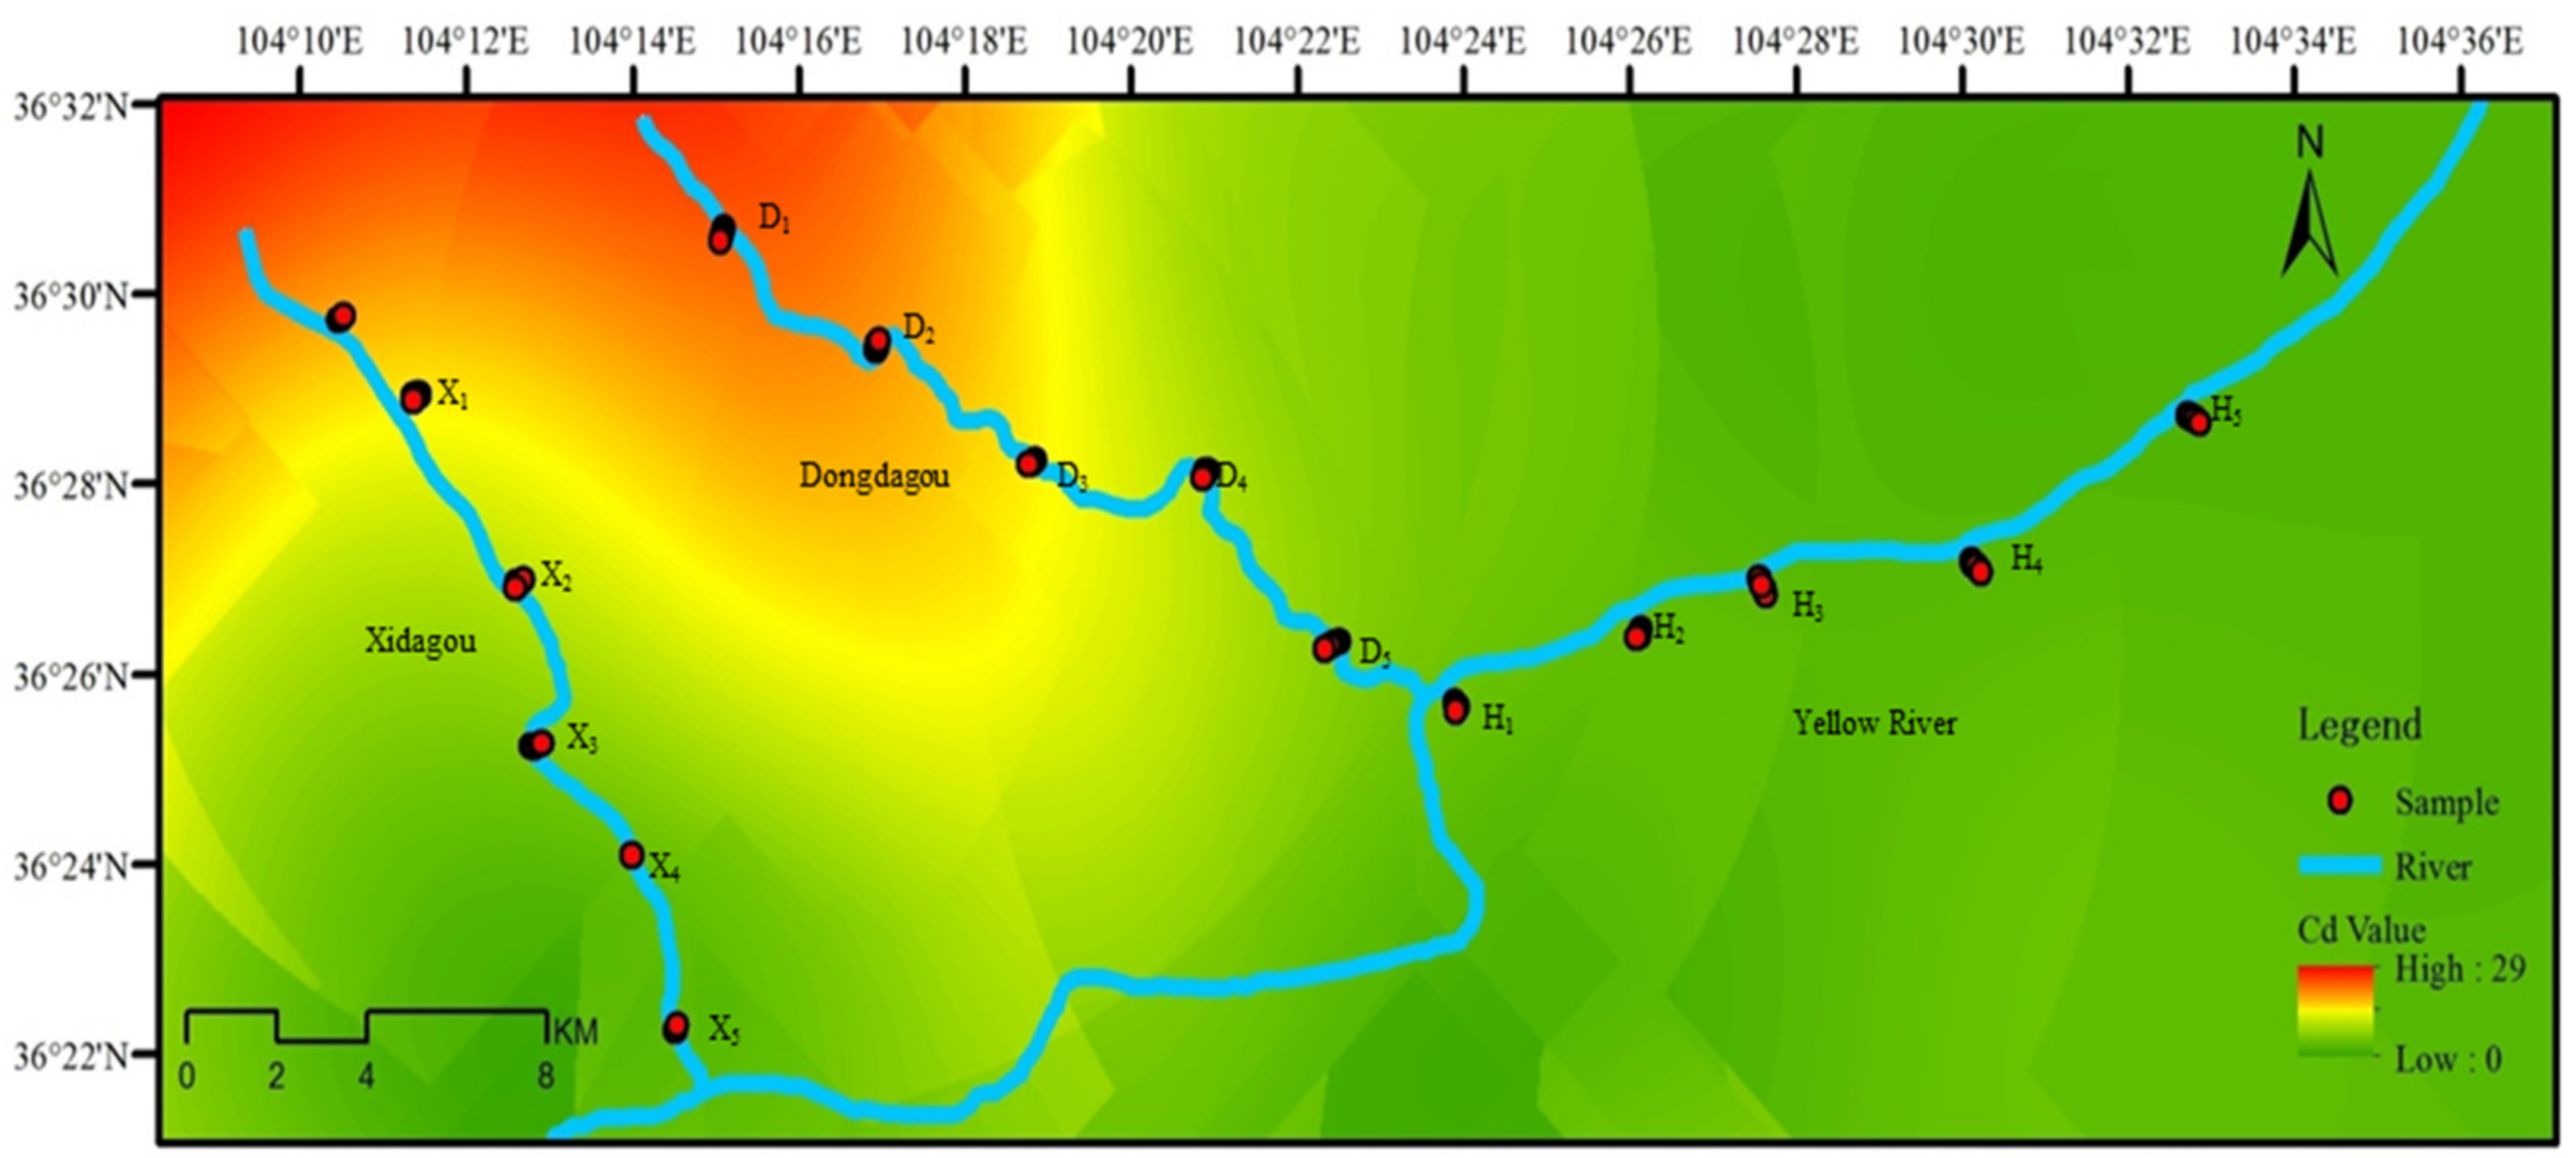
The experimental design of the deep utilization model of contaminated soil is shown in Figure 1. First, the soil Cd concentrations are determined in different parts of the region and, second, we propose a setup for the Cd concentration laboratory experiments based on the results of the above field experiment. According to the growth status of plants and the permissible value of cadmium in crops, we then use GIS and a geostatistical analysis approach of spatial patterns in cadmium soil pollution to classify contaminated soil into three areas: (1) planting region, (2) phytoremediation region, and (3) non-planting region for crop production (Figure 1).

2.1. Study Area

Our study area is located in the region around Baiyin City (36°23′–36°40′ N, 104°21′–104°27′ E). It has a typical southeast monsoon climate, with an annual average temperature of 6–9 °C and an annual total precipitation of 180–450 mm. Most of the non-ferrous metal mining and smelting plants are located in the upper reaches of the Dongdagou stream and several Nonferrous metal mines are located in the upper reaches of the Xidagou stream (Figure 2). The most significant effluent sources are mills, nonferrous metal smelters, and mine tailings. Domestic wastewater and industrial sewage and effluent containing cadmium are released into both streams [33], which drain directly into the Yellow River [35]. With the expansion of industrial development, the Yellow River has become increasingly polluted and irrigation water from the Yellow River contains many hazardous pollutants, including heavy metals [36]. The main agricultural region in the study area is located along the Dongdagou stream and the Yellow River, where farmlands are irrigated using river water. Broadly speaking, this area is a traditional semi-arid agricultural region.

2.2. Sample Collection and Analysis

Fifteen sampling areas were selected along three streams (Figure 2). Five sampling areas (D1–D5) are located along the Dongdagou stream between Liangjiayao to Shahekou, five sampling areas (H1–H5) are located along the Yellow River between Silong and Zhongbao, and a further five sampling areas (X1–X5) are located in the upstream area of Xidagou between Liujiayao and Shuichuan. The number of samples taken from each sampling area is five (n = 5). Each of the five sampling areas along each stream was located about 4.5 km apart. In each sampling area, we chose sampling sites located 1, 101, 201, and 301 m from the side of the stream. At each sampling site, five soil samples for each depth (i.e., 0–20 cm, 20–40 cm, and 40–60 cm depth) were collected using a stainless-steel borer. These depths were chosen because over 80% of roots of both M. sativa and Z. mays are located between depths of 0 and 60 cm [37].
The soil samples were air-dried, ground into fine powder, and sieved through a 0.25 mm sieve. Around 4.0 g of each soil was mixed with 10.0 mL of deionized water in a centrifuge tube. The mixtures were then shaken for 30 min on a mechanical shaker and centrifuged at 3000 r/min for 10 min [38]. The pH value of the supernatants was measured with a pH electrode (MP522, Shanghai, China) [39]. To determine the cadmium concentration, 0.2 g of each soil sample was extracted with concentrated HNO3–HF–HClO4 (v/v 3:1:1) in a 100 mL Teflon beaker on an electric hot plate (150 °C, 1 h); after showing HClO4 smoke, 10 mL HNO3 was added. Subsequently, the digested solution was diluted with deionized water to 100 mL in a volumetric flask. Finally, the cadmium concentrations in the solutions were determined with a flame atomic absorption spectrophotometer (M6AA system, Thermo, Waltham, MA, USA) at a wavelength of 228.8 nm. Standard material, GBW-10015, was purchased from a standard material center in Beijing, China, to control the analytical quality. The recovery rate was 95 ± 5%.
According to the National Standard on Soil and Fodder, the maximum permitted level of cadmium applicable to general farmland, tea plantations, orchards, or farms is 0.6 mg kg−1 (Table 1).

2.3. Plant Materials and Hydroponics Procedure

There are a few principles to be considered in the selection of experimental materials. First, they should be easy to plant in large quantities; second, they should have a large biomass; and third, the available part of the plant should have economic value. M. sativa and Z. mays are important food and fodder crops in the research area and both satisfy the aforementioned criteria; therefore, these species were chosen as experimental materials for this study.
The seeds of M. sativa were provided by the Longdong Grassland Research Institute at the Chinese Academy of Agricultural Science in Hohhot, Inner Mongolia. The Jinsui No. 3 cultivar of Z. mays seeds was provided by the Baiyin Jin Sui Seed Industry Company.
The M. sativa and Z. mays seeds were surface sterilized by dipping in 75% (v/v) ethanol for 30 s after being soaked for 1.5 h under running water. The disinfected seeds were rinsed with sterile distilled water 3–5 times and soaked in 5% NaClO for 15 min, then rinsed a further 3–5 times with sterile distilled water. The seeds were then placed in sterile Petri dishes with rinsed filter paper for 24 h in darkness at 25 °C. Germinated seedlings with roots 1.0 cm long were transferred to a hydroponics system in a greenhouse and grown under a 16 h light/8 h dark regime at a constant temperature of 25 °C. The light intensity at the shelf height was 230 mmol m−2s−1 using fluorescent lamps [38]. The hydroponic system (Australian Center for Plant Functional Genomics, Australia) consisted of 20 plastic vessels with a 25 L capacity, into which Hoagland modified medium plus cadmium treatments were pumped with a small aquarium air pump for 15 min, twice an hour. The Hoagland medium was modified to contain 5 mM KNO3, 1 mM NH4H2PO4, 0.5 mM MgSO4·7H2O, 0.5 mM Ca(NO3)2·4H2O, 92 mM H3BO3, 18 mM MnCl2·4H2O, 1.6 mM ZnSO4·7H2O, 0.6 mM CuSO4·5H2O, 0.7 mM (NH4)6Mo7O24·4H2O, and 59 mM Fe-EDTA. A pH of 8 was maintained by adding 1 M NaOH as required throughout the experiment. To simulate the environmental conditions of the studied Yellow River irrigation region, we used cadmium concentrations based on field measurements, specifically, 0, 1, 3, 5, 10, 15, 20, 25, and 50 mg kg−1 CdCl2 [38]. There were five replicates of both M. sativa and Z. mays plants for each concentration.
The effects of CdCl2 stress on biomass production and growth parameters were determined after 2 weeks of growth with and without Cd. Each harvested plant was removed and the shoot length, root length, shoot biomass, and root biomass were measured. The relative root growth rate was determined by the ratio of root biomass under Cd treatment to the root biomass of the control treatment.

2.4. Cadmium Accumulation in Plant Materials

In order to examine the levels of cadmium accumulation in M. sativa and Z. mays, 80 plants of each species were cultured for two weeks in the hydroponic system, as described above. Subsequently, the experimental cadmium levels were added for a further two weeks. Roots, stems, and leaves of the plants were harvested and extensively washed with distilled water. All samples were then oven-dried, ground to a fine powder, and ashed in a muffle furnace at 550 °C for 4 h. The ashed residue was brought into solution using 5 mL of 1 M HNO3. The cadmium concentration was then determined with a flame atomic absorption spectrophotometer (M6AA system, Thermo, America).
To evaluate the phytoextraction potential of M. sativa and Z. mays, two parameters were calculated: the translocation factor (TF) and the bioconcentration factor (BCF). The TF, defined as the ratio of the aboveground cadmium concentrations to those in the root biomass, was used to evaluate the effectiveness of the plant in translocating cadmium from the root to the shoot. The BCF represents the ratio of the cadmium concentration in the aboveground tissue to that in the culture medium [40].

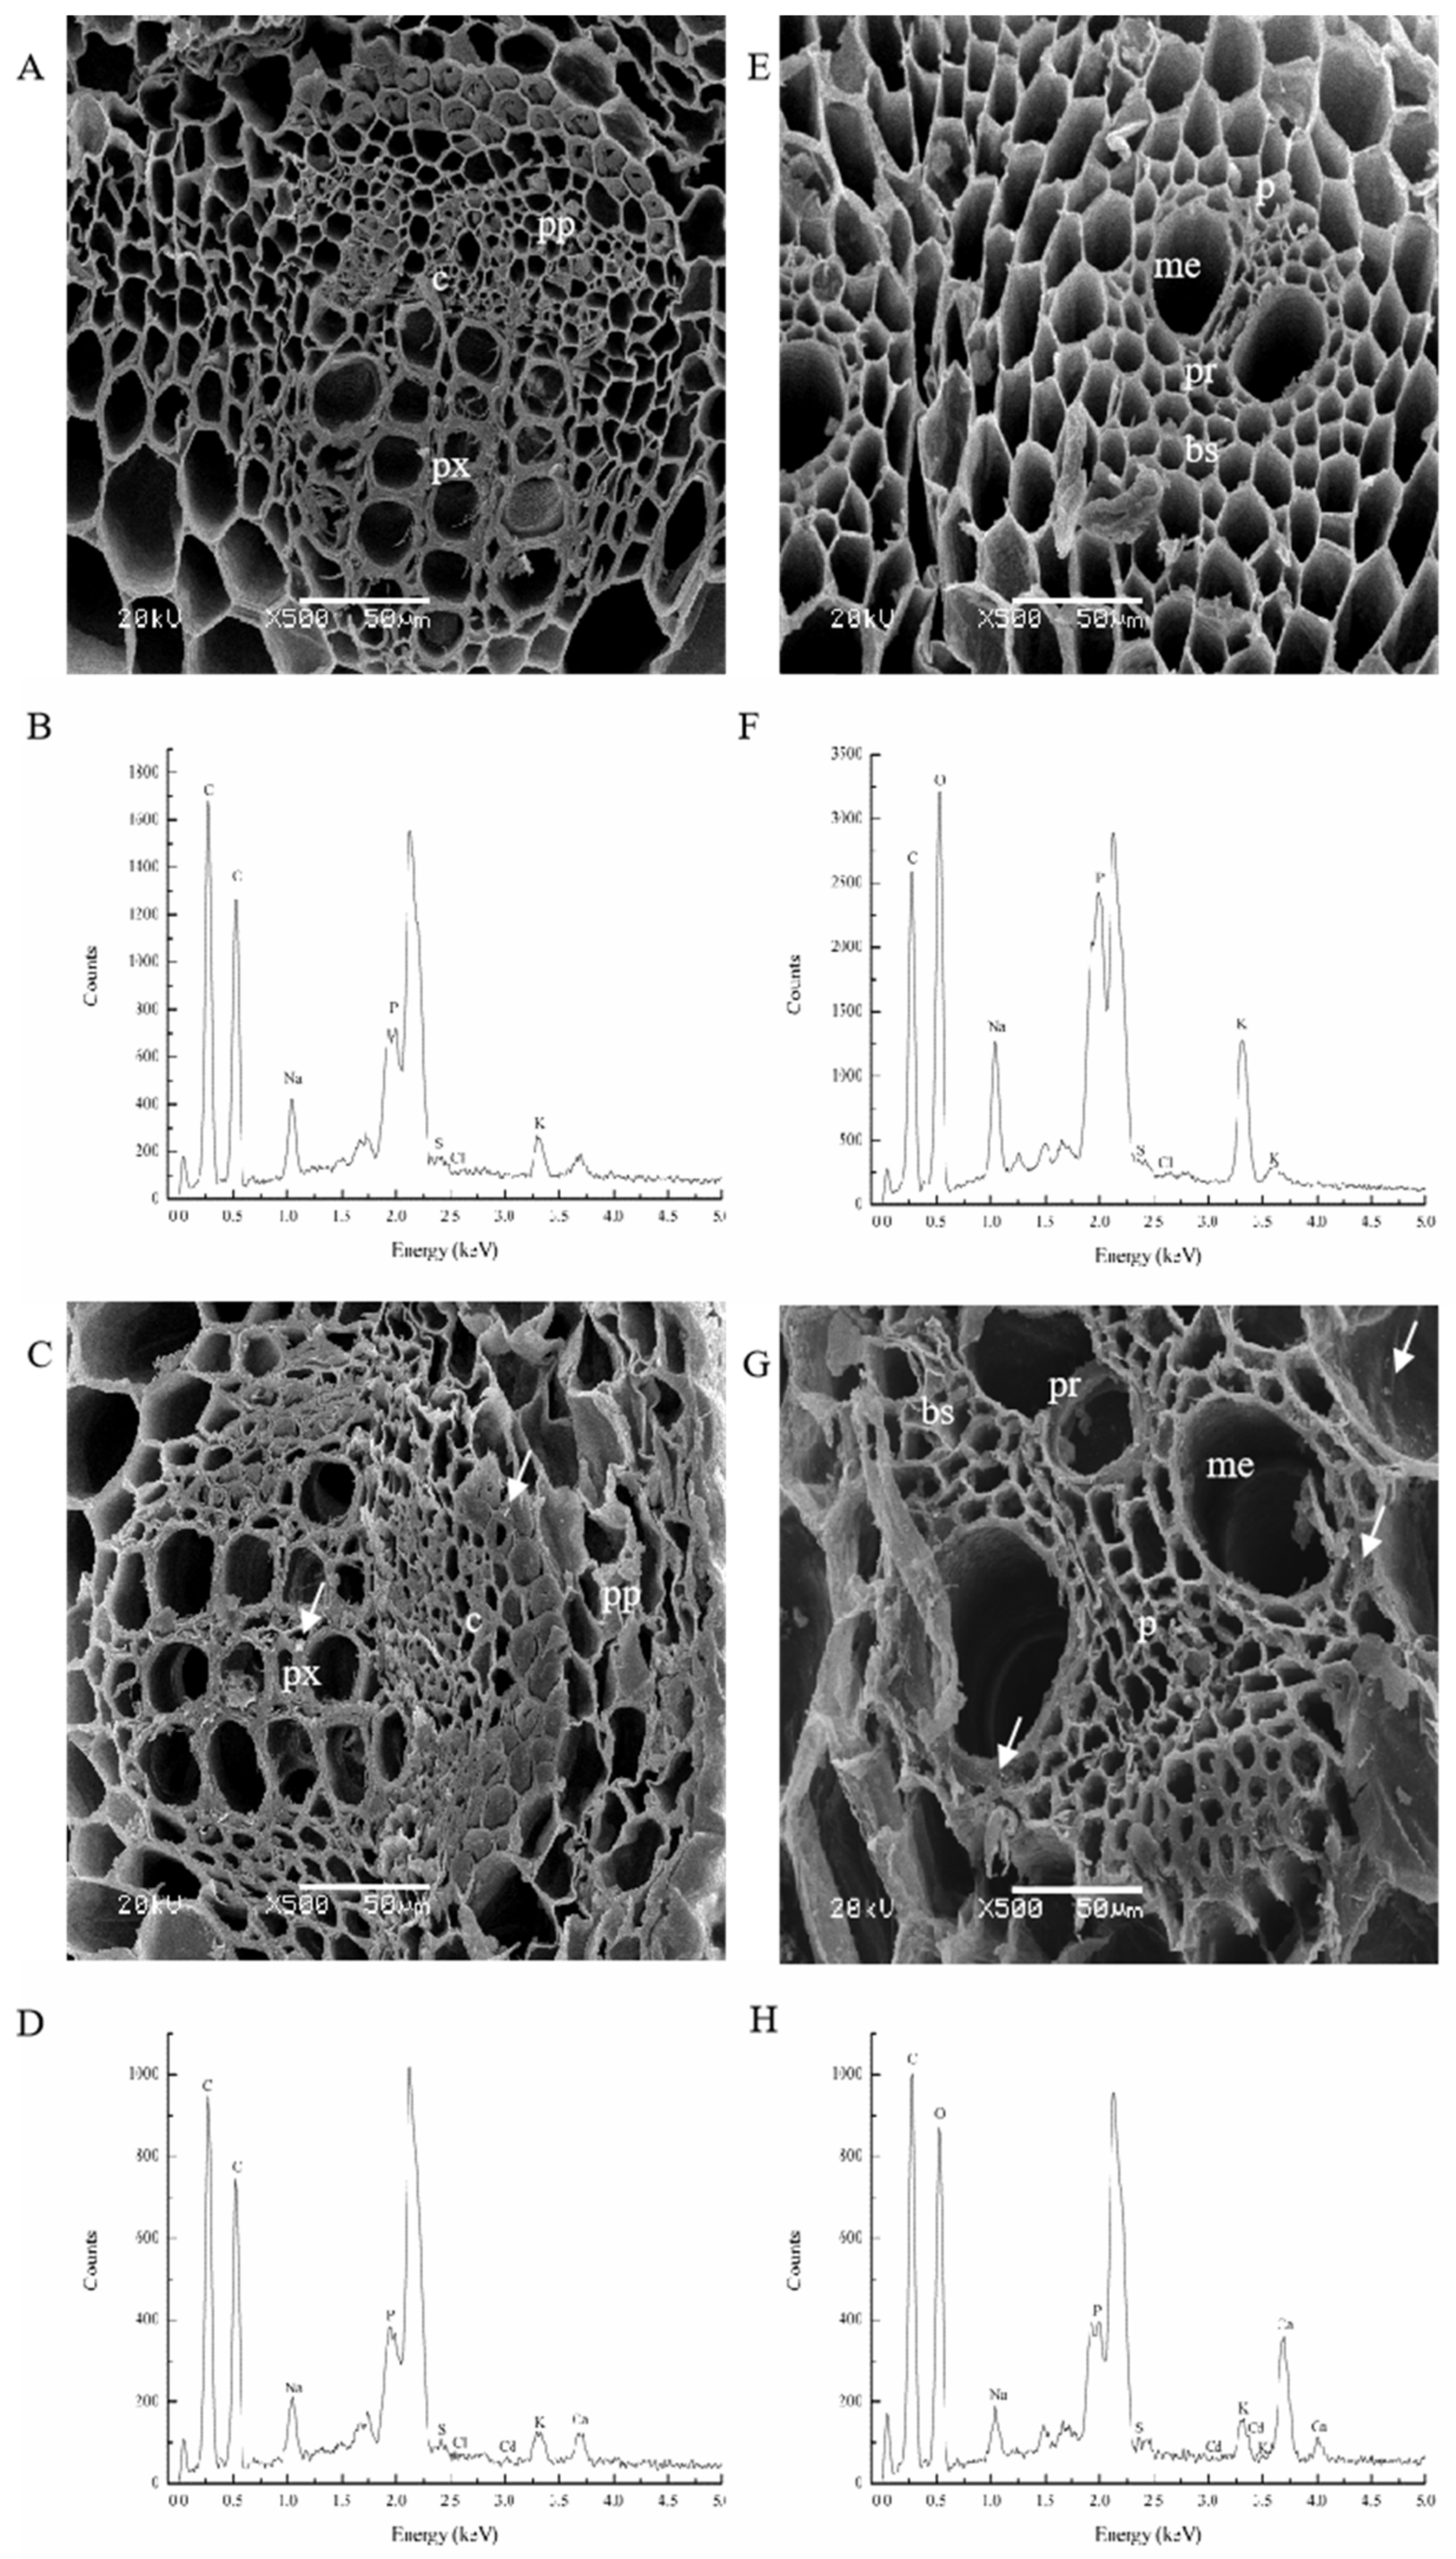
2.5. Scanning Electron Microscopy and Energy Dispersive X-rays Analysis

After cadmium treatment for 14 days, root and stem segments were analyzed to determine the sites of cadmium accumulation. Tissue segments were washed with deionized water and fixed in the presence of 3% glutaraldehyde with a 0.2 M phosphate buffer (pH 7.2) for at least 24 h at 4 °C. The phosphate buffer contained 0.2 M Na2HPO4·12H2O and 0.2M NaH2PO4·12H2O. The tissue segments were then rinsed three times with the phosphate buffer solution. Post-fixation in 1% OsO4 was performed before dehydration with an ethanol series (50, 60, 70, 80, 90, and 100% concentrations). Between post-fixation and dehydration, the tissue segments were rinsed three times with the phosphate buffer. In order to obtain a fracture surface, the preparations were cut with a razor blade after dehydration. The preparations were then soaked with tert-butanol and freeze-dried. After the freeze-drying stage, the samples were coated with a thin layer of Au. The scanning electron microscope (SEM) analysis was carried out using a JEOL JSM-5600LV microscope adapted with a NORAN energy dispersive X-ray spectrometer with VOYAGER II 1100/1110 software. There were five replicates for each cadmium concentration of root and stem for both M. sativa and Z. mays plants used in the scanning electron microscopy and energy dispersive X-ray analyses.

2.6. Data Analysis

The cadmium concentrations of the plant tissues are presented as means with two standard deviations of error. Differences between treatments were analyzed using paired-samples Tukey tests and one-way analysis of variance (ANOVA) using the SPSS software package (version 22.0, SPSS Inc., Chicago, IL, USA). The spatial distribution of cadmium was then analyzed using a GIS dimensional analytical method, described below [22].

2.7. GIS Spatial Analysis

In order to understand the different cadmium concentrations of the cultivated land in the study area, we obtained the existing global land cover products. The FROM-GLC10 product with 10 m spatial resolution was downloaded from http://data.ess.tsinghua.edu.cn (accessed date: 6 September 2021). We extracted the spatial distribution of cultivated land in the study area in ArcGIS. We used Kriging spatial interpolation to obtain the concentration distribution in ArcGIS 10.4 software, and combined the spatial distribution of cultivated land in the study area to divide the contaminated soil area into three different areas, including a non-planting region, a phytoremediation region, and a planting region.

3. Results

3.1. Spatial Distribution of Cadmium in the Sampling Areas

Soil cadmium concentrations ranged from 0.2 to 24.8 mg kg−1 in the sampling areas (Figure 3 and Figure 4). The areas along the Dongdagou stream (D1–D5) had the highest cadmium levels (4.21 to 24.83 mg kg−1), while the southeast and northeast parts of the study area showed relatively lower cadmium concentrations. Within Dongdagou, the cadmium concentrations were highest in the upstream area (D1) and gradually decreased along the flow direction of the stream. The cadmium concentrations also gradually decreased further away from the Dongdagou stream. The Xidagou stream and Yellow River also showed the same trend as the Dongdagou stream. Based on Figure 3 and Figure 4, at the same sampling depth at all three sites, in general, the greater the distance from the water, the lower the cadmium concentration of soil. Similarly, at the same distance from the water at all three sites (Figure 4), the deeper the sampling layer, the lower the cadmium concentration of the soil.

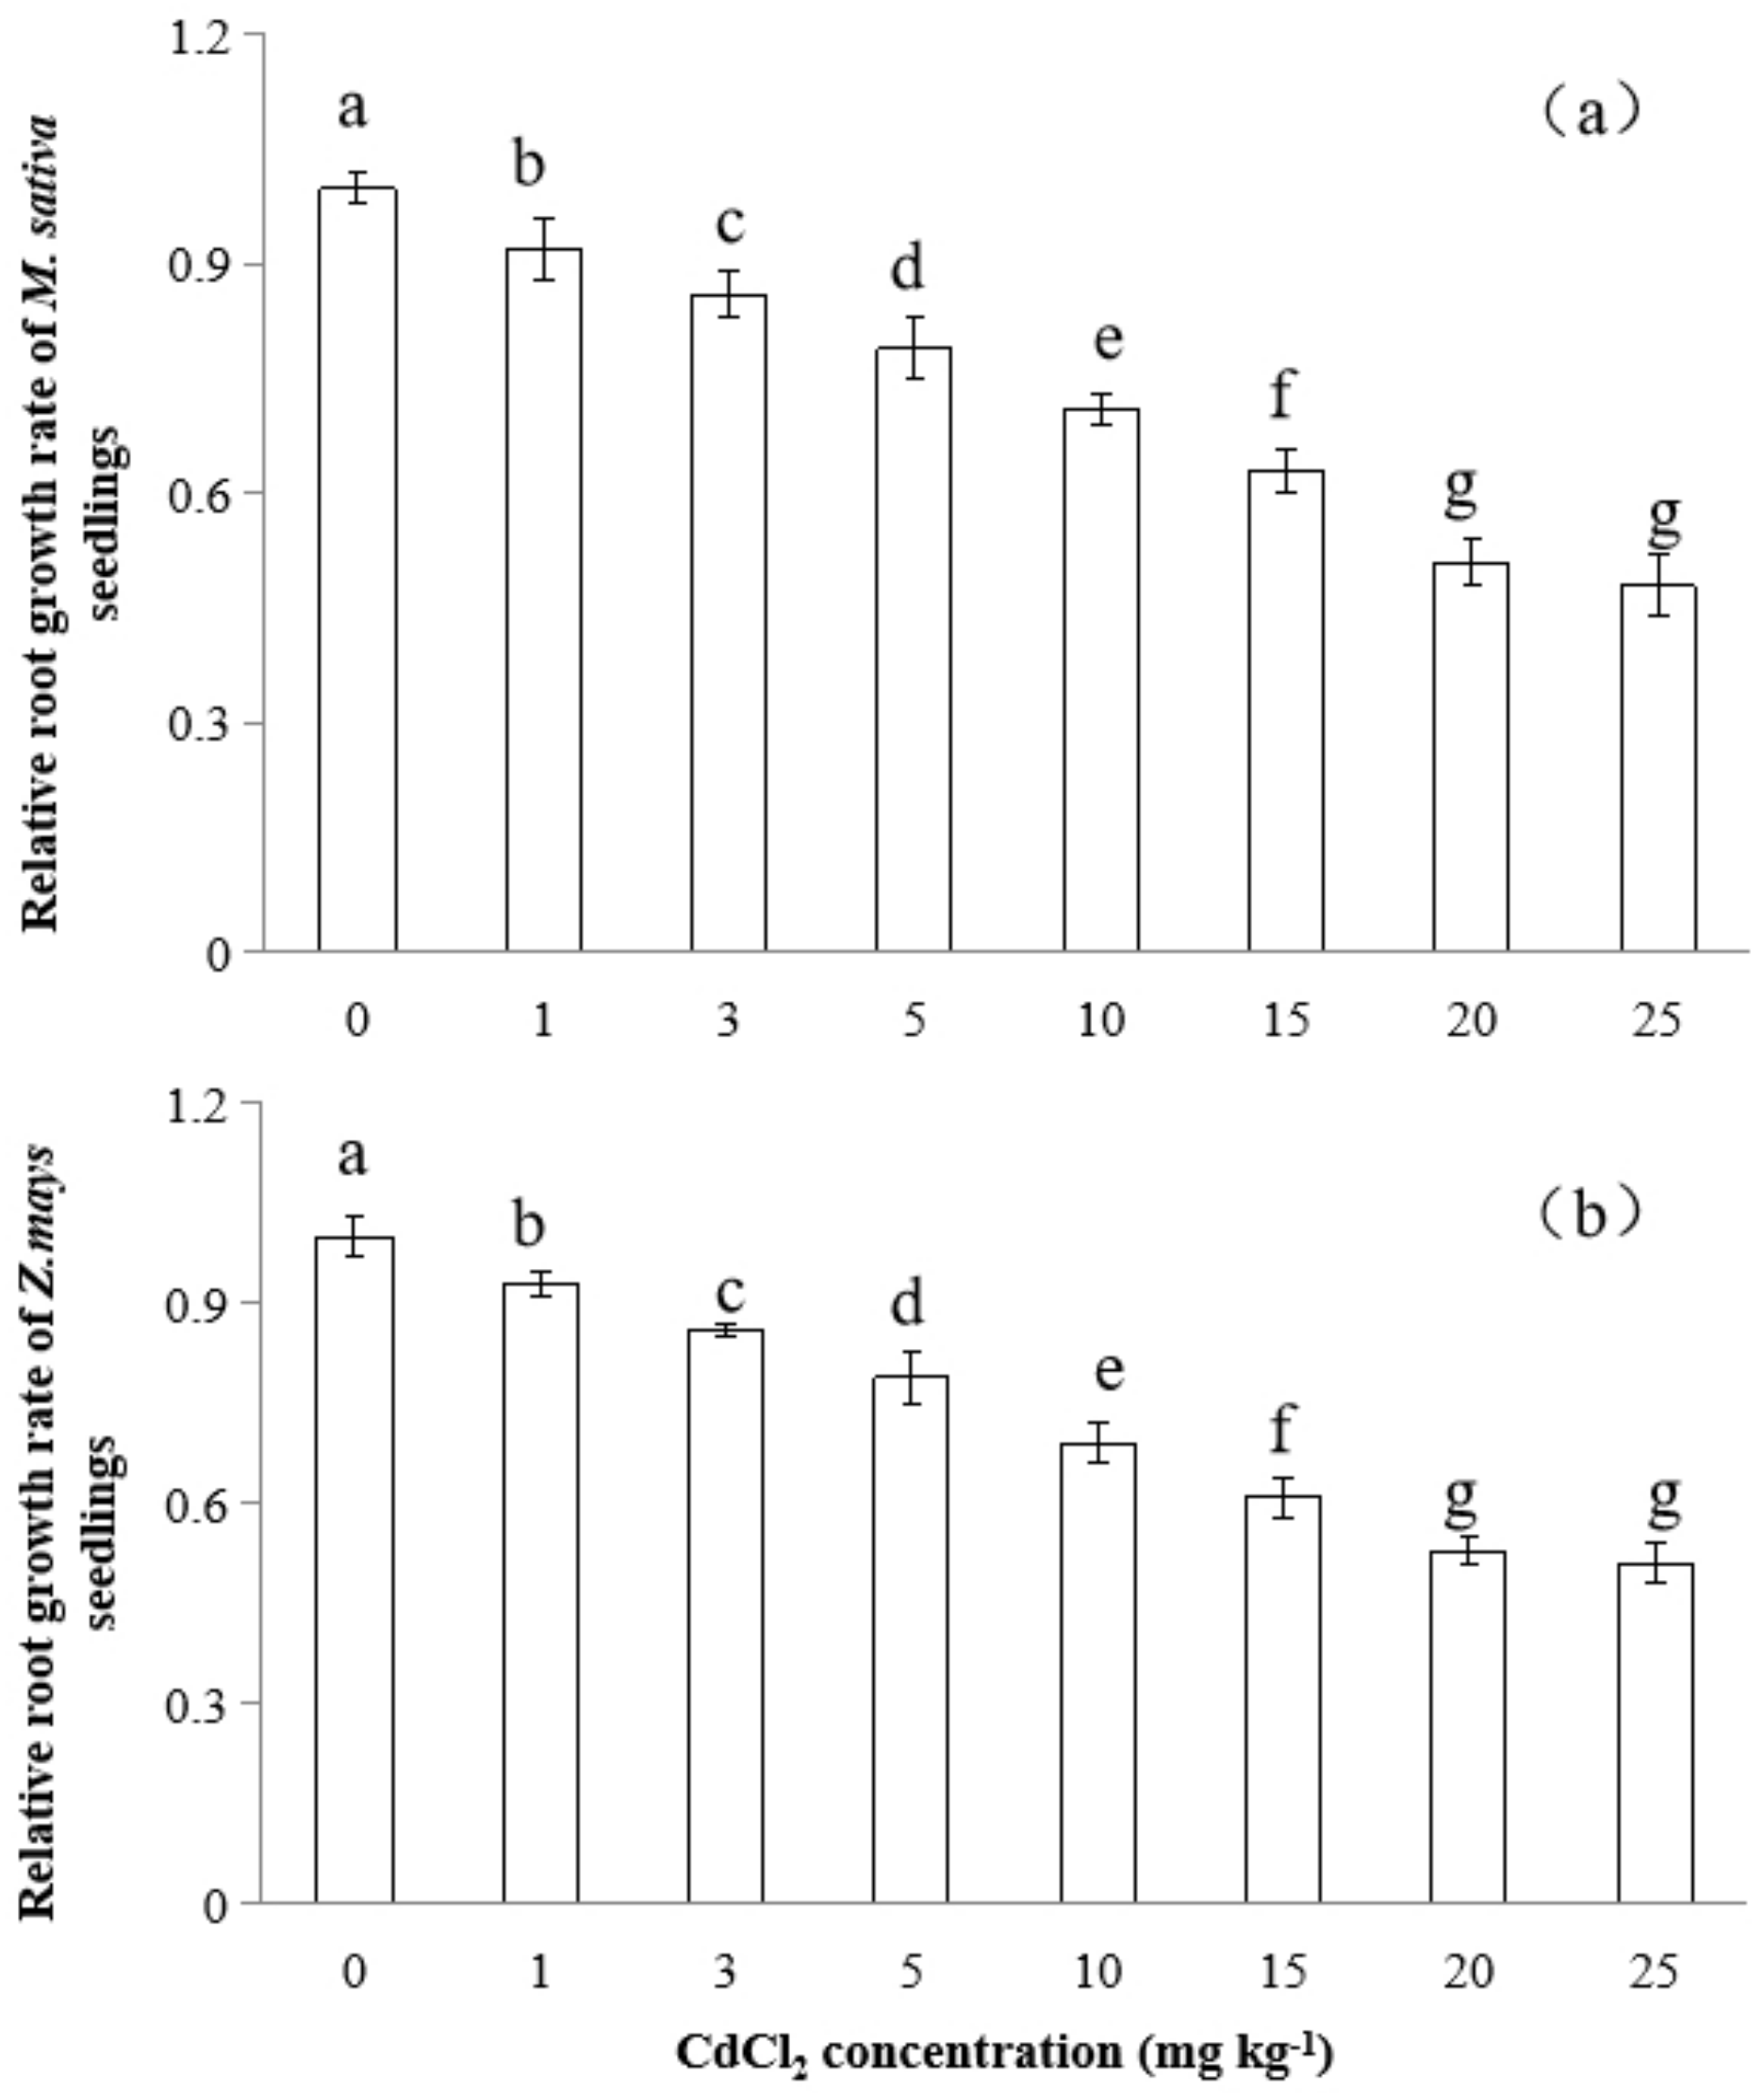
3.2. Cadmium Accumulation in M. sativa and Z. mays

In order to determine the laboratory experiment cadmium levels, we used a clustering analysis for the soil samples. All the concentrations of cadmium in the soil of the sampling sites were clustered as 1, 3, 5, 10, 15, 20, and 25 mg kg−1 (Figure 5). Values of 0 to 2.0 mg kg−1 were clustered as 1.0 mg kg−1, 2.0 to 4.0 mg kg−1 was clustered as 3.0 mg kg−1, 4.0 to 7.5 mg kg−1 was clustered as 5.0 mg kg−1, 7.5 to 12.5 mg kg−1 was clustered as 10.0 mg kg−1, 12.5 to 17.5 mg kg−1 was clustered as 15.0 mg kg−1, 17.5 to 22.5 mg kg−1 was clustered as 20.0 mg kg−1, and 22.5 to 27.5 mg kg−1 was clustered as 25.0 mg kg−1.
The cadmium content in M. sativa roots was much higher than that in the stems and leaves. Cadmium content values reached 1663, 157, and 139 mg kg−1 dry biomass in the roots, stems, and leaves, respectively (Table 2). The cadmium content in Z. mays showed the same pattern as in M. sativa, with cadmium content values reaching 1529, 811, and 466 mg kg−1 dry biomass in the roots, stems, and leaves, respectively (Table 2). These results indicate that most of the cadmium taken up by M. sativa and Z. mays plants remained in the roots and only a minor amount of cadmium was transported into the stems and leaves, especially in M. sativa. The cadmium concentrations in the Z. mays stems were around 2–10 times higher than those in M. sativa, while the cadmium concentrations in Z. mays leaves were approximately 3–6 times higher than those in M. sativa (Table 2). These results indicate that under the same treatment conditions, Z. mays accumulates more cadmium than M. sativa in its aboveground tissues.
In both M. sativa and Z. mays plants, the translocation factor was < 1 and the bioconcentration factor was >1 in all treatments (Table 3). In M. sativa, the bioconcentration factor was highest at low concentrations (i.e., 1 and 3 mg kg−1). In Z. mays, the bioconcentration factor was generally higher at the lower concentrations (1, 3, 5, and 10 mg kg−1) then dropped at concentrations of 15 mg kg−1 and above.
An appropriate Cd concentration ranging from 0 to 25 mg kg−1 was used for screening the semi-lethal dose for M. sativa and Z. mays. The relative root growth rate of the two plants averaged from 0.48 to 1.0 and the relative root growth decreased quickly with increasing Cd concentration. Generally, the higher the Cd concentration used, the lower the relative root growth (Figure 6). There was no significant difference in the average relative root growth rate between 20 and 25 mg kg−1 CdCl2 treatments. In addition, for the underground biomass, there was significant difference between 15 and 20 mg kg−1, 20 and 25 mg kg−1 CdCl2 treatments in both of the two plants. For the aboveground biomass, there was no significant difference between 15 and 20 mg kg−1 CdCl2 treatments, but there was significant difference between 20 and 25 mg kg−1 CdCl2 treatments in both plants (Table 4). Therefore, considering the aboveground biomass, underground biomass, and relative root growth, we finally determined that 25 mg kg−1 was the semi-lethal dose for both M. sativa and Z. mays.
For M. sativa, Table 2 shows that with the increase in cadmium concentration, the content of cadmium in the root, stem, and leaf showed an increasing trend. When the concentration of cadmium reaches 0.3 mg kg−1, the content values of cadmium in the root, stem, and leaf are 2.57 mg kg−1, 0.52 mg kg−1, and 0.39 mg kg−1, respectively (data not shown). These results were consistent with those of Flores-Cáceres, and showed that under the stress of Cd at 6 μM, the Cd content in plants showed roots > stems > leaves [41]. The results indicate that at a 0.3 mg kg−1 cadmium concentration, the cadmium content in stems exceeded the allowable threshold cadmium content level in feed (0.5 mg kg−1) (Table 1). When the concentration of cadmium was 25 mg kg−1, normal growth of the plant was inhibited severely. When the concentration of cadmium reached 50 mg kg−1, neither plant can survive. Therefore, there were no data for this treatment concentration.
As shown in Table 2, with increasing cadmium concentration, the content of cadmium in the roots, stems, and leaves of Z. mays also showed the same trend as that of M. sativa. When the concentration of cadmium reaches 0.2 mg kg−1, the content values of cadmium in the root, stem, and leaf are 2.14 mg kg−1, 0.48 mg kg−1, and 0.27 mg kg−1, respectively (data not shown). These results were consistent with those of Retamal-Salgado and Shakeel [42,43]. In this scenario, the content of cadmium in the stems was close to the threshold of the cadmium content in feed (0.5 mg kg−1) (Table 1). When the concentration of cadmium was higher than 25 mg kg−1, growth of Z. mays was inhibited, similar to M. sativa.
We experimentally simulated the actual field environmental conditions to examine cadmium accumulation in M. sativa and Z. mays. From Table 2, we can observe that when the cadmium concentration was higher than 1 mg kg−1, the cadmium content values in roots, stems, and leaves of both M. sativa and Z. mays were higher than 0.5 mg kg −1. When the cadmium concentration was 1 mg kg−1, the cadmium levels reached 359, 38, and 25 mg kg−1 dry biomass in the roots, stems, and leaves, respectively, of M. sativa (Table 2). For Z. mays, the cadmium levels reached 205, 64, and 29 mg kg−1 dry biomass in the roots, stems, and leaves, respectively, when the cadmium concentration was 1 mg kg−1 (Table 2). The cadmium levels in all tissues of both species were above the maximum permissible national standard level for crops. For fodder, the allowed maximum cadmium concentration is 0.5 mg kg−1 (Table 1); thus, none of the tissues of either plant can be used for fodders.

3.3. Cadmium Subcellular Determination in M. sativa and Z. mays

Using SEM analyses, we observed a large cadmium accumulation in the roots of M. sativa, which were treated with 25 mg kg−1 cadmium for 14 days (Figure 7A). Cadmium accumulation was most frequently observed in the endodermis, pericycle, phloem, and xylem, and less in the cortex region. EDX analyses confirmed that these deposits contain cadmium (Figure 7B). The prevalence of deposition within the stele region supports the hypothesis that this forms the main cadmium transport pathway in M. sativa roots. Cadmium may also be chelated into organic compounds as the EDX spectrum showed oxygen, carbon, phosphorus, and sulfur peaks (Figure 7B). In contrast to the roots, the stems of M. sativa only revealed small deposits (Figure 8A). EDX observations also confirmed that these depositions contain cadmium (Figure 8B). Higher amounts of deposition were observed in the primary xylem and cambium, as compared to the primary phloem. Cadmium may be more readily detected in the primary xylem because metal ligands are transported in both the xylem and phloem, but the higher prevalence of deposition within the primary xylem supports the hypothesis that this region forms the main cadmium transport pathway in the stems. Similar to Figure 7B, the EDX spectrum showed possible evidence of cadmium chelation to organic compounds due to the presence of peaks of oxygen, carbon, phosphorus, and sulfur (Figure 8B).
In contrast, the roots of Z. mays treated with 25 mg kg−1 cadmium for 14 days showed less cadmium accumulation (Figure 7C). EDX observations confirmed that the deposition areas contain cadmium (Figure 7D). Cadmium accumulation was mostly observed in the endodermis, pericycle, and xylem, and to a lesser extent in the cortex. The prevalence of deposition in the pericycle and xylem supports the hypothesis that these areas form the main pathway of cadmium transport in maize roots. Cadmium may also have been chelated into organic compounds because the EDX spectrum showed peaks relating to oxygen, carbon, phosphorus, and sulfur (Figure 7D). Stems of Z. mays revealed only limited deposition (Figure 8C). Cadmium-treated plants showed abundant clusters inside the vascular bundle of stem cells including within the phloem, metaxylem, protoxylem, and bundle sheath (Figure 8C), which were absent in the control specimens. The clusters observed by SEM within the vascular bundle contain cadmium (Figure 8D). As the EDX spectrum showed peaks of oxygen, carbon, phosphorus, and sulfur (Figure 8D), similar to observations in the roots, cadmium may be chelated to organic compounds.
Mechanisms of cadmium detoxification in plants are thought to involve chelation through phytochelatins or organic compounds. Because the EDX spectra consistently showed peaks of oxygen, carbon, phosphorus, and sulfur (Figure 8D), this may support the concept of cadmium chelation to organic compounds. Thus, the role of chelating ligands in cadmium translocation warrants further attention.

3.4. Situation of Soil Cadmium Pollution in the Study Area

In this research, we established a three-dimensional spatial database relating to the distribution of cadmium in contaminated soil. The three dimensions are the equidistant sampling along the direction of each river, equidistant sampling perpendicular to the direction of each river, and soil sampling at different depths. Figure 9 showed the spatial distribution map of cadmium concentrations across the study area. Our study sites were located along the Dongdagou and Xidagou streams, which flow broadly from north to south, and the Yellow River, which flows from west to east. The Dongdagou and Xidagou streams function as drainage ditches, originating in an industrial district and draining into the Yellow River. Both these streams are known to be severely polluted with hazardous substances, especially heavy metals [35]. These streams play a crucial role in transporting heavy metals into the soils in our research area.
The observed planting of crops in the study area, based on satellite image classification, is shown in Figure 10. From Figure 10, we found that the entirety of the study area was used for crop cultivation.
In our study area, there is a total agricultural area of 20.87 km2. As shown in Table 5, for M. sativa, the areas of three classified regions are: non-planting region, 7.44 km2; planting region, 5.92 km2; and phytoremediation region, 7.5118 km2. The proportions of the total planting area represented by each classification are 35.64%, 28.37%, and 35.99%, respectively. Similarly, for Z. mays, the areas of the three classified areas are: non-planting region, 7.44 km2; planting region, 5.88 km2; and phytoremediation region, 7.55 km2. The corresponding proportions of the total area are 35.65%, 28.18%, and 36.17% respectively.

4. Discussion

4.1. Deep Utilization Patterns of M. sativa and Z. mays

In our study, there was no significant difference observed in average relative root growth rate between 20 and 25 mg kg−1 CdCl2 treatments; therefore, the 25 mg kg−1 CdCl2 concentration was selected for Cd-tolerant accession screening as it gave the widest distribution of relative root growth (Figure 6). These results indicate that 25 mg kg−1 CdCl2 treatment was the semi-lethal dose for M. sativa and Z. mays, meaning that when the cadmium concentrations in soil are higher than 25 mg kg−1, plants cannot grow. When the cadmium concentration is below this threshold, the plants can, in theory, survive; however, although plants can grow normally in contaminated soil, their edible parts are not necessarily usable by humans or livestock.
Since Cd is toxic to humans at lower concentrations than plants, plants that appear healthy are not necessarily safe for human consumption. To decrease the potential risks associated with excessive Cd intake via consumption of contaminated food, the maximum allowable values of Cd in edible plant parts have been established by the Codex Alimentarius Commission of Food and Agriculture Organization of World Health Organization (FAO/WHO, CODEX 2006) [44] (Table 1). The threshold values of Cd in edible plant parts vary with food type (i.e., cereals, legumes, or vegetables) as well as the edible/consumed plant part (grain, root, stem, or leaf) (Table 1). The tolerable limit of Cd intake for humans is <70 μg day−1 [45] and the provisional tolerable weekly intake is 7 μg kg−1 body weight. The study area has alkaline soils, with a pH range between 7.7 and 8.8 (Table S1). Cadmium availability depends on the soil pH, and for a soil pH above 7.5, the maximum permitted soil cadmium concentration is 0.6 mg kg−1. Cadmium concentrations in all soil samples in our study exceeded this maximum national standard for general farmland. Thus, none of the soil in the study area is suitable for farming. Note that both maize and alfalfa did not grow normally in the 50 mg kg−1 cadmium treatment; therefore, there were no maize or alfalfa accumulation data for this treatment concentration.

4.2. Classified Management Pattern of Contaminated Soil

As shown in Figure 9, The distribution of heavy metal pollution in soils is influenced by both internal and external factors. External factors, for example, anthropogenic activities such as mining, smelting, fertilizers, and pesticides, can increase the heavy metal content in soils. Internal factors such as the soil’s physicochemical properties can affect its heavy metal content via sorption–desorption, dissolution–precipitation, oxidoreduction, coordination–chelation, and other geochemical processes [25,46,47]. In our study, the spatial distribution of heavy metals in soils in different regions appears to be mainly influenced by distance from the source of pollution.
Our analysis indicated that the sampling sites can be divided into two parts, namely, areas of high and low contamination. In addition, we use kriging interpolation to obtain the spatial distribution map of the study area cadmium concentrations according to sampling (Figure 9) [48,49]. The highly contaminated areas are principally located close to the headwaters of the Dongdagou and Xidagou streams. Comparatively, the less contaminated areas are located further away from the streams [12]. Thus, we hypothesize that the pollution source of the heavy metals in soil is primarily the irrigation water from the Dongdagou and Xidagou streams.
We designed the cadmium concentrations in the laboratory based on the results of soil cadmium concentration in study area, under different pollution sources and the environmental background database. In addition, we compared the differences in cadmium content in different tissues of our plant materials.
Based on the results above, we combined space analysis with mathematical statistics to select the spatial location of different deep utilization management patterns in our experimental site (Figure 11).
The experimental materials selected in our research are important economic crops that are planted in large quantities in the study area, and their aboveground parts are widely used, such as stems, leaves, and fruits (seeds). Our results show that when the soil cadmium concentration exceeds 1 mg kg−1, although plants can still grow, the cadmium content in the aboveground parts of the two experimental species consistently exceeded the threshold value of 0.5 mg kg−1 (Table 1); therefore, the aboveground parts cannot be used as food or fodder. When the soil cadmium concentration was between 1 mg kg−1 and 25 mg kg−1, the two experimental species could still grow and achieve large biomass, indicating that these types of soil may be suitable candidates for phytoremediation. When the soil cadmium concentration exceeded 25 mg kg−1 (semi-lethal dose), neither of the experimental materials could grow; therefore, areas with soil cadmium concentrations higher than 25 mg kg−1 can be classified as non-planting areas. When the soil cadmium concentration is lower than 1 mg kg−1, the cadmium contents of the aboveground parts of both experimental species are within the prescribed threshold range. Therefore, the aboveground parts of both experimental materials could be used for fodder. Areas with a soil cadmium concentration less than 1 mg kg−1 can, thus, be classified as planting areas. Therefore, according to the above results, soils contaminated by cadmium can be classified as follows: (1) areas with soil cadmium content greater than 25 mg kg−1 are non-planting regions; (2) areas with soil cadmium content less than 0.3 mg kg−1 are the planting region and the aboveground plant material can be used as material for fodder (compound feed); and (3) areas where the content of cadmium in the soil is between 0.3 mg kg−1 and 25 mg kg−1 are the phytoremediation region. Although the aboveground parts of plants growing in this area cannot be used as materials for feed, they can be used for phytoremediation because the plant can grow normally and can accumulate large amounts of cadmium in its aboveground tissue.
In conclusion, if our management model is used in the planting process of contaminated soil, food and fodder safety risks can be effectively reduced and sustainable development of soil utilization can be realized in contaminated areas. This research suggests that satellite remote sensing and GIS application could be used by agricultural land use planners and land policy makers to select suitable lands for increasing crop production [50,51,52].

4.3. Establishment of Deep Utilization Model of Contaminated Soil

We compared the estimated aboveground cadmium content of M. sativa and Z. mays based on the spatial distribution of different cadmium concentrations (shown in Figure 9) with the permissible cadmium content threshold in fodder (Figure 11). The study was then classified into three regions, namely, the planting region, phytoremediation region, and non-planting region. As showed in Figure 11, for both M. sativa and Z. mays, the orange area means non-planting region, the gray area means phytoremediation region, and the green area means planting region.
The area where both crops can be planted is the planting region, the area where at least one of the two crops cannot be planted is the phytoremediation region, and the area where neither crop can be successfully planted is the non-planting region. This classification model can effectively reduce the dangers to food and fodder safety. At the same time, this type of model can highlight areas where crops will not grow successfully (or safely) with relatively sparse sampling, meaning that agricultural producers would be able to predict areas of poor productivity [53]. These crops enter the food chain as food or fodder and cadmium contamination can severely affect human or animal health as a result [51,52].
Table 5 showed that for M. sativa and Z. mays, the proportions of the planting area unsafe for consumption accounted for 71.63% and 71.816%, respectively. Thus, based on the distribution of crops in the research area, for M. sativa and Z. mays, the plants that occupy 71.63% and 71.816% of the current planting area, respectively, present serious food safety risks. Only crops in the planting region should be used for food or fodder. Therefore, the deep utilization model of contaminated soil in our study can help to guide local crop cultivation to avoid potential food and fodder safety problems.

5. Conclusions

This study highlighted the unsafe use of agricultural land in the study area, close to Baiyin City. The results showed that an integrated approach based on toxicology experiments combined with remote sensing and GIS-based spatial analysis is an effective way to carry out agricultural land safety management. Additionally, the results showed that the safe planting region for alfalfa and maize in the study area accounted for only around 28% of the existing planting area, thus, indicating that the unsafe planting area is currently very large. The current planting method may cause serious food safety problems. In the next step of our studies, we will further explore how to improve the restoration efficiency of plants in the restoration area, prevent the expansion of unsuitable planting areas, effectively protect the existing suitable crop planting areas, and achieve sustainable and healthy development of agricultural land.

Supplementary Materials

The following are available online at https://www.mdpi.com/article/10.3390/land10121364/s1, Table S1: Surface soil properties of the study area. Data shown as mean ± SD, (n = 5).

Author Contributions

Conceptualization, Y.S. and W.L.; methodology, Y.X.; software, H.Z.; validation, W.W.; formal analysis, Y.X.; investigation, C.L.; resources, W.L.; data curation, Y.S.; writing—original draft preparation, Y.S.; writing—review and editing, W.L.; visualization, Y.S. and Y.X.; supervision, H.Z.; project administration, Y.S.; funding acquisition, W.L. All authors have read and agreed to the published version of the manuscript.

Funding

This research was funded by National Natural Science Foundation of China, grant number 41471450; earmarked fund for China Agriculture Research System, grant number CARS-34; Fundamental Research Funds for the Central Universities, grant number lzujbky-2021-ct11; funds for investigation and monitoring of typical forest, shrub, and meadow ecosystems in the vertical distribution zone of the Haibei region of the National Park, grant number QHXH-2021-017; Protection and Restoration of Muli Alpine Wetland in Tianjun County, grant number QHTM-2021-003; Opening Project of Hebei Key Laboratory of Agroecological Safety, grant number 2020SYSJJ01. The APC was funded by 2020SYSJJ01.

Data Availability Statement

The data used in this study was not permitted to share.

Acknowledgments

This work was supported by the National Natural Science Foundation of China (41471450); the earmarked fund for China Agriculture Research System (CARS-34); the Fundamental Research Funds for the Central Universities (lzujbky-2021-ct11); the funds for investigation and monitoring of typical forest, shrub, and meadow ecosystems in the vertical distribution zone of the Haibei region of the National Park (QHXH-2021-017); Protection and Restoration of Muli Alpine Wetland in Tianjun County (QHTM-2021-003), and the Opening Project of Hebei Key Laboratory of Agroecological Safety (2020SYSJJ01).

Conflicts of Interest

The authors declare no conflict of interest.

References

  1. Jie, C.; Xie, C.Y.; Hou, Z.R. Transport patterns and numerical simulation of heavy metal pollutants in soils of lead-zinc ore mines. J. Moutain Sci. 2021, 18, 2345–2356. [Google Scholar]
  2. Do Nascimento, A.R.V.J.; Cunha, G.K.G.; do Nascimento, C.W.A.; da Cunha, K.P.V. Assessing Soil Quality and Heavy Metal Contamination on Scheelite Mining Sites in a Tropical Semi-arid Setting. Water Air Soil Pollut. 2021, 232, 1–15. [Google Scholar] [CrossRef]
  3. Kebonye, N.M.; Eze, P.N.; John, K.; Agyeman, P.C.; Němeček, K.; Borůvka, L. An in-depth human health risk assessment of potentially toxic elements in highly polluted riverine soils, Příbram (Czech Republic). Environ. Geochem. Health 2021, 1–17. [Google Scholar] [CrossRef] [PubMed]
  4. Klimek, B.; Sitarz, A.; Choczyński, M.; Niklińska, M. The Effects of Heavy Metals and Total Petroleum Hydrocarbons on Soil Bacterial Activity and Functional Diversity in the Upper Silesia Industrial Region (Poland). Water Air Soil Pollut. 2016, 227, 1–9. [Google Scholar] [CrossRef] [Green Version]
  5. Feng, J.; Franks, A.E.; Lu, Z.; Xu, J.; He, Y. Assembly and variation of root-associated microbiota of rice during their vegetative growth phase with and without lindane pollutant. Soil Ecol. Lett. 2021, 3, 207–219. [Google Scholar] [CrossRef]
  6. Ding, X.; Zhao, Z.; Xing, Z.; Li, S.; Li, X.; Liu, Y. Comparison of Models for Spatial Distribution and Prediction of Cadmium in Subtropical Forest Soils, Guangdong, China. Land 2021, 10, 906. [Google Scholar] [CrossRef]
  7. Redondo-Gómez, S.; Mateos-Naranjo, E.; Andrades-Moreno, L. Accumulation and tolerance characteristics of cadmium in a halophytic Cd-hyperaccumulator, Arthrocnemum macrostachyum. J. Hazard. Mater. 2010, 184, 299–307. [Google Scholar] [CrossRef] [PubMed]
  8. Umer, S.; Hussain, M.; Arfan, M.; Rasul, F. Spatiotemporal variations of metals in urban roadside soils and ornamental plant species of Faisalabad Metropolitan, Pakistan. Int. J. Environ. Sci. Technol. 2021, 1–8. [Google Scholar] [CrossRef]
  9. Huang, H.; Li, M.; Rizwan, M.; Dai, Z.; Yuan, Y.; Hossain, M.M.; Cao, M.; Xiong, S.; Tu, S. Synergistic effect of silicon and selenium on the alleviation of cadmium toxicity in rice plants. J. Hazard. Mater. 2021, 401, 123393. [Google Scholar] [CrossRef]
  10. Zhao, Q.; Gu, C.; Sun, Y.; Li, G.; Li, L.L.; Hao, L. Root defense in salicylic acid-altering Arabidopsis plants in responses to cadmium stress. J. Plant Growth Regul. 2021, 40, 1764–1776. [Google Scholar] [CrossRef]
  11. Haider, F.U.; Liqun, C.; Coulter, J.A.; Cheema, S.A.; Wu, J.; Zhang, R.; Farooq, M. Cadmium toxicity in plants: Impacts and remediation strategies. Ecotoxicol. Environ. Saf. 2021, 211, 111887. [Google Scholar] [CrossRef]
  12. Liu, B.; Ma, X.; Ai, S.; Zhu, S.; Zhang, W.; Zhang, Y. Spatial distribution and source identification of heavy metals in soils under different land uses in a sewage irrigation region, northwest China. J. Soil Sediment. 2016, 16, 1547–1556. [Google Scholar] [CrossRef]
  13. Tan, L.; Yang, B.; Xue, Z.; Wang, Z. Assessing Heavy Metal Contamination Risk in Soil and Water in the Core Water Source Area of the Middle Route of the South-to-North Water Diversion Project, China. Land 2021, 10, 934. [Google Scholar] [CrossRef]
  14. Alexakis, D.E. Contaminated land by wildfire effect on ultramafic soil and associated human health and ecological risk. Land 2020, 9, 409. [Google Scholar] [CrossRef]
  15. Dobrikova, A.G.; Apostolova, E.L.; Hanć, A.; Yotsova, E.; Borisova, P.; Sperdouli, I.; Moustakas, M. Cadmium toxicity in Salvia sclarea L.: An integrative response of element uptake, oxidative stress markers, leaf structure and photosynthesis. Ecotoxicol. Environ. Saf. 2021, 209, 111851. [Google Scholar] [CrossRef] [PubMed]
  16. Van der Zee, L.; Remigio, A.C.; Casey, L.W.; Purwadi, I.; Yamjabok, J.; van der Ent, A.; Kootstra, G.; Aarts, M.G.M. Quantification of spatial metal accumulation patterns in Noccaea caerulescens by X-ray fluorescence image processing for genetic studies. Plant Methods 2021, 17, 2–16. [Google Scholar] [CrossRef] [PubMed]
  17. Akhter, M.F.; Omelon, C.R.; Gordon, R.A.; Moser, D.; Macfie, S.M. Localization and chemical speciation of cadmium in the roots of barley and lettuce. Environ. Exp. Bot. 2014, 100, 10–19. [Google Scholar] [CrossRef] [Green Version]
  18. Tavker, N.; Yadav, V.K.; Yadav, K.K.; Cabral-Pinto, M.; Alam, J.; Shukla, A.K.; Alhoshan, M. Removal of cadmium and chromium by mixture of silver nanoparticles and nano-fibrillated cellulose isolated from waste peels of citrus sinensis. Polymers 2021, 13, 234. [Google Scholar] [CrossRef] [PubMed]
  19. Koptsik, G.N.; Koptsik, S.V.; Smirnova, I.E.; Sinichkina, M.A. Effect of Soil Degradation and Remediation in Technogenic Barrens on the Uptake of Nutrients and Heavy Metals by Plants in the Kola Subarctic. Eurasian Soil Sci. 2021, 54, 1252–1264. [Google Scholar] [CrossRef]
  20. Dong, J.; Wu, F.B.; Zhang, G.P. Influence of cadmium on antioxidant capacity and four microelement concentrations in tomato seedlings (Lycopersicon esculentum). Chemosphere 2006, 64, 1659–1666. [Google Scholar] [CrossRef] [PubMed]
  21. Batwa-Ismail, M.Z.; Moodley, R.; Mutanga, O. Elemental analysis of soils along the South African National Road (N3)—a combined approach including statistics, pollution indicators, and geographic information system (GIS). Environ. Monit. Assess. 2021, 19, 1–16. [Google Scholar] [CrossRef] [PubMed]
  22. Facchinelli, A.; Sacchi, E.; Mallen, L. Multivariate statistical and GIS-based approach to identify heavy metal sources in soils. Environ. Pollut. 2001, 114, 313–324. [Google Scholar] [CrossRef]
  23. Dhaliwal, S.S.; Setia, R.K.; Bhatti, S.S.; Singh, J. Potential Ecological Impacts of Heavy Metals in Sediments of Industrially Contaminated Perennial Drain of India. Bull. Environ. Contam. Toxicol. 2021, 2021, 1–10. [Google Scholar] [CrossRef] [PubMed]
  24. Micó, C.; Recatalá, L.; Peris, M.; Sánchez, J. Assessing heavy metal sources in agricultural soils of an European Mediterranean area by multivariate analysis. Chemosphere 2006, 65, 863–872. [Google Scholar] [CrossRef] [PubMed]
  25. Li, Y.P.; Wang, S.L.; Prete, D.; Xue, S.Y.; Nan, Z.R.; Zang, F.; Zhang, Q. Accumulation and interaction of fluoride and cadmium in the soil-wheat plants ystem from the waste water irrigated soil of an oasis region in northwest China. Sci. Total Environ. 2017, 595, 344–351. [Google Scholar] [CrossRef] [PubMed]
  26. Niu, L.; Yang, F.; Xu, C.; Yang, H.; Liu, W. Status of metal accumulation in farmland soils across China: From distribution to risk assessment. Environ. Pollut. 2013, 176, 55–62. [Google Scholar] [CrossRef] [PubMed]
  27. Zang, F.; Wang, S.; Nan, Z.; Ma, J.; Zhang, Q.; Chen, Y.; Li, Y. Accumulation, spatio-temporal distribution, and risk assessment of heavy metals in the soil-corn system around a polymetallic mining area from the Loess Plateau, northwest China. Geoderma 2017, 305, 188–196. [Google Scholar] [CrossRef]
  28. Quispe-Jofré, A.; Philimon, P.P.; Alfaro-Lira, S. Socio-environmental conflict over abandoned mining waste in Copaquilla, Chile. Environ. Sci. Pollut. Res. 2021, 1–19. [Google Scholar] [CrossRef]
  29. Bhuiyan, M.A.H.; Parvez, L.; Islam, M.A.; Dampare, S.B.; Suzuki, S. Heavy metal pollution of coal mine-affected agricultural soils in the northern part of Bangladesh. J. Hazard. Mater. 2010, 173, 384–392. [Google Scholar] [CrossRef] [PubMed]
  30. Varol, M. Assessment of heavy metal contamination in sediments of the Tigris River (Turkey) using pollution indices and multivariate statistical techniques. J. Hazard. Mater. 2011, 195, 355–364. [Google Scholar] [CrossRef]
  31. Xia, X.Q.; Yang, Z.F.; Yu, T.; Zhang, C.S.; Hou, Q.Y. Predicting spatial and temporal variation of Cd concentration in rice grains in the Lower Changjiang Plain during 2004–2014 based on soil geochemical survey data with GIS. J. Geochem. Explor. 2019, 200, 276–283. [Google Scholar] [CrossRef]
  32. Kumar, A.; Subrahmanyam, G.; Mondal, R.; Cabral-Pinto, M.M.S.; Shabnam, A.A.; Jigyasu, D.K.; Yu, Z.G. Bio-remediation approaches for alleviation of cadmium contamination in natural resources. Chemosphere 2021, 268, 128855. [Google Scholar] [CrossRef] [PubMed]
  33. Nan, Z.R.; Zhao, C.Y. Heavy metal concentrations in gray calcareous soils of Baiyin region, Gansu province, PR China. Water Air Soil Pollut. 2000, 118, 131–142. [Google Scholar] [CrossRef]
  34. Si, W.T.; Ji, W.H.; Yang, F.; Lv, Y.; Wang, Y.; Zhang, Y. The function of constructed wetland in reducing the risk of heavy metals on human health. Environ. Monit. Assess. 2011, 181, 531–537. [Google Scholar] [CrossRef]
  35. Li, Y.; Wang, Y.-b.; Gou, X.; Su, Y.-B.; Wang, G. Risk assessment of heavy metals in soils and vegetables around non-ferrous metals mining and smelting sites, Baiyin, China. J. Environ. Sci. 2006, 18, 1124–1134. [Google Scholar]
  36. Wang, X.W.; Li, C.S. Competitive Adsorption on Exotic Heavy Metals Ions in Sediments of the Yellow River. J. Agro-Environ. Sci. 2003, 22, 693–696. [Google Scholar]
  37. Song, Y.; Jin, L.; Wang, X. Cadmium absorption and transportation pathways in plants. Int. J. Phytoremediat. 2017, 19, 133–141. [Google Scholar] [CrossRef] [PubMed]
  38. Wang, X.; Song, Y.; Ma, Y.; Zhuo, R.Y.; Jin, L. Screening of Cd tolerant genotypes and isolation of metallothionein genes in alfalfa (Medicago sativa L.). Environ. Pollut. 2011, 159, 3627–3633. [Google Scholar] [CrossRef] [PubMed]
  39. Wei, M.I.N.; Guo, H.J.; Zhang, W.; Zhou, G.W.; Jun, Y.E.; Hou, Z.A. Irrigation water salinity and N fertilization: Effects on ammonia oxidizer abundance, enzyme activity and cotton growth in a drip irrigated cotton field. J. Integr. Agric. 2016, 15, 1121–1131. [Google Scholar]
  40. Tu, C.; Ma, L.Q. Effects of arsenic concentrations and forms on arsenic uptake by the hyperaccumulator ladder brake. J. Environ. Qual. 2002, 31, 641–647. [Google Scholar] [CrossRef]
  41. Flores-Cáceres, M.L.; Hattab, S.; Hattab, S.; Boussetta, H.; Banni, M.; Hernández, L.E. Specific mechanisms of tolerance to copper and cadmium are compromised by a limited concentration of glutathione in alfalfa plants. Plant. Sci. 2015, 233, 165–173. [Google Scholar] [CrossRef]
  42. Retamal-Salgado, J.; Matus, I.; Walter, I.; Hirzel, J. Absorption and distribution of cadmium of three maize hybrids in three environments. J. Soil Sci. Plant Nutr. 2017, 17, 266–278. [Google Scholar] [CrossRef] [Green Version]
  43. Shakeel, A.A.; Mohsin, T.; Saddam, H.; Mingchen, B.; Wang, L.C.; Imran, K.; Ehsan, U.; Shahbaz, A.T.; Rana, A.S.; Babar, S. Cadmium toxicity in Maize (Zea mays L.): Consequences on antioxidative systems, reactive oxygen species and cadmium accumulation. Environ. Sci. Pollut. Res. 2015, 22, 17022–17030. [Google Scholar]
  44. FAO/WHO. Joint FAO/WHO Food Standard Programme, Codex Committee on Food Additives and Contaminants; 38th Session; FAO: Rome, Italy, 2006. [Google Scholar]
  45. FAO/WHO. Joint FAO/WHO Expert Committee on Food Additives; Technical Report Series, 631; WHO: Geneva, Switzerland, 1978. [Google Scholar]
  46. Liu, H.; Probst, A.; Liao, B. Metal contamination of soils and crops affected by the Chenzhou lead/zinc mine spill (Hunan, China). Sci. Total Environ. 2005, 339, 153–166. [Google Scholar] [CrossRef] [PubMed] [Green Version]
  47. Nicholson, F.A.; Smith, S.R.; Alloway, B.J.; Carlton-Smith, C.; Chambers, B.J. An Inventory of Heavy Metals Inputs to Agricultural Soils in England and Wales. Sci. Total Environ. 2003, 311, 205–219. [Google Scholar] [CrossRef]
  48. Kumar, A.; Mishra, R.K.; Sarma, K. Mapping spatial distribution of traffic induced criteria pollutants and associated health risks using kriging interpolation tool in Delhi. J. Transp. Health 2020, 18, 100879. [Google Scholar] [CrossRef]
  49. Shukla, K.; Kumar, P.; Mann, G.S.; Khare, M. Mapping spatial distribution of particulate matter using Kriging and Inverse Distance Weighting at supersites of megacity Delhi. Sustain. Cities Soc. 2020, 54, 101997. [Google Scholar] [CrossRef]
  50. Das, A.C.; Noguchi, R.; Ahamed, T. Integrating an Expert System, GIS, and Satellite Remote Sensing to Evaluate Land Suitability for Sustainable Tea Production in Bangladesh. Remote Sens. 2020, 12, 4136. [Google Scholar] [CrossRef]
  51. Selmy, S.A.; Al-Aziz, S.H.A.; Jiménez-Ballesta, R.; García-Navarro, F.J.; Fadl, M.E. Soil Quality Assessment Using Multivariate Approaches: A Case Study of the Dakhla Oasis Arid Lands. Land 2021, 10, 1074. [Google Scholar] [CrossRef]
  52. Römkens, P.F.A.M.; Salomons, W. Cd, Cu, and Zn solubility in arable and forest soils: Consequences of land use changes for metal mobility and risk assessment. Soil Sci. 2000, 163, 859–871. [Google Scholar] [CrossRef]
  53. Alexakis, D.E. Multielement contamination of land in the margin of highways. Land 2021, 10, 230. [Google Scholar] [CrossRef]
Figure 1. The experiment design of the deep utilization model.
Land 10 01364 g001
Figure 2. Map of the study area and the sampling sites.
Land 10 01364 g002
Figure 3. Soil cadmium concentration in sample region at the same depth and different distances. (A) means 0–20 cm depth; (B) means 20–40 cm depth; and (C) means 40–60 cm depth. In addition, 1, 101, 201, and 301 indicate distances in meters from the edge of the stream. Sample region one (D1–D5) is located along the Dongdagou stream between Liangjiayao to Shahekou. Sample region two (X1–X5) is located in the upstream area of Xidagou between Liujiayao and Shuichuan. Sample region three (H1–H5) is located along the Yellow River between Silong and Zhongbao. Sample size (n = 5). Bars represent standard errors.
Land 10 01364 g003
Figure 4. Soil cadmium concentration in sample region at the same distance and different depths. (AD) indicate distances of 1 m, 101 m, 201 m, and 301 m away from the edge of the stream, respectively. Furthermore, 0–20 means 0–20 cm depth; 20–40 means 20–40 cm depth; 40–60 means 40–60 cm depth. Sample region one is the Dongdagou stream, sample region two is the Xidagou stream, and sample region three is the Yellow River. Sample size (n = 5). Bars represent standard errors.
Land 10 01364 g004
Figure 5. Frequency analysis of the soil cadmium concentration.
Land 10 01364 g005
Figure 6. Relative root growth rate (root biomass of plant growth with and without Cd2+) of M. sativa (a) and Z. mays (b) seedlings in different CdCl2 concentrations. Sample size (n = 5). Bars represent standard errors. Values in a column followed by the same letter are not significantly different (p < 0.05).
Land 10 01364 g006
Figure 7. Subcellular location of cadmium in M. sativa (C,D) and Z. mays (G,H) roots exposed to 25 mg kg−1 cadmium for 144 h. (A,B,E,F) show the specimens prior to cadmium treatment. Images (A,C,E,G) were obtained by SEM. Graphs (B,D,F,H) are the spectra detected by EDX, which reflect the white deposits indicated by the arrows on the images on the left. The EDX spectra demonstrate that the deposition areas contain cadmium. In terms of labels, co refers to the cortex; p refers to the phloem; me refers to the metaxylem; pr refers to the protoxylem; pe refers to the pericycle; and en refers to the endodermis. The arrows represent cadmium deposition sites.
Land 10 01364 g007
Figure 8. Subcellular determination of cadmium in M. sativa (C,D) and Z. mays (G,H) stems exposed to 25 mg kg−1 cadmium for 144 h. Images (A,B,E,F) show the specimens prior to cadmium treatment. Images (A,C,E,G) were obtained by SEM. Graphs (B,D,F,H) are the spectra detected by EDX, which reflect the white deposits indicated by the arrows on the images on the left. The EDX spectra demonstrate that the deposition areas contain cadmium. In terms of labels, pp refers to the primary phloem; px refers to the primary xylem; c refers to the cambium; p refers to the phloem; me refers to the metaxylem; pr refers to the protoxylem; and bs refers to the bundle sheath. The arrows represent cadmium deposition sites.
Land 10 01364 g008
Figure 9. Estimated spatial distribution map of cadmium concentrations across the study area.
Land 10 01364 g009
Figure 10. Spatial distribution of cultivated land in the study area.
Land 10 01364 g010
Figure 11. Spatial distribution for deep utilization management patterns.
Land 10 01364 g011
Table 1. Summary of maximum allowable cadmium concentrations in soil and fodder.
VarietySoilFodder
pH < 6.56.5 < pH < 7.5pH > 7.5Compound Feed
Cd concentration (mg kg−1)0.30.30.60.5
Table 2. Cadmium levels in root, stem, and leaf in M. sativa and Z. mays under different cadmium treatments.
Soil Cadmium Concentration (mg kg−1)Cadmium Concentration in Medicago sativa (mg kg−1)Cadmium Concentration in Zea mays (mg kg−1)
RootStemLeafRootStemLeaf
0.150.31 ± 0.03a0.13 ± 0.01a0.09 ± 0.01a0.30 ± 0.03a0.14 ± 0.01a0.07 ± 0.01a
1359.14 ± 19.87b37.79 ± 13.64b25.71 ± 12.38b204.88 ± 11.87b63.81 ± 5.64b28.59 ± 3.38b
3616.04 ± 31.75c56.31 ± 20.18cd36.59 ± 18.98b580.73 ± 62.75c153.49 ± 17.18c79.41 ± 9.98c
51337.51 ± 124.21bc47.41 ± 13.83bc35.35 ± 18.04b854.46 ± 89.21d324.61 ± 37.83d118.69 ± 13.04d
101280.38 ± 108.21d71.70 ± 31.66d67.33 ± 41.21c1289.45 ± 138.21e798.96 ± 82.66e393.37 ± 42.21e
151456.33 ± 142.30de129.71 ± 52.27e105.52 ± 53.25d1159.67 ± 122.30e518.65 ± 64.27ed281.97 ± 31.25e
201576.14 ± 153.22ef148.78 ± 47.60f122.58 ± 63.53e1177.62 ± 123.22e697.23 ± 72.60ef358.14 ± 38.53e
251662.63 ± 175.33f157.47 ± 61.26f139.43 ± 70.52f1528.70 ± 165.33f811.42 ± 86.26f465.46 ± 53.52f
Note: Values followed by the same letter are not significantly different (p < 0.05). Sample size (n = 5).
Table 3. Cadmium translocation factors (TF) and bioconcentration factors (BCF) in M. sativa and Z. mays as influenced by different cadmium treatment concentrations.
Cd Concentration
(mg kg−1)
M. sativaZ. mays
TFBCFTFBCF
10.10 ± 0.0c36.6 ± 0.1d0.23 ± 0.1a46.3 ± 0.6c
30.08 ± 0.1ab15.4 ± 0.1c0.20 ± 0.1a38.8 ± 0.8b
50.03 ± 0.1a8.31 ± 0.2b0.26 ± 0.0ab44.4 ± 1.3c
100.05 ± 0.1a6.94 ± 0.3a0.33 ± 0.0b39.1 ± 2.3b
150.08 ± 0.1b7.83 ± 0.3ab0.36 ± 0.0b24.7 ± 4.2a
200.09 ± 0.1b6.76 ± 0.3a0.42 ± 0.1c23.7 ± 5.1a
250.09 ± 0.1bc5.93 ± 0.4a0.39 ± 0.1bc26.9 ± 5.6a
Note: values followed by the same letter are not significantly different (p < 0.05). Sample size (n = 5).
Table 4. Aboveground and underground biomass of M. sativa and Z. mays seedlings in different CdCl2 concentrations. Data shown as mean ±SD, (n = 5).
Cadmium Concentration (mg kg−1)Aboveground Biomass (g)Underground Biomass (g)
M. sativaZ. maysM. sativaZ. mays
00.041 ± 0.011a0.235 ± 0.047a0.0096 ± 0.011a0.053 ± 0.012a
10.042 ± 0.009a0.242 ± 0.029a0.0094 ± 0.009a0.052 ± 0.013a
30.039 ± 0.008b0.239 ± 0.026b0.0091 ± 0.008b0.052 ± 0.011a
50.038 ± 0.009bc0.238 ± 0.023bc0.0086 ± 0.006c0.048 ± 0.009b
100.037 ± 0.006c0.233 ± 0.031c0.0072 ± 0.004d0.039 ± 0.006c
150.035 ± 0.004d0.219 ± 0.026cd0.0055 ± 0.004e0.033 ± 0.003d
200.031 ± 0.004de0.208 ± 0.019d0.0051 ± 0.003f0.027 ± 0.001e
250.021 ± 0.002f0.097 ± 0.005e0.0046 ± 0.002g0.022 ± 0.002f
Note: Values in a column followed by the same letter are not significantly different (p < 0.05).
Table 5. Areas of three classified regions for M. sativa and Z. mays.
TypeM. sativaZ. mays
Area (km2)Ratio (%)Area (km2)Ratio (%)
Non-planting region7.4435.647.4435.65
Planting region5.92428.3745.88428.184
Phytoremediation region7.51435.9947.5536.17
Publisher’s Note: MDPI stays neutral with regard to jurisdictional claims in published maps and institutional affiliations.

