Article

Application of Risk Analysis in the Screening of Flood Disaster Hot Spots and Adaptation Strategies

Department of Soil and Water Conservation, National Chung Hsing University, Taichung 402202, Taiwan
*
Author to whom correspondence should be addressed.
Land 2022, 11(1), 36; https://doi.org/10.3390/land11010036
Submission received: 13 November 2021 / Revised: 22 December 2021 / Accepted: 24 December 2021 / Published: 26 December 2021

Abstract

:
In recent years, Taiwan has established a sound flood control foundation in terms of river management. Due to climate change and land development, surface runoff has increased. In addition, the functions of flood control engineering facilities have their limits. Surface runoff cannot be fully absorbed by rivers, and frequent floods still occur in some areas. According to the characteristics of water flowing along the terrain to low-lying land, the terrain features can be used to find out the hot areas prone to flooding and the appropriate location of flood storage space for improving flooding. On the basis of the natural terrain environment, the disaster risk framework is used to manage environmental complexity, and to carry out research on flood warning and governance decision-making systems, so that human beings can coexist with the uncertainty of flood risk. In this study, the Zhuoshuixi Basin was used as the sample area, the SCS-CN method was used to analyze the excess runoff, and the risk concept was used to establish a flood evaluation model. In addition, through the changes in land use, the SCS-CN method estimates the difference of potential maximum retention, quantifies the variation of excess rainfall in each watershed division, and uses the digital elevation model to calculate the depression site to analyze the relationship between the difference of potential maximum retention and the depression space of the watershed. The results show that the adaptation strategy for high-risk flooded areas should be strengthened, and areas with large water storage space and a small potential maximum retention difference can be the best location for offsite compensation.

1. Introduction

Taiwan is located on the northwest side of East Asia and the Pacific, between tropical and subtropical. At the end of spring and in early summer each year, stagnant fronts generated by the confrontation of hot and cold air masses and typhoons generated by tropical depressions in summer and autumn are the two main rainfall periods of the year. In addition, due to the steep terrain, the rapid flow of water during rainfall is prone to flooding. Therefore, in order to protect the safety of people’s lives and property, the government built embankments on both sides of the waterway to limit floods within the revetment. Under the influence of climate change and urbanization trends, waterway governance has reached the once-in-100-year protection standard in the past, but inland water urban areas still suffer from flooding. We should realize that no flood control measures are absolutely guaranteed, but a complex comprehensive flood control method needs to be considered [1]. Therefore, it is necessary to transform from protecting social and economic development from external shocks to integrating risk management, advocating a risk-based proactive strategy, and transforming disaster management into risk management [2]. IPCC AR5 takes climate change assessment as the core, and considers the possibility of causing valuable things to be in an uncertain hazard as a risk. It is usually expressed as the probability of hazardous events or trends multiplied by the consequences of these events or trends [3,4], as shown in the following formula:
R i s k = hazard × vulnerability × exposure
The comprehensive analysis of risk usually assesses the elements and their vulnerabilities exposed to the hazardous probability scenarios. The change in the perspective of urban flood risk analysis should be from a single disaster to multiple disasters, from silo to system analysis [5].
Hazard refers to external factors that specify the type and intensity of the hazard [6,7], which are natural or man-made physical events or trends [3]. Vulnerability can be regarded as an internal factor [6,7], including sensitivity, vulnerability to disasters, and lack of ability to cope and adapt [3]. It is the result of dynamic interaction [8], and is usually calculated by statistical analysis of the area-specific damage data [9,10]. Exposure is where human lives, infrastructure, economic, or social may be adversely affected [3]. Based on the possibility of avoiding future flood damage, and the vulnerability assessment of flood damage and economic benefits obtained through flood reduction, the benefits of flood prevention can be further understood [11]. In addition, in order to effectively understand and reduce the risk of natural disasters, it is necessary to understand the cost of natural disasters. Incorporating cost assessment into risk management can support decision makers to choose appropriate risk mitigation measures [12].
The risk of flooding caused by climate change is becoming more serious. In addition to traditional flood control countermeasures, it is hoped that land use management and control will be used to respond. Catchment-Based Flood Management (CBFM) in the UK includes any type of intervention aimed at changing land use, land management, upstream river channels, and floodplains to reduce the frequency and severity of flooding [13]. Among them, natural flood management (NFM) aims to reduce flood risk through natural processes, and to potentially promote integrated flood risk management and engineering solutions by providing landscape-based climate change impact flexibility [14], and has been promoted as a traditional flood sustainable alternative to management [15].
In this study, the Zhuoshuixi Basin was used as a sample area. The current flooding models are roughly divided into distributed or lumped models, but in the past, they were mostly lumped models. For example, HEC-HMS [16], which is widely used at present, mainly calculates the water volume of each grid in the flooded area. These integrated models are popular due to their simplicity and low computational cost [17], but it is difficult to calculate where the source of water comes from. Therefore, the use of distributed models can better represent spatial variability and can produce more reliable results [18], and the distributed model not only requires complex formulas to simulate multiple physical processes, but also requires fine spatial resolution to capture large-scale flood dynamics [19], which requires a huge amount of calculation and complexity. Therefore, it is necessary to keep the advantages of the distributed model and propose a simple and fast evaluation method without a loss of accuracy. The SCS-CN method has this feature. It is developed by the Natural Resources Conservation Service (NRCS), US Department of Agriculture (USDA). In the absence of sufficient hydrological data, runoff can be effectively estimated [20], and factors such as soil, land use, and topographic characteristics can be considered [21]. The digital elevation model is used to automatically delineate the source area of runoff generation, and through the hydrological evaluation model and on-site survey to establish the depression storage location data, it is known that surface runoff can be controlled by the construction of a depression location [22]. Using the concept of risk, the SCS-CN method is used to find out the correlation between runoff changes and the space of depressions, to assess the flooding risk hot areas in the basin, and to explore the source of flooding. Therefore, in terms of long-term planning, if land use is designed as a disaster mitigation measure, its safety is much higher than that of engineering flood control [23].

2. Materials and Methods
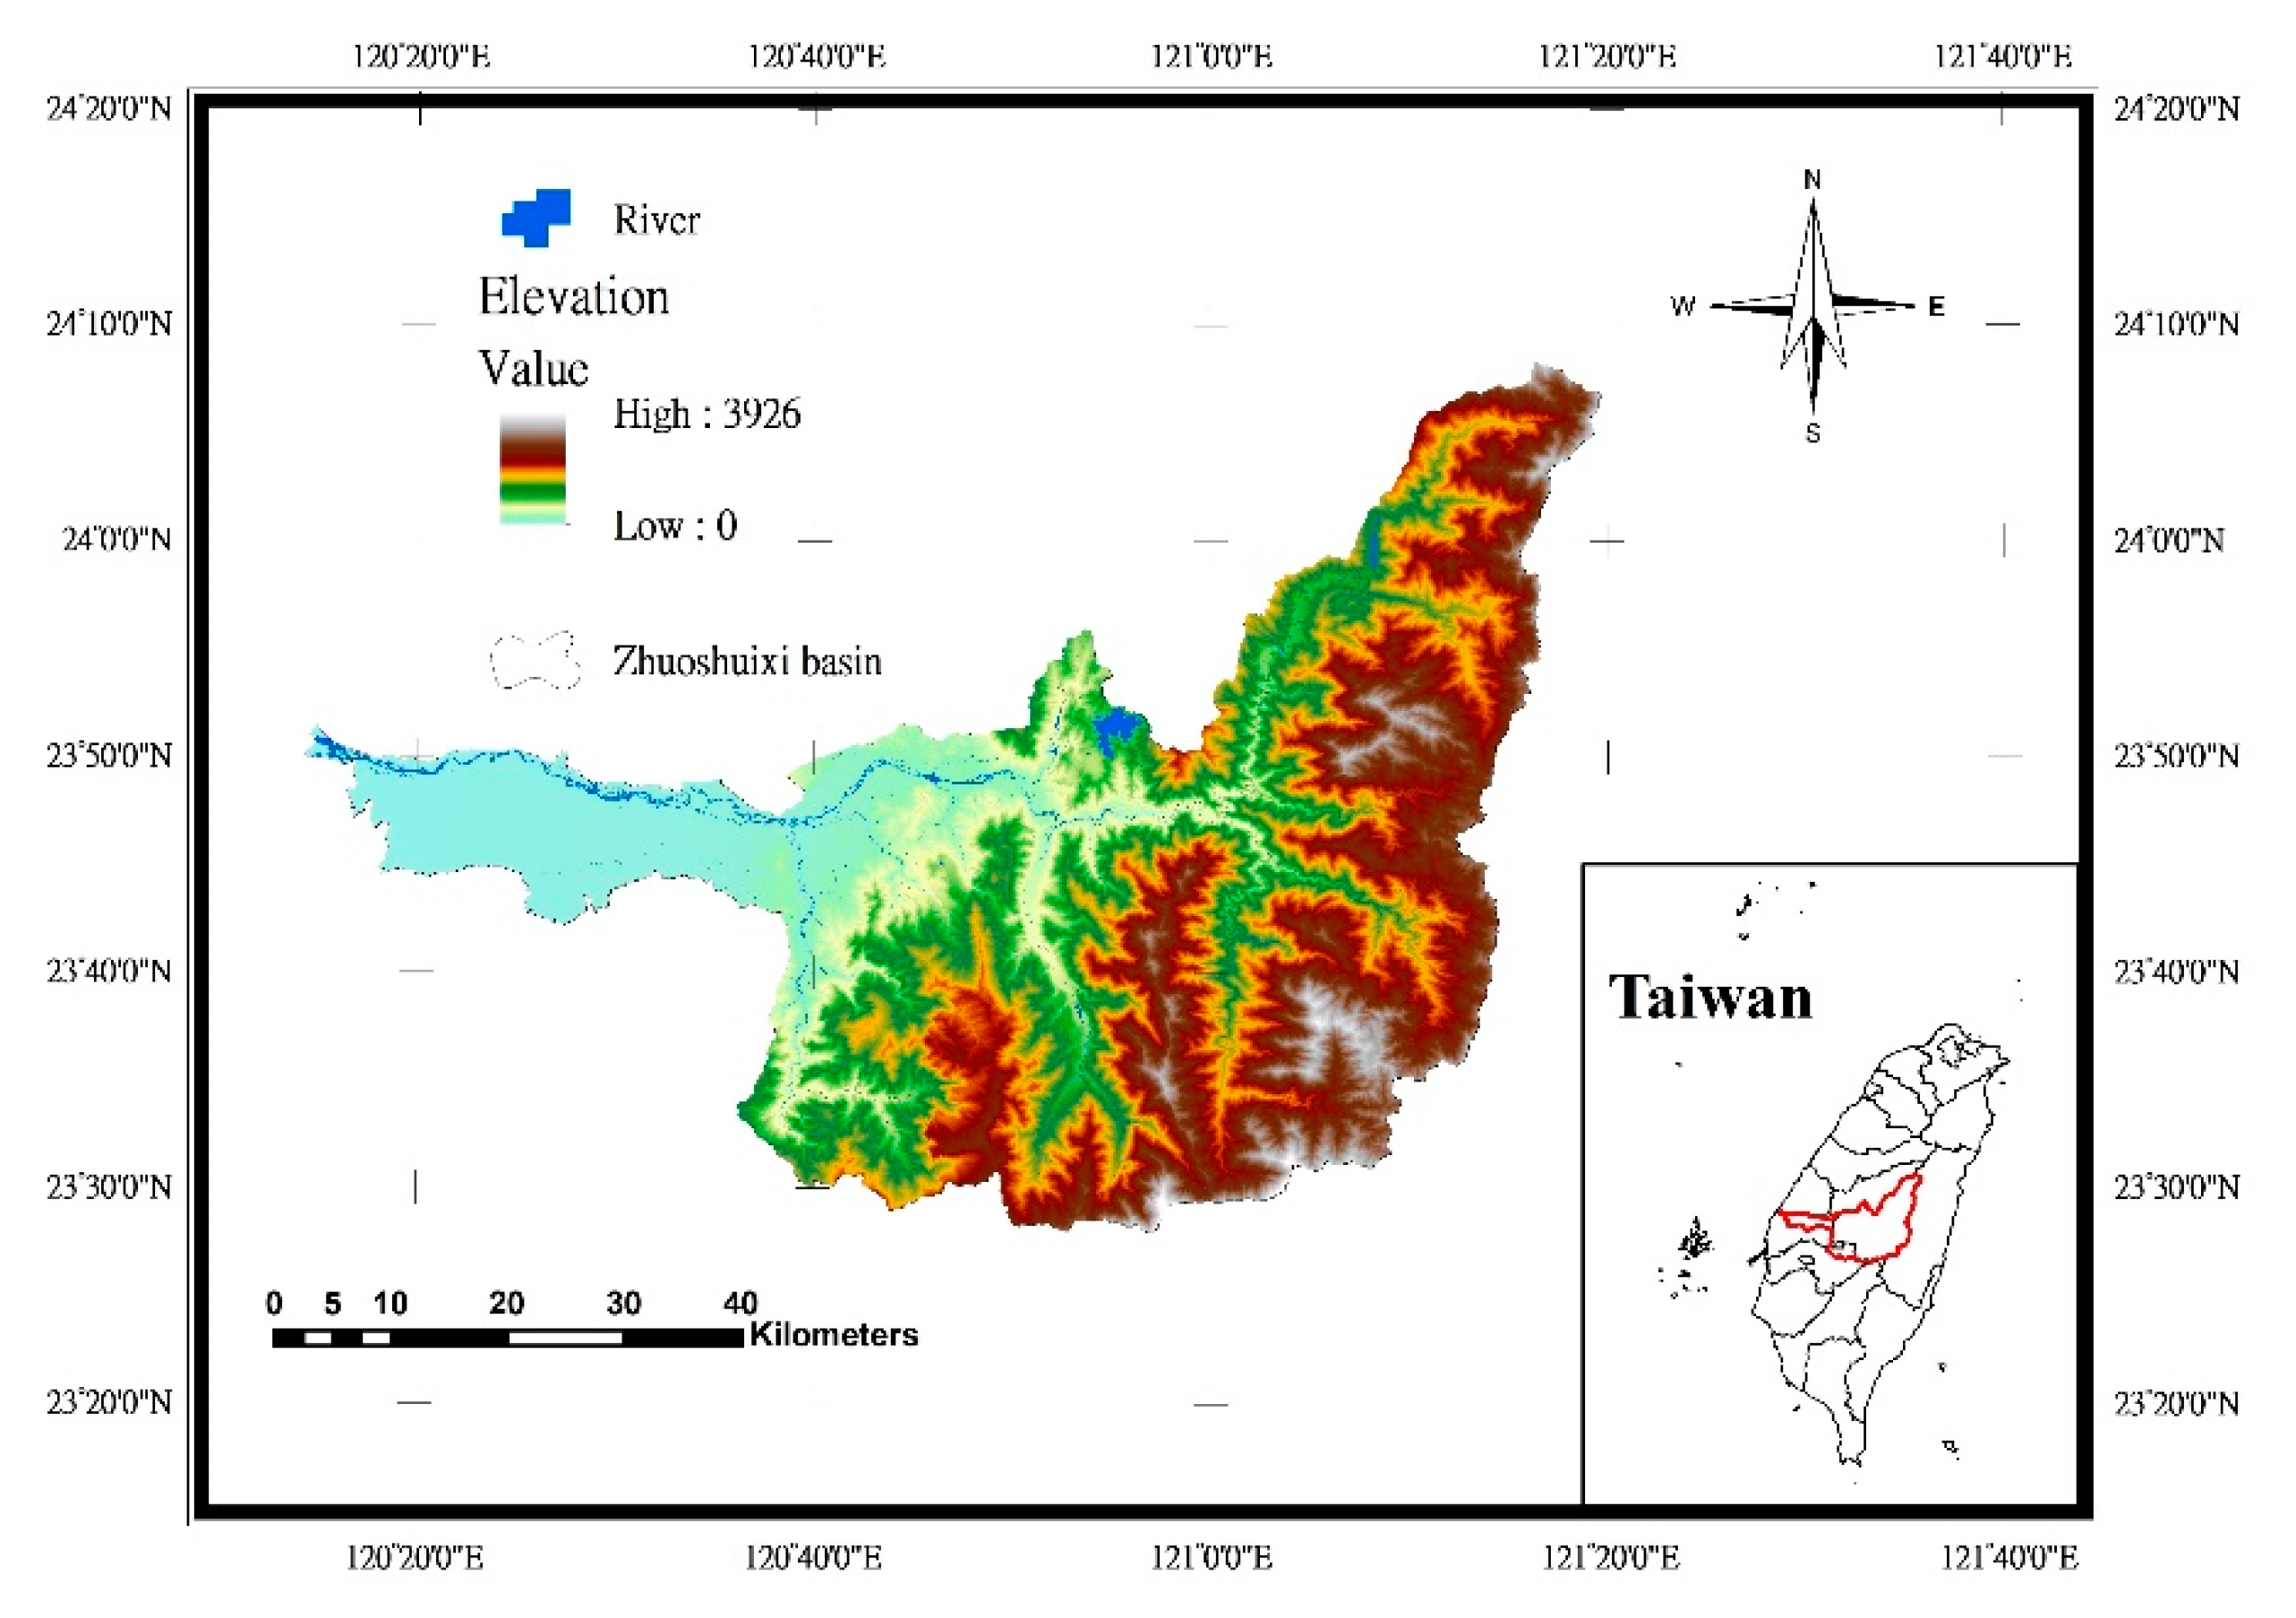
2.1. Study Area

The basin covers an area of 3257 square kilometers and is located in central Taiwan. It is the longest river in Taiwan, with a total length of 186.6 km and an average annual rainfall of about 2459 mm. Figure 1 shows the scope of the study area; the terrain has a large elevation difference, the main slope is six grades (>55%), and the highest elevation is 3926 m. The flowing water carries a lot of sediment, which causes turbidity in the four seasons.

2.2. Study Materials

This study uses data published by various government departments, as shown in Table 1, to establish a flooding risk analysis model and land adaptation area classification. The historical rainfall and flow data are from the Water Resources Agency of Ministry of Economic Affairs, and are used to calculate the excess runoff and flow in the catchment area in the 100-year return period scenario. The DEM uses the data published by the Department of Land Affairs of the Ministry of the Interior, and the grid information is 20 m × 20 m for the terrain analysis, slope units, and TWI extraction. In addition, the land use map of the National Land Surveying and Mapping Center and the soil map of the Agricultural Research Institute were used to filter out the spatial distribution of depression sites.

2.3. Management Subdivisions

When river governance is likened to the concept of human health, various health conditions are often assessed through relevant indicators, and then the root cause of the problem is diagnosed, and treatments are prescribed to improve the condition [24]. Therefore, exploring the root of the problem during river governance is not based on the assessment of the entire river basin. The assessment model should be accurately used to analyze the hot spots and propose management strategies. In this study, the catchment zone was set up in the basin, and the catchment zone was further divided into three slope management units: the source, the left bank, and the right bank by the water system. We calculated the flow direction by DEM [25] to establish a grid of cumulative flow, and the grid with a cumulative flow greater than or equal to the threshold (50 ha threshold used in the study) is the water system network [26]. The spatial distribution of the specific watershed is delineated in Figure 2a, and then the specific watershed was further subdivided into right bank, left bank and headwater (if existing) areas for the sake of homogeneity for management division (Figure 2b).

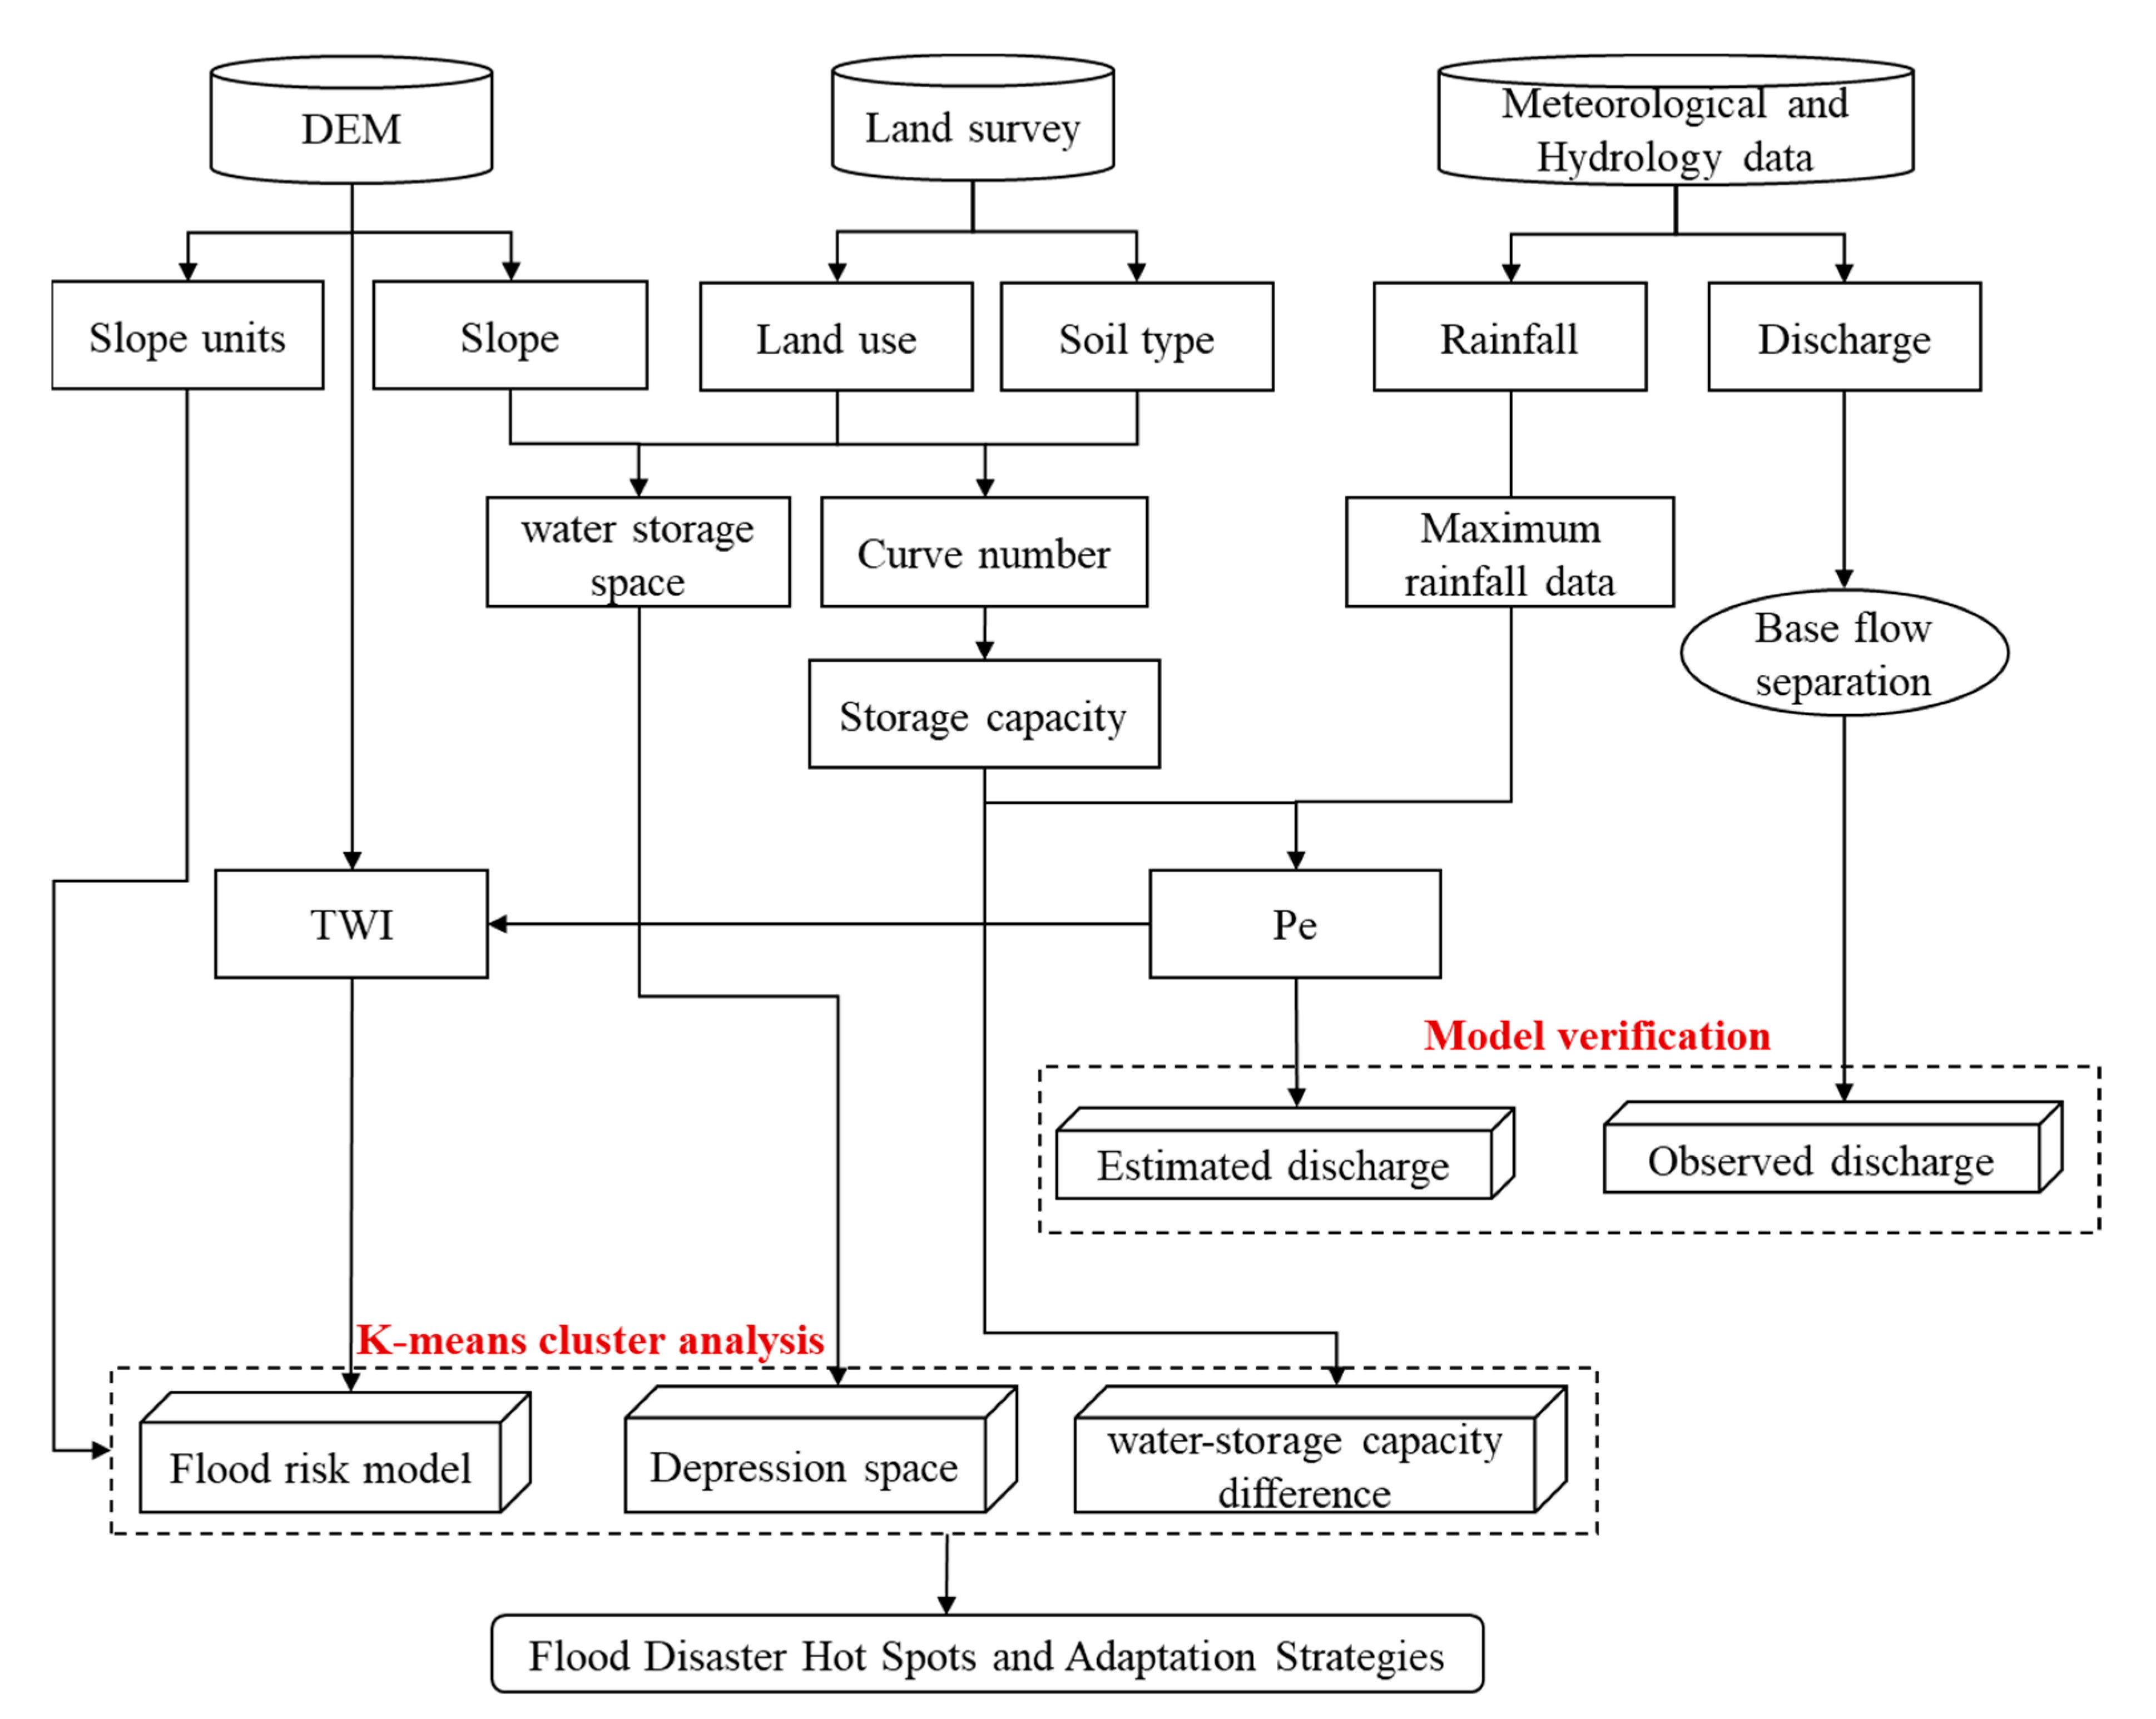
2.4. Analytical Method

Regarding the storage capacity as the benefit value of mitigating downstream flooding, an effective adjustment strategy is proposed. The research flow chart is shown in Figure 3.

2.4.1. Risk Analysis

Most of the river embankments in the Zhuoshuixi Basin have been constructed, and the flooding incidents are mainly low points affected by the terrain. In order to understand the movement of runoff through the terrain, there should be an overall catchment monitoring mechanism. Risk analyses are performed to satisfy regulatory requirements [27]. According to the risk concept in IPCC (2014), a quantitative risk model can be provided for disaster risk analysis. Take the excessive runoff that causes flooding disasters as the hazard, and when the surface excess runoff is generated, its value is equal to the excess rainfall (Pe), and the topographic wetness index (TWI) refers to the control of soil moisture by topography. The soil moisture content can be reflected through the terrain, that is, the smoother the slope, the higher the soil moisture content, and the easier it is for runoff to collect and form flooding, which is then used as a vulnerability. In terms of the movement pattern of surface runoff, all areas of the movement path are exposed to risks. The model can be expressed as follows:
R i s k = Pe × TWI
The indicators used in the study are individually normalized within the range of 0–1. This normalization method eliminates the influence of different dimensions between data sets. The normalization formula can be written as:
X n o m = ( X X min ) ( X max X min )
where Xnom is the normalized value of the index, X represents original value, and Xmax and Xmin indicate the maximum and minimum value of the index, respectively.

Index of Hazard

The term hazard usually refers to a physical event or trend related to the climate or its physical impact [3]. This study uses the data of 23 rainfall stations, and uses the Gumbel distribution (Extreme Value distribution Type-I) method to compare the data from 1985 to 2019. The 100-year return period rainfall of each station were derived based on the maximum daily rainfall in a year, and then use the Kriging method to get the historical maximum rainfall data from 1985 to 2019 to calculate the 100-year return period rainfall distribution, as shown in Figure 4a. Because the SCS-CN method is one of the most popular methods for calculating direct surface runoff from heavy rainfall [28,29,30], the runoff curve method developed by the US Soil and Water Conservation Agency is used to estimate excess precipitation (Pe), namely Equations (4) and (5), and because the setting of rainfall stations is limited to the influence of terrain and funding, there are not enough stations to reflect the overall rainfall situation of the basin, so the SCS-CN method can be used to calculate the runoff distribution related to the actual trend in a short time, and to normalize it as shown in Figure 4b. Therefore, considering that the 100-year return period is the current standard set by Taiwan for the protection of settlements in the Zhuoshuixi Basin, the Pe estimated by this method is used as the hazard of flooding disaster risk.
S ( mm ) = 25400 CN 254
Pe = ( P 0.2 S ) 2 ( P + 0.8 S )

Index of Vulnerability

Vulnerability includes various concepts and elements, including sensitivity or susceptibility to injury and lack of coping and adaptability [3]. Topographic conditions can reflect the impact on the runoff of the watershed [31], so the topographic wetness index (TWI) extracted by DEM is used to judge the correlation between topography and stagnant water. TWI is an important indicator of the hydrological model TOPMODEL. Kirkby and Weyman first calculated the saturation water level and calculated the topographic index at that point. Later, the topographic humidity index was derived [32], the concept is that the steeper the slope, the faster the water flows downwards, so the infiltration rate will be lower, and the soil moisture content will be lower. So, it can reflect the degree of water accumulation on the surface when runoff occurs in each grid. The calculation method is Equation (6), and the calculation results and normalization results are shown in Figure 5. The larger the TWI value, the smoother the terrain and the easier it is to accumulate water. Therefore, it has the sensitivity to judge the degree of flood damage and is an indicator of vulnerability.
TWI = ln ( A s tan β )
where As is the area of a specific catchment area and β is the grid slope.

2.4.2. Water Storage Capacity

The proper corresponding hydraulic soil parameters of a watershed from the Soil Conservation service curve number can be used in the physically-based infiltration equations for an accurate estimate of the direct runoff of the watershed [33]. Land use is the main environmental factor affecting the degree of flood disasters [34]. Therefore, this study divided the soil texture of the Zhuoshuixi Basin into categories A, B, C, and D, according to the USDA Natural Resources Conservation Service (Table 2). Soil classification A has a good water permeability and is mostly sandy soil, which is easy to penetrate into the ground, and is not easy to produce direct runoff, while classification D has the worst water permeability and is mostly clay soil, which is the easiest to produce runoff. The SCS soil classification is then overlapped with the land use data by using GIS software, corresponding to its CN value, according to Table 3, and then the water storage capacity is calculated.

2.4.3. Extraction of Water Storage Space

In this study, the water-storable space is extracted from existing depression sites and flat land with a slope of less than 5%, and land use is deducted as the scope of construction land. Depression means short-term accumulation of water, which can be divided into natural and artificial depression locations according to its type. Natural depressions are natural low-lying places on slopes or river deep pools; artificial depressions are flood detention facilities such as reservoirs, ponds, and ponds. Using the height difference method combined with the inclined plane method to establish the initial flow direction of the depression, the threshold value or source tracing method is used to extract the water system network, and then the DEM data are used to calculate the elevation difference of the surrounding grid, and the middle and downstream grids of the water system network are calculated [28]. The middle and downstream grid elevation of the river system network is greater than that of the upstream grid as a depression location. In areas with relatively gentle slopes, the surface water flows more slowly, causing runoff to collect easily. Therefore, considering that the area of storage locations on slopes is less, locations with slopes less than 5% are also included as storage hotspots.

2.4.4. K-means Clustering

K-means is a numerical, unsupervised, and non-deterministic iterative method. It is simple and fast; this method has proven to be a very effective method that can produce good clustering results [35]. A cluster is collections of data object that are similar to one another that are in the same cluster and dissimilar to the objects that are in other clusters. Cluster analysis is a tool that is used to observe the characteristics of cluster and to focus on a particular cluster for further analysis [36]. Therefore, it can be applied to analyze the impact of various environmental indicators in the management area. In order to better understand the degree of flooding distribution and quickly assess the spatial location that can improve runoff generation in the upstream of the flooded area, the flooding risk is divided into five categories and the spatial improvement location is divided into three categories for discussion.

2.4.5. SOBEK Hydrological Model

The SOBEK hydrological model is a simulation system tool jointly developed by Delft Hydraulics and the National Dutch Institute of Inland Water Management and Wastewater Treatment, which includes flood forecasting, drainage system optimization, and river course calculations. The generation of Taiwan’s flood potential map is mainly analyzed by the SOBEK Model [37]. Therefore, the results of the SOBEK hydrological model certified by the government are used to compare and verify the flood distribution with the conceptual model proposed in this study.

3. Results

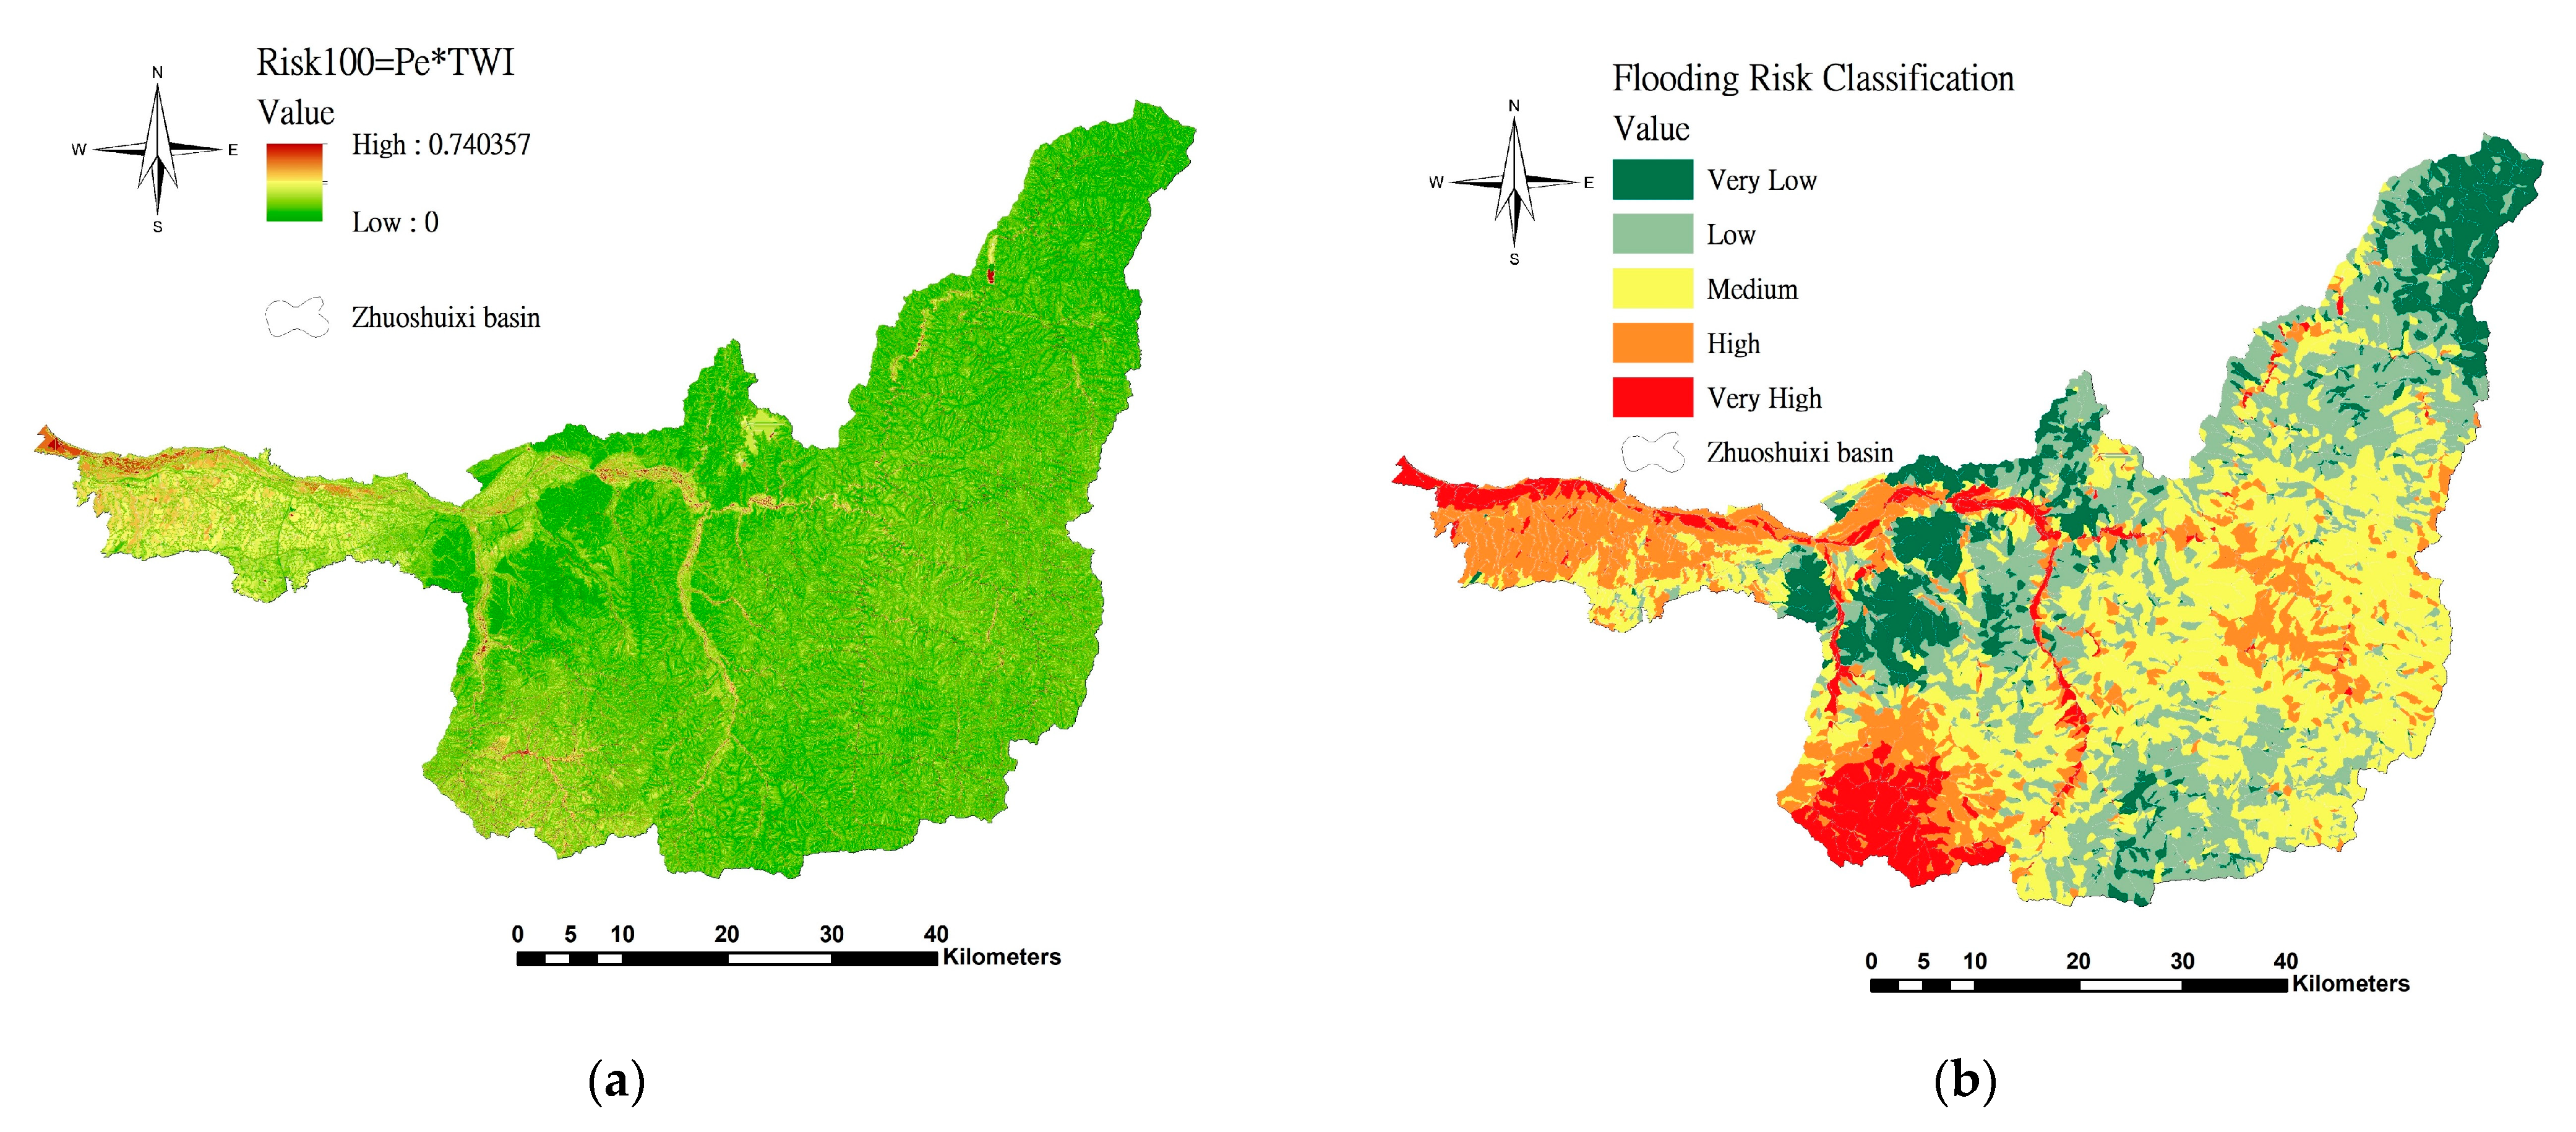
3.1. Analysis of Flood Risk Model

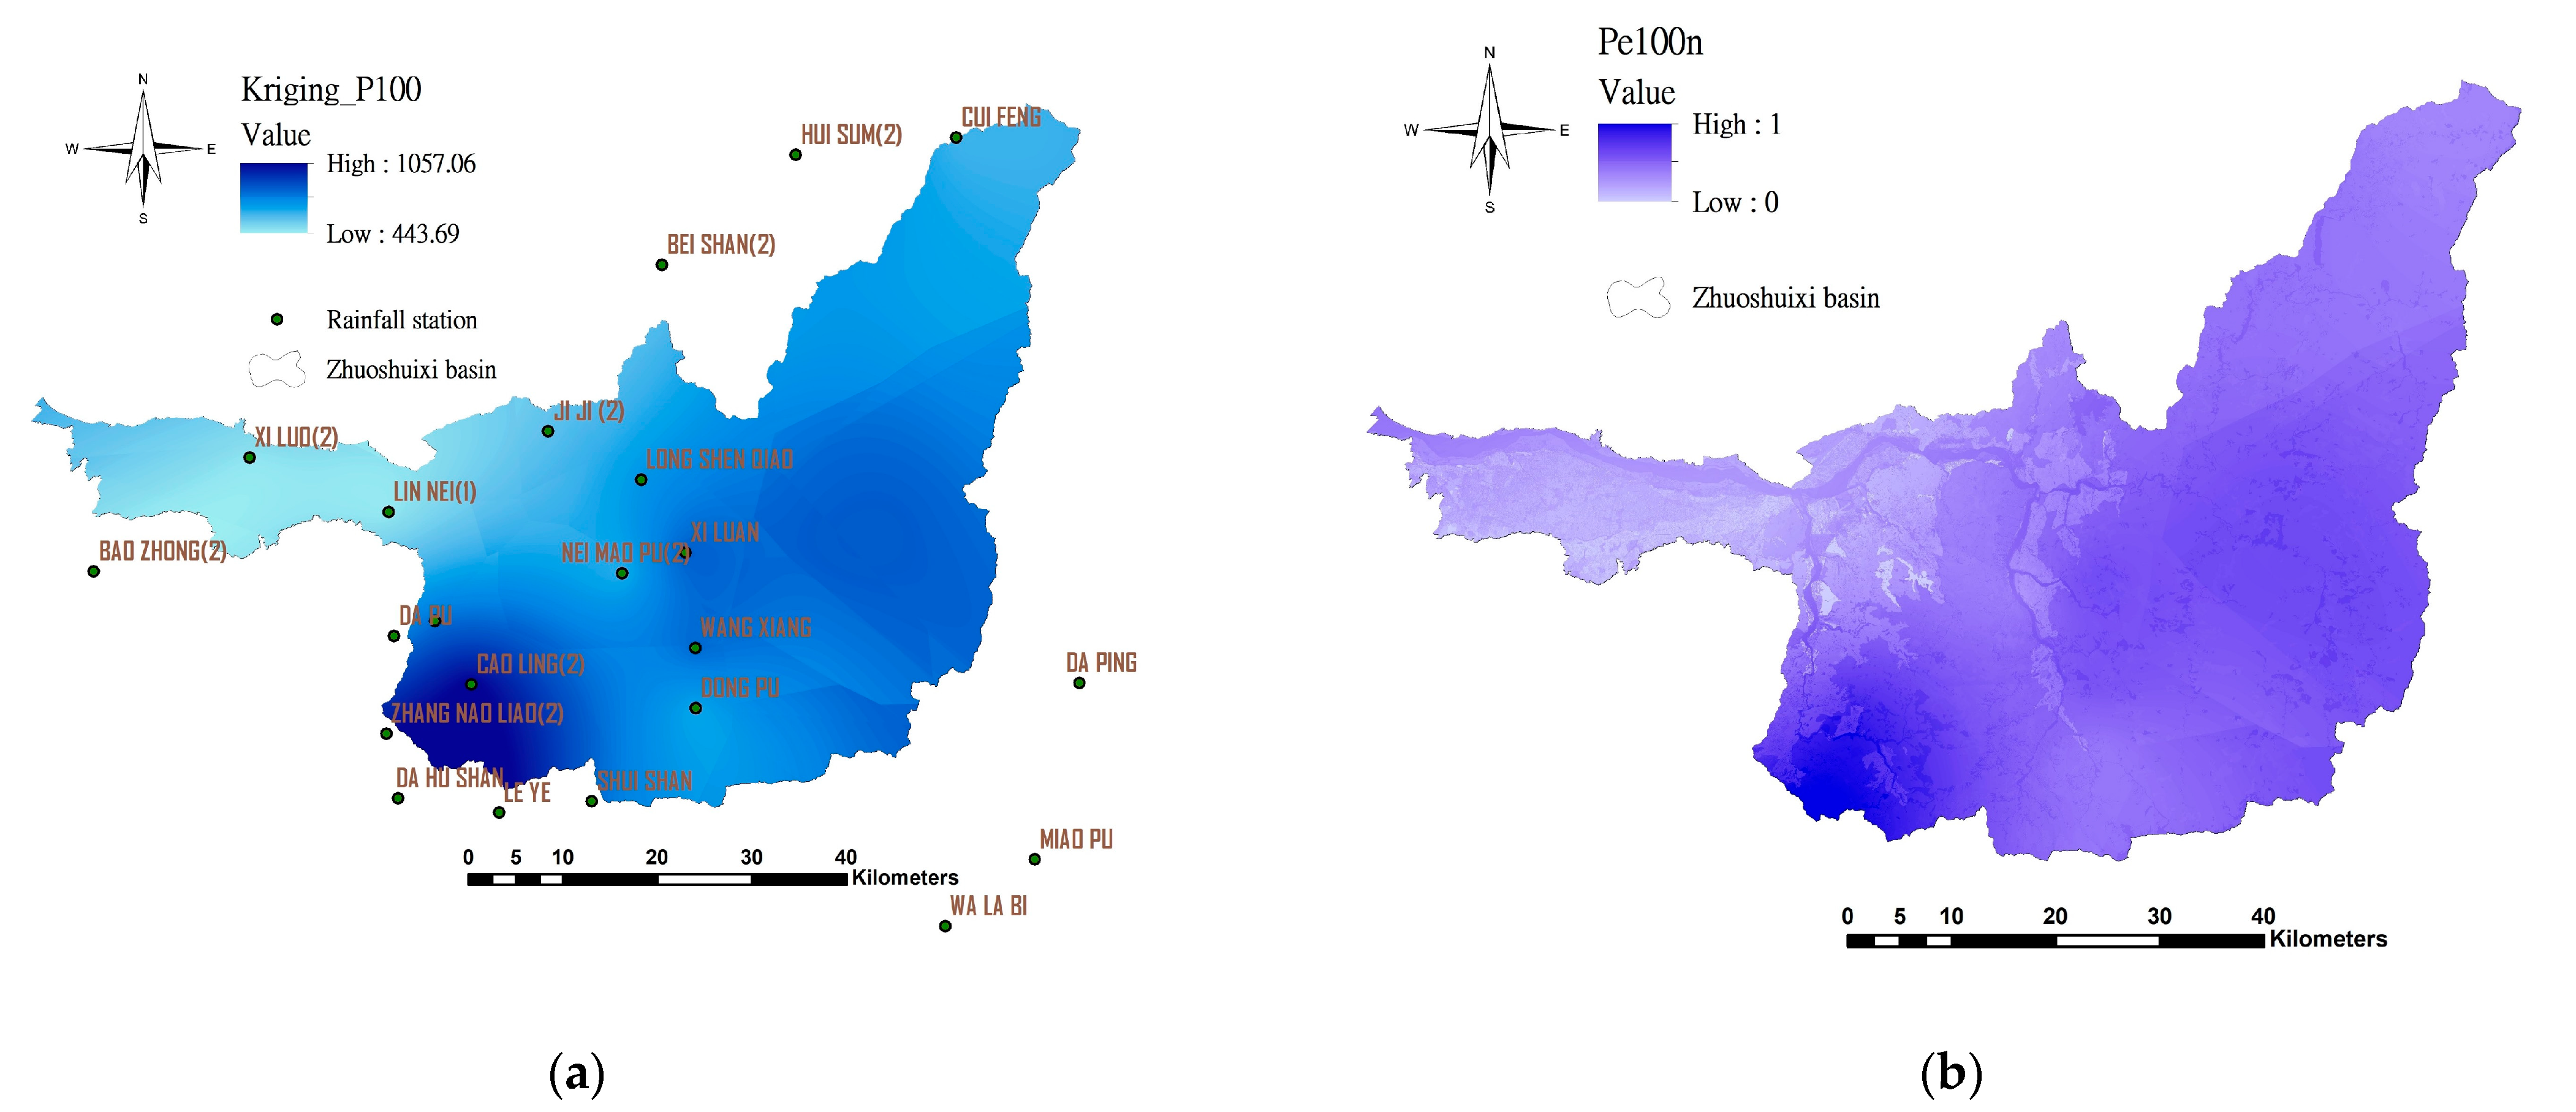
3.1.1. Estimation and Verification of the Potential Excess Runoff

Using the SCS-CN method to estimate the excess runoff can quickly calculate its spatial distribution in the watershed. The distribution of flow stations in the basin (Figure 6) shows that the Chun-Yun bridge station is the main tributary confluence. Compared with other stations, the watershed runoff in the station changes greatly, and the water flow conditions are more complicated. Therefore, with Chun-Yun bridge station as the control point, the relationship between the estimated excess runoff and the measured flow was established. The results can better reflect the advantages of this research model. Based on the observed flow and estimated flow of the largest rainfall event in the past 8 years, the influence of the base flow is considered, as shown in Table 4 and Figure 7. The relationship equation shows a positive correlation (R2 = 0.8655), and the horizontal base flow separation method is used to separate the base flow, and to then perform a correlation analysis with the measured flow. The result also shows a high degree of positive correlation (R2 = 0.8595). It can be seen that the separation of base flow has no significant difference in the estimated runoff trend. The linear regression shows that the two slopes are 0.8158 and 0.7908, respectively, which means that the estimated runoff is slightly larger than the actual observed runoff. The excess runoff is mostly below the 1:1 slope line. The reason may be that the model is based on the consideration of surface infiltration capacity and does not consider large depressions such as lakes and reservoirs, resulting in an overestimation compared with the observed runoff [38]. The main reservoirs upstream of Chun-Yun bridge station include Wu-She reservoir, Wu-jie dam, Sun Moon Lake reservoir, Jiji weir, and Hu-Shan reservoir. The total effective storage capacity of the reservoir is 222.7 M.M3. From the viewpoint of adjusting the storage capacity of reservoirs during the flood season, the difference between the estimated and measured runoff (Table 4) is between 37.2~280.6 M.M3, which is also consistent with the reservoir. In line with the deviation range caused by the flood storage operation of the reservoir, this can reasonably explain the main reason for the deviation.

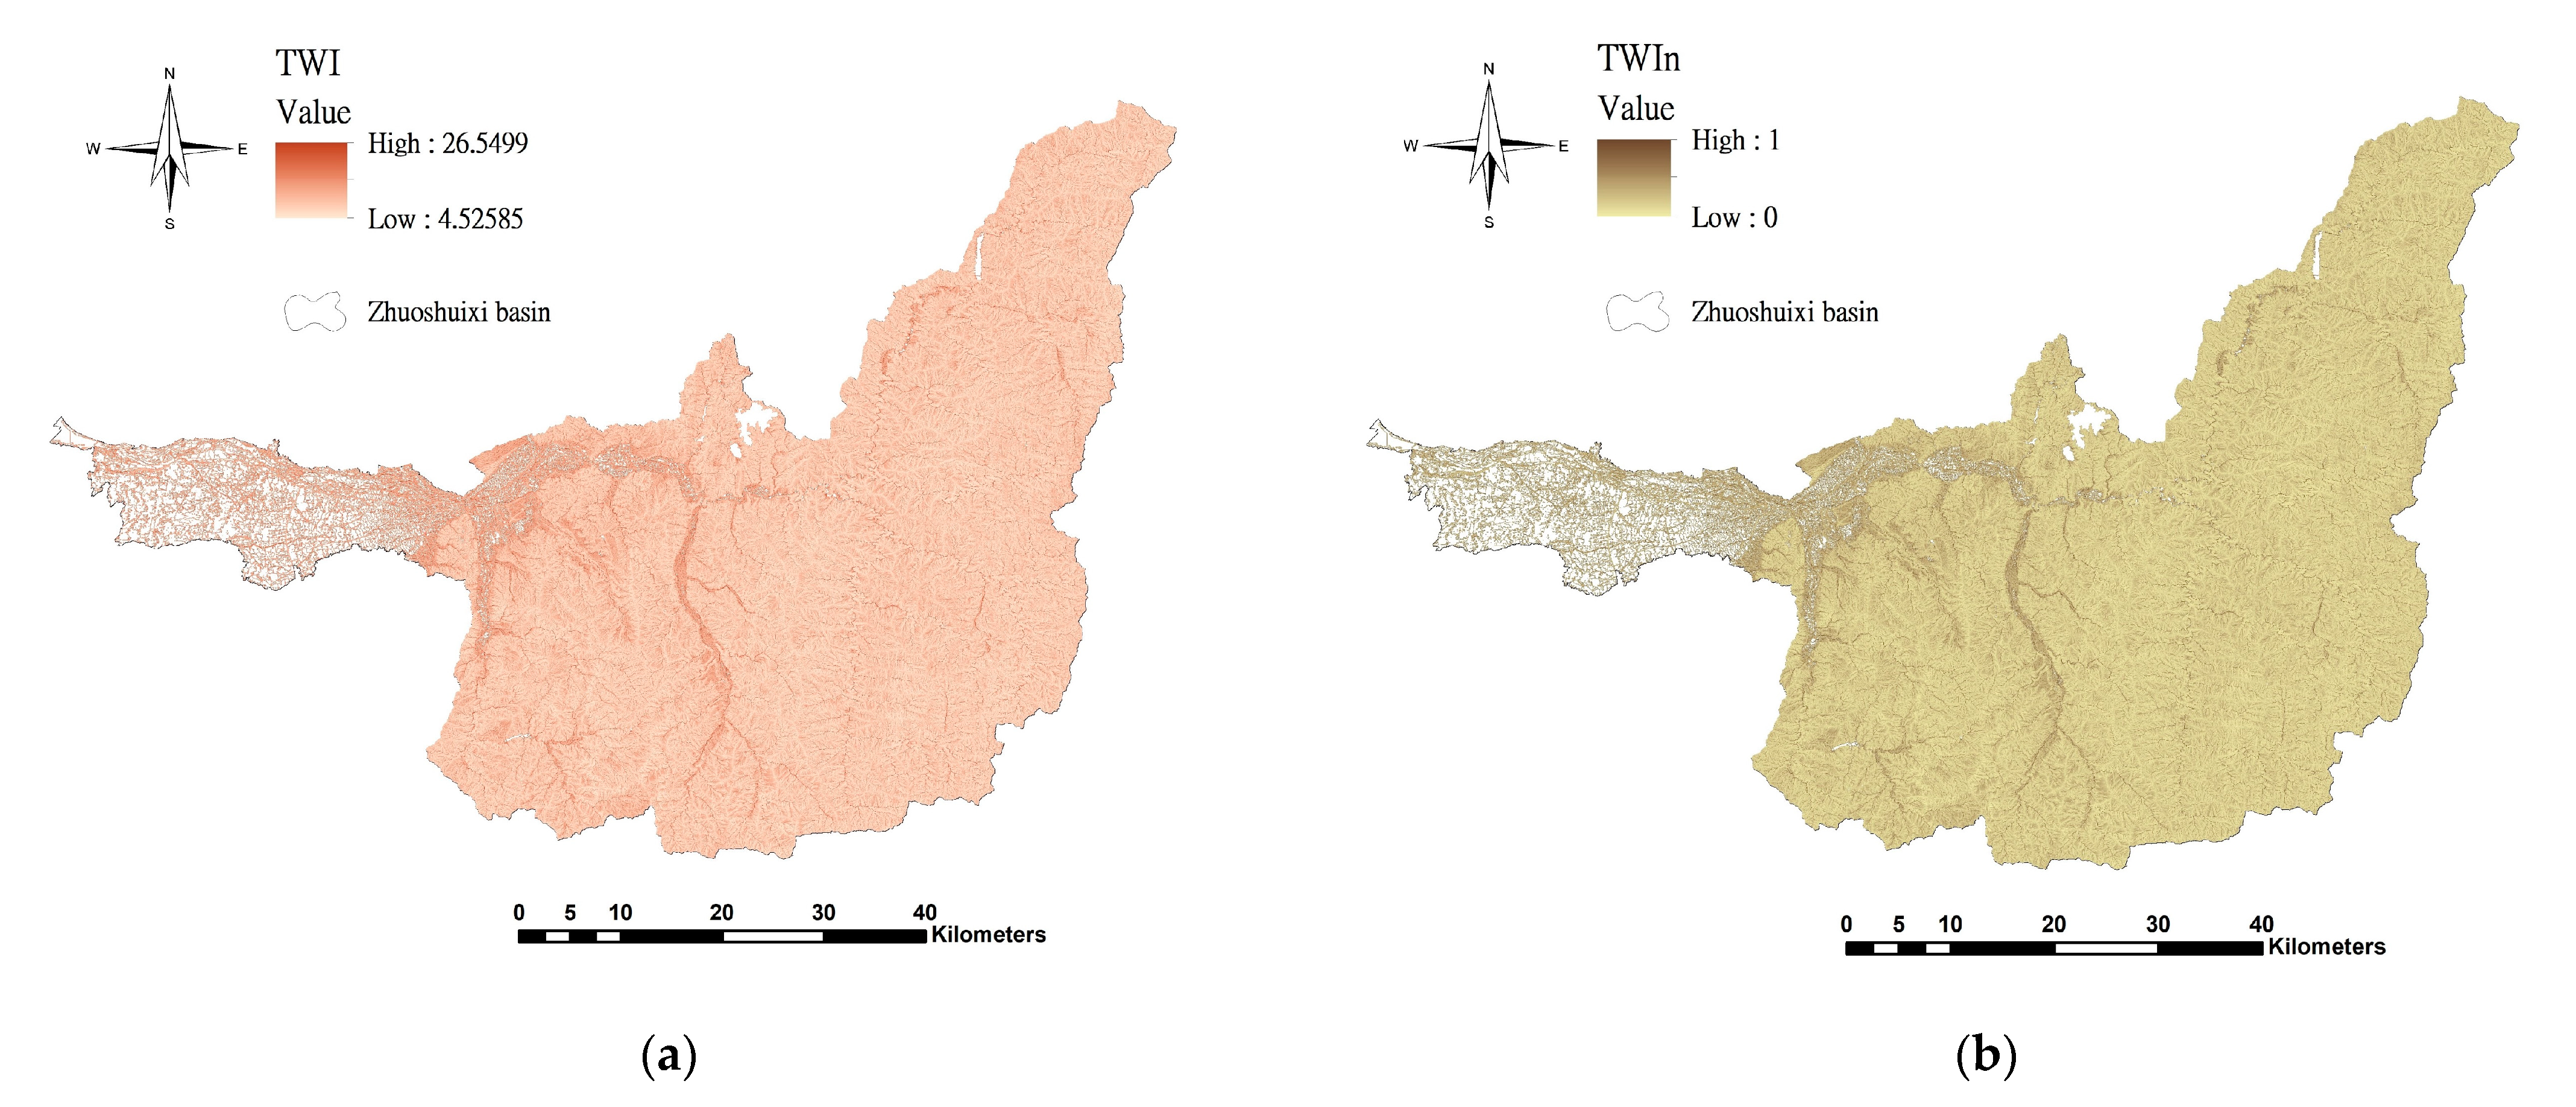
3.1.2. Flood Risk Model Results

The 100-year return period risk map is calculated from the flooding risk conceptual model, and its normalized results are shown in Figure 8a. Using K-mean cluster analysis, the flooding potential of the Zhuoshuixi Basin is divided into five levels. It can be seen that the extremely high level accounts for 7.2%, the high level accounts for 17.2%, the medium level accounted for 35.8%, the low level accounts for 27.0%, and the extremely low level accounts for 12.8%. Affected by the terrain, the risk in the river channel is mostly higher, and the mountain area has a lower risk value due to the steep slope. However, in the southwest of the Zhuoshuixi Basin, it is a mountainous valley topography, which makes the risk value of this area extremely high, as shown in Figure 8b.

3.2. Selection of Hot Spots for Land Adaptation

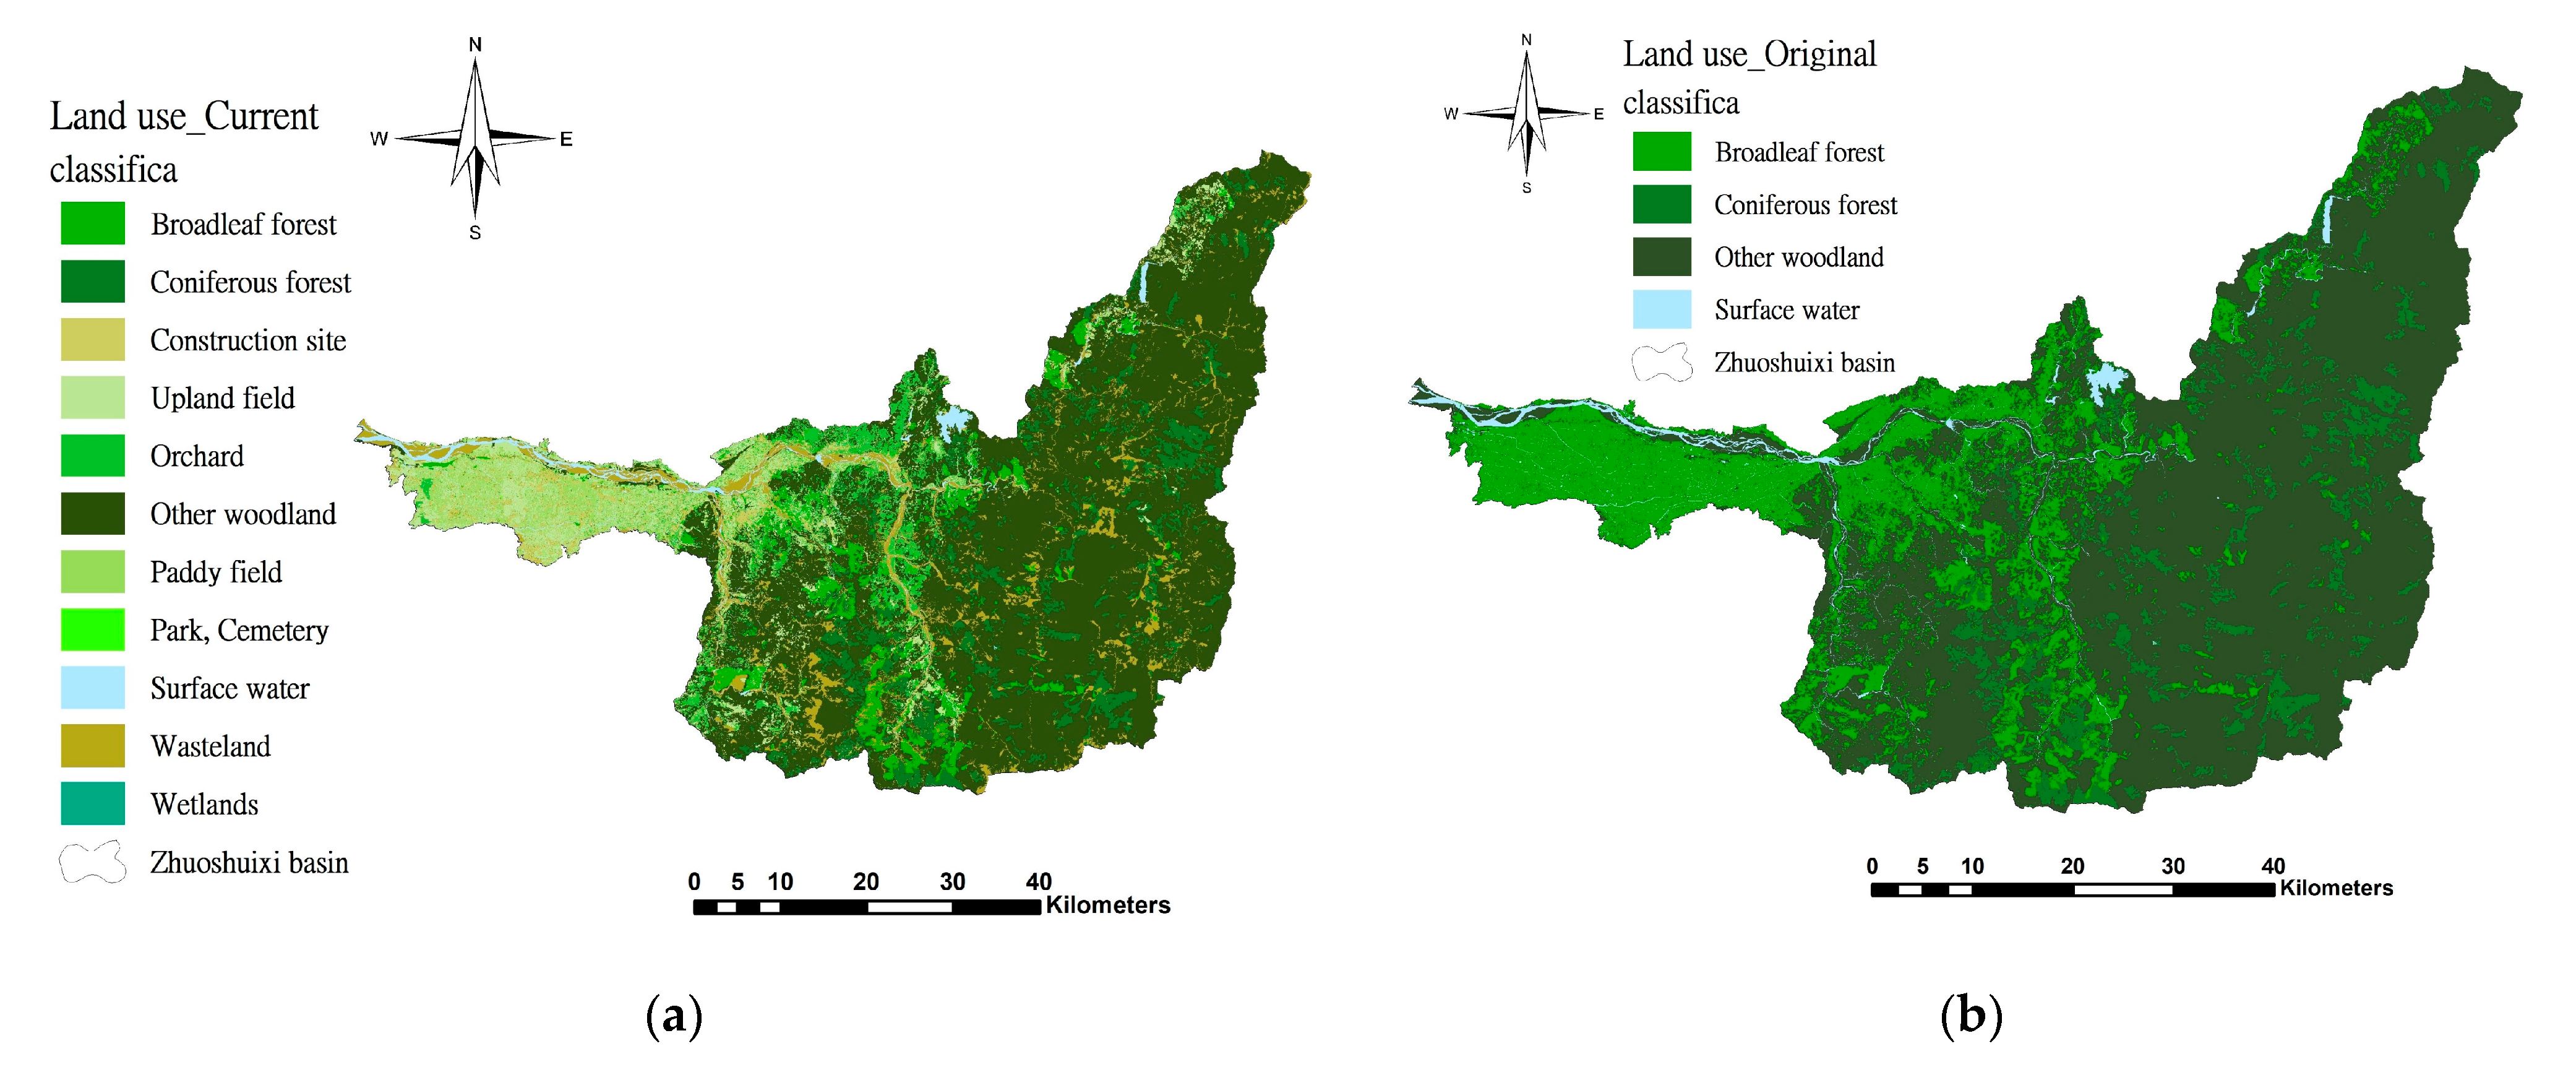
3.2.1. Water-Storage Capacity

According to the aforementioned method of calculating the water-storage capacity, the results of the current and original conditions of land use are calculated by overlapping soil type and land use map data as follows:
  • Soils types
According to the soil texture data of the Agricultural Research Institute corresponding to the SCS soil classification (Figure 9), class A accounts for 3.2%, class B accounts for 16.6%, class C accounts for 0.1%, and class D accounts for up to 80.1%. This means that the Zhuoshuixi Basin is prone to surface runoff under heavy rains.
2.
Land use
The land use map provided by the National Land Surveying and Mapping Center is divided into 12 types of coverage, including upland field, parks, wasteland, water area, coniferous forest, and other woodland. Other woodland is the main land use type, and its area accounts for about 60% of the Basin area, as shown in Figure 10a. In order to explore the change of land use from the most primitive situation to the current situation, the vegetation morphology classification method [39] is used to estimate the land use situation in the watershed without human development so as to determine the distribution of the original forest plants (Figure 10b). The SCS-CN method (Equation (4)) is used to estimate the difference in CN between the two periods and to convert the difference between the water storage capacities (S), as shown in Figure 10c–f. The larger the S value, the better the permeability of the surface layer, and the easier it is to infiltrate and retain water.

3.2.2. Water Storage Capacity Difference

Figure 11a shows the maximum water storage difference in the Zhuoshuixi Basin, and is obtained by subtracting the water storage capacity under the current conditions and the original conditions. Through this value, the increase in runoff caused by land use changes in the two periods can be reflected. The upper reaches have less development due to steep slopes, resulting in less runoff increments; the middle and lower reaches have more flat land, and some urban developments are hotter, resulting in an increase in impervious area. For the effective management of the watershed, the difference in storage capacity is divided into large, medium, and small levels using management zoning and K-mean cluster analysis, of which the area accounts for 2.3%, 11.7%, and 86.0%, respectively (Figure 11b).

3.2.3. Depression Space

The depression space distribution extracted by DEM and land use map data is shown in Figure 12a. Using k-mean cluster analysis, the depression space is divided into three levels, from large to small, accounting for 8.6%, 10.1%, and 81.3% respectively. The depression space in the middle and lower reaches of the basin is gradually decreasing, as shown in Figure 12b, as it gets closer to the mainstream.

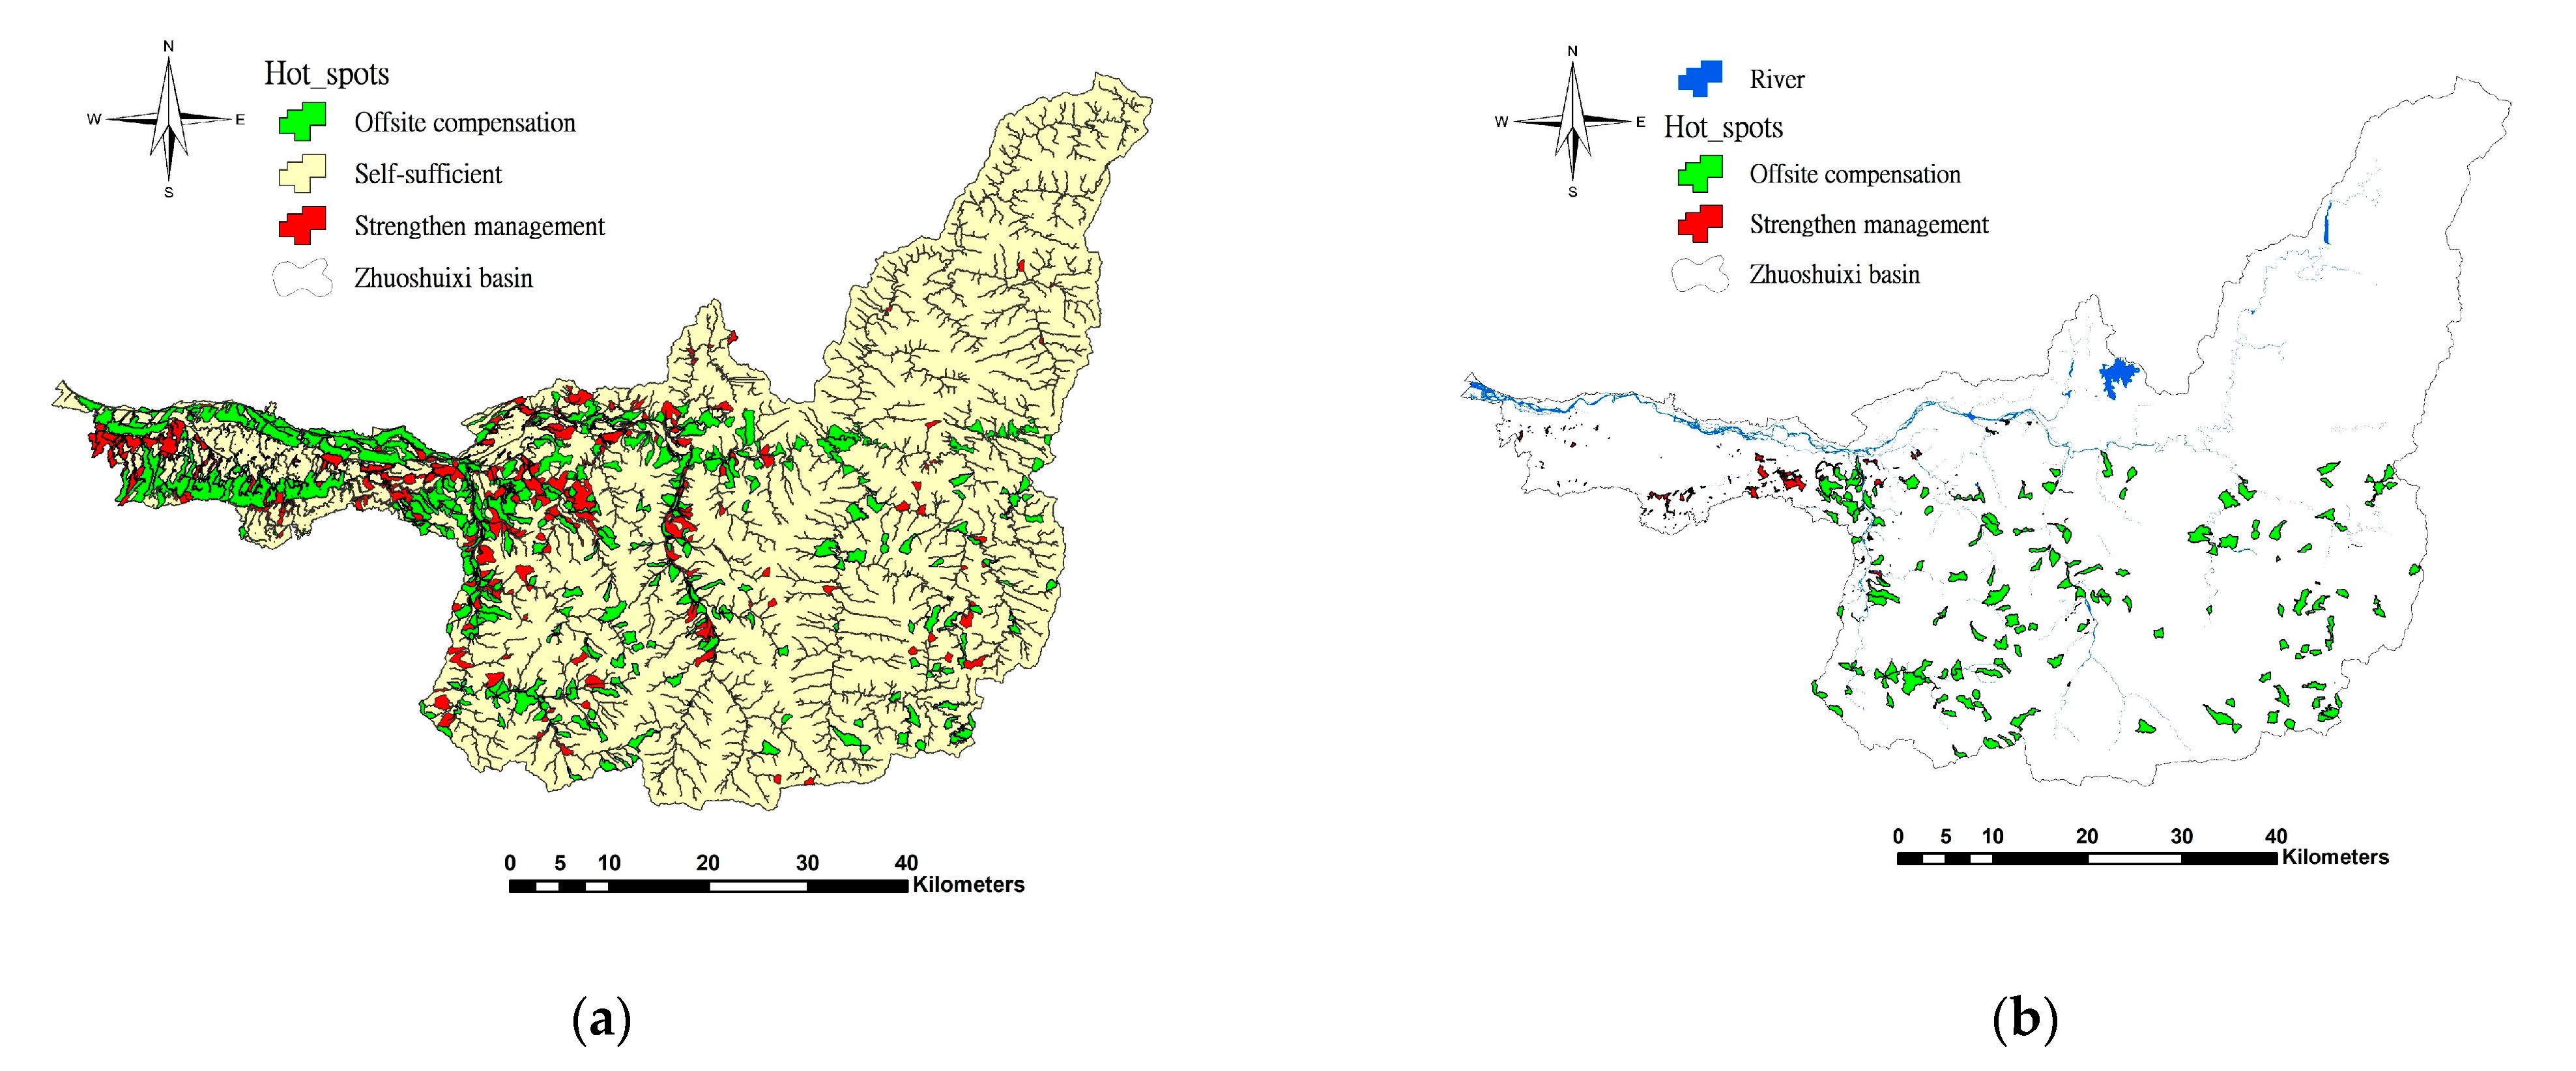
3.2.4. Flood Disaster Adjustment and Construction Location Screening

In order to screen the watershed areas that can be built to adjust flood disasters, the difference in water storage capacity and the analysis results of the depression space are used, and the spatial classification matrix of runoff generation and storage (Table 5) reflects the relationship between the runoff changes and storage space of each management subdivision. By overlapping its spatial distribution, the hot spots of the advantages and disadvantages of the runoff storage and detention space can be obtained, as shown in Figure 13a. The water storage capacity difference represents the change in runoff. When the increased runoff has a considerable depression space to accommodate the water body, the management zone can balance itself, and the depression space is greater than the area where the runoff increment is larger. This location is a self-sufficient construction type.
In areas where the depression space is larger than the runoff increment, the use of this space to build water storage facilities can effectively store water resources in its catchment area, which can be used as an upstream offset location to reduce the flooded volume of the low-lying downstream. This location belongs to the construction type of off-site compensation.
When the depression space is less than the runoff increment, because there is no more space to store the water body, pumping equipment can only be installed in the low-lying flooded area to pump the excess water body to the river to reduce the degree of flooding. This location belongs to the type of construction that strengthens management.
Through the classification matrix, the construction locations of various types of catchment areas can be obtained, and the key construction locations can also be known. In the case of limited governance funds, taking into account the maximum benefit and priority, the area with the smallest difference in water storage capacity and the largest water storage space is selected, and the best area for off-site compensation is 124 square kilometers. For the area with the largest difference in water storage capacity and the smallest water storage space, the suitability evaluation of land development and management should be carried out, which is 9.7 square kilometers, as shown in Figure 13b.

4. Discussion

4.1. Flood Risk Assessment

The results of the flooding potential map released by the Water Resources Agency are based on different designed rainfall scenarios, based on hydro-geographic conditions, and then calculated using the SOBEK hydrological model to simulate the possible flooding situation of flood control facilities under normal operation. Therefore, when the disaster occurs, the internal water is not easily discharged due to the influence of the external water level, so that the flooding area is mostly internal water flooding, and the depth is mostly 0.3 m to 3 m (Figure 14a). The results of this study show that in the high-risk area, it accounts for 73.5% of the total flooded area, followed by 19.1% in the medium-risk area, 4.1% in the very high-risk area, 2.6% in the low-risk area, and 0.7% in the very low-risk area. It can be seen that the runoff conforms to the characteristics of the topography, and eventually all gather in the waterway, becoming the highest risk situation. The rest are mainly high-risk areas in the flooding potential range, indicating that the results are consistent with official data (Figure 14b). Therefore, using the TWI indicators of each basin combined with the SCS-CN method to estimate excess runoff can quickly and simply calculate the risk of flooding in the whole basin. This research has practical value and can provide government agencies with strengthening preparations for high-risk areas before typhoon torrential rains.

4.2. Adaptation Strategies for Flooded Locations

About 85% of the Zhuoshuixi embankment project has been completed. In the face of climate change, flooding events still occur under the increasingly severe rain pattern of short-delay heavy rainfall. The protective power of flood control projects has its limits and with the changes in social expectations and opinions, it is necessary to adjust the flood risk management strategy. Therefore, based on resilience thinking, it should not be implemented with the resistance strategy of raising the embankment, but should be implemented with a flood risk management strategy, which means allowing the river to temporarily inundate a large area, and then adjusting the land use to minimize flood damage. Therefore, it is based on risk management and “coexistence with flood” as the operating method, not disaster control [40].
In the process of land adjustment, the degradation of land use will have a significant impact on surface water infiltration and surface roughness, resulting in more floods [41], where the rural area is the same as the urban area, which is not only the driving cause of the increase in flood risk, but also the subject of flood damage. Therefore, the results of the water storage capacity difference in Figure 11 clearly show the distribution of runoff increments generated by land use, mainly in the flat area on the left bank of the lower reaches of Chun-Yun Bridge, which is a relatively hot zone that should be controlled. Figure 12 also finds that these high runoff increments are located on the upstream slopes of the management zone. Due to the influence of the terrain, there is still considerable depression space for water adjustment, which is the best location for compensation in different places, and these locations are mostly distributed in the upstream of Chun-Yun Bridge. Figure 13 shows that at the upstream of some high runoff incremental management zones, due to the influence of terrain, there is still considerable depression space for water adjustment, which is the best location for off-site compensation, and these locations are mostly located in the upper reaches of Chun-Yun Bridge. The concentration time of the flood peak can be delayed or the storage of water bodies through engineering means, that is, floodplains or flood detention ponds are built on the river course, and flood storage ponds can be built on the upstream slope, and it can reduce the flooding pressure in downstream areas. Therefore, the joint application of land use and engineering will become the most effective measure to control future flood risks [42].

5. Conclusions

Clarifying the distribution of land runoff can meet the demands of different stakeholders, reduce the pressure on flood management, and promote the fair and sustainable development of the river basin [43]. In addition, we also considered the provision of Ecosystem Flood Regulation Services (EFRS), which means that the ability to store water and reduce runoff in a specific area depends on the local soil, land use, and topography [44,45]. The excess runoff estimated by the SCS-CN method provides a simple and fast method to calculate runoff. The result also shows a high degree of positive correlation (R2 = 0.86). The runoff prediction can reach 80% reliability, and its error is mainly affected by the flood storage operation of the reservoir. The traditional use of SCS-CN method to estimate runoff does not take into account the influence of terrain. The evaluation model established in this study incorporates the judgment of the land to increase the correction of the actual runoff, that is, the use of TWI, which is considered to be a feature of river runoff [46] and can better reflect the flood risk situation. Combined with the concept of risk to establish a model for evaluating flood disasters, the results are consistent with the official data (SOBEK hydrological model). It can be used in real time dynamic risk warning through different rainfall events or recurrence periods.
In addition, combined with the water storage capacity difference and depression space indicators, the best location for floodplain, flood storage, and flood detention in the basin is optimized through topographic characteristics, so as to achieve the effects of slope land adjustment and sharing of runoff, high development area control, and flood peak reduction. These optimal locations for adjustment are selected through the natural terrain environment, and their own conditions can achieve flooding improvement. In the future, combined with environmental construction work, the scale of engineering facilities can be reduced, and the ecosystem service functions can be enhanced to prevent flooding. It can provide the government as a reference for river basin management.

Author Contributions

Conceptualization, C.-Y.L. and E.-C.H.; methodology, C.-Y.L.; software, E.-C.H. and S.-W.W.; validation, E.-C.H., P.-W.L. and S.-W.W.; formal analysis, E.-C.H.; resources, E.-C.H.; data curation, E.-C.H.; writing—original draft preparation, E.-C.H.; writing—review and editing, C.-Y.L.; visualization, E.-C.H.; supervision, C.-Y.L.; project administration, C.-Y.L. All authors have read and agreed to the published version of the manuscript.

Funding

This research was supported by grants from the Ministry of Science and Technology of Taiwan R.O.C. (109-2621-M-005-002-MY3).

Data Availability Statement

The data used in this study was not permitted to share.

Acknowledgments

We would like to thank the MDPI Land academic editor and reviewer team, and the Ministry of Science and Technology of Taiwan R.O.C.

Conflicts of Interest

The authors declare no conflict of interest.

References

  1. Vojtek, M.; Vojteková, J. Flood hazard and flood risk assessment at the local spatial scale: A case study. Geomat. Nat. Hazards Risk 2016, 7, 1973–1992. [Google Scholar] [CrossRef]
  2. Aronsson-Storrier, M. The UN Global Assessment Report on Disaster Risk Reduction; UN. Office for Disaster Risk Reduction: Geneva, Switzerland, 2019; Volume 2. [Google Scholar]
  3. Field, C.B.; Barros, V.R.; Dokken, D.J.; Mach, K.J.; Mastrandrea, M.D.; Bilir, T.E.; Chatterjee, M.; Ebi, K.L.; Estrada, Y.O.; Genova, B.R.C.; et al. Climate Change 2014 Part A: Global and Sectoral Aspects; Woodward, A., Ed.; Cambridge University Press: Cambridge, UK, 2014; ISBN 9781107641655. [Google Scholar]
  4. Papilloud, T.; Röthlisberger, V.; Loreti, S.; Keiler, M. Flood exposure analysis of road infrastructure—Comparison of different methods at national level. Int. J. Disaster Risk Reduct. 2020, 47, 101548. [Google Scholar] [CrossRef]
  5. Arosio, M.; Arrighi, C.; Cesarini, L.; Martina, M.L.V. Service accessibility risk (SAR) assessment for pluvial and fluvial floods in an urban context. Hydrology 2021, 8, 142. [Google Scholar] [CrossRef]
  6. Taubenböck, H.; Post, J.; Roth, A.; Zosseder, K.; Strunz, G.; Dech, S. A conceptual vulnerability and risk framework as outline to identify capabilities of remote sensing. Nat. Hazards Earth Syst. Sci. 2008, 8, 409–420. [Google Scholar] [CrossRef]
  7. Bohle, H.-G. Vulnerability and criticality: Perspectives from social geography. IHDP Updat. 2001, 2, 3–5. [Google Scholar]
  8. Mavhura, E. Analysing drivers of vulnerability to flooding: A systems approach. S. Afr. Geogr. J. 2019, 101, 72–90. [Google Scholar] [CrossRef]
  9. Fuchs, S.; Keiler, M.; Ortlepp, R.; Schinke, R.; Papathoma-Köhle, M. Recent advances in vulnerability assessment for the built environment exposed to torrential hazards: Challenges and the way forward. J. Hydrol. 2019, 575, 587–595. [Google Scholar] [CrossRef]
  10. Zischg, A.P.; Röthlisberger, V.; Mosimann, M.; Profico-Kaltenrieder, R.; Bresch, D.N.; Fuchs, S.; Kauzlaric, M.; Keiler, M. Evaluating targeted heuristics for vulnerability assessment in flood impact model chains. J. Flood Risk Manag. 2021, 14, e12736. [Google Scholar] [CrossRef]
  11. Pottier, N.; Penning-Rowsell, E.; Tunstall, S.; Hubert, G. Land use and flood protection: Contrasting approaches and outcomes in France and in England and Wales. Appl. Geogr. 2005, 25, 1–27. [Google Scholar] [CrossRef]
  12. Meyer, V.; Becker, N.; Markantonis, V.; Schwarze, R.; Van Den Bergh, J.C.J.M.; Bouwer, L.M.; Bubeck, P.; Ciavola, P.; Genovese, E.; Green, C.; et al. Assessing the costs of natural hazards—state of the art and knowledge gaps. Nat. Hazards Earth Syst. Sci. 2013, 13, 1351–1373. [Google Scholar] [CrossRef]
  13. Dadson, S.J.; Hall, J.W.; Murgatroyd, A.; Acreman, M.; Bates, P.; Beven, K.; Heathwaite, L.; Holden, J.; Holman, I.P.; Lane, S.N.; et al. A restatement of the natural science evidence concerning catchment-based “natural” flood management in the UK. Proc. R. Soc. A Math. Phys. Eng. Sci. 2017, 473, 20160706. [Google Scholar] [CrossRef] [Green Version]
  14. Kay, A.L.; Old, G.H.; Bell, V.A.; Davies, H.N.; Trill, E.J. An assessment of the potential for natural flood management to offset climate change impacts. Environ. Res. Lett. 2019, 14, 044017. [Google Scholar] [CrossRef]
  15. Lane, S.N. Natural flood management. Wiley Interdiscip. Rev. Water 2017, 4, e1211. [Google Scholar] [CrossRef] [Green Version]
  16. Teng, F.; Huang, W.; Ginis, I. Hydrological modeling of storm runoff and snowmelt in Taunton River Basin by applications of HEC-HMS and PRMS models. Nat. Hazards 2017, 911, 179–199. [Google Scholar] [CrossRef]
  17. Darbandsari, P.; Coulibaly, P. Inter-comparison of lumped hydrological models in data-scarce watersheds using different precipitation forcing data sets: Case study of Northern Ontario, Canada. J. Hydrol. Reg. Stud. 2020, 31, 100730. [Google Scholar] [CrossRef]
  18. Moradkhani, H.; Sorooshian, S. General Review of Rainfall-Runoff Modeling: Model Calibration, Data Assimilation, and Uncertainty Analysis. In Hydrological Modelling and the Water Cycle; Springer: Berlin/Heidelberg, Germany, 2009; pp. 1–24. [Google Scholar] [CrossRef] [Green Version]
  19. Chen, Y.; Li, J.; Wang, H.; Qin, J.; Dong, L. Large-watershed flood forecasting with high-resolution distributed hydrological model. Hydrol. Earth Syst. Sci. 2017, 21, 735–749. [Google Scholar] [CrossRef] [Green Version]
  20. Al-Ghobari, H.; Dewidar, A.; Alataway, A. Estimation of Surface Water Runoff for a Semi-Arid Area Using RS and GIS-Based SCS-CN Method. Water 2020, 12, 1924. [Google Scholar] [CrossRef]
  21. Shrestha, S.; Cui, S.; Xu, L.; Wang, L.; Manandhar, B.; Ding, S. Impact of Land Use Change Due to Urbanisation on Surface Runoff Using GIS-Based SCS–CN Method: A Case Study of Xiamen City, China. Land 2021, 10, 839. [Google Scholar] [CrossRef]
  22. Richards, P.L.; Brenner, A.J. Delineating source areas for runoff in depressional landscapes: Implications for hydrologic modeling. J. Great Lakes Res. 2004, 30, 9–21. [Google Scholar] [CrossRef]
  23. Böhm, H.R.; Haupter, B.; Heiland, P.; Dapp, K. Implementation of flood risk management measures into spatial plans and policies. River Res. Appl. 2004, 20, 255–267. [Google Scholar] [CrossRef]
  24. Maddock, I. The importance of physical habitat assessment for evaluating river health. Freshw. Biol. 1999, 41, 373–391. [Google Scholar] [CrossRef]
  25. Jenson, S.K.; Domingue, J.O. Extracting topographic structure from digital elevation data for geographic information system analysis. Photogrammetric Engineering and Remote. Photogramm. Eng. Remote Sens. 1988, 54, 1593–1600. [Google Scholar]
  26. O’Callaghan, J.F.; Mark, D.M. The extraction of drainage networks from digital elevation data. Comput. Vis. Graph. Image Process. 1984, 28, 323–344. [Google Scholar] [CrossRef]
  27. Aven, T. Risk Analysis, 2nd ed.; John Wiley & Sons: Hoboken, NJ, USA, 2015; ISBN 9781119057796. [Google Scholar]
  28. Kumar, T.; Jhariya, D.C. Identification of rainwater harvesting sites using SCS-CN methodology, remote sensing and Geographical Information System techniques. Geocarto Int. 2017, 32, 1367–1388. [Google Scholar] [CrossRef]
  29. Soulis, K.X.; Valiantzas, J.D. SCS-CN parameter determination using rainfall-runoff data in heterogeneous watersheds-the two-CN system approach. Hydrol. Earth Syst. Sci. 2012, 16, 1001–1015. [Google Scholar] [CrossRef] [Green Version]
  30. Elhakeem, M.; Papanicolaou, A.N. Estimation of the runoff curve number via direct rainfall simulator measurements in the state of Iowa, USA. Water Resour. Manag. 2009, 23, 2455–2473. [Google Scholar] [CrossRef]
  31. BEVEN, K.J.; KIRKBY, M.J. A physically based, variable contributing area model of basin hydrology / Un modèle à base physique de zone d’appel variable de l’hydrologie du bassin versant. Hydrol. Sci. Bull. 1979, 24, 43–69. [Google Scholar] [CrossRef] [Green Version]
  32. Beven, K.; Kirkby, M.; Freer, J.E.; Lamb, R. A history of TOPMODEL. Hydrol. Earth Syst. Sci. 2021, 25, 527–549. [Google Scholar] [CrossRef]
  33. Morel-Seytoux, H.J.; Verdin, J.P. Extension of the Soil Conservation Service Rainfall-Runoff Methodology for Ungaged Watersheds; National Technical Information Service: Washington, DC, USA, 1981.
  34. Shi, P.J.; Yuan, Y.; Zheng, J.; Wang, J.A.; Ge, Y.; Qiu, G.Y. The effect of land use/cover change on surface runoff in Shenzhen region, China. Catena 2007, 69, 35. [Google Scholar] [CrossRef]
  35. Shi, N.; Liu, X.; Guan, Y. Research on k-means clustering algorithm: An improved k-means clustering algorithm. In Proceedings of the 2010 Third International Symposium on Intelligent Information Technology and Security Informatics, Ji’an, China, 2–4 April 2010; pp. 63–67. [Google Scholar] [CrossRef]
  36. Yadav, J.; Sharma, M. A Review of K-mean Algorithm. Int. J. Eng. Trends Technol. 2013, 4, 2972–2976. [Google Scholar]
  37. Water Resources Planning Institute, WRA. MOEA-Common Tools For Drainage Hydraulic Simulation. Available online: https://en.wrap.gov.tw/cp.aspx?n=26503 (accessed on 8 July 2021).
  38. Wu, S.W. A Study of Soil Loss Tolerance in the Liukuei Experimental Forest Using Conceptual Models. Master’s Thesis, National Chung Hsing University, Taichung, Taiwan, 2020. [Google Scholar]
  39. Chiu, C.A.; Lin, H.C.; Liao, M.C.; Tseng, Y.H.; Ou, C.H.; Lu, K.C.; Tzeng, H.Y. A Physiognomic Classification Scheme of Potential Vegetation of Tn. Quart. J. Forest Res. 2008, 30, 89–111. [Google Scholar]
  40. Klijn, F.; Van Buuren, M.; Van Rooij, S.A.M. Flood-risk management strategies for an uncertain future: Living with rhine river floods in the Netherlands? AMBIO J. Hum. Environ. 2004, 33, 141–147. [Google Scholar] [CrossRef]
  41. Saghafian, B.; Farazjoo, H.; Bozorgy, B.; Yazdandoost, F. Flood intensification due to changes in land use. Water Resour. Manag. 2008, 22, 1051–1067. [Google Scholar] [CrossRef]
  42. Wheater, H.; Evans, E. Land use, water management and future flood risk. Land Use Policy 2009, 26, S251–S264. [Google Scholar] [CrossRef]
  43. Chang, H.S.; Su, Q. Exploring the coupling relationship of stormwater runoff distribution in watershed from the perspective of fairness. Urban Clim. 2021, 36, 100792. [Google Scholar] [CrossRef]
  44. Stürck, J.; Poortinga, A.; Verburg, P.H. Mapping ecosystem services: The supply and demand of flood regulation services in Europe. Ecol. Indic. 2014, 38, 198–211. [Google Scholar] [CrossRef]
  45. Shen, J.; Du, S.; Huang, Q.; Yin, J.; Zhang, M.; Wen, J.; Gao, J. Mapping the city-scale supply and demand of ecosystem flood regulation services—A case study in Shanghai. Ecol. Indic. 2019, 106, 105544. [Google Scholar] [CrossRef]
  46. Juracek, K.E. Estimation of Potential Runoff-Contributing Areas; US Geological Survey: Reston, VA, USA, 2001.
Figure 1. Site of the study area with DEM.
Land 11 00036 g001
Figure 2. Analysis unit division: (a) spatial distribution of the specific watershed and (b) subdivision of the specific watershed.
Land 11 00036 g002
Figure 3. Study flow chart.
Land 11 00036 g003
Figure 4. The rainfall, excess runoff, and normalized excess runoff diagram of Zhuoshuixi Basin during the 100-year return period: (a) rainfall distribution map of Kriging analysis; (b) the normalized spatial distribution of excess rainfall calculated by SCS-CN method.
Land 11 00036 g004
Figure 5. (a) The topographic wetness index and (b) the normalized topographic wetness index.
Land 11 00036 g005
Figure 6. Location of the flow station.
Land 11 00036 g006
Figure 7. Correlation between estimated runoff and observed flow.
Land 11 00036 g007
Figure 8. (a) Flooding risk map (100-year return period) and (b) a risk level map based on subdivisions.
Land 11 00036 g008
Figure 9. SCS soil texture classification.
Land 11 00036 g009
Figure 10. Basic map data under current and original conditions: (a) current land use map, (b) original situation land use map, (c) current situation CN value, (d) original situation CN value, (e) current situation water storage capacity, and (f) water storage capacity in the original situation.
Land 11 00036 g010aLand 11 00036 g010b
Figure 11. (a) Distribution of the water storage capacity difference and (b) distribution of water-storage capacity difference classification.
Land 11 00036 g011
Figure 12. (a) Depression space distribution and (b) depression space classification.
Land 11 00036 g012
Figure 13. (a) The spatial relationship between runoff generation and flood storage and (b) location of the best off-site compensation and strengthened management.
Land 11 00036 g013
Figure 14. (a) The spatial relationship between the flooding potential map and the model results of this study and (b) the range of the flood potential map corresponds to the risk level of this study model.
Land 11 00036 g014
Table 1. Related information used in the study.
NameResolutionData SourcePurpose
DEM20 m × 20 mDepartment of Land AdministrationTerrain analysis
RainfallDaily dataWater Resources AgencyReturn period estimation
DischargeDaily dataWater Resources AgencyRunoff
Soil type1/5000Agricultural Research InstituteCN, S value
Table 2. Soil category of SWCB and the corresponding that of SCS.
ClassificationSoil TextureSCS Soil Classification
0Coarse sand and sandA
1Fine sand, loamy sand, and loamy coarse sand
2Loamy fine sand, coarse sandy loam, sandy loam, fine sandy, and loamy soil
3Fine sand, very fine sand loamy, and fine sandy loam
4Alfalfa loam and bauxiteB
5Loam
6Sandy clay loamC
7Clayey loam and silty clayD
8Enamel clay and sandy clay
9Clay
Table 3. CN values corresponding to various land use and soil hydrological characteristics.
SCS Soil ClassificationABCD
Construction site74849092
Coniferous forest25557277
Surface water94939596
Upland field62717881
Park and cemetery39617480
Security forest25557077
Wasteland77869194
Wetlands92939495
Broadleaf forest36607379
Paddy field70798488
Orchard45667783
Other woodland38627480
Table 4. Observation and estimation of the maximum discharge events in each year.
DischargeA
Estimated
(M.M3)
B
Observed
(M.M3)
C
Base Flow
(M.M3)
D
B-C
(M.M3)
E
A-D
(M.M3)
Date
2018/08/24388.7306.916.82290.0898.6
2017/06/031092.11081.626.401055.1837.2
2016/09/27478.3267.417.69249.73228.6
2015/08/08403.5133.29.95123.20280.6
2014/07/23492.8284.66.61277.97214.8
2013/07/13685.9571.721.57550.09145.8
2012/08/021028.8861.220.89840.33188.5
2011/07/19267.892.57.7284.77183.0
Table 5. The runoff generation and the flood storage space classification matrix.
Water-Storage Capacity Difference SmallMediumLarge
Depression Space
SmallSelf-sufficientStrengthen managementStrengthen management
MediumOffsite compensationSelf-sufficientStrengthen management
LargeOffsite compensationOffsite compensationSelf-sufficient
Publisher’s Note: MDPI stays neutral with regard to jurisdictional claims in published maps and institutional affiliations.

