Article

Method for Fast Map Construction Based on GPS Data and Compressed Grid Algorithm

1
School of Electrical and Information Engineering, Tianjin University, No. 92, Weijin Road, Nankai District, Tianjin 300072, China
2
State Grid Tianjin Electric Power Company, No. 39, Wujing Road, Hebei District, Tianjin 300160, China
3
College of Management and Economics, Tianjin University, No. 92, Weijin Road, Nankai District, Tianjin 300192, China
4
School of Geographic and Environmental Sciences, Tianjin Normal University, No. 393, Binshui Road, Xiqing District, Tianjin 300382, China
*
Author to whom correspondence should be addressed.
Land 2021, 10(12), 1322; https://doi.org/10.3390/land10121322
Submission received: 13 November 2021 / Revised: 28 November 2021 / Accepted: 29 November 2021 / Published: 1 December 2021
(This article belongs to the Topic Climate Change and Environmental Sustainability)

Abstract

:
Electronic maps play an important role in the field of urban traffic management, but the interface functions provided by map service agencies are limited, and commercial maps are generally expensive. Furthermore, the map generation algorithms based on the Global Positioning System (GPS) data can be very complex and take up a lot of storage space, which limits their application to specific practical problems, such as the real-time update of area maps, temporary road control, emergency route planning, and other scenarios. In order to solve this problem, an intuitive, extensible, and flexible method of constructing urban road maps is proposed. Using the Othello-coordinated method, the representation of the unit grid cell was redesigned. Through this method, the disadvantages of the raster map’s large storage space and computing resource requirements are compensated for during processing, improving the topological expression ability of the raster map and the speed with which the construction of the map is realized. The application potential of the proposed method is demonstrated by the evaluation of public transport service and road network resilience. In our experiments, the optimization efficiency of storage space was up to 99.914%, and the calculation accuracy of bus coverage was about 99.86%.

1. Introduction

City resilience, which refers to the defense and restoring ability of a city to face emergencies and long-term unfavorable pressure, plays a vital role in modern city construction [1]. One major key to building a resilient modern city is to enhance the resilient construction of urban transport infrastructure [2,3]. Against the background of frequent accidents and continuous natural and man-made disasters, regional safety is highly valued by city managers [4,5]. Recently, the world-wide spreading Novel Coronavirus Pneumonia (NCP) has deeply affected many facets of people’s lives, especially through the shutting down of public transportation, restricting people’s mobility, and intensifying the closed community management necessary for the control of the epidemic. All these issues have tested the transport resilience of different cities. As the carrier of city operations, a transport system materially guarantees the interaction between the city and the outside world as well as the city’s internal maintenance and effectiveness, while the road network is the material basis of the entire transport system [1,2,3].
Complex and changeable road conditions can severely disturb the operational efficiency of urban road networks. Moreover, the operational efficiency of an urban road network is highly affected by long-term changes (such as the maintenance and construction of existing and new roads) and short-term changes (such as morning and evening traffic peaks, emergency incident control, and traffic accidents). In addition, while the spatial form of urban architecture affects traffic conditions, it also variously impacts urban land surface temperatures through the heat island effect, which in turn impacts the wellbeing of urban residents [6,7,8,9]. If an operations manager can optimize and adjust road network operations from the overall perspective, the reliability of road network operations will be greatly improved.
The digitization of urban traffic maps is a prerequisite for improving the efficiency of road network management. The digital map of a road network can be portrayed in various ways. For instance, a metric map represents a location with coordinates, while a topological map portrays locations with points and uses lines to connect the points; a graph map is based on graph theory, and a semantic map uses a set of verbal tags to express the locations and associations of points. The network diagram representation method in the Seven Bridges of Königsberg problem [10] is the earliest form of the city road network, which uses the node set to represent an intersection and the edge set to represent a road segment, based on which the digraph [11], dual graph [12,13], and adjacency graph [14] were proposed for research on the topological structure map. In modern information technology, based on the advantages of spatial modeling and information analysis, technologies such as Geographic Information Systems (GIS) have played a significant role in electronic map development. As for the transport network model, a specific GIS-T application that demonstrates the resolution ratio and geographic range can be used to provide support for path planning, which should embody several functions, including statistical modeling, data processing, and data analysis [15]. This can largely contribute to aspects such as individual transportation planning, urban scale transportation network evaluation and transportation infrastructure investment space quantification [16,17].
In 2015, BMW, Mercedes Benz, and Daimler jointly developed the Nokia HERE map for 2.5 billion euros, demonstrating the increasingly important status of digital maps in the business sector. However, limited map interfaces, the high computing resource usage of high-accuracy commercial maps, and memory storage costs have limited the development conditions and scope of such maps. In some of the application scenarios with low-accuracy map requirements, such as non-automatic driving, navigation, route planning, regional visualization, and geographic information annotation, the map can be automatically generated using ancillary data so as to improve the flexibility and expansibility of application development and usage, and to simultaneously shorten the map update cycle. The wide spreading of the Global Positioning System (GPS) has accelerated the development and application of electronic maps [18]. Some scholars have succeeded in generating the topological structure of roads from GPS data [19,20,21]. However, most GPS-based maps focus on topological maps (road network database maps), which demands high precision of the GPS and complex algorithms [22].
A grid map, also called a raster image, which represents an image discretized in space and brightness, is usually drawn based on imagery data. If a raster is regarded as a matrix and the value of each point in the matrix denotes the gray value of the corresponding element in the image, the image can be discretized, and the corresponding digital matrix can be used to indicate geographic information abstractly. In contrast to the abstract degrees of the metric map, topological map, and semantic map, the accuracy of the grid map to describe an actual road can be controlled by the grid cell size. In many practical applications, such as route planning and design, facility location, regional labeling, road network management, vehicle tracking, traffic guidance, and visual analysis, the grid map can successfully meet these requirements under certain conditions. The current generation of grid maps mainly depends on remote sensing imagery [23], sensors [24], and GPS [22,25,26,27,28]. The former two are restricted by certain factors, such as technologies, labor, and financial cost, resulting in a longer map update cycle that has significantly limited the derived application of electronic maps in cities. The research on road network generation based mainly on GPS tracking shows how such map generation firstly processes GPS data by the clustering and segmentation of track points, center-line fitting, virtual intermediate point interpolation, or similar convolution, and then generates the vectorized road network. During this process, the road network is directly generated after data preprocessing, meaning that while all the data need to be loaded, only specific datum needs to be updated. Thus, when the portrayed region is expanded, the data volume and storage space will be affected and increased. Research [24] highlights how speed and angle data are also needed, which increases the requirements for the accuracy and number of sensors. A road network generated by GPS trajectory data alone will not be able to show a map responding in a timely manner to local traffic conditions affected by accidents and disasters, especially with only partial responses to specific areas. In such cross-regional resource allocation, the requirement of map accuracy is no longer an important factor and can be further reduced according to actual needs; while for traffic management in a specific local area, the requirement of map accuracy can be increased with the need for details. Therefore, more attention should be paid to the robustness and fault tolerance of the GIS so that it can flexibly cope with the user requirements and scope of different hardware conditions against different application backgrounds.
In order to address the aforementioned problems leading to long update cycles that delay many digital maps and prevent timely and accurate representations of fast-changing local conditions, we propose a fast-constructing method of urban road maps based on GPS data, and we developed a compressed grid algorithm to adapt to map scenario applications that have a lower requirement for accuracy. The proposed method mainly includes the following features:
(1)
By coordinating the intersection of direction and distance, less data and storage space are used to express the topological relationship between nodes, thereby compressing the map size and saving the system’s running memory.
(2)
The way the traditional grid is described is improved by adopting a multi-dimensional coordinate design, and when resolving the overall regeneration problem of regional updating, the information capacity of the elementary grid is enlarged. After updating the local map, it can be merged to the main map to update the entire map, avoiding the unnecessary burden on the system of inputting all the data.
(3)
Compression and restoring can be flexibly transformed and adjusted according to how accurately the scenario describes the road, thereby achieving good expansibility and adaptability.
In order to prove the effectiveness of the proposed method, the performance of quick map construction was tested in Qitaihe City, Heilongjiang Province, China, and the effect of our algorithm was evaluated by the analysis of bus network coverage and resilience of public transport.

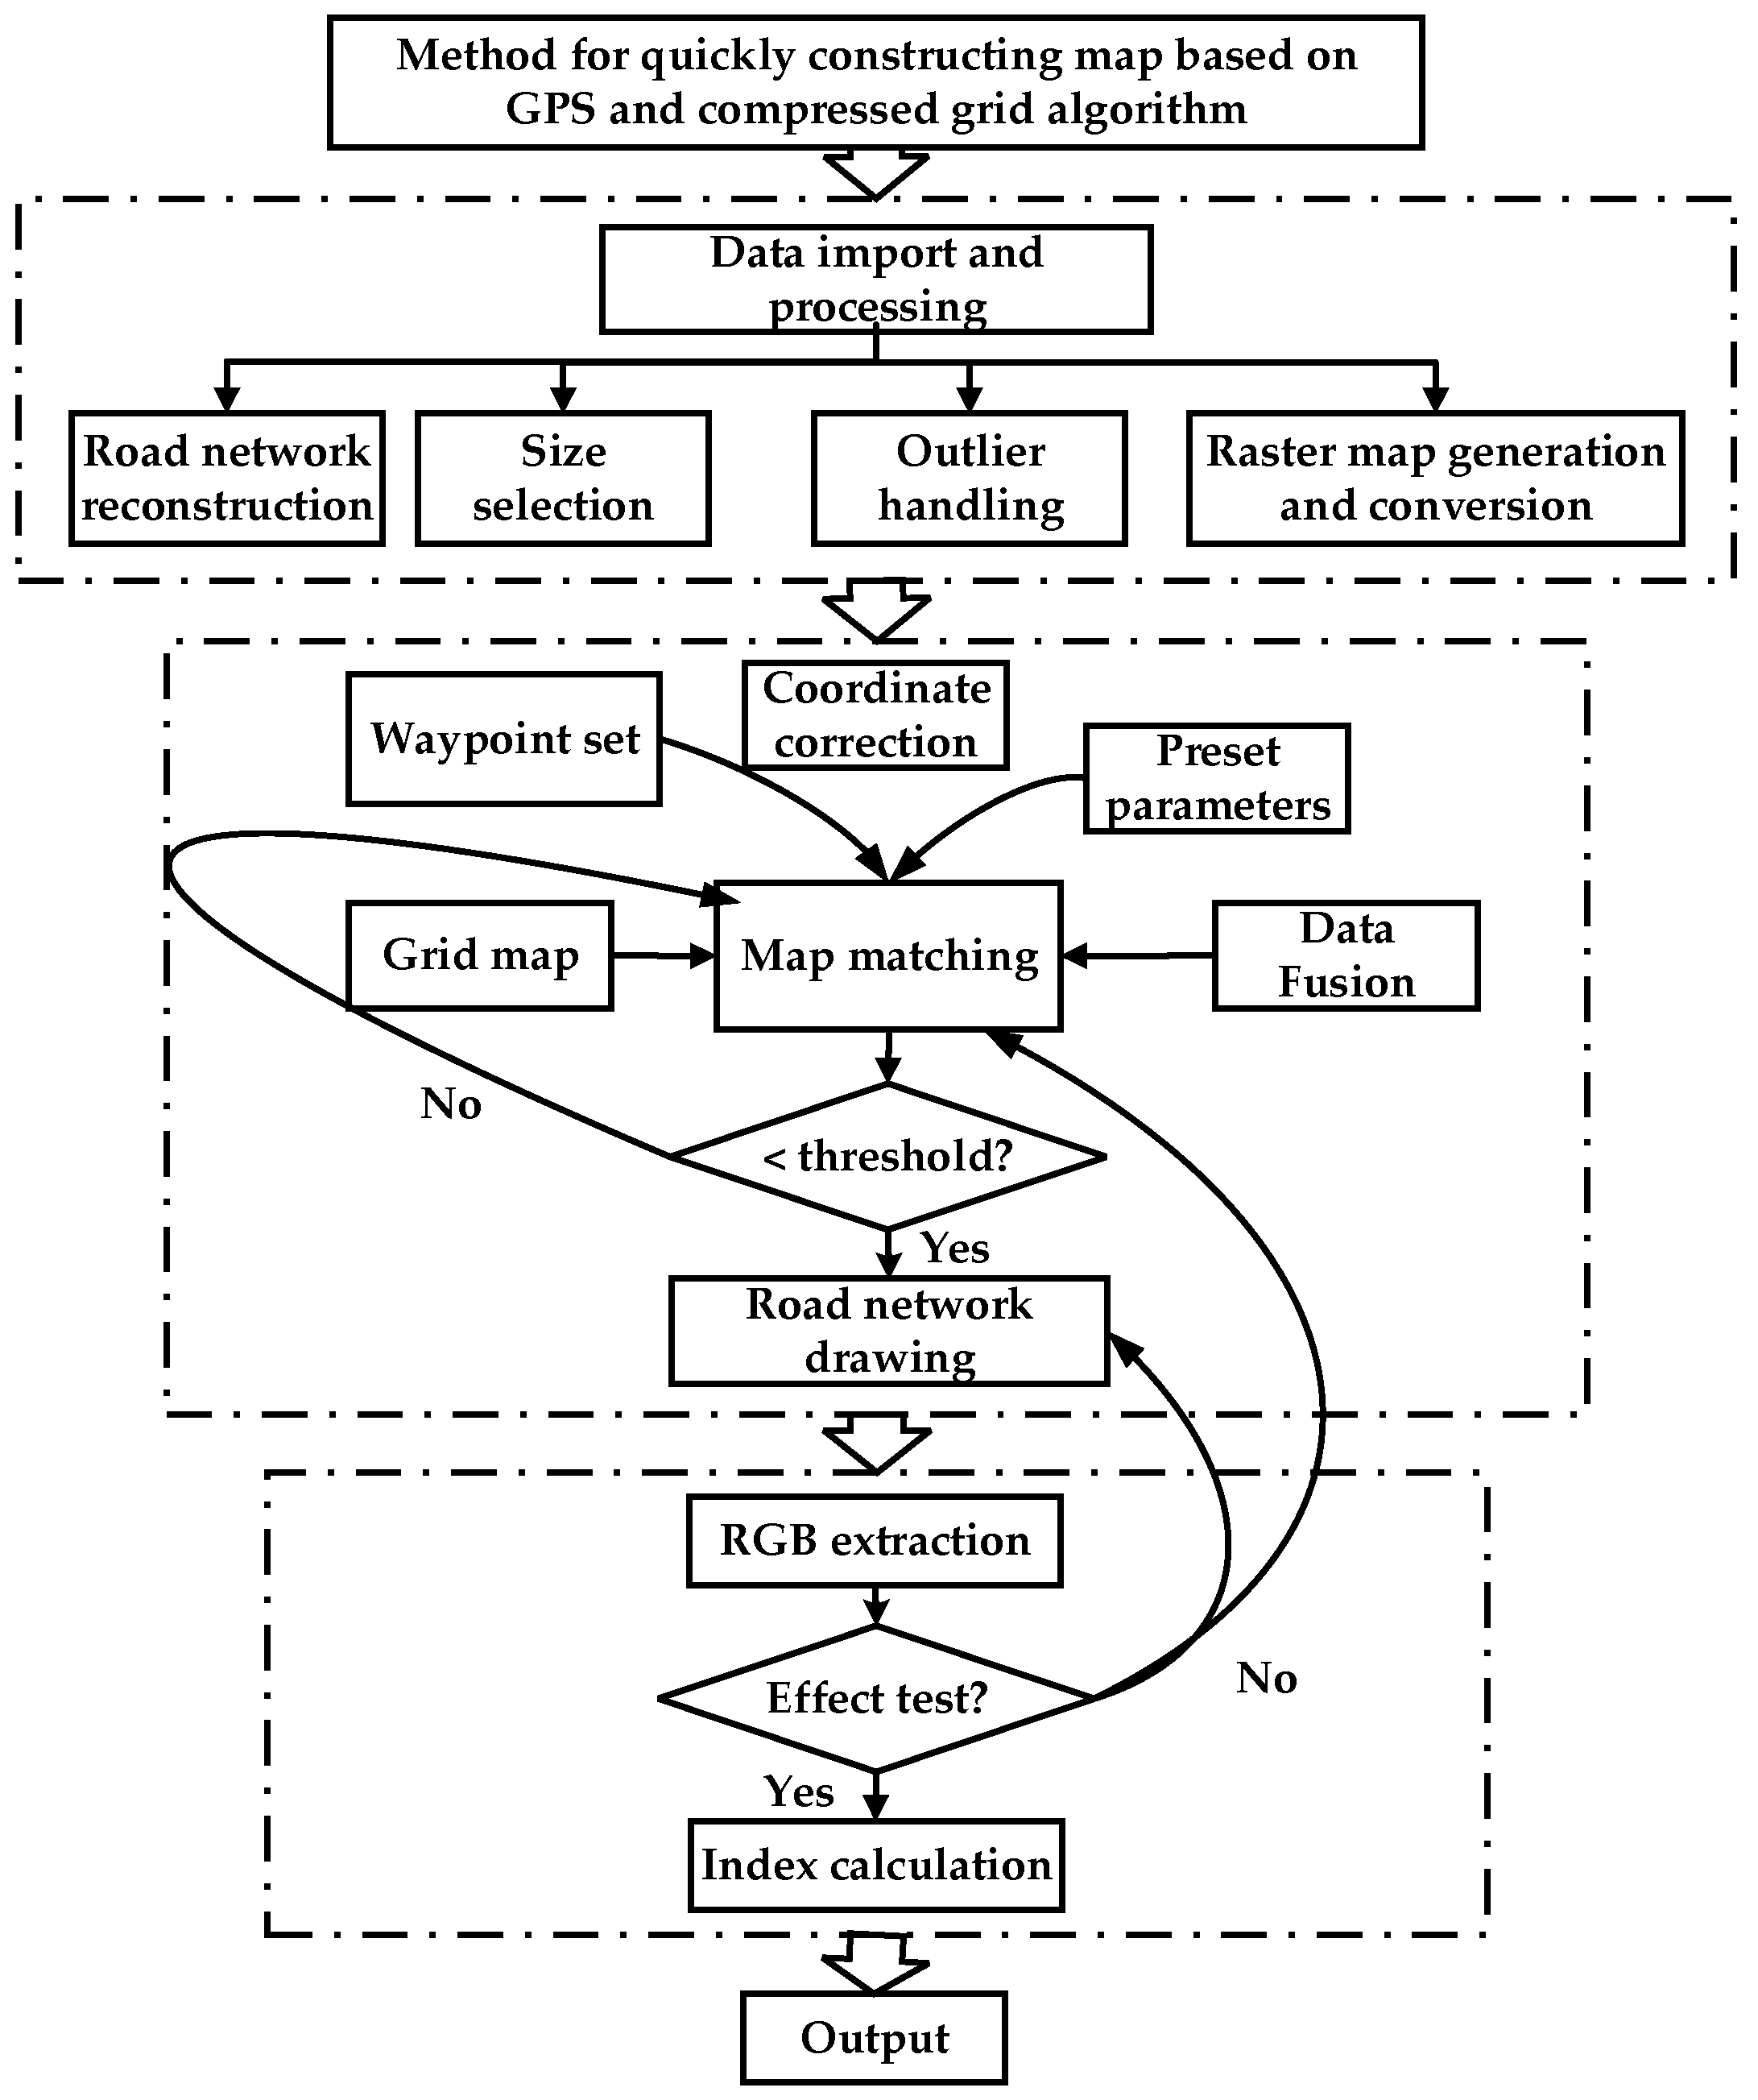
2. Materials and Methods

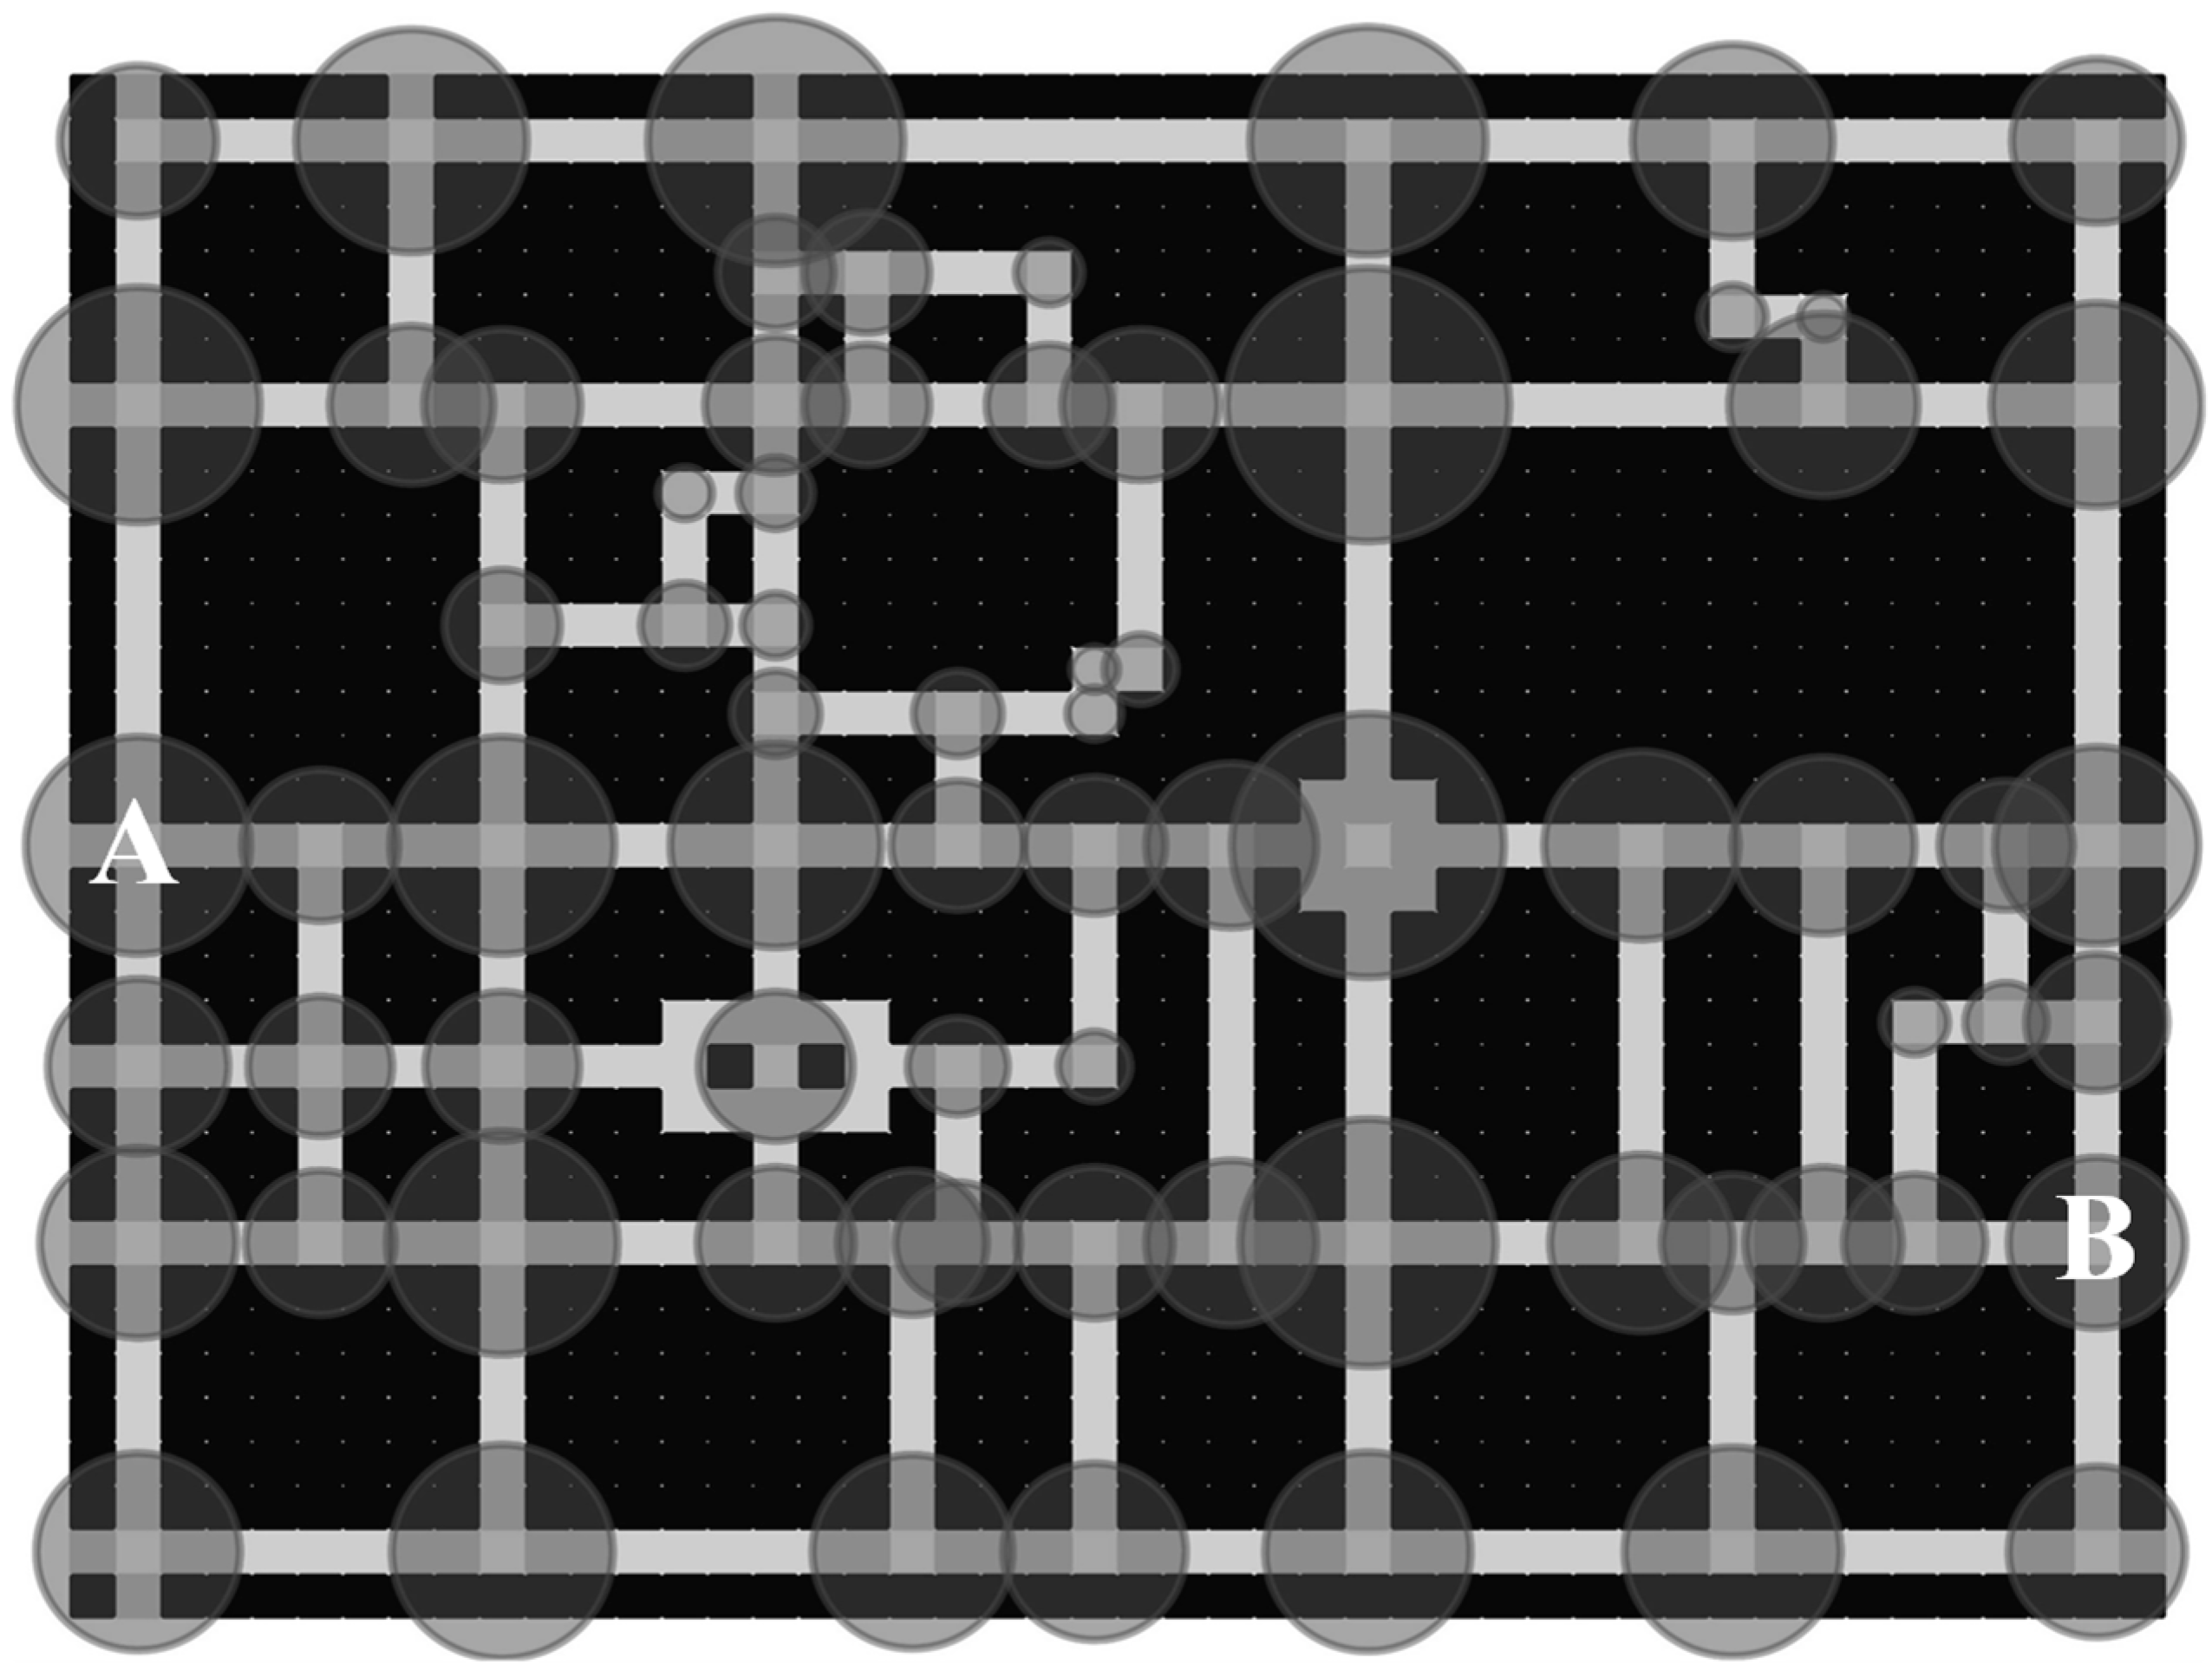
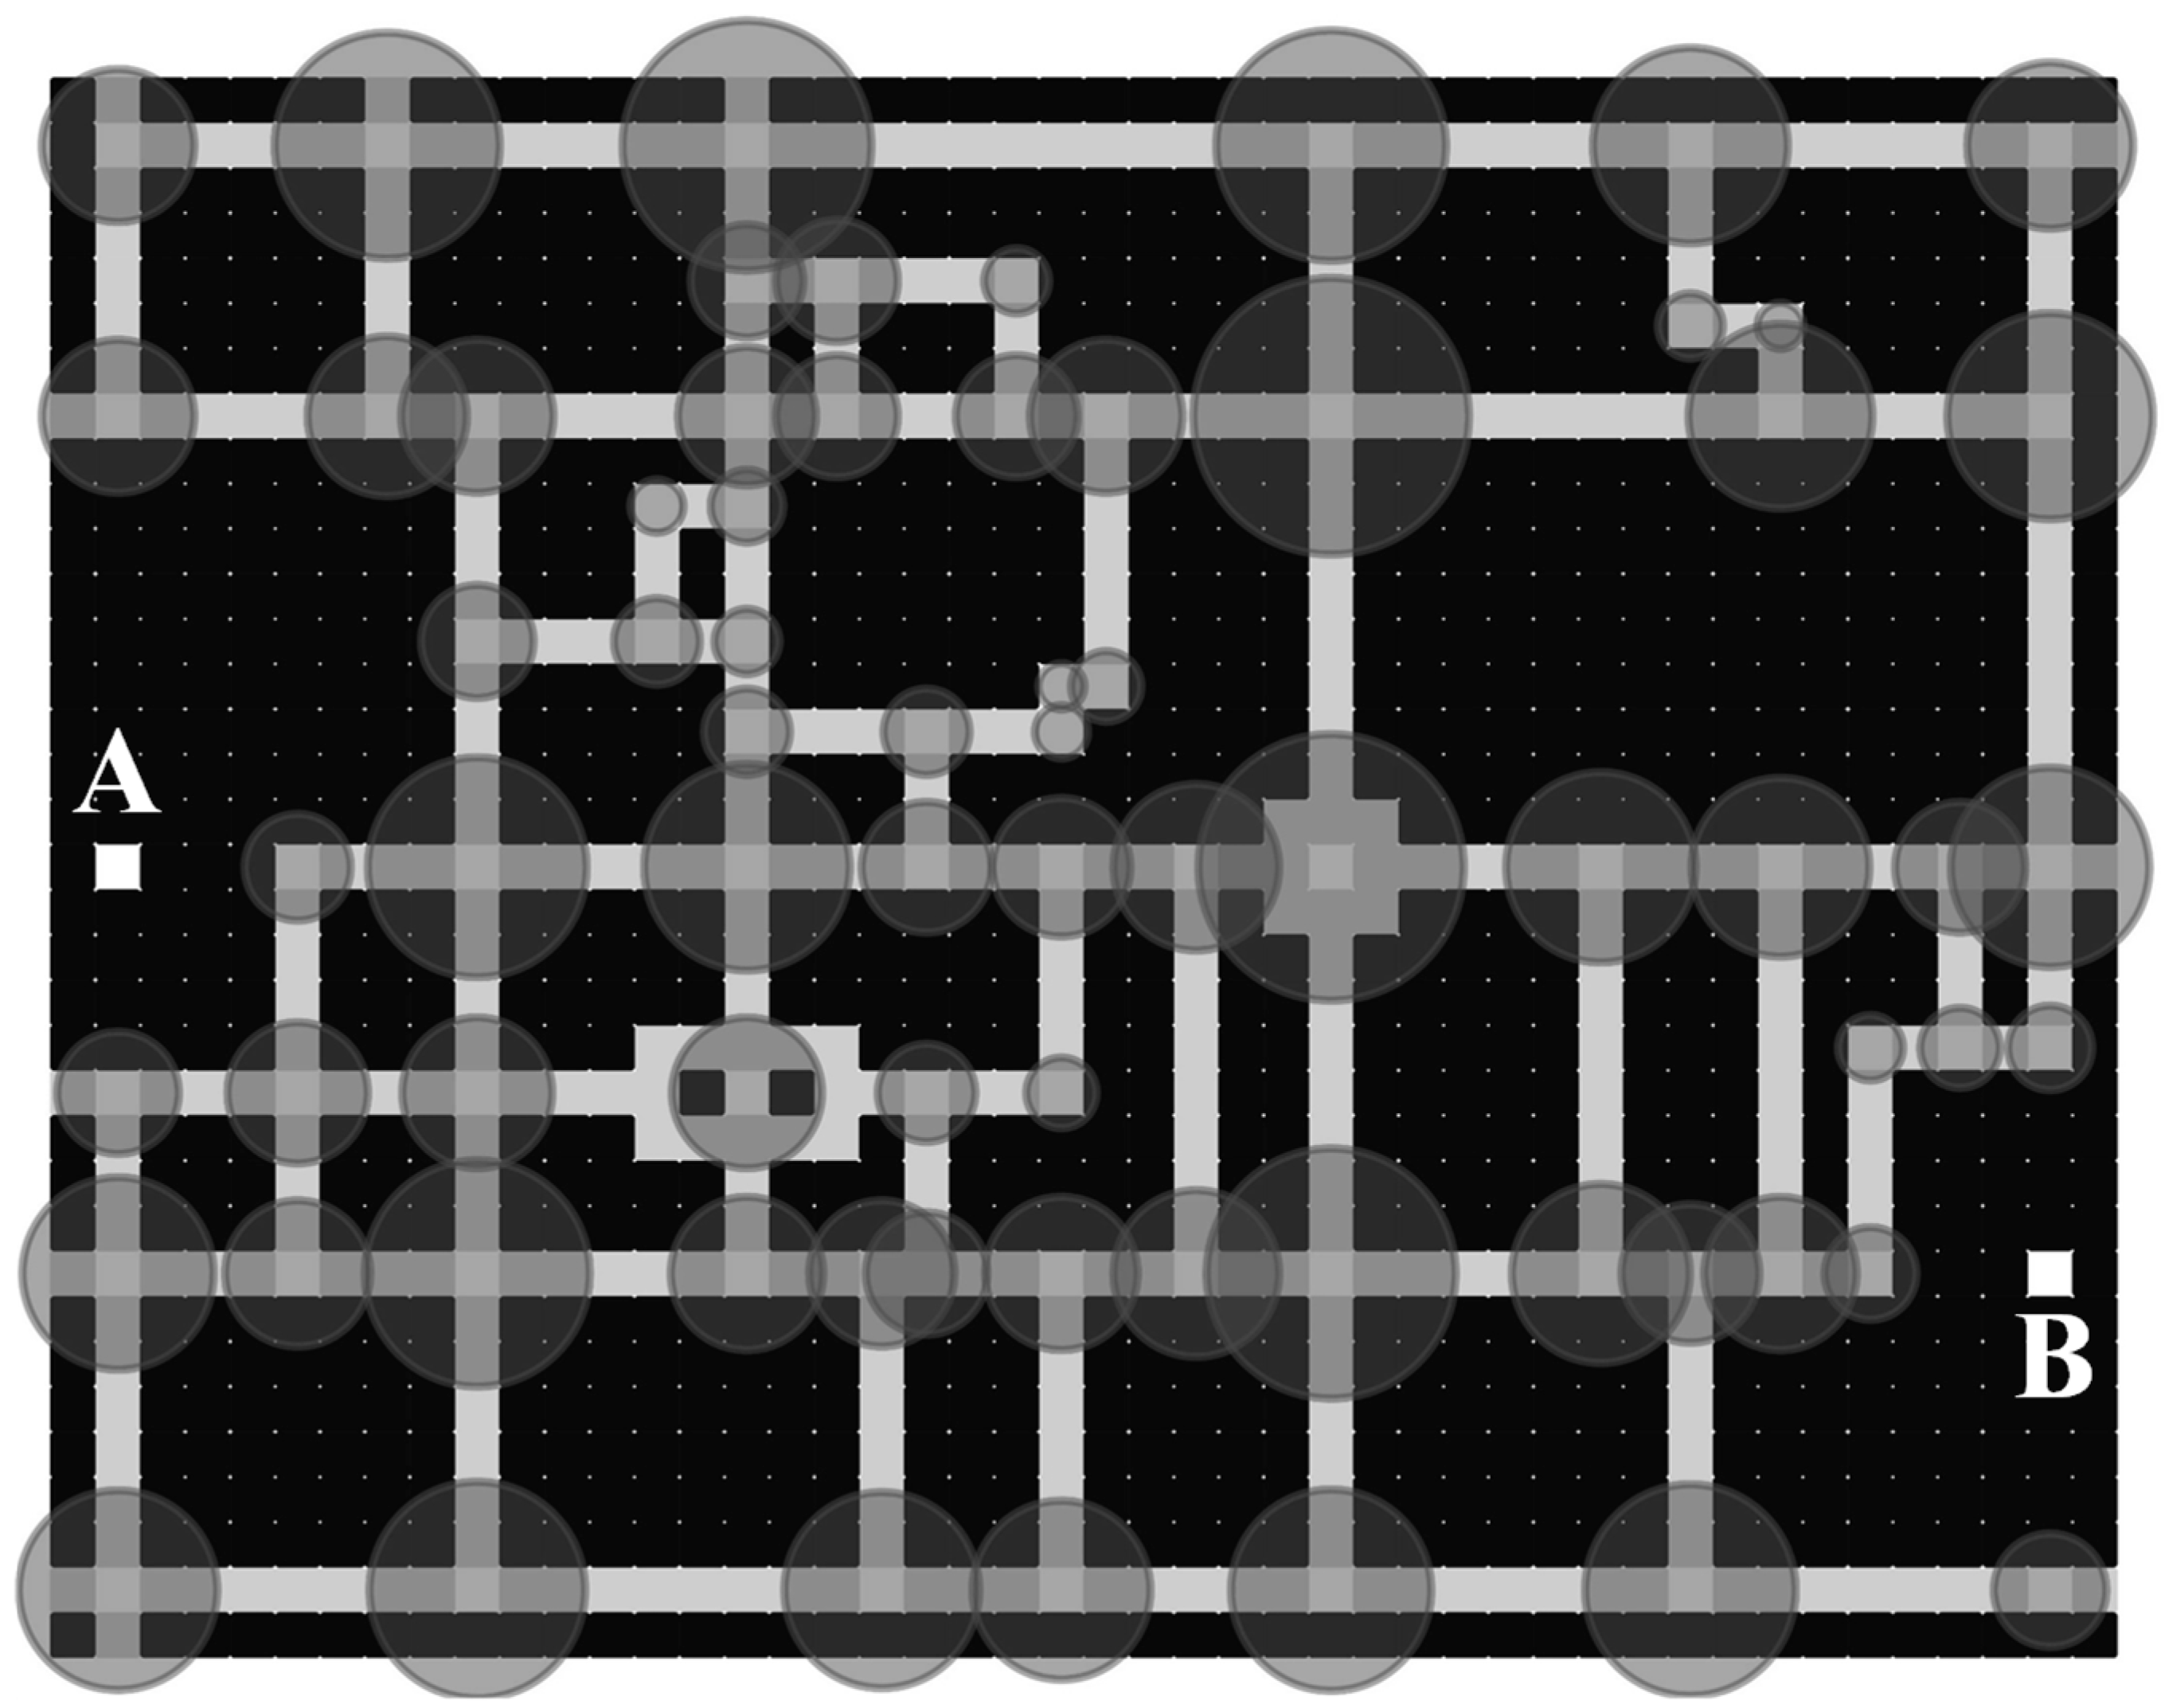
2.1. Model Principle and Symbol Description

The grid method has a simple principle and an intuitive graph, and it is easy to maintain. However, its accuracy is highly related to the size of the regional grid cell; the smaller the regional grid cell is, the larger the number of data that needs to be stored when modeling, and the more complicated the model building process will be. To further compress the local map size and simultaneously save on computation resources, decrease hardware requirements, and improve system adaptability, the plane coordinates need to be converted. This step will reduce the local map size as much as possible and reserve the offset, thus reserving parameters for subsequent local map splicing and global map restoration.
This paper names the grid map generation algorithm Othello, inspired by the Othello board game, which is also known as Reversi (Appendix A). The algorithm generates new nodes when searching the nodes of the global map, setting the grid between nodes from one to zero to distinguish roads and non-roads (zero means access; one means obstacle). In this way, a city grid network can be constructed. A grid coordinate obtained by this process is named an Othello coordinate, and the process of coordinate generation is named Othello coordinatization.
Based on the city road network construction process and the theory of occupying the grid map, the main and median algorithms (raster map generation and segment transformation) of the proposed method for the fast construction of urban maps based on the GPS data and the compressed grid algorithm are presented in Figure 1 and Figure 2, respectively. The customized terms used in the road network construction process are introduced in Table 1.

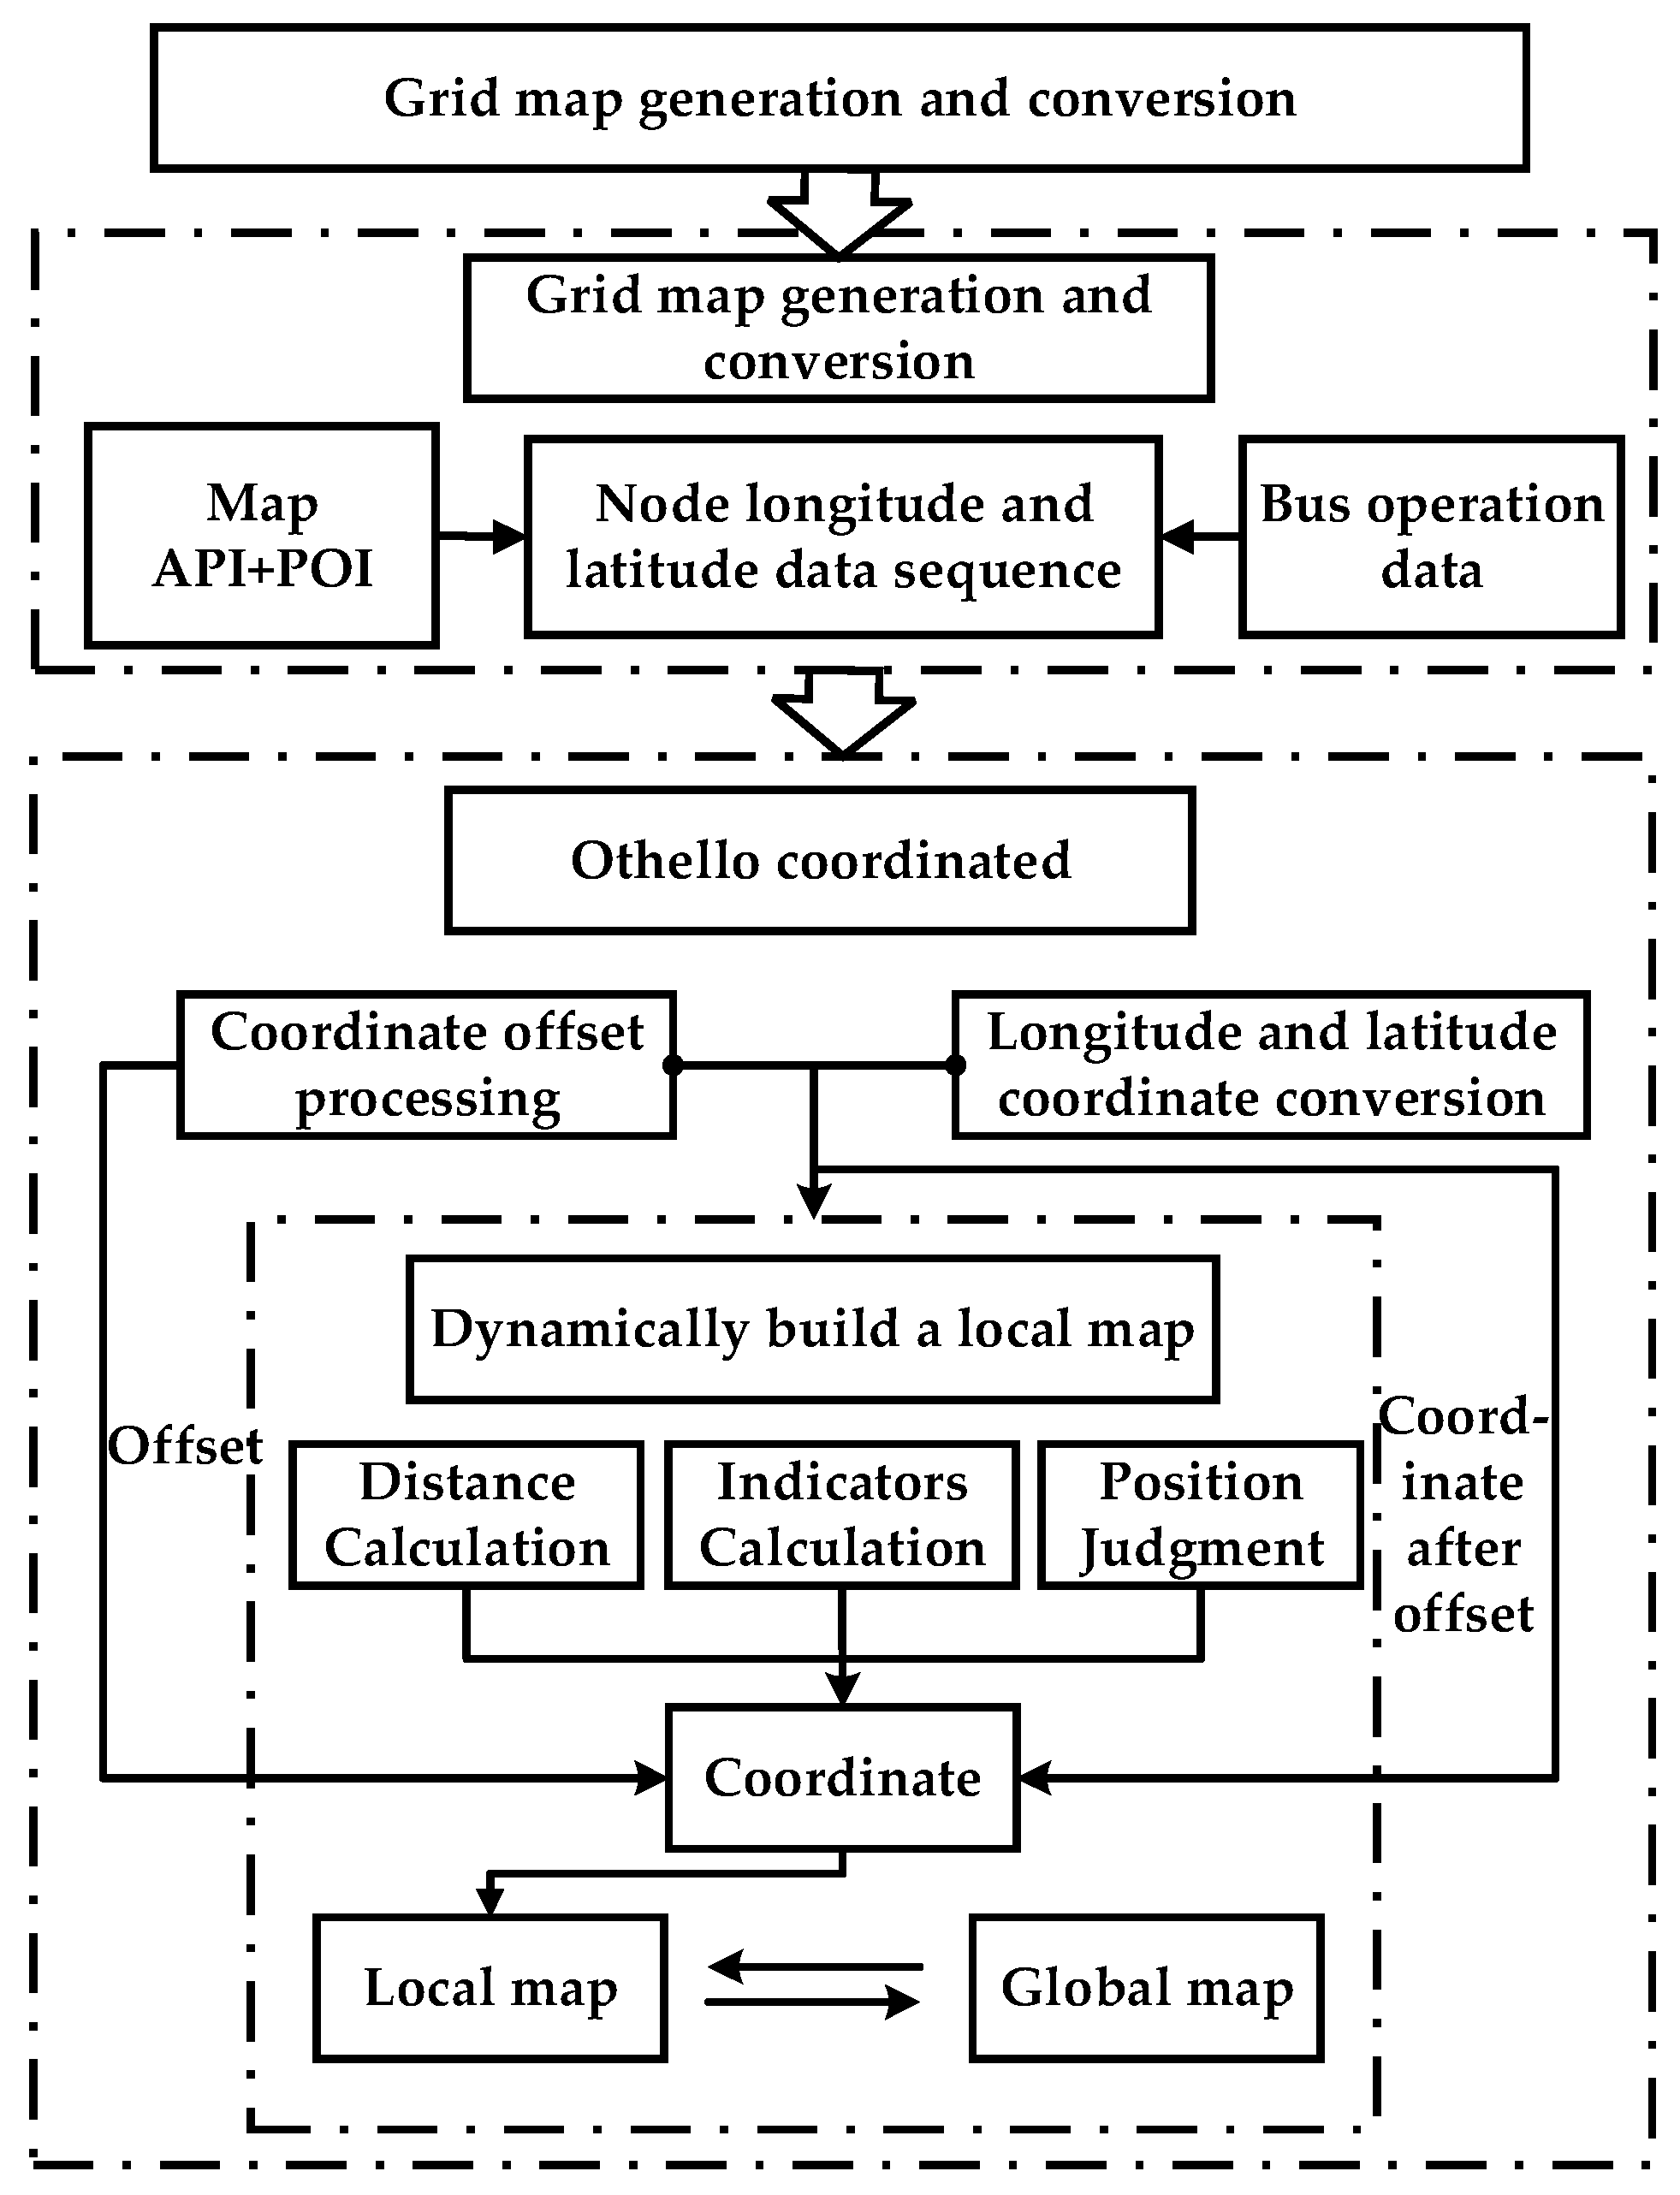
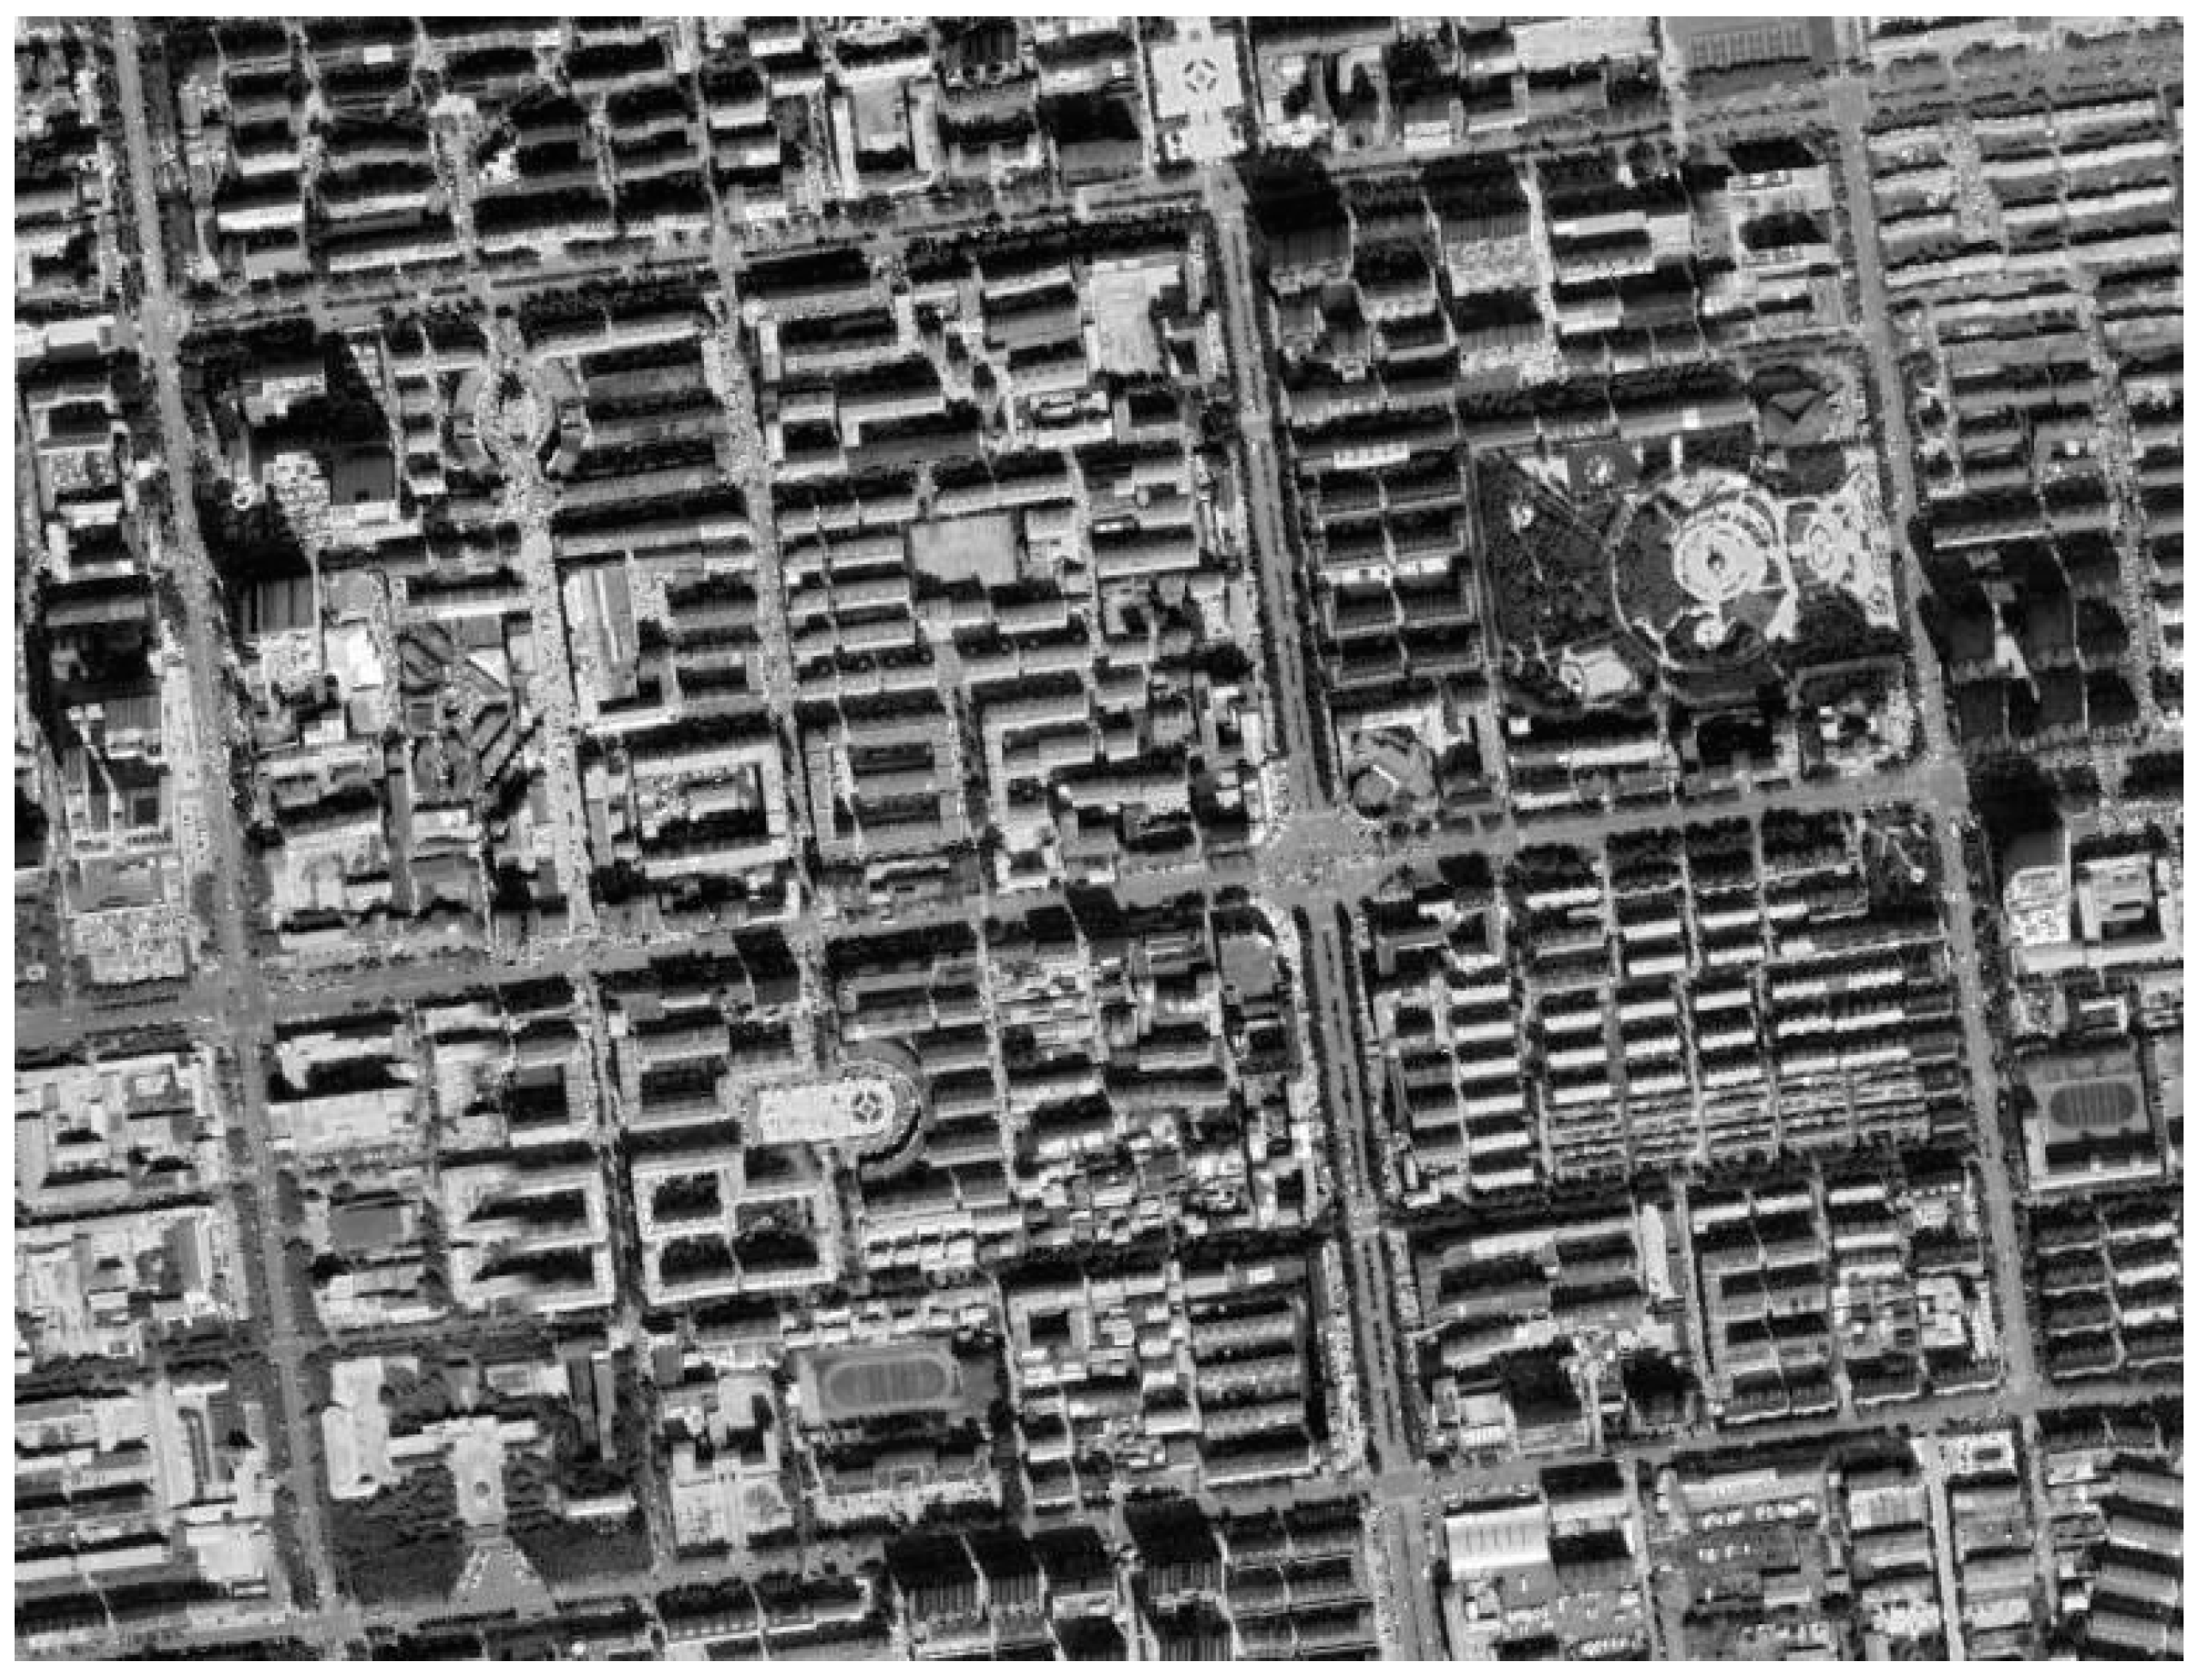
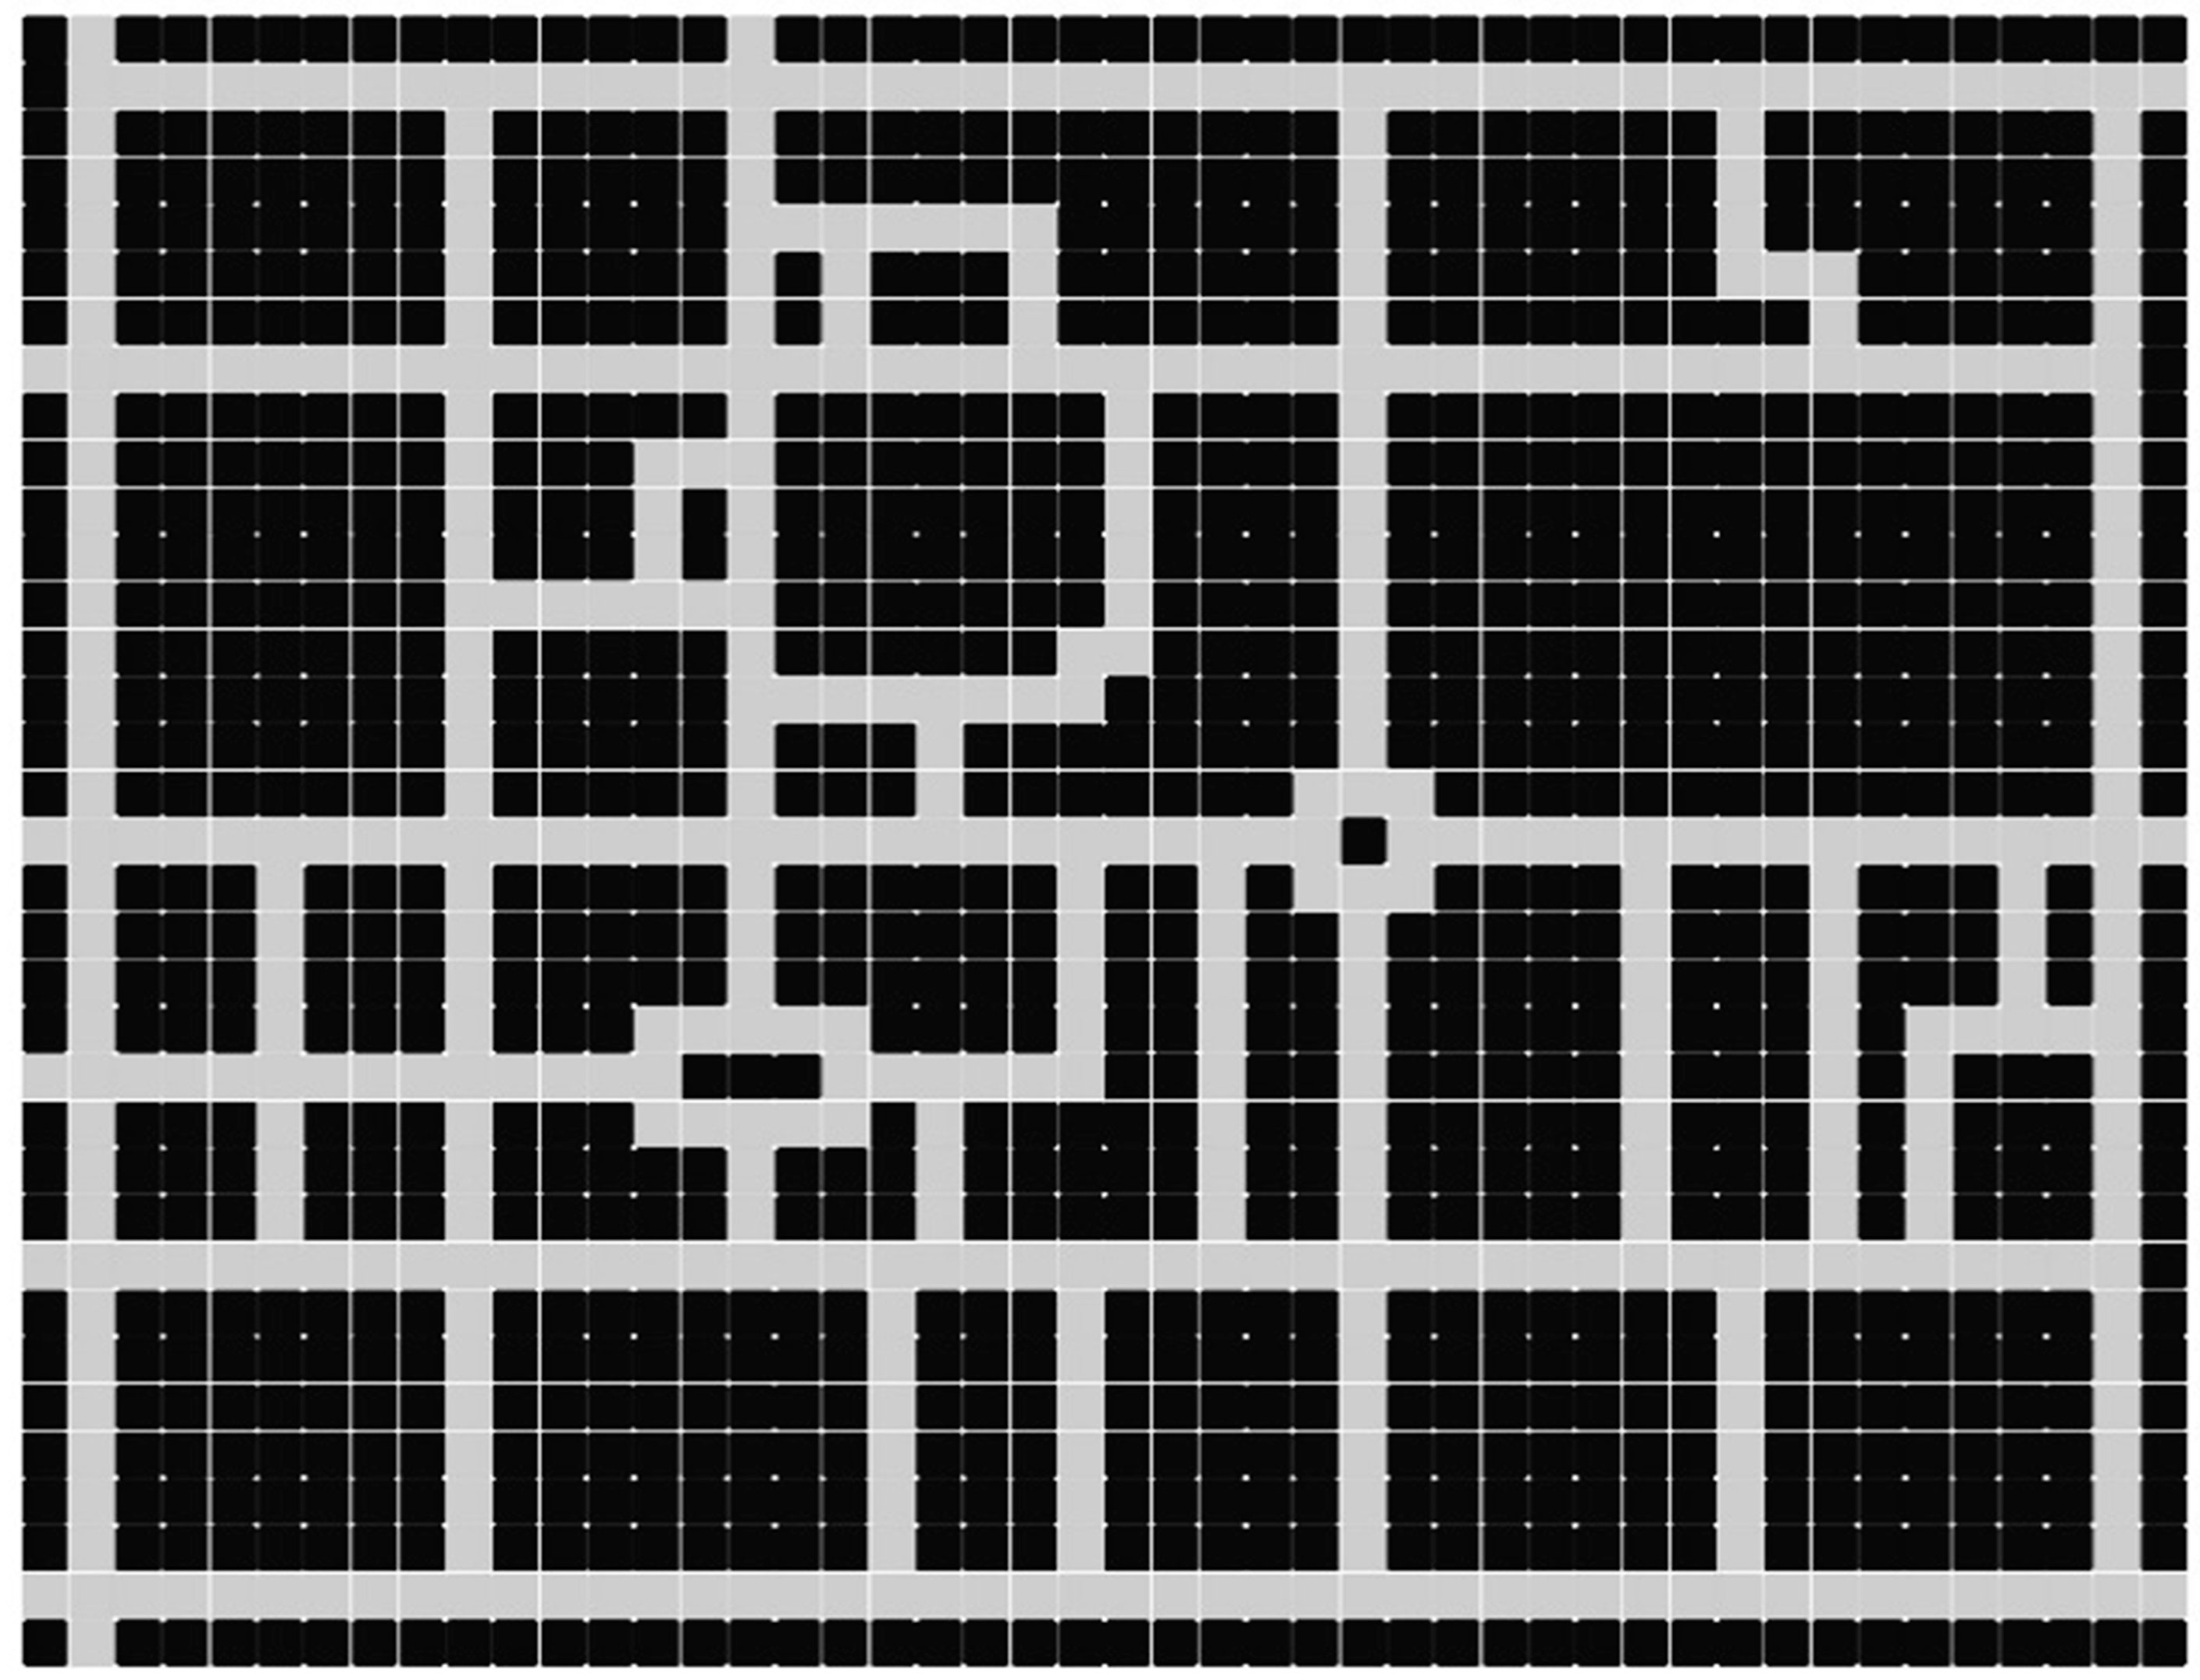
2.2. Road Network Raster Map Generation

2.2.1. Map Projection

This paper uses the Web Mercator Projection method to project the longitude and latitude coordinates, which means to map the longitude and latitude coordinates to the Cartesian rectangular coordinate system for subsequent processing and management (in meters per raster). Positioning errors can occur in the obtained bus operation GPS data due to geomagnetic interference, the shielding of tall buildings, and transmission packet loss. To correct for abnormal GPS data, we use the nearest reference point between longitude and latitude distance calculation algorithm and the standard or corrected road node within the threshold range. The corresponding pseudocode is given in Algorithm 1. If there is no standard or corrected road node, the median point of multiple lines within the threshold range of the point and the minimum distance are taken as new GPS coordinates of that point.
Algorithm 1 The Longitude and Latitude Distance Calculation Algorithm.
Input:longitude1, latitude1, longitude2, latitude2, R_Earth
Output:Distance between two points
Begin
1Cov_radian = map (radians, input_points)
2Square = sin(dis_lat/2)2 + cos(lat1) * cos(lat2) * sin(dis_lon/2)2
3Distance = 2*sqrt(Square) *R_Earth*1000
4Result = round(Distance, x)
5return Result
End
The formula [29] is as follows:
{ x = L o n g i t u d e * R _ E a r t h / 180 y = log ( tan ( ( 90 + L a t i t u d e ) * π / 360 ) ) * R _ E a r t h / π
where x and y denote the plane coordinates obtained from the Latitude and Longitude of the original position data using the Web Mercator projection method, and R _ E a r t h is the half the width of the world map, which is under the projection.

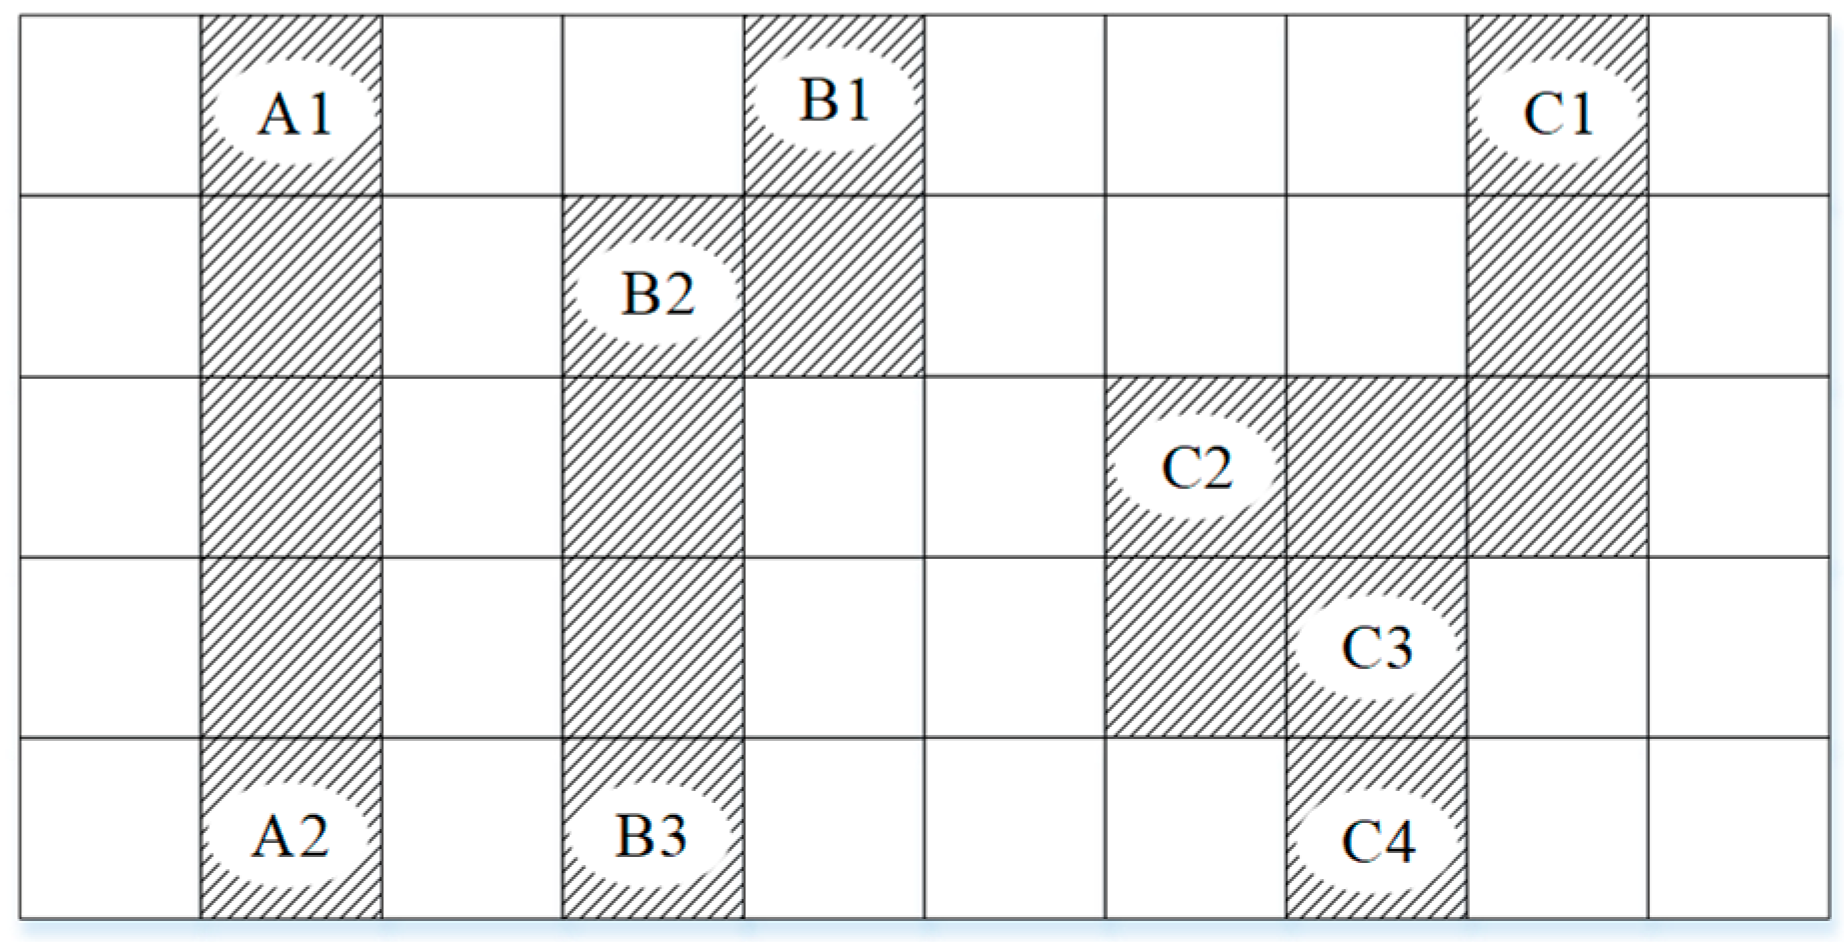
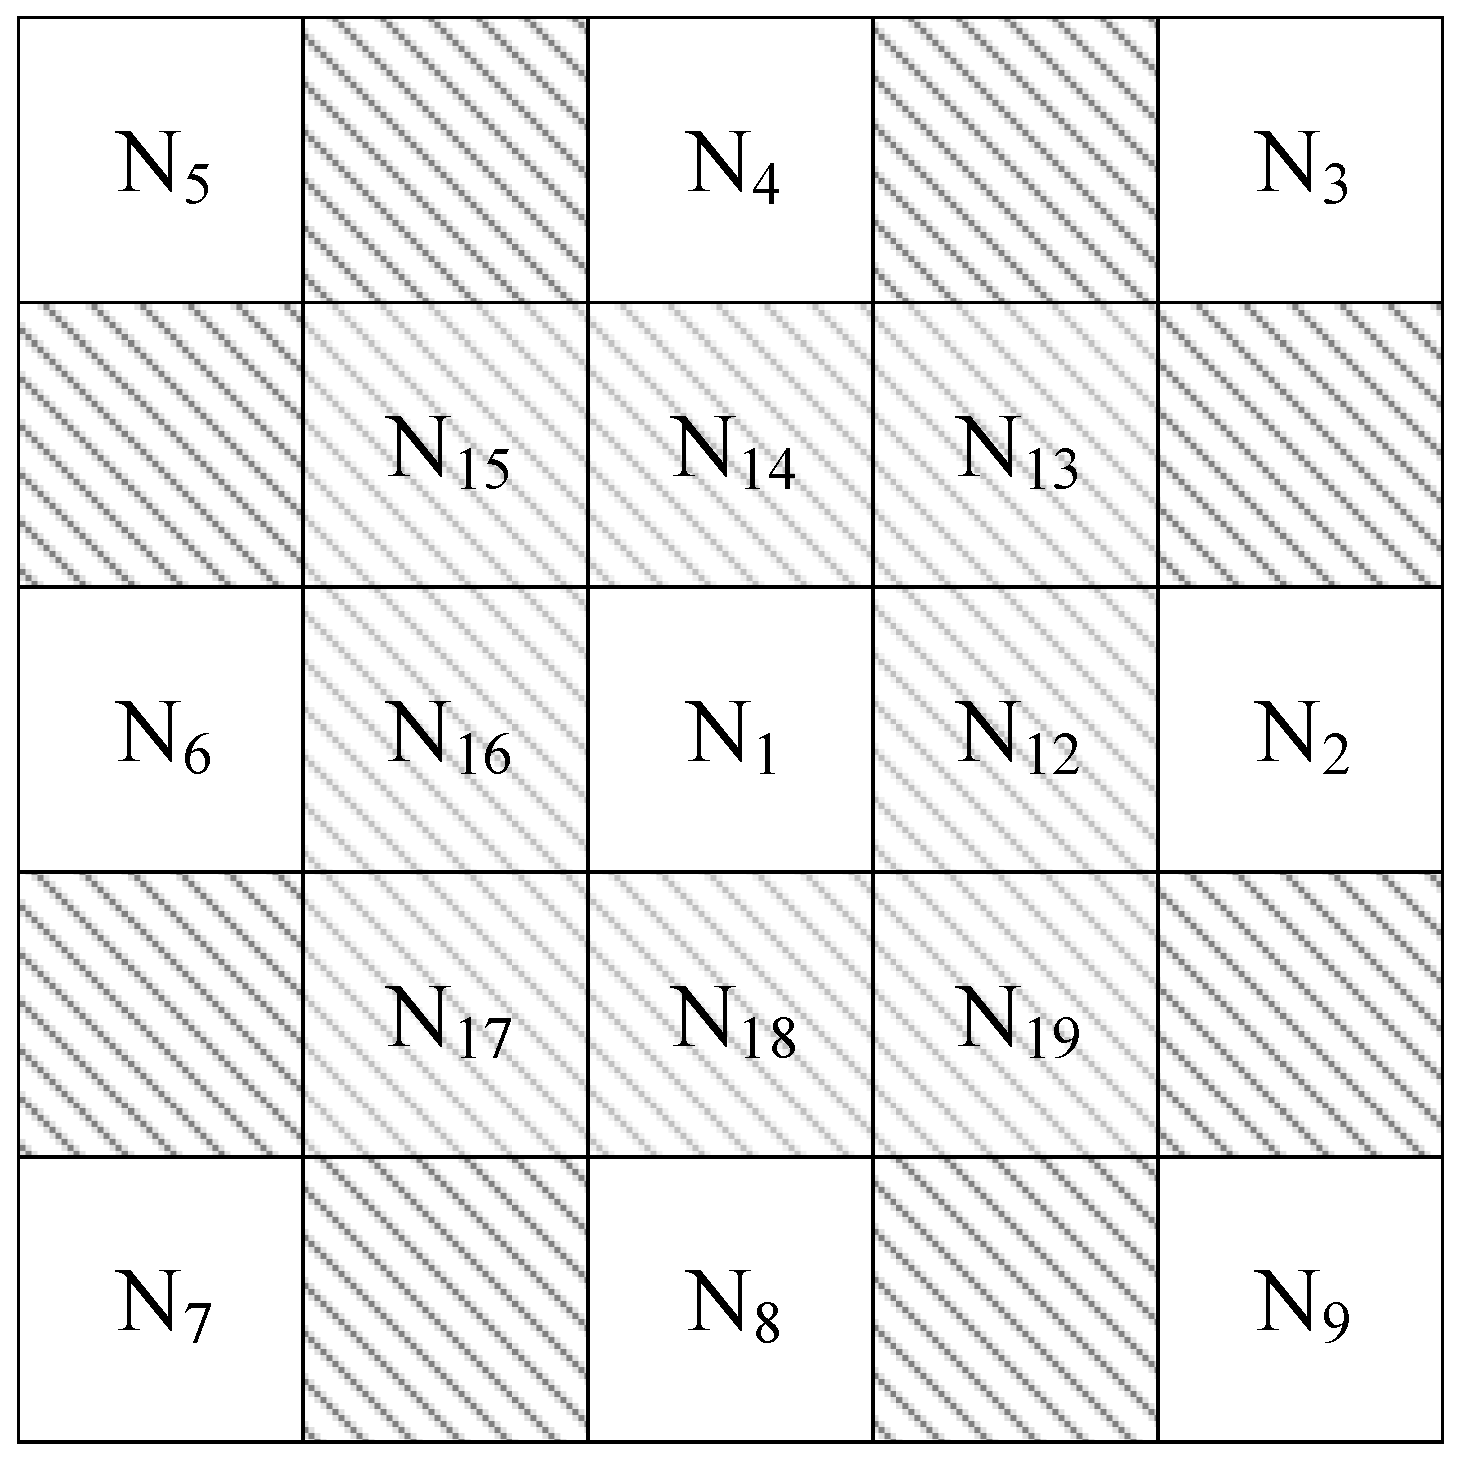
2.2.2. The Othello-Coordinated Design

In Othello board game, when your opponent’s chess piece has a path to your pieces in any of the eight horizontal, vertical, or diagonal directions, your opponent can capture all your pieces in that path (Appendix A). In other words, two points (nodes) determine a straight line (road), and this feature can be used to compress the scale of the raster map. For example, there are three existing roads in Figure 3, and the effect of compression running lengthwise is shown in Figure 4.
The traditional raster map uses “zero“ and “one“ to represent “access” and “obstacle” in the grid cell, respectively. To compress the scale of the raster map and improve its expansibility and application, the Othello-coordinated algorithm was designed to revalue the grid cells that have nodes. As is shown in Figure 5, in order to represent the eight directions of the grid cell, new rows and columns were virtually added around the original node N1 to generate eight flow points (from N12 to N19) around it; and in fact, N1 and N5 are still adjacent.
The relationship between a node and other nodes is represented by grid cells with light diagonal lines, and the value of each node in the matrix is zero. Since the virtual diagonal outer layer of a node has eight directions (two-way lanes occupy only one direction) and can be connected with another node, it can be used to represent the traffic direction of most urban roads. If a more complex intersection connection such as a viaduct is met, the road network can be divided into layers and analyzed by introducing a three- or multi-dimensional matrix.
The grid cells with light diagonal lines do not exist in the whole raster map, but only for localized areas, and in this work, seven-dimensional coordinates are established to describe the complex relationship between the local area and the whole area of a local grid map, as follows:
(Dr, Ds, Dm, Dx, Dy, Dpx, Dpy),
where Dr represents the directional connectivity property of a node, and each digit indicates the direction (east, northeast, north, northwest, due west, southwest, south, southeast) from right to left, where zero indicates an accessible azimuth; Ds represents the Manhattan distance between two nodes, where every three bits of data correspond to a bearing of Dr, in which the encoding is base64 and the unit is meter; Dm represents the label of a node in the local map; Dx represents the row label; Dy represents the column label; Dpx represents the offset of the row label relative to the absolute coordinate; and Dpy represents the offset of the column label relative to the absolute coordinates.
An example of the coordinate parameters is as follows:
(10111010, 0000VV0000000000J400001L, 2, 100, 37, 891, 657).
The size of a grid cell of the raster map is defined according to the requirements. The values in (3) mean that a node is 2379 m away from the node due east, 632 m away from the node due north, and 1365 m away from the node due south; the label of this node in the local map is 2, the row label is 100, the offset is 891, the column label is 37, and the offset is 657. Using custom coordinates to replace the “zero” on the traditional raster map renders compression or restoration of the raster map more effective, flexible, and lossless.

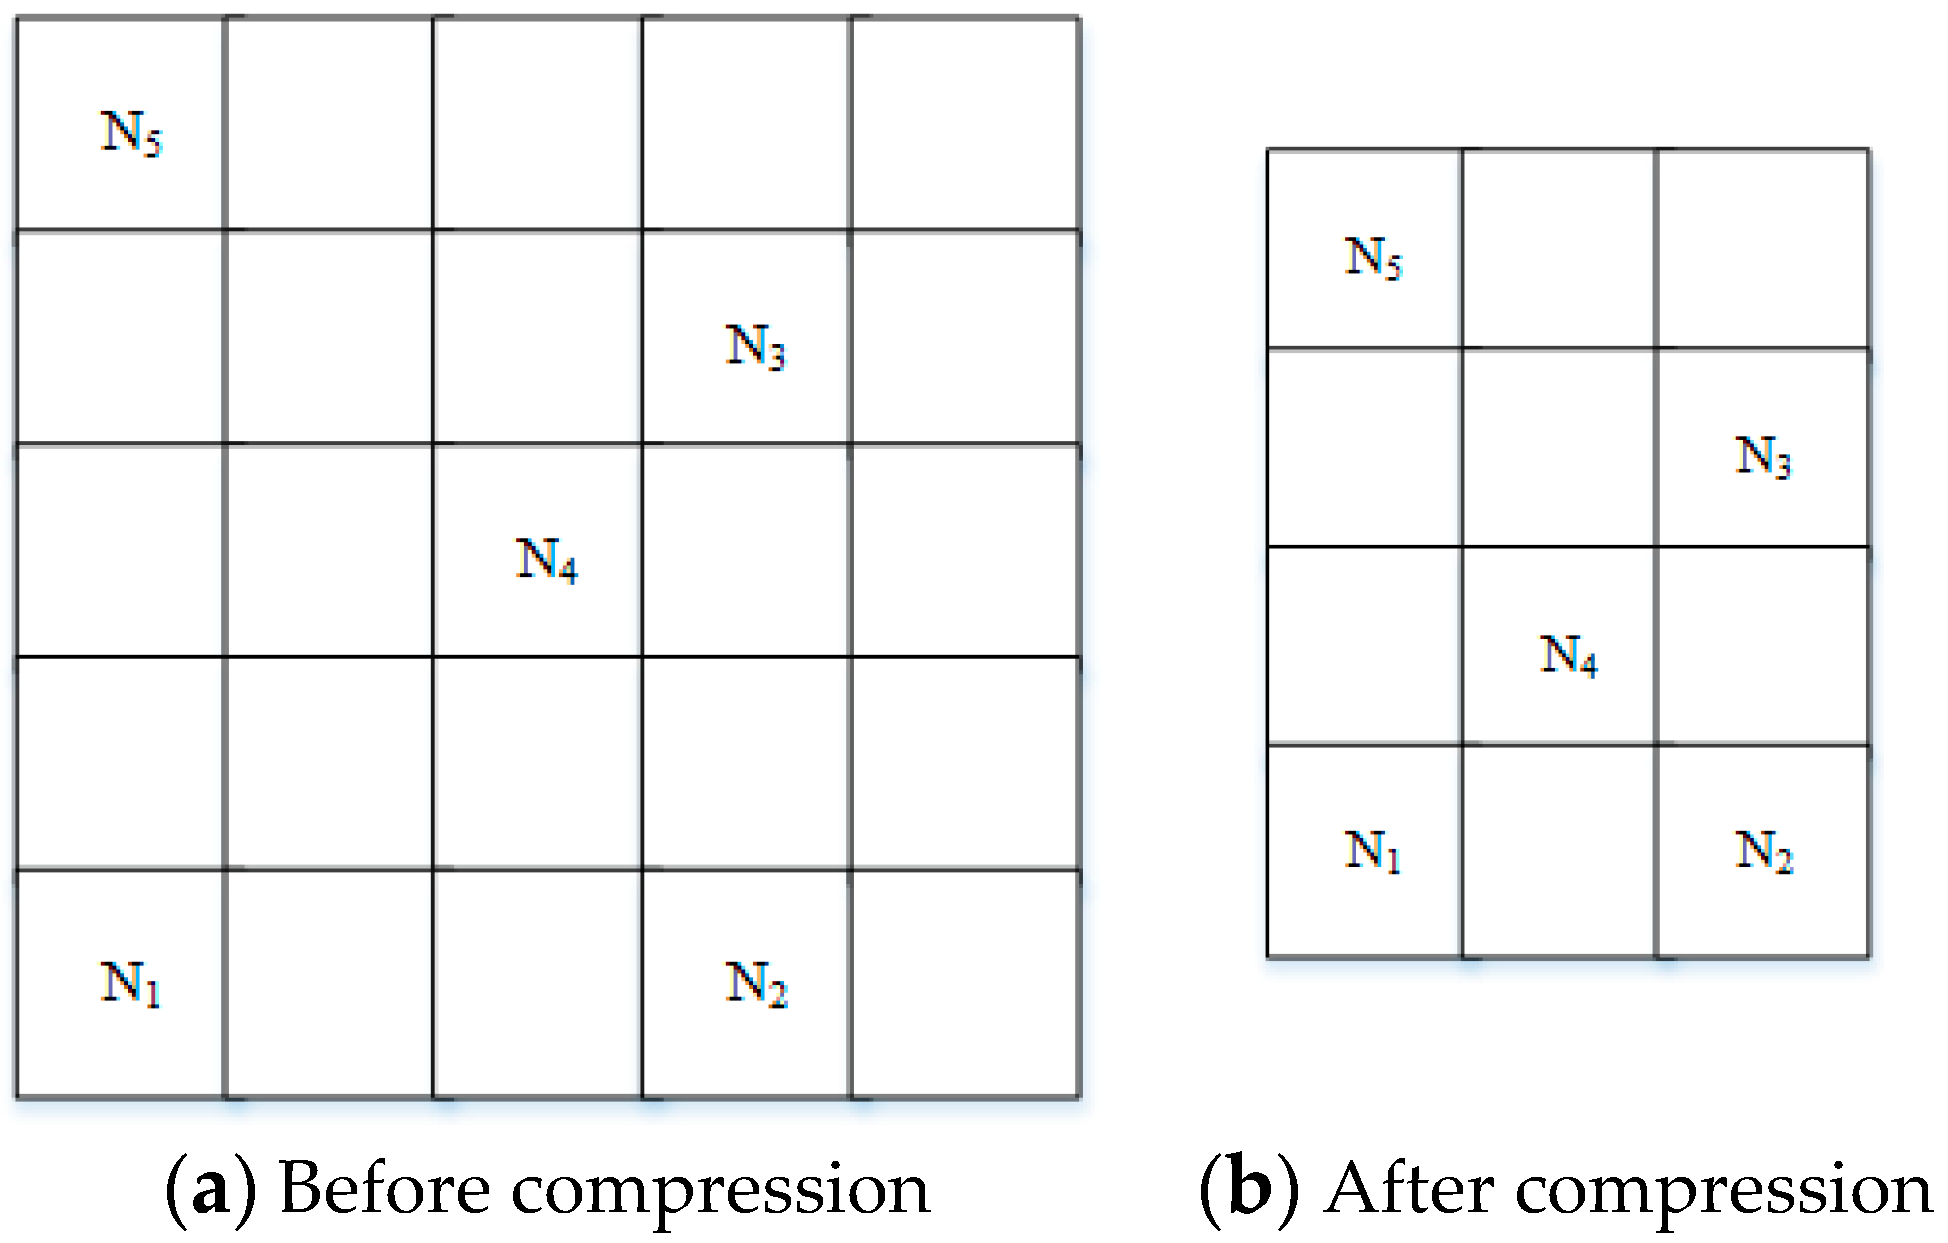
2.2.3. Map Compression and Restoration

The map compression process is shown in Figure 6. This compression process removes all the rows or columns that are empty of flow points and is the next step in Othello coordinatization.
The pseudocode of the map compression and Othello-coordinatization algorithm is shown in Algorithm 2.
Algorithm 2 Map compression and coordinate processing.
Input:longitude1, latitude1, longitude2, latitude2, …, longitude_n, latitude_n, R_Earth
Output:Raster map
Begin
1Cov_coo = Algorithm_1(input_points)
2for direction in one-around_point:
        While not beyond borders:
                If another point is available:
                        Distance = Euclidean distance
                        Direction = direction
3Othello_coo = (Cov_coo, Distance, Direction, …)
4Result_map = zip(map_Othello(i,j))
5return Result
End
The map restoration process extracts the line number, column number, and offset of the node coordinates within the scope of restoration, constructs the grid matrix with appointed specifications, and fills the grid between nodes with the flow points to generate the global map.

2.2.4. Map Splicing and Updating

Map splicing refers to the process of combining raster maps into new raster maps by adding (subtracting) rows (columns) with absolute coordinates. The row and column offsets in Othello coordinates provide a standard for splicing and updating multiple maps. When the road condition in a certain area changes, the local map is updated using the new coordinates of the region, and the coordinate values are also updated. The local map with the largest size is taken as the base map, and then the whole map is spliced as a unit.
The pseudocode of the map splicing and updating algorithm is shown in Algorithm 3.
Algorithm 3 The Map Splicing and Updating Algorithm.
Input:Raster_map1, Raster_map2,…, Raster_map_n
Output:Raster_map_new
Begin
1for i in range(n):
  Raster_map_i_global = unzip(Raster_map_i)
  for nodes in map_1 and map_i:
if the same coordinate points exist:
    new_coo = XOR (two_points)
                elif one of the horizontal and vertical coordinates is the same:
                     Deposit row or column
                     new_coo = XOR (two_points_same_coordinate)
                else:
                     new_coo = point_i
Deposit row and column
       Temporary _map = zip(map_1*)
2Result = combining (Temporary _map)
3return Result
End
By splicing and superimposing multiple local maps, the urban road map of a target area can be quickly updated. If the absolute coordinates of a node in the second row and first column of an image to be spliced are the same as those of the node in the second row and first column of the base image, this node is the point to be updated, and its Othello coordinates are updated as follows:
D r 21 z = D r 21 x | D r 21 y
D s 21 z = D s 21 x + D s 21 y
{ D p x 21 z = min ( D p x x , D p x y ) D p y 21 z = min ( D p y x , D p y y )
{ D x 21 z = D x 21 x + D x 21 y min ( D p x x , D p x y ) D y 21 z = D y 21 x + D y 21 y min ( D p y x , D p y y )
If the absolute coordinates of the node in the second row and first column of the image to be spliced are different from those in the base image, this node is the point to be added. Then, it needs to update its base map and its related node coordinates in the base map according to its absolute position coordinates and the Othello coordinate process.

3. Results and Discussion

In this section, we present two application cases of the raster map of Qitaihe City, Heilongjiang Province, China, which was used as our research subject: calculation of bus line coverage and resilient traffic evaluation. We simultaneously tested the performance of the map’s storage space.

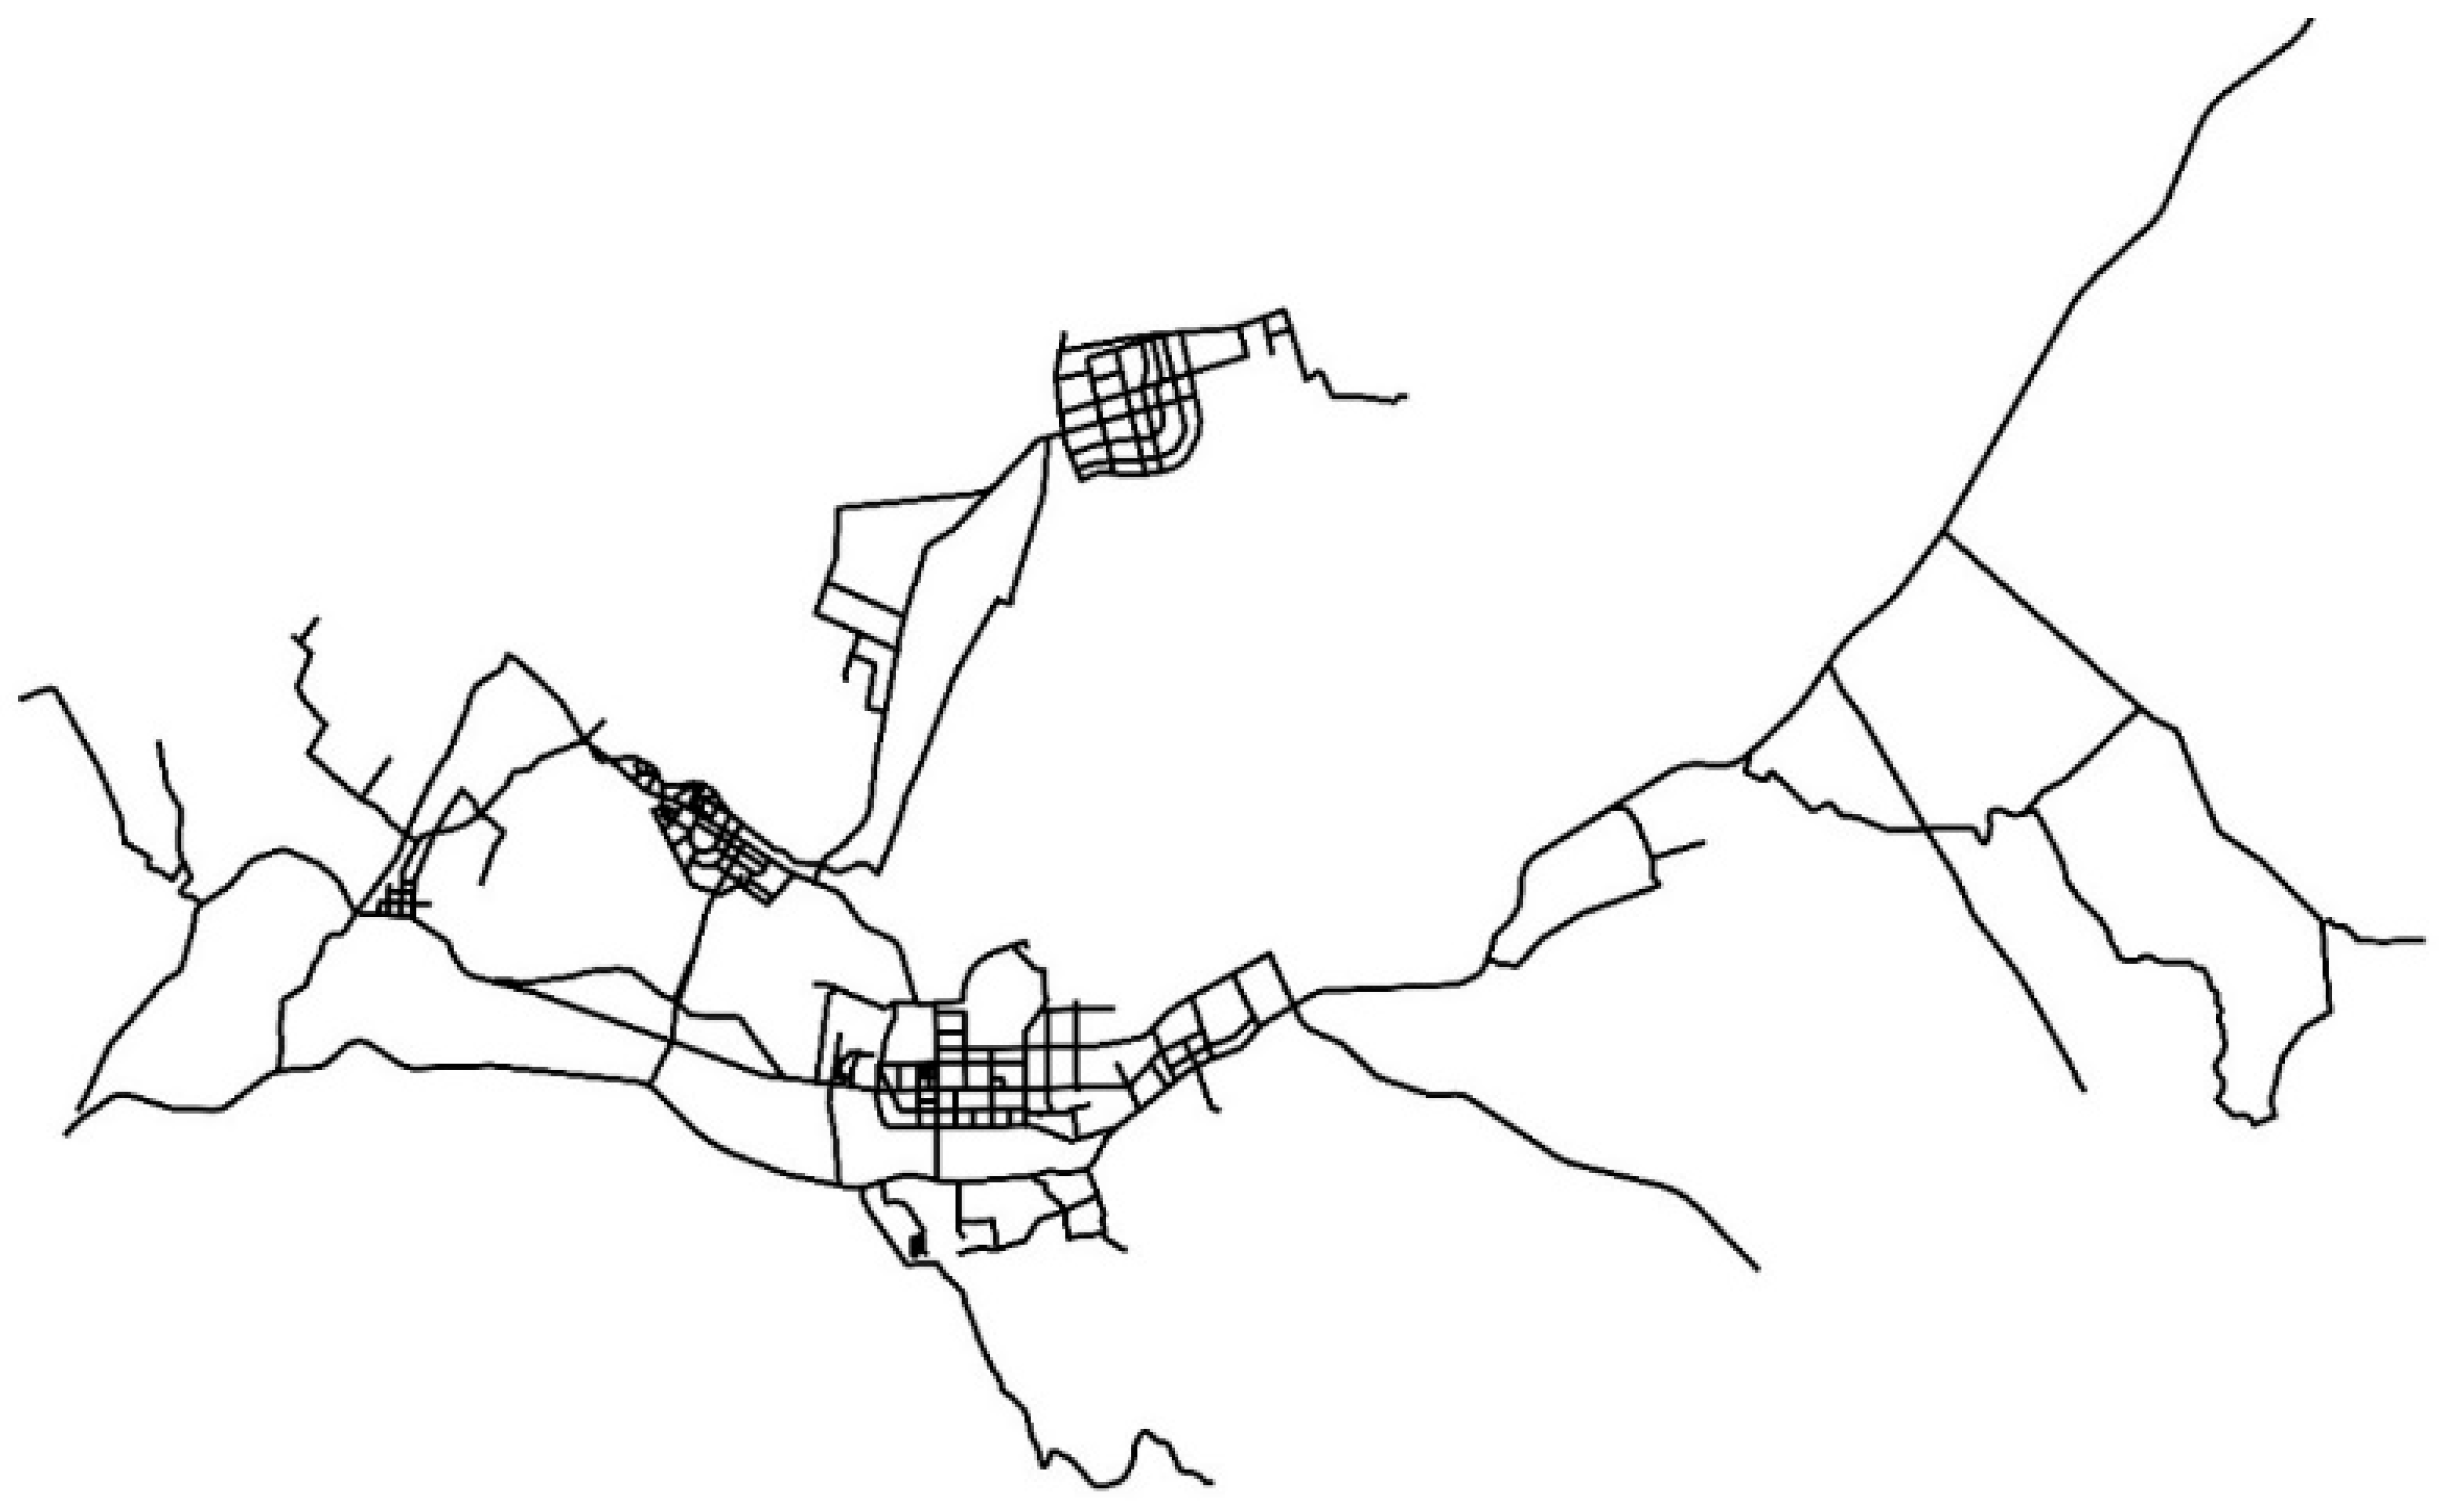
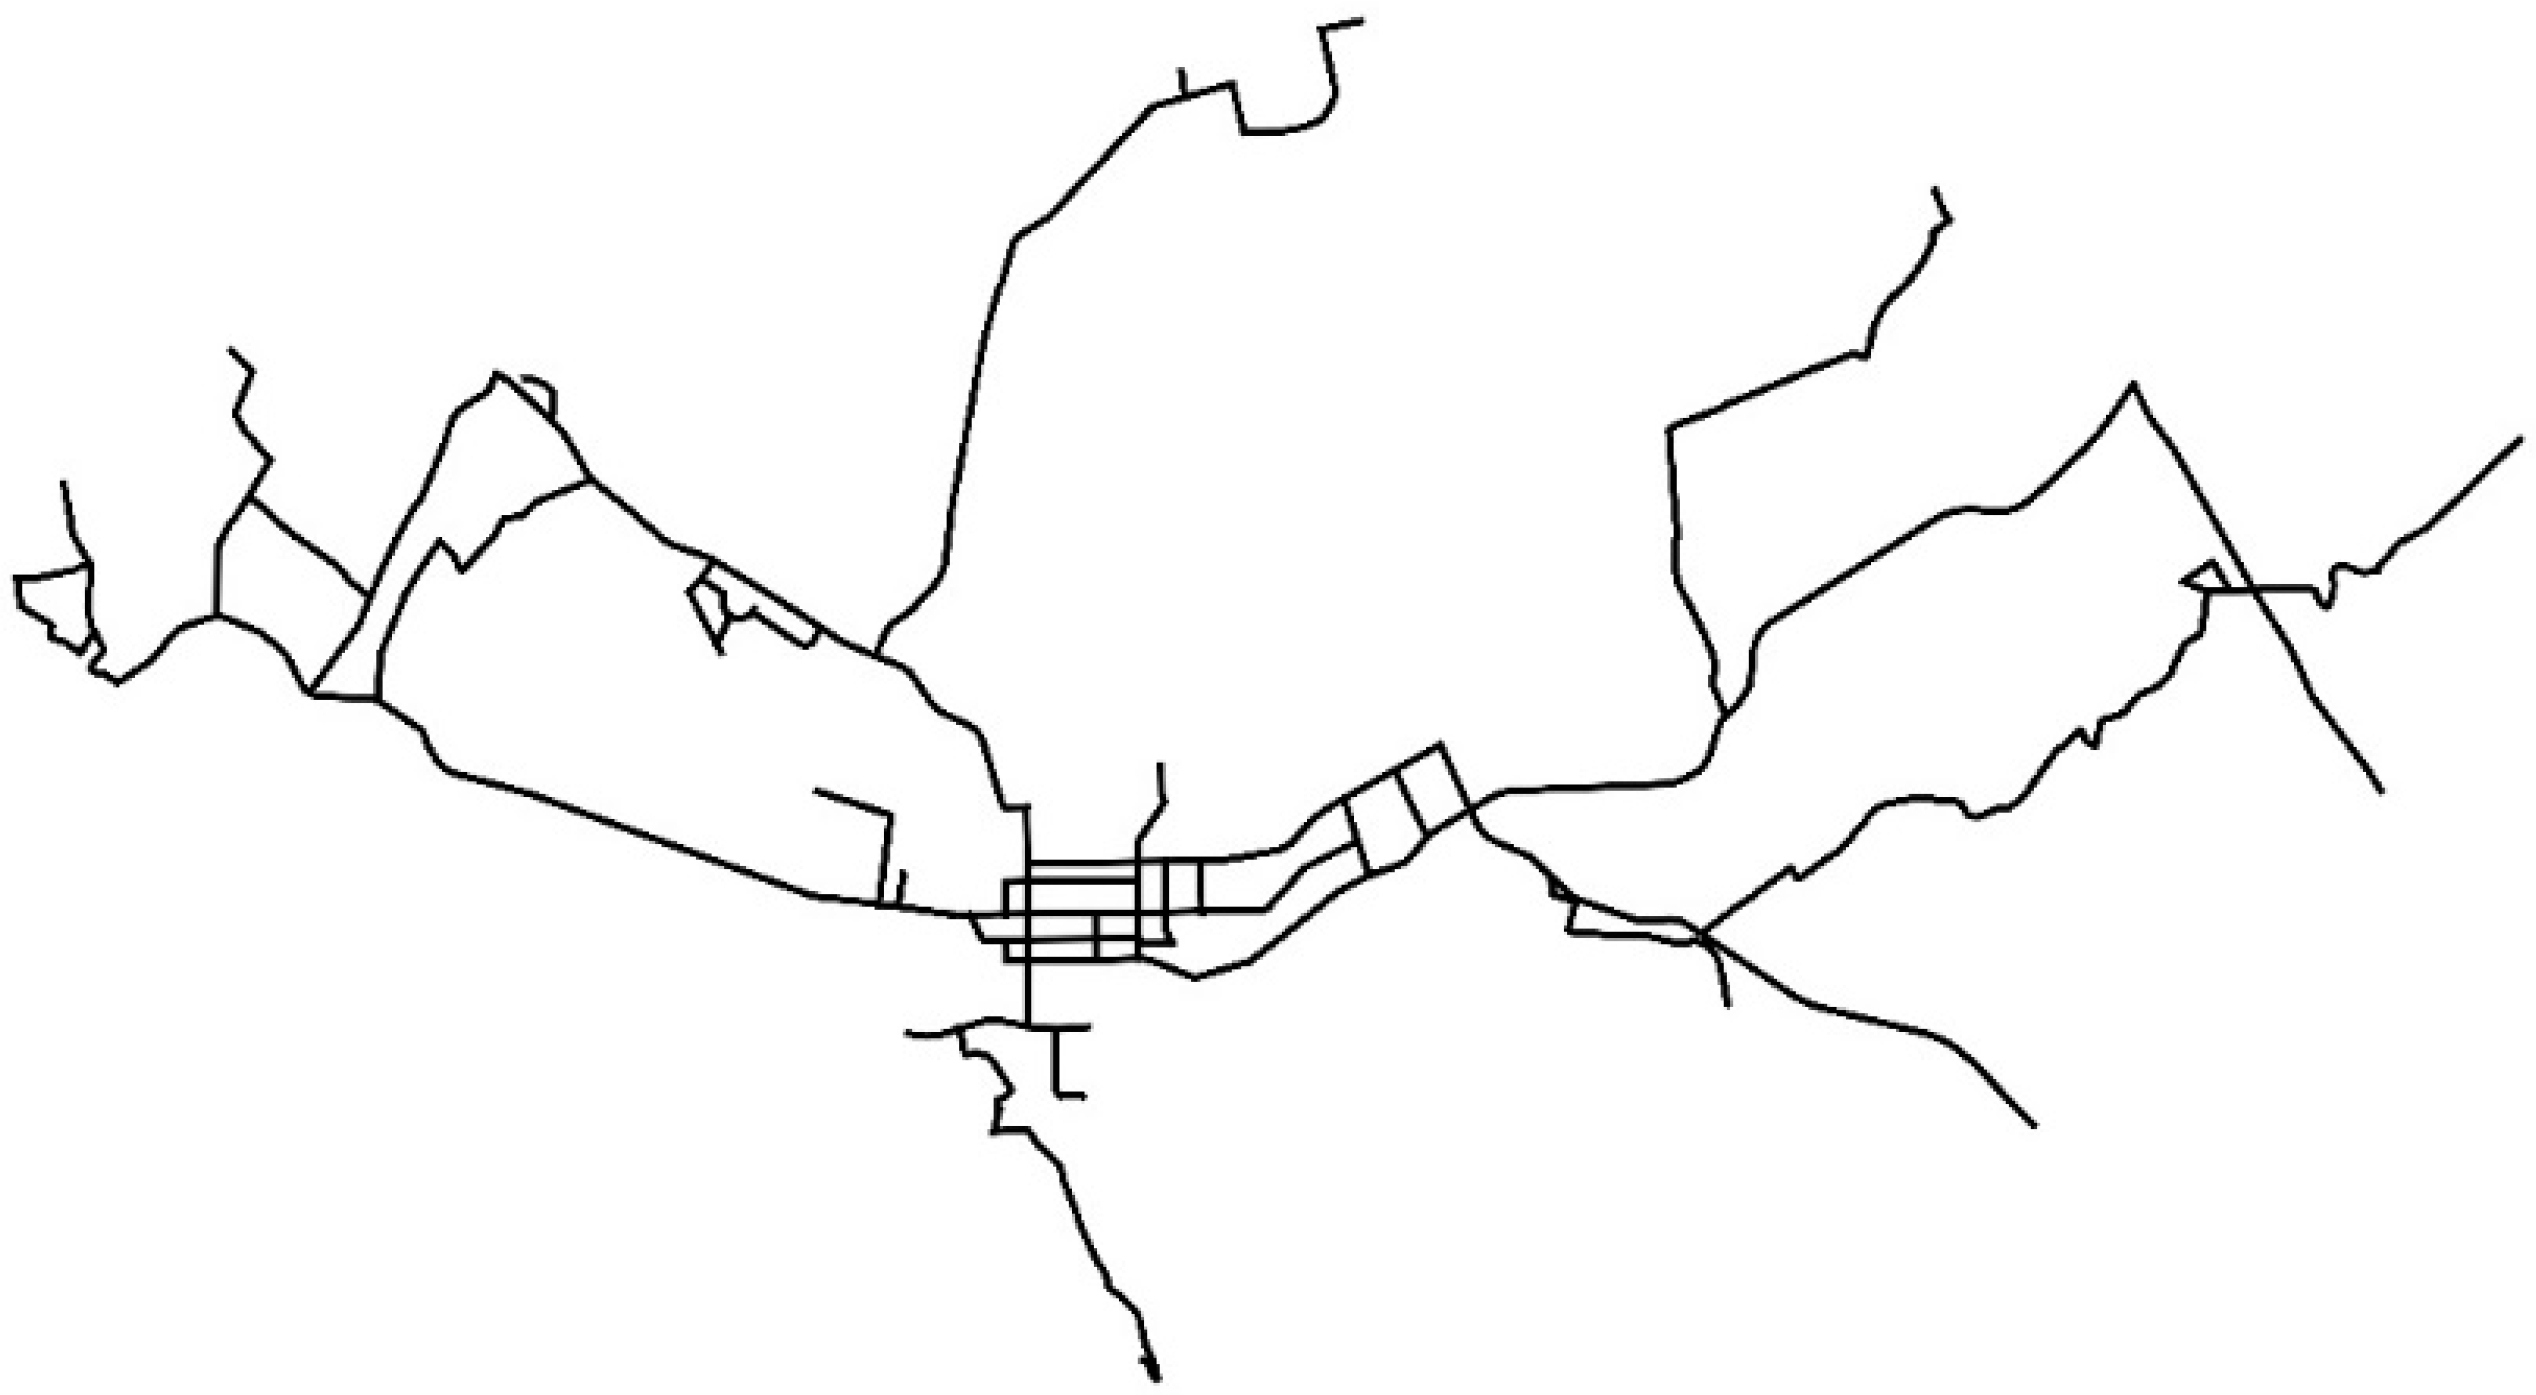
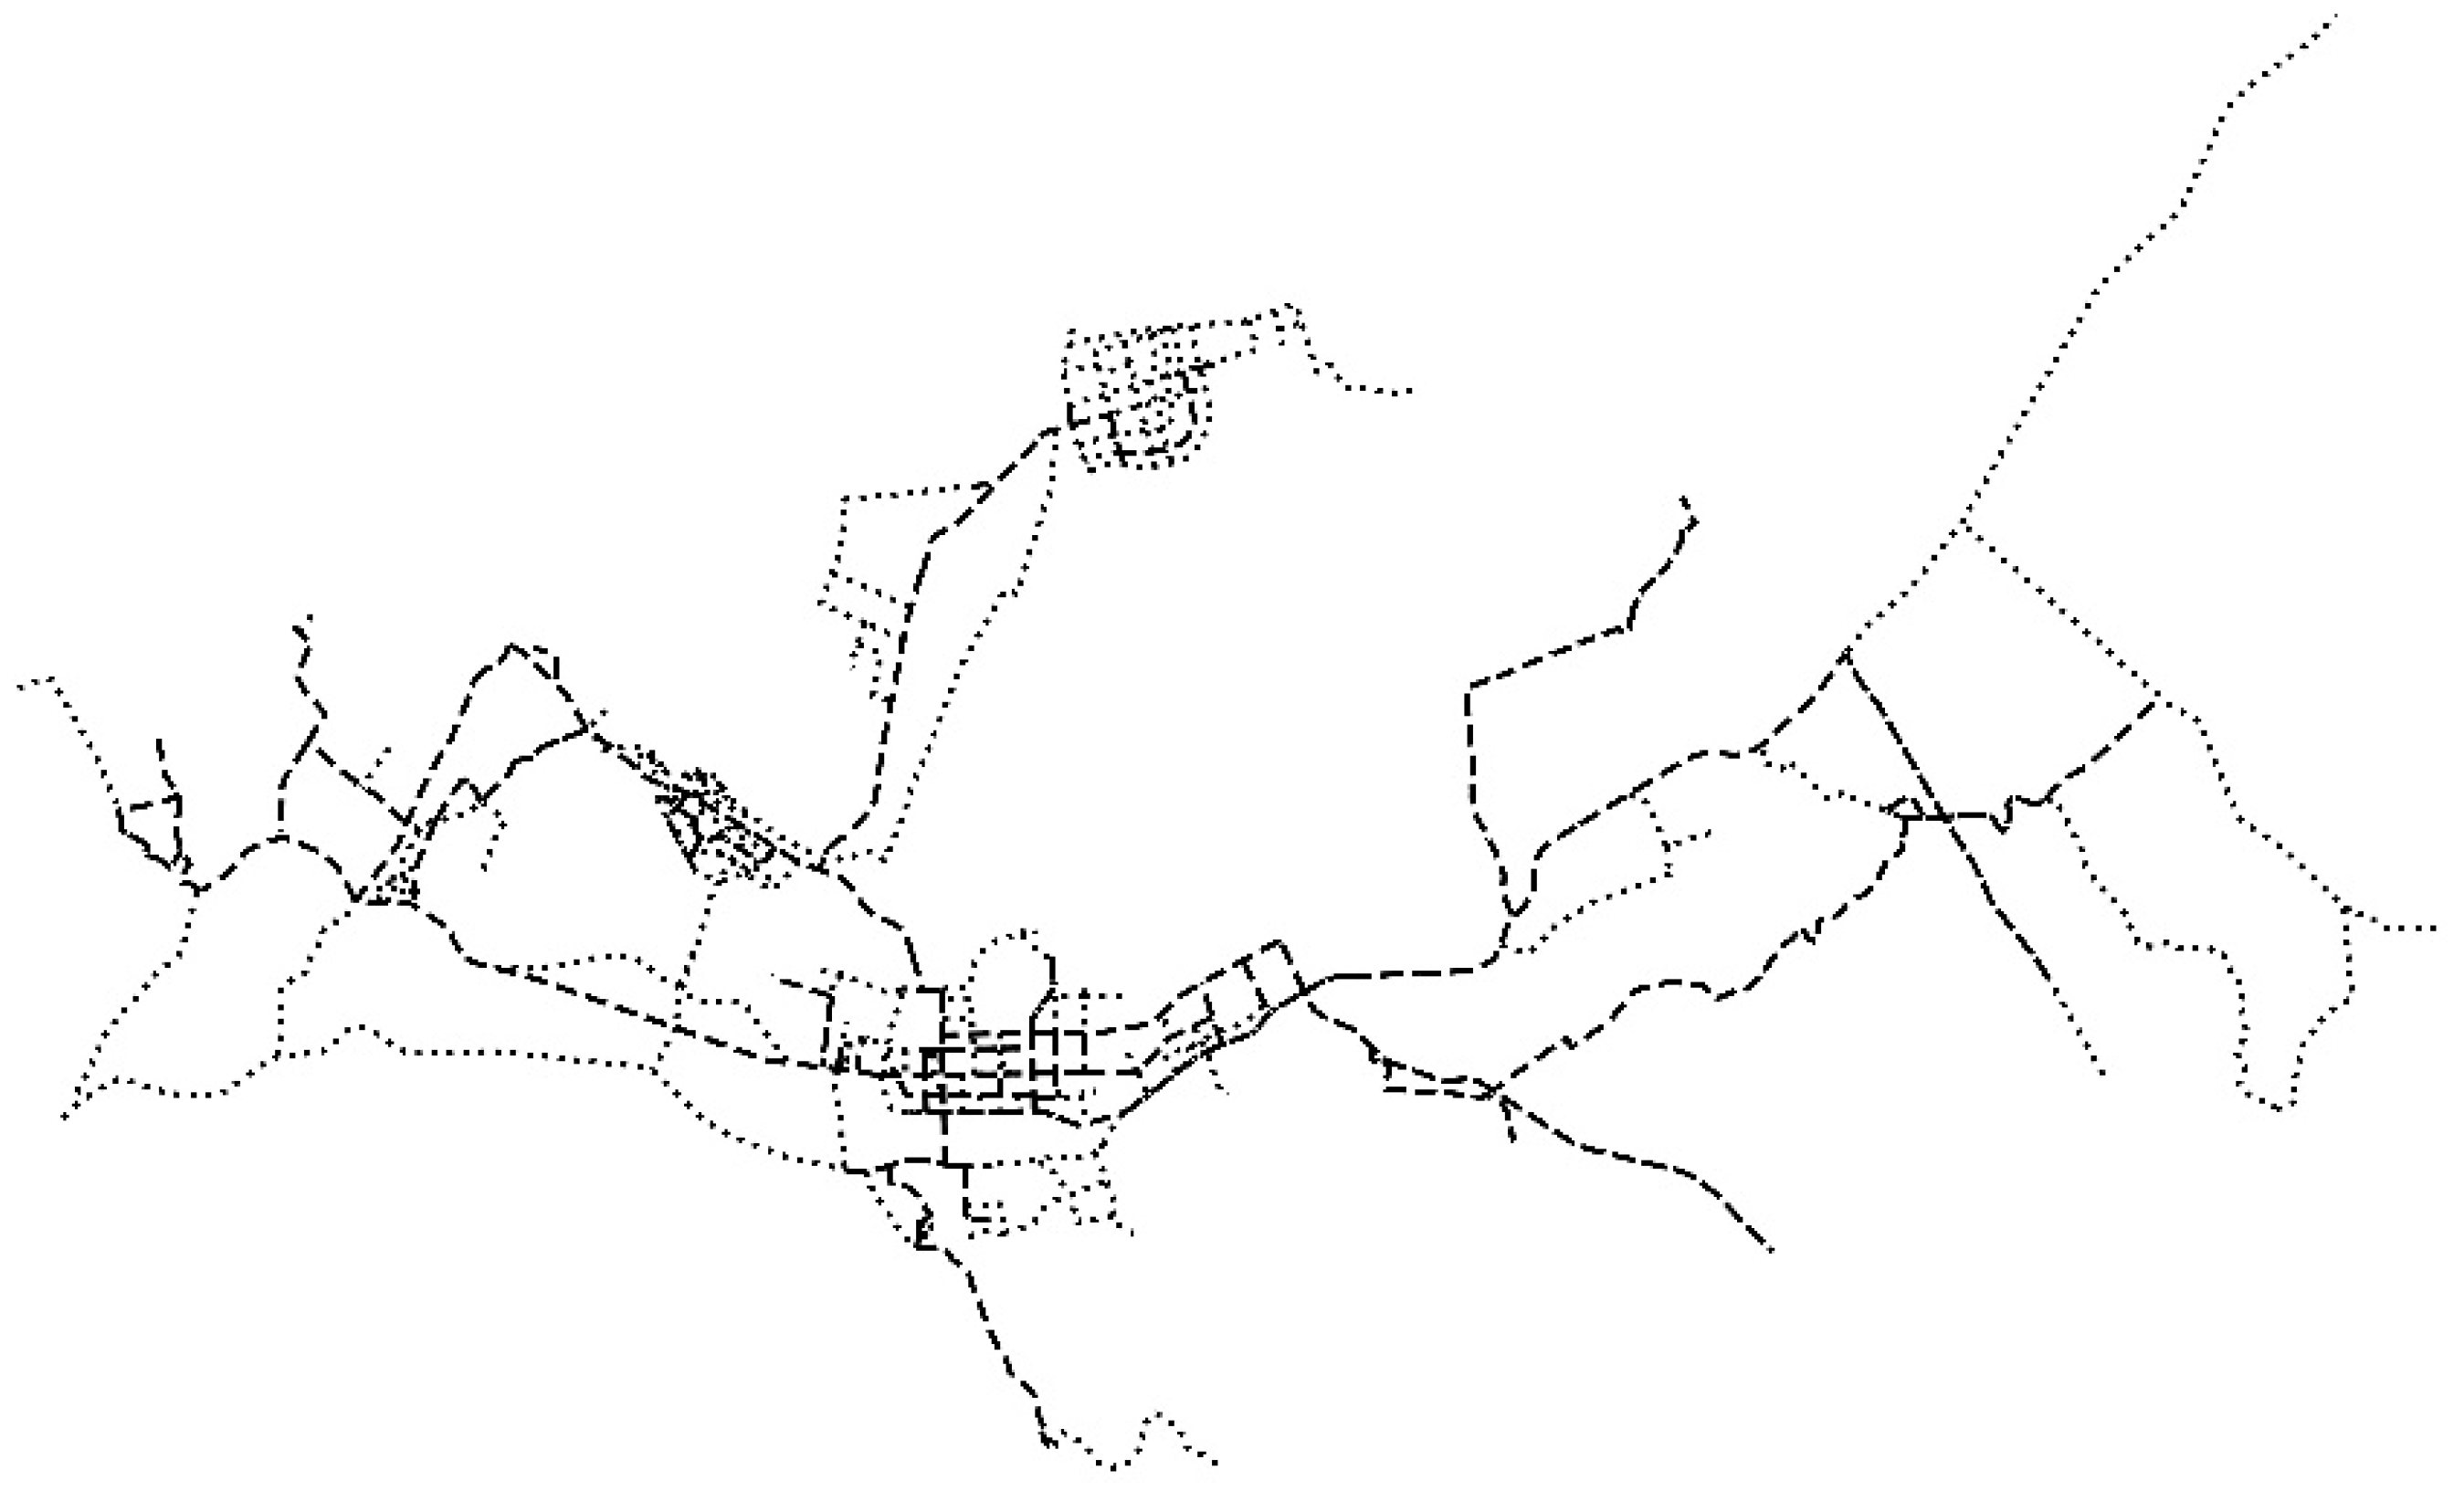
3.1. Data Source and Processing

The data used in this work were selected from the GPS data of Qitaihe bus operation on 27 January 2018, and include a total of 192,464 groups of nonrepetitive longitude and latitude coordinate points.
The JSON file (130.8254e ~ 131.2544e, 45.7442n ~ 45.8661n) of Qitaihe City was exported through Openstreet. The road points (the type was “way”) were filtered out, and the road and non-road points with lower road levels in the categories of community, park, and commercial streets were removed from the data. After matching the longitude and latitude data (the type was “node”), the data were stored in the SQL Server 2008 database in the form of original sequence points.
Additionally, the longitude and latitude data of the public transport network and the intersection in the area covered by the public transport network in Qitaihe City (obtained from Gaode map API) were used to test the spatial storage performance of the model with a total of 1076 groups of longitude and latitude coordinate points.

3.2. Calculation of Public Transport Vehicle Coverage Rate

After projecting the GPS data of the road network over the data of the public transport operations, the specified-size map (for instance, the real size was set to 7680 × 13,056, which is the size of the fifteenth level map of the above area) was converted to a grid map with only zeros and ones based on the coordinate offset. According to the serial number of each road, the map consisted of roads represented by connected lines and was further transformed to represent the transportation network, as shown in Figure 7 and Figure 8.
After the RGB extraction, the generated road and public transport operations image was transformed into the zero–one matrix replacing the raster data matrix, and the sum of all the values was calculated. The ratio of the latter to the former was used to roughly estimate the coverage of public transport vehicles. After calculation, the selected 20 bus lines accounted for 49.65% of the main road network coverage of Qitaihe City. The coverage effect of the 20 bus lines on the same base map is shown in Figure 9, where the dashed lines represent the bus lines. With the help of the map software, the total length of the roads measured by hand associated with the map software was 329.423 km, including 163.324 km of public transport vehicle routes, and the road network coverage was 49.58%. Therefore, the calculation accuracy of the proposed algorithm was about 99.86%.

3.3. Study of Regional Resilient Transport

Resilient transport [5] can be defined as the defense and restoring ability of transport when facing a sudden crisis and long-term unfavorable pressure. Recent research in this area has been mainly focused on theory and policy without considering quantitative and information management. In this work, the center area of Qitaihe City, as shown in Figure 10, was selected to evaluate the application of the raster map when transport faces emergencies from the perspective of accessibility.
This area was converted into a raster map with a size of 208,896 bytes. After transformation, the road points were represented by Othello coordinates, corresponding to the light-colored parts in Figure 11, while the obstacles were represented by zeros, corresponding to the dark parts in Figure 11.
Regional safety resilience, transport capacity, and facility layout affect each other. The importance of nodes in the map and whether they are accessible can be described by an accessibility index, which can be quantified by the product of the distance, intersection number, and road level between nodes and adjacent nodes. The larger the circle is, the better the accessibility and the more important the node will be. The evaluation visualization results are shown in Figure 12.
Suppose that two traffic accidents due to snow and fog occur at time t at nodes A and B in Figure 12; the accessibility evaluation of this area would be as shown in Figure 13. The influence of node accessibility on the system can be seen directly through the change in the circles at the affected nodes and their adjacent nodes.
A rasterized map can represent the road features in a straightforward and visual way. Even if compression is needed to reduce the storage space, a compressed raster map can preserve the relative position of each node. The accessibility evaluation results can provide references for further improvement in regional resilient transport development and planning to ensure the risk prevention, maintenance, and crisis recovery of a transportation system. Such resilient transport development evaluates and analyzes the risk preventive construction of the transportation network layout, hub location, facility construction, and other parts; it controls the risk resistance ability of the system, such as redundancy, network connectivity, and operational reliability, when disasters and other emergency events occur, and it also ensures the ability to conduct support diagnoses for self-repair after damage and the integration of external gathering resources.

3.4. Algorithm Evaluation and Experiments Comparison

In what follows, we contrast our compression algorithm with a non-compressed raster map and with other raster map construction algorithms to demonstrate that our algorithm retains raster resolution and accuracy and to clarify how it stands out in contrast to the advantages and disadvantages of other algorithms.

3.4.1. Contrasting with a Non-Compressed Raster Map

After gathering the original data, a global map was generated, which was a matrix with a size of 43,784 × 24,582, with an exported csv format file size of 4,305,436,484 bytes. After Othello coordinatization, the global map was a 956 × 947 matrix, with an exported csv format file size of 3,690,426 bytes, which was only about 0.086% of the size of the file before processing. The compression process took about 55.2 s, so the optimization efficiency of the storage space was 99.914%. Since the information carried by each raster after the restoration process is consistent with the information carried by the global map, we can be assured that Othello coordinatization does not depreciate the resolution or accuracy of the raster.

3.4.2. Contrasting with Other Raster Map Construction Algorithms

Considering that the operating environment, input requirements, and output effects of different raster map construction algorithms are not the same, we analyzed the main advantages and disadvantages of various algorithms from a qualitative point of view; the results are shown in Table 2.

3.4.3. Summary of the Discussion

Sustainable development is inseparable from efficient transport management. Unlike the abstraction of scale maps, topological maps, and semantic maps, the fineness of the actual road descriptions of the grid map can be controlled by a number of dimensions, and its accuracy is theoretically unlimited. However, the scale of network data increases exponentially with road network complexity, which places considerable pressure on network operation and maintenance, affecting storage space and server computing load. In order to respond to the demands for urban digital management and resilient transportation construction, this paper proposes an intuitive, extensible, and flexible method for constructing urban road maps, a method enabling fast map construction based on GPS data and a compressed grid algorithm. This proposed method can choose to publish the POI data on the network or set up equipment to collect it on its own according to requirements of accuracy or confidentiality. Our Othello-coordinated design compensates for the disadvantages of large raster map storage space and large computing resource requirements during the processing. Through the extraction, processing, compression, layering, splicing, and restoration of the original geographic data information, the rapid construction of maps can be realized. At the same time, various extended applications, such as public transportation service evaluation and emergency traffic control, can be performed on this basis.
The proposed method provides an alternative solution for urban digital management, which is mainly suitable for navigation, route planning, regional visualization, and geographic information labeling under low-accuracy map requirements. It automatically generates maps based on auxiliary data, thereby further improving the flexibility and scalability of related application development and usage and shortening the map updating cycle. The proposed method also has good expansion, splicing, and extraction performances, which is not the case in the traditional road networks, such as directed graphs and adjacency matrices.

4. Conclusions

This paper proposes a fast map construction method, which can save memory resources by extracting, processing, layering, splicing, and restoring the original geographic data. Maps obtained using GPS and our compressed grid algorithm can be flexibly applied to digitize not only the city road network but also specific scenarios that may arise on that network, such as the calculation of bus line coverage and resilient traffic evaluation.
We used data from Qitaihe City, Heilongjiang Province, China, to evaluate the proposed method. Our case study illustrates that the proposed model can compress the global map of the urban road network to different degrees while preserving its topological relationships and can also retain the Othello coordinate information on the source road network to the size of 9/10,000. This means that under the same hardware configuration, the applications based on this algorithm can carry more information or have a longer product life cycle. On the other hand, its requirements for system configuration are relatively low, and the reliability of its operation increases accordingly. Besides, its excellent performance in information preservation, splicing, and quickly updating can greatly enlarge the application scenarios and scopes to address the constantly emerging and changing needs of modern urban traffic management.
Compared to the accurate topological map, the compressed raster map has fewer errors that are commonly generated on a grid where the nodes are divided. The smaller the grid cell is, the smaller the error will be. However, the process of refining the grid increases the storage space and reduces the operational efficiency. Balancing the relationship between these two will be part of our future work. At the same time, optimizing the proposed method and expanding its scope and area of application will also be one of our future research directions.

Author Contributions

All authors contributed to the writing, revision, and approval of the final manuscript. Conceptualization, J.Z. and X.H.; Methodology, X.H. and S.L.; Software, X.H.; Formal analysis, S.L.; Investigation, J.Z.; Resources, P.W.; Data curation, X.H.; Writing—original draft, X.H., S.L. and L.L.; Writing—review and editing, J.Z., X.H. and S.L.; Visualization, P.W.; Supervision, L.L.; Validation, J.Z.; Project administration, S.L.; Funding acquisition, S.L. All authors have read and agreed to the published version of the manuscript.

Funding

The work described in this paper is supported by the Program of National Natural Science Foundation of China (71701146, 72171168), and the first Batch of 2021 MOE of PRC Industry-University Collaborative Education Program (Program No. 202001SX04, Kingfar-CES “Human Factors and Ergonomics” Program).

Data Availability Statement

The data presented in this study are available on request from the corresponding author; because they originated in field research conducted by the research team, the data are not publicly available.

Conflicts of Interest

The authors declare no conflict of interest.

Appendix A

Othello (also known as Reversi) is a two-player board game, usually played on a board with eight rows and eight columns and a set of light and a dark turnable pieces for each side. The player’s goal is to have a majority of their colored pieces showing at the end of the game, turning over as many of their opponent’s pieces as possible. The dark player makes the first move from the starting position, alternating with the light player. Each player has to place a piece on the board such that there exists at least one straight (horizontal, vertical, or diagonal) occupied line of opponent pieces between the new piece and another own piece. After placing the piece, the side turns over (flips, captures) all opponent pieces lying on any straight lines between the new piece and any anchoring own pieces. The game ends when the board is full, both players say pass, or one player surrenders. At that time the pieces on the board are counted, and the player with more pieces wins.
Example: Player A has the dark pieces. There is one dark piece on the board, and next to it are five white pieces in a line. Player A puts a black piece at the end of the line, so now Player A has five white pieces between two black pieces, so those white pieces turn to black.
Writing an Othello program is an appealing and interesting challenge, and this game was the inspiration behind the algorithm in this article. The chessboard is like a grid map, and the dark pieces are like road nodes. It does not matter how many white pieces are between these nodes. As long as a dark piece is placed at the end of the line, the “road” is formed.

References

  1. Bloomberg, M. A stronger, more resilient New York. In City of New York, Chapter 4: Buildings, PlaNYC Report. Available online: https://www1.nyc.gov/assets/sirr/downloads/pdf/Ch4_Buildings_FINAL_singles.pdf (accessed on 13 November 2021).
  2. Koks, E.E.; Rozenberg, J.; Zorn, C.; Tariverdi, M.; Hallegatte, S. A global multi-hazard risk analysis of road and railway infrastructure assets. Nat. Commun. 2019, 10, 2677. [Google Scholar] [CrossRef] [PubMed] [Green Version]
  3. Mahriyar, M.Z.; Rho, J.H. The compact city concept in creating resilient city and transportation system in Surabaya. Proced.-Soc. Behav. Sci. 2014, 135, 41–49. [Google Scholar] [CrossRef] [Green Version]
  4. Amdal, J.R.; Swigart, S.L. Resilient transportation systems in a post-disaster environment: A case study of opportunities realized and missed in the greater new orleans region, 2010. UNOTI Publications. 2010, p. 5. Available online: http://scholarworks.uno.edu/unoti_pubs/5 (accessed on 13 November 2021).
  5. Murray-Tuite, P.M. A comparison of transportation network resilience under simulated system optimum and user equilibrium conditions. In Proceedings of the 2006 Winter Simulation Conference, Monterey, CA, USA, 13 March 2006; pp. 1398–1405. [Google Scholar]
  6. Yang, J.; Su, J.R.; Xia, J.H.; Jin, C.; Li, X.M.; Ge, Q.S. The impact of spatial form of urban architecture on the urban thermal environment: A case study of the Zhongshan District, Dalian, China. IEEE J. Sel. Top. Appl. Earth Obs. Remote Sens. 2018, 11, 2709–2716. [Google Scholar] [CrossRef]
  7. Yang, J.; Jin, S.H.; Xiao, X.M.; Jin, C.; Xia, J.H.; Li, X.M.; Wang, S.J. Local climate zone ventilation and urban land surface temperatures: Towards a performance-based and wind-sensitive planning proposal in megacities. Sustain. Cities Soc. 2019, 47, 101487. [Google Scholar] [CrossRef]
  8. Yang, J.; Wang, Y.; Xiu, C.; Xiao, X.; Jin, C. Optimizing local climate zones to mitigate urban heat island effect in human settlements. J. Clean. Prod. 2020, 275, 123767. [Google Scholar] [CrossRef]
  9. Yang, J.; Zhan, Y.X.; Xiao, X.M.; Xia, J.H.; Sun, W.; Li, X.M. Investigating the diversity of land surface temperature characteristics in different scale cities based on local climate zones. Urban. Clim. 2020, 34, 1–12. [Google Scholar] [CrossRef]
  10. Euler, L. Solutio problematis ad geometriam situs pertinentis. Commentarii academiae scientiarum Petropolitanae 1741, 8, 128–140. [Google Scholar]
  11. Aho, A.V.; Garey, M.R.; Ullman, J.D. The transitive reduction of a directed graph. SIAM J. Comput. 1972, 1, 131–137. [Google Scholar] [CrossRef] [Green Version]
  12. Anez, J.; Barra, T.D.L.; Pérez, B. Dual graph representation of transport networks. Transp. Res. Part B Methodol. 1996, 30, 209–216. [Google Scholar] [CrossRef]
  13. Hu, M.B.; Jiang, R.; Wu, Y.H.; Wang, W.X.; Wu, Q.S. Urban traffic from the perspective of dual graph. Eur. Phys. J. B 2008, 63, 127–133. [Google Scholar] [CrossRef] [Green Version]
  14. Watanabe, D. A study on analyzing the grid road network patterns using relative neighborhood graph. In Proceedings of the Ninth International Symposium on Operations Research and Its Applications (ISORA’10), Chengdu, China, 19–23 August 2010; pp. 112–119. [Google Scholar]
  15. Thill, J. Geographic information systems for transportation in perspective. Transp. Res. Part C-Emerg. Technol. 2000, 8, 3–12. [Google Scholar] [CrossRef]
  16. Miller, H.J.; Wu, Y. GIS software for measuring space-time accessibility in transportation planning and analysis. Geoinformatica 2000, 4, 141–159. [Google Scholar] [CrossRef]
  17. Gutiérrez, J.; Condeço-Melhorado, A.; Martín, J.C. Using accessibility indicators and GIS to assess spatial spillovers of transport infrastructure investment. J. Transport. Geogr. 2010, 18, 141–152. [Google Scholar] [CrossRef]
  18. GSA GNSS Market Report. European GNSS Agency Report. Available online: https://www.gpsworld.com/gsa-releases-2019-gnss-market-report/ (accessed on 23 April 2020).
  19. Axer, S.; Friedrich, B. Level of service estimation based on low-frequency floating car data. Transp. Res. Procedia 2014, 3, 1051–1058. [Google Scholar] [CrossRef] [Green Version]
  20. Xu, X.; Xu, Z.; Zhao, X. Traffic flow visualization using taxi GPS data. In Proceedings of the International Conference on Advanced Data Mining and Applications, Gold Coast, QLD, Australia, 12–15 December 2016; pp. 811–814. [Google Scholar]
  21. Shi, W.; Shen, S.; Liu, Y. Automatic generation of road network map from massive GPS, vehicle trajectories. In Proceedings of the 12th International IEEE Conference on Intelligent Transportation Systems, St. Louis, MO, USA, 3–7 October 2009; pp. 48–53. [Google Scholar]
  22. Qingjie, K.; Wenhuan, S.; Yuncai, L. A GPS-track-based method for automatically generating road-network vector map. J. Univ. Sci. Technol. China 2012, 42, 623–627, 647. [Google Scholar]
  23. Wang, F.; Xiang, Y.; You, H. SAR Image rectification based on vector map. IGARSS 2019. In Proceedings of the 2019 IEEE International Geoscience and Remote Sensing Symposium, Yokohama, Japan, 28 July–2 August 2019; pp. 8594–8597. [Google Scholar]
  24. Konrad, M.; Szczot, M.; Schüle, F. Generic grid mapping for road course estimation. In Proceedings of the 2011 IEEE Intelligent Vehicles Symposium (IV), Baden-Baden, Germany, 5–9 June 2011; pp. 851–856. [Google Scholar]
  25. Freitas, T.R.M.; Coelho, A.; Rossetti, R.J.F. Improving digital maps through GPS data processing. In Proceedings of the 12th International IEEE Conference on Intelligent Transportation Systems, St. Louis, MO, USA, 3–7 October 2009; pp. 480–485. [Google Scholar]
  26. Bierlaire, M.; Chen, J.; Newman, J. A probabilistic map matching method for smartphone GPS data. Transp. Res. Part C-Emerg. Technol. 2013, 26, 78–98. [Google Scholar] [CrossRef]
  27. Li, Y.; Huang, Q.; Kerber, M.; Zhang, L.; Guibas, L. Large-scale joint map matching of GPS traces. In Proceedings of the 21st ACM SIGSPATIAL International Conference on Advances in Geographic Information Systems, Orlando, FL, USA, 5–8 November 2013; pp. 214–223. [Google Scholar]
  28. Rahman, M.M.; Mou, J.R.; Tara, K.; Sarkar, M.L. Real time Google map and Arduino based vehicle tracking system. In Proceedings of the 2016 2nd International Conference on Electrical, Computer & Telecommunication Engineering (ICECTE), Rajshahi, Bangladesh, 8–10 December 2016; pp. 1–4. [Google Scholar]
  29. Xu, H.; Ma, X.P. Geographic information system design and implementation based on Web Mercator Projection. Comput. Program. Ski. Maint. 2011, 8, 41–43, 51. [Google Scholar]
Figure 1. Flowchart of the main algorithm of the proposed method for fast map construction based on the GPS data and the compressed grid algorithm.
Land 10 01322 g001
Figure 2. Flowchart of the grid map generation and conversion algorithm.
Land 10 01322 g002
Figure 3. Schematic diagram of road (before compression).
Land 10 01322 g003
Figure 4. Schematic diagram of road (after compression).
Land 10 01322 g004
Figure 5. Schematic diagram of coordinate design.
Land 10 01322 g005
Figure 6. Schematic diagram of map compression.
Land 10 01322 g006
Figure 7. Schematic diagram of Qitaihe road network.
Land 10 01322 g007
Figure 8. Schematic diagram of Qitaihe public transportation vehicle operation network.
Land 10 01322 g008
Figure 9. Schematic diagram of coverage of part of the Qitaihe bus network.
Land 10 01322 g009
Figure 10. Schematic diagram of the selected area.
Land 10 01322 g010
Figure 11. Results of compressed rasterization.
Land 10 01322 g011
Figure 12. Evaluation results of the accessibility of each node.
Land 10 01322 g012
Figure 13. Evaluation results of the accessibility of each node at time t.
Land 10 01322 g013
Table 1. Definition interpretation.
DefinitionInterpretation
Flow pointthe road point between nodes, the value is zero
Nodethe coordinate of bus stop and intersection in the bus network, the value is zero
Accessthis point is accessible to another node in this direction
Obstaclea generic term for inaccessible areas, the value is one
Compressionthe smallest rectangular area map containing the road network within the required range
Splicinga map is spliced in two maps according to specifications
Restorationthe compressed map is restored to the raster map represented by zero and one
Base mapa local map as a datum reference
Table 2. Comparison of different raster map construction algorithms.
Method.Main AdvantagesMain Disadvantages
Based on professional software such as ArcGIS, MapGISPowerful, comprehensive, transferable, flexible, and efficient operationProfessional training is required, the cost of software procurement and configuration is high, the operating environment is required, and the self-expansion is insufficient
Road network extraction method based on remote sensing imageThe highest precisionSlow update and high cost of acquisition; the directionality, one-way and two-way characteristics, and topological structures of roads cannot be taken into account
Road extraction method based on GPS trajectory clusteringEasy to extract road shape and identify intersectionNot suitable for multi-noise situations; requires high-accuracy data and needs data distribution near the road center
Generation of raster map by GPS coordinate transformationSimple method, short period (almost real time)Batch conversion, large amount of data, difficult local update
Dynamic addition of road Vector Edge based on GPS trajectoryDynamic, high accuracyDifficult to identify overlapped sections and intersections, needs the base map
Proposed methodNo base map needed
Dynamic and updated locally
The smallest storage occupation under the same specification
Suitable for low-accuracy application scenarios
Publisher’s Note: MDPI stays neutral with regard to jurisdictional claims in published maps and institutional affiliations.

