Article

The Impact of Mosaic Land Use and Land Cover on the Quality of River Waters (Case Study: Lubelskie Province, E Poland)

by
Dorota Dymek
1,
Wojciech Zgłobicki
2,* and
Bogusława Baran-Zgłobicka
1
1
Institute of Socio-Economic Geography and Spatial Management, Maria Curie-Skłodowska University, Kraśnicka Av. 2d, 20-718 Lublin, Poland
2
Institute of Earth and Environmental Sciences, Maria Curie-Skłodowska University, Kraśnicka Av. 2d, 20-718 Lublin, Poland
*
Author to whom correspondence should be addressed.
Land 2021, 10(12), 1318; https://doi.org/10.3390/land10121318
Submission received: 6 November 2021 / Revised: 25 November 2021 / Accepted: 29 November 2021 / Published: 30 November 2021
(This article belongs to the Special Issue Water Resources and Land Use Planning)

Abstract

:
Human activity with respect to land use and land cover can impact the quality of river water. Understanding the correlation between these two factors makes it possible to improve the management of space and mitigate negative human impacts on the environment. The present study encompassed 34 catchments in Lubelskie Province, a typically agricultural region in eastern Poland. Six main types of land use and land cover (LULC) and 15 indices of water quality have been analysed. An unequivocally negative impact of LULC on the river water parameters has not been found. For some indices, no correlations occur, while for others the statistical correlations are weak. One possible reason is the impact of other factors or the unique land use mosaic of the province having a significant impact on the circulation of pollutants in the landscape. It may be that the absence of clear correlations is the result of the relatively low anthropogenic pressure in the region.

1. Introduction

Changes in the natural environment are determined, with varying degrees of intensity, by the diverse human use of space. Each form of human activity has a specific impact on the quality of the environment. The most significant effects are related to the development of industry and the human settlement network. However, agricultural land use has a specific impact on the environment too. On the other hand, the intensity of impacts is determined by the resilience manifested in semi-natural areas, among other factors. Understanding the determinants of the impacts of diverse land use is a key element of environmental management [1,2,3].
The quality of surface water varies in space and time, and human impacts can improve or worsen negative changes [4,5,6]. Land cover and land use influence the individual environmental components, including their chemical properties. In the case of river water, this impact is multi-faceted and applies to the volume of flux as well as the physical and chemical properties of water [7,8,9,10,11]. The influence of particular types of land use—woodland, agriculture, the built environment and industrial areas—on non-point source pollution of river water is varied and depends largely on their mutual proportions within a catchment [12,13]. What is highlighted is the particular role of urbanisation and suburbanisation processes leading to the expansion of the built environment [14,15]. In general, the greater the proportion of anthropogenic areas associated with human settlement and economic activity, the higher the level of river water contamination [16,17].
At present, considerable land cover changes can be observed in Europe, which can influence changes in the quality of river water in the future [18,19,20]. A distinctive feature of these changes is the increased area of forests at the expense of areas used for agriculture as a result of land abandonment processes [21,22,23,24].
The study objective was to determine the impact of land use and land cover in a first-order catchment on the selected parameters of river water within a large area. While research on this scale is rarely conducted, it enables the development of a water resources management strategy at the province level; such a strategy can be based on controlling the type of land cover, for example. Furthermore, eastern Poland is a unique region in the European context because of the preserved mosaic of land use and land cover which is not encountered elsewhere [25,26].

2. Study Area

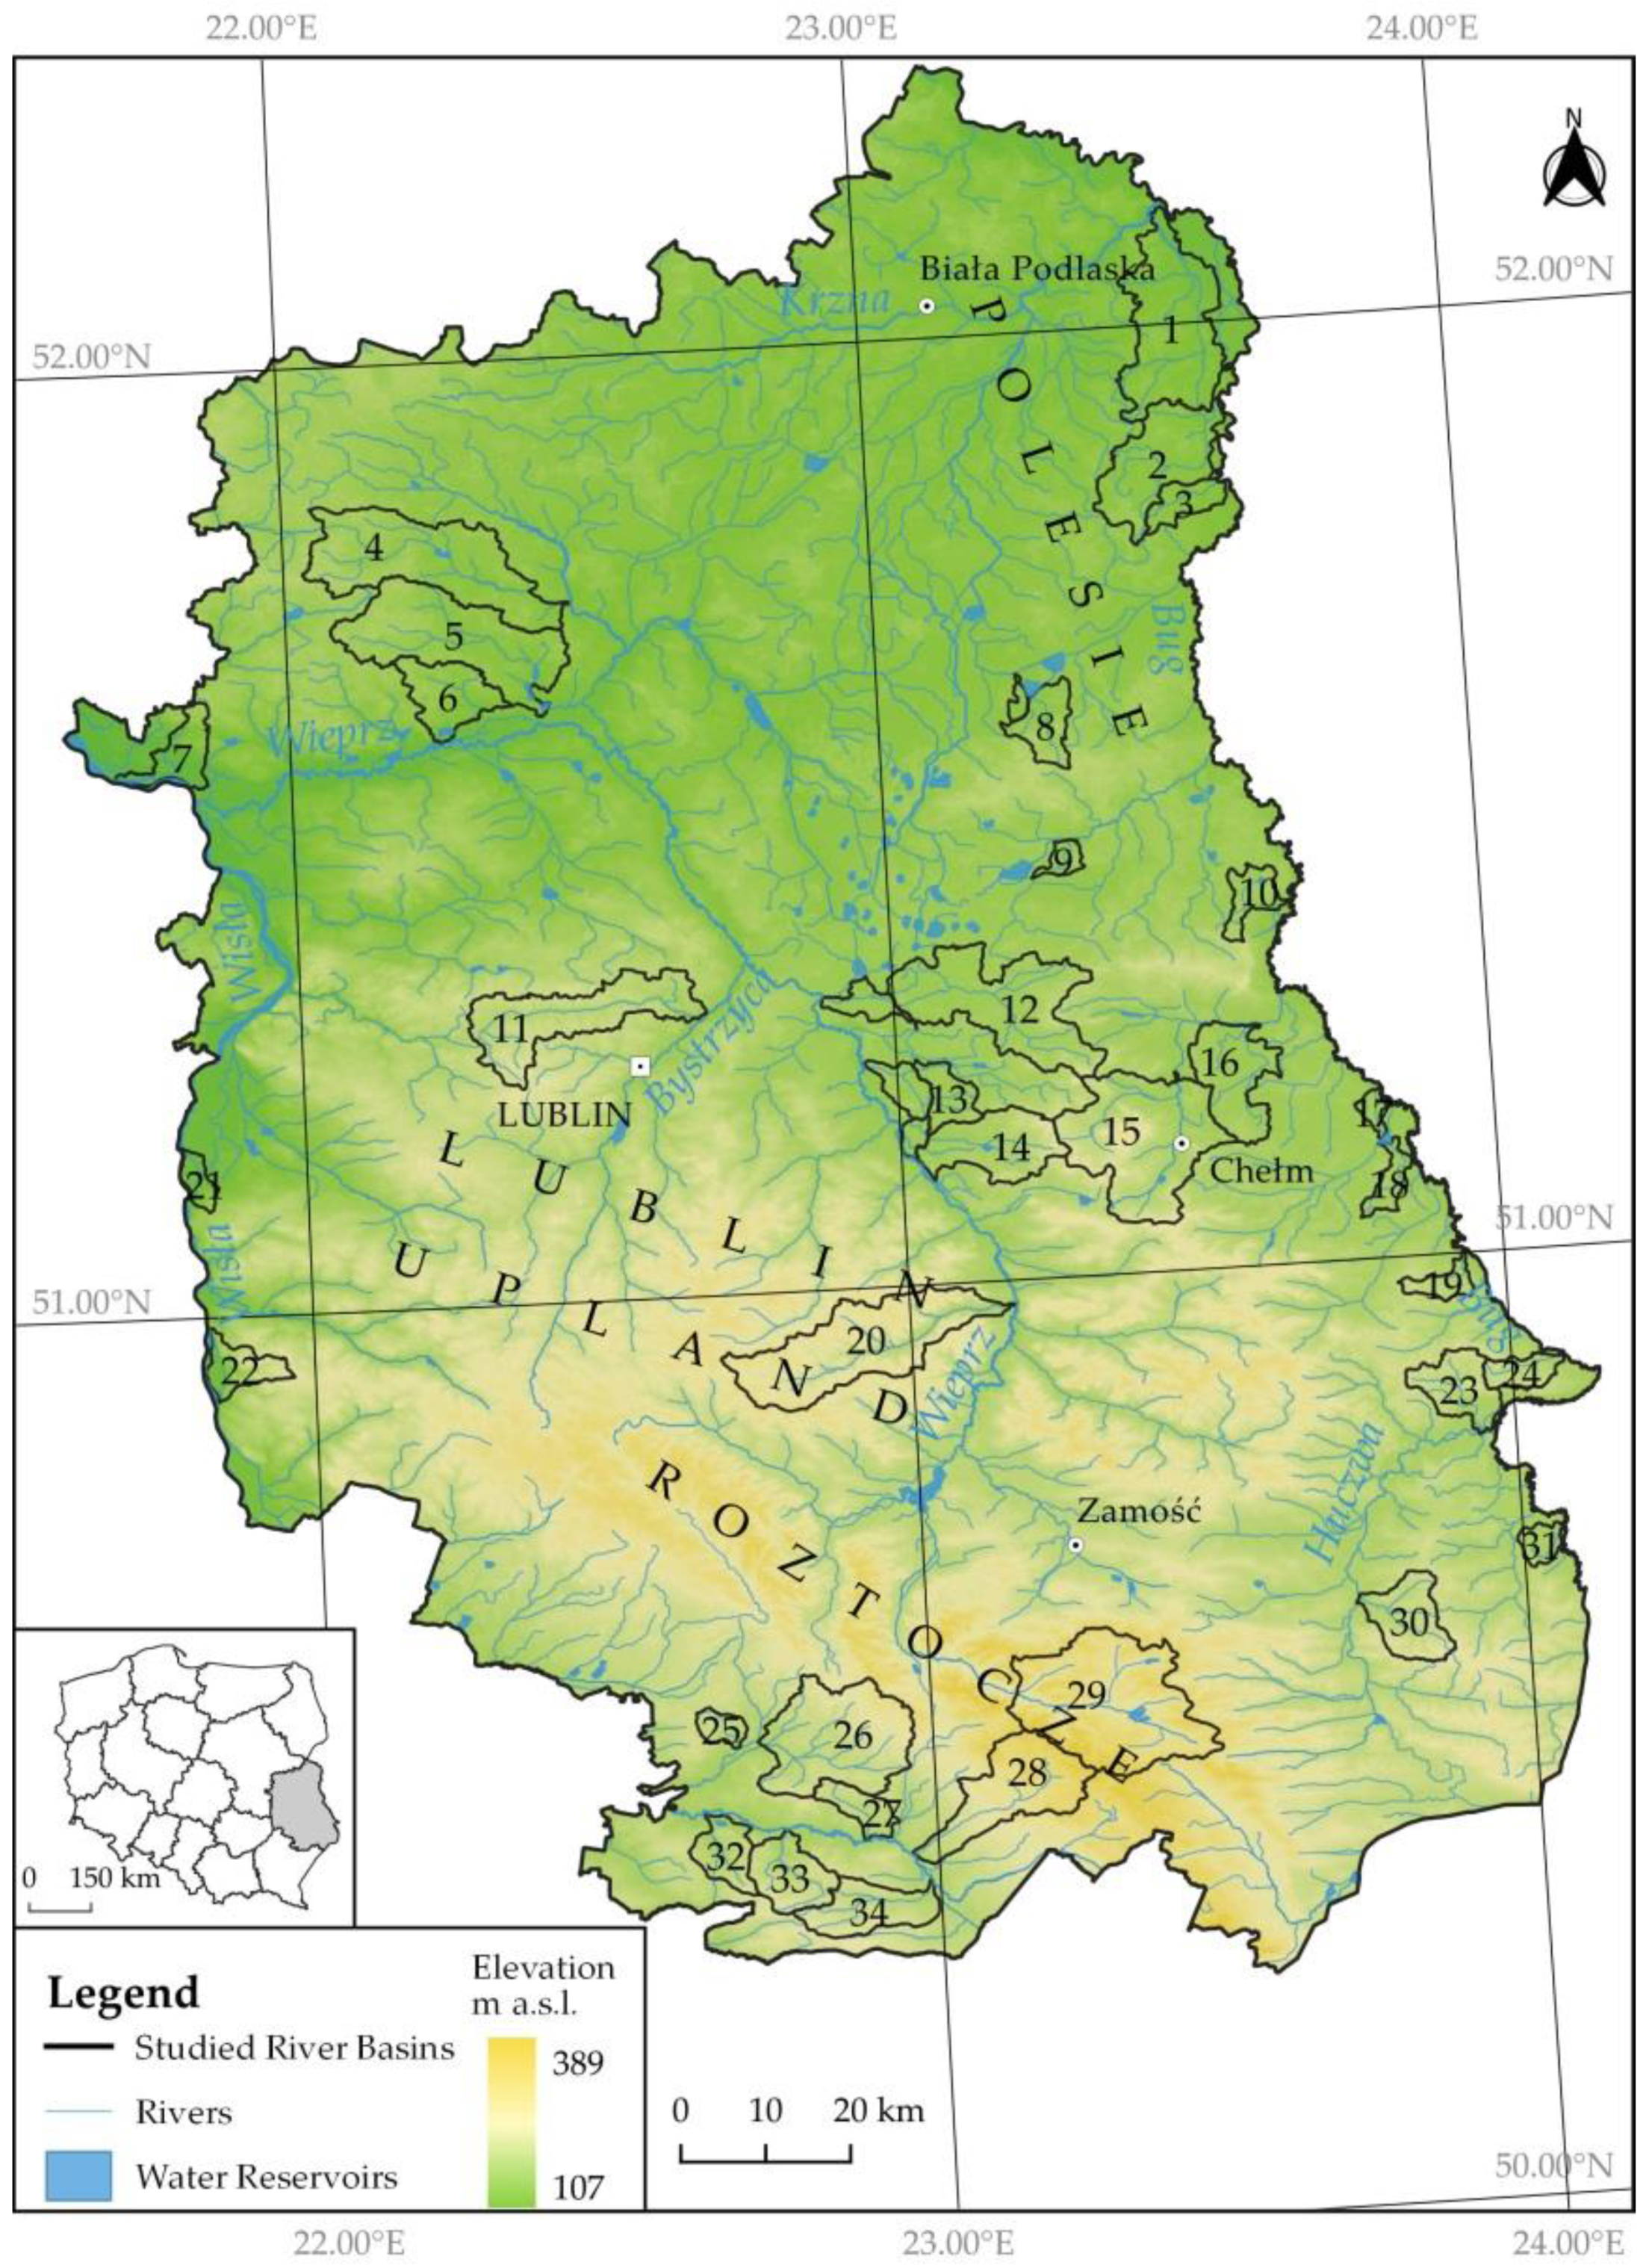
Lubelskie Province is located in eastern Poland (Figure 1). It covers 25,123 km2, which accounts for 8% of Poland’s territory. It is inhabited by 2.1 million people. The size of the population successively decreases as the depopulation processes and their consequences are increasingly visible, particularly in rural areas. The negative migration balance (general balance: −6495 people, including −5383 people of working age) is a very serious problem. A high negative natural increase rate occurs (−1.77‰; the national rate for Poland being −0.99‰). The population density, 84 people/km2, is distinctly lower than the national average [27]. About 46% of the inhabitants live in towns and cities (which total 48). Lubelskie Province is among the least developed regions not only in Poland but also in the entire EU. Its peripheral location is not conducive to economic development. This is directly manifested in the unemployment rate of 7.5% (compared to Poland’s national rate of 5.2%), which exceeds 15% in counties in the eastern part of the region. The value of gross domestic product per capita in Lubelskie Province is 32.2% lower than the national average, whereas the gross value added per one employed person in Lubelskie Province is 28.7% lower than the national average. The number of entities of national economy per 10,000 inhabitants (879) is lower than the national number (1175). The region’s economic development is also hampered by relatively poor transport accessibility, as evidenced by indices that are below Poland’s national average: public roads with hard paving, 91 km per 100 km2 (Poland: 98.2 km per 100 km2), among which national roads account for 4.6%, provincial roads for 10.2%, county roads for 40.7%, and district roads for 44.5%. The situation is even worse in the case of railway lines (3.9 versus the national average of 6.2 km per 100 km2) [28].
The land use structure is dominated by agricultural land that accounts for 70.5% of the province’s total area (60% is the national average). Forests and woodlots occupy 23.7% of the province’s territory, compared to the national average of 30.5%. The proportion of built-up and urbanised land (3.9%) is also lower than the average for all of Poland (5.5%). There is little underwater land (0.8% versus 2.1% for Poland) and wasteland (0.9% versus 1.5% for Poland). Capital expenditure on fixed assets for environmental protection amount to PLN 323 per inhabitant, which is the same as the national expenditure. Expenditure on water management is lower in Lubelskie Province (PLN 58) than in Poland as a whole (PLN 84). The share of capital expenditure on environmental protection in the total capital expenditure of the province is 5.3% [28].
The diverse natural environmental conditions and the not very intensive economic use have enabled the fragmentary preservation of valuable natural assets. All legal forms of nature conservation occur in the Lublin region. Areas under legal protection account for a total of 22.69% (excluding Natura 2000 areas), national parks account for 0.72%, nature reserves for 0.47%, landscape parks for 9.56%, areas of protected landscape for 12.03%, while documentation sites, ecological lands, nature and landscape complexes account for 0.32% of the area of the province. Natura 2000 areas comprise the following: special bird protection areas (SPA) account for 13.4%, while special habitat protection areas (SAC) account for 6.6% [27].
In national-level strategic documents, Lubelskie Province is recognized as an agricultural region and its development is programmed accordingly. Thanks to the occurrence of fertile soils (Luvisols, Cambisols), the province is a major centre of agricultural production in Poland. Lubelskie Province ranks second in Poland in cereal production (11.3%), second in rape and agrimony production (12.6%), third in sugar beet production (14.5%), and second in the production of fruits from trees (15.3%). Livestock breeding is of much lower significance as the province ranks seventh in Poland in cow milk production (5.7%) and ninth in slaughter livestock (4.3%). The fragmentation of agriculture is characteristic for most of the study area. Small family-owned farms are inefficient and incapable of commercial production. The average size of an agricultural holding is 9.05 ha (including 7.94 ha of farmland), while among the private (individually-owned) farms alone, it is 8.76 ha (including 7.68 ha of farmland) [27].
Lubelskie has never been an industrial region. The political and economic changes in the late 1980s/early 1990s and the economic crisis led to the collapse of production and closing down or restructuring of many industrial plants. Small- and medium-sized towns were particularly affected by these problems. The collapse of the agri-food industry, including fruit and vegetable processing, led to changes in the structure of agricultural land and crops. The monitoring of rural area development in Poland [29] shows that the indices in the individual components of socio-economic development—spatial, economic, social and those determining the quality of life—are low in Lubelskie Province in comparison with regions in western Poland in particular. Only in the case of districts in the vicinity of large cities (mainly Lublin), the level of development is higher.
The province has a varied natural environment. The northern part is a lowland composed of glacial sediments (sand, till and silt). Loess and limestone uplands occur in the central and SE part. The south-western part of the province is occupied by an old glacial plain (sub-Carpathian basins). The annual precipitation is about 550 mm, the mean annual air temperatures range from 7.0 to 7.6 °C, and the mean specific runoff rate is about 4.0 l/s·km2 [30].
Lubelskie Province lies in the basin of the Vistula river and is regarded as an area with small resources of surface water. The main rivers are: Wisła (Vistula), Bug, Wieprz, Krzna, Bystrzyca, and Huczwa. The river network is particularly sparse in the south-western part of the Lublin Upland and in Roztocze. The region’s water consumption needs are met by groundwater. Water consumption for the needs of the national economy and the population amounts to 130.8 m3 per resident per year [27]. The total water consumption for industrial needs is 99,195 dam3, of which 18,827 dam3 comes from underground water and 74,210 dam3 from surface water. The following pollution loads in wastewater are discharged to the water or the soil: BOD5 79,729 kg/year, COD 932,541 kg/year, total suspended sediment 241,024 kg/year, sum of chloride and sulphate ions 10,164,442 kg/year, total nitrogen 1,905,580 kg/year, total phosphorus 4477 kg/year. Total discharged wastewater amounts to 86,170 dam3, including 5171 dam3 of wastewater discharged to the sewage network and 80,999 dam3 of wastewater discharged directly to the water or soil. Total treated wastewater amounts to 23,764 dam3, 62,080 dam3 are cooling waters (not requiring treatment), while untreated wastewater amounts to 326 dam3 [27].
Lubelskie Province has extremely varied conditions respecting the occurrence and circulation of groundwater. For most of the province’s territory—Lublin Upland, Roztocze, and southern Polesie (Figure 1)—the main aquifer is in Cretaceous rocks and, locally, in Tertiary and Quaternary formations [30]. Water in Upper Cretaceous carbonate rocks has the greatest use value. Some of it is highly mineralised. The groundwater resources are large despite their intensive economic exploitation. The region is rich in water springs (about 1600 inventoried springs, among which 1280 function continuously), most of which occur in its upland parts. The river valleys in the Lublin Upland and Roztocze dissect the main aquifer, and springs flow from the bases of the valley slopes. Highly efficient springs fed by infiltration water from the plateau tops also occur in the valley floors. The flow from the largest spring, in Zaporze, is 300 l/s. Springs play a significant role in river runoff and account for 19% of the runoff in the Vistula and Bug interfluvial zone, and for 38% in the western part of the Lublin Upland and Roztocze. The role of springs is particularly important during periods without rain, when springs supply more than 50% of the water and, in the case of very small catchments, nearly 100%. Lakes occur in the north-western part of the province—in the Łęczna-Włodawa Lake District. They are small (a few hectares), shallow, mesotrophic, and eutrophic [30].
At present, the quality of surface water is considerably influenced by the following: excessive water uptake, discharges of urban and industrial wastewater, area source pollution (mainly from agricultural areas), and pollution related to the development of tourism and recreation [31]. On the other hand, recent years have seen a decreasing trend in pollution introduced to water or soil. Biogenic substance content in treated wastewater decreases systematically. The predominant area source pollutants in Lubelskie Province are those generated by agricultural production [28,30].
The sewage system in the province is poorly developed, particularly in rural areas where a considerable part of the population uses septic tanks that do not always meet the applicable technical requirements. In general, wastewater treatment plants are used by 58.1% of the province’s inhabitants (94% in towns and cities, 27% in rural areas, according to [28]). The difficulties with connecting to the collective sewage system result from the dispersed nature of settlements in rural areas, which hinders the complete provision of technical infrastructure (this also applies to water supply and mains gas). Another significant factor is the demographic situation in these areas: the outflow of young people and a high proportion of elderly people; social exclusion and poverty are not conducive to improving the quality of life. Lubelskie Province is a region in which there are serious deficiencies in household sanitary facilities, which, in extreme cases, leads to a peculiar paradox: the lack of access to running water from the mains means lower water consumption in a household, which means a smaller discharge of pollutants to the environment. Owing to high prices, particularly for collecting sewage, and low incomes, households connected to the water supply and sewage system are forced to be frugal. The number of pollutants discharged to the environment has definitely decreased due to the decreasing livestock population, also.

3. Materials and Methods

Data collected by the Chief Inspectorate of Environmental Protection as part of the national monitoring of surface water in Poland were used in the study. The forms and manner of conducting monitoring of surface water bodies is regulated by the 9 October 2019 Ordinance of the Minister of Maritime Economy and Inland Navigation [32], and includes:
(1) The kinds of sampling points and criteria for their designation;
(2) The scope and frequency of assaying the individual aspects of the classification of ecological states and chemical conditions;
(3) The scope of assaying the individual aspects of the classification of ecological potential and chemical conditions;
(4) The reference methodology and conditions for ensuring the quality of measurements and assays;
(5) The number of sampling points, the criteria for their designation, and the scope and frequency of testing for substances particularly harmful to the water environment.
Approximately 34 catchments (surface water bodies) located in Lubelskie Province were encompassed by the study (E Poland) (Figure 1). Overall, water quality monitoring covers 95 catchments. However, for most of them, only the most basic parameters are determined. Additionally, only first-order catchments were studied in order to obtain clear correlations between water quality indices and a clearly defined area of water supply. This method of catchment selection eliminates the influence of point sources of pollution located at greater distances from the sampling locations.
At the same time, the compared catchments have less diverse areas. Fifteen indices describing the state of water were considered: (i) biological parameters (2); (ii) physicochemical parameters: physical condition (2), oxygen conditions (5), salinity (3), acidity (1), and biogenic conditions (2). The methods of sampling and sample analysis are presented in Table 1. Only indices that are available for a larger number of catchments were investigated. This allows us to recognize the relationships as representative.
The present study has used water quality data for 2018 from the Report prepared by the General Directorate for Environmental Protection “Assessment of the condition of water bodies of rivers and dam reservoirs in 2014–2019 based on monitoring” [33]. The data presents averaged water quality results based on assays of samples collected six times a year at locations at the mouth of the selected river catchments.
Data related to land cover were obtained from the Topographic Objects Database (BDOT10k) [34]. Six types of land cover and land use were distinguished: anthropogenic areas; orchards and plantations; arable land; meadows and pastures (grassland); water and wetland areas; and forests and woodlots. We also calculated the indicator showing the diversity of terrain functions (land use and land cover) proposed by Śleszyński (2013) [35]. The share of specific LULC forms within catchments has been calculated using GIS software (ArcGIS).
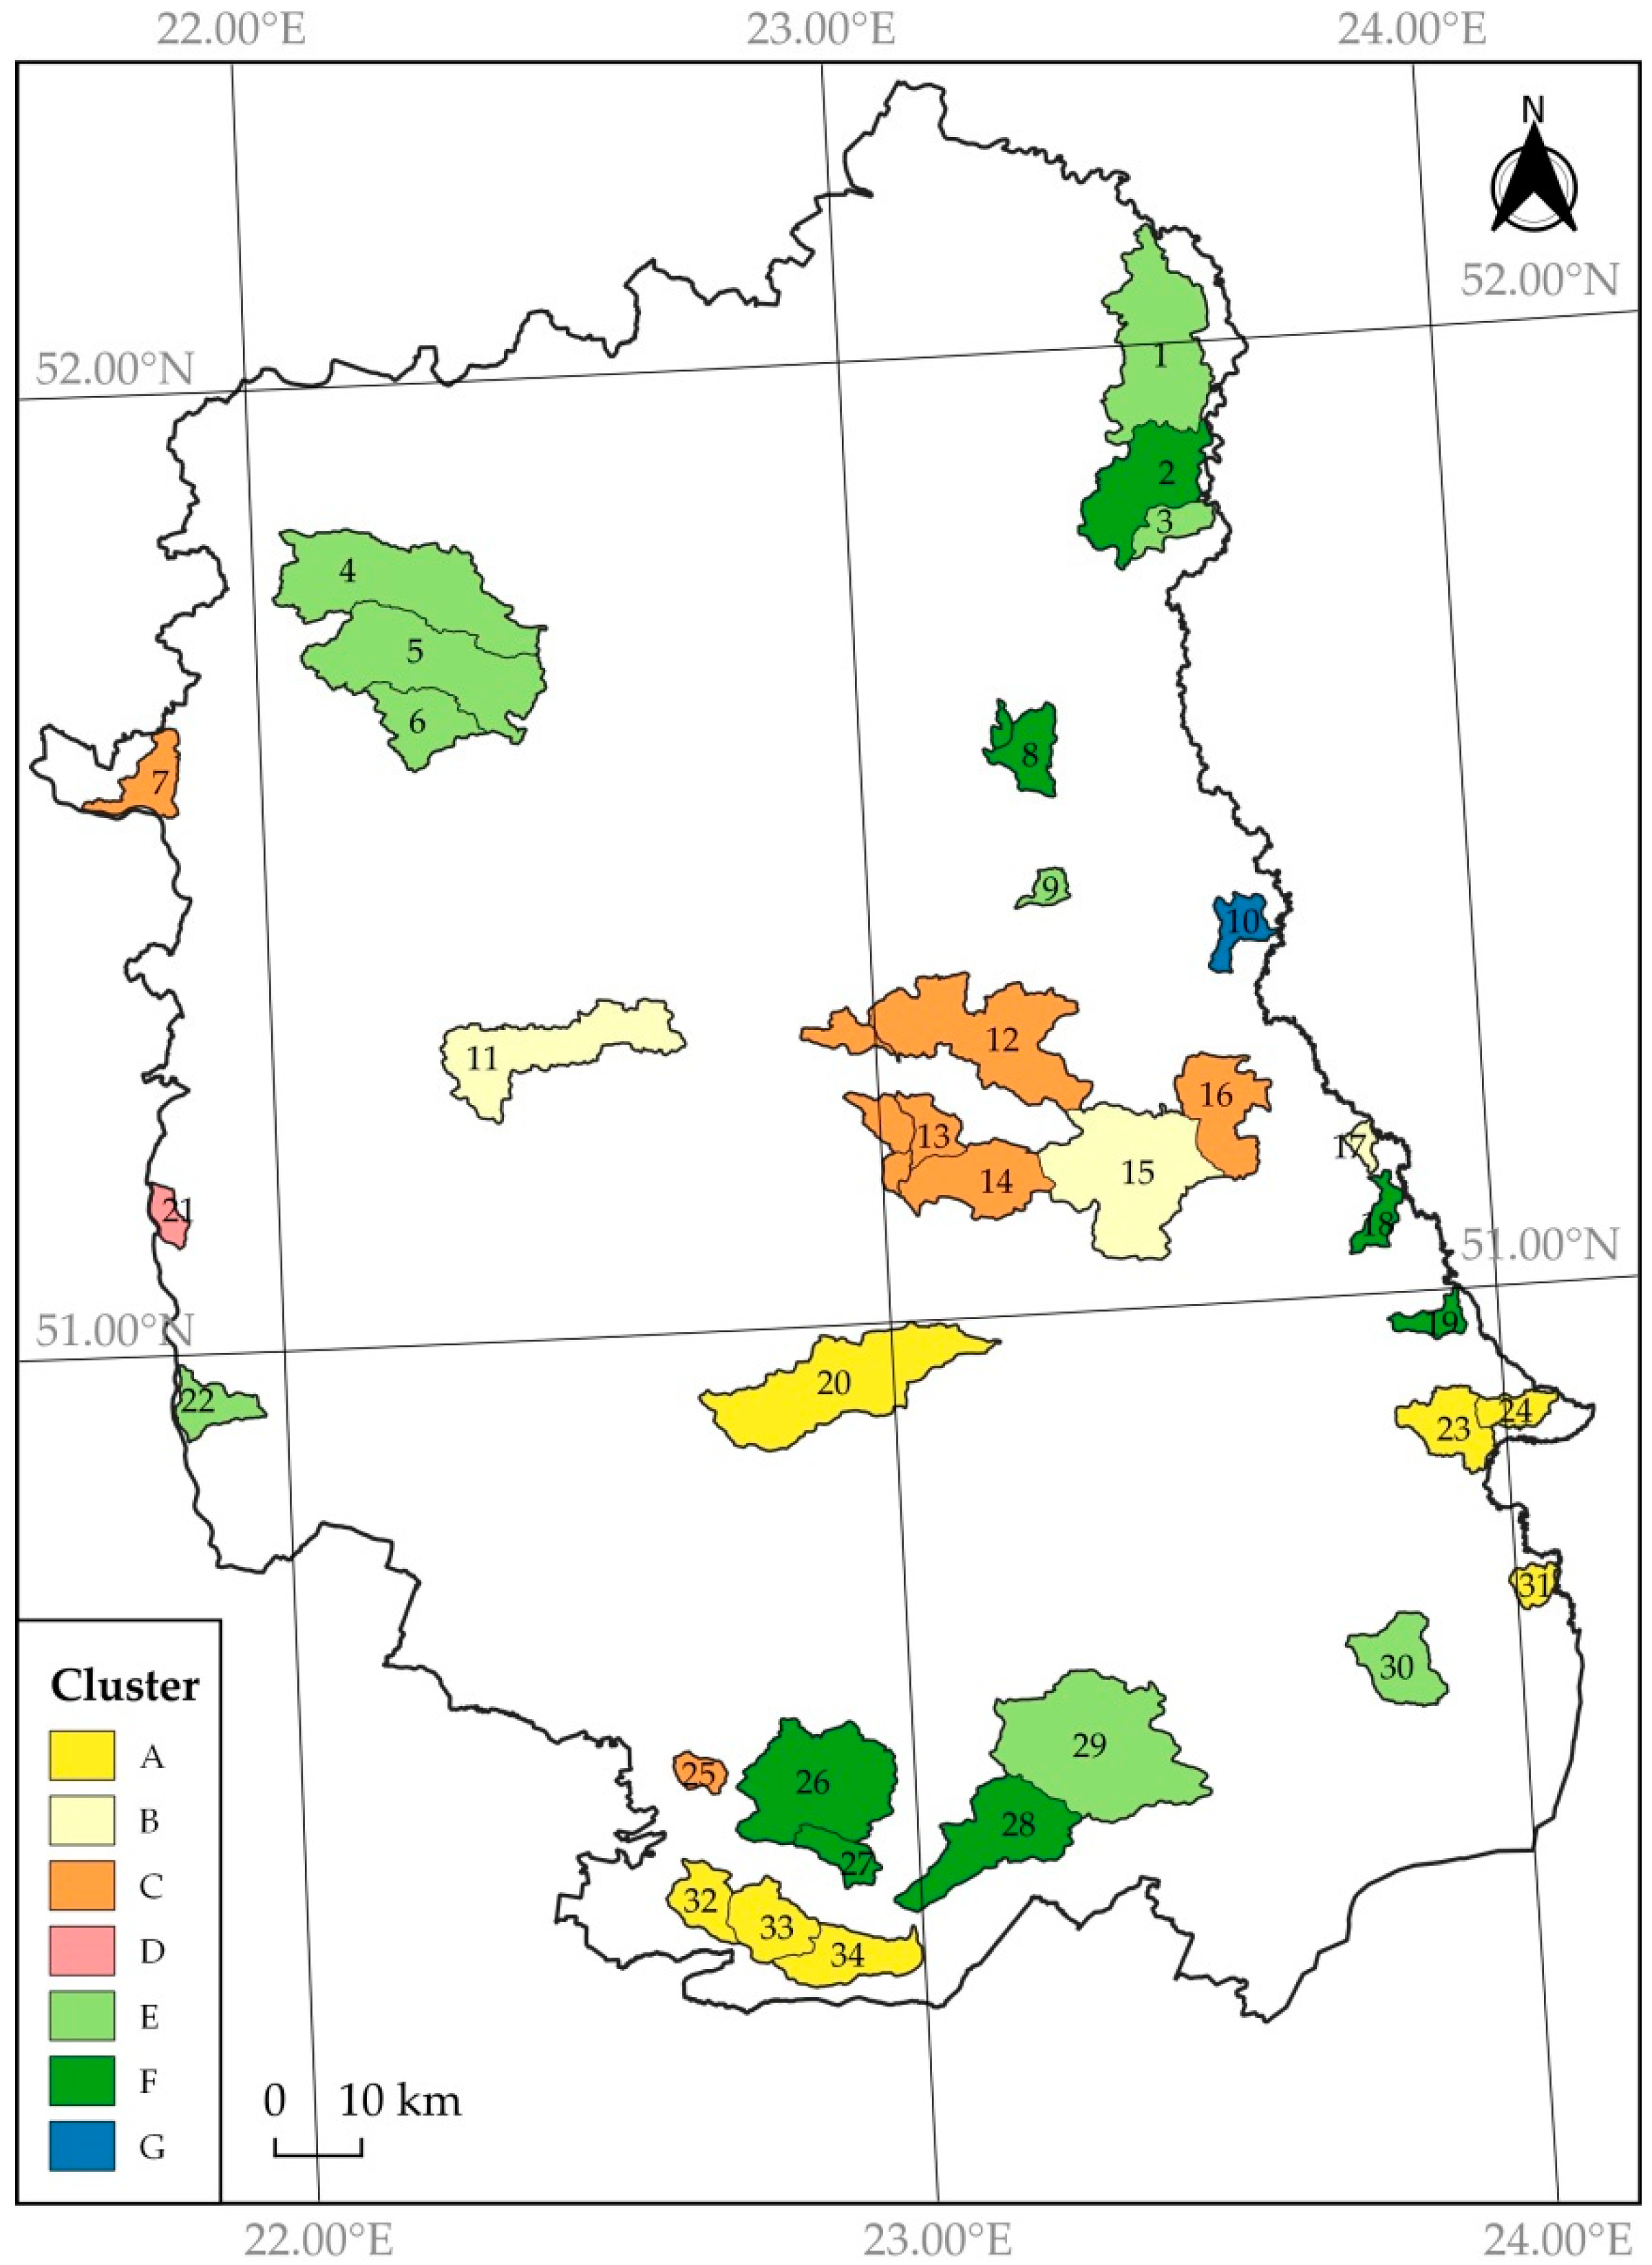
Statistical analyses were then carried out to detect and identify correlations between surface water quality and land use/land cover in a catchment (correlation coefficients, clustering method, redundancy analysis). Pearson’s correlation coefficients were calculated for the percentage share of the individual types of land use/land cover and water quality parameters. The level of correlation significance was also determined. The spatial similarity of the studied catchments in terms of land cover was identified using Ward’s method [
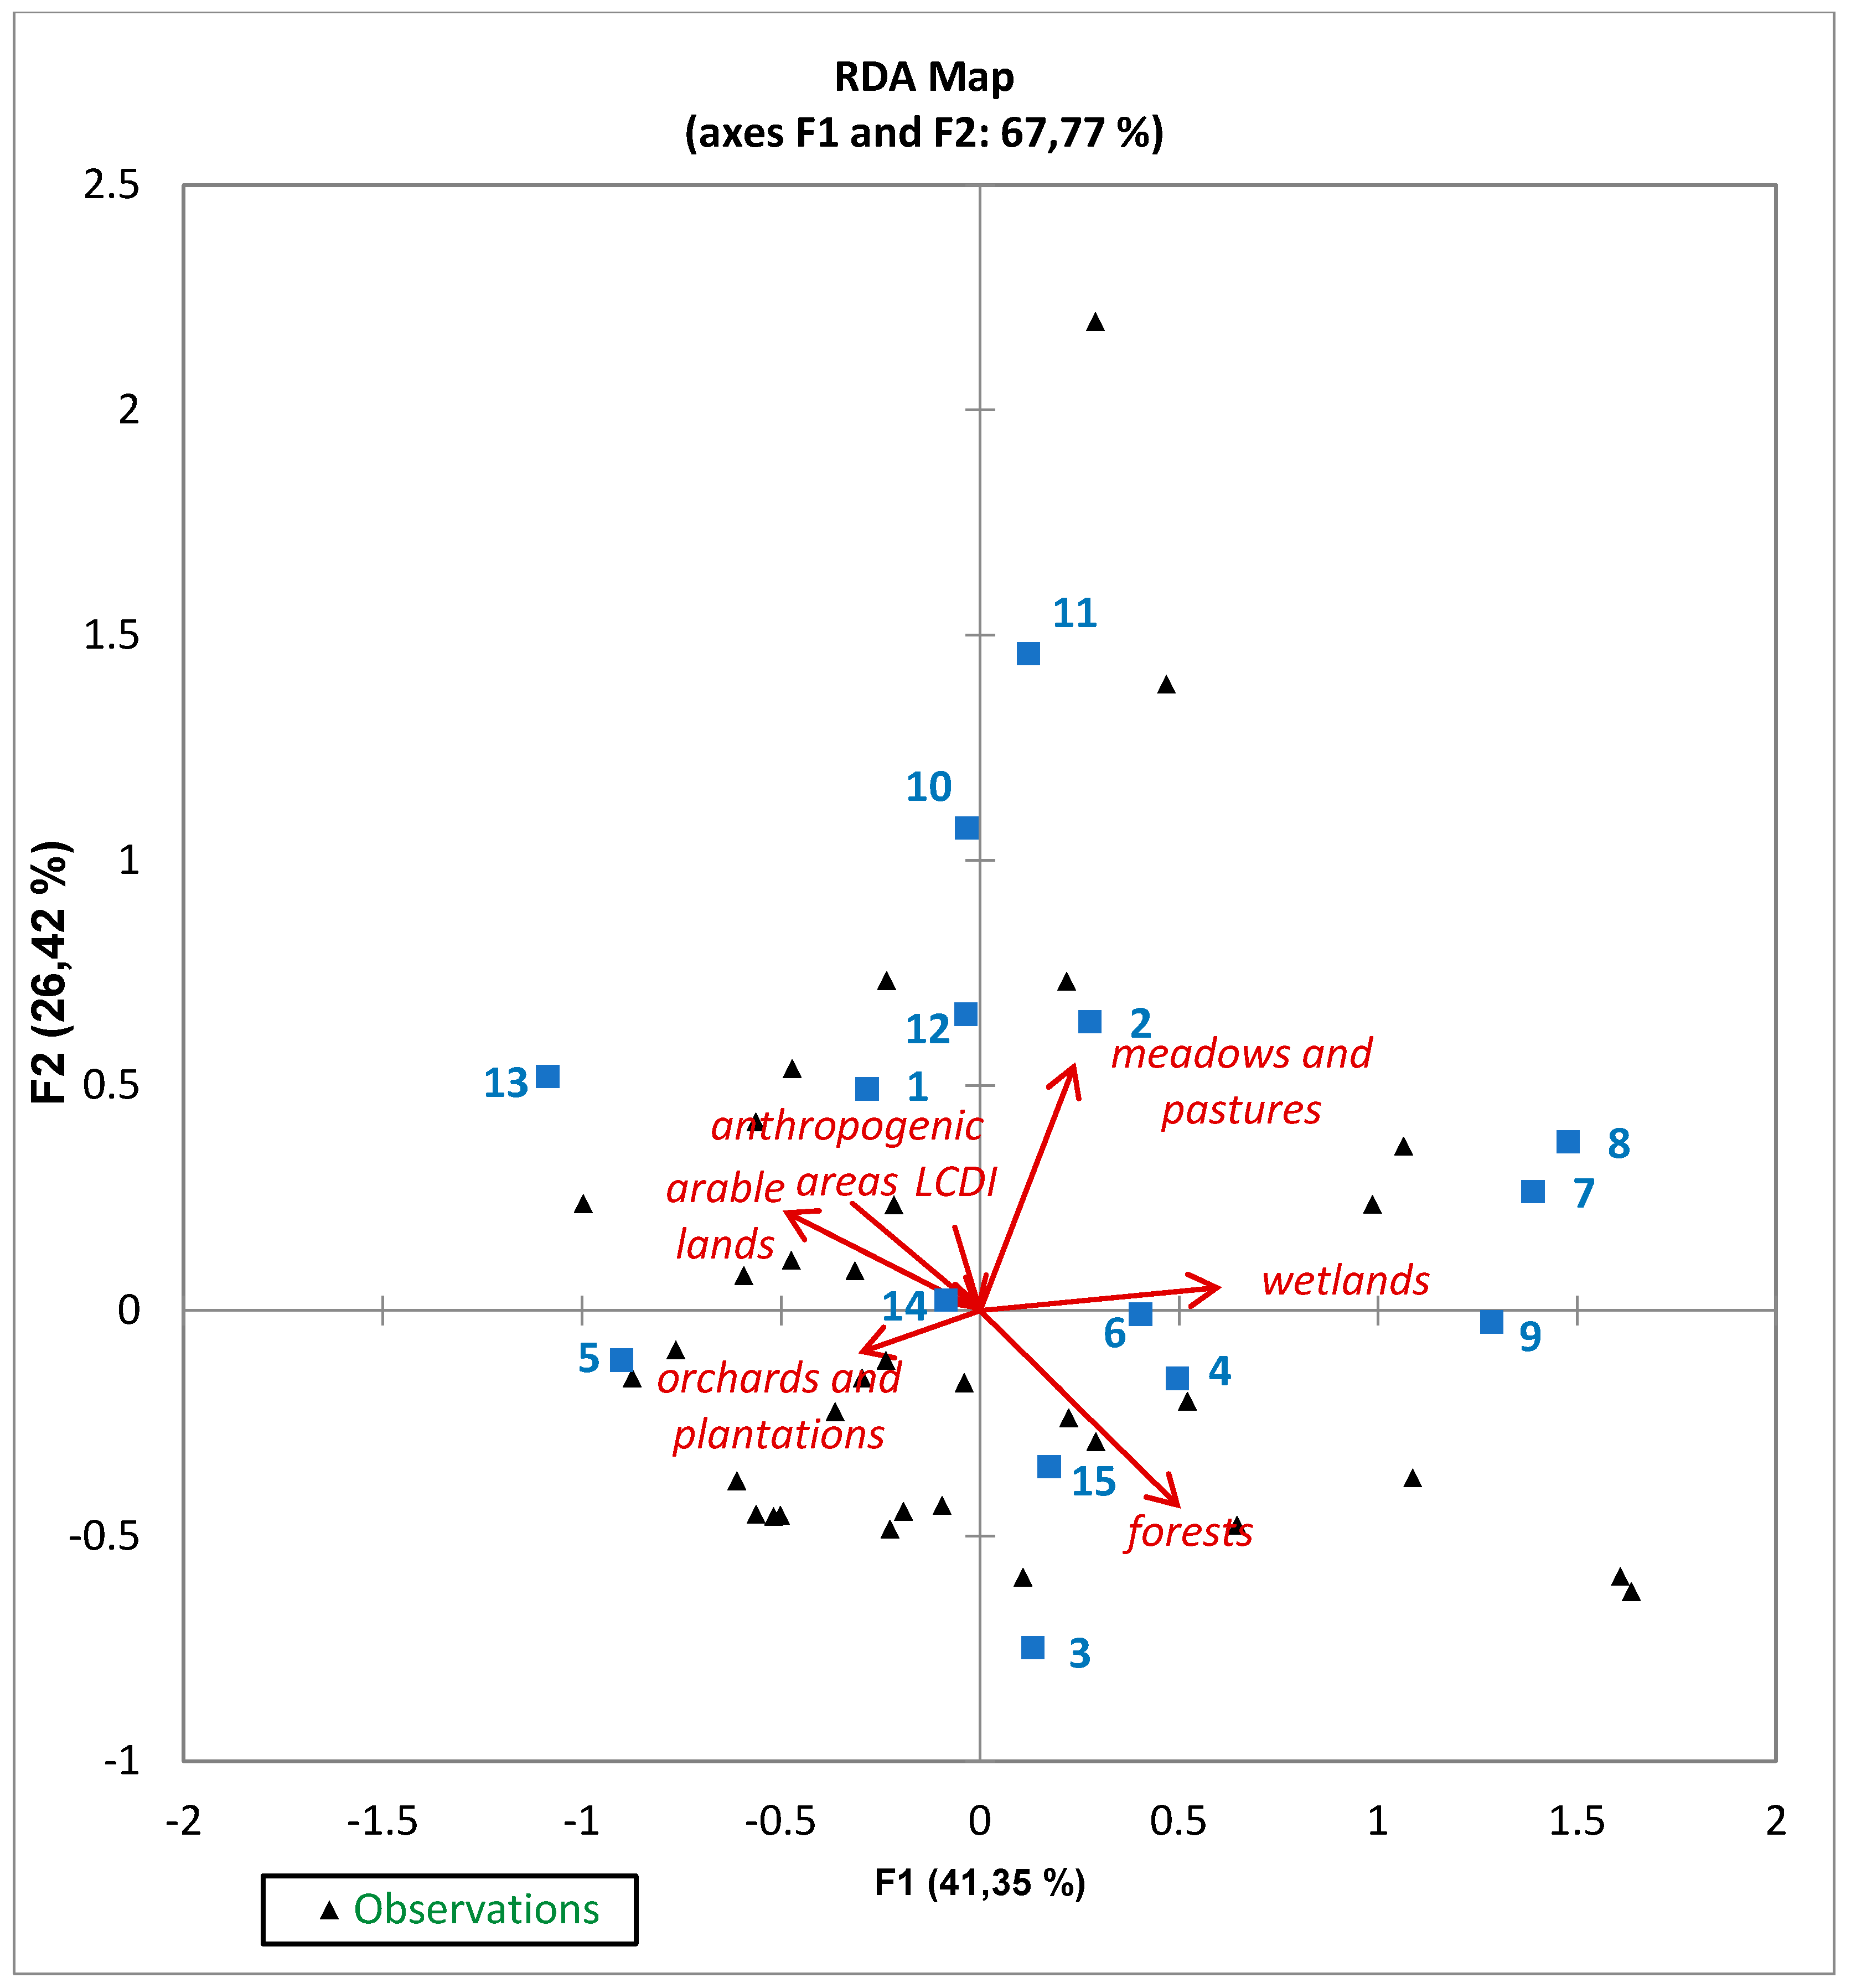
36], i.e., agglomerative hierarchical clustering. In the calculation, Euclidean distances were used as measures of similarity between objects. A dendrogram showing a graphical representation of the similarities was thereby obtained. The calculations were carried out using the XLSTAT add-in in Microsoft Excel. Then, the mean values of water quality parameters were calculated for clusters of catchments with similar land cover characteristics. The correlation between land cover categories and river water quality indices was examined by means of redundancy analysis (RDA) [37], which enables the investigation of correlations between two datasets. RDA was carried out using the XLSTAT add-in to Microsoft Excel. Owing to their different orders of magnitude, the variables were standardised for the purposes of the analysis. In the graphic image, type II scaling focusing on the correlations between the explanatory variables was used.

4. Results

4.1. Land Use/Land Cover and Water Quality

While Lubelskie Province is an agricultural region, the catchments under study show a considerable diversity of land cover. The largest area is covered by arable land (45% on average) and forests and woodlots (26%). The share of meadows and pastures is also relatively high (Table 2). The share of arable land was lower than 20% of the catchment area in only four catchments. Forests and woodlots accounted for less than 20% of the catchment area in 15 catchments. The share of orchards and plantations, as well as water and wetland areas, shows the greatest diversity, their variation coefficient being 2.7 and 1.8, respectively. Within the catchments under study, the maximum share of forests and woodlots was 70%; anthropogenic areas, 31%; orchards and plantations, 57%; arable land, 91%; and water and wetland areas, 19% (Table 2). The occurrence of a land use/land cover mosaic is a distinctive feature of the catchments under study, particularly those in the upland areas of the province (Figure 2).
Averaged water quality parameters in the catchments under study are provided in Table 3. The condition of the water in the catchments under study varies depending on the individual indices related to the standards of water purity classes in Poland (Table 4): standard class I, very good water condition (drinking water); standard class II, the water condition is assessed as good. The worst situation occurs in the case of biological indicators: the standards of water purity class I are not met in any of the catchments, and in just nine catchments can the water be rated as class 2. In the case of indicators concerning the oxygen conditions, the following belong to class I: six catchments (BOD5), seven catchments (COD—Mn), 10 catchments (COD—Mn), 11 catchments (dissolved oxygen). Based on the other parameters—salinity, acidity, biogenic conditions—water in 22 to 34 catchments can be assigned to purity class I. The most varied parameters included chlorides (VC = 2.2) and total suspended sediment (0.96) and total nitrogen (0.68).

4.2. Correlations

The analysis of correlations between the parameters of river water quality and land use/land cover indicates the following relationships (Table 5):
(1)
A greater share of arable land causes a deterioration of river water quality owing to an increased total content of chlorides, dissolved substances, and sulphates (moderate correlations), but it also improves their quality owing to the lower total content of organic carbon and organic and non-organic contaminants (COD Mn). The pH is higher in these catchments (moderate correlation).
(2)
A greater share of meadows and pastures causes a decrease in river water quality due to an increased total content of organic carbon (strong correlation), sulphates, and organic and non-organic contaminants (COD Mn) (moderate correlations). At the same time, this form of land use leads to the increased occurrence of macrophytes in river water (higher biological index).
(3)
A greater share of orchards and plantations leads to a decline in river water quality as a result of increased total content of chlorides; however, it contributes to a better water quality thanks to a decreased content of organic carbon (strong correlation), and non-organic contaminants (COD Mn, Cr) (moderate correlations).
(4)
A greater share of forests and woodlots results in improved river water quality thanks to a decreased content of chlorides and dissolved substances (strong correlation); however, the water quality deteriorates due to an increased content of organic and non-organic contaminants (COD Mn) and organic carbon (moderate correlations). In forest-covered catchments, the pH is lower (moderate correlation).
(5)
A greater share of water and wetland areas causes a decline in river water quality due to an increased total content of organic and non-organic contaminants (COD Mn, Cr, BOD5) and organic carbon (strong and moderate correlations). On the other hand, a greater presence of macrophytes leads to improved river water quality. The pH in these catchments is lower (moderate correlation).
(6)
The presence of anthropogenic areas does not essentially influence water quality; it merely causes a decrease in the content of organic and non-organic contaminants (COD—Cr)
(7)
The diversification of land use in a catchment (function diversity index) leads to improved river water quality resulting from the greater number of macrophytes (moderate correlation) and, on the other hand, diminished quality due to increased organic carbon and sulphate content (moderate correlation).
No moderate or high correlations were found between the type of land use and land cover and the following water quality parameters: phytobenthos, dissolved oxygen, total nitrogen, total phosphorus.

4.3. Clustering

The clustering method has made it possible to distinguish seven groups of the catchments with the land use and water quality characteristics listed below (Figure 3). In some clusters, a small number of catchments occurred (Table 6).
(a)
Cluster A (catchments with a very large share of forests and woodlots, as well as water and wetland areas): lowest content of phytobenthos and macrophytes, highest mean water temperature, highest total suspended sediment content, lowest dissolved oxygen content, highest BOD5, COD and organic carbon content, lowest chloride content, lower sulphate content, highest total nitrogen and phosphorus content.
(b)
Cluster B (catchments with a very large share of forests and woodlots and a large share of arable land and meadows and pastures): high total suspended sediment content, low dissolved substance content, low chloride content, low total nitrogen content.
(c)
Cluster C (high share of arable land, meadows and pastures, and anthropogenic areas): high phytobenthos and sulphate content.
(d)
Cluster D (high share of arable land, meadows and pastures, forests and woodlots): moderate indices.
(e)
Cluster E (high share of meadows and pastures, arable land, forests and woodlots): highest content of macrophytes, low water temperature, high level of dissolved oxygen, highest content of dissolved substances, sulphates and chlorides.
(f)
Cluster F (very large share of orchards and plantations): highest level of phytobenthos, low water temperature, lowest level of total suspended sediment, highest dissolved oxygen content, lowest BOD5, COD and organic carbon content, low content of dissolved substances, lowest total nitrogen and phosphorus content.
(g)
Cluster G (the largest share of arable land): high level of total nitrogen, dissolved oxygen, low BOD5, COD—Mn, total organic carbon.

4.4. Redundancy

The results of the redundancy analysis (RDA) indicate that the correlation between land cover and river water quality parameters is explained mainly by the first two axes. Axes F1 and F2 jointly express 67.77% of information: axis 1, 41.35%; axis 2, 26.42% (Figure 4). There is a strong positive correlation of total nitrogen with arable land, of orchards/plantations and function diversity index (FR) with sulphates and macrophytes. There is a negative correlation between dissolved oxygen and forests and woodlots. Macrophytes, sulphates, total organic carbon and COD—Mn are positively correlated with the share of meadows and pastures/water and wetland areas. Total phosphorus, water temperature, BOD5, COD—Cr, and total suspended sediment are additionally correlated with the share of forests and woodlots. Orchards and plantations are correlated with dissolved oxygen. Dissolved substances, chlorides, phytobenthos, and total nitrogen are correlated with the share of arable land and anthropogenic areas.

5. Discussion

The water in the catchments under study are of low quality in terms of biological indices, of quite a good quality with regard to oxygen indices, and of good quality in terms of salinity and biogenic substance content. The analyses indicate the occurrence of various correlations (including the lack of correlation) between the quality of river water and land use in catchments. It should also be noted that not all correlations were confirmed by more than one statistical method. The most important relationships found between LULC and river water quality are as follows:
(1)
A larger number of macrophytes is fostered by the presence of meadows and pastures, water and wetland areas, as well as diversity of land use in catchments. This indicates that such forms of land use are conducive to the development of organisms that are indicative of better water quality.
(2)
The mean water temperature is the lowest in catchments with varied land use.
(3)
Total organic carbon content is greater in catchments with a high proportion of meadows and pastures, as well as water and wetland areas; it is lower in catchments used as arable land. This pattern results from the greater supply of organic matter to river channels in peat bog and grassland areas. Organic carbon is generally treated as a contaminant influencing the oxygen conditions of water.
(4)
A similar situation occurs in the case of COD indices: they are higher in catchments with a high proportion of forests, meadows and pastures, as well as water and wetland areas. An increase in dissolved substance content is favoured by the use of catchments as arable land, while a clear decrease occurs in forest-covered catchments.
(5)
The same pattern occurs in the case of chlorides and sulphates. The agricultural use of catchments is conducive to the supply of contaminants in dissolved form, while forests effectively mitigate this phenomenon.
(6)
The presence of arable land, orchards, and plantations is conducive to increased nitrogen content in water. Nitrogen content is clearly lower in the water of catchments with a greater number of forests. The negative influence of agricultural land use and the positive impact of forests can also be observed in this case.
(7)
No statistical correlations were found between types of land use and the following water quality properties: phytobenthos, total suspended sediment, total phosphorus, dissolved oxygen, BOD5.
Land cover is one of the factors influencing water quality, and the lack of unequivocal correlations found in some cases may result from the impact of other factors, such as topography, hydrogeological conditions, or the presence of point sources of pollution in a catchment [10,14,39,40,41]. The poor hydrological connectivity between slope systems and river channels may have a particularly important influence. Water and the substances in it—originating from agricultural areas—do not always reach rivers. This phenomenon is particularly intensive in the case of a land use mosaic, which is linked to a varied microtopography conducive to local accumulation of contaminants [41,42]. What is quite significant in the case of small catchments in the Lublin Upland and Roztocze is the high proportion of water supply from the springs, which may exceed 50% in periods with less precipitation. This significantly reduces the impact of land cover on the quality of river water. It should be emphasized that the functional diversity index used in the study only partially reflects the land use mosaic (based on the main CLC classes) because it does not take into account the diversity resulting from the occurrence of a field mosaic.
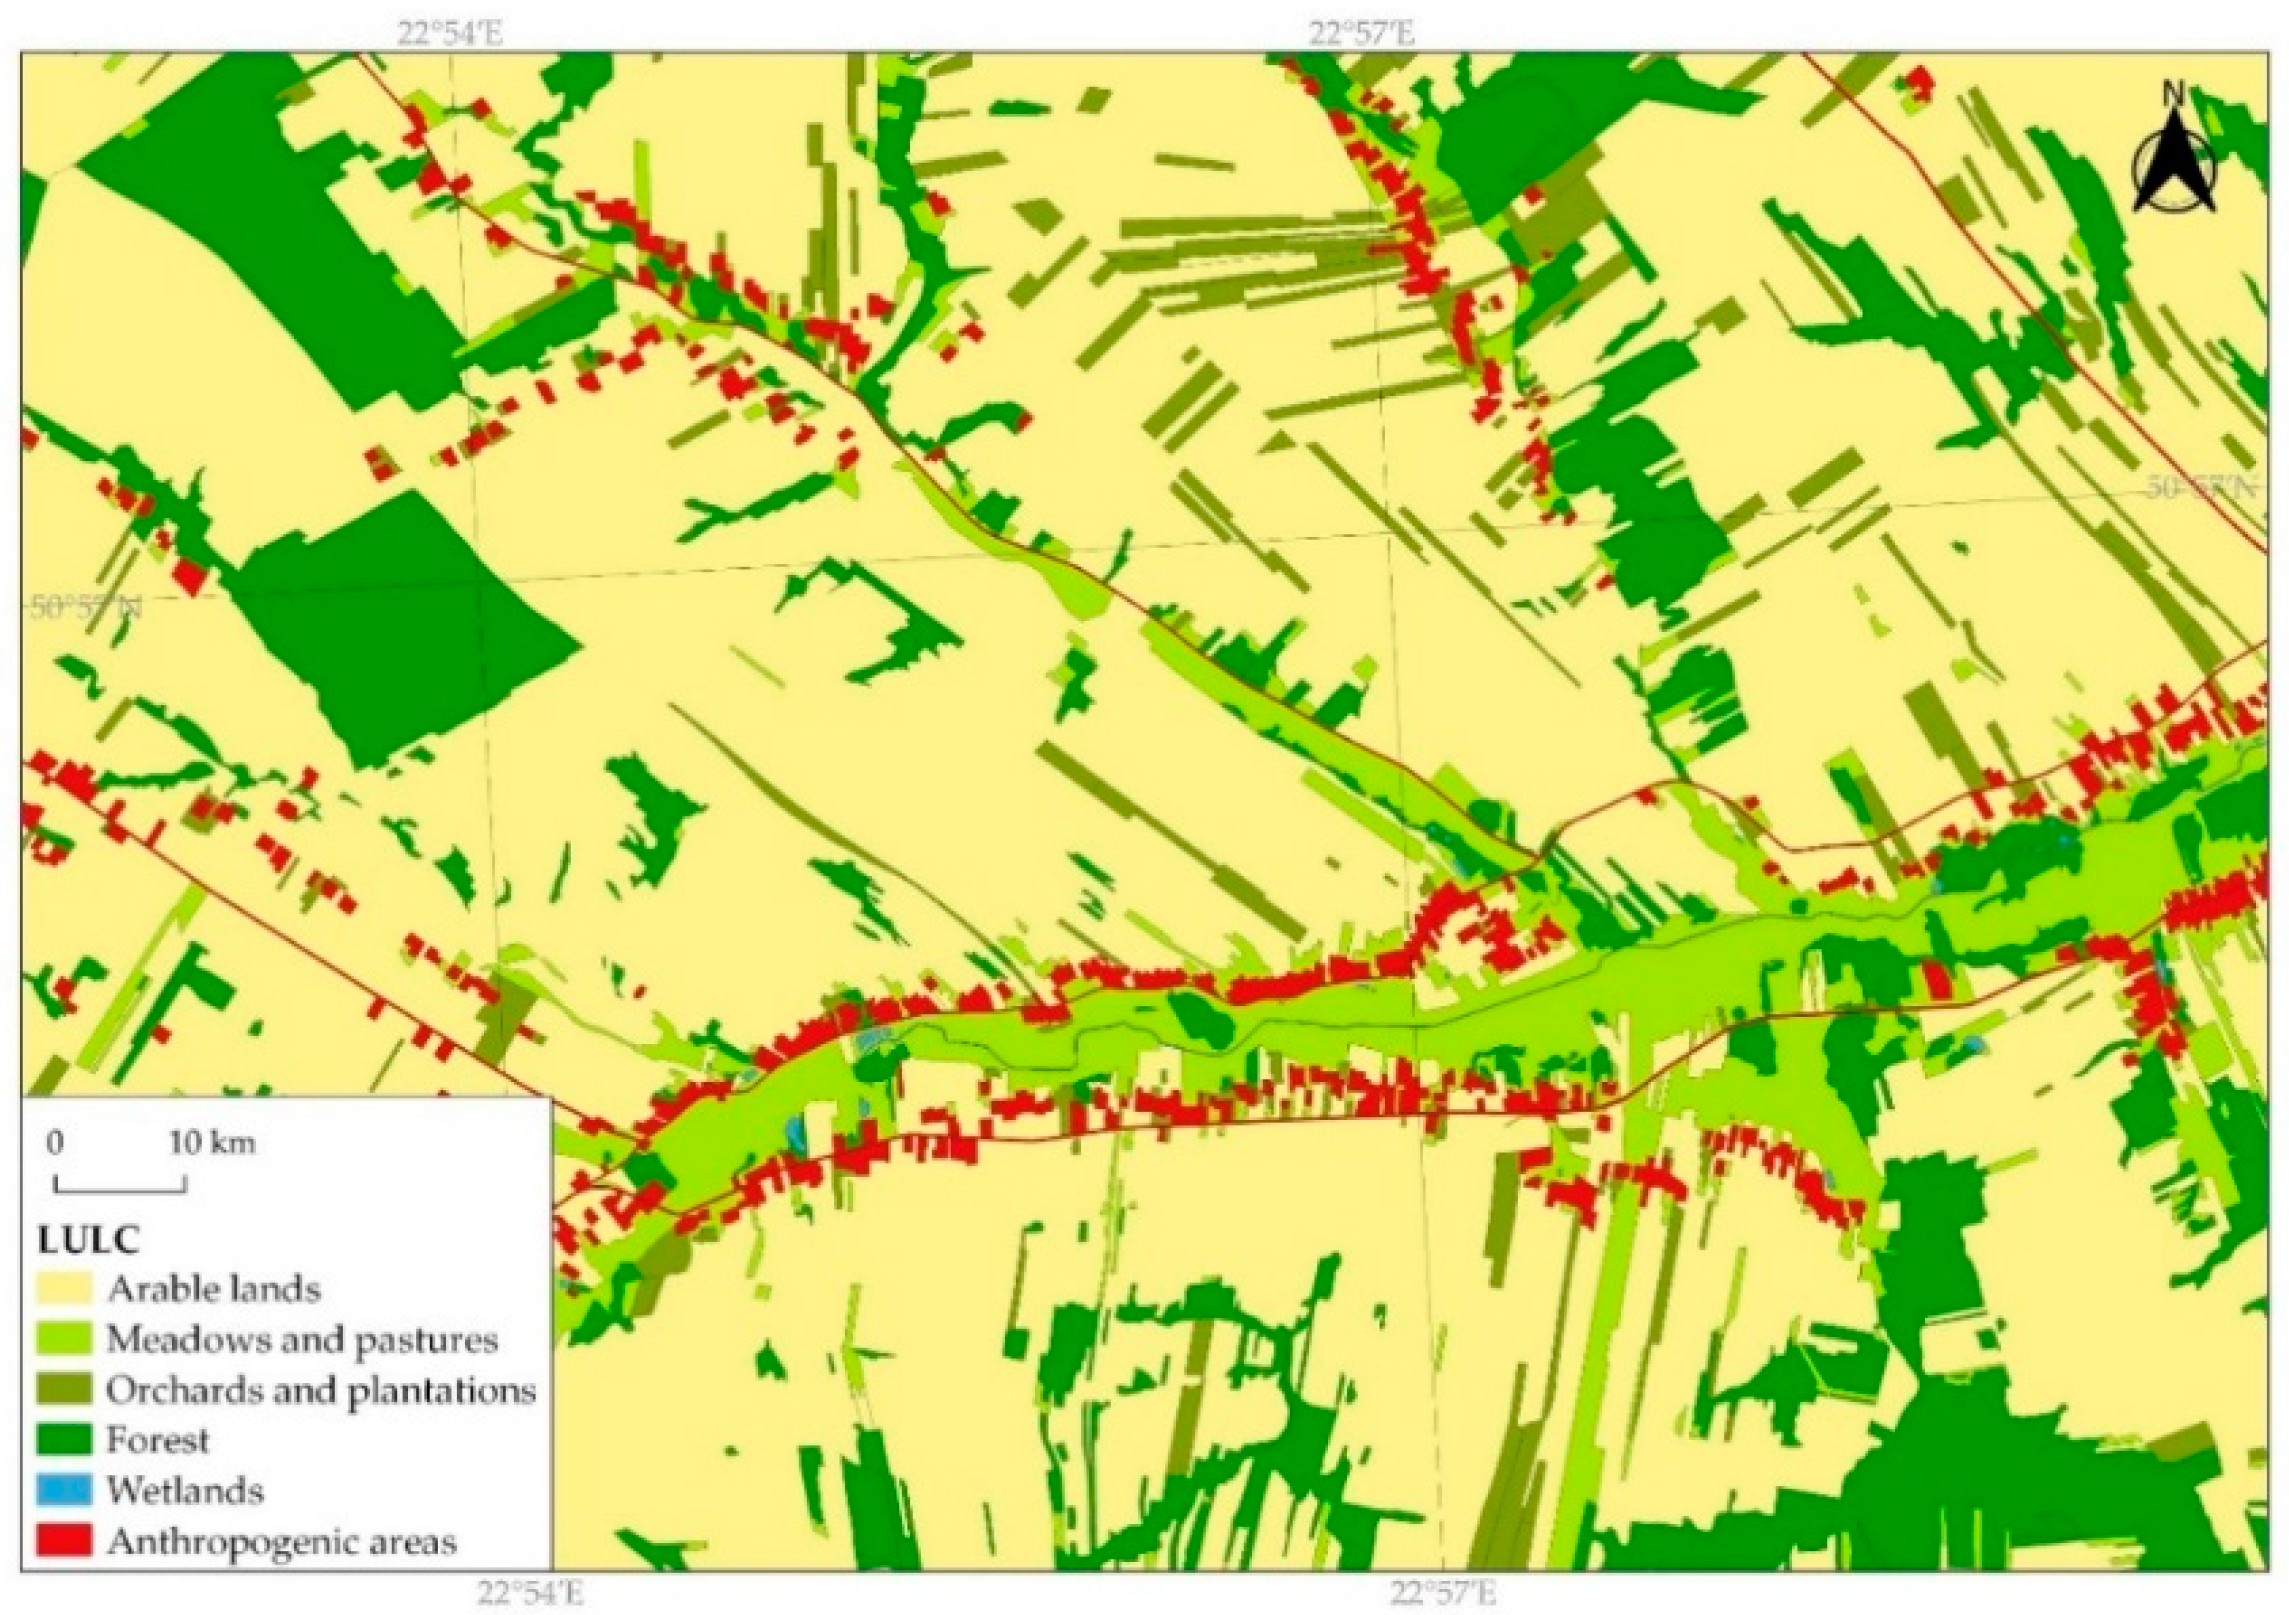
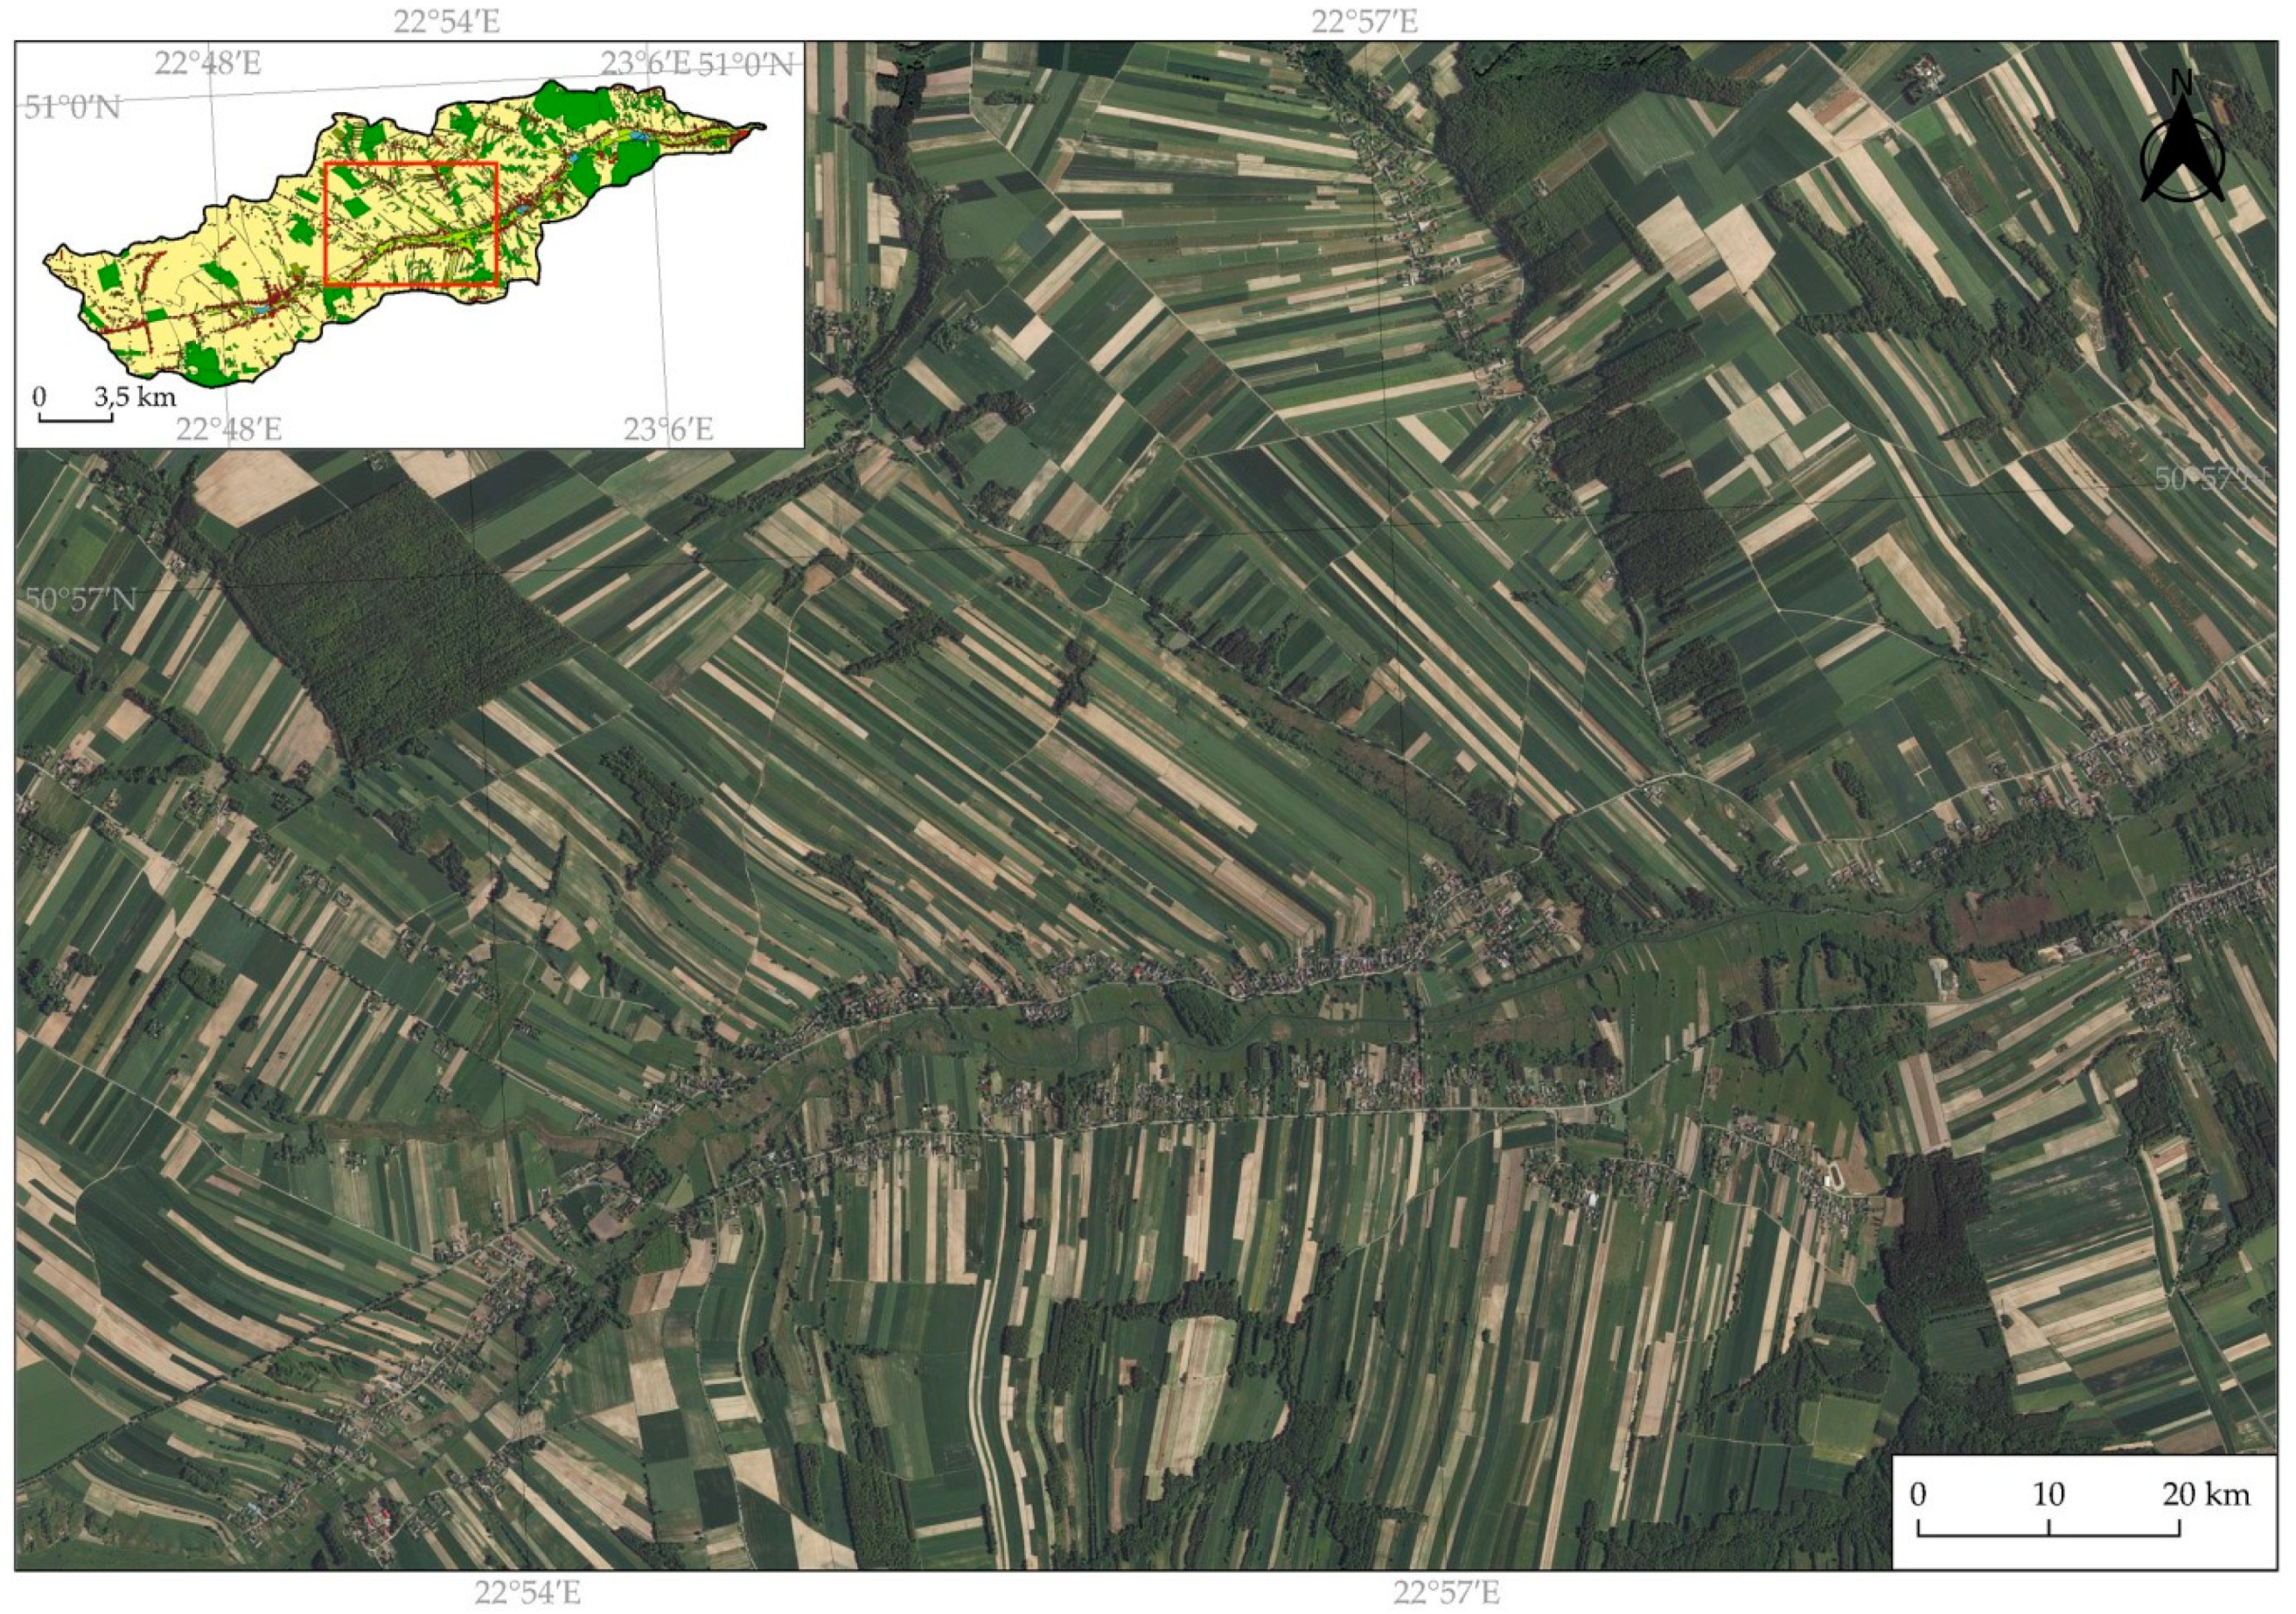
Eastern Poland is extremely varied in terms of land use. Historical factors and changes in agriculture following changes in the political and economic system determine the present-day characteristics of the landscape. A mosaic of highly diverse forms of agricultural use has developed: meadows and pastures, orchards and plantations, and wasteland (Table 7, Figure 5). In some areas, individual fields are less than 10 m wide. The more diverse the land relief, the smaller the area covered by the individual forms of land use. Forests and woodlots add to this diversity. Field boundaries are barriers to the formation of surface runoff. Thus, the patchwork of different forms of land use—including an increased number of small areas of wasteland, woodland, woodlots, and shrubbery in a mosaic-like pattern—reduces the delivery of pollutants of agricultural origin to river water (Figure 5). Therefore, this kind of land use should be recommended in policies concerning the sustainable development of rural areas both in Poland and other countries. Since a mosaic of land use reduces the threat posed not only by soil erosion but also the pollution of rivers, it should be preserved in the selected areas [26].
Investigations conducted so far indicate that urban areas have an important influence on the deterioration of water quality [17]. In the catchments under study, however, no correlation was found between the size of anthropogenic areas and the characteristics of surface water. It should be emphasised, though, that there are few typical urban areas in the region, hence the impact of this category of land cover is smaller than in the case of highly urbanised areas. The lack of clear correlations between LULC and water quality in the areas under study can generally result from the relatively weak anthropogenic pressure.
When searching for the determinants of water quality, the correlation between the type of catchment (type of sediments occurring in the substrate) and characteristics of river water was also analysed. For some indices, poorer oxygen indices were found for catchments where peat bog areas occur (Table 8). This is related to the large supply of organic matter to river channels, which leads to the deterioration of water quality. On the other hand, the lowest indices (the best water quality) occur in rivers that are direct tributaries of the Vistula (Table 8). At the same time, no statistically significant correlations were found between water quality parameters and catchment characteristics, such as area, density of the river network, or density of the road network (Table 9).
The results of studies conducted in other areas are not unequivocal either. For example, Ding et al. (2015) [11] found that in a subtropical river basin, the proportion of forests was positively associated with dissolved oxygen concentration but negatively associated with water temperature, total phosphorus, and total nitrogen. The proportion of urban land was strongly positively associated with total nitrogen. According to the study, agricultural land use did not have a significant impact on water quality. De Carli et al. (2018) [44] found strong but not significant correlations between short-term agriculture and total phosphorus, long-term agriculture and turbidity, pasture and total nitrogen, pasture and total phosphorus forest and total phosphorus, and urban buildings and total nitrogen. Based on the analysis of publications concerning research into the impact of land cover on water quality, Camara et al. (2019) [17] found that while a positive correlation was found between the area of arable land and quality of river waters, the correlation was not significant. Urban areas showed the most significant correlations with hydrological parameters (decline in water quality). A significant positive correlation was demonstrated between the size of forested areas and changes in the physicochemical parameters of water quality. Studies conducted in the USA indicated a significant correlation between land use and river water quality, particularly in the case of nitrogen and phosphorus [9]. Research conducted in other areas of Poland indicates a positive impact of the share of meadows and pastures and a negative impact of arable lands on the quality of river water [45,46,47]. All researchers emphasise that this influence is determined by several regional or local factors related to human activity and the characteristics of the natural environment.
Lee et al. (2009) [10] point out that the structure of LULC patches, and not just the proportion of individual forms of land use, is an important influence on water parameters. During investigations conducted in Korea, they found that a greater deterioration of water in reservoirs occurs in areas where there is greater mosaicism of land use types. This particularly concerns the built environment: its negative impact on water quality is weaker when it is more compact. Large forest complexes, on the other hand, are conducive to an improvement of water quality. In the case of Lubelskie Province, forest areas are usually small, and this can be the reason for the lack of their positive impact on water quality. It should be stressed that the results obtained by [10] contradict, to a certain extent, the previously suggested positive influence of land use mosaicism. However, one should take into consideration the differences in the structure of land use in Poland (agricultural country) and Korea (predominance of forest areas) and in the entirely different forms of agricultural land use.
Small farms and the associated mosaic of land use are not economically efficient. The process of land consolidation and intensification of agriculture may lead to their disappearance. Institutions responsible for land use policy should therefore pursue a rational policy of spatial management and creating a specific structure of LULC patches, and thus influence the quality of water. Spatial planning can be a tool for maintaining a mosaic of land use, and thus for water quality protection. The structure of land use and land cover in the Lublin region is the result of historical processes operating from the Middle Ages to the present day (including planned village layouts, farm management, parcelling, inheritance divisions, suburbanization, and deagrarisation). Nowadays, this mosaic of use shows high landscape values and, due to the stability of the ecological systems, it is conducive to maintaining the natural balance [26]. At the same time, excessive fragmentation of the landscape may lead to the breakdown of the ecological network, and small, isolated units may not always fulfill their functions [48]. In the case of many rural areas, there is no comprehensive shaping of their functional and spatial structure. The basis of a correct spatial policy is local spatial development planning, with different plans treating environmental issues in different ways [49,50]. In many territorial units, investment processes are carried out on the basis of decisions about land development conditions which do not always fully take into account the entire spectrum of natural conditions [51,52,53].

6. Conclusions

A negative influence of land use on water quality (i.e., higher numbers of pollutants) has not been detected in the area under study. This influence is visible only in the case of some indices, and the statistical correlations found are usually not strong. No statistical correlations with the type of land use/land cover were found in the case of some indices.
In agricultural catchments, a greater number of substances dissolved in water were found (including sulphates and chlorides) and a greater amount of total nitrogen. Orchards and plantations and anthropogenic areas (the built environment) did not result in the decline of the indices analysed. Natural catchments (with forests, meadows and pastures, water and wetland areas) had better biological parameters (macrophytes) and smaller quantities of dissolved substances (forests). At the same time, water in catchments with a high proportion of these types of land use is characterised by poorer oxygen conditions (greater content of organic substances in water).
The quality of river water is a resultant of several natural factors and factors related to human activity. The lack of correlations with land cover may result from the diversity of the environmental characteristics of catchments, and this diversity (e.g., point sources of pollution) was not taken into account in the present study. A synergistic effect of multiple factors on water quality parameters is also possible.
One of the factors that can mask the impact of land use and land cover on river water quality is its unique structure. The mosaic of fields with different types of use results in a peculiar system of water circulation, i.e., increased micro-retention and infiltration within slopes and dry valleys. Therefore, the direct supply of water and substances suspended and dissolved in water is more limited.
The assessment of the impact of the land use mosaic on the physical and chemical parameters of river water requires further detailed investigation. The results of this study may suggest its positive influence in reducing the adverse effects of human activity in the environment. This problem requires further study. However, it seems that land cover mosaics can be regarded as a model form of land use. Spatial planning can be a tool for maintaining the mosaic of land use and, as a result, fertile soils and water quality.

Author Contributions

Conceptualization, W.Z. and D.D.; methodology, D.D. and W.Z.; investigation, D.D.; writing—original draft preparation, W.Z., D.D. and B.B.-Z.; writing—review and editing, W.Z. and B.B.-Z.; visualization, D.D. All authors have read and agreed to the published version of the manuscript.

Funding

This research received no external funding.

Institutional Review Board Statement

Not applicable.

Informed Consent Statement

Not applicable.

Data Availability Statement

Not applicable.

Acknowledgments

The authors wish to thank anonymous reviewers for their valuable comments and suggestions for improving the quality of this paper.

Conflicts of Interest

The authors declare no conflict of interest.

References

  1. Antrop, A. Background concepts from integrated landscape analysis. Agric. Ecosyst. Environ. 2000, 77, 17–28. [Google Scholar] [CrossRef]
  2. Dearing, J.A.; Battarbee, R.W.; Dikau, R.; Larocque, I.; Oldfield, F. Human–environment interactions: Learning from the past. Reg. Environ. Chang. 2006, 6, 1–16. [Google Scholar] [CrossRef]
  3. Goudie, A.S. Human Impact on the Natural Environment; John Wiley & Sons: Hoboken, NJ, USA, 2018. [Google Scholar]
  4. Baird, C.; Jennings, M.; Ockerman, D.; Dybala, T. Charaterization of Nonpoint Sources and Loadings to the Corpus Christi Bay National Estuary Program Study Area; Final report; Natural Resources Conservation Service: Washington, DC, USA, 1996. [Google Scholar]
  5. Giri, S.; Qiu, Z. Understanding the relationship of land uses and water quality in twenty first century: A review. J. Environ. Manag. 2016, 173, 41–48. [Google Scholar] [CrossRef] [PubMed] [Green Version]
  6. Hua, A.K. Land Use Land Cover Changes in Detection of Water Quality: A Study Based on Remote Sensing and Multivariate Statistics. J. Environ. Public Health 2017, 7515130. [Google Scholar] [CrossRef] [Green Version]
  7. White, M.D.; Greer, K.A. The effects of watershed urbanization on the stream hydrology and riparian vegetation of Los Peñasquitos Creek, California. Landsc. Urban Plan. 2006, 74, 125–138. [Google Scholar] [CrossRef]
  8. Strayer, D.L.; Beighley, R.E.; Thompson, L.C.; Brooks, S.; Nilsson, C.; Pinay, G.; Naiman, R.J. Effects of land cover on stream ecosystems: Roles of empirical models and scaling issues. Ecosystems 2003, 6, 407–423. [Google Scholar] [CrossRef]
  9. Tong, S.T.Y.; Chen, W. Modeling the relationship between land use and surface water quality. J. Environ. Manag. 2002, 66, 377–393. [Google Scholar] [CrossRef]
  10. Lee, S.-W.; Hwang, S.-J.; Lee, S.-B.; Hwang, H.-S.; Sung, H.-C. Landscape ecological approach to the relationships of land use patterns in watersheds to water quality characteristics. Landsc. Urban Plan. 2009, 92, 80–89. [Google Scholar] [CrossRef]
  11. Ding, J.; Jiang, Y.; Fu, L.; Liu, Q.; Peng, Q.; Kang, M. Impacts of Land Use on Surface Water Quality in a Subtropical River Basin: A Case Study of the Dongjiang River Basin, Southeastern China. Water 2015, 7, 4427–4445. [Google Scholar] [CrossRef] [Green Version]
  12. Donohue, I.; McGarrigle, M.L.; Mills, P. Linking catchment characteristics and water chemistry with the ecological status of Irish rivers. Water Res. 2006, 40, 91–98. [Google Scholar] [CrossRef]
  13. Fisher, D.S.; Steiner, J.L.; Endale, D.M.; Stuedemann, J.A.; Schomberg, H.H.; Franzluebbers, A.J.; Wilkinson, S.R. The relationship of land use practices to surface water quality in the Upper Oconee Watershed of Georgia. For. Ecol. Manag. 2000, 128, 39–48. [Google Scholar] [CrossRef] [Green Version]
  14. Song, Y.; Song, X.; Shao, G.; Hu, T. Effects of Land Use on Stream Water Quality in the Rapidly Urbanized Areas: A Multiscale Analysis. Water 2020, 12, 1123. [Google Scholar] [CrossRef] [Green Version]
  15. Ciupa, T.; Suligowski, R. Impact of the City on the Rapid Increase in the Runoff and Transport of Suspended and Dissolved Solids During Rainfall—The Example of the Silnica River (Kielce, Poland). Water 2020, 12, 2693. [Google Scholar] [CrossRef]
  16. Baker, A. Land use and water quality. Hydrol. Process 2003, 17, 2499–2501. [Google Scholar] [CrossRef]
  17. Camara, M.; Jamil, N.R.; Fikri Bin Abdullah, A. Impact of land uses on water quality in Malaysia: A review. Ecol. Process. 2019, 8, 10. [Google Scholar] [CrossRef]
  18. Feranec, J.; Jaffrain, G.; Soukup, T.; Hazeu, G. Determining changes and flows in European landscapes 1990–2000 using CORINE land cover data. Appl. Geogr. 2010, 30, 19–35. [Google Scholar] [CrossRef]
  19. Brouwer, F.M.; Thomas, A.J.; Chadwick, M.J. Land Use Changes in Europe: Processes of Change, Environmental Transformations and Future Patterns; Springer Science and Business Media: Berlin, Germany, 2012; p. 529. [Google Scholar]
  20. Zgłobicki, W.; Gawrysiak, L.; Baran-Zgłobicka, B.; Telecka, M. Long-term forest cover changes, within an agricultural region, in relation to environmental variables, Lubelskie province, Eastern Poland. Environ. Earth Sci. 2016, 75, 1373. [Google Scholar] [CrossRef] [Green Version]
  21. Renwick, A.; Jansson, T.; Verburg, P.H.; Revoredo-Giha, C.; Britz, W.; Gocht, A.; McCracken, D. Policy reform and agricultural land abandonment in the EU. Land Use Policy 2013, 30, 446–457. [Google Scholar] [CrossRef]
  22. Estel, S.; Kuemmerle, T.; Alcántara, C.; Levers, C.; Prishchepov, A.; Hostert, P. Mapping farmland abandonment and recultivation across Europe using MODIS NDVI time series. Remote Sens. Environ. 2015, 163, 312–325. [Google Scholar] [CrossRef]
  23. Filho, W.F.; Mandel, M.; Al-Amin, A.Q.; Feher, A.; Chiappetta Jabbour, C.J. An assessment of the causes and consequences of agricultural land abandonment in Europe. Int. J. Sustain. Dev. World Ecol. 2017, 24, 554–560. [Google Scholar] [CrossRef] [Green Version]
  24. Zgłobicki, W.; Karczmarczuk, K.; Baran-Zgłobicka, B. Intensity and Driving Forces of Land Abandonment in Eastern Poland. Appl. Sci. 2020, 10, 3500. [Google Scholar] [CrossRef]
  25. Zgłobicki, W.; Baran-Zgłobicka, B. Impact of loess relief on land use mosaic in SE Poland. CATENA 2012, 96, 76–82. [Google Scholar] [CrossRef]
  26. Baran-Zgłobicka, B.; Zgłobicki, W. Mosaic landscapes of SE Poland: Should we preserve them? Agrofor. Syst. 2012, 85, 351–365. [Google Scholar] [CrossRef] [Green Version]
  27. BDL. Available online: https://bdl.stat.gov.pl/BDL/dane/teryt/tablica (accessed on 6 September 2021).
  28. Statystyczne Vademecum Samorządowca. Portret województwa. Województwo lubelskie 2020. Available online: https://lublin.stat.gov.pl/statystyczne-vademecum-samorzadowca/ (accessed on 6 September 2021).
  29. Rosner, A.; Stanny, M. Socio-Economic Development of Rural Areas in Poland; EFRWP, IRWiR PAN: Warszawa, Poland, 2017. [Google Scholar]
  30. Michalczyk, Z.; Wilgat, T. Stosunki Wodne Lubelszczyzny; Wydawnictwo UMCS: Lublin, Poland, 2020. [Google Scholar]
  31. Stan środowiska Województwa Lubelskiego w 2020. Główny Inspektorat Ochrony Środowiska. 2020 Lublin. Available online: https://www.gios.gov.pl/images/dokumenty/pms/raporty/stan_srodowiska_2020_lubelskie.pdf (accessed on 6 September 2021).
  32. Rozporządzenie Ministra Gospodarki Morskiej i Żeglugi Śródlądowej z dnia 9 października 2019 r. w sprawie form i sposobu prowadzenia monitoringu jednolitych części wód powierzchniowych i jednolitych części wód podziemnych. Dziennik Ustaw Rzeczypospolitej Polskiej 2019, pozycja 2147.
  33. Ocena Stanu Jednolitych Części Wód Rzek I Zbiorników Zaporowych W Latach 2014–2019 na Podstawie Monitoringu. Available online: http://www.gios.gov.pl/pl/component/content/article/8-pms/100-badanie-i-ocena-stanu-rzek (accessed on 6 September 2021).
  34. Baza Danych Obiektów Topograficznych (BDOT10k). Available online: https://mapy.geoportal.gov.pl/imap/Imgp_2.html?locale=pl&gui=new&sessionID=5160004 (accessed on 6 September 2021).
  35. Śleszyński, P. Propozycja kompleksowej koncepcji wskaźników zagospodarowania i ładu przestrzennego. Biuletyn Polska Akademia Nauk. Kom. Przestrz. Zagospod. Kraj. 2013, 252, 176–231. [Google Scholar]
  36. Ward, J.H. Hierarchical Grouping to Optimize an Objective Function. J. Am. Statist. Assoc. 1963, 58, 236–244. [Google Scholar] [CrossRef]
  37. Van den Wollenberg, A.L. Redundancy analysis an alternative for canonical correlation analysis. Psychometrika 1977, 42, 207–219. [Google Scholar] [CrossRef]
  38. 38. Rozporządzenie Ministra Środowiska z dnia 22 października 2014 r. w sprawie sposobu klasyfikacji stanu jednolitych części wód powierzchniowych oraz środowiskowych norm jakości dla substancji priorytetowych. Dz. Ustaw Rzeczyposp. Pol. 2014, pozycja 1482.
  39. Casalí, J.; Gastesi, R.; Álvarez-Mozos, J.; de Santisteban, L.; de Lersundi, J.D.V.; Giménez, R.; Larrañaga, A.; Goñi, M.; Agirre, U.; Campo, M. Runo, erosion, and water quality of agricultural watersheds in central Navarre (Spain). Agric. Water Manag. 2008, 95, 1111–1128. [Google Scholar] [CrossRef]
  40. Skaggs, R.W.; Breve, M.; Gilliam, J. Hydrologic and water quality impacts of agricultural drainage. Crit. Rev. Environ. Sci. Technol. 1994, 24, 1–32. [Google Scholar] [CrossRef]
  41. Zgłobicki, W.; Rodzik, J. Heavy metals in slope deposits of loess areas of the Lublin Upland (E Poland). CATENA 2007, 71, 84–95. [Google Scholar] [CrossRef]
  42. Zgłobicki, W. Impact of microtopography on the geochemistry of soils within archaeological sites in SE Poland. Environ. Earth Sci. 2013, 70, 3085–3092. [Google Scholar] [CrossRef] [Green Version]
  43. Geoportal. Available online: https://mapy.geoportal.gov.pl (accessed on 6 September 2021).
  44. De-Carli, B.P.; de Souza, J.C.; de Sousa, J.A.P.; Shoegima, T.F.; Del Pilar Romero Barreiro, M.; Dutra, A.C.; de Medeiros, G.A.; Ribeiro, A.I.; Bressane, A. Relationship Between Land Use and Water Quality in a Subtropical River Basin. J. Soc. Technol. Environ. Sci. 2018, 7, 245–261. [Google Scholar] [CrossRef]
  45. Grabińska, B.; Koc, J.; Glińska-Lewczuk, K. Wpływ użytkowania zlewni na zanieczyszczenie wód rzecznych na przykładzie Narwi i jej dopływów. Zesz. Probl. Post. Nauk Roln. 2005, 503, 101–110. [Google Scholar]
  46. Kowalik, T.; Kanownik, W.; Bogdał, A.; Policht-Latawiec, A. Wpływ zmian użytkowania zlewni wyżynnej na kształtowanie jakości wody powierzchniowej. Annu. Set Environ. Prot. 2014, 16, 223–238. [Google Scholar]
  47. Pytka, A.; Jóżwiakowski, K.; Marzec, M.; Gizińska, M.; Sosnowska, B. Ocena wpływu zanieczyszczeń antropogenicznych na jakość wód rzeki Bochotniczanki. Infrastrukt. Ekol. Teren. Wiej. 2013, 3, 15–29. [Google Scholar]
  48. Wolski, P.; Kistowski, M.; Cieszewska, A.; Kaliszuk, E. Landscape structure and spatial planning–Relations and conflicts. In Proceedings of the 3rd International Workshop on Sustainable Land Use Planning, Wageningen, The Netherlands, 5–6 June 2020; pp. 1–11. [Google Scholar]
  49. Nowak, M.J. Restrictions on land use vs. protection of environmental values. Chem. Environ. Biotechnol. 2017, 20, 5–16. [Google Scholar] [CrossRef]
  50. Mickiewicz, P.; Nowak, M.J.; Mickiewicz, B.; Zvirbule, A. Environmental protection and integrated development planning in local spatial policy on the example of Poland. Ann. Univ. Apulensis Ser. Oeconom. 2020, 22, 11–18. [Google Scholar]
  51. Baran-Zgłobicka, B. Środowisko Przyrodnicze w Zarządzaniu Przestrzenią i Rozwojem Lokalnym na Obszarach Wiejskich; Wydawnictwo UMCS: Lublin, Poland, 2017. [Google Scholar]
  52. Kistowski, M. Przyrodnicze uwarunkowania gospodarowania przestrzenią. In Współczesne Uwarunkowania Procesów Zarządzania Przestrzenią w Polsce; Chaberek-Karwacka, G., Ed.; Wydawnictwo UG: Gdańsk, Poland, 2017; pp. 89–118. [Google Scholar]
  53. Kistowski, M. Regionalny Model Zrównoważonego Rozwoju i Ochrony Środowiska Polski a Strategie Rozwoju Województw; Wydawwnictwo UG: Gdańsk, Poland, 2003. [Google Scholar]
Figure 1. Location of studied catchments. 1—Czapelka, 2—Grabar, 3—Sajówka, 4—Mała Bystrzyca, 5—Czarna, 6—Struga, 7—Odnoga, 8—Krynica, 9—Krzywianka, 10—Dopływ z Jez. Brudno, 11—Ciemięga, 12—Świnka bez dopł. spod Kobyłki, 13—Białka, 14—Rów Mokry, 15—Uherka od źródeł do Garki, 16—Gdolanka, 17—Dopływ spod Turki, 18—Dopływ spod Bielin, 19—Dopływ z Zagórnik, 20—Żółkiewka, 21—Wisełka (II), 22—Wisełka (I), 23—Dopływ z Moniatycz, 24—Dopływ spod Kobla, 25—Dopł. spod Dąbrowicy, 26—Czarna Łada do Braszczki, 27—Szpisznica, 28—Sopot, 29—Wieprz do Jacynki, 30—Dopływ ze Starej Wsi, 31—Bużek, 32—Łazowna, 33—Złota Nitka, 34—Lubienia.
Land 10 01318 g001
Figure 2. Land use/land cover types in one of the catchments under study, after [35].
Land 10 01318 g002
Figure 3. Distribution of catchments belonging to the individual clusters. 1—Czapelka, 2—Grabar, 3—Sajówka, 4—Mała Bystrzyca, 5—Czarna, 6—Struga, 7—Odnoga, 8—Krynica, 9—Krzywianka, 10—Dopływ z Jez. Brudno, 11—Ciemięga, 12—Świnka bez dopł. spod Kobyłki, 13—Białka, 14—Rów Mokry, 15—Uherka od źródeł do Garki, 16—Gdolanka, 17—Dopływ spod Turki, 18—Dopływ spod Bielin, 19—Dopływ z Zagórnik, 20—Żółkiewka, 21—Wisełka (II), 22—Wisełka (I), 23—Dopływ z Moniatycz, 24—Dopływ spod Kobla, 25—Dopł. spod Dąbrowicy, 26—Czarna Łada do Braszczki, 27—Szpisznica, 28—Sopot, 29—Wieprz do Jacynki, 30—Dopływ ze Starej Wsi, 31—Bużek, 32—Łazowna, 33—Złota Nitka, 34—Lubienia.
Land 10 01318 g003
Figure 4. Results of the redundancy analysis (RDA) presenting the correlation of river water quality parameters with variables representing land cover categories. LCDI—Land Cover Diversity Index. 1—Phytobenthos, 2—Macrophytes, 3—Water temperature, 4—Total suspended sediment, 5—Dissolved oxygen, 6—BOD5, 7—COD—Mn, 8—Organic carbon, 9—COD—Cr, 10—issolved substances, 11—Sulphates, 12—Chlorides, 13—pH, 14—Total nitrogen, 15—Total phosphorus.
Land 10 01318 g004
Figure 5. A mosaic of land use/land cover in one of the catchments under study, according to [43].
Land 10 01318 g005
Table 1. Reference methods for measurements and assays as part of the monitoring of surface water bodies and groundwater bodies in Poland [33].
IndiceStandardMethodUnit
PhytobenthosPN-EN 13946, PN-EN ISO 5667-1, ISO 5667-3Utermöhl method (sedimentary, microscopic, quantitative and qualitative)Index
MacrobenthosEN 14184Microscopic; computational
quantitative and qualitative
Index
TemperatureResearch procedureTemperature measurement (in situ during sample collection)°C
Total suspended sedimentPN-EN 872Gravimetricmg/L
Dissolved oxygenPN-EN 25813, ISO 5814, ISO 17289ElectrochemicalmgO2/L
BOD5 (five-day biological oxygen demand)PN-EN 1899(1,2)ElectrochemicalmgO2/L
COD—Cr (chemical oxygen demand)PN-ISO 15705SpectrophotometricmgO2/L
COD—Mn (chemical oxygen demand)PN-EN ISO 8467TitrimetricmgO2/L
Total organic carbonPN-EN 1484Infrared spectrophotometrymgC/L
Dissolved substancesPN-EN 15216Gravimetricmg/L
ChloridesISO 15923-1TitrimetricmgCl/L
SulphatesISO 15923-1GravimetricmgSO4/L
pHISO 10523PotentiometricpH
Total nitrogenPN-ISO 7150-1, PN-EN 25663, PN-EN 26777SpectrophotometricmgN/L
Total phosphorusPN-EN ISO 6878SpectrophotometricmgP/L
Table 2. Land cover and land use in the catchments under study.
VariablesMinimumMaximumMedianMeanStandard DeviationVC (%)
Catchment area (ha)111727,28765619544786482
Arable land (%)3.791.645.645.620.547
Meadows and pastures (%)1.932.813.915.17.351
Orchards and plantations (%)0.157.91.05.510.5270
Forests and woodlots (%)3.770.022.226.017.571
Water and wetland areas (%)0.119.41.33.04.1181
Anthropogenic areas (%)1.031.14.05.34.455
Function diversity index0.50.70.60.60.07
Table 3. Descriptive statistics of catchment water parameters.
Index of Water QualityMinimumMaximumMedianMeanStandard DeviationVC (%)
Phytobenthos0.20.80.40.40.130
Macrophytes28.641.336.436.43.08
Water temperature (°C)8.314.510.611.01.412
Total suspended sediment (mg/L)3.256.310.716.614.586
Dissolved oxygen (mgO2/L)3.810.88.48.11.729
BOD5 (mgO2/L)1.434.83.54.04.435
Organic carbon (mgC/L)3.925.49.911.56.051
COD—Cr (mgO2/L)1085.04139.920.952
COD—Mn (mgO2/L)3.324.88.810.15.655
Dissolved substances (mg/L)192.0775.0361.5378.7113.649
Sulphates (mgSO4/L)13.2106.617.633.220.753
Chlorides (mgCl/L)6.9444.733.738.573.7220
pH7.38.37.97.90.23
Total nitrogen (mgN/L)1.011.12.12.61.868
Total phosphorus (mgP/L)0.00.80.20.20.171
Table 4. Relationships between water quality in the catchments under study and quality standards applicable in Poland, according to [38].
Water Quality IndexStandard Class IStandard Class IICatchments in Class ICatchments in Class II
Phytobenthos>0.75>0.5509
Macrophytes>65>5000
Water temperature (°C)----
Total suspended sediment (mg/L)<25<50249
Dissolved oxygen (mgO2/L)>7>5118
BOD5 (mgO2/L)<3<5625
Organic carbon (mgC/L)<10<15178
COD—Cr (mgO2/L)<25<30101
COD—Mn (mgO2/L)<6<12715
Dissolved substances (mg/L)<500<700267
Sulphates (mgSO4/L)<150<250340
Chlorides (mgCl/L)<200<300340
pH6–8.56–9340
Total nitrogen (mgN/L)<5<10331
Total phosphorus (mgP/L)<0.2<0.4228
Table 5. Spearman’s coefficients of correlation between the variables under study.
VariablesArable LandMeadows and PasturesOrchards and PlantationsForestsWater and Wetland AreasAnthropogenic AreasFunction Diversity Index
Phytobenthos−0.100.14−0.09−0.02−0.020.09−0.09
Macrophytes−0.280.48 *−0.180.250.30−0.000.47
Water temperature (°C)0.04−0.21−0.090.05−0.08−0.04−0.11
Total suspended sediment (mg/L)−0.07−0.020.030.120.15−0.180.02
Dissolved oxygen (mgO2/L)0.19−0.210.16−0.12−0.200.09−0.04
BOD5 (mgO2/L)−0.17−0.040.080.150.33−0.10−0.12
Organic carbon (mgC/L)−0.36 *0.39 *−0.380.35 *0.52 *−0.280.28
COD—Cr (mgO2/L)−0.51 *0.52−0.52 *0.47 *0.49 *−0.220.41
COD—Mn (mgO2/L)−0.28 *0.15−0.390.24 *0.48 *−0.35−0.07
Dissolved substances (mg/L)0.430.090.28−0.58 *−0.040.24−0.18
Sulphates (mgSO4/L)0.350.41 *0.21−0.41 *0.080.240.37
Chlorides (mgCl/L)0.48 *0.070.32−0.60 *−0.110.29−0.06
pH0.46 *−0.070.22−0.49 *−0.43 *0.24−0.00
Total nitrogen (mgN/L)0.18−0.040.11−0.08−0.040.01−0.04
Total phosphorus (mgP/L)0.080.05−0.010.07−0.01−0.010.19
* p < 0.05.
Table 6. Basic statistics concerning the land use/land cover clusters and parameters of river water quality.
VariablesCluster (In Brackets Number of Catchments per Cluster)
A (1)B (7)C (3)D (9)E (6)F (1)G (7)
Arable land (%)3.625.553.847.833.920.274.4
Meadows and pastures (%)6.412.620.316.327.86.37.6.
Orchards and plantations (%)0.00.22.72.90.857.94.2
Forests and woodlots (%)69.956.210.827.326.46.98.8
Water and wetland areas (%)19.33.12.51.85.94.00.8
Anthropogenic areas (%)0.92.310.54.25.35.04.2
Function diversity index0.40.60.60.60.60.60.6
Phytobenthos0.30.40.50.40.40.50.4
Macrophytes32.238.035.035.940.034.434.0
Water temperature (°C)13.611.512.011.110.410.612.0
Total suspended sediment (mg/L)26.723.315.312.518.85.314.1
Dissolved oxygen (mgO2/L)4.37.46.76.77.28.38.0
BOD5 (mgO2/L)5.23.63.93.73.93.23.5
Organic carbon (mgC/L)24.811.210.38.413.63.36.8
COD—Cr (mgO2/L)24.712.911.510.916.25.25.8
COD—Mn (mgO2/L)84.447.040.328.645.615.439.4
Dissolved substances (mg/L)340.0268.4503.6338.8567.6306.7439.8
Sulphates (mgSO4/L)24.822.646.234.163.523.739.2
Chlorides (mgCl/L)12.013.237.016.791.516.328.1
pH7.37.6.7.97.77.88.07.8
Total nitrogen (mgN/L)4.61.72.12.22.70.93.1
Total phosphorus (mgP/L)0.2250.10.10.20.20.10.2
Table 7. Structure of land cover within the loess areas of Lublin Province (test area of 28 km2, as in [26]).
Form of Land CoverNumPMPS (ha)MEDPS (ha)PSCoVMSIMPAR (m/ha)
Arable land1519.61.72181.9485
Grassland2721.50.72511.6655
Orchards1740.50.31451.4840
Plantations1550.90.61121.6714
Agricultural wasteland680.90.51291.5733
NumP—total number of patches in the landscape, MPS—average patch size, MEDPS—median patch size, PSCoV—coefficient of variation of patches, MSI—mean shape index, MPAR—mean perimeter area ratio.
Table 8. Impact of types of streams and substrates on water quality (mean values).
Lowland Stream with a Loess or Clayey BedLowland Stream with a Sandy BedStream in an Area Subject to Peat-Forming ProcessesStream in the Valley of a Large Lowland RiverUpland Stream with a Fine-Grained Carbonate Substrate on Loess and Loess-like Rocks
Phytobenthos0.450.450.450.650.48
Macrophytes34.1738.8935.8535.9637.00
Water temperature (°C)11.7410.6512.1010.8011.25
Total suspended sediment (mg/L)10.6319.5319.777.0319.35
Dissolved oxygen (mgO2/L)7.918.315.477.678.90
BOD5 (mgO2/L)3.504.113.803.233.35
Organic carbon (mgC/L)7.0410.8513.295.504.90
COD—Cr (mgO2/L)6.4612.3315.528.226.51
COD—Mn (mgO2/L)40.1438.0650.5514.8022.65
Dissolved substances (mg/L)479.29404.87368.08306.23416.00
Sulphates (mgSO4/L)44.6643.3836.2828.7320.85
Chlorides (mgCl/L)29.3057.0522.5613.8320.90
pH7.817.787.667.908.25
Total nitrogen (mgN/L)3.012.342.421.482.43
Total phosphorus (mgP/L)0.180.190.250.070.21
Table 9. Spearman’s coefficients of correlation between water quality indices and selected catchment parameters.
IndicesCatchment Area (ha)River Network Density (km·km−2)Road Network Density (km·km−2)
Phytobenthos−0.13−0.250.14
Macrophytes0.06−0.000.27
Water temperature (°C)0.030.17−0.03
Total suspended sediment (mg/L)−0.070.12−0.26
Dissolved oxygen (mgO2/L)0.270.080.37
BOD5 (mgO2/L)−0.070.00−0.38
Organic carbon (mgC/L)−0.31−0.12−0.23
COD—Cr (mgO2/L)−0.22−0.09−0.15
COD—Mn (mgO2/L)−0.37−0.22−0.27
Dissolved substances (mg/L)0.190.14−0.21
Sulphates (mgSO4/L)0.170.12−0.21
Chlorides (mgCl/L)0.110.28−0.09
pH0.300.17−0.11
Total nitrogen (mgN/L)0.14−0.05−0.00
Total phosphorus (mgP/L)0.160.260.04
Publisher’s Note: MDPI stays neutral with regard to jurisdictional claims in published maps and institutional affiliations.

