1. Introduction
Urbanization is one of the main drivers behind land use transformation around the world, and thus also for the decline in ecosystem services (ESs) [
1]. Russia has a high level of urbanization. More than 70% of the population live in urban settlements, namely 1117 towns and cities of various sizes [
2]. More specifically, 23% (or about 34 million people) reside in cities with over one million inhabitants, where over 30% of the national GDP is generated. Moscow, which is now Europe’s largest city and the only megacity in Russia, generates around 15% of the national GDP.
Urban expansion generally occurs when (suburban) natural vegetated lands are converted into impermeable surfaces, thereby disturbing natural processes and the functioning of ecosystems [
3,
4,
5]. Natural habitats are destroyed and fragmented not only by the construction of residential or commercial sites but also by ancillary infrastructure and transport networks [
6,
7,
8]. Russia’s largest cities are no exception. Between 2005 and 2019, the area of urbanized land in Russia increased from 78,000 to 84,000 km
2 (National report on the use and state of land categories in the Russian Federation in 2005 and 2019). In the same period, many of the most populated cities also expanded spatially. For instance, Moscow grew by 1480 km
2 in 2012, Ekaterinburg by 650 km
2 in 2015, and the urban precincts of Volgograd expanded by 290 km
2 in 2015.
Some of the main drivers of urban expansion are political decision-making and special federal programs. In particular, the national project “Housing and Urban Environment” (2018–2024) foresees the expansion of residential areas in Moscow and Saint Petersburg as well as other large cities. In 2020, around 25.5% of the total volume of newly commissioned housing in Russian cities was provided by the 16 largest cities (with a population of over one million people) (
Table 1). It is the aim of the “Housing and Urban Environment” project that both new and old urban areas should provide all the requirements of a comfortable urban environment, which should include large green areas in built-up zones and well-established recreational areas. Consideration of these two factors is promoting an urban pattern of multistory buildings and artificially created green areas in the largest cities.
Clearly, any expansion in urban development will provoke contradictory opinions and social conflict between the local authorities, citizens, and ecological activists [
8]. This is also true of Russia’s cities, in particular Moscow [
9]. It is important to note that due to favorable natural conditions and historical tradition, the country’s largest cities are rather green. A network of green areas since the 1930s was incorporated into the first Soviet urban planning system, the so-called General Plans (or Genplan), an official project document that forms the basis for urban planning, reconstruction, and development in many Russian cities. While this extensive ecological framework is greatly appreciated by local residents, the quality of green spaces is often severely undermined by pollution. According to national standards, about nine million people (or 6% of the country’s population) live in cities with a high level of air pollution. The use of chemical substances in wintertime to remove snow and ice from roads also damages urban vegetation [
10].
For all these reasons, the preservation of green areas is a hot topic amongst decision-makers and citizens in the largest cities. Clearly, there is a need for new approaches to integrate the value of green areas into urban planning [
11]. In recent years, the concept of urban ecosystem services has become an important instrument in decision-making processes of urban spatial development or socio-economic sustainability [
12,
13,
14].
In post-Soviet Russia, the study of urban ESs and biodiversity is still at a relatively early stage despite previous advances in urban environmental science [
9]. The very few recent publications on the topic have generally focused on various individual aspects. The first systematic attempt to assess urban ecosystem services in Russia was undertaken as a part of the TEEB-Russia Project (
http://teeb.biodiversity.ru/en/; accessed on 20 October 2020) [
9].
In this article, we present the results of a high-resolution survey of green infrastructure (GI) in Russia’s 16 largest cities before discussing the connection between GI and the urban climate as well as changes in urban GI in recent years. Subsequently, we present and discuss the results of our physical evaluation of selected ESs as well as the extent to which city residents are provided with ESs. Finally, we discuss the main methodological problems of ES accounting in Russia’s cities and propose some initial approaches on how to integrate urban ESs into the process of urban planning against a backdrop of urbanization.
2. Materials and Methods
2.1. General Approaches to Assessing Urban Green Infrastructure and Ecosystem Services
Ecosystem services are understood as all kinds of benefits, both tangible and intangible, that humans obtain from ecosystems and their resident flora and fauna. Many classifications of urban ESs found in the literature (for example [
15,
16,
17,
18]) are based on existing systems specified by the Millennium Ecosystem Assessment [
11,
19,
20]. These classifications encompass a wide variety of ESs, which can be calculated by the direct quantitative evaluation of biophysical factors (assuming that data on supplied, consumed, and demanded ESs are detailed in statistical reports) or the indirect quantitative evaluation of biophysical factors. The latter is applied when direct statistical data is lacking. In this case, cartographic data and previous studies can be used to evaluate selected indicators based on simple calculations or GIS modelling. Any assessment of carbon storage, biological productivity and diversity, or the accurate evaluation of air and water purification requires continuous periodical statistical data and monitoring, which is generally unavailable in Russia at the urban level. For this reason, in our study, we only used indirect assessment methods to assess a limited number of ESs [
9].
In the TEEB-Russia project, ESs are assessed as provided (potential), demanded, and consumed [
21,
22,
23]. The provided ES is a volume produced by ecosystems regardless of the presence (or absence) of consumers. The demanded ES is the amount needed to meet the demands of the population and regional economy. The consumed ES is the ES yield, which is materially or immaterially used by the population or from which people derive current benefits. The ratio between the demanded/consumed volumes indicates the level of ES use in the city and the extent to which the needs of the local population are satisfied.
Urban ecosystems have been defined as the vegetated space (which may include water bodies) in areas where a significant proportion of land is built-up or sealed [
10,
12,
24] and where population density is high [
25]. The concept of green infrastructure is closely related to that of the “urban ecological network” [
26] popular in national urban planning schools of the 1980s. Green infrastructure, however, encompasses a wider range and thus volume of elements. Despite its frequent usage by scholars and journalists, the term “ecological network” is not legally recognized in Russia. To characterize urban vegetated areas, national schools of urban planning traditionally use the term “green plantings”, which are defined by GOST 28329-89 as “a complex of tree, shrub and herbaceous vegetation in a specific area”. This definition does not consider the main emergent features of the ecological network, in particular its integrity, connectivity, and hierarchy of green elements, which ensure its function of stabilizing the local environment. Unlike green plantings, ecosystem services are not specified in Russian planning documents; the term is not even used in General Plans. However, the term “ecological functions”, which sometimes coincides with ecosystem services, is often mentioned. In our research, urban ESs refer to services provided by ecosystems that are situated within the administrative boundaries of the city. For our analysis, we used the administrative boundaries as indicated by the OpenStreetMap portal.
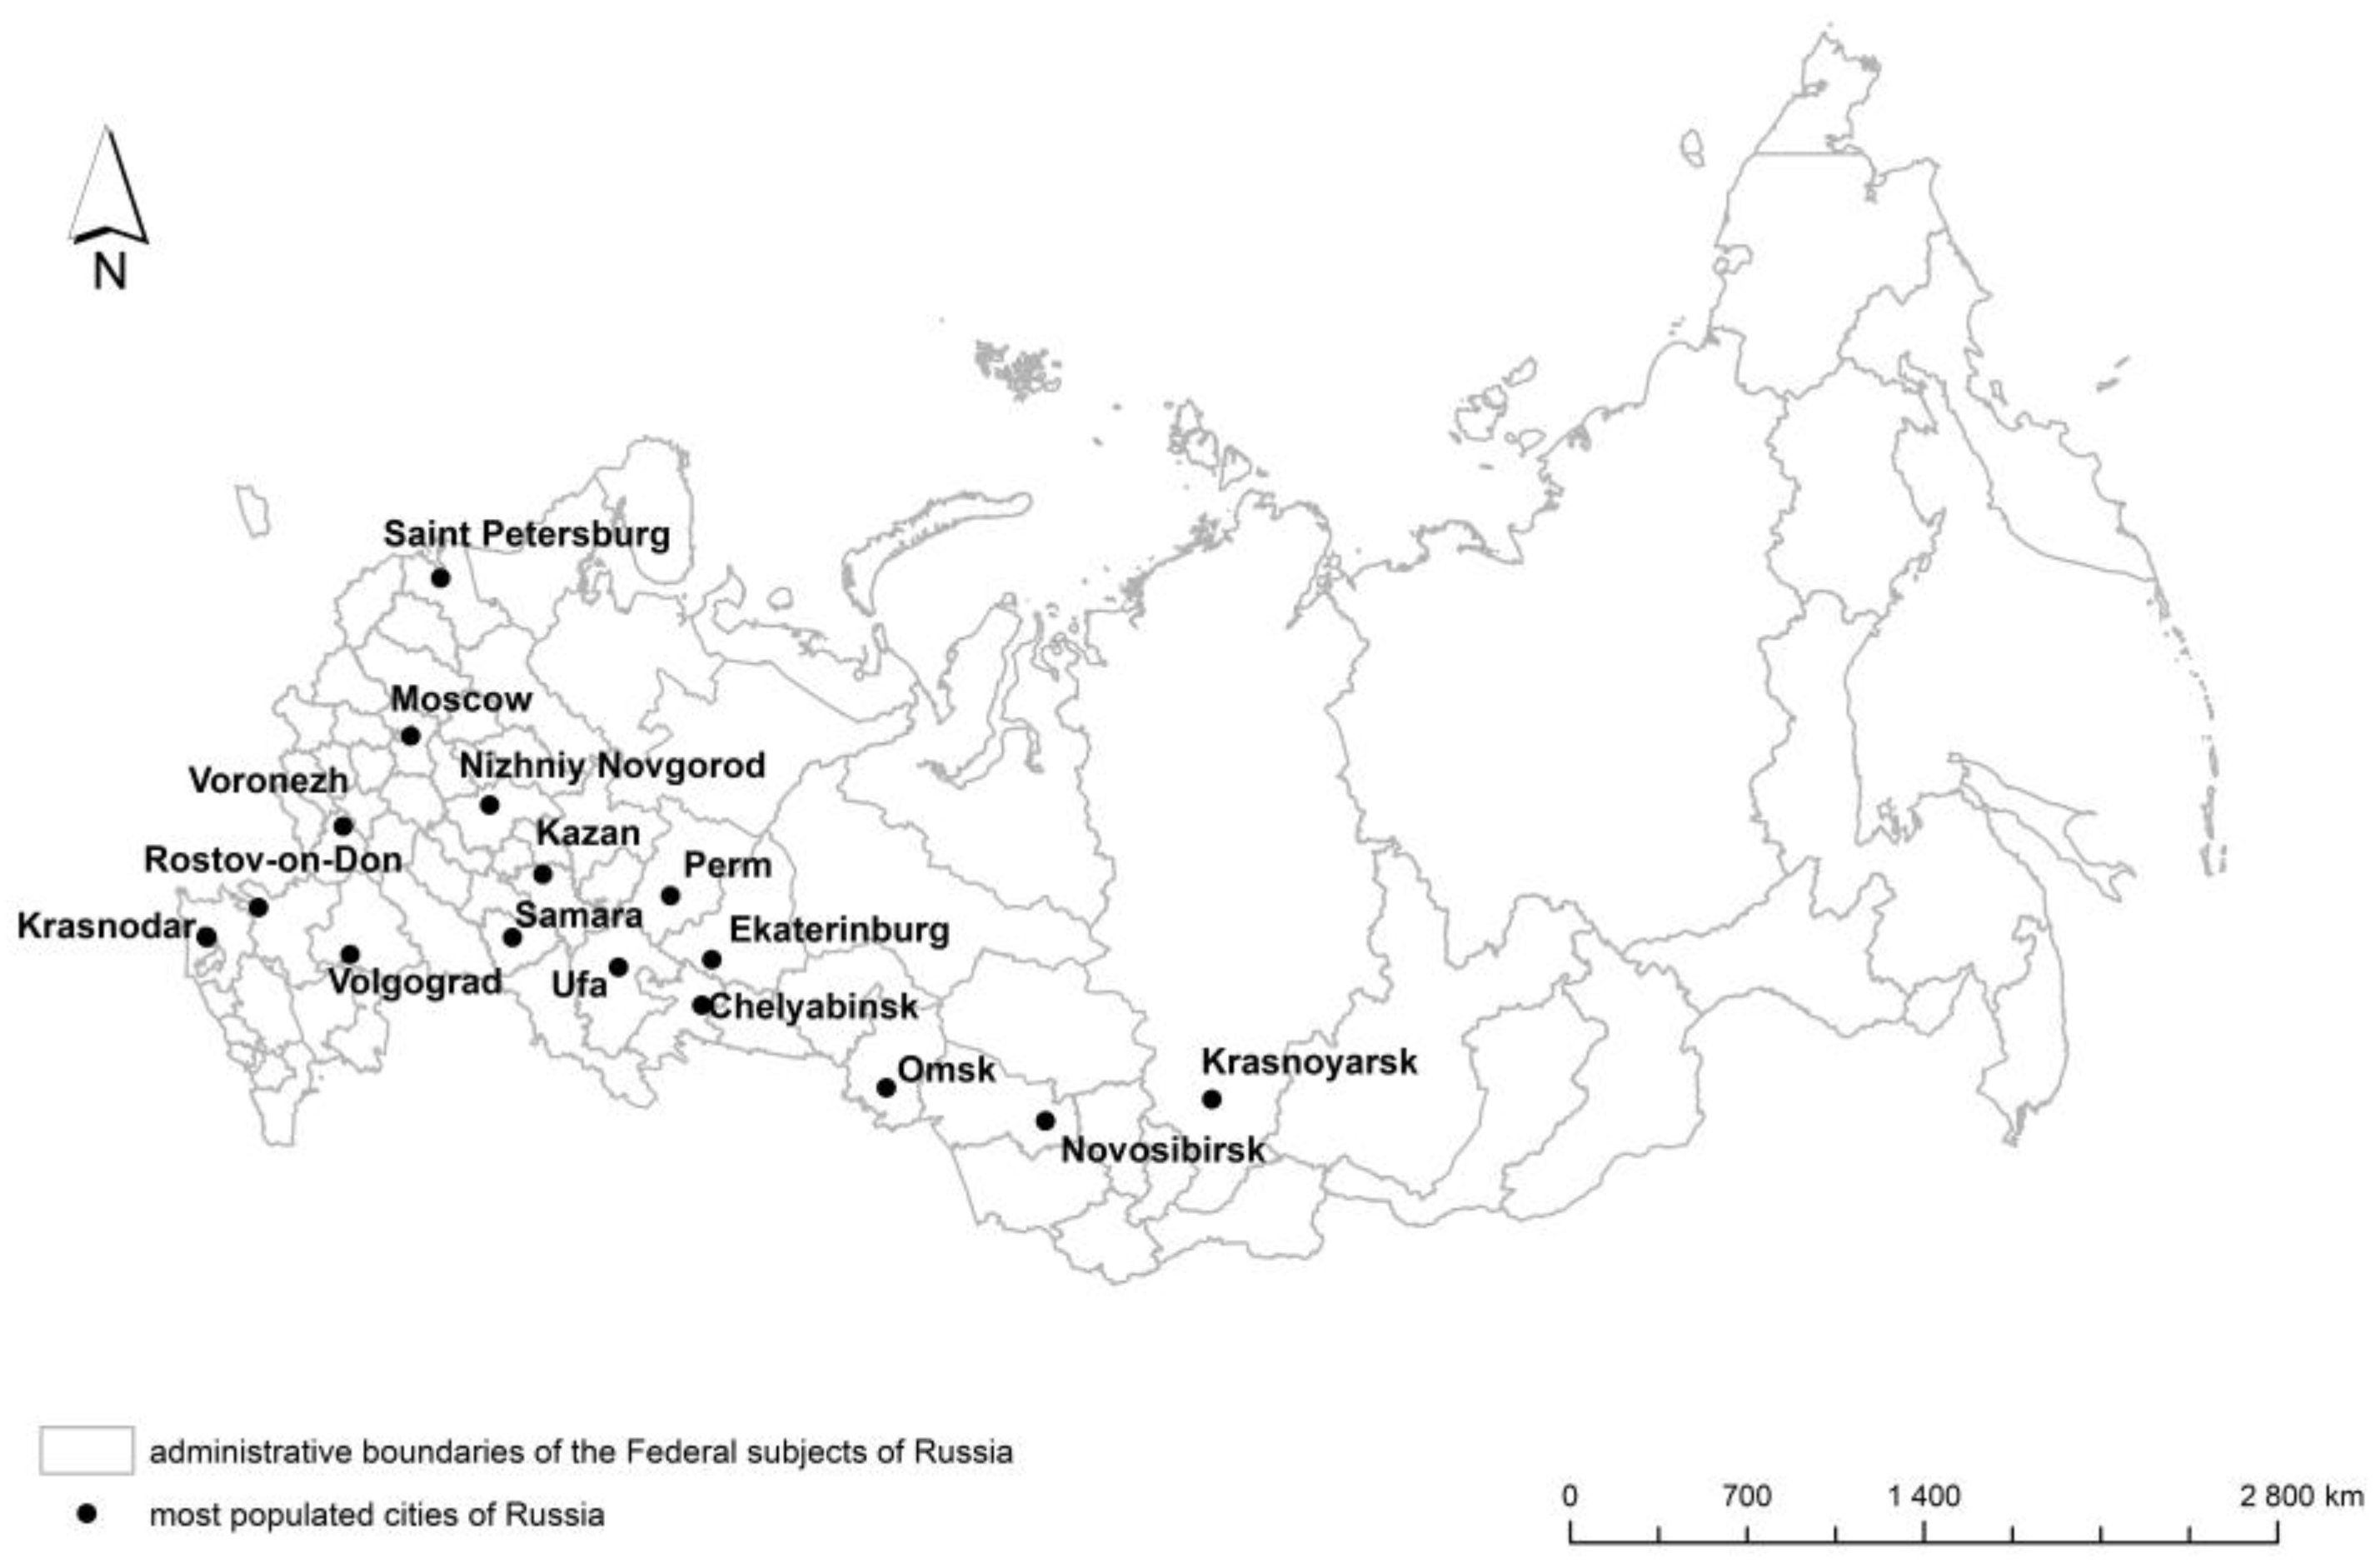
Our case studies are of Russia’s 16 largest cities with populations over one million (
Figure 1), and which have very different climates and different rates of population growth and social and economic development (
Table 1). According to [
27], the majority of the largest cities (Saint Petersburg, Ekaterinburg, Nizhniy Novgorod, Samara, Omsk, Chelyabinsk, Rostov-on-Don, Krasnoyarsk) are referred to the most industrial group with the highest index of anthropogenic impact (IAI) and the severest water pollution. Moscow is not among the most industrial cities, but it also has the highest IAI and air pollution. Other cities (Kazan, Ufa, Volgograd, Perm, Voronezh) have medium values of IAI and are mostly affected by waste accumulation. Krasnodar is the only city with a population over one million people that has a low IAI. The GNP values and functional specialization of the studied cities vary greatly. These factors obviously influence the GI state and, consequently, ESs. These particular correlations ought to be considered in further studies.
We conducted a correlation analysis between natural conditions, the urbanization rate, and GI quantity. We also analyzed the GI quantity and composition dynamics for the top five cities, since changes to GI are directly connected to the ES supply.
Rosstat (the Federal State Statistics Service) provides open data for ES evaluation on the urban okrugs, a particular type of municipality that includes two to three settlements within a contiguous territory. However, the boundaries of urban okrugs do not always match city boundaries. In some regions of Russia with a high level of urbanization and industrial development (for example, in the Urals), these differences can be drastic.
There are specific difficulties in assessing the GI and ESs at the city level. Firstly, this local level of research requires higher accuracy and detail than research conducted at the regional level. Secondly, it is almost impossible to make conclusions on urban ESs in the country as a whole based on the results of a few cities; instead, it is necessary to study a significant number of case studies. Unfortunately, research at the local level is quite complex and time-consuming. Moreover, the quality and quantity of the required base data for the calculations will vary depending on the city or may even be entirely missing. For these reasons, we decided to assess only those ESs that could be estimated from our own modeling or using open official data. GI parameters are a valuable asset for ES assessment, since in the urban environment, it is such green elements that provide all ecosystem services. The following assessments are mostly based on the GI parameters described in the previous section.
2.2. Methods of GI Composition Assessment
We examined three main types of urban GI: tree vegetation, non-tree vegetation, and agricultural land.
The general inventory of GI was realized in two steps. Firstly, we used images taken on a cloudless summer day of the Landsat 5, 7, and 8 series for the years 2000–2020 with a spatial resolution of 30 m. The selected images were from the period 30 May to 3 September. These were used to create a Normalized Difference Vegetation Index (NDVI) raster in the ArcMap 10.3 program. Subsequently, a supervised classification was conducted to distinguish two classes of land cover: (1) non-vegetated surface (NDVI = 0.18–0.30) and (2) vegetated surface (NDVI > 0.30). NDVI values for dense/healthy tree vegetation, which is the most valuable for ESs [
23], are usually quite high. In our case, the diapason for this type of vegetation was 0.35–0.50.
In the second stage, we made use of spatial data on tree cover taken from the “Global Forest Change” website of Maryland University. This data enabled us to verify our tree vegetation raster for the various cities, which are situated in different climate zones. In some cases (particularly cities in the steppe zone), NDVI data was insufficient to create an inventory of all green infrastructure due to the diverse condition of agricultural lands, which are the main providers of the food provisioning ESs.
We extracted spatial data from OpenStreetMap (OSM) by selecting “farmland” categories from the OSM “landuse” key. According to the definitions of OSM key elements, “farmland” is an area used for tillage, including croplands, pastures, and orchards, etc. We extracted this selected data and added it as agricultural lands to the maps, defined as a unique value in the legend, and subtracted the area from the total non-tree vegetation area. The verification of these OSM shapes using a high-resolution “Base map” in ArcGIS 10.3 showed that the OSM “farmland” category did not capture all agricultural lands in Rostov-on-Don and Samara. For this reason, all the missing polygons were defined manually through visual inspection, supplemented by land use data from the open geoportal Wikimapia. The maps and materials created on this basis were used to establish our inventory of ecosystems that perform services.
The transformation in GI (share of green area within the city borders) and composition (the percentage of tree vegetation, non-tree vegetation, and agricultural lands) during the period 2000–2020 was assessed by comparing the inventory results for these years using the Overlay function.
Within the TEEB-Russia project, we have already assessed the transformation of GI quantity and composition in all 16 cities for the period 2000–2016; however, only a few cities displayed any significant changes in this period. We updated our results from TEEB-Russia [
28] for the sake of this study. The update concerned the investigated period and the studied area. For this publication, we analyzed the GI transformation between 2000 and 2020 for only the five largest cities, namely Moscow, Saint Petersburg, Novosibirsk, Ekaterinburg, and Nizhniy Novgorod, because our previous studies revealed some significant changes in green area (in general, most cities gained or lost less than 1% of green area over 16 years).
2.3. Methods of ES Assessment
Ecosystem assets supply ESs and are defined as “contiguous spaces of a specific ecosystem type characterized by a distinct set of biotic and abiotic components and their interactions” [
29]. Due to the lack of data on the quality of urban ecosystems, in our assessment of the 16 largest cities, we only used indicators of ecosystem assets area described in the previous section:
Area of urban tree cover derived from the map of [
30];
Area of non-tree cover derived from NDVI and classified Landsat Images;
Area of agricultural land, derived from OpenStreetMap data.
In this way we could calculate the area of these GI types and, according to the valuation method presented in
Table 2, derive the values of the provided ES volumes. In our work, we assume that the volume of ESs is determined by the efficient area of GI. For each ES, a different green area is considered efficient, i.e., capable of efficiently performing the specific service. For example, we assumed that food provisioning is mostly performed by agricultural lands, heat mitigation by large forest massifs, etc. As there are no freely available statistics for a full assessment of these ecosystem services in Russia, we used cartographic modeling. The only exception was food provisioning, for which we partly used statistical data on the annual yield and urban demand. Heat mitigation is usually assessed by monitoring near-surface temperatures or by modeling surface temperatures by the means of thermal images. Due to the lack of meteorological data for most areas of the cities, we assessed this service by calculating the area of GI that can be potentially used for heat mitigation, i.e., green massifs of tree vegetation of size 500 ha or more. Finally, the ES of daily and weekend recreation was estimated according to the recreational capacity of GI and its availability to local residents.
2.3.1. Removal of Air Pollution
Generally, the service of air purification is assessed using data on the tree absorption potential. We adopted the method suggested by [
32,
33] for Canadian and American cities. In those studies, the authors made use of the iTree software application to calculate the absorbed volume of pollutants by trees. Since there are no examples for Russian vegetation in the database, we applied the results of [
32,
33] for Canadian and American vegetation to similar forms of vegetation in Russia. In particular, [
32,
33] assessed the volume of gaseous pollutants removed by urban woodland, regardless of the proximity to roads.
For the current study, we assessed the ES volume of pollutant removal provided by tree vegetation using the forest type area and the related average value of air pollutant removal for each city. Further, we assumed that all woodland inside one city belongs to one corresponding forest type. Therefore, the provided volume (i.e., the amount of pollutants that can be absorbed by all urban trees) was calculated by multiplying the area of tree cover by the average value of air pollutant removal indicated in
Table 3.
The demanded ES volume is simply the total emissions from automobiles in the city. Data on vehicle emissions was taken from the annual report issued by the Federal Service for Hydrometeorology and Environmental Monitoring of Russia (Rosgidromet) [
34].
The consumed volume is equal to the amount of pollutants that trees actually absorb. As will be shown below, the absorption capacity of trees (provided ES) is lower than the pollution emissions (demanded ESs) in all investigated cities; therefore, in all cases, the consumed volume is equal to the provided volume, i.e., the absorption capacity is fully used. The ratio between the demanded and provided ES volume indicates the extent to which a population’s needs for this ES are satisfied.
Compared to automobiles, emissions from point sources present a smaller share of total emissions in Russia’s most populated cities. To mitigate the negative impact of industrial zones on the environment and human health, special sanitary buffers are created around industrial areas. These must be of sufficient size to ensure that chemical, biological, and physical air pollution does not exceed established safety guidelines. Regarding industries classified in danger categories I and II, buffers must act to decrease concentration values to an acceptable level of health risk. In this study, we adopted the 300 m buffer (danger class III), under the assumption that the most populated cities do not have many dangerous industries within their borders. While the Sanitary Norms and Regulations of Russia (SanPin) [
35] do not elaborate on the type of vegetation inside the buffers, it is stated that they must decrease the negative impact on the environment (including chemical and physical pollution), present a barrier between residential and industrial areas, absorb pollutants, and regulate the microclimate. In this study, we only considered the extent of woodland inside the buffer, as this is the most effective type of vegetation to mitigate negative chemical and physical impacts and to purify the air. Specifically, we selected all areas in the OSM land-use layer with the tag “industrial” and created merged buffers of a width of 300 m around these. Then, we calculated the area of tree vegetation inside these buffers and multiplied it by the values from
Table 3 to obtain the provided ES volume.
At this stage, the demanded volume for the total emissions from point sources inside the city was set at the same level as vehicle pollution (the data was also taken from the Rosgidromet report). This assumption can be justified by the fact that there is no freely available geospatial data on identified point sources and emissions volume in Russia. This lack of information makes it impossible to calculate the demanded ES volume for each industrial area individually. In fact, green infrastructure inside the sanitary buffers is not required to remove all air pollutants but merely to decrease the level to the maximum permissible concentration (MPC).
2.3.2. Urban Microclimate Regulation
Urban green infrastructure plays a crucial role in regulating the urban microclimate, particularly in reducing the heat island effect [
36,
37]. An urban heat island is a built-up area with higher temperatures than nearby open space. This difference in temperatures is caused by a specific heat exchange between the atmosphere and the built-up area [
18]. The intensity of an urban heat island depends on local meteorological factors and the ratio between built-up and unsealed green areas in the urban land-use system [
13]. A case study of Berlin showed that large elements of green infrastructure have a more efficient cooling effect on the surrounding area than small elements [
38]. Specifically, the temperature in the center of a large green element (>500 ha) is 5 °C lower than in adjacent territories (ibid.). The cooling effect in Moscow ranges from −4.3 to +0.3 °C (with an average of −1.3 °C) [
39]. Depending on the size of the green element, the area benefiting from the cooling effect may vary between 500 and 1500 m [
14,
31].
Assuming that in cities with similar geographical features, large green elements (>500 ha) perform the most efficient cooling effect at a distance up to 1500 m, we determined the provided ES volume as the average area cooled by parks. Assuming a near circular form for the cooled area, we calculated the area using the following equation: S3 = S1 + S2, where S1 is 500 ha, S2 is the cooled area, and S3 is the total area of park and the area that it cools. The resulting sum of a park’s area and its cooled area is 1893 ha. This is 3.8 times bigger than the park itself. We took this value as a coefficient to calculate the nominal area influenced by similar parks and their tree vegetation in each city.
The demanded ES volume is simply the urban area (including the area of tree cover).
2.3.3. Food Production
ES volume provided by green infrastructure is expressed as an indirect indicator, namely the gross yield of household croplands during the year. Typical cultivated crops are potatoes and other vegetables and fruits. Drawing on official statistical data for the municipalities, we additionally calculated the share of croplands and permanent croplands provided by the total urban area.
Households mostly grow potatoes and other vegetables as well as fruits for trade or private use. According to the recommendations of the World Health Organization, a healthy diet should include 400 g of fruits and vegetables every day (in addition to potatoes and other root vegetables). Considering that this recommendation also includes crops that cannot be cultivated in the temperate zone, such as bananas, oranges, grapefruits, etc., we halved this norm to 200 g/per day (or 73 kg/per year) to calculate the demanded volume. According to recommendations of the Ministry of Health of the Russian Federation, the annual rational norm of potato is 90 kg/per year. Thus, a total standard value for vegetable, fruits, and potato consumption can be set at 163 kg/per year. The demanded volume was calculated by multiplying this value by the total population of a city.
2.3.4. Recreational Services
ES volume provided by green infrastructure is here calculated as the maximum permissible number of people who can simultaneously and comfortably visit an element of urban green infrastructure for recreational walking. Our assessment was done in several stages. First, it was necessary to define the types of green infrastructure suitable for recreation. Here, we selected elements from the following OSM categories: “wood”, “forest”, “orchard”, “grass”, “meadow”, “village_green”, “recreation_ground”, “garden”, “park”, “allotments”, and “cemetery”. Generally, the borders of these elements correspond with the outlines of green infrastructure we obtained from a classified NDVI image and Hansen’s tree-cover raster, thus proving their relevance. Areas suitable for recreation were divided into two categories: protected areas (PAs) and other recreational GI.
The provided ES of mass weekend recreation was estimated as the maximum permissible recreational carrying capacity of PAs and other GI. For Pas, we adopted minimum estimates of the permissible recreational load of 2 per/ha and for other GI medium estimates of 50 per/ha [
5]. The estimate of the demanded ES volume was based on the Moscow Park standard recommended number of simultaneous park visitors, namely 5% of the urban population. The provided volume of the ES of daily recreation was estimated as the proportion of the city’s residential zone (from OSM) that has GI within an 800 m buffer, i.e., the standard distance of a 10-min walk (Accessible Natural Greenspace Standard - ANGSt) [
40]. The demanded volume is 100%, since the ideal situation implies that all residents have a green zone within walking distance.
2.3.5. Indicators of the Urbanization Rate and GI
To determine the influence of urbanization and city development on the GI area and ES volume, we assessed the urbanization rate using four indicators:
Percentage ratios of urban area occupied by tree vegetation and non-tree vegetation;
Percentage transformation of GI composition in the period 2000–2020;
Percentage change in the urban population;
Percentage change in built-up area.
The data for the first two parameters were obtained by modeling in ArcGIS with the use of remote sensing (Landsat images, Hansen’s tree-cover data, OSM materials). The latter two indicators were obtained from official statistical data on the Russian population and land use, including the reports on the national census [
10], and use and condition of the land (The Federal Service for State Registration, Cadastre and Cartography—Rosreestr).
3. Results
3.1. Composition of Green Infrastructure
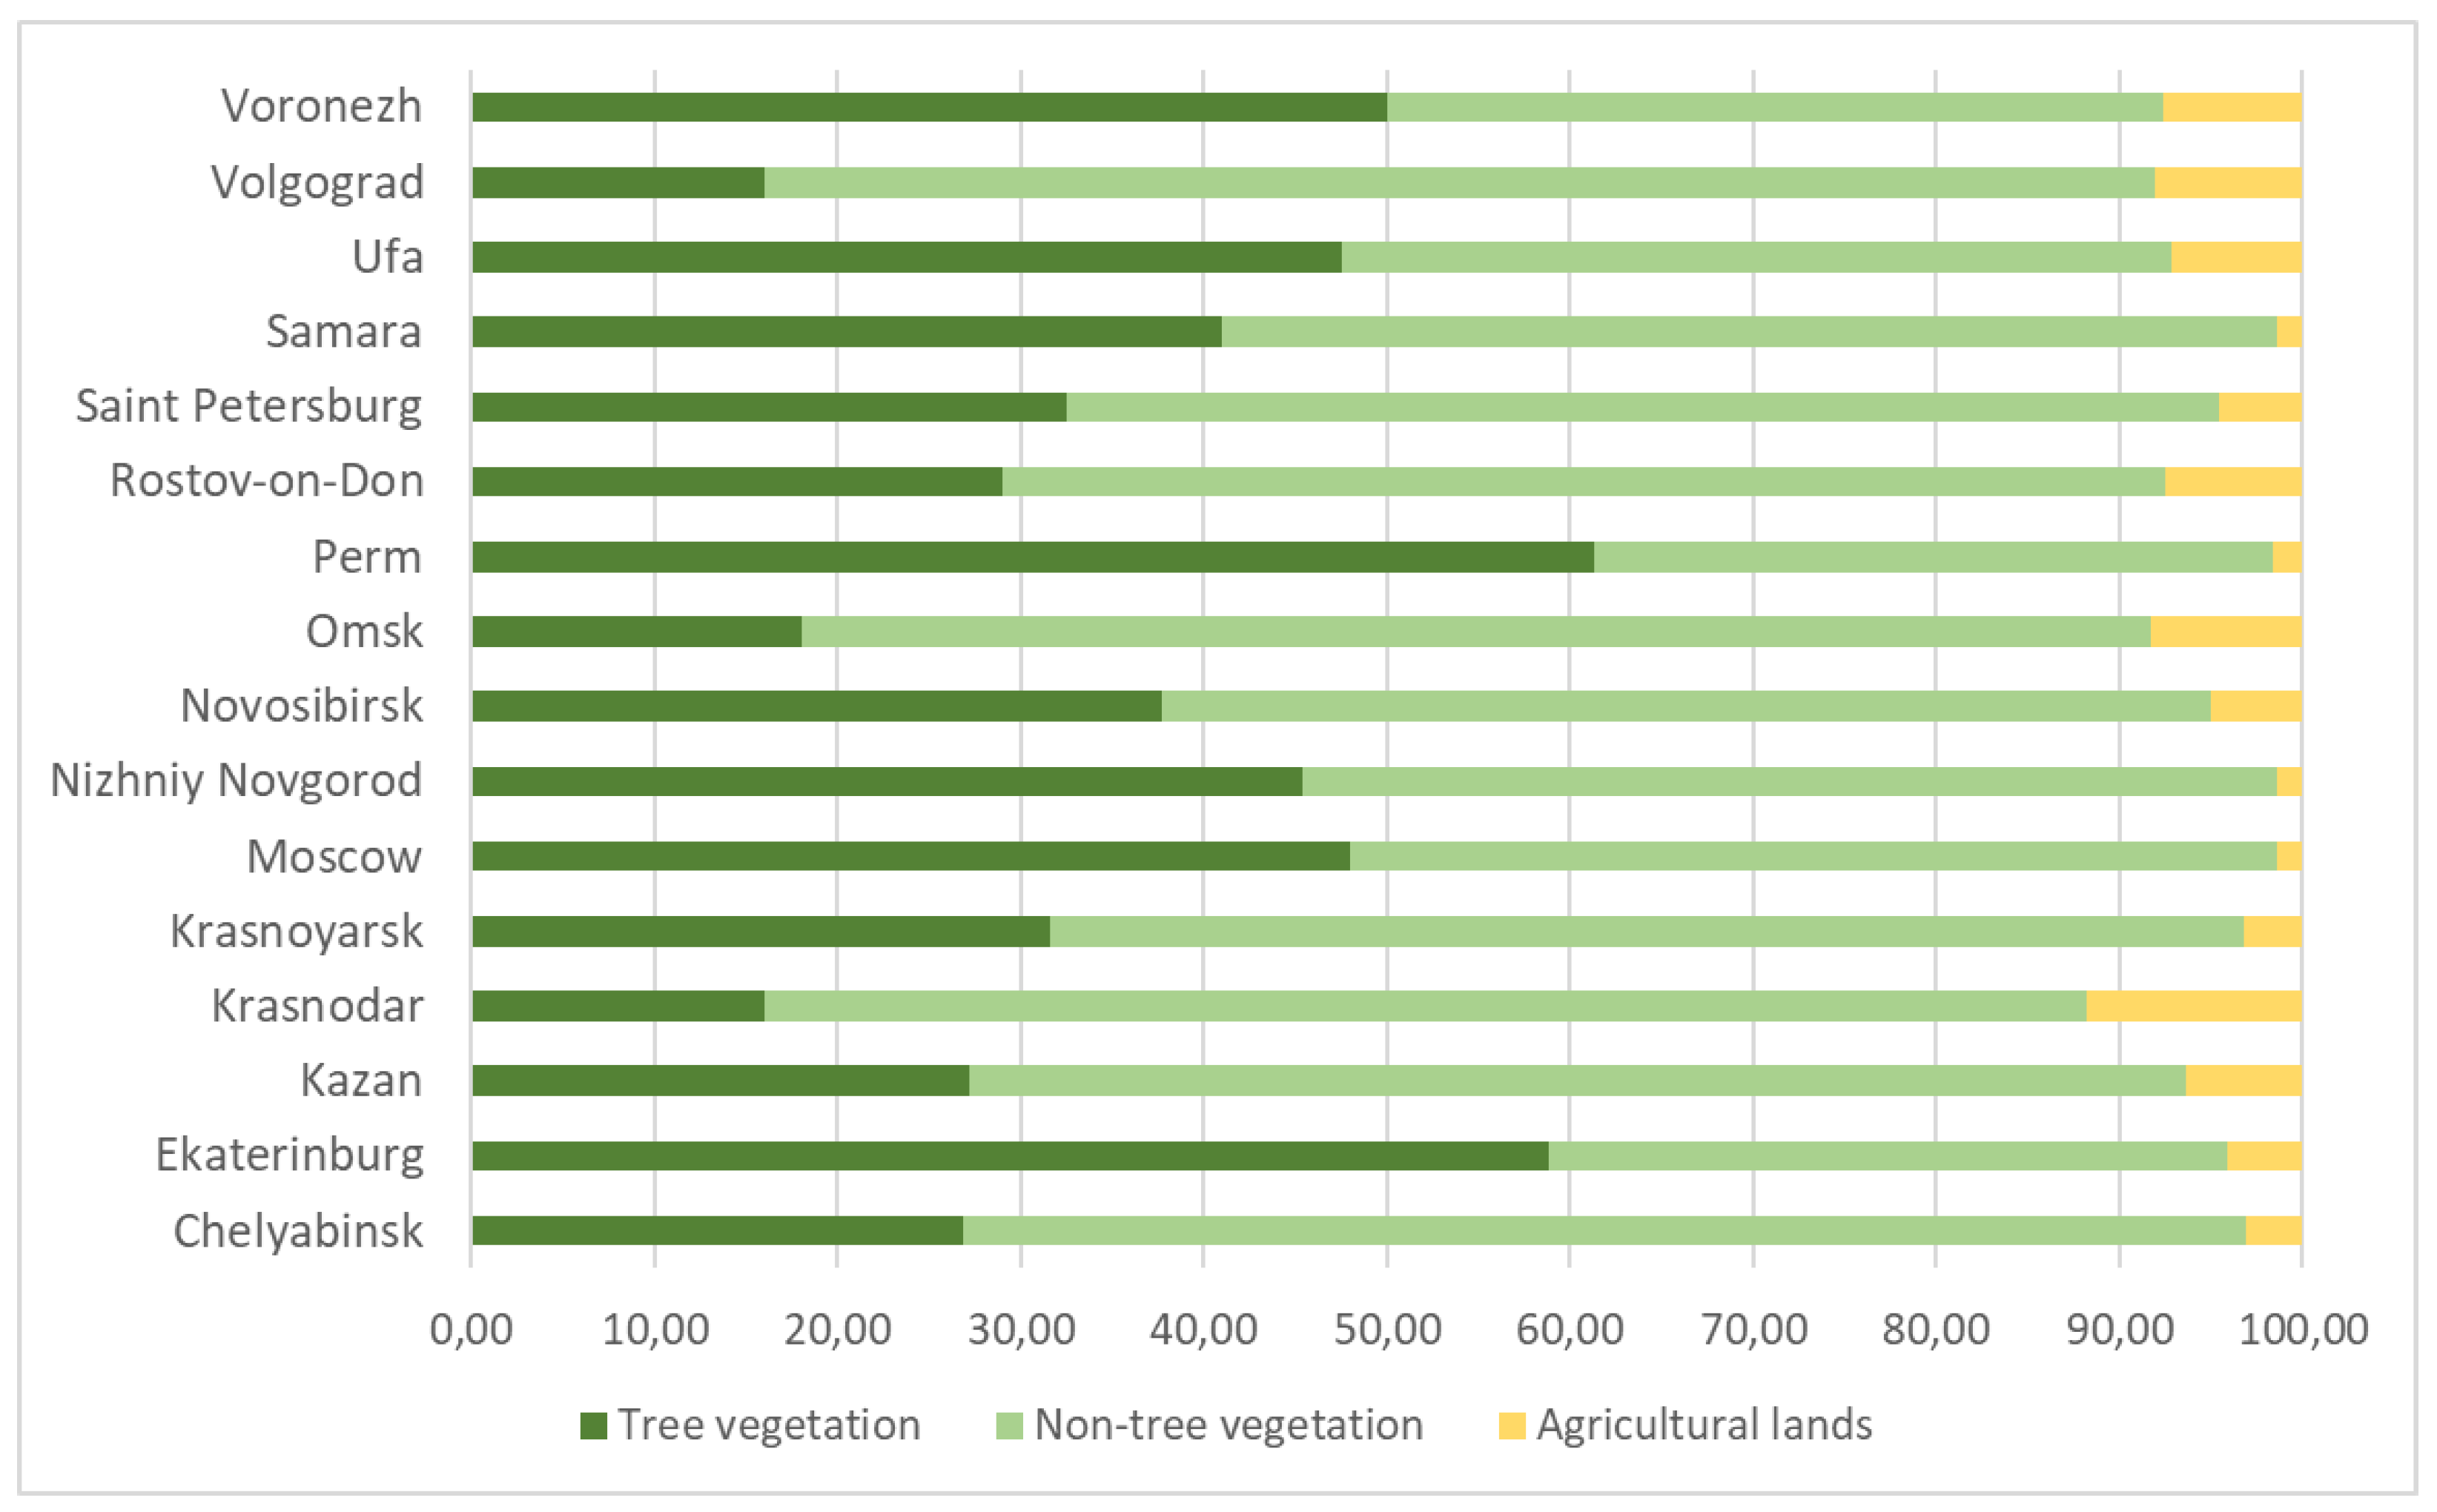
The main features of green infrastructure in Russia’s most populated cities are shown in
Table 4. Tree vegetation of varying density makes up 16% to 61% of the total expanse of green infrastructure. The cities Omsk and Volgograd, located in the steppe zone, have the smallest share of tree cover at 18% and 16%, respectively, while cities of the forest zone, such as Ekaterinburg and Perm, have the most tree cover at 58.8% and 61.3%, respectively. (
Figure 2). Although Voronezh is situated in an ecological zone with climate conditions similar to that of Omsk and Volgograd, its tree cover is about two times greater. The same disparity can be seen when comparing the lower extent of tree vegetation of Kazan with that of Perm and Ekaterinburg, which have similarly favorable climate conditions. Although Krasnoyarsk and Rostov-on-Don lie in different ecological zones, their extent of tree cover is similar. Our analysis showed that cities in the steppe zones often incorporate large forests (both natural and artificial) outside the main urban core into the administrative borders, generally to be used for recreation. In contrast, areas of woodland in the forest zone are usually not incorporated within the city.
Of course, woodland is not the only element of urban GI, which encompasses other unsealed areas including farmland.
According to the General Plans for urban development, GI per capita varies from 4 to 135 m2, depending on the city and district. The lowest figures are found in Chelyabinsk (2.1–5.8 m2/per capita), Perm (4.0–10.0), Rostov-on-Don (6.7–10.0), and Volgograd (10.0), with the highest figures in Ekaterinburg (38.6) and Novosibirsk (88.0–135.0). Our research shows that three of the 16 cities have less than 100 m2 of green infrastructure per capita; seven cities have about 100–200 m2/per capita and six cities have more than 200 m2 of GI per capita. If we consider that not all tree vegetation is captured in standard assessments, the actual per capita values will be much greater.
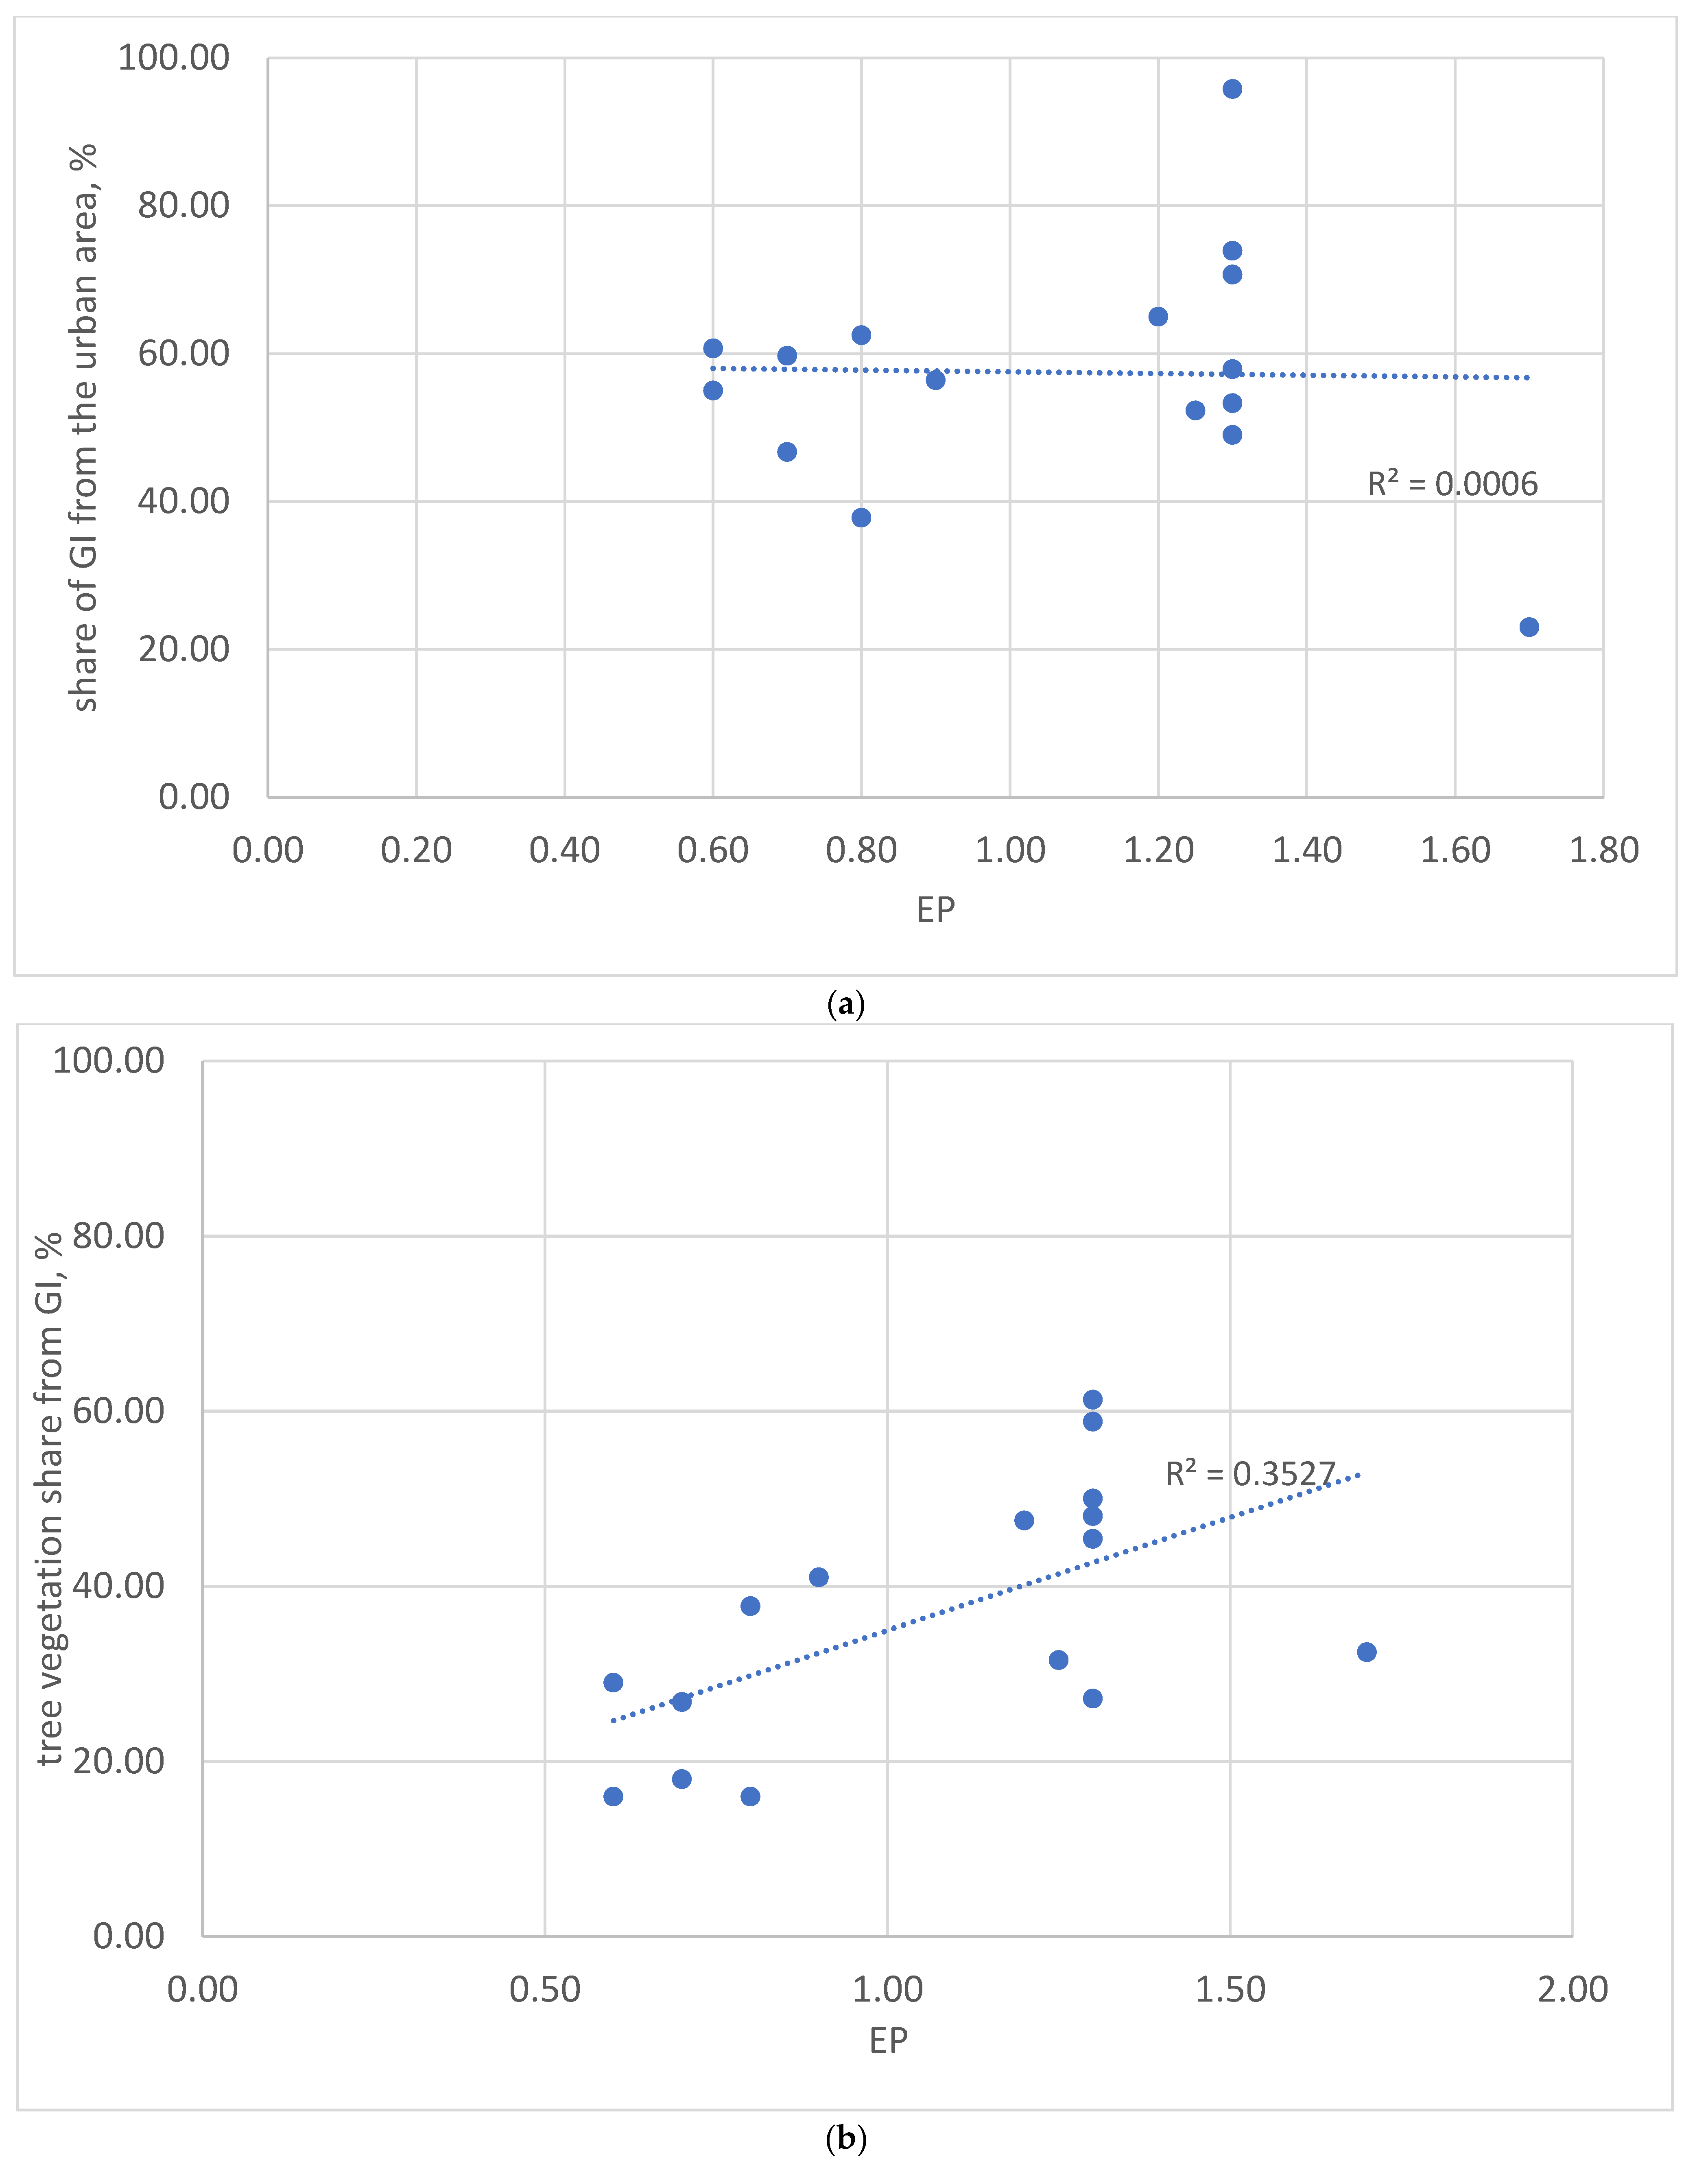
For our study, we also examined the relationship between the city’s GI and the local climate (
Figure 3). To describe climatic conditions, we used the Evaporation Precipitation Index (EP), which is a ratio between the average annual precipitation and evaporation. In general, values above 1 are more favorable for vegetation while values below 1 imply a harsh growing environment.
As no correlation was found between EP and the share of GI from total urban area (
Figure 3a), we may assume that climate does not play a decisive role in determining the total GI area. While there is a tendency for cities with EP < 1 (steppe and forest-steppe cities, such as Omsk, Samara, Volgograd) to contain less green space than cities with higher EP values, at the same time, several cities with the most favorable climatic conditions (EP > 1) display a share of GI similar to cities in the steppe, e.g., Ekaterinburg. Saint Petersburg has the highest EP value (1.7) but simultaneously the smallest share of GI. Almost all cities except Krasnodar still meet the recommended 40% share of urban green [
5].
In contrast, we found a certain correlation between the extent of tree vegetation (the most valuable form of GI) and climatic conditions (
Figure 3b). While low EP (<1) implies a small share of tree vegetation (e.g., steppe zone), high EP (>1) does not always imply a large share of tree cover. Therefore, the degradation of GI in cities with EP above 1.0 but with a share of tree vegetation below 40% cannot be attributed to climate. In most cases, the processes of urbanization, economic development, and human activities influence GI to a much greater extent than natural conditions in the urban environment of Russia’s largest cities.
3.2. Removal of Air Pollution from Vehicles and Point Sources
Evaluation of this ES in physical terms showed a very negative situation in all analyzed cities [
28]. Motor vehicles are the main source of air pollution in most of the case studies. The share of vehicle emissions from total air emissions varies from 34% in Krasnoyarsk to 94% in Moscow. Gaseous pollutants contained in the exhaust fumes circulate in the air under the influence of atmospheric diffusion. Their concentration gradually decreases at greater heights and distances from roads. Such gases can circulate to other city districts where they undermine the air quality. Trees and shrubs in buffers around the roads are most affected by the pollutants; at the same time, they act as barriers to the further diffusion of pollutants. The provided volume depends on the area of woodland inside the city. This value varies greatly between the studied cities: the highest values are found in Moscow, Perm, and Voronezh, the smallest in Chelyabinsk, Omsk, Krasnodar, and Rostov-on-Don.
There is a significant difference in the demanded volume between the cities: those with the greatest loads are Moscow, Saint Petersburg, and Kazan, while Volgograd, Krasnoyarsk, and Rostov-on-Don produce less than 70,000 tons of emissions per year.
The ratio of required to provided ES volume does not exceed 1% in the studied cities, i.e., this service is practically unavailable to the local population. Slightly more sulphur dioxide (SO2) is absorbed than the other two investigated pollutants, carbon monoxide (CO) and nitrogen oxides (NOx). In this case, the demanded volume for removal is smaller than the consumed volume, meaning that more SO2 emissions can be absorbed by the existing woodland. In contrast, CO is removed in smaller volumes than other pollutants due to its intense emissions and the low absorption capacity of CO by trees.
The results show that today’s urban green infrastructure is unable to remove most emissions. The best results were found in Voronezh and Perm, which are rather green and have comparatively low emissions. It should be also stressed that Moscow, despite having the largest green area, shows the worst results for all studied gases due to the enormous volume of vehicle emissions. The correlation between the proportion of removed pollutants and the relative extent of green area is extremely low, also indicating the inadequate capacity of this ecosystem service.
Regarding the removal of air pollutants from stationary sources, the supplied volume of this ES was found to vary between 6.2 and 104.1 tons/year, depending on the area of green infrastructure inside the buffers.
As before, the ratio of required to provided ES volumes is less than 1% in all case studies. Considering that a large proportion of pollutants is transported away from the point source, we can assume that the major role of green infrastructure inside the sanitary buffers is to partly decrease the demanded volume of air purification provided by other urban and suburban forests, which also perform this ecosystem service.
The provided ES volume depends on the deforestation level in the sanitary buffers. In our study, we could not identify a single city where tree vegetation covered more than 30% of a buffer. The maximum proportion was found in Perm (30%), with the lowest values in Chelyabinsk (7%) and Volgograd (9%).
The extent of woodland in the sanitary buffers reflects the zone in which a city lies: for instance, values for this indicator are higher in the forest zone than in the steppe zone. At the same time, the sanitary buffers are much more deforested than the cities themselves. Further, the largest industrial zones were found in the biggest cities, namely Moscow and Saint Petersburg. Despite the large number of industrial zones, these two cities have the most highly vegetated sanitary buffers.
3.3. Urban Microclimate Regulation: Cooling Effect
Several of the studied cities do not possess sufficient green infrastructure to perform an optimal climate regulation, i.e., less than 100% of the urban precincts enjoys a cooling effect. These include cities in the steppe zone, such as Volgograd, Omsk, Krasnodar, Chelyabinsk, and Samara. Krasnoyarsk is also severely lacking in this service: only 23% of the urban area is cooled. Considering that this city has a humid continental climate (Dfb type, according to the Köppen climate classification) with rather hot summers (the average July temperature is about 20 °C), heat mitigation is thus crucial to ensure a comfortable urban environment. While Saint Petersburg was also found to be suboptimal in this ecosystem service, our adopted method is probably less suitable here as it does not take account of the numerous canals and water bodies in the city, which also provide a significant cooling effect. In contrast, the cooled area in Perm, Moscow, and Nizhniy Novgorod was found to be two times bigger than the urban precincts. This can be attributed to the high shares of developed green infrastructure and tree vegetation in these cities. It is important, however, to remember that green elements are not evenly distributed across most of Russia’s large cities; rather, the outskirts are often close to large urban forests while urban cores may lack any vegetation. This situation is true of Perm, Rostov-on-Don, and Samara, where the largest shares of GI (up to 50–70%) are concentrated outside the urban core. Particularly in the case of Rostov-on-Don, forest massifs are situated on the almost undeveloped and unsettled riverbank, while the city center and residential areas are severely deficient in green areas. For more details on the evaluation of this ES, see [
9].
3.4. Provisioning Services: Food Production
Agricultural lands make up less than 2% of the total urban area of Nizhniy Novgorod, Moscow (within the old pre-2012 boundaries, i.e., excluding the so-called New Moscow) and Samara. In contrast, about 12% of Krasnodar is made up of farmland (
Figure 2). The share depends not only on the ecological zone and climate conditions but also on the historical formation of the city. Volgograd, Voronezh, Rostov-on-Don, Omsk, and Krasnodar are the only case studies where we found a considerable area of croplands belonging to agricultural businesses. In fact, most permanent croplands, such as fruit orchards, belong to private households. These private households (so-called dachas, a seasonal second home) occupy a significant area of suburban territories and play an important role in recreation and food-provisioning for many city-dwellers.
While modern large cities are generally not self-sufficient in food, our analysis showed considerable variation in the ratio of food production, from 5.5% in Samara to 31.3% in Omsk. It should be noted that this potential input is bigger than the percentage of agricultural lands in the city, implying that household croplands are highly productive and important for the food security of many of Russia’s large cities. Notably, cities of the steppe zone with more favorable agroclimatic conditions and fertile soils (including chernozems) also have the highest values of this ES service, e.g., Rostov-on-Don, Krasnodar, Volgograd, and Omsk. However, these farmlands situated within the administrative borders mostly belong to agricultural holdings, which often export the yield to other regions. For more details on the evaluation of this ES, see [
9].
3.5. Recreational Services: Forming Natural Conditions for Recreation
One of the most important ESs provided by urban green infrastructure is to establish conditions for recreational walking and sports. Unfortunately, it is technically difficult to assess this kind of ES in Russian cities: firstly, due to the variety of green elements with diverse conditions for recreation; and secondly, because of the wide range of recreational activities and a lack of standards to regulate the permissible recreational carrying capacity.
When considering the provided ES for weekend recreation based on the minimum value of permissible recreational carrying capacity (2 per/ha) for urban PAs and the medium value (50 per/ha) for other GI, the results show that all cities (except Rostov-on-Don) can supply a considerably larger volume of recreational service than demanded by local residents (the ratio is above 100%). The degree of ES provision for citizens changes when applying the minimum value (2 per/ha) for the whole GI. In this case, the ES supply exceeds the demand in only two cities: Voronezh and Perm. In other cases, the demand is greater than the supply. The average ES volume for daily (rather than weekend) recreation supply by urban GI is about 90% in most cities, i.e., more than 90% of the residential areas of Moscow, Ekaterinburg, Kazan, Nizhniy Novgorod, Voronezh, and Perm have GI within walking distance. This result can be expected since these cities also have the largest area of GI in general. More surprising, however, is the fact that GI in cities, such as Saint Petersburg, Samara, Volgograd, and Chelyabinsk, with relatively small green areas is sufficient to meet the needs of citizens for daily recreation. In contrast, Rostov-on-Don and Ufa show the worst results for this ecosystem service despite their relatively large green areas.
On the whole, the results for recreational services are better than for a number of other studied ESs in Russian cities. Together with microclimate regulation, recreational services can be called the most efficient.
3.6. Patterns of ES Provision in Russia’s Most Populated Cities
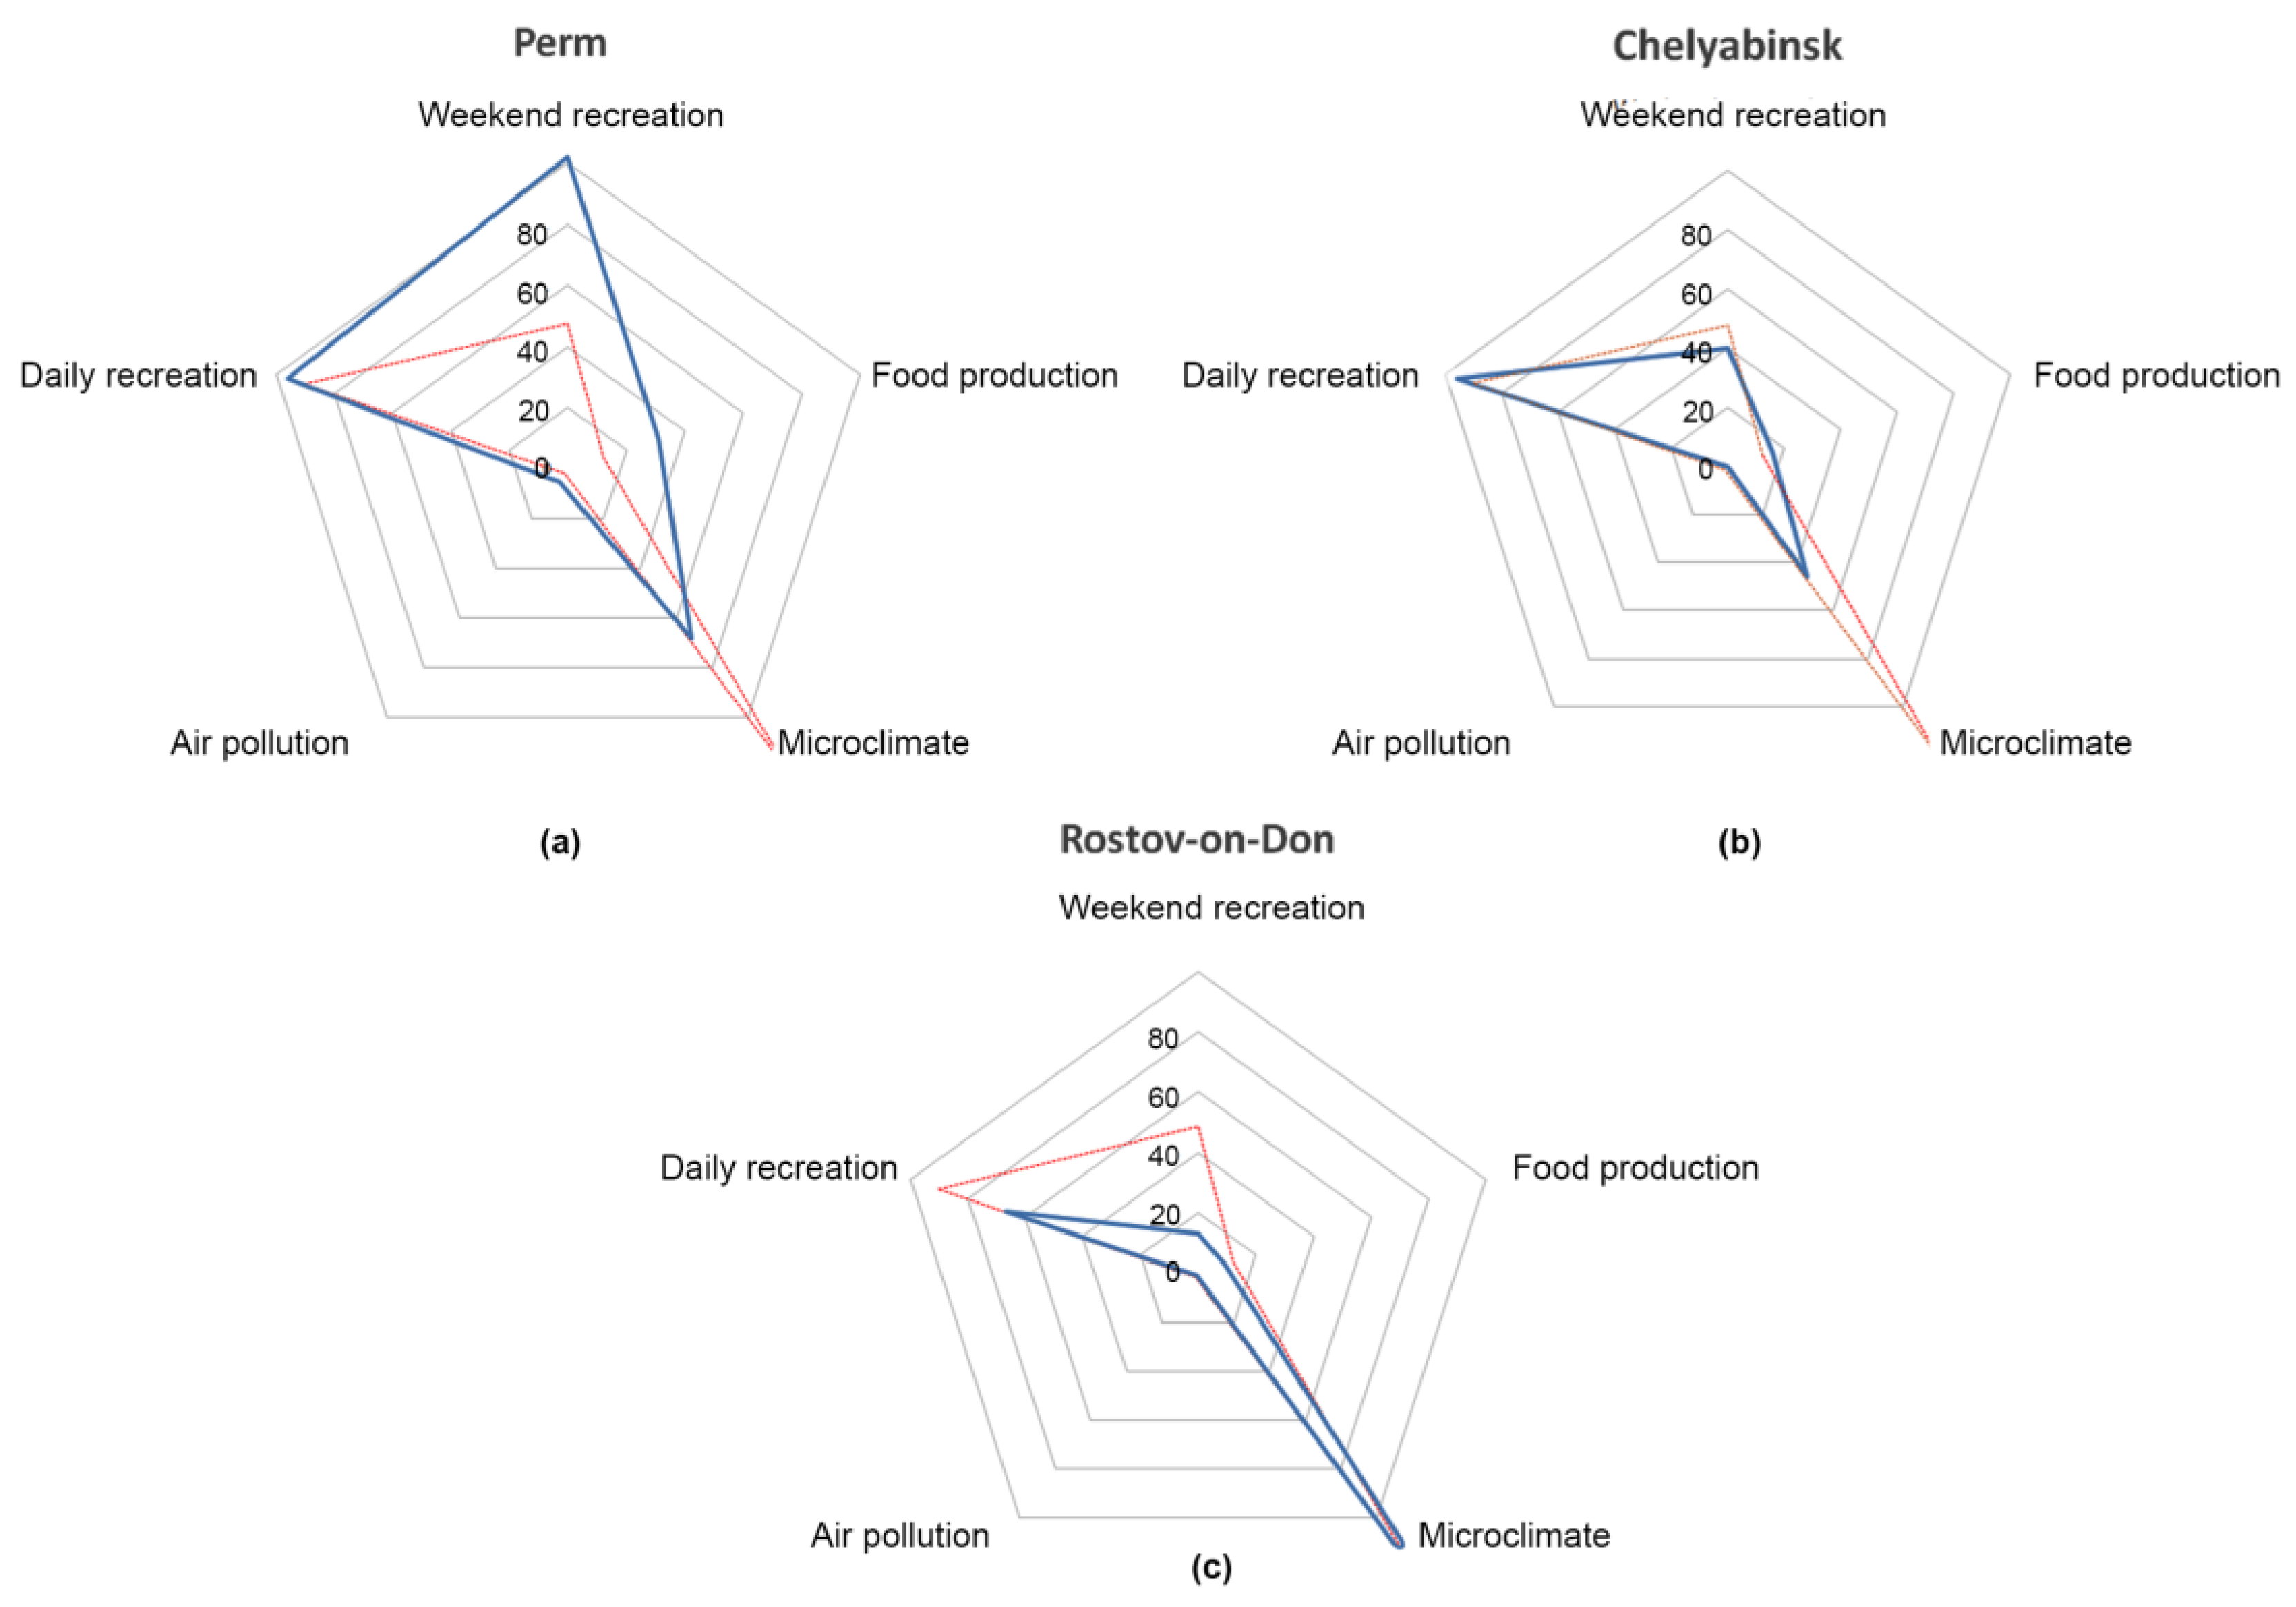
For the present study, we analyzed the extent to which residents are provided with ESs (i.e., the ratio between provided and demanded ESs) in Russia’s 16 largest cities. Our results show that the most efficient service in a number of cities is microclimate regulation and daily recreation. The red line in
Figure 4 shows that in most cases, the volume of climate regulation is even excess to demands, i.e., the existing green infrastructure can provide more heat mitigation than required by the local population. Daily recreation is also a well-performed service, although the provided volume of weekend recreation (when considering the minimum recreational carrying capacity) is smaller. The most poorly provided services are food production and air purification. The latter service is only able to remove less than 0.01% of the airborne pollutants. Clearly, we cannot expect plants to absorb 100% of urban emissions; therefore, we set a value of 10% of the total emissions as the demanded volume. Yet even under this assumption, the best result for this service (in Voronezh) is still only 4.4% of the demand.
Seven of the studied cities, namely Moscow, Novosibirsk, Saint Petersburg, Kazan, Omsk, Volgograd, and Ufa, have similar patterns of ES provision. However, we can identify three other types of patterns amongst the studied cities. In Perm (
Figure 4a) and Voronezh, the most efficient service is weekend recreation; while all other services are also fairly efficient, microclimate regulation is not excessive as is the case in most of the investigated cities. This pattern can be called the most balanced, since the disparities between the volumes of the five services is less striking. Another pattern can be identified in Chelyabinsk (
Figure 4b) and Krasnoyarsk. Here, the structure of ES provision indicates a sufficient supply of daily recreation but a deficiency in all other services, including climate regulation. The third pattern is associated with the cities Rostov-on-Don (
Figure 4c), Samara, and Nizhniy Novgorod. Here, all ESs apart from heat mitigation are seen to be less efficient than in other cities. The second and third patterns of ES provision are the least balanced. Most of the cities with these patterns have some industrial specialization, such as Chelyabinsk, Samara, Rostov-on-Don, and Nizhniy Novgorod, which can partially explain this deficit in ESs, even though the green infrastructure parameters are acceptable. This ES pattern demonstrates that an abundance of green space does not necessarily imply that ecosystem services are well provided. In fact, the quality and location of green elements will also determine the volume and variety of ESs. We believe that this is an important finding with practical relevance for Russia’s cities, which, in comparison to many large European and Asian cities, enjoy extensive GI within the urban precincts. These large shares of green space give the misleading impression that ES volumes are equally large.
3.7. Urbanization and Green Infrastructure Transformation: Case Studies of the Five Largest Cities
Russia’s most heavily populated cities, i.e., Moscow, Saint Petersburg, Novosibirsk, Ekaterinburg, and Nizhniy Novgorod, all enjoy a particular status. Acting as pioneers and innovators, these cities define the GI development for other administrative centers in the country. Here, it is also important to note that the administrative boundaries have repeatedly changed in most of these cities over the last 20 years (for this reason, we used the most recent boundaries). The major changes to urban boundaries occurred after 2011. Several cities have followed the example of Moscow, whose area has enlarged by a factor of 2.5, with many small towns being incorporated into large neighboring cities. The recent study for TEEB-Russia [
25] mostly made use of old boundaries.
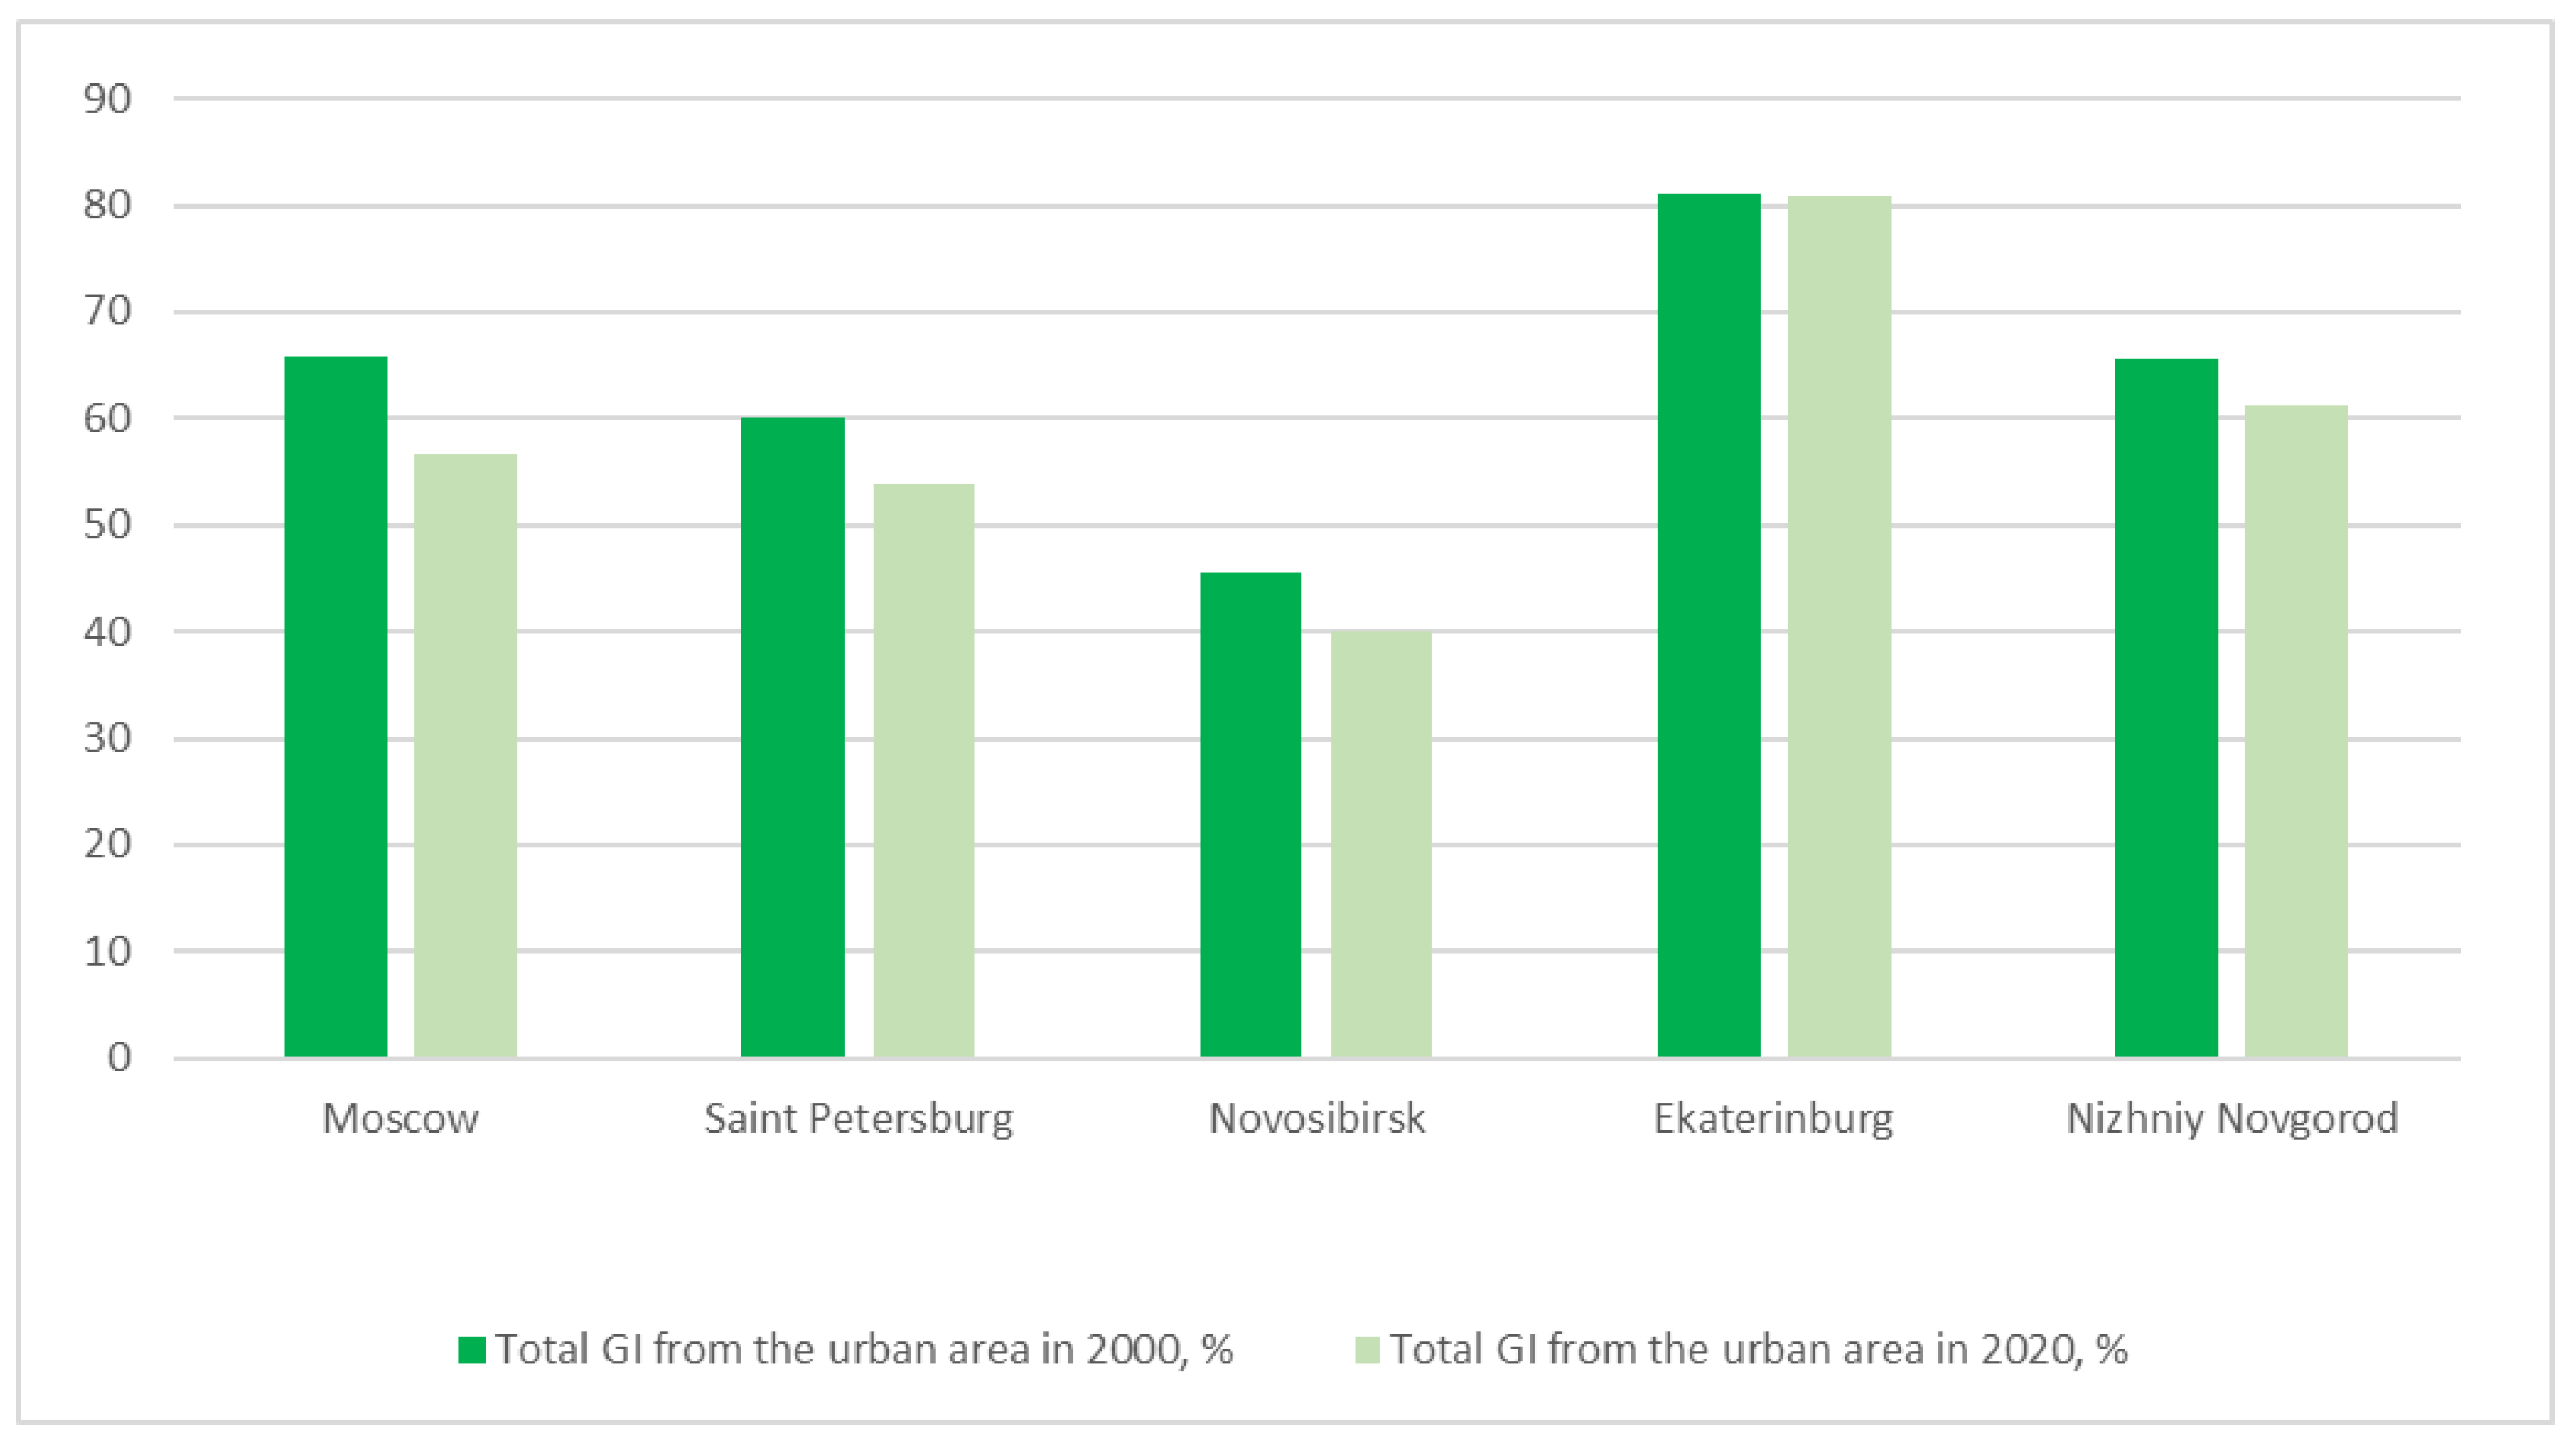
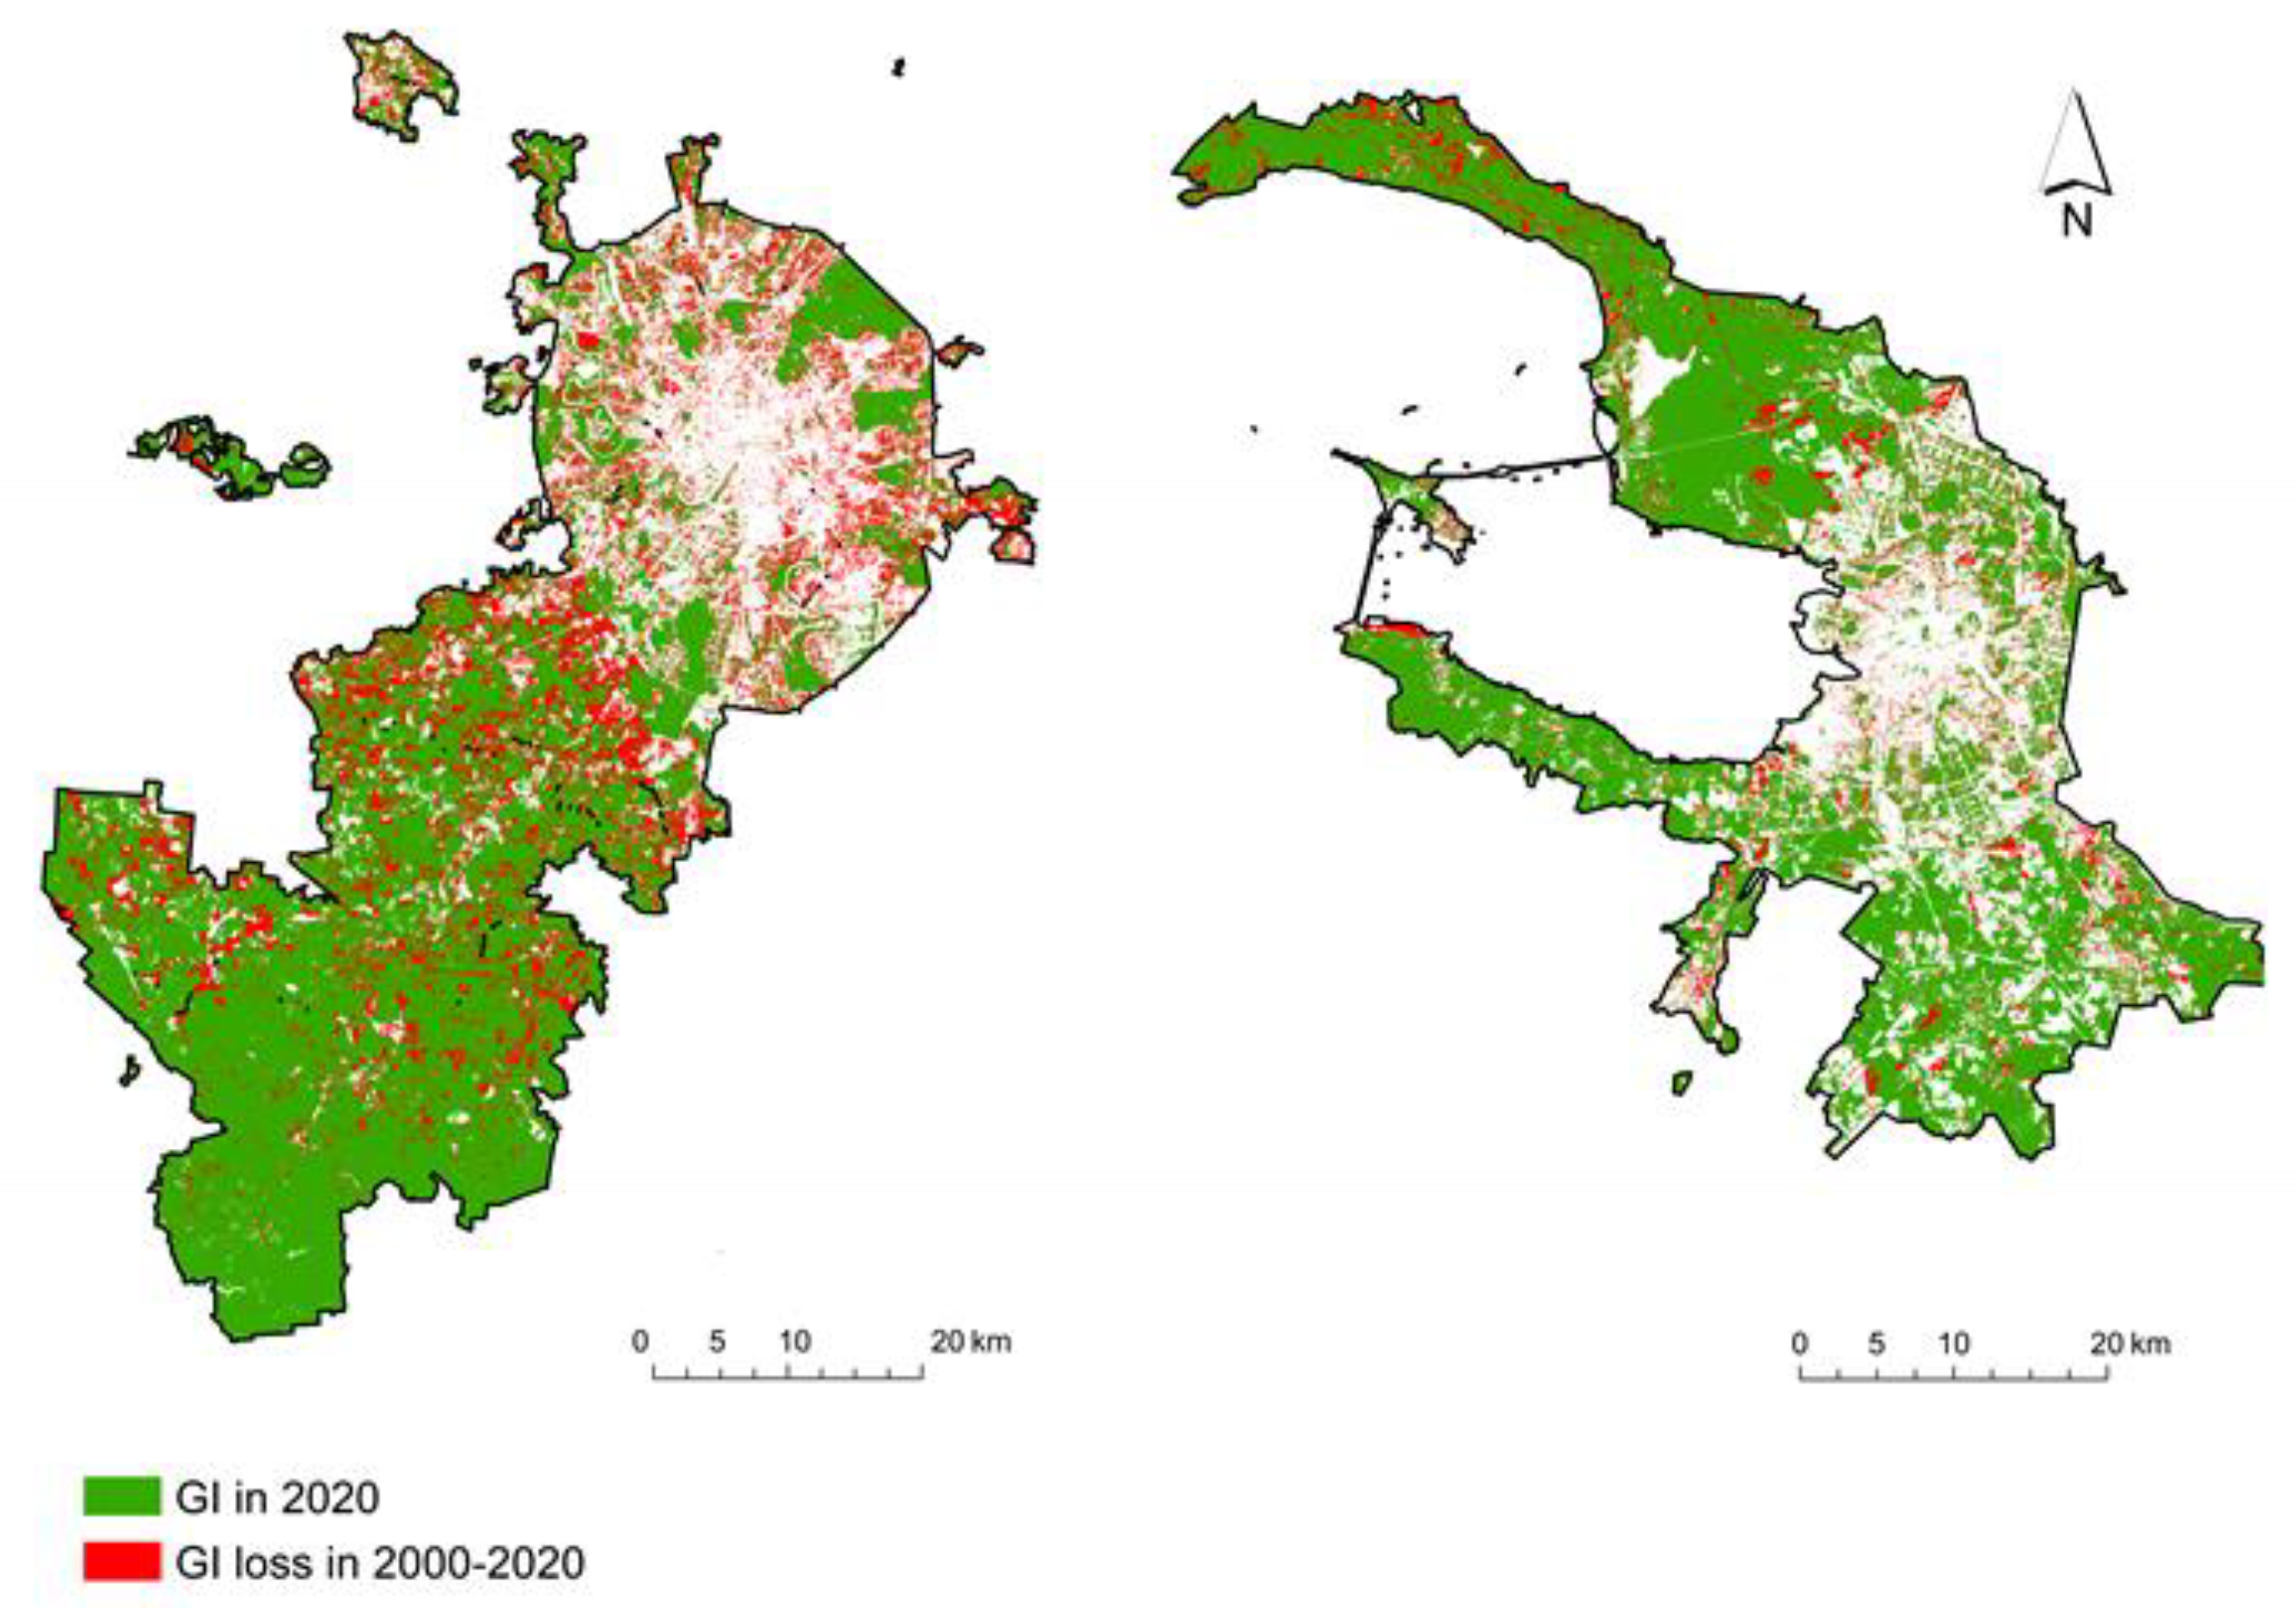
Our assessment of GI transformation revealed a loss of green space in all cities (
Figure 5 and
Figure 6). The greatest change was found in Moscow and Nizhniy Novgorod (a loss of 9.2% or 235 km
2 and 19% or 95 km
2, respectively), with the smallest in Ekaterinburg (a loss of only 0.3%). However, Ekaterinburg is also the only case where we found a gain in non-tree vegetation, against a loss in tree vegetation of about 0.8%. From our NDVI images and tree-cover raster, we could determine that most tree vegetation was transformed into non-tree vegetation, which is less valuable in terms of ES volume and variety.
In other cities, the major transformation of GI concerns non-tree vegetation, while tree vegetation loss is little affected. The loss of this type of GI is about 3% in Nizhniy Novgorod and 7% in Moscow, generally due to the incursion of new residential districts at the cities’ outskirts. In Moscow, the majority of green area has been replaced by roads and other infrastructure buildings as part of the development of “New Moscow” since 2012. Much less GI has been lost in the inner-city areas. It is important to note that our assessment at the city level may contains some errors, especially concerning small local changes inside the urban core, due to the spatial resolution of 30 x 30 m offered by the Landsat images and Hansen’s tree cover raster. In particular, we assume that our results may be somewhat overstated in cities with a large share of agricultural lands within urban borders, since NDVI values can in reality reflect plowed fields rather than built-up areas. Although we attempted to deal with this problem by distinguishing agricultural lands by visual interpretation and OSM materials, the particular resolution of the remote sensing data still leaves some room for error.
In general, and with the exception of Nizhniy Novgorod, the relative change in green area may seem quite insignificant in the investigated cities. Yet the absolute losses in green area may be fairly large: for example, Saint Petersburg lost about 100 km
2 of GI and Novosibirsk 28 km
2. While most transformations occur on the urban outskirts, so that the most densely populated inner cities have preserved their green areas and local residents can still enjoy their recreational ES, the depletion of the green belt brings with it a reduction in regulating and supporting services. In general, suburban forests perform most air and water purification. Agricultural lands have not changed much during our period of investigation, so that this provisioning service has also remained stable. According to our modeling, the most common land cover transition is when non-tree vegetation makes way for built-up areas. This is the worst form of transformation according to [
41], since it leads to a total loss of ESs. The transition from tree vegetation to non-tree vegetation is less common and less damaging for the variety and volume of ESs. Regarding the transition from woodlands to built-up areas, although this change does take place in some central districts, it is not widespread in the studied cities.
4. Discussion
While the methods of ES modeling used here are applicable at the city level, they lack a certain accuracy and level of detail. For instance, the volume and variety of provided ESs depend not only on the total area of GI but also its quality. In this study, we simplified the quality assessment to consider only three types of GI: tree vegetation, non-tree vegetation, and agricultural land. Although this simplification is permissible for our scale and target results, a more complex assessment for the purposes of urban planning and development will require more indices and parameters. Vegetation should be classified by its health and condition [
42], while the functions and value of green elements should be determined not only by their size but also form and location [
43]. Moreover, fragmentation is an important factor to consider as it can determine the quality of ecosystems, various supporting services, and GI sustainability [
44].
Ignoring intracity differences, our results reflect the average situation for an entire city. However, the supply and demand of ESs may vary between districts, depending on the population density, the location of industrial and residential areas, the volume of emissions from particular sources, as well as geographical and spatial features (prevailing wind directions and other atmospheric conditions, built-up structures, etc.) [
45].
The results of this survey demonstrated that most cities with a large share of GI are sufficiently provided with climate regulating services. However, we stress that GI ele-ments, which supply this and other services, are usually concentrated outside the popu-lated urban core. In Russia, the administrative boundaries of most cities encompass not only built-up areas but vast territories of forests, grasslands, and agricultural lands so that the actual urban core can be two to three times smaller than the administrative boundaries. This means that despite the huge volume of supplied ESs, the real amount of consumed ESs can be much smaller, since consumers’ homes are distant from the GI. We uncovered this problem in almost all the studied cities. The expansion of formal urban boundaries at the expense of vast suburban areas, as in the case of Moscow (see
Section 3.7), can significantly improve the average indicators of ES provision, while in the city center, the contraction of GI can cause a decrease in ES supply to residents there.
For instance, the efficient performance of heat mitigation services depends first and foremost on the location of green elements, which ideally should be situated within the densely populated urban center and not only at the outskirts. This built-up center forms the core of the heat island, exposing the majority of city dwellers to excessive heat [
46]. While our data only allows us to assess the configuration of green infrastructure qualitatively, the results show that the main challenge to climate change adaptation in all of Russia’s largest cities is a lack of green infrastructure in the urban center. To improve our assessment methodology of climate regulation, it would be necessary to consider not just the scale of heat islands but also the size of existing green elements. Better knowledge of the form, size, and location of parks can help to calculate the affected area with greater accuracy.
To assess more precisely the input of urban agricultural lands to food provisioning, it would be necessary to take account of the particular features of the local fruit and vegetable markets as well as the consumption of crops (statistical data on different types of crops) and people’s preferences for local products [
38].
Results on recreational services can be made more accurate by, firstly, using the most reliable information on the extent of green infrastructure capable of performing recreational services and its current state; secondly, by defining the types of recreational activities in order to specify the norms of carrying capacity for each one individually; and thirdly, by detailing the norms for the permissible recreational carrying capacity that does not deteriorate natural ecosystems in consideration of the specific environmental and geographical features of the area, i.e., slopes, soil and vegetation cover, factors that disturb fauna, etc. [
28]. Although it is too early to make predictions about changes to urban ESs in this regard, we can speculate that recreational services will gradually become the prevailing component in the pattern of ESs.
Regarding the assessment of air purification by trees, currently, there is no such tool in Russia, such as iTree, to show absorption rates and limits for different species native to the country [
33]. As an alternative, we used average values for US and Canadian cities of approximately the same populations and with similar vegetation zones. Obviously, the results would be more accurate if dedicated data for Russian cities and vegetation can be used.
To calculate the mentioned parameters, you need well-structured and constantly updated materials at the local level. Currently, open data is collected for the whole city at best and not for the constituent districts. While economic and demographic data are more or less exhaustive, diverse environmental datasets on species, weather conditions, protected areas, and vegetation state are not presented in a single well-organized form. Moreover, as there is no official data on emissions from point sources, it is impossible to locate districts with the highest demand for air purification services. Detailed studies cannot be carried out at the city level due to the lack of data on visitors to parks or their recreational preferences. The literature contains a number of studies that have investigated the ESs of individual green elements, urban districts, or even entire cities in Russia; yet, very few methods have been proposed to assess the ESs in several cities simultaneously. Therefore, the improved availability of more detailed databases on cities could ensure not only an accurate ES calculation but also the assessment of a greater variety of ESs.
Some may argue that it is not useful or feasible to compare the volume and variety of ES in cities that are situated in completely different natural zones. In our opinion, this is generally true for small towns in Russia. It is obvious that towns in the north of the country are less green than in the south. Towns of medium size do not greatly transform the environment so that natural conditions still remain the governing factor behind GI features. However, large cities are a completely different case. They form their own urban environment with transformed or reduced natural processes, and the quality as well as the quantity of GI largely depend on urban planning [
25]. In turn, improvement measures are stimulated or hampered by investments, public policy, as well as the general needs and trends of the population.
Regarding especially valuable GI elements, these include not only urban PAs but also riparian green zones. Unlike most urban forests, rivers usually run through urban centers. They are of exceptional importance for several reasons. First, they perform extra heat mitigation services. Second, natural riparian ecosystems are of the utmost importance due to the supporting and regulating services they provide. Like wetlands, these ecosystems are responsible for the majority of water purification, erosion, and flood control services. Third, areas adjacent to rivers and other water bodies are popular for the various recreational opportunities they provide. Fourth and finally, being unique intrazonal ecosystems, they are a natural habitat for a number of species. Rivers are natural corridors between different green elements in the city as well as between urban and suburban ecosystems. Hence, they support the stability and health of GI. In this way, riparian areas can be multifunctional elements of GI [
47]. Yet having provided water and energy to industries for many decades, riparian areas in many large Russian cities are burdened with abandoned plants and factories, old embankments, and docks. Nonetheless, rivers and riparian zones still constitute valuable ES assets in many cities, and thus must be improved and developed.
Russian cities can be said to be fairly unique in regard to GI and related ESs. On the one hand, their population growth rates over the last 20 years have been relatively high, and urban sprawl is quite evident in many cities. On the other hand, and unlike many Asian or American cities of similar populations, many large cities in Russia have preserved extensive green areas from the Soviet era, which are now often being transformed by new developments and upgrading plans or because of the encroachment of built-up areas. The remaining parts of the Soviet green networks are actually natural ecosystems with sedimentary forests, which function just like any other natural forest outside the urban area. Regarding the provision of ESs, these GI elements are of particular value as they are highly efficient suppliers of regulating and supporting services in comparison to other artificial or semi-natural green elements. However, to preserve these urban forests in their current state, it is necessary to protect them from intense recreational or other use, which for the city authorities is an inefficient use of land. It is crucial to further develop plans and schemes on GI structuring in urban and suburban planning and GI assessment by using more indicators like biodiversity richness, connectivity and fragmentation, and zoning the studied area to define the most vulnerable or valuable territories [
22].
Today, the green infrastructure of many of Russia’s large cities is gradually transforming. Although extensive woodlands still make up the biggest part of urban green infrastructure, new districts and infrastructure are slowly swallowing these up; in their place, new artificial green areas, such as modern parks and squares, are being constructed. The main function of these elements is recreation. They also perform other services, such as heat mitigation or water purification, but at much lower volumes. On the positive side, these artificial elements can provide desperately needed green infrastructure in densely built-up inner-city districts; in contrast, most urban forests are situated in low-density areas on the outskirts, which already possess much street vegetation.
In Russia, the largest cities often function as role models to others. This is particularly true of Saint Petersburg and Moscow. In both of these cities, an ecological strategy has been announced to encourage an environmental-oriented lifestyle that includes a healthy urban environment featuring GI. In recent years, however, we note not only a loss of GI (see
Section 3.7,
Figure 6) but also a deterioration in its quality due to the unfavorable distribution of natural areas [
9]. Such trends in real GI and ES change serve as dangerous examples to other cities, despite the declared strategies to improve the urban environment. Nevertheless, for most cases, there was an insignificant decline in green area. In the context of urbanization, GI intactness can be interpreted as a positive result. There is not a lot of undeveloped urban area to increase GI, but it is necessary to preserve existing green elements.
The question of the most efficient greening scheme for urban areas remains unanswered for many cities [
48,
49]. Moreover, with their specific structure and development history, Russia’s cities also require specific planning solutions.
5. Conclusions
Our analysis of the current state of urban GI and the most important associated ESs in Russia’s 16 largest cities showed that both GI and ESs are vital factors in determining the quality of life of city-dwellers. However, there is great variation between the examined cities in their stocks of GI and supply of ESs. Some were found to have very low ES provision. This suggests that indicators for GI and ESs should be included in the decision-making processes of large cities.
In particular, we analyzed the key regulating services (i.e., the removal of air pollutants from point sources and automobiles, regulation of the urban microclimate), recreational ESs (i.e., the formation of natural conditions for recreation), and provisioning ESs (i.e., food production). By comparing the provided and demanded ESs, we found that all of Russia’s largest cities are deficient in the ES of air purification. Reflecting minimum standards for the supply of green space for recreation, it can be stated that the availability of recreational ES is sufficient in most cases. These results, however, need careful elaboration based on the maximum recreational carrying capacity of ecosystems, which varies for different types of ecosystems, climatic conditions, and recreational activities.
Urbanization processes, mass construction, increasing population densities, and the environmentally inadequate development of transport infrastructure in Russia’s most populated cities are reducing both the area and quality of GI, and consequently the supply of ESs, especially in districts undergoing breakneck development. As a result, environmental indicators for the quality of life of the urban population are decreasing.
Our case study of the five most populated cities in the period 2000–2020 showed that densely built-up areas continued to expand at the expense of open spaces. The development programs of these cities will further reduce the stock of green space, in particular destroying mature woodland aged 40–60 years, which is especially efficient in the provision of ESs.
In Moscow and Saint Petersburg, transport infrastructure is being developed without any consideration of ecosystem preservation. This is causing fragmentation of suburban ecosystems and destroying links between suburban and urban ecosystems. The resulting isolated ecosystems have low sustainability, thus further endangering biodiversity.
Considering the key importance of ESs for the well-being of citizens and the trends of increasing urbanization and reductions in the stock of urban GI, it is urgently necessary to establish systems for the accounting and monitoring of GI and ESs in all Russian cities, especially its largest settlements. Evaluation methods should consider the diversity of GI elements, the full range of ESs, and the intracity differences of these indicators.
Major revisions to urban planning policy are required to safeguard the constitutional rights of citizens to a healthy environment. These should fully reflect scientifically backed standards for green infrastructure and its quality, including indicators of biodiversity and urban ESs.


