Article

Spatial–Temporal Impacts of Urban Sprawl on Ecosystem Services: Implications for Urban Planning in the Process of Rapid Urbanization

1
College of Earth Sciences, Jilin University, Changchun 130061, China
2
Key Laboratory of Wetland Ecology and Environment, Northeast Institute of Geography and Agroecology, Chinese Academy of Sciences, Changchun 130102, China
*
Author to whom correspondence should be addressed.
Land 2021, 10(11), 1210; https://doi.org/10.3390/land10111210
Submission received: 19 September 2021 / Revised: 2 November 2021 / Accepted: 4 November 2021 / Published: 8 November 2021
(This article belongs to the Special Issue Dynamics of Urbanization and Ecosystem Services Provision)

Abstract

:
Rapid urbanization drives land cover change, affecting urban ecosystems and inducing serious environmental issues. The study region of Changchun, China was divided into three urbanization categories according to different urbanization levels and the characteristics of urban sprawl and changes and relationships between typical ecosystem services (ESs) under rapid urbanization were analysed. The results showed that Changchun has undergone considerable urban expansion since 2000, which has significantly impacted all ESs in terms of spatial and temporal heterogeneity. Habitat suitability and crop yield have relatively stronger service capacity in the study area. Since the expansion of large-scale infrastructures, the mean ES values of developed urban areas are the lowest among the three zones, except for water retention and sandstorm prevention in 2015, when the balance between all services decreased. Over the past 16 years, habitat suitability in developing urban areas has decreased to a large extent due to urban sprawl. Because of the improvement in agricultural science and technology, crop yield in three regions increased, while the area of cropland reduced from 1720 km2 to 1560 km2 (9.3%). Synergies between habitat suitability and carbon storage and habitat suitability and soil retention were detected in three areas. A trade-off between habitat suitability and water retention was detected in three areas. The interactions between crop yield and carbon storage, habitat suitability, and soil retention were more complex in this study region. In addition to water retention, urbanization index has a negative correlation with ESs. According to the results, some suggestions to alleviate ES loss during the process of rapid urbanization were proposed, which may guide scientific urban planning for sustainable urban development.

1. Introduction

Urbanization is a global universal process and an inevitable phase towards modernization for the development of most countries [1]. According to a report released by the United Nations, the rate of global urbanization increased from 30% to 55% between 1950 and 2018 and will continue to increase to 68% by 2050 [2]. In China, the urbanization rate, which was only 10.64% in 1949, exceeded 50% for the first time in 2011 and reached 59.58% in 2018 [3]. There are many factors influencing urban expansion, including rural land reform, large-scale industrialization, incentive policy, migration, economic reform, and market-led urbanization, etc [3]. With the rapid development of urbanization, rural populations moved into cities and secondary and tertiary industries continued to gather in cities. China’s seventh national census shows that 902 million people live in the city in 2021, reaching 63.89% of the total population [4]. The population agglomeration in urban areas in particular has led to a surge in demand for urban land resources. Statistics about urban development released by the World Bank showed that urban land consumption outpaces population growth by as much as 50%, and is expected to add 1.2 million km2 of new urban built up areas to the world in the next three decades [5]. Such a sprawl puts pressure on land and natural resources and a large number of natural resources are consumed.
Statistics from the United Nations showed that cities accounting for less than 2% of the earth’s surface consume 78% of the energy generated and produce 60% of greenhouse gas emissions [6]. According to the Land Rent Theory, the price and demand for land change with the increase in distance from the city centre. As a result, commercial, office, and residential activities, which are more profitable and have a higher rent, outbid and replace agriculture and ecosystem services to maximize access to the dense city centre [7]. ESs became the first casualty of urban expansion and economic development. ESs are a range of important goods and benefits that humans obtain from ecosystems, which are a key bridge linking human welfare with the environment, therefore providing an important framework within which to understand and manage urban sustainability [8,9]. ESs can be classified into four categories: provisioning services, regulation services, supporting services, and cultural services [6]. Assessment and evaluation of ESs provide decision-making information for the effective management of the earth’s ecosystem and a vital framework to understand and manage urban sustainability [10,11].
Since urbanization was one of the principle driving factors of ES change, the way that urbanization influences ecosystems is a worldwide concern [12]. Recent studies have revealed that, driven by numerous factors, including physical environment, economics, socio-political issues, science, and technology, as well as scale and degree of urbanization, the impact mechanisms of urban processes on ESs are quite complex, showing negative or positive correlations in different urban areas [3,13,14,15,16]. A study by Wang et al. in Guangdong-Hong Kong showed that urbanization is negatively correlated with natural habitats, water retention, soil conservation, and carbon sequestration, both in urban and rural areas [9]. Sun et al. found that in the process of urbanization, carbon storage, habitat quality index, water yield, and soil conservation decreased but food supply grew steadily [17]. Furthermore, studies have also shown that ESs increased in the early stage of urbanization and declined in the later stage, forming an inverted “U”-shaped relationship [18]. Therefore, there is still no universally consistent conclusion, and it is particularly necessary to research the impact of urbanization on ESs at local and regional levels. Some studies have also explored the impact of the urban–rural spatial gradient on ESs, especially for developed coastal cities [18,19,20]. However, few studies have been conducted on the influences of urbanization on ESs in the Black Soil Belt of northeast China.
As the provincial city of Jilin Province and the core city of the Urban Agglomeration of Harbin–Changchun, Changchun has seen an unexpectedly rapid urban expansion in the past two decades, especially after the implementation of the Strategy of Revitalizing Northeast China, which provides a good opportunity for regional development, as well as posing a major threat to the fragile ecosystems of the region [21]. At the same time, located in the typical Black Soil Belt and the important granary of China, Changchun plays a vital role in national food security. Rapid sprawling urbanization transformed a large number of high-quality croplands into artificial surfaces [21], which caused the challenges for cropland protection and food safety. Maintaining a balance between environmental sustainability and rapid urbanization becomes the principal issue that Changchun faces for future development. Many initiatives have been developed to protect cropland and natural landscapes to optimize land use structure. However, in order to minimize the loss of ESs during urbanization, a full understanding and quantitative analysis of impact of the urbanization processes on ESs are necessary.
For these reasons, the aims of this paper are: (1) to analyse dynamic characteristics of urbanization of Changchun since 2000; (2) to evaluate six ESs changes and bundle relationships during urbanization; and (3) to explore impacts of urbanization process on ES changes. The study aims to provide quantitative information for the balance and sustainability of ESs under rapid urbanization, which provides a basis for the development planning of Changchun.

2. Materials and Methods
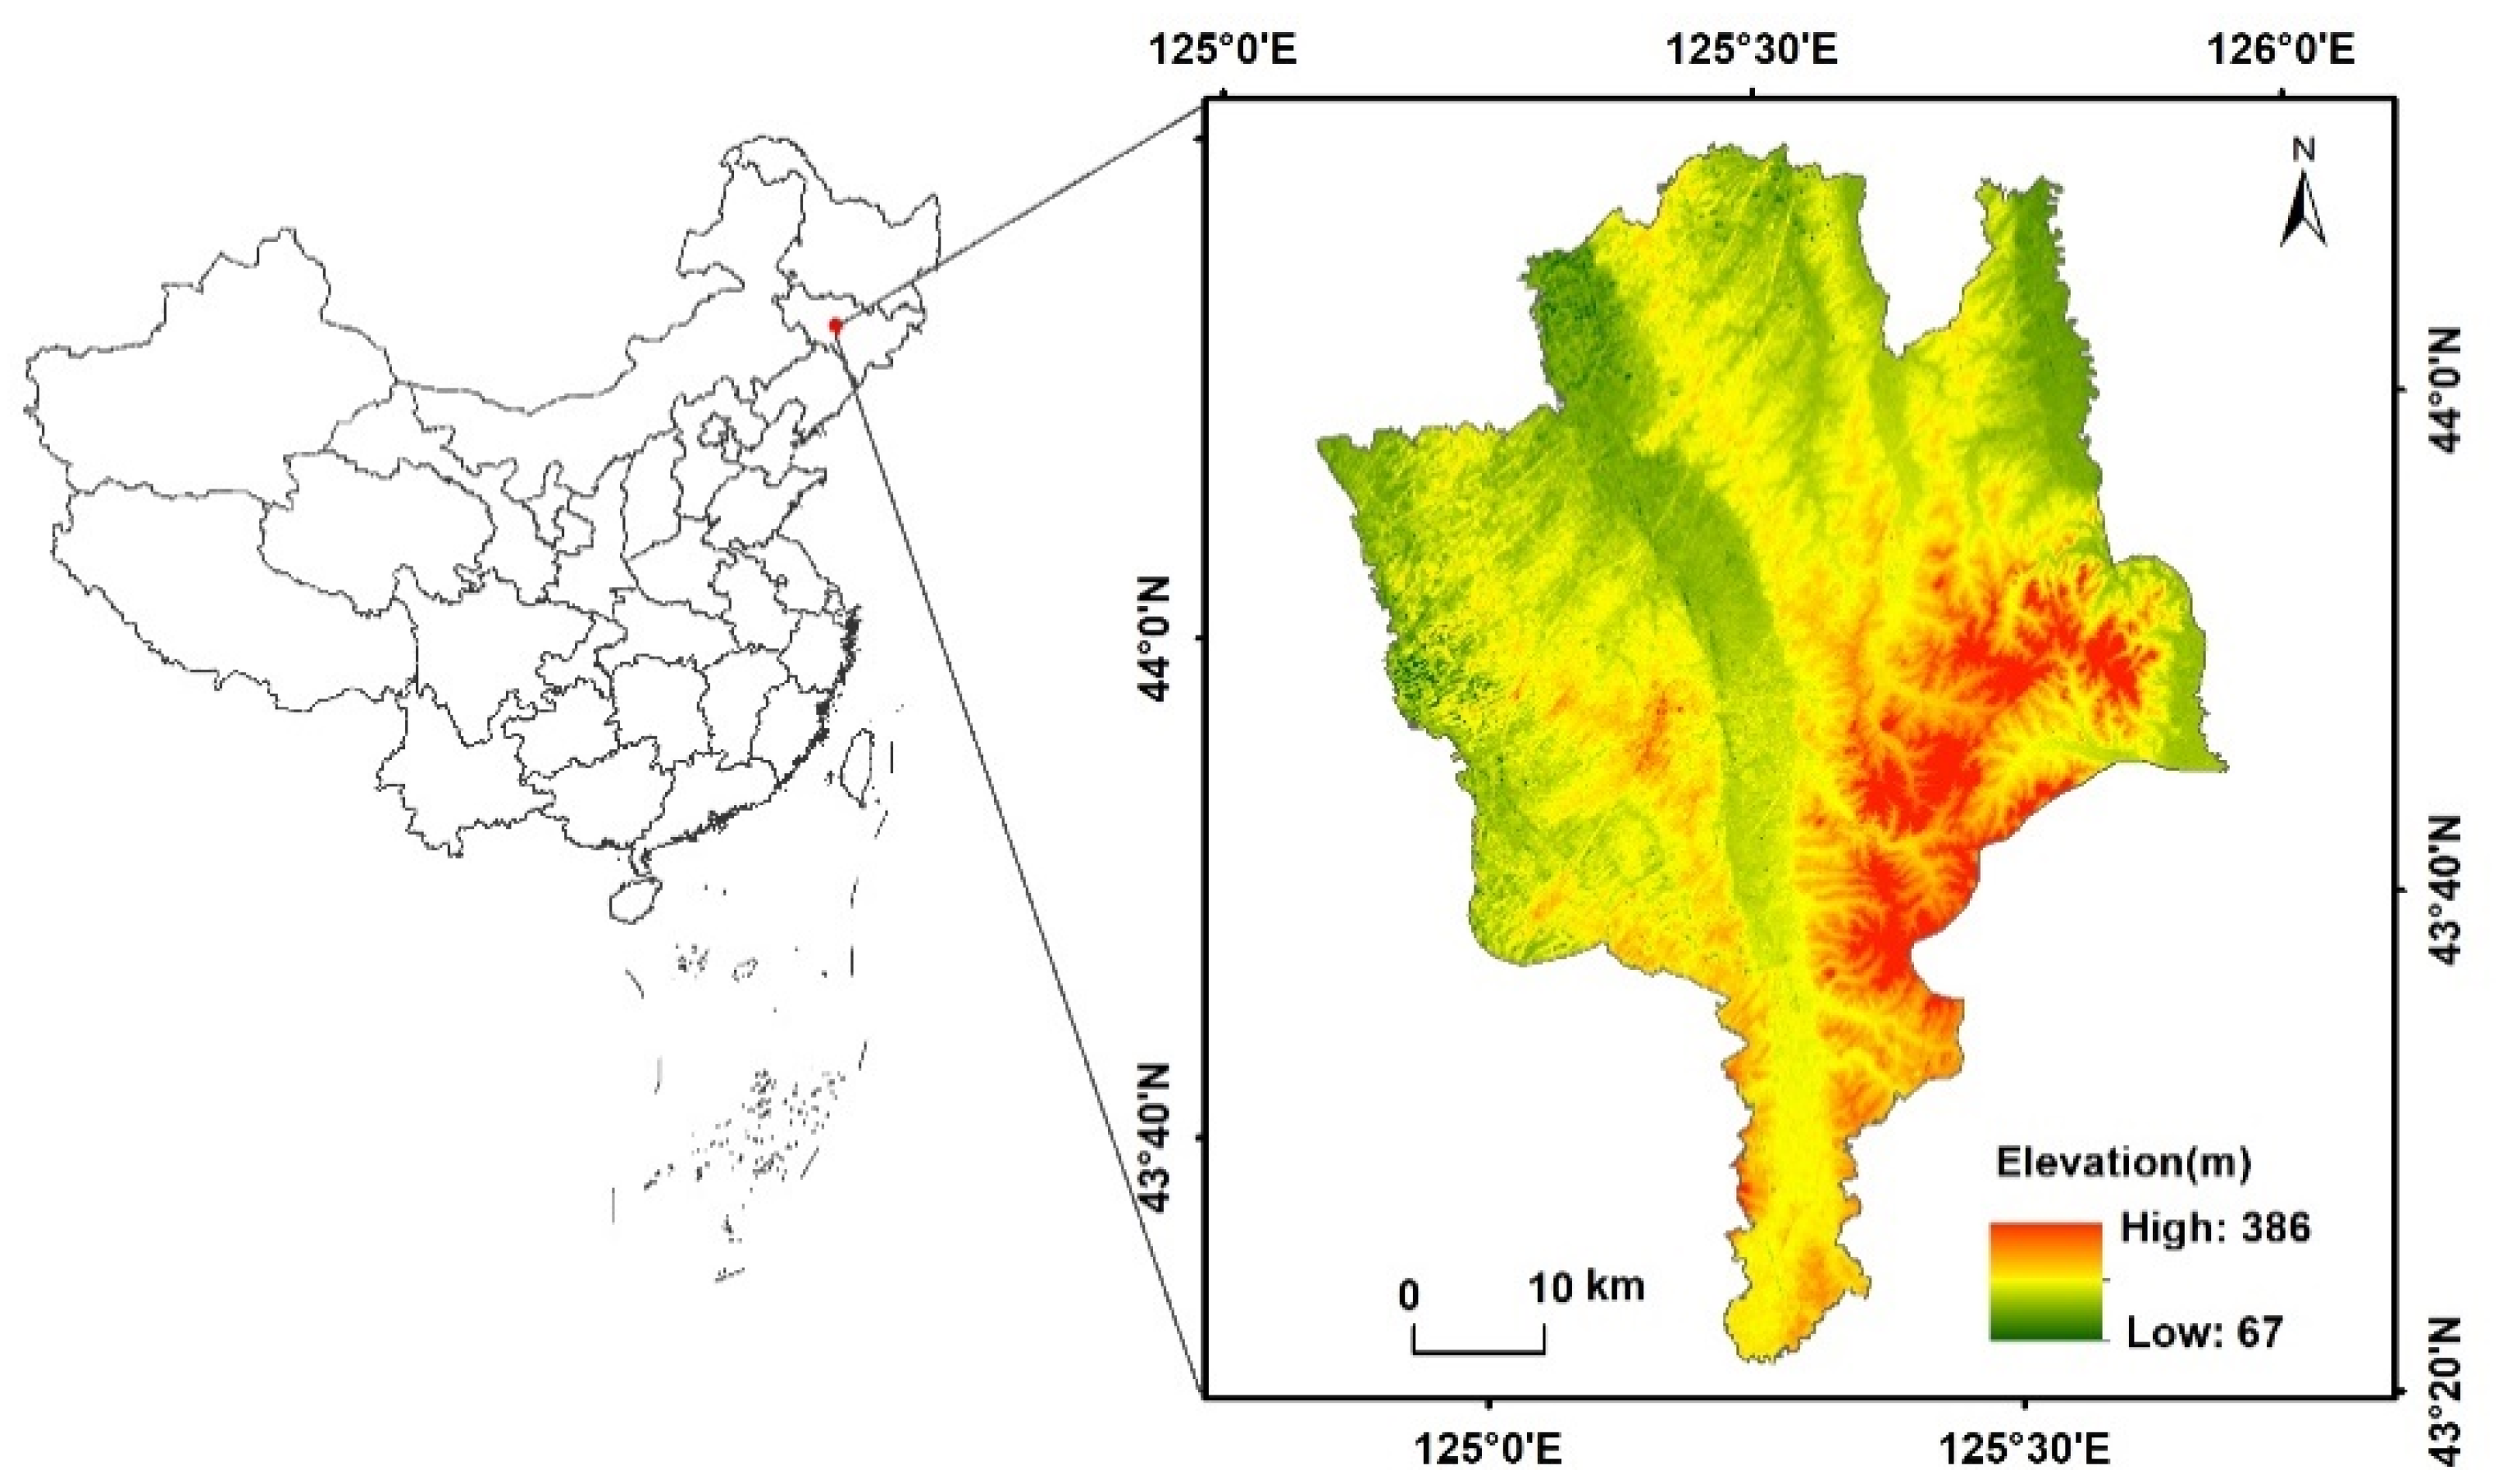
2.1. Study Area

Changchun (43°26′31″–44°36′29″ N, 125°1′44″–125°48′58″ E), the capital city of Jilin Province, is located in the middle part of the Songnen Plain, covering a total area of 3.1 × 10³ km2 within an urban built-up region (Figure 1). In this area, altitude varies from 67 to 368 m with small undulation in topography. The area has a semi-humid continental monsoon climate, characterized by a cold winter and cool summer with a mean annual precipitation of 570–700 mm and a mean annual temperature of 4.5–4.8 °C. In this region, rainfall occurs primarily in June–August. At the same time, Changchun belongs to the famous Black Soil Belt of northeast China and zonal soil types include mollisol, chernozem, and dark brown soil, in which corn is the dominant crop.
As a famous old industrial base in China, urbanization of Changchun was once higher than the national average level. With the emergence of abuses in the development of resource-based cities, the economic development of Changchun has stagnated. The proposal and implementation of the Strategy of Revitalizing Northeast China in 2003 propelled Changchun into an economic boom and rapid urbanization, which has inevitably accelerated land cover changes, soil resource loss, the heat island effect, and other environmental issues [21].

2.2. Data Source and Processing

In this study, we collected and used multi-source geographic data to quantitatively assess ES changes during urban sprawl. The main data sources and their descriptions are as the follows (Table 1):
Digital elevation model (DEM) data with a 30 m resolution were derived from the ASTER GDEM product (http://www.jspaceystems.or.jp/ersdac/GDEM/E, accessed on 15 April 2021). Meteorological data in 2000 and 2015 were acquired from the website of the China Meteorological Data Sharing Service System (CMDSSS, http://cdc.cma.gov.cn/, accessed on 15 April 2021). Climate datasets were spatially interpolated to grid data with a 30 m spatial resolution by the Kringing method in ArcGIS 10.3 software before being used in the ES models. Soil type data in vector format with a scale of 500,000 were provided by the Soil and Fertilizer Station of Jilin Province (SFSJP). Night-time light imagery data were downloaded from the website of NOAA/NGDC (https://ngdc.noaa.gov, accessed on 15 April 2021). Night-time light imagery data for different periods arrived from different sensors: data of the Operational Linescan System (OLS) arrived from the Defence Meteorological Satellite Program (DMSP) in 2000 and data from the Visible Infrared Imaging Radiometer (VIIRS) arrived from the NPOESS Preparatory Project (NPP) in 2015; therefore, resampling, mutual correction, and interannual fusion of the two periods of data were carried out according to the methods described in the literature to ensure data consistency [26,27]. Evapotranspiration products from a moderate resolution imaging spectroradiometer (MODIS) with a 500 m resolution were accessed from the NASA website and were used to calculate the water retention services. Land cover datasets in 2000 and 2015, interpreted from Landsat Thematic Mapper (TM) and Operational Land Imager (OLI) data were provided by the Northeast Institute of Geography and Agroecology, Chinese Academy of Sciences (IGA, CAS). Land cover types were divided into seven categories according to Wu [28]: cropland, grassland, forestland, wetland, built-up land, water body, and others. Based on the ground investigation data, the overall accuracy of the land cover classification data was higher than 90% for the two periods.

2.3. Methods

2.3.1. Urban Expansion Zoning

DMSP/OLS or NPP/VIIRS sensors can detect the low-intensity light emitted by urban lights and even small-scale residential areas and traffic flow at night, which make urban areas different from dark rural areas. Therefore, night-time light imagery data, as an intuitive representation of human activities, have been widely used in modelling urban sprawl [26]. Generally, higher Digital Number (DN) values indicate higher levels of urbanization. According to previous studies, a DN value of 50 was used as a threshold for distinguishing urbanization areas from rural areas. Accordingly, the study area was divided into three areas according to different levels of urbanization [1]: developed urban, developing urban, and rural area. For developed urban area, the DN values of the whole study region were both greater than 50 in 2000 and 2015; for developing urban area, the DN value in 2000 was less than 50, but greater than 50 in 2015; for rural area, the DN values were both less than 50 in 2000 and 2015.

2.3.2. Estimation of ESs

In this study, six vital ESs, including one provision service (crop yield), four regulation services (carbon storage, sandstorm prevention, soil retention, and water retention), and one supporting service (habitat suitability) were selected because they are closely related to the dwellers’ health and security, and are sensitive to land cover changes.
The approaches used to quantify each service are briefly described in the following subsections:

Carbon Storage Service

Carbon storage is an important indicator of climate regulation [29]. The InVEST model was used to evaluate carbon stored in carbon pools, including above ground biomass, below ground biomass, soil, and dead organic matter [30]. The total carbon storage is the sum of those four carbon sources:
C i = C i ( a b o v e ) + C i ( b e l o w ) + C i ( d e a d ) + C i ( s o i l )
where Ci represents the total carbon storage of grid cell i.
Carbon storage was calculated based on the specific ecosystem classification [28]. Because the InVEST model was designed for worldwide application, some functions are general without considering regional heterogeneity [30]. For better results, the biomass carbon stocks per unit area of each land cover type were derived from the local research results and long-term observation data from field stations in northeast China [31].

Soil Retention Service

Soil retention is an important regulating ES, especially in the case of rapid urban sprawl and significant increases in impervious surfaces in the Black Soil Belt. With frequent human interference, regional soil erosion is becoming more and more serious, and the soil retention capacity of the study area has changed greatly. The Revised Universal Soil Loss Equation [32] was used to estimate the soil retention service of different ecosystems. Areas of land with high soil retention present less risk of erosion loss [33]. Soil retention is the difference between potential soil erosion and actual soil erosion; the formula is as follows [34]:
A = A p A a = R × K × L S × ( 1 C × P )
where A is the annual soil loss (t km−2 a−1); Ap is the potential annual soil loss (t km−2 a−1); Aa is the actual annual soil loss (t km−2 a−1); R indicates the erosion factor of rainfall runoff (MJ mm km−2 ha−1 a−1), which is calculated according to the daily rainfall; K refers to the soil erosion factor (t h JM−1 mm−1); LS denotes the slope length and gradient, representing the terrain factor; C indicates the dimensionless vegetation cover factor, and P represents the soil retention measure.
All factors were spatialized into a grid with a 30 m resolution in ArcGIS 10.3 software and grid calculations were performed to obtain the annual soil loss for each unit.

Water Retention Service

Water retention is one of the most critical services of the ecosystem, which closely connects the growing population with the ecosystem [34]. The amount of water retention for each pixel on the landscape was calculated using the water balance equation [35]. The model is expressed as follows [35]:
W R = i = 1 j ( P i R i A E T i ) × A i
R i = P i × α
where W R is the total amount of water retention, Pi means annual precipitation (mm), Ri indicates the surface runoff (mm), AETi represents annual actual evapotranspiration (mm), Ai is area (km2) of the ecosystems defined by land cover types, α is average surface runoff coefficient collected from the published research results in this area [36], i is the index of ecosystem types, and j denotes the total number of ecosystem types. Precipitation data were calculated using meteorological data from CMDSSS (http://data.cma.cn, accessed on 15 April 2021). The evapotranspiration data were calculated using MODIS products and meteorological records [35].

Habitat Suitability

Habitat suitability plays a crucial role in biological diffusion and biodiversity conservation, representing the ecosystems’ ability to provide suitable conditions for the sustainable survival of individuals and populations [37]. The habitat suitability index was used to estimate the habitat and vegetation supporting ecosystems across the whole landscape, which considered the relative quality of the ecosystem type, the availability of the water source, the sensitivity to disturbing factors, and the abundance of food. The equation was as follows [38]:
H S I = 1 i w i f i
where HSI represents the total value of the comprehensive index of habitat suitability in the study year, wi is the weight for the ith factor assigned by experts, fi is the standardized value of the ith factor involved in the assessment of habitat suitability, and i is the number of evaluated factors.
Spatialization and weighted summation for all factors were performed utilizing ArcGIS 10.3 software.

Sandstorm Prevention

Sandstorm prevention of the ecosystem was calculated using the revised wind erosion equation (RWEQ) [39]. The RWEQ is an empirical model for estimating long-term soil loss caused by wind erosion [34]. In this model, climate, topography, vegetation, and soil properties were considered to quantify wind erosion [40]. Potential and actual wind erosion intensity were estimated, and the difference between them was used as the sand fixation capacity of the ecosystem to assess the function of wind and sand fixation in the ecosystem. The formulas involved are as follows [39]:
Q = Q 0 Q v
Q ( x ) = Q m a x { 1 e x p [ ( x / s ) 2 ] }
S = 150.71 · ( W F × E F × S C F × K × C ) 0.3711
Q m a x = 109.8 · ( W F × E F × S C F × K × C )
S = 150.71 · [ W F × E F × S C F × K × ( 1 C ) ] 0.3711
where ΔQ means the amount of sand fixation (t km−2 a−1), Q0 refers to the potential soil erosion without vegetation cover (t km−2 a−1), and Qv indicates the actual soil erosion considering the current land cover and management conditions (t km−2 a−1). Q(x) represents the amount of soil transported by wind at point x, Qmax indicates the maximum sand transport capacity by wind, and S describes critical field length. WF, EF, SCF, K , and C represent weather factor, soil erodible fraction, soil crust factor, surface roughness factor, and vegetation factor, respectively.

Crop Yield

Located in the typical Black Soil Belt of Northeast China, the food supply of the study area is a crucial service for regional food security. Crop yield was selected to estimate food provisioning services of Changchun. Crop yields data were obtained from the statistical yearbook of Changchun in 2001 and 2016.

2.3.3. Relationship between ESs

According to previous studies on the relationship between ESs [1,37,41], the changes of ES in divided urban area were analysed and compared to reveal the influences of urbanization on the relationships between ES changes.
There are three relationship types between ESs: synergy, trade-off, and neutral. Synergy represents a win–win or lose–lose situation of two ESs with a consistent trend of increases or losses; trade-off indicates a win-lose or lose-win situation in which one ES rises at the expense of the other; and neutral means that a change in one ES will not cause variation in another [1]. In this study, 754 random points (432 in rural area, 209 in developing area, and 113 in developed areas) for each ES layer, both in 2000 and 2015, were extracted using ArcGIS 10.3 software. Before comparing the 2000 and 2015 ecosystem services, all data were standardized using the following equations:
S v 2000 = v 2000 min ( v 2000 , v 2015 ) max ( v 2000 , v 2015 ) min ( v 2000 , v 2015 )
S v 2015 = v 2015 min ( v 2000 , v 2015 ) max ( v 2000 , v 2015 ) min ( v 2000 , v 2015 )
where S v 2000 and S v 2015 are the standardized values for each ES in 2000 and 2015, respectively, and v 2000   and   v 2015 are the ES values in 2000 and 2015, respectively.

3. Results

3.1. Urban Sprawl of Changchun during 2000–2015

Based on night light data, the scope of urban and industrial land in the study area in 2000 and 2015 was extracted and the dynamic of urban expansion was obtained via the spatial analysis module of ArcGIS 10.3. The results showed that Changchun has undergone considerable urban expansion since 2000 (Figure 2). The area of urban and industrial land was 25, 2067 ha in 2000, and 487,064 ha in 2015, respectively, an increase of 234,997 ha in the past 16 years with a 14,687 ha yearly increase (8.45%). The average DN of night light data for the study area increased from 12.21 in 2000 to 22.55 in 2015. The mean DN was 4.21, 48.76, and 60.31 in rural area, developing urban area, and developed urban area in 2000, respectively. The average DN increased by 2.52 in developed urban area, and by 10.74 in developing urban area in the last 16 years. The average DN in rural area changed the most, increasing by 13.64 from 2000 to 2015 (Table 2).

3.2. Changes of ESs in Changchun

3.2.1. Spatial–Temporal Changes for Overall ESs

The spatial distribution of carbon storage, soil retention, and habitat suitability services presented similar patterns with high values in eastern areas, where the slope gradient was relatively high, and the dominant land cover type was forestland (Figure 3). The values range from 0 to 37.1 t, 0 to 4.2 × 10³ t km−2a−1, and 0 to 60.2 for these three ecosystem services, respectively. The sandstorm prevention deceased from west to east, and the areas with high values of water retention were concentrated in the central parts (Figure 3). From 2000 to 2015, the three ESs-carbon storage, soil retention, and water retention-increased by 2.01%, 124%, and 28.03% in the study area, while habitat suitability and sandstorm prevention services decreased by 3.55%, and 1.64%, respectively (Figure 4). In the study area, the area of cropland was reduced from 1720.4 km2 to 1560.4 km2 by 9.3%, but the crop yield service increased from 668.5 × 10 6 t to 753.4 × 10 6 t by 12.87% (Figure 4).
The relative service capacities are shown using radar plots based on standardized values (Figure 5). Each axis of the plot indicates a different ES; the outermost point on the axes means the highest level of ES, and the provisioning service decreases towards the centre. The symmetry of the plot represents relative balance of the ESs; consequently, the larger and more symmetrical they are, the higher the overall potential benefits of ESs [1]. It can be seen that six service capacities in the study area are extremely unbalanced. Habitat suitability and crop yield are relatively stronger than the others, while the service capacity of soil retention is the weakest.

3.2.2. Relationships among ES Changes

Interactions between ESs were analysed to evaluate the differential changes in ESs in the process of urbanization and to detect the urbanization problems presented in Changchun (Table 3). Habitat suitability significantly corresponded with carbon storage, soil retention, and water retention. Synergies between habitat suitability and carbon storage, and habitat suitability and soil retention were detected in the three areas, that is, habitat suitability deteriorated with the decrease in carbon storage and soil retention. However, the correlation coefficient decreased from developed urban area to rural area in terms of carbon storage and increased from a developed urban area to a rural area for soil retention. A trade-off between habitat suitability and water retention was detected in the three zones, and the correlation coefficient of the rural area was the highest.
The interactions between crop yield and carbon storage, habitat suitability, and soil retention were more complex. There was only a weak trade-off between crop yield and carbon storage in rural areas, while the correlation between the other two areas was not significant. For crop yield and habitat suitability, a higher trade-off in developed urban areas but a weaker trade-off in rural areas can be seen.
The correlation coefficients of sandstorm prevention with all of the other five ESs were insignificant in three areas. Insignificant results were also detected between water retention and soil retention, and water retention and crop yield.

3.3. Impact of Urbanization on ESs

3.3.1. ES Changes in Different Urbanization Areas

Average values of ESs in the three urban zones were calculated to compare the impact of rapid urban sprawl on ESs (Table 4). It can be seen that the mean values of soil retention, carbon density, habitat suitability, and crop yield in rural areas are significantly higher than those in the other two areas, both in 2000 and 2015. All of the mean ES values for urban areas are the lowest among the three areas, except for water retention and sandstorm prevention in 2015. For developed and developing urban areas, carbon density and habitat suitability decreased, while the other four ecological services improved slightly from 2000 to 2015. For rural area, only sandstorm prevention decreased from 6.0 × 10³ t·km−2 to 4.44 × 10³ t·km−2 during the study period.
We can also learn from radar maps that the relative balance of all of the services in three areas is quite different. For developed urban area (Figure 6a), habitat suitability and sandstorm prevention are stronger than other services and the balance between all services decreased from 2000 to 2015. For developing urban area (Figure 6b), habitat suitability is significantly higher than other ESs in 2000 but decreased to a large extent in 2015. For rural area (Figure 6c), crop yield increased significantly from 2000 to 2015, while other ESs hardly changed. The relative balance of all of the services in developing urban area is the most symmetrical among the three areas, but the overall potential ES benefit is not higher (Figure 6d).

3.3.2. Correlation Analysis between Urbanization and ESs

A total of 1500 sample points were randomly extracted, including 120 in developed urban areas, 221 in developing urban areas, and 1159 in rural areas. Taking nightlight satellite measurements as a proxy for urbanization, correlation analysis were analysed between urbanization and ecosystem services in 2000 and 2015, respectively. Habitat suitability were negatively correlated with urbanization in all three areas (Table 5). The relationship between water retention and urbanization was negative in developed urban areas, while it was positive in developing urban areas and rural areas. The relationship between crop yield and urbanization was negative in developed and developing urban areas, while it was insignificant in rural areas. Due to the extensiveness and continued growth of water-impervious surfaces at the loss of forest and crop land in developing urban areas, urbanization is negatively correlated with carbon density in 2015. There was no significant correlation between soil conservation, sandstorm prevention and urbanization in all areas.

4. Discussion

4.1. Typical Impact of Urban Expansion on ESs in Changchun

Many studies have shown that changes in land cover driven by urbanization contribute greatly to spatial and temporal changes in ESs [12,33,41,42]. The influences brought about by urbanization not only reflected the urban–rural gradient changes, but also presented a spatial spill over effect [36]. In this study, we also found that rapid and extensive changes in land cover from rural to urban area in Changchun led to a remarkable influence on the spatial distribution of ESs. Some ESs, including carbon storage, soil retention, habitat suitability, and crop yield, increased with the distance from developed urban areas, which was consistent with the previous research results with regard to gradient change along the urban–rural gradient [1]. We found that water retention represented the opposite trend: the mean value in developed urban area was much higher than that in rural area. This is mainly because the evapotranspiration of impervious surface is small, which leads to larger water retention values.
Due to different environmental and land cover patterns in different areas, the dynamic trends of ESs are quite different. According to previous studies, an increased rate of water-impervious surfaces in developing urban areas is the highest compared to the other two types of areas; consequently, the greatest reduction in regulation services as well as food production services occurs in developing urban areas [1,38]. In our study, the mean value of carbon storage and habitat suitability declined, while other services increased in developing urban areas.
Crop yield increased in all three areas, which is consistent with the results obtained by Sun et al. in the Atlanta metropolitan area [16]. Although urbanization took up a large amount of cropland, especially in developing urban areas, the progress in agricultural science and technology and the improvement of farming management greatly increased crop yield per unit area, which made the overall level and average level of the crop yield in the three areas improve. In addition, the conversion of some dry farmland into paddy fields in rural areas also promoted the largest increase in crop yield among three areas. However, in the study of Qi et al., it was found that the food supply in this area increased first and then decreased [43]. Cropland protection cannot be ignored.
Urban sprawl declined the area of cropland, as well as grassland. Accordingly, the average amount of carbon storage in developing urban areas and developed urban areas reduced, while that in rural areas increased due to the implementation of the Grain to Green Program (the area of forest land increased by 13.90%, and water body increased by 128.95%), which offset the decrease in carbon storage due to the increase in impervious surface (Figure 7). It is worth mentioning that because of burgeoning spiritual demands, the three regions pay more attention to the environment and aesthetics. As a result, there was an increase in green infrastructure from 2000 to 2015, and the forestland area in the three regions increased by 13.90%, 88.9%, and 29.1%, compared with 2000, respectively. However, due to the rapid growth of artificial surface (the rate of increase was 26.55%, 91.9%, and 10.43% for rural area, developing urban area, and developed urban area, respectively, from 2000–2015), developing urban area showed the largest decline in their habitat suitability index from 40.38 to 36.17 (Figure 7). In rural area, though rural residential land expanded significantly due to urban sprawl, habitat suitability still improved a small amount because forestland and water body provide better habitat suitability services than cropland. Both water retention and soil retention services presented an inclining trend in all three areas and the largest increase in water retention occurred in developed urban area because of these areas saw the largest increase in forestland and bodies of water. Furthermore, the reduced evapotranspiration due to the large increase in impervious areas also resulted in the largest increase in water retention occurring in developed urban area. Since the increasing forestland as well as the high- density buildings reduced the wind speed and surface sand, the largest increase in sandstorm prevention services occurred in developed urban areas.
Furthermore, correlation analyses showed that the urbanization index and habitant suitability, and crop yield had a negative correlation in Changchun, which are consistent with previous studies [9,41] and indicates that urbanization exerts significant influence on ecosystem services. In our study, water retention is significantly negatively correlated in urbanized areas, but positively correlated in developing urban areas and rural areas. However, the study of sun et al. in Guangdong-Hong Kong-Macao “Megacity” found that water retention was negatively correlated only in urban areas, but insignificant in rural areas [9]. This is because in addition to land use, other factors such as topography and meteorology, likely contributed to the relationship between urbanization and service capacity. In developed urban area, the terrain is so flat and high-density artificial surface caused large runoff and consequent reduction of water retention. While in developing urban area and rural area, water retention is more impacted by slope gradient and heterogeneity of evapotranspiration and precipitation. Carbon density only significantly negatively correlated with urbanization in developing areas, but not significantly in developed area and rural area. It shows that the large increase of urban land has a significant impact on carbon storage in the developing area than others.

4.2. Effects of Urbanization on the Relationships among ESs

Correlation analyses of multiple ESs could provide instructive information for the balanced development of ESs overall. The factors leading to changes in ES relationships varied spatiotemporally due to the different characteristics of the natural environment and the degree of human disturbance. This study mainly focused on the changes in ES relationships caused by land cover transformation.
Studies have shown that there are general trade-off relationships between provision services and regulation services, such as crop yield and carbon storage, water retention, and soil retention [44,45,46]. However, in our study, crop yield presented a more complex relationship with other ESs in different urbanization areas. Due to the large proportion of cropland (the proportion was 67.01% in 2000 and 53.08% in 2015), cropland plays a vital role as a carbon sink in rural area. Although there was an increase in forestland areas, carbon storage had barely changed due to the decrease in large area of cropland. However, impacted by advances in agricultural science and technology, and agricultural management factors, crop yield showed rapidly increasing trend, and became the most prominent ES in rural area (Figure 6), which caused a weak trade-off between crop yield and carbon storage in rural area. Large-scale expansion of urban areas leads to loss of large areas of suitable habitats, resulting in the largest reduction in habitat suitability in developing urban areas in this study. These two diverse trends resulted in a high trade-off between crop yield and habitat suitability in this region.
In addition, we found that habitat suitability significantly corresponded with carbon storage, soil retention, and water retention. In contrast, land cover changes driven by urbanization transformed most land surfaces into water-impervious surfaces, which raised water retention but reduced the soil retention and carbon storage. Therefore, habitat suitability has a trade-off relationship with water retention, but a synergistic relationship with soil retention and carbon storage.

4.3. Implications for Urban Planning

Due to rapid urban sprawl, coordinating development activities without destroying ecological sustainability has become a preliminary and vital issue in relation to urban management. Many studies have tried to solve this situation through delimiting ecological protection areas with high ESs [47]. However, the benefit of urbanization often promotes development activities in ecological protection zones, which lead to a failure to protect of these areas. The “Guiding Opinions on the Overall Delimitation and Implementation of Three Control Lines in National Territory Spatial Planning” issued by the Office of the State Council of China in 2019 emphasized the importance of the demarcation of the ecological protection red line, permanent basic cropland, and the urban development boundary [48]. Therefore, the contradiction between urban development and ecological protection can be mitigated by strict constraints on development activities in delineated areas. Taking ESs and urbanization as a whole system and analysing their interactions at local scale can provide more constructive suggestions for ecological protection in the process of urbanization. According to urbanization and its effect on ESs, our detailed recommendations for local urban development planning are as follows:
First, Changchun, as the central city of the Harbin–Changchun Urban Agglomeration, is also the region where black soil is concentrated. The trade-off between food security and economic development is always the core problem of regional development. From 2000 to 2015, due to urbanization, 156.91 km2 of cropland was transformed into urban built-up land, accounting for 8.2% of the total amount of cropland in 2000. Despite the improvement in agricultural science, technology, and management, crop yield showed an increasing trend in each of the three areas (Table 3). However, this benefit can only be maintained in a limited range. In the long run, the protection of cropland area is necessary. Therefore, urban sprawl should give full consideration to the red line of basic agriculture protection, as well as the sustainable use of black soil, so as to achieve a win–win situation of food security and economic development.
Second, we found that the increase in soil conservation services in the three areas and carbon storage in rural area due to Changchun’s rapid urbanization benefited from the increase in forestland and water body with high ESs. Therefore, in urban landscape plan, we should pay more attention to the construction of green infrastructure, especially in developing urban areas where the area of water- impervious surfaces increases extensively, so as to reverse the phenomenon of the continuous loss of ESs in the process of urban sprawl.
Finally, it has been proven that the allocations and patterns of land cover have a significant impact on ESs. However, commonly, human activities changed land use types and tend to generate the most profit [41]. Therefore, it is critical that policy makers and planners should understand how to design the land use structure in order to promote sustainable urban development in a more reasonable and beneficial way.

5. Conclusions

Taking Changchun as study area, we studied the impact of rapid urbanization on changes in ESs in inland agricultural areas. We assessed six ESs and their interrelation in different urbanization areas. The urbanization changes and their impact on these ESs were analysed by integrating remote sensing and geospatial analysis methods.
Changchun experienced rapid urbanization between 2000 and 2015. At the same time, the ESs of Changchun changed significantly over the past 16 years, with increases in carbon storage, soil retention, water retention, and crop yield, and decreases in habitat suitability and sandstorm prevention service. Urbanization has a significant impact on ESs, and ESs change regularly in different urbanization areas. The relationships between ESs were not only simple trade-offs or synergies, but presented more complex issues, and the correlation characteristics were different in different urbanization areas. Habitant suitability and crop yield have a significantly negative relationship with urbanization. The increase in forestland and water with high ESs slowed down the decrease in ESs due to urbanization. In view of the impact of urbanization on ecosystem services in Changchun, we put forward three suggestions to avoid or minimize the ecological problems caused by urbanization. In this study, only the impact of land cover changes on ecosystem services was considered. The comprehensive impact of climate, terrain, and other factors on ESs should be considered in future work.

Author Contributions

Conceptualization, X.L.; methodology, X.L.; formal analysis, Y.R.; investigation, R.Y.; data curation, Z.S. and Z.X.; writing—original draft preparation, X.L.; writing—review and editing, X.L.; visualization, G.S. All authors have read and agreed to the published version of the manuscript.

Funding

This work was supported by the National Natural Science Foundation of China (No. 42171328) and the Science and Technology Development Program of Jilin Province (Nos. 20200201048JC and 20200301014RQ).

Data Availability Statement

The data are not publicly available for privacy reasons.

Conflicts of Interest

The authors declare no conflict of interest.

References

  1. Li, B.J.; Chen, D.X.; Wu, S.H.; Zhou, S.L.; Wang, T.; Chen, H. Spatio-temporal assessment of urbanization impact on ecosystem services: Case study of Nanjing City, China. Ecol. Indic. 2016, 71, 416–427. [Google Scholar] [CrossRef]
  2. Kuang, B.; Lu, X.H.; Han, J.; Fan, X.Y.; Zuo, Z. How urbanization influence urban land consumption intensity: Evidence from China. Habitat Int. 2020, 100, 102103. [Google Scholar] [CrossRef]
  3. Gu, C.L.; Hu, L.Q.; Cook, I.G. China’s urbanization in 1949–2015: Processes and driving forces. Chin. Geogr. Sci. 2017, 27, 847–859. [Google Scholar] [CrossRef]
  4. The Central People’s Government of the People’s Republic of China. Available online: http://www.gov.cn/shuju//hgjjyxqk/detail.html?q=3 (accessed on 25 October 2021).
  5. The World Bank. Available online: https://www.worldbank.org/en/topic/urbandevelopment/overview (accessed on 25 October 2021).
  6. The United Nations. Available online: https://www.un.org/en/climatechange/climate-solutions/cities-pollution (accessed on 25 October 2021).
  7. Ding, C.R.; Zhao, X.S. Land market, land development and urban spatial structure in Beijing. Land Use Policy 2014, 40, 83–90. [Google Scholar] [CrossRef]
  8. Costanza, R.; d’Arge, R.; de Groot, R.; Farber, S.; Grasso, M.; Hannon, B.; Limburg, K.; Naeem, S.; O’Neill, R.V.; Paruelo, J.; et al. The value of the world’s ecosystem service and natural capital. Nature 1997, 387, 253–260. [Google Scholar] [CrossRef]
  9. Wang, W.J.; Wu, T.; Li, Y.Z.; Xie, S.L.; Han, B.L.; Zheng, H.; Ouyang, Z.Y. Urbanization impacts on natural habitat and ecosystem services in the Guangdong-Hong Kong-Macao “Megacity”. Sustainability 2020, 12, 6675. [Google Scholar] [CrossRef]
  10. Wu, J.G. Landscape sustainability science: Ecosystem services and human well-being in changing landscapes. Landsc. Ecol. 2013, 28, 999–1023. [Google Scholar] [CrossRef]
  11. Athukorala, D.; Estoque, R.C.; Murayama, Y.J.; Matsushita, B. Impacts of urbanization on the Muthurajawela Marsh and Negombo Lagoon, Sri Lanka: Implications for landscape planning towards a sustainable urban wetland ecosystem. Remote Sens. 2021, 13, 316. [Google Scholar] [CrossRef]
  12. Deng, C.X.; Liu, J.Y.; Nie, X.D.; Li, Z.W.; Liu, Y.J.; Xiao, H.B.; Hu, X.Q.; Wang, L.X.; Zhang, Y.T.; Zhang, G.Y.; et al. How trade-offs between ecological construction and urbanization expansion affect ecosystem services. Ecol. Indic. 2021, 122, 107253. [Google Scholar] [CrossRef]
  13. Larondelle, N.; Haase, D. Urban ecosystem services assessment along a rural–urban gradient: Across-analysis of European cities. Ecol. Indic. 2013, 29, 179–190. [Google Scholar] [CrossRef]
  14. Mach, M.E.; Martone, R.G.; Chan, K.M.A. Human impacts and ecosystem services: Insufficient research for trade-off evaluation. Ecosyst. Serv. 2015, 16, 112–120. [Google Scholar] [CrossRef]
  15. Amundson, R.; Berhe, A.A.; Hopmans, J.W.; Olson, C.; Sztein, A.E.; Sparks, D.L. Soil and human security in the 21st century. Science 2015, 348, 1261071. [Google Scholar] [CrossRef] [Green Version]
  16. Wan, L.L.; Ye, X.Y.; Lee, J.; Lu, X.Q.; Zheng, L.; Wu, K.Y. Effects of urbanization on ecosystem service values in a mineral resource-based city. Habitat Int. 2015, 46, 54–63. [Google Scholar] [CrossRef]
  17. Sun, X.S.; Crittenden, J.C.; Li, F.; Lu, Z.M.; Dou, X.L. Urban expansion simulation and the spatio-temporal changes of ecosystem services, a case study in Atlanta Metropolitan area, USA. Sci. Total Environ. 2018, 622, 974–987. [Google Scholar] [CrossRef] [PubMed]
  18. Aguilera, M.A.; Tapia, J.; Gallardo, C.; Nunez, P.; Varas-Belemmi, K. Loss of coastal ecosystem spatial connectivity and services by urbanization: Natural-to-urban integration for bay management. J. Environ. Manag. 2020, 276, 111297. [Google Scholar] [CrossRef]
  19. María, D.A.; Juan, M.B.; Javier, G.S. Relationships between coastal urbanization and ecosystems in Spain. Cities 2017, 68, 8–17. [Google Scholar]
  20. García-Nieto, A.P.; Geijzendorffer, I.R.; Baró, F.; Roche, P.K.; Bondeau, A.; Cramer, W. Impacts of urbanization around Mediterranean cities: Changes in ecosystem service supply. Ecol. Indic. 2018, 91, 589–606. [Google Scholar] [CrossRef] [Green Version]
  21. Li, X.Y.; Yang, L.M.; Ren, Y.X.; Li, H.Y.; Wang, Z.M. Impacts of urban sprawl on soil resources in the Changchun–Jilin Economic Zone, China, 2000–2015. Int. J. Environ. Res. Public Health 2018, 15, 1186. [Google Scholar] [CrossRef] [PubMed] [Green Version]
  22. ASTER GDEM Project. Available online: http://www.jspacesystems.or.jp/ersdac/GDEM/E (accessed on 15 April 2021).
  23. National Meteorological Science Data Center. Available online: http://data.cma.cn (accessed on 15 April 2021).
  24. National Oceanic and Atmospheric Administration. Available online: https://ngdc.noaa.gov (accessed on 15 April 2021).
  25. National Aeronautics and Space Administration. Available online: https://ladsweb.modaps.eosdis.nasa.gov (accessed on 15 April 2021).
  26. Li, X.P.; Gong, L. Calibration and fitting of DMSP/OLS and VIIRS/DNB night light images. Bull. Surv. Mapp. 2019, 7, 138–146. (In Chinese) [Google Scholar]
  27. Zhang, B.F.; Miao, C.H.; Song, Y.N.; Wang, J.J. Correction of DMSP/OLS Stable Night Light Images in China. J. Geo-Inf. Sci. 2020, 8, 1679–1691. (In Chinese) [Google Scholar]
  28. Wu, B.F. Land Cover of China; Science Press: Beijing, China, 2017. [Google Scholar]
  29. Xu, Q.; Yang, R.; Dong, Y.X.; Liu, Y.X.; Qiu, L.R. The influence of rapid urbanization and land use changes on terrestrial carbon sources/sinks in Guangzhou, China. Ecol. Indic. 2016, 70, 304–316. [Google Scholar] [CrossRef]
  30. Kumari, G.; Jian, Y.; Lei, F. Assessing ecosystem services from the forestry-based reclamation of surface mined areas in the North fork of the Kentucky river watershed. Forests 2018, 9, 652–674. [Google Scholar]
  31. Wang, Z.M.; Mao, D.H.; Li, L.; Jia, M.M.; Dong, Z.Y.; Miao, Z.H.; Ren, C.Y.; Song, C.C. Quantifying changes in multiple ecosystem services during 1992–2012 in the Sanjiang Plain of China. Sci. Total Environ. 2015, 514, 119–130. [Google Scholar] [CrossRef]
  32. Renard, K.G.; Foster, G.R.; Weesies, G.A.; Porter, J.P. RUSLE: Revised universal soil loss equation. J. Soil Water Conserv. 1991, 46, 30–33. [Google Scholar]
  33. Sajedipour, S.; Zarei, H.; Oryan, S. Estimation of environmental water requirements via an ecological approach: A case study of Bakhtegan Lake, Iran. Ecol. Eng. 2017, 100, 246–255. [Google Scholar] [CrossRef]
  34. Jiang, C.; Nath, R.; Labzovskii, L.; Wang, D.W. Integrating ecosystem services into effectiveness assessment of ecological restoration program in northern China’s arid areas: Insights from the Beijing-Tianjin Sandstorm Source Region. Land Use Policy 2018, 75, 201–214. [Google Scholar] [CrossRef]
  35. Yang, Y.Y.; Zheng, H.; Kong, L.Q.; Huang, B.B.; Xu, W.H.; Ouyang, Z.Y. Mapping ecosystem services bundles to detect high-and low-value ecosystem services areas for land use management. J. Clean. Prod. 2019, 225, 11–17. [Google Scholar] [CrossRef]
  36. Xiang, H.X.; Wang, Z.M.; Mao, D.H.; Zhang, J.; Zhao, D.; Zeng, Y.; Wu, B.F. Surface mining caused multiple ecosystem services losses in China. J. Environ. Manag. 2021, 290, 112618. [Google Scholar] [CrossRef] [PubMed]
  37. Jackson, B.; Pagella, T.; Sinclair, F.; Orellana, B.; Henshaw, A.; Reynolds, B.; Mcintyre, N.; Wheater, H.; Eycott, A. Polyscape: A GIS mapping framework providing efficient and spatially explicit landscape-scale valuation of multiple ecosystem services. Landsc. Urban Plann. 2013, 112, 74–88. [Google Scholar] [CrossRef]
  38. Sun, X.; Lu, Z.M.; Li, F.; Crittenden, J.C. Analyzing spatio-temporal changes and trade-offs to support the supply of multiple ecosystem services in Beijing, China. Ecol. Indic. 2018, 94, 117–129. [Google Scholar] [CrossRef]
  39. Jiang, C.; Wang, F.; Zhang, H.Y.; Dong, X.L. Quantifying changes in multiple ecosystem services during 2000–2012 on the Loess Plateau, China, as a result of climate variability and ecological restoration. Ecol. Eng. 2016, 97, 258–271. [Google Scholar] [CrossRef]
  40. Du, H.Q.; Xue, X.; Wang, T.; Deng, X.H. Assessment of wind-erosion risk in the watershed of the Ningxia-Inner Mongolia Reach of the Yellow River, northern China. Aeolian Res. 2015, 17, 193–204. [Google Scholar] [CrossRef]
  41. Lyu, R.F.; Zhang, J.M.; Xu, M.Q.; Li, J.J. Impacts of urbanization on ecosystem services and their temporal relations: A case study in Northern Ningxia, China. Land Use Policy 2018, 77, 163–173. [Google Scholar] [CrossRef]
  42. Sun, X.; Li, F. Spatiotemporal assessment and trade-offs of multiple ecosystem services based on land use changes in Zengcheng, China. Sci. Total Environ. 2017, 609, 1569–1581. [Google Scholar] [CrossRef] [PubMed]
  43. Qi, Z.F.; Ye, X.Y.; Zhang, H.; Yu, Z.L. Land fragmentation and variation of ecosystem services in the context of rapid urbanization: The case of Taizhou city, China. Stoch. Environ. Res. Risk. Assess. 2014, 28, 843–855. [Google Scholar] [CrossRef]
  44. Jopke, C.; Kreyling, J.; Maes, J.; Koellner, T. Interactions among ecosystem services across Europe: Bagplots and cumulative correlation coefficients reveal synergies, trade-offs, and regional patterns. Ecol. Indic. 2015, 49, 36–52. [Google Scholar] [CrossRef]
  45. Zhou, Z.X.; Li, J.; Guo, Z.Z.; Li, T. Trade-offs between carbon, water, soil and food in Guanzhong-Tianshui economic region from remotely sensed data. Int. J. Appl. Earth Obs. Geoinf. 2017, 58, 145–156. [Google Scholar] [CrossRef]
  46. Wu, J.J.; Jin, X.R.; Feng, Z.; Chen, T.Q.; Wang, C.X.; Feng, D.R.; Lv, J.Q. Relationship of ecosystem services in the Beijing-Tianjin-Hebei region based on the production possibility frontier. Land 2021, 10, 881. [Google Scholar] [CrossRef]
  47. Zhang, Y.; Liu, Y.F.; Zhang, Y.; Liu, Y.; Zhang, G.X.; Chen, Y.Y. On the spatial relationship between ecosystem services and urbanization: A case study in Wuhan, China. Sci. Total Environ. 2018, 637, 780–790. [Google Scholar] [CrossRef]
  48. Li, J.S.; Sun, W.; Li, M.Y.; Meng, L.L. Coupling coordination degree of production, living and ecological spaces and its influencing factors in the Yellow River Basin. J. Clean. Prod. 2021, 298, 126803. [Google Scholar] [CrossRef]
Figure 1. Location of the Changchun, Jilin Province, China.
Land 10 01210 g001
Figure 2. Urbanization (a) in 2000–2015 and (b) classification of urbanization in study area.
Land 10 01210 g002
Figure 3. Spatial Distribution of ESs in 2000, 2015, and changes of Changchun.
Land 10 01210 g003aLand 10 01210 g003b
Figure 4. ESs in 2000 and 2015.
Land 10 01210 g004
Figure 5. Radar maps of the standardized ESs.
Land 10 01210 g005
Figure 6. Radar maps of ESs in (a) developed urban area, (b) developing urban area, (c) rural area, and (d) the mean value of ESs in three areas.
Land 10 01210 g006
Figure 7. Land cover of Changchun in (a) 2005, and in (b) 2015.
Land 10 01210 g007
Table 1. Main data sources used in the study.
DatasetsDescriptionResolutionTimeData Sources
DEMASTER GDEM productRaster, 30 m2009http://www.jspacesystems.or.jp/ersdac/GDEM/E, accessed on 15 April 2021 [22]
Climatic dataDaily temperature, Daily rainfall, Daily wind speed, Daily sunshine durationPoint2000–2015CMDSSS (http://data.cma.cn), accessed on 15 April 2021 [23]
Soil dataSoil mapVector, 1:500,0002016SFSJP
Remote sensing imageNight data, DMSP/OLSRaster, 1000 m2000https://ngdc.noaa.gov accessed on 15 April 2021 [24]
Night data, NPP/VIIRSRaster, 750 m2015
Evapotranspiration data, MODIS 16A2Raster, 500 m2000, 2015https://ladsweb.modaps.eosdis.nasa.gov/ accessed on 15 April 2021 [25]
Land cover dataInterpreted data of Landsat TM/OLI ImageVector2000, 2015IGA, CAS
Table 2. The average DN of night light data in different areas in 2000 and 2015.
TimeMeanRural AreaDeveloping Urban AreaDeveloped Urban Area
200012.214.2148.7660.31
201522.5517.8559.5062.83
Table 3. Relationships between pairs of ESs.
Carbon StorageHabitat SuitabilitySoil RetentionSandstorm PreventionWater RetentionCrop Yield
Carbon storagedeveloped1
developing1
rural1
Habitat suitabilitydeveloped0.528 **1
developing0.495 **1
rural0.430 **1
Soil retentiondeveloped−0.0230.188 *1
developing0.191 **0.198 **1
rural0.306 **0.247 **1
Sandstorm preventiondeveloped−0.009−0.010−0.0701
developing−0.002−0.015−0.1021
rural0.006−0.036−0.0281
Water retentiondeveloped−0.058−0.0630.013−0.0151
developing−0.088−0.181 **−0.061−0.0431
rural−0.121 **−0.260 **−0.0430.0551
Crop yielddeveloped−0.114−0.339 **−0.211 *−0.0250.1051
developing0.0240.0510.055−0.036−0.1081
rural−0.172 **0.176 **−0.104 **−0.015−0.0511
Note: * indicates significance at the 5% level, ** indicates significance at the 1% level.
Table 4. Mean values of ESs in the three urban areas.
Soil Retention
(103 t·km−2)
Sandstorm Prevention
(103 t·km−2)
Carbon Density
(109 gC·km−2)
HabitatSuitabilityWater Retention
(105 t·km−2)
Crop Yield
(103 kg·ha−1)
200020152000201520002015200020152000201520002015
Developed0.681.754.104.941.831.5228.6428.303.994.581.512.28
Developing1.333.284.084.504.304.1940.3836.172.192.983.794.16
Rural1.884.146.04.447.297.5345.2145.711.662.155.976.79
Table 5. The correlation coefficients of ESs with urbanization in different urban areas in 2000 and 2015.
Developed AreaDeveloping AreaRural Area
200020152000201520002015
Soil retention−0.067−0.081 *−0.036−0.117−0.064 *−0.077 *
Sandstorm prevention−0.0210.0710.1130.1120.040.067 *
Carbon density−0.081−0.014−0.104−0.207 **−0.071 *−0.076 *
Habitat suitability−0.373 **−0.309 **−0.397 **−0.467 **−0.17 **−0.233 **
Wate retention−0.252 **−0.428 **0.218 **0.080.126 **0.248 **
Crop yield−0.359 **−0.314 **−0.172 *−0.147 *0.064 *−0.054
Note: * indicates significance at the 5% level, ** indicates significance at the 1% level.
Publisher’s Note: MDPI stays neutral with regard to jurisdictional claims in published maps and institutional affiliations.

